empirical investigation into the use of complexity levels ... · pdf filein marketing...
TRANSCRIPT

Loughborough UniversityInstitutional Repository
Empirical investigation intothe use of complexity levelsin marketing segmentationand the categorisation ofnew automotive products
This item was submitted to Loughborough University's Institutional Repositoryby the/an author.
Additional Information:
• A Doctoral Thesis. Submitted in partial fulfilment of the requirementsfor the award of Doctor of Philosophy of Loughborough University.
Metadata Record: https://dspace.lboro.ac.uk/2134/13985
Publisher: c© Paul Taylor-West
Please cite the published version.

This item was submitted to Loughborough University as a PhD thesis by the author and is made available in the Institutional Repository
(https://dspace.lboro.ac.uk/) under the following Creative Commons Licence conditions.
For the full text of this licence, please go to: http://creativecommons.org/licenses/by-nc-nd/2.5/

EMPIRICAL INVESTIGATION INTO THE USE OFCOMPLEXITY LEVELS IN MARKETING
SEGMENTATION AND THE CATEGORISATION OFNEW AUTOMOTIVE PRODUCTS
by
Paul Taylor-West
A Doctoral Thesis
Submitted in partial fulfilment of the requirements
for the award of
Doctor of Philosophy of Loughborough University
© by Paul Taylor-West 2013
School of Business and EconomicsLoughborough University

ACKNOWLEDGMENTS
I would like to express my sincere gratitude and thanks to everyone who helped and
supported me throughout my studies.
Special thanks go to my supervisors. To Jim Saker for his support and strategic input and to
Donna Champion for the detailed feedback and encouragement, this was invaluable. Donna
in particular was extremely helpful in keeping me focused and on track, our discussions and
reviews were always motivational, and for that I am very grateful. Thanks also go to Dave
Coates for his feedback, input and guidance of the statistical analysis.
I would also like to thank Ford Motor Company for providing access to key figures within the
organisation that contributed their time and information to give me a clear understanding and
background to the development and marketing of new products.
My thanks also to Toyota Motor Company in allowing me to attend and gather information at
the Geneva Motor Show and a major product launch held in Madrid.
I would also like to thank my fellow students for their support and friendship, as well as the
exchange of experiences during our studies; it has been very interesting to see how we all
changed over the last three years.
Finally, my greatest thanks and admiration for her never ending support and encouragement
goes to my wife Carole, without her I doubt if I would have ever started my Ph.D. studies,
never mind completed them. Thanks to her, this is without doubt my greatest achievement!

ABSTRACT__________________________________________________________________________________________________________________________________________________________________________________________________________
This thesis is set in the context of the automotive industry where launches of new products
with high levels of technical innovations are becoming increasingly complex for consumers
to comprehend. Car manufacturers need to understand consumer perceptions of new models
so they can categorise their products form the consumer perspective, to obtain a more
accurate indication as to where their products fit within the increasingly defined consumer
segments.
Situational and personal variables now play the most important roles in marketing. In the area
of nested segmentation consumer variables are only concerned with their needs, attitudes,
motivations and perceptions and overlook any previous experience, exposure or familiarity
that a consumer may or may not have had with the product. It is argued here that consumers
have differing perceptions of newness and that asking “how new” and “new to whom” would
be valid questions for marketers when introducing new products. If car manufacturers can
categorise their products in terms of newness for specific consumers based on their levels of
Expertise, Involvement and Familiarity with the product, manufacturers will be able to target
appropriate markets more effectively. To explore this area a mixed methods research
approach was applied.
This research found that the level of Involvement with the product, from a motivational
aspect, gave rise to different levels of interest and enthusiasm between consumers and has a
direct impact on how different types of consumers view new products. In addition the
differing levels of consumer knowledge highlights the need to improve targeting of marketing
communications so that manufacturers provide a better understanding of complex new
products to consumers. Current mass marketing methods based on consumer demographics
are no longer sufficient.
This research found that a consumer’s level of Expertise, Involvement and Familiarity (EIF)
with a specific product can be captured using a multi-dimensional scale to measure consumer
product knowledge and provide an accurate consumer segmentation tool. By offering
different explanations of product innovations to these consumer segments, according to a
customer's EIF, marketers will achieve more effective targeting, reduce marketing costs and
increase marketing campaign response.

CONTENTS__________________________________________________________________________________________________________________________________________________________________________________________________________
CHAPTER: 1 INTRODUCTION1.1 BACKGROUND 1
1.2 RESEARCH RATIONALE 3
1.3 RESEARCH OBJECTIVES 7
1.4 CHAPTER OUTLINE 8
CHAPTER: 2 LITERATURE REVIEW2.1 INTRODUCTION TO THE CHAPTER 11
2.2 CONSUMER BEHAVIOUR 12
2.2.1 Schema Congruity 12
2.2.2 Needs 16
2.2.3 Expectations 17
2.2.4 Appraisal Theory and Emotions 17
2.2.5 Involvement 19
2.2.6 Traits 23
2.2.7 Social Cognition and Stimulus 23
2.2.8 Inertia 25
2.2.9 Values and Means-End Chains 26
2.2.10 Search Behaviour 29
2.2.11 Consumer Concerns about Product Innovations 30
2.3 NEW PRODUCT DEVELOPMENT 31
2.3.1 Product Newness 31
2.3.2 Complexity 33
2.3.3 Product Familiarity 35
2.3.4 Expertise 37
2.3.5 Innovation Theory 40
2.3.6 Optimum Range 43
2.3.7 Categorisation Theory 43
2.3.8 Product development theory 44
2.4 NEW PRODUCT DEVELOPMENT IN THE AUTOMOTIVE INDUSTRY 46
2.5 MARKET SEGMENTATION AND PRACTIONERS 50

2.5.1 Market Segmentation 50
2.5.2 Introduction to the Practitioners Approach to Market Segmentation 51
2.5.3 Ford Motor Company Limited 51
2.5.4 Wunderman Ltd 54
2.5.5 Experian Ltd 58
2.5.6 MORI Research 60
2.5.7 Euro RSCG 61
2.5.8 Demographic and Geodemographic Classifications 62
2.5.9 Emotional Geographics 65
2.5.10 Government Social Classifications 66
2.6 ADVERTISING AND COMMUNICATIONS 67
2.6.1 Marketing Myopia 68
2.6.2 Summary of the Practitioners Approach to Market Segmentation 69
2.7 LITERATURE REVIEW SUMMARY 69
CHAPTER: 3 EXPLORATORY STUDIES3.1 INTRODUCTION TO THE CHAPTER 72
3.2 OVERVIEW OF EXPLORATORY STUDIES 73
3.3 INTERVIEWS WITH MANUFACTURERS AND PRACTITIONERS 73
3.3.1 Meeting with Ford of Britain (FoB) Communications Manager 74
3.3.2 Meeting with Ford of Britain Global Consumer Insights (GCI) Manager 76
3.3.3 Meetings with the Ford of Britain Advanced Product Group (APG) 77
3.3.4 Meetings and discussions with Glass’s Guide 80
3.3.5 Informal Meeting with BMW X6 Hybrid Manager – Munich 82
3.4 GENEVA MOTOR SHOW 83
3.4.1 Background to Data Collection 83
3.4.2 Findings 85
3.5 CONSUMER DISCUSSION GROUPS 87
3.5.1 Background to the Meetings 88
3.5.2 Qualitative Discussions 88
3.5.3 Quantitative Data Collection 91
3.5.4 Combined Data 93
3.5.5 Findings 93

3.5.6 Discussion and Conclusions 95
3.5.7 Limitations 96
3.6 INITIAL QUESTIONNAIRE PRE-TEST 97
3.6.1 Construction of the Initial Questionnaire 97
3.6.2 Data Collection 97
3.6.3 Findings 98
3.6.4 Limitations 103
3.7 EXPLORATORY STUDIES SUMMARY 103
CHAPTER: 4 CONCEPTUALISATION OF THE STUDY4.1 INTRODUCTION TO THE CHAPTER 107
4.2 RELEVANCE OF EXISTING RESEARCH 107
4.3 KEY CONSTRUCTS AND IDEAS 111
4.3.1 Complexity Construct 112
4.3.2 Expertise Construct 112
4.3.3 Involvement Construct 113
4.3.4 Familiarity Construct 113
4.3.5 Ideas 114
4.4 VARIABLES 116
4.4.1 Independent (presumed cause) 116
4.4.2 Dependent (presumed effect) 116
4.4.3 Intervening (presumed moderators) 116
4.5 HYPOTHESIS 117
4.6 CONCEPTUAL FRAMEWORK 117
4.7 MODEL SUMMARY 118
CHAPTER: 5 METHODS5.1 INTRODUCTION TO THE CHAPTER 119
5.2 METHODS AND DIRECTION 121
5.3 RESOURCES 123
5.4 EXPLORATORY RESEARCH 124
5.5 TARGET POPLULATION AND SAMPLE 124
5.6 DATA COLLECTION 124

5.6.1 Main Survey Data Source 125
5.7 QUESTIONNAIRE DESIGN 126
5.7.1 Information Sought 127
5.7.2 Complexity 128
5.7.3 Expertise 130
5.7.4 Involvement 131
5.7.5 Familiarity 131
5.7.6 Car Ownership/Usage 132
5.7.7 Information Sources 133
5.7.8 Most Important Aspect of Car Purchase 134
5.7.9 Socio-Demographics 134
5.8 PILOT QUESTIONNAIRE 135
5.9 CONSTRUCTION OF MAIN SURVEY 136
5.9.1 Structure 137
5.9.2 Procedure 138
5.9.3 Response 139
5.9.4 Participation in Automotive Research Panel 140
5.10 COMPLEXITY RATINGS 141
5.11 POST-MAIN SURVEY RESEARCH 141
5.11.1 Product Launches 142
5.11.2 : TV Adverts and Product Videos 142
5.12 METHODS SUMMARY 144
CHAPTER: 6 DATA ANALYSIS6.1 INTRODUCTION TO THE CHAPTER 146
6.2 METHODS USED 146
6.2.1 Coefficient Alpha 147
6.2.2 Eta-Squared 147
6.2.3 t-test 148
6.2.4 Pearson Correlation 148
6.2.5 One-way ANOVA 148
6.2.6 Triangulation 148
6.2.7 Socially Desirable Response Bias 149

6.2.8 Reverse Scoring of Negative Questions 149
6.2.9 Structural Equation Modelling - LISREL 150
6.3 PILOT SURVEY RESULTS 150
6.4 MAIN SURVEY RESULTS 153
6.4.1 Construct Reliability 153
6.4.2 Expertise and Involvement Relationships 154
6.4.3 Familiarity Constructs and Triangulation 155
6.4.4 Socio-Demographics Relationships 160
6.4.5 Car Ownership/Usage Relationships 161
6.4.6 Product Information Relationships 172
6.4.7 Most Important Aspect of Car Purchase 180
6.4.8 New Product Complexity (NPC) 181
6.4.9 Complexity Ratings 181
6.4.10 Consumer Categorisation of Innovation 183
6.4.11 LISREL 188
6.5 PRODUCT VIDEOS AND TV ADVERTS RESULTS 190
6.6 DISCUSSION OF ANALYSIS FINDINGS 193
6.6.1 Constructs 193
6.6.2 Intervening Variables 195
6.6.3 Other Relationships 195
6.7 SUMMARY 197
CHAPTER: 7 FURTHER POST-MAIN SURVEY INVESTIGATIONS7.1 INTRODUCTION TO THE CHAPTER 198
7.2 ATTENDANCE OF NEW PRODUCT LAUNCHES 198
7.2.1 Ford B-Max Launch - Salesman Training Event 198
7.2.2 Toyota Auris Launch Train-the-Trainer Event - Madrid 199
7.3 SUMMARY 200
CHAPTER: 8 CONCLUSIONS8.1 INTRODUCTION TO THE CHAPTER 201
8.2 HYPOTHESIS CONCLUSIONS 202
8.2.1 Hypothesis 1a and 1b: Consumer Product Experience (CPE) 202

8.2.2 Hypothesis 2a - 2c: Familiarity 202
8.2.3 Hypothesis 3a and 3b: Product Information 203
8.2.4 Hypothesis 4 and 5: New Product Complexity (NPC) 204
8.3 IMPLICATIONS AND GUIDELINES 205
8.4 LIMITATIONS AND FUTURE RESEARCH RECOMMENDATIONS 209
REFERENCES
APPENDICES
Appendix 1 - Motor Industry Vehicle Classifications
Appendix 2 - Geneva Motor Show Questionnaire
Appendix 3 - Explanation of Technological Option Packs for Ford Focus
Appendix 4 - Combined Display Data
Appendix 5 – Pre-Test Questionnaire
Appendix 6 – Meeting structure with FoB Communications Manager
Appendix 7 – Sample of Feedback to the Pilot Questionnaire
Appendix 8 – Main Questionnaire
Appendix 9 – Email Invitation for Main Questionnaire
Appendix 10 – Automotive Research Panel Invitation and Consent Form
Appendix 11 – Confidentiality Query by Panel Member
Appendix 12 – TV Car Adverts Invitation
Appendix 13 – TV Adverts and Product Video Questionnaire
Appendix 14 – Doctoral Colloquiums and Seminars attended
Appendix 15 – Core Texts and Search Terms Used
Appendix 16 – Summary of Exploratory Meetings and Interviews
Appendix 17 – Socio-Demographic Categorisations used in the study
Appendix 18 – Summary of Instruments used in the surveys

LIST OF TABLES
Table 1 - Attributes of Newness - summarised from Rogers (1995) .......................................15
Table 2 - Approaches to ‘Involvement’ applied in the literature .............................................20
Table 3 - Personality Traits Segmentation Tool - summarised from Mowen and Harris (2003)
..................................................................................................................................................23
Table 4 - Search Behaviour - Compiled from Sasu and Ariton (2011, p.23) ..........................29
Table 5 - Product Newness ......................................................................................................31
Table 6 - Aspects of Expertise – summarised from Alba and Hutchinson (1987) ..................38
Table 7 - Emotional Aspects in Automotive Advertising........................................................66
Table 8 - Product Positioning Methods ...................................................................................67
Table 9 - Measure Items ..........................................................................................................92
Table 10 - Expertise, Involvement and Knows Options Correlations .....................................98
Table 11 - Correlations ............................................................................................................99
Table 12 - Partial Correlations...............................................................................................100
Table 13 - Correlations in detail ............................................................................................102
Table 14 - Like versus Buy....................................................................................................103
Table 15 - Antecedents of Knowledge...................................................................................110
Table 16- Procedure for Developing a Questionnaire ...........................................................127
Table 17 - Items to measure Innovation Aspects...................................................................129
Table 18 - Prior Awareness: Sources of Information ............................................................130
Table 19 - Pre-Test and Pilot Questionnaire Responses ........................................................136
Table 20 - Responses based on Data Criteria ........................................................................140
Table 21- Frequencies of Pilot Survey Respondents .............................................................150
Table 22 - Pilot Study - Cronbach Alpha Coefficient Comparisons .....................................151
Table 23 - One-way ANOVA: Familiarity with Expertise and Involvement ........................152
Table 24 - Pearson Correlation: Information Sources Used with Expertise and Involvement
................................................................................................................................................152
Table 25 - Pearson Correlation: Knows the Options with Expertise, Involvement and
Familiarity..............................................................................................................................153
Table 26- Main Study Cronbach Alpha Coefficient Comparisons ........................................154
Table 27 - Pearson Correlations for Involvement, Expertise and Triangulation scales.........155
Table 28 - One-Way ANOVA: Familiarity LMH Construct.................................................156
Table 29 - One Way ANOVA: Familiarity 1 to 5 Construct .................................................156

Table 30 - Multiple Comparisons: Familiarity 1 to 5 Construct............................................157
Table 31 - 32 - One Way ANOVA: Familiarity NLMH Construct .......................................158
Table 33 - One-way ANOVA: Familiarity with Expertise and Involvement........................159
Table 34 - Mean Scores for Familiarity and Expertise ..........................................................159
Table 35 - Means Scores for Familiarity and Involvement ...................................................160
Table 36 - T-test and Eta squared values: Male and Female with Expertise, Involvement and
Familiarity..............................................................................................................................160
Table 37 – One-way ANOVA F-values: Socio-Demographics with Expertise, Involvement
and Familiarity .......................................................................................................................161
Table 38 – One-way ANOVA Eta squared values: Socio-Demographics with Expertise,
Involvement and Familiarity..................................................................................................161
Table 39 - One-way ANOVA F-values: Make of Current Car Groups with Expertise and
Involvement ...........................................................................................................................162
Table 40 - One-way ANOVA Eta squared values: Make of Current Car Groups with
Expertise and Involvement ....................................................................................................162
Table 41 – Descriptives: Count of Make of Current Car – 9 Groups ....................................163
Table 42 – One-way ANOVA F-values and Eta squared values: Type of Current Car with
Expertise and Involvement ....................................................................................................163
Table 43 - Descriptives: Count of Type of Current Car ........................................................165
Table 44 - Descriptives: Count of Age of Current Car in Years ...........................................165
Table 45 - One-way ANOVA F-values and Eta squared values: Number of Cars Owned or
Shared with Expertise, and Involvement ...............................................................................166
Table 46 - Descriptives: Count of Number of Cars Owned or Shared ..................................166
Table 47 - One-way ANOVA F-values and Eta squared values: Number of Different Makes
Owned or Shared with Expertise and Involvement ...............................................................167
Table 48 - Descriptives: Count of Number of Different Makes Owned or Shared ...............167
Table 49 – One-way ANOVA F-values and Eta squared values: Number of Makes considered
when buying last car with Expertise and Involvement ..........................................................168
Table 50 – Descriptives: Count of Number of Makes considered when buying last car.......168
Table 51 - One-way ANOVA F-values and Eta squared values: Number of Models
considered when buying last car with Expertise and Involvement........................................168
Table 52 - Descriptives: Count of Number of Models considered when buying last car......169
Table 53 - One-way ANOVA F-values and Eta squared values: Reason for Changing Last
Car with Expertise and Involvement......................................................................................169

Table 54 - Descriptives: Count of Reason for Changing Last Car ........................................169
Table 55 – One-way ANOVA F-values and Eta squared values: If reason to change was to
get a new model, what was new about it? With Expertise and Involvement.........................170
Table 56 - Descriptives: Count of: If reason to change was to get a new model, what was new
about it?..................................................................................................................................170
Table 57 - Pearson Correlation: Information Sources Used with Measures of Consumer
Product Experience ................................................................................................................172
Table 58 - One-way ANOVA Matrix: Previous Awareness Source (for the options) with
Expertise, Involvement and Familiarity.................................................................................174
Table 59- One-Way ANOVA Multiple Comparisons: Significant Differences with Options
and Previous Awareness Source (continued on next page) ...................................................175
Table 60 – Crosstabulation: Ford Focus with Previous Awareness Source ..........................177
Table 61 - Crosstabulation: Active Park Assist - TV Advert with Familiarity and Expertise
................................................................................................................................................178
Table 62 - Crosstabulation: Active Park Assist - TV Advert with Familiarity and Involvement
................................................................................................................................................179
Table 63 - Information Sources Used Summary....................................................................180
Table 64- Pearson Correlation: Most Important Aspect of Car Purchase with Measures of
Consumer Product Experience...............................................................................................181
Table 65 - Pearson Correlation: Knows the Options with Measures of New Product
Complexity.............................................................................................................................184
Table 66 - Mean Scores for Familiarity and Know the Options Average .............................185
Table 67 - Mean Scores for Familiarity and Know the Options Mode .................................185
Table 68 - T-test and Eta squared values: Male and Female with Knows the Options –
Average and Mode.................................................................................................................185
Table 69 - Pearson Correlation: Measures of Consumer Categorisation of Innovation with
Measures of New Product Complexity ..................................................................................187
Table 70 - Pearson Correlation: Likes and Buy with Measures of New Product Complexity
................................................................................................................................................187
Table 71 - Frequencies of Pilot Survey Respondents ............................................................191

LIST OF FIGURES
Figure 1 – Source: Redrawn from Bloch and Richins (1983, P78) .........................................22
Figure 2 – Source: Permission given by Branislav Bucan, Brand and Product Insights
Manager, Ford Motor Company – Europe – details supplied via email ..................................52
Figure 3 – Source: Permission given by Branislav Bucan, Brand and Product Insights
Manager, Ford Motor Company – Europe – details supplied via email ..................................53
Figure 4 - Source: Permission given by Orlando Machado, Head of Analytics - Knowledge &
Business Solutions – Wunderman Ltd, London - supplied via email......................................55
Figure 5 – Source: Permission given by Orlando Machado, Head of Analytics - Knowledge &
Business Solutions – Wunderman Ltd, London - supplied via email......................................57
Figure 6 – Source: Redrawn from NRS (2000) .......................................................................60
Figure 7 - Source: Redrawn from Businessballs (2003) ..........................................................63
Figure 8 - Source: Redrawn from Businessballs (2003) ..........................................................64
Figure 9 - Source: Redrawn from Businessballs (2003)..........................................................64
Figure 10 - Source: Redrawn from Businessballs (2003) ........................................................65
Figure 11 – Overview of Exploratory Studies .........................................................................73
Figure 12 - Correlations for Involvement and Expertise .........................................................86
Figure 13 - Comparisons of Previous studies - Reliability Statistics (Cronbach alpha).........87
Figure 14 – Aspects of New Products......................................................................................89
Figure 15 – Sentence and Aspect Categorisation ....................................................................90
Figure 16 - Expertise, Involvement and Familiarity overlap .................................................101
Figure 17 - Conceptual Framework .......................................................................................118
Figure 18 - Overview of Methods..........................................................................................120
Figure 19- Meetings/Interviews and Data Collection Time Frame .......................................125
Figure 20 – Means Plot: Type of Current Car with Expertise ...............................................164
Figure 21 - Means Plot: Type of Current Car with Involvement...........................................164
Figure 22 - Means Plot: Number of Cars Owned or Shared with Expertise..........................166
Figure 23 – Means Plot: If reason to change was to get a new model, what was new about it?
................................................................................................................................................171
Figure 24 – Bar Chart: Active Park Assist - TV Advert with Familiarity and Expertise ......178
Figure 25 - Bar Chart: Active Park Assist - TV Advert with Familiarity and Involvement..179
Figure 26 - Complexity Perceptions of Ford Focus Options .................................................182
Figure 27 - LISREL: Confirmatory Factor Analysis .............................................................189

Figure 28 - Responses to Familiarity, Expertise and Involvement ........................................191
Figure 29 - Responses to the perceived complexity of the Toyota TV advert and Toyota
product video .........................................................................................................................192
Figure 30 - Responses to the perceived complexity of the Audi TV advert..........................193

1
CHAPTER: 1 INTRODUCTIONThis thesis is an empirical investigation into consumer perceptions of new automotive
products. During the course of the research two papers were published in academic journals
(Taylor-West et al., 2012; Taylor-West et al., 2013a), three papers were accepted and
presented at academic conferences (Taylor-West et al., 2011a; Taylor-West et al., 2011b;
Taylor-West et al., 2013b), two papers were accepted and discussed at doctoral colloquiums
and three papers were accepted and presented at PhD seminars (Appendix 14). All papers
were subject to blind peer reviews; the doctoral colloquiums and seminars provided in-depth
discussion, including feedback for direction and conceptualisation.
The introduction of new products is vital to a company’s success. How newness is defined is
heavily debated, yet most agree that for something to be new it must have some perceivable
change to differentiate it from previous products as well as competitor alternatives (Rokeach,
1973; Herstatt and von Hippel, 1992; Rogers, 1995; Johannessen et al., 2001; Chapman,
2005; Conway, 2010; Peter and Olsen, 2010). Changes in a product could be incremental or
radical with a greater or lesser degree of innovation (Gobeli and Brown, 1987), and there is a
common view that innovation implies invention (Johannessen et al., 2001). Chapman (2005)
suggests that new innovations can be misunderstood by customers and the general public, as
they can be too complex. There can also be a lack of digestible information about a new
innovation, or product, resulting in that product, or innovation being sidestepped or ignored
(Chapman, 2005).
This chapter sets out the background to the research, the rationale and objectives, and an
outline and structure of this thesis.
1.1 BACKGROUNDDocumented information in the automotive industry is considerable, however this is mostly
concerned with engineering and manufacturing processes that concern product development
and production techniques (Saker, 2013). Currently, on the manufacturing side, knowledge
sharing between manufacturers is becoming more and more commonplace (Morley, 2006;
Agrawal et al., 2013).

2
In comparison, the area of sales and marketing are much less documented (Saker, 2013). This
is because the franchise system adopted by most manufacturers is made up of independent
retailers/dealer groups as the outlet for their products. Although the independents follow the
manufacturer’s marketing guidelines, they develop their own sales and marketing research
and processes to suit their local area (Saker, 2013). The information obtained is usually on an
ad-hoc basis and any knowledge is usually retained within the dealership and in some cases
this is not even shared within the dealer group. As a result the available literature is discrete
in nature and difficult to identify because of the lack of any central collation and knowledge
sharing (Saker, 2013). The evidence suggests there is a need to collate existing knowledge
and pull it together, this would provide more insight into the strategic and tactical processes
used in automotive retail marketing and reveal the way forward to improving
communications that are relevant to consumers.
Automotive manufacturers do provide support for marketing and training to retailers, but
little is done to collate information and feedback from the retailers in terms of the success or
failure of their strategic and tactical campaigns (Saker, 2013). Although retailers strive to
follow the manufacturer’s guidelines, it is inevitable that their interpretation may differ and
wander from the manufacturer’s objectives to the retailers objectives. There is also a lost
opportunity to develop and improve the marketing campaigns due to the lack of feedback,
resulting in best practices are unshared and remain within the domain of the retailer (Saker,
2013).
The outcome of this situation is that new product launches are formulated for mass markets
with one-size-fits-all messages, leaving it to a consumer’s summary judgement rather than
tailoring messages to a more defined segmented market (Dibb, 1998; Beck et al., 2012).
Although segmentation is used to target consumers, it is at a higher tier - usually
demographics, without any consideration to the differences in views and opinions that
consumers may have (Shillito, 2001). This is due to the limitation of basic data collection
methods which opt for the easy route to the access of information such as age, marital status,
postcodes, etc., all of which are readily available. This is also a limitation of bought-in
information, such as consumer databases (Dibb and Simpkin, 1991; Dibb, 1998). Unless there
is a change in the type of data and how it is collected, then more effective segmented
marketing campaigns will remain elusive to automotive manufacturers as well as their
retailers.

3
1.2 RESEARCH RATIONALEThe automotive sector and new automotive products was chosen because there is evidence
that new cars are not easily understood (Gibson 2010; Sasu and Ariton, 2011). With a
plethora of features and new innovations that are increasing in complexity some consumers
are confused or even alienated, resulting in the products often been overlooked or even
ignored (Talke et al., 2009; Whitfield, 2009; Loginova, 2010; Johannessen et al., 2011;
Simonsohn, 2011; Warman, 2011; Reynolds and Ruiz de Maya, 2013).
For many consumers a car is usually the second biggest purchase after a house and they are
ubiquitous, most families in the UK owing at least one car (Office for National Statistics,
2010). Yet, even though the process of consumer assessment is far more in depth than a low
value everyday consumable product, consumers are disorientated when it comes to new
innovations (Johannessen, 2011; Simonsohn, 2011).
This lack of understanding should be of great concern when you consider the high cost of car
purchase for a consumer and the increasing cost to them as taxpayers when you consider the
amount of investment being given to automotive manufacturers by government. For
example, incentives to develop new green power trains that rely less on fossil fuels have been
high on the government’s agenda for some time (Department of Transport, 2003; Transport
Research Board, 2004).
At the end of July, 2007 it was reported that out of 28 million vehicles, only 2,500 were
battery-powered; a long way short of the government’s target of 1.7 million electric vehicles
by the end of the decade (Jowit, 2011). Despite this low take-up of electric vehicles, at the
end of the decade (2010), the UK government gave Nissan UK a £20.7 million subsidy to
develop their new Nissan Leaf electric car, even though only 55 electric cars of any make
were registered in 2009 (Jowit, 2011). Even with these low volumes of sales, the Nissan Leaf
was still given the accolade of European car of the year 2011 (Booker, 2010).
This did not halt the determination of the government to encourage cleaner vehicles, it was
forecast that 2011 was the year of the electric car, but failed to do so, despite a £5000
government grant being given to consumers towards the cost of each vehicle (Rufford, 2012).

4
This was still not sufficient to attract consumers and supports the view by Sasu and Ariton
(2011) who suggested that increasing incentives for buying environmental cars are not well
understood and are not very effective.
The RAC provided some insight into why there is such a low take-up of green power (Gibson
2010). They believe that motorists need to know more about low emission vehicles, there
view is that there is insufficient information available for consumers to make an informed
judgement on these issues. In contrast a report by the Low Carbon Vehicle Partnership
warned of the dangers of providing too much information, creating a situation of ‘information
overload’ for consumers that may result in even greater confusion (Lane and Banks, 2010).
Although there is evidence that there is a need to provide more detailed information on new
products, the information must be relevant and if possible customised to each individual
consumer (Johannessen et al., 2001), but it may not be feasible because the provision of a
one-to-one information service would not only be expensive, but also impractical (Rokeach,
1973; Chikweche and Fletcher, 2012). However, differing levels of information aimed at
different group segments of consumers would be more useful than the current diffusion
method of sending the same message to a mass market.
The evidence suggests that any development of how manufacturers communicate new
products should begin with an assessment of the newness of the product from the consumer’s
viewpoint (Vercauteren, 2005). If consumers are confused by product complexity then this is
the variable that should be used to measure newness. Evidence has established that a new
product must be different (Chapman, 2005) and that it must have some degree of complexity
to attract and gain initial interest from consumers (Michaut et al., 2001a). More research is
needed to establish a categorisation of product complexity from the consumer’s viewpoint.
This categorisation of complexity could then be matched to the information needs of
consumer groups; one key area of research identified in the literature review summarises this
succinctly by asking “how new?” and “new to whom?” (Johannessen et al., 2001).
There is a wealth of literature relating to the categorisation of new products (Booz et al.,
1982; Meyer and Roberts, 1986; Gobeli and Brown, 1987; Gregan-Paxton and John (1997);
Cooper et al., 2002), however all current product classifications are measured on two
manufacturing viewpoints. The first is the manufacturing capability in terms of technology

5
(Booz et al., 1982), the second is the newness of the market application for which the product
has been developed (Gregan-Paxton and John, 1997). The marketing department is then given
the task of positioning the manufactured product in the mind of the consumer (Jiao et al.,
2007), but evidence suggests that marketing campaigns based on a manufacturer’s view will
not be as effective when compared to a consumers view of product newness (Johannessen et
al., 2001).
Even if manufacturers could establish a new measure of consumer product complexity and
develop marketing campaigns based on the consumer’s viewpoint, they only have
conventional consumer data based on demographics and social class that can be used for
conditional segmentation methods, such as post code areas, income levels etc., (Bayus, 1991).
Even recent research into social classes that suggests there are seven social classes instead of
the accepted three (Hall, 2013) are still inadequate, because whilst this type of data tells you
where consumers are located, they are unable to differentiate between individual’s views and
behaviour, even if they have the same demographic (Bayus, 1991).
Bloch (1981) suggests these views and behaviour are very emotive in nature when related to
automobiles, some to a greater or lesser extent depending on how involved they are with their
cars, and that basing campaigns using only demographic data is inappropriate. New products
arouse different levels of interest and enthusiasm between consumers and what may be new
to one consumer may not be to another (Rogers and Shoemaker, 1971), this is due in part to
the level of knowledge or expertise of an individual as well their enthusiasm or involvement
for a product (Bloch, 1981; Kleiser and Mantel, 1994, 1999; Laaksonen, 1994; Sasu and
Ariton, 2011).
There is a great deal of literature concerned with consumers and product involvement,
however this area of research is generally treated as a catch-all for all aspects of involvement
with the main focus being on the purchasing process (Hupfer and Gardner, 1971; Muncy and
Hunt, 1984; Jensen and Hansen, 2006). For example, situational or purchase involvement
attracts the most attention for researchers because this is when the intensity of involvement is
at its highest (Peter and Olson, 2010).
Whilst this is valid, situational involvement is temporal in nature and quickly subsides when
the purchase process is completed (Peter and Olson, 2010) and is considerably downstream

6
from the impact of a new product. Situational involvement can only commence after product
exposure and is more concerned with external elements that begin after the initial shortlist has
been made - such as costs (Bloch and Richins, 1983; Dholakia, 2001).
In comparison a consumer’s first impact is when they are initially exposed to the new
product. Even during this early stage there is an intensity of emotional involvement, to a
greater or lesser degree, depending on their level of enthusiasm and interest towards the
product, which can evoke positive as well as negative reactions (Bloch, 1981). What is
important is that emotional involvement is enduring and is concerned with the actual object -
what it is, compared to the temporal nature of situational involvement which quickly subsides
after the purchase is completed (Bloch, 1981).
There is evidence to suggest that emotional involvement moderates the level of consumer
product knowledge (Bloch, 1981), not the in-depth technical knowledge associated with
experts, but more from the aspect of interest in what it does rather than how it works, yet
there is a gap in current literature that measures this construct. Another aspect that is not
utilised, is the previous exposure or familiarity that consumers have with current products.
For example, in the case of cars, previous owners will have more knowledge and be more
aware of the changes to a new model compared to other consumers.
From a marketing perspective, data of this nature would provide more insight into their
consumer base as well as more accurate consumer segments. To do this the areas of expertise,
involvement and familiarity need to be unpacked so that they focus on the time when
consumers are first exposed to new products.
If data was available for consumer segments, based on their level of familiarity, involvement
and expertise with a product, then a sample of consumers that represent those segments could
be used to establish a products level of complexity. This will provide two significant benefits;
firstly manufacturers would be able to establish a new products optimum complexity, with
lower and upper levels. Secondly marketers could provide more relevant information based
on these levels. For example, clearer explanations can be given when communicating
products that are high in complexity to avoid alienating consumers that have low levels of
expertise, compared to more detailed information that would be sought by experts. This

7
would provide marketers with new consumer segments and more effective advertising
campaigns.
Currently, most advertising is based on lifestyles and consumer aspirations to those lifestyles
(Young and Rubicam Inc, 2002; Experian, 2003; Acxiom, 2004; Harris, 2004; Lilley, 2004;
thevaluescompany, 2004; WPP Group, 2005). These are centred on a consumer profile
established by manufacturers, or their marketing agencies, which they believe fits with their
product. Methods that utilise this shoe-horning of product to consumer or consumer to
product are unlikely to be successful if it relies on consumer aspirations. Although
practitioners continue to use product positioning and aspirational methods as their main
marketing tool, there has been very little academic research in this area, probably because this
catch-all approach has little merit. Evidence suggests that consumers should be the judge of
new products (Rogers, 1995; Danneels and Kleinschmidt, 2001; Johannessen et al., 2001) and
marketers would benefit from obtaining consumer views, rather than imposing their own.
To date there have been no studies that have investigated links between product complexity
and consumer segments that has utilised familiarity, involvement and expertise to measure
the appeal of new products. Consumers would benefit from more information that is
appropriate to them as an individual (Johannessen et al., 2001) and provide a greater
awareness of products that they may normally overlook (Rogers, 1995), and for
manufacturers it would increase the effectiveness of their marketing campaigns whilst
providing a better indication and likelihood of success (Shillito, 2001).
1.3 RESEARCH OBJECTIVESThe objective of this thesis is to fill a gap in the literature on how consumers perceive the
complexity of new products, based on their involvement, familiarity and expertise. Currently,
in the automotive sector, there are no classifications that accommodate the consumers view or
indeed categorise the degree of innovativeness (newness) and complexity they perceive in a
new product.
In addition, there is no differentiation in marketing messages. A consumer profile is
established by the product development teams and the same message is then sent out to mass
market segments based on demographics. The objective is to design a more effective method

8
of profiling consumers, with data that identifies consumer segments more accurately, instead
of using a structure based on intuition rather than systematic analysis (Dibb, 1998). Yet an
intuitive structure is the approach most used by manufacturing industries, including the
automotive sector, and one that has remained unchanged for some time (Dibb, 1998).
The evidence suggests specific objectives for the thesis as follows:
to establish/test independent variables that measure consumers’ product expertise,
involvement and familiarity with a product.
to investigate the relationships between these independent variables and a dependant variable
that constitutes an overall consumers product experience (CPE).
to establish/test independent variables that measure new product complexity (NPC).
to investigate the relationships between CPE and NPC and discover if lower and higher levels
of complexity can be established to provide an optimum range of complexity for a given
product, a dependant variable - consumer categorisation of innovation (CCI).
This thesis investigates and builds upon previous studies in the areas of product newness and
market segmentation. In doing so it provides important guidelines for marketing departments
on data collection for improved consumer segmentation and manufacturers with a more
effective measure for their new products.
By achieving these objectives the thesis will add to the area of consumer behaviour, new
product development and market segmentation.
1.4 CHAPTER OUTLINEThe following structure gives an indication on how the research was carried out:
The review of literature is split into two sections to distinguish between the theoretical and
what happens in practice. The first section 2.2 to 2.4 is a review of academic literature, the
second 2.5 and 2.6 is a review of literature and information obtained from practitioners in the

9
automotive industry. The chapter begins with a short introduction leading into consumer
behaviour which encompasses a wide range of literature including schema congruity, needs,
expectations, emotions, involvement, traits, social cognition, stimulus, interest, inertia,
values, benefits and means-end chain, search behaviour, appraisal theory and consumer
concerns. This is followed by a section on new product development which discusses
research relating to product newness, complexity, familiarity, expertise, innovation theory,
optimum range categorisation theory and product development theory.
The review then looks at what happens in practice in the automobile industry and looks at
three areas – New Product Development (NPD) in The Automotive Industry, Market
Segmentation and Practioners and Advertising and Communications; NPD is discussed from
the automotive manufacturer’s perspective. This is followed by segmentation strategies
which covers all the leading practitioner methods employed within their industry, together
with a short section on advertising and communications. The chapter concludes with a
summary and focuses on the gaps in the literature.
This is followed by chapter three which provides detail of all the exploratory studies that
were conducted during the course of this research. This section includes fieldwork -
investigations carried out in the field rather than a laboratory, consumer discussion groups,
and interviews with manufacturers and practitioners, with detailed information on methods,
data, the findings, discussions, conclusions and limitations. The exploratory studies are
placed before the Methods chapter, because the investigations and pre-tests were necessary to
form a conceptual framework. The studies in this chapter are detailed and use online
questionnaires and SPSS analysis. Normally studies containing this level of detail are
discussed first in the Methods chapter, but because they were instrumental in the
conceptualisation of the study the detail is given here.
The study then leads into chapter four which is concerned with conceptualisation of the study
including the model and factors.
Chapter five is the methods section which describes the research methodology that was used,
including the questionnaire design and construction of the main survey - including pre-testing
and exploratory research methods. Details are alsoprovided on the sampling frame and data
collection methods, including online resources.

10
Chapter six provides the data analysis of the pilot and main surveys, including results and ,
findings. Details are given on a post-main survey of research into consumer preferences of
communication methods. The discussion of findings draws together all the practical scales
established from scale development techniques and the model is operationalised with
Confirmatory Factor Analysis using Structural Equation Modelling.
Chapter 7 reports on post-main survey investigations into the methods used by manufacturers
to diffuse product information for new model launches. Because of the timing of the product
launches the results could only be reported after the main survey was completed.
Finally, chapter eight discusses the study implications, hypothesis conclusions and
managerial implications and provides practical suggestions and guidelines that are relevant to
academics as well as practitioners. Limitations of this work are discussed in the closing
section with recommendations for future research in this area.

11
CHAPTER: 2 LITERATURE REVIEW
2.1 INTRODUCTION TO THE CHAPTERThis research has been directed at understanding the way customers approach buying a
product they do not understand. The automotive industries in particular are developing highly
complex products and often introduce several new innovations on each product release. This
increasing complexity is leaving customers confused, or even alienated from the products.
The aim of the research was to first, gain an understanding of how customers with different
levels of understanding of the product, in this case a vehicle, approach the buying process.
Second, what aspects of the buying process might be accessed and utilised by car
manufacturers to market and sell their products. In order to achieve these aims a broad range
of literature has been reviewed and analysed. For example, research that explored issues such
as ‘how new?’ and ‘new to whom?’ (Johannessen et al., 2001), was considered of central
importance when explaining how consumers develop perceptions of new products. The
review also explored how car manufacturers develop new products and take them to market,
and how those products are understood by consumers.
The automotive sector develops products that regularly are introduced with new
technological innovations, so how consumers view new technologies on cars has also been a
focus for the review. The literature review is organised into six main sections. After this
introduction, section 2.2 discusses consumer behaviour towards new products, their
perceptions and motivation, as well as how experience and exposure to a product moderates
behaviour. Consumer concerns relating to new products are discussed, in particular, the
feelings of uncertainty and risk in choosing the right product and the adoption of new
technology are considered in the appraisal and acceptance process. Sections 2.3 evaluates
New Product Development (NPD) literature to ascertain what defines product newness and
section 2.4 focuses on how NPD theories have been applied in the automotive industry.
Section 2.5 evaluates how market segmentation and information is currently sourced and
used by manufacturers and marketing practitioners for marketing campaigns with section 2.6
focusing on how the techniques and methods are employed in advertising and
communications in the automotive sector. The chapter concludes with a summary of the
findings and implications that have driven this research.

12
2.2 CONSUMER BEHAVIOUR
2.2.1 Schema CongruityPeter and Olsen (2010) define consumer behaviour towards products, as the thoughts,
feelings and actions that consumers experience during the consumption process and argue
that these experiences are influenced by everything that is happening within that
environment, such as advertisements, product appearance, consumer comments and advice.
This consumer interaction is dynamic involving interactions and exchanges on how
information is received and absorbed, particularly for those who are attached or involved with
a product, as these consumers can be very motivated and energised (Peter and Olsen, 2010;
Morton et al., 2011).
Meyers-Levy and Tybout (1989) first suggested the concept of ‘schema congruity’ as a basis
for this product evaluation by consumers. Schema are defined as organised patterns of
expectations, beliefs, prototypes, and effect (Home and Kahle, 1988; Folkes and Kielser,
1991) that guide perception, thought, and action (Mandler, 1981). Schema can be described
by their level of congruity, that is, how well the picture fits with what they know and expect
(familiarity). When familiarity is lacking the schema is said to be incongruous (unfamiliar).
Products are said to be held internally as categorised schema with associated attributes and
values which are revised as new information is received and processed (Meyers-Levy and
Tybout, 1989; Tomaseti and Ruiz, 2004). For consumers, these internal schemas are activated
when new products are encountered in a search for a favourable match (Mandler, 1981).
Schema congruent products (familiar) are identified quickly and are only likely to prompt a
passing interest, whereas when schema incongruent products (unfamiliar) are encountered,
the novelty increases arousal and stimulates thought processes that search conceptually for
answers in an effort to resolve the incongruity (Mandler, 1981; von Hippel, 1986). Where this
effort is unresolved, extreme incongruity develops, resulting in a negative evaluation that can
lead to frustration and rejection. In the case where an incongruity is resolved, the process is
rewarding and positively valued; this is classified as moderate incongruity (Mandler, 1981).
Meyers-Levy and Tybout (1989) conclude that ideally moderate schema incongruity is
optimal, rather than no congruity or extreme levels; moderate schema incongruity results in
more favourable perceptions of a product.

13
Gregan-Paxton and John (1997) suggest schemas are created as a by-product of the
analogical learning process. When faced with something unfamiliar, people often attempt to
understand novelty or incongruence, by relating it to something familiar. This process can
involve accessing information from a number of familiar existing schema, in an attempt to
understand and comprehend an unfamiliar product. This accumulated knowledge is then
formed into a new schema (Shapiro et al., 2009). Coulson (2001, p122) discusses a similar
process he refers to as conceptual blending, comprising ‘composition’, ‘completion’ and
‘elaboration’, leading to a new emergent structure or new blend. The evidence suggests that
moderate schema incongruity suggested by Meyers-Levy and Tybout (1989) provides the
most favourable outcomes in product assessment without risk of alienating consumers.
Some authors argue that product categorised schema have associated attributes and values
(Ostlund, 1974; Meyers-Levy and Tybout, 1989; Gregan-Paxton and John, 1997; Hofstadter,
1998). Attributes contain concrete, physical elements, such as an optical mouse as part of a
computer, alongside abstract attributes that are inferred and intangible, such as ease of use.
Most attributes also have a relation, an interconnectivity with other product components, e.g.
the optical mouse has a relationship with the computer screen. These attributes and
relationships create a base domain and are important in establishing new schema or target
domains. Central to this process is the comparison of the attributes and relations of one base
domain with another, which as a process seems similar to Coulson’s (2001) conceptual
blending. Sometimes attribute only comparisons can be problematic as some consumers have
a tendency to embellish the transfer of information from a base domain to a new schema,
resulting in errors (Gregan-Paxton and John, 1997). Copycat products take advantage of these
type of errors, particularly when it is based on physical similarity alone, as it encourages
more favourable comparisons (Gregan-Paxton and John, 1997).
Novices and experts tend to approach products differently. Novick (1998) suggests novices
are primarily attribute-driven whereas experts are relation-driven. This argument supports the
views of Gregan-Paxton and John (1997) who observed that schema-based categorisation was
beyond the ability of those with low levels of base domain knowledge. They suggest that
novices with impoverished schemas (low relational content) utilise a similarity–to-exemplar
process in which the more similar the target domain is (i.e. the more attributes observed) to
the base domain (exemplar) the more willing the novice will be able to make a comparison.
In addition they suggest that experts also use similarity-to-exemplar processing for familiar

14
products that do not warrant the use of schema based processing, but if there is a total lack of
product categorised schema (as in the case of new-to-the-world products), then both experts
and novices turn to mere appearance comparisons in an attempt to identify associations. If a
match cannot be found in this category-based evaluation then the individual product attributes
have to be considered in a piece-meal process or, in the case of novices, using category-based
processing (Gregan-Paxton and John, 1997).
Recent research has identified problems in some expert evaluations (Mehta et al., 2011).
Findings revealed that when products lacked relational information, experts had a tendency to
punch above their weight to avoid schema incongruity, and made assumptions based on
attribute comparisons. Some assumptions were made because the experts thought they were
expected to know; Mehta et al. (2011) describe these actions as false recall effects and found
that some experts fill in missing information and simply guess. Problems with expert
assessment is not new, Moreau et al. (2001) found that although experts had a higher
comprehension and a preference for continuous innovations, when they encountered
discontinuous innovations their entrenched knowledge resulted in lower comprehension,
fewer benefits and low preferences compared to novices. Moreau et al. (2001) concluded that
experts need supplementary information for discontinuous innovations. If this is the case,
then it is likely that where this information is not forthcoming, it is possible that experts may
make an inaccurate assessment of the value of an innovation, or product.
Mukherjee and Hoyer (2001) found that even consumers with low knowledge make
inferences on novel attributes based on potential benefits and cost. This value inference is
only positive if attributes are seen to add value. Part of the evaluation process includes
consideration of the learning-cost – the effort in learning how to use something. Complex
products are associated with high learning costs and are negatively evaluated as a result.
Mukherjee and Hoyer (2001) argue most people do not want to understand the inner
mechanics of complex products and so marketers should always highlight ease of usage and
provide benefit information when launching new products.
There are cases where innovations are equally abstract for novices and experts. An example
of this is the Mercedes-Benz Biome concept car revealed in 2010. This car was made from
Biofibre a lightweight material grown from seed so at the end of its life it could be
composted, just like garden waste. Whilst this was a serious design proposal, the press at the

15
time commented that it owed more to the realms of psychedelia than the accepted norms of
car design (Williams, 2010b) - it would appear that there are limits to acceptability.
Even the concept of ‘newness’ is subject to individual interpretation (Rogers, 1995; Moreau
et al., 2001; Pauwels et al., 2004; Cowley and Mitchell, 2005; Talke et al., 2009; Loginova,
2010; Johannessen and Olsen, 2011; Simonsohn, 2011). Rogers, (1995, p.36) identified five
perceived attributes that consumers use to judge new innovative products:
Attributes of Newness Description
Relative advantage An evaluation of the advantages of a new idea/product over
existing ideas/products
Compatibility Concept of matching existing values and needs
Complexity Degree of difficulty to understand and use a product
Trialability Can be tried or experimented with on a limited basis
Observability An innovation offers observable results
Table 1 - Attributes of Newness - summarised from Rogers (1995)
The second attribute - compatibility, is for this research, the most interesting. Compatibility
involves the consumer relating the product to internally held criteria/knowledge where values
and needs have a high influence in determining the outcome, though it is noted that Blythe
(1999) suggests that such a process is only likely to be undertaken for high-involvement
purchases because of the extended evaluation e.g. a house or car. The third attribute,
‘complexity’ is also of great interest for this research as if there is a lack of understanding ,
‘use’ and any further product evaluation cannot take place, at this point products are often
overlooked or bypassed (Mukherjee and Hoyer, 2001).
Although values and needs vary considerably among different consumers, initial interest and
arousal is critical when selling a product. If a product fails to grab any attention, the
consumer is unlikely to pay attention, even if the product meets the needs and values that are
being sought (Mandler, 1981). However, when attention is captured, needs quickly come to
the forefront of the appraisal process as they are the dynamic motivator of our desires.

16
2.2.2 NeedsKim et al. (2002) propose that consumer values and needs change overtime, adapting
dynamically to personal circumstances, surroundings and environment. Values are a type of
social cognition that shape an individual’s needs and desires (Becker and Richards, 2007),
which in turn determines attitudes and consumption behaviour that are manifested by
preferences for certain products. Chapman (2005) points out that all forms of desires are
motivated by two categories of need, those that are ‘innate’ and those that are ‘acquired’.
Innate needs are physiological, such as the need for food and shelter. In contrast acquired
needs are psychological, things that people want or aspire to, such as recognition, prestige,
social status and friendship. Chapman’s (2005) categories are similar to the ‘functional’ and
‘social’ needs proposed by Park et al. (1986), but they suggest a third category ‘experiential’
needs are required to satisfy the desire for variety, novelty and sensory pleasure; Park et al.
(1986) suggest the latter being the most important motivator in creating demand for new
products. Perhaps the description given by Steg (2005) of ‘must’ and ‘lust’ of car use is more
appropriate.
Steg (2005) found that while innate/functional needs are necessary (must), the social and
affective or experiential needs (lust) provide the most differences between consumer groups,
in particular the emotional aspect of how they feel about a product. Sasu and Ariton (2011)
support this view, they found that the way some people talk about cars show they satisfy
social needs and experiential desires, some people don’t drive cars just because they need
them, but because they like to drive.
Although values and needs change over time, experiential needs do not as they are an
ongoing desire for new things, as soon as old experiential needs are met then new experiential
needs emerge “nurturing the infinite sequence of desire and destruction that is so
characteristic of the modern world” (Chapman, 2005, p.54).There is evidence that consumers
can recognise and/or visualise needs. Research by Schoormans and Robben (1997), found
that one third of unplanned buying was attributed to consumers recognition of new needs
while shopping, but Stern (1962) argues that this is not necessarily irrational, particularly
when consumers see something for the first time and visualise a need. Even instances of pure
impulse purchasing are usually associated with a desire to escape from the norm, e.g.
anecdotally, a colleague who intended to buy a small economic car, recently returned with a
high-performance BMW estate car, citing that she just ‘needed to have it’. Yet there are some

17
‘givens’ that consumers may find hard to sacrifice, an expectation to have at least what they
have had before.
2.2.3 ExpectationsMoultrie and Fraser (2004), proposed that product development of existing lines should begin
with the assessment of how the current product compares with user expectations and this
should be approached with a mindset that the consumers expectation is that new equals
better. They suggest that if the existing product falls below consumer expectations, it would
be impossible to improve the product without this information, and it is likely that the new
product will inherit the faults and flaws of its predecessor.
Some expectations are short term others long-term, but in both cases there are times when
consumer expectations are not met (McCarthy, 1995). For example, The Economist (2012a)
asked “Whatever happened to the flying car?” the adverts of the 1950s and 60s led the baby
boomer generation of that area to grow up to believe that they will be going to work in sky
cars. The same generation may have been saddened when tape cassette players were no
longer fitted to cars, only to hear that there are now plans to remove the CD player
replacement with MP3 players (McManus, 2012). Some proposals are treated with cautious
anticipation e.g. a self-driving car (The Economist, 2012b), but for other practical changes
manufacturers should assess how such proposals impact on consumer expectations and in
particular, create emotional reactions such as arousal and disappointment.
2.2.4 Appraisal Theory and EmotionsThe appraisal of a situation, object, or event is based on the personal significance of a number
of dimensions and criteria. Appraisal theory invokes responses that are emotional in nature
which are differentiated by an individual’s subjective evaluation. Appraisal is a two stage
process involving a primary appraisal (i.e. the positive or negative significance of an event
for one's well-being), and secondary appraisal (the ability to cope with the consequences of
an event), (Scherer, 1999).
Scherer (1999), suggests the classic approach to appraisal employs four main groups of
criteria:

18
1. Intrinsic characteristics of objects or events, such as novelty or agreeableness.
2. The significance of the event for the individual's needs or goals.
3. The individual's ability to influence or cope with the consequences of the event, including
the evaluation of uncertainty/risk.
4. The compatibility of the event with social or personal standards, norms, or values.
Zajonc (1984), points out that although appraisal theory may explain some emotional
reactions there are many cases where responses are unconscious and undeliberate, and it is
possible for arousal to be triggered without any in-depth cognitive-evaluative processing at
all. What is clear is that the appraisal process will come to an abrupt halt if initial exposure
does not stimulate further interest. Depending on a consumer’s individual circumstances there
may be underlying concerns and risks associated with a product that restrict the evaluation.
Emotions are central to appraisal theory (Scherer, 1999); they are involved in a person’s
subjective evaluation of a situation, object or event in a process that involves assessment,
such as novelty, impact on meeting needs and goals, the ability to influence or cope with any
consequences and compatibility with social or personal standards. Whitfield (2009) suggests
the process begins with stimulus and ends in a response involving reactions that provide
pleasure in terms of arousal as well as arousal potential; many of those reactions being
automatic unconscious factors (Scherer, 1999). For high value products, purchase decisions
are likely to be goal based – not just functional but also higher order (Schlosser, 2003), for
example what does a car or house say about you (Whitfield, 2009). Whilst stimulus is the
basis for comparison, emotions are fundamental in reaching a categorical conclusion, and
something that is person specific.
In comparison Barsalou (1995) suggests that whilst goals are individual in nature there are
shared taxonomic categories which are recalled during the decision-making process, for
example a commuter will require a comfortable car with good fuel economy and may
associate a subcompact car with these attributes, a process described as constraint-chains. Yet
Barsalou (1995) acknowledges that at this point emotions become involved in the final
appraisal process. How intense those emotions are is dependent on the level of involvement
consumers have with the product.

19
2.2.5 InvolvementBloch (1981), Shimp and Sharma (1983) and Lennox and MaClaren (2003) have all argued
that consumer views are moderated by a consumer’s enthusiasm or involvement with the
product. Products arouse different levels of interest and enthusiasm between consumers and
impact on how they view new products. Research by Zaichkowsky (1985b) suggests this
interest and enthusiasm is involvement with the product, a motivational construct that
increases with more frequent use. Zaichkowsky also suggests that product use and
involvement are correlated when use of the product is optional, although most consumers
regard a car as a necessity.
Other views suggest involvement is represented by an individual’s needs, goals, values and
any existing knowledge and attitude to the object (Laaksonen, 1994; Garcia and Calatone,
2003), however Gatignon and Robertson (1991) suggest that this is moderated by the degree
of innovativeness of a product. Rogers and Shoemaker (1971) disagree with this view and
suggest that if the object or idea seems new to the individual, then from their individual
viewpoint it is an innovation. It is argued here that how involvement with the product
influences consumer behaviour depends on the intensity of involvement and so adopts the
position also taken by Sasu and Ariton (2011). It is important to note that the literature has a
very broad definition of involvement, many researchers use it as a catch-all for a number of
variables and processes, some examples are shown in Table 2.

20
Researcher Term Used Definition of involvement
Hupfer and Gardner (1971) Ego
Involvement
'the degree of ego-involvement can be
determined by the relative importance of an
attitude that the individual holds regarding
the object or activity' (pp. 262-3)
Jensen and Hansen (2006) Purchasing
Involvement
Relevance of purchasing activities to
the individual
Peter and Olson (2010)Brand
Involvement
Commitment to a specific brand
Muncy and Hunt (1984)
Ego Value of self and object
Commitment Purchasing intentions
Communication Information search
Purchase Concerns at the time of purchase
Response Reaction to a product
Table 2 - Approaches to ‘Involvement’ applied in the literature
This research has focused on the impact of ‘Response Involvement’ as this is concerned with
the initial reaction to the exposure of a new product; the other categories of involvement
happen later in the product evaluation process to support purchasing decisions and so are only
activated in the subsequent arguments and debates for purchase (Peter and Olson, 2010).
Although Ego may have some influence, all the other aspects have no place in the initial
exposure. The difficulty in applying the concept of response involvement is identifying how
involved the consumer is with a given product.
Involvement is a personal phenomenon that is an expression of an individual’s views and
feelings, as a well as how they respond to an object (VonRiesen and Herndon, 2011).
Consumers also differ in how long they spend in assessing a product, what search patterns
they apply and how much detailed information they need to make a decision (van Rijnsoever
et al., 2009). Consumers can be active or passive to advertising and marketing
communications which may cut short or activate further information searches depending on
the intensity of involvement with a product (Laurent and Kapferer, 1985; Zaichkowsky,
1985b). Bauer et al. (2006) suggest that higher levels of involvement, leads to greater
perceptions of product attributes. However, Zaichkowsky (1985a), points out that increased

21
perceptions does not necessarily mean an increase in expertise; it is suggested that you do not
need to be an expert to have involvement.
Quester and Lim, (2003) suggested that high involvement is a pre-requisite for loyalty,
whereas extremely low involvement can be the least understood and unpredictable area
because of the ambivalence and/or inertia to the product and product information. How
involved, uninvolved and ambivalent a consumer is with a product is a key factor in
determining brand loyalty (VonRiesen and Herndon, 2011). According to VonRiesen and
Herndon (2011) brand commitment is more likely when the level of involvement is above-
average (true loyalty), as opposed to low involvement which generally indicates loyalty of a
spurious nature. Peter and Olsen (2010) argued that marketers are able to influence overt
consumer behaviour, but not covert behaviour or consumers with inertia towards a product.
Whilst loyalty is not a specific subject of investigation in this thesis, the inertia aspect of low
involvement is discussed in more detail in Section 2.2.9 as marketers should consider how
they communicate with this segment.
Richins and Bloch (1986) states that involvement is consumer-defined, not product-defined,
yet most products are classified as high or low involvement by researchers, although Peter
and Olson (2010) suggest even this is inaccurate as involvement is a continuum rather than a
bipolar classification. Laurent (1985) suggests all surveys should include a measurement of
consumer involvement as advertising messages should be tailored to be active or passive in
order to limit or extend the way in which consumers’ process information.
However, Peter and Olson (2010) suggest that involvement is not a continuous state, it is
specific to occasions, such as when purchasing a car and that once the purchase is completed,
the involvement fades until the next time, yet a distinction is drawn between intrinsic self-
relevance - those who are passionate about cars, and self-relevant consequences - those who
are concerned with social status, the former being more enduring than the latter. A number of
authors disagree with Peter and Olsen (2010) that the involvement fades between purchases,
on the contrary automobile involvement is seen as a constant long term interest that endures
over time (Lennox, 2003; Kassubeck et al.,2011) and would only intensify at the time of
purchase, rather than fade during the intervening period (Bloch, 1981).

22
Dholakia (2001) suggest that even when situational elements such as unanticipated costs of
early replacement introduces risk that can heighten and skew the level of involvement,
enduring involvement will always prevail. Although situational involvement is important in
the decision-making process, it relates to tangible aspects such as cost, choice and the
outcomes of perceived risk (Bloch and Richins 1983). However, this thesis is concerned with
the enduring emotional involvement that forms the basis of the attraction to the product,
preceding situational aspects.
Figure 1 – Source: Redrawn from Bloch and Richins (1983, P78)
Bloch (1981) developed the Automobile Involvement Scale (AIS) based on the so-called
‘love affair with the automobile’ that is associated with ridership and a long-term interest in
cars. The scale is based on the importance of personal needs, image and values that reflect an
individual’s involvement on an ongoing basis, ranging from minimal to extremely high
levels. Although the evidence suggests that AIS (Bloch, 1981; Shimp and Sharma, 1983;
Lennox and McClaren, 2003) provides a reliable tool to identify consumer segments in the
automotive industry, personality traits can provide an alternative segmentation tool.

23
2.2.6 TraitsMowen and Harris (2003) carried out research in the automotive industry using personality
traits as a segmentation tool and proposed a four level hierarchy (Table 3).
Trait Description of Trait
Elemental Self needs, emotions and arousal
Compound Competitiveness and task orientation
Situational Frugality and value consciousness
Surface The reaction to elemental, compound and situational traits. Prone to
bargaining
Table 3 - Personality Traits Segmentation Tool - summarised from Mowen and Harris (2003)
Mowen and Harris (2003) discovered that the surface trait of bargaining proneness was useful
for targeting consumers for dealers that employ a price negotiation strategy. By identifying
consumers with this trait combined with demographics it enabled them to target this segment
more accurately. However, according to Blythe (1997), there are an estimated 18,000
identifiable personality traits with more being discovered daily - bearing this in mind, the
target market would have to be very specific to be effective . Hutchinson and Eisenstein
(2008) suggest that traits are developed over time and are formed from social cognition; this
is discussed in the next section.
2.2.7 Social Cognition and StimulusSocial cognition is formed from learning what others do and do not do; learning might impact
on and change persons behaviour, but learning can also occur without a change in behaviour
(Bandura and McClelland, 1977). Searle (1995) suggests that nothing is known to a person
except the content of their experiences and that cognition develops as people adapt to their
environment. Berger and Luckmann (1991) argue that although people do adapt, reality is
differentiated by the degree of familiarity person has with surroundings.
Cognition then, begins with stimulus. Radford and Bloch (2011) propose that stimulation
begins with a visual evaluation that raises arousal and interest. This would then seem a
crucial experience for manufacturers to understand, as if a new product fails to make an
impact, the evaluation process comes to a halt. Radford and Bloch (2011) found that the

24
focus of new product development has always been on technology and features and has not
taken into account consumer reactions. When consumers are faced with making a choice
between a large number of new products ,which are often introduced with only small changes
and differentiators, they are often confused, not only by the large number of products, but
also by the abundance of marketing materials. To stand out from the clutter, new products
need to have visual stimulus. For example, a new automobile model receiving a “wow” type
of response at a motor show will create an immediate impact, it is not sufficient for a product
to just have new features, it must also look different to other products (Radford and Bloch,
2011).
Sasu and Ariton (2011) found that in the automotive sector, complexity is the main stimulus
for buyers. Stimulus evokes four types of consumer response (Crilly et al., 2004); emotional,
aesthetic, semantic interpretation (what it does) and symbolic association (social status),
emotion being fundamental in stimulating arousal (Whitfield, 2009). Most consumers do not
delve very deeply in their search for information on new products, most rely on extrinsic
cues, the non-physical characteristics such as advertising, packaging, brand reputation and
price (Ratneshwar et al.,1996), whereas other consumers refer to third party sources for
information, such as product reviews in their product assessments (Akdeniz et al., 2013). A
frequent measure of stimulus is fixation times with the product or product information, the
association being that interest holds your attention for longer periods, indicating a preference
for one product over another (Goldsmith and Hofacker, 1991). However, Mandler (1981)
warns that this association can be flawed because the interest could be bad as well as good
and may have little to do with preference, citing the situation in road traffic accidents where
motorists slow down to view the scene, a problem which is referred to as “rubbernecking”.
For the majority of consumers, interest arises when they are intrigued by something which is
unfamiliar and/or complex to understand (Berlyne, 1978; Silvia, 2005), although curiosity
will decline rapidly unless they can source adequate information. If the product is too
complex any future exposures will be given less and less interest. Sahar (1999) proposes that
interestingness is individual and subjective due to the diverse nature of consumer knowledge.
However, some consumers do have continuing intense interest and enthusiasm for products,
particularly those who must have the “habitual acquisition of newer, shiner things”
(Chapman, 2005, p.18) and they continually seek out information on new products within
their area of interest and usually have an impact in the transfer of new information to other

25
consumers (Bloch, 1986). Others have fixed perceptions, innate preferences of things they
like and dislike, these can be inherited preferences that make it entirely possible to like
something without knowing why it is we like them (Mandler, 1981). These preferences may
change over time through exposure to new experiences, whereas some consumers wait to see
if others like the product, particularly for infrequent purchases, but following others can be
problematic as consumers have different tastes; one may like a product that others dislike
(McFadden and Train, 1996).
Michaut (2004a) found that liking increases when new products are understood and disliked
when this was reversed, similarly Peter and Olson (2010) found consumer appraisal follows a
process of awareness, knowledge and liking. In this case like/dislike is more acceptable in the
early stages as an immediate response to new products rather than the deeper emotion of
love/hate that may develop over the longer term. This could be compared with human
relationships, unless it is love-at-first-sight it begins with liking each other, this analogy can
be drawn with the ‘exposure effect’, the more exposures to a product increases the probability
it will be liked (Clark and Fiske, 1982). Nel (2012) suggests that liking something is not
enough, people do not buy things that they just like anymore, but they will spend their money
on things they love. Nel suggests that liking something does not mean a change in behaviour,
whereas the emotional responses of love and hate does. Just liking something means it’s okay
and as most ideas are not groundbreaking, they fall into the okay or like bucket. With more
and more competing products in the marketplace, Nel (2012) suggests manufacturers need to
get their consumers to move from liking their products to loving their products. Yet there is a
segment of consumers that appear to have little or no interest in some products.
2.2.8 InertiaAlthough there are leaders and followers in the adoption of new products, such as the Rogers
and Shoemaker (1971) categorisation of innovators through to laggards, there are consumers
that appear to have no apparent reasons or preferences when making a purchase decision, the
so-called ‘inertia’ segment (Bettman and Park, 1980; Alba and Hutchinson, 1987; Goldsmith
and Flynn, 1992; Schoormans and Robben, 1997; Peter and Olson, 2010; Wu, 2011).
Rogers and Shoemaker (1971) categorisation implies a hierarchical approach, a simple
lineage of leaders and followers in the take up of new products that is led by innovation,

26
peaking at the early majority stage and then descending into decline. Prior to Rogers’s
categorisation, Stuteville (1968), suggested consumers rely on feedback from early
innovators, they wait until they confirm it is okay before they start to take up the product.
Stuteville points out this is similar in manufacturing, innovators take the lead followed by the
larger group of imitators. Later research by Santini and Vyas (2005) found that in the
automotive market, consumers change their purchase decisions as new-technology vehicles
move from the risky or unique phase to the safe or mainstream phase.
Wu (2011) proposed that inertia occurs when consumers make decisions based on situational
cues and reflects a non-conscious process; unemotional; habitual; indifferent and convenience
driven but because of this, even though the purchase process appears to be passive and
without much thought, it is fragile and should be treated as spurious loyalty as such
customers are vulnerable to attractive alternatives. In fact Greig (2003) suggests that when
there is such a weak connection, the inertia segment of consumers are more likely to accept
suggestions made by others, whether this be friends and family or at the point of sale.
Wu (2009), found that inert consumers are unpredictable, as they will easily terminate their
relationships if they are attracted by better offers in the marketplace. Peter and Olson (2010)
describe this behaviour as a simple or conjunctive strategy, whereas Bettman and Park (1980)
suggest that it may be that the task is just too overwhelming and some consumers go with the
easiest options. Keller (2003) though proposes that all encounters with a product have the
opportunity to change a consumer’s mental representation and information of that product.
This would suggest that care must be taken when asking questions from consumers that show
ambivalence in their attitude to new products, such as someone who buys without much
thought. These consumers may have difficulty in explaining why they made repeat purchases
of the same brand, especially if the reason they gave is they simply buy because they really
like the brand (VonRiesen, 2011). It may be that for the inertia segment their requirements,
for some products, are easily met, such as values and means-end chains.
2.2.9 Values and Means-End ChainsMost authors accept that there is a correlation between lifestyles and social surroundings and
such lifestyles have an impact on values (Rokeach, 1973; Home and Kahle, 1988; Kahle and
Chiagouris, 1997; Kim et al., 2002; Greig, 2003; Brookes et al., 2004). Kahle and Chiagouris

27
(1997) suggest that it is critical to gain an understanding of why specific product attributes
are regarded as important to people with certain lifestyles and values. They also acknowledge
that there is no universal set of attributes to characterise all products. However, Rokeach
(1973) suggests that values are stable and enduring, and that the total number of values a
person has is relatively small. He also argues that most people possesses the same values, but
to differing degrees. Consumers view product attributes as a means to an end, in other words
the benefits gained – a means-end chain (Laaksonen, 1994). Means-end chains are made up
of instrumental values (what it is and means to you) and terminal values (what it does and the
consequences). These values can be domain specific (van Raaij and Verhallen, 1994). For
example, Sasu and Ariton (2011) suggest the reason for car ownership is the instrumental
value when choosing a car, whereas things that give pleasure, security and a comfortable life
are terminal values (Peter and Olson, 2010). Punj and Staelin (1983) suggest that the goal that
consumers strive for can be regarded as a ‘terminal value’. There are cases for specific
terminal or end requirements; these are known as constraint chains. For example, commuters
who travel long distances will look for a car that has the attributes of good fuel economy and
comfort such as a subcompact car or large families that would need an estate car (Ratneshwar
et al., 1996).
Rokeach (1973) developed a model comprising eighteen instrumental and eighteen terminal
values; the Rokeach Value Survey (RVS). The survey asks respondents to arrange the values
in order of importance to them, starting with the most important and so on until the list is
exhausted, resulting in the identification of higher ranked orders of instrumental and terminal
values. However the RVS has been criticised by Home and Kahle (1988), because of the
difficulty of the lengthy ranking task and information loss due to rank orderings. Home and
Kahle (1988), unsurprisingly, had a preference for their own List of Values (LOV), a
simplified model developed from Rokeach’s RVS but that also accommodates a number of
category-relevant factors. They suggest that value dimensions are not independent and that
value perceptions can be generated without the product or service being bought or used, for
example a trade-off between quality and price; a value-for-money conceptualisation
(Sweeney, 2001), which itself is a means-end value process. LOV is used extensively in
academic research and significantly predicts consumer behaviour trends (Kahle et al., 1986;
Cohen and Basu, 1987; Sweeney and Soutar, 2001; Kurpis et al., 2010).

28
Holbrook and Stern (1999) take a different approach and suggests consumer value can only
be derived from the interaction between the consumer and the product or service. The
interaction activates comparisons with relevant internally held preferences and values and the
outcome is defined as the consumption experience. The proposition by Holbrook and Stern
can only apply to a product or service that can be consumed by some form of interaction, in
the case of automobiles this could be through test driving the vehicle, but this is unlikely to
occur for under-the-bonnet improvements, no matter how innovative or novel they may be.
For example, the achievement of the highest accident crash rating or similar improvements in
occupant safety zones in automobiles are unlikely to be consumed before they are
appreciated. As such it is logical to presume that not all values can be defined as consumption
experiences, for consumers to be attracted by these types of credence products, the
manufacturer must ensure consumers have enough information to form an assessment
(Gobeli and Brown, 1987).
Scherer (1999) suggests that internally held values are likely to be established well in
advance of any consumption stage and are activated in the appraisal process when consumers
come face-to-face with a situation, object or event for the first time. This still assumes some
form of prior experience or familiarity and they could be more psychological in nature than
material values as was found in the research by Stradling (2002) into the benefits obtained
from car use, which identified image and personal identity as key aspects that reflected their
success and happiness. Botschen et al. (1999) gives some support to this view, in this
research it was found that consumers only search for products that will fulfil the benefits and
values sought. There is evidence to support this notion that personal values give a clearer
understanding of consumption patterns especially if those values are implicit, as they will
affect what specific choices are based on, and what is or is not valued for a wide range of
products (Erdem et al., 1999; Allen, 2001).
Mandler (1981) points out that, in the absence of any other evidence, default values will
define the expected and normal values for any particular variable, that is, any gaps in product
or service perception will be filled by internally held values that have been developed through
extensive experiences. Mandler proposes that those experiences define what will become
usual and familiar. Depending on the extent of a consumer’s experience, any shortfalls will
invoke differing levels of search behaviour to fill those gaps.

29
2.2.10 Search BehaviourSeveral frameworks have been developed to improve our understanding of search behaviour,
including four relating to the purchase of new cars. First, Kiel and Leyton (1981) suggest
there are low, high and selective information seekers. Second, Furse et al. (1984) suggest
low, high and self-reliant approaches to information gathering. Third van Rijnsoever et al.
(2009) found relationships between attitude and behaviour to car purchasing by establishing
links between information sources and the most important aspects of car purchase, they found
correlations between involvement with cars, using Bloch (1981) AIS scale, and the amount of
information sources. Fourth, Sasu and Ariton (2011) offer a more detailed framework based
on the number of information sources used by the consumer as well as search intensity.
% Number of
Information
Sources Used
Search
Intensity
Behaviour displayed
45% Medium Low This group has visited relatively many dealers, has
discussed with many sales representatives and made
several test-drives. They enjoyed the car buying process
the most, they see themselves as having a low control
level on resources and don’t have a very optimistic
attitude towards technology or innovation.
25% Large Moderate In making the final decision, these consumers used the
most brochures, they consulted the most sales
representatives and made the most test-drives. They are
moderately optimistic and innovative when speaking of
technology.
25% Large Low They gathered information from many sources but the
number of searches within each source was the
smallest, these consumers being reserved when it comes
to new technologies.
5% Medium High These consumers are very optimistic about technology
and innovation.
Table 4 - Search Behaviour - Compiled from Sasu and Ariton (2011, p.23)

30
2.2.11 Consumer Concerns about Product InnovationsUnsurprisingly purchasing a high value product creates more concern in the consumer
because of the feeling of uncertainty and risk in choosing the right product. In addition to the
financial and psychological risks there may also be concerns about the adoption of new
technology (Ozaki, 2011; Barnett, 2012). A report into passenger cars by the Energy Saving
Trust (2007) suggests a growing reluctance for consumers to take up new technology through
lack of knowledge, familiarity or experience. They found that early adopters of new
technology represented only 2.5% of the total market and early buyers a further 12.5%, the
remaining 85% being the mass market, who adopt a ‘wait-and-see’ approach to new
technologies and innovations.
Because newness often implies innovation, and innovation often implies new technology,
research has shown that some consumers display a resistance to new innovations, even
technophobia (May, 2011), and that such resistance and phobia can become a real barrier to
adoption for some products (Brosnan 1998; Wiedmann et al., 2011). Brosnan (1998)
suggested that 85% of the population were hesitant or resistant to new technology and
proposed three consumer technology typologies: Eager Adopter: loves technology and is the
first to try any new gadget; Hesitant ‘Prove It’: uses technology but finds the learning curve
steep and encounters problems and Resister: keeps away from technology feeling they will
never learn or absorb anything from it. Rowley (2000) argues that the resistance is to the use
of technology, rather than technology, albeit the main problem being the complexity of
options that confronts consumers during the buying process. Unless care is taken about
introducing how to use new technology, consumers can be alienated very quickly resulting in
resistance and possible rejection (Mukherjee and Hoyer, 2001).
To some extent concerns about new technology and innovation resistance may disappear with
the passage of time. Currently, it has been suggested that with regards to technology,
consumers can be placed into two groups, digital natives and digital immigrants (Steinberg,
2012). Digital natives are children of the 90's who have had Web access and mobile
technology their entire lives as opposed to digital immigrants who were introduced to
technology as adults. In terms of information a digital native is not disrupted by a non-linear
narrative and is happy in receiving and piecing information in any order together, whereas
digital immigrants need the whole story, a beginning, middle, and end, and in that order.

31
In addition to technology concerns, there are a number of risk-related adoption barriers, such
as financial risk. The main causes for uncertainty include:- performance risk - will it do what
I want it to do; time risk - how much time will it take up and social risk - will it be acceptable
within my social circle, all these issues add to the feelings of uncertainty (Wiedmann et al.,
2011). The level of risk in purchasing situation depends on the product, low value and
frequent purchases such as milk, or soap, require minimal involvement by the consumer
(Dholakia, 2001). For high value products involvement risk is much higher and is defined by
the consumer (Richins and Bloch, 1986). So what defines product newness and what do
individual customers regard as innovation?
2.3 NEW PRODUCT DEVELOPMENTThis section assesses what defines product newness and what is an innovation from the
perspective of the consumer. This assessment leads into a discussion of product development
theory in order to identify the hurdles that face manufacturers, with particular reference to the
automotive industry.
2.3.1 Product NewnessThere are three main categorisations of how consumers process product newness, as defined
in the following table:
Categorisation
of Newness
Process Authors
Perceptual Directly grasped during product exposure Michaut et al. (2001a)
Epistemic Requires reflection on the part of the consumer Michaut et al. (2001a)
Conceptual Reconciling the unfamiliar Nurrenbern and
Robinson (1998)
Table 5 - Product Newness
Michaut et al. (2001a) proposed that the way in which the product newness is considered
influences the perceived value of that product and also its success on the market. They
suggest newness is a two-dimensional structure comprising ‘perceptual newness’ and
‘epistemic or conceptual newness’. Perceptual newness is described as “elements consumers

32
directly notice during product exposure” (Michaut et al., 2001a, p.2) making it easy for the
consumer to identify and be comfortable in their association with the product. Brewin (1989)
refers to this stimulation as an affective process that draws on prewired knowledge that is
non-conscious process and activated without intention or awareness. However, individuals
hold affective preferences, their likes and dislikes, these have a moderating effect especially
when processing old and new judgements (Zajonc, 1980).
In comparison epistemic newness are “elements that require more information processing and
reflection” (Michaut et al., 2001a, p.2) for products that require more thought, reflection and
activate cognitive stimulation. Hofstadter (1998) suggest this prompts an automatic trigger of
identification using internally held recall in the process. Bennett and Dewar (2004) propose
epistemic knowledge is accumulated through two stages: the knowledge required to create
knowledge that is new to you, and the knowledge required to decide whether an argument is
valid.
The expectation is that perceptual newness is a prerequisite for product success (Michaut et
al., 2001a), even though epistemic newness is key to holding a consumer’s interest/ intrigue,
it can only commence once the product is noticed. This recognition process can be extended
if there are numerous elements of epistemic newness to the point where consumers have
negative reactions to the product; this is supported by Rogers (1995) view, if the product is
too complex it can become a potential barrier to adoption by the consumer. Chapman (2005),
suggests that regardless of the level of complexity something must be altered if it is to be
noticed and advocates a policy of Just Noticeable Difference (JND) - small changes that are
mild jolts that change the flow of information and perception, but not enough to alienate the
consumer.
Other authors take a rather different approach to the notion of conceptual newness. Berlyne
(1966) argues that epistemic behaviour is motivated by conceptual conflict, this in turn
stimulates exploration i.e. curiosity and to achieve this it is necessary for products to have an
inadequacy of information. The stimulation involved can be diverse, such as novelty,
surprisingness, complexity, change or variety, all of which are collated variables as they all
have some collective impact. Berlyne (1966) suggests that these aspects of stimulation can
be instantaneous, it is not necessary that they are preceded by the receipt of partial
information; however the conceptual conflict must be reconciled. Moors et al. (2003) hold

33
that conceptual newness is an end-state, an outcome of new products. In the case of
automobiles consumers would need to comprehend what the new model has to offer; its
appearance as well as any technical innovations. Moors et al. (2003) argue that new products
and services can only be successful if consumers have a good understanding of the newness
(and benefits) of the new products and services, that is of the conceptual newness of the
product.
Nurrenbern and Robinson (1998) argue that the notion of conceptual newness is of a higher
order than perceptual and epistemic newness; they suggest that for conceptual newness you
need questions that require you to formulate an answer rather than simply to recall something
or to activate an algorithm. Nurrenbern and Robinson (1998) suggest such high order
questions provide the following: an understanding of the underlying idea; explaining the
unfamiliar; transferring knowledge to a new situation; adapting an explanation to a new
situation; identifying the underlying concept and visualising a system to reach a conclusion.
On this basis, although perceptual newness captures your initial attention, epistemic newness
is required to stimulate further interest and raise further questions about the product, with the
proviso that if a product is too complex, or raises too many questions (Rogers, 1995), then an
answer may not be found. The evidence suggests a number of reasons for differences in
consumer perceptions of product complexity.
2.3.2 ComplexityProduct complexity is moderated by the actual newness of the product (Gregan-Paxton and
John, 1997). Gatignon and Robertson (1991) suggest that consumer perceptions set the level
of how novel or innovative a product is, whereas Rogers and Shoemaker (1971) point out
that it does not matter if the idea or product is new, as measured by the lapse of time, if the
idea seems new to the individual, it is an innovation. The difficulty and importance is
capturing those perceptions (Kotabe and Swan, 1995).
Berlyne (1970) and Ziamou (1999) suggest the degree of newness is perceived differently by
producers and consumers. This is supported by Johannessen et al. (2001) who suggest that the
questions of “how new?” and “new to whom?” are closely linked and should be considered in
all new product development. From the manufacturer’s viewpoint complexity has both

34
internal and external elements (Lindemann et al., 2009). External elements comprise
competitor products and consumer diversity, both providing and demanding increasing levels
of innovation, whereas internal elements require the need for expertise and processing
capabilities, not only to develop innovative products, but to keep pace with what currently
exists and is demanded by the market.
Feeding these needs can be problematic, Chapman (2005) suggests more is less and questions
whether our experiences have developed with equal pace with the gadgets and gizmos that
are being produced, liking it to a Swiss Army knife that is crammed with functions at the
expense of usability. A report by Warman (2011) estimated that in 2010 there was a £52
billion gap in what consumers paid for and the features they actually use and 51% of
consumers expressed frustration in the use of at least one of their gadgets; the report suggests
that ease of use, rather than increased features, is technology’s new frontier. This appears to
have some merit, an article by Wilcox (2012), suggests that the reason why Apple, Google
and other companies post so many how-to videos online (small instructional video guides) is
to try and reduce the amount of product returns and exchanges, 57% of returns (in the USA)
are cited as being defective, whilst the real reason is they are too complex and the purchaser
does not understand how the device works.
One car manufacturer, Volvo, supports this view, an article by Tobin (2012a) reported that in
June 2012 the head of Volvo, Stefan Jacoby, admitted that their cars were too complex and
that 75% of their customers were not aware of the possibilities of their cars. In the same
article Tobin (2012a) suggested that less is more and reported a shift in customers buying
basic cars without extras, yet just a few weeks later the same author reported that consumers
would not forego some of the safety and comfort features they had become to expect (Tobin,
2012b). This presents some conflict as a lot of safety and comfort features are highly
innovative (Knapman, 2012) – it appears that consumers seem to want features they don’t
understand and ‘safety’ becomes an issue. For one manufacturer, Ford Motor Company, one
particular innovation became problematic. Ford introduced a ‘Torque Vectoring Control’
system (TVC) fitted to their Focus model but no one understood what it did or how it worked,
so a year later, Ford had to develop a communications strategy giving detailed description
and customer benefits to overcome customer resistance (Wood, 2012; English, 2013).

35
Yet there appears to be no slowdown in the development of highly complex new products in
the automotive industry. New collaborations with leading technology companies are
continually being formed. For example, Toyota are working with Microsoft to develop a
Telematics system that turns a car into an information terminal, not only for communications
and satellite navigation, but also for software updates to the engine management systems
(Wilcox, 2011). In the USA, Ford Motor Company are working with Google to develop a car
that will know where you are in the world, and at what time. This is linked to the recall of
previous circumstances to make predictions about what it is to be used for, such as at 7:30
AM on a Monday it would recall that you are almost certainly driving to work and would
check traffic congestion and plot a route accordingly. In time they expect the system to
predict driver behaviour and optimise the performance to suit driving styles and types of
journey (Pell, 2011). This may appear to be far-fetched, however Google have developed a
driverless car in the USA, where the states of Nevada and California have legislated to allow
such vehicles on their roads, and Mercedes is to introduce a system that will drive itself up to
a maximum speed of 25 mph in the new S- Series 2013 model, which they say is useful in
slow moving traffic congestion (Gillespie and Tobin, 2011).
How acceptable these advanced innovations will be to consumers’ remains to be seen.
Driverless cars and automobiles that predict driver behaviour may involve other aspects of
concern for consumers beyond complexity. There is evidence to suggest exposure and usage
with a product or innovation reduces complexity levels whilst creating familiarity with the
product.
2.3.3 Product FamiliarityMandler (1981, p5) suggests that it is a “pervasive human characteristic to prefer the known
to the unknown, the usual to the unusual, the familiar to the strange”. A number of authors
suggest that increased use of a product reduces complexity as they become more familiar and
comfortable with the product (Park and Lessig, 1981; Zaichkowsky, 1985a; Chapman, 2005;
Hutchinson and Eisenstein, 2008; Lakshmanan and Krishnan, 2011; Reynolds and Ruiz de
Maya, 2013). This may be the case with some high-frequency repeat purchases that are low
in value, with high-value infrequent purchases this argument does not hold completely. Usage
of the product will be relevant where some pre-experience exists, for example in the case of
cars, the ownership or use of the previous model. Park and Lessig (1981), suggest that the

36
highest level of familiarity is ownership, later research by Park et al. (1994) found that
memory recall was more accessible to consumers than knowledge accumulated from other
sources. Familiarity with a product can have positive as well as negative connotations,
Hutchinson and Eisenstein (2008), suggest that over-familiarity can disappoint through
habituation - the same old thing, particularly where a product is in decline; a case of
familiarity breeding contempt.
Others argue that modern consumers are short distance runners and that the deflowering gaze
of familiarity begins to grow as they outgrow and demystify their current product as they
begin to search for the next newer or shinier model - a faster car or a larger TV (Chapman,
2005). This is prevalent in industries where continuing evolution is the norm, such as the
automotive industry with the never-ending introduction of new models.
Nevertheless, familiarity of a product is an important variable in the initial exposure to a new
product (Laroche et al., 1996); even fleeting experiences have some value as consumers act
on those prior experiences which provide consumers with prior knowledge to mediate their
final judgement (Sujan, 1985). The way we act and respond to the world is largely
conditioned by prior experiences, some of these are subconscious experiences that establish
strong durable connections with users on both rational and emotional levels (Chapman,
2005); Johannessen and Olsen (2011) refer to this as tacit knowledge - the things we
instinctively know. That level of knowledge is dependent on the depth of exposure and
familiarity, whether that be casual use or ownership of the product, and is not limited to just
previous models but also similar alternatives (Kressmann et al., 2006). There are many ways
that knowledge can be acquired, Johnson and Russo (1984) suggests that no one study could
examine them all, however where most correlations for familiarity are sought between usage
and direct experience, they suggest the most overlooked source of familiarity is advertising,
which is arguably the most important communication for the introduction and exposure to
new models.
In terms of consumer choice, research by Barroso and Llobet (2012) found the awareness
process can be significantly sped up by advertising and is crucial in making consumers aware
of the existence and characteristics of new products, especially where there are a large
number of products in the market. They found that consumers were only aware of a limited
number of alternative products when they are in market, relying on past experience of

37
product usage and information spillovers of other products sold by the same firm, this can be
particularly powerful when vehicles that generate ‘buzz’, spur sales of all the other
automaker’s vehicles (Train and Winston, 2007). Research by Kreuzbauer and Malter (2007),
support the view of information spillover, particularly where brands share similar lines and
appearances as they come together under the same umbrella, Keller (2003) refers to this
connectivity as brand personality or heritage. This suggests that familiarity for most
consumers is of a very localised nature, in fact it has been suggested that the last purchase
experience is the best information for the next purchase and that some buyers only purchase
on that basis (Paredes, 2011). In contrast, Kreuzbauer and Malter (2007), suggest that the
familiarity of several prior car experiences formulates our concept of a car, but Morton et al.
(2011) point out that this cannot hold for first time buyers who have to rely on the experience
of others or product information sources.
Mantonakis et al. (2008) found that familiarity uses two types of information, implicit
knowledge formed from prior experience without any conscious awareness and explicit
knowledge formed from observed effects giving conscious awareness. Danneels and
Kleinschmidt (2001) suggest that more importance should be attached to products having a
familiarity fit with consumers - what they know and expect from a particular product. If this
is the case then the path to increasing awareness is to employ communication methods that
increase the explicit components of familiarity. Sometimes there is confusion between
familiarity and expertise.
2.3.4 ExpertiseHutchinson and Eisenstein (2008) suggest a positive correlation between familiarity and
expertise, but it is argued here that familiarity is built on product experience and so is
different to detailed expertise. Peter and Olson (2010) found that most consumers use
heuristics, i.e. a combination of processes when making decisions. Heuristics tend to be
simple and are applied when needed and adapted to a given situation.
Chi et al. (1982) suggest that experts categorise problems differently than novices, for
example physicists look at the deep structure (underlying principles); they look at things that
will solve the problem rather than novices who look at surface structure (features). Hence
they propose that is it not just the acquisition and memory recall of information that

38
differentiates a novice from an expert, it is the difference being the depth of knowledge and
how it is stored.
Experts also store information in chunks and during retrieval one chunk may activate another.
This provides them with the ability to recognize patterns in the task consideration on the basis
of past experience. A good example of this is in chess. Experts recognize perceptual chunks,
those typical and distinctive layouts and movements of pieces which they have acquired
through practice and study, and stored in long-term memory, these are recalled when
considering their next move (Connors et al., 2011). Research by Bettman and Sujan (1987)
found that consumers can develop a great deal of expertise within a particular product
category over time; this suggests novices can develop their levels of information through
familiarity.
Even with a high degree of familiarity there are limitations to technical knowledge of
complex products. Loginova (2010) suggests that complexity varies along a continuum rather
than a polarised novice/expert effect, earlier work Gregan-Paxton and John (1997) proposed
that the perception of product complexity varies considerably between novices and experts,
surmising that novices are likely to be more perceptual than experts who, with more in-depth
product knowledge, would probably be more epistemic in their evaluations of newness.
Whereas Alba and Hutchinson (1987) simplify consumer knowledge into two major
components, familiarity and expertise; whilst similar to the novice/expert categorisation they
propose five distinct aspects of expertise:
Aspects of Expertise Description
Simple repetition Reduces the cognitive effort required to perform the
task… leads to performance that is automatic
Cognitive structures Ability to differentiate becomes more refined as
familiarity increases
Ability to analyse information Improves as familiarity increases
Ability to elaborate on given
information
Improves as familiarity increases
Ability to remember product
information
Improves as familiarity increases
Table 6 - Aspects of Expertise – summarised from Alba and Hutchinson (1987)

39
Alba and Hutchinson (1987) suggest these aspects can be improved as product familiarity
increases - supporting the view by Loginova (2010) that familiarity/expertise is a continuum.
The degree of familiarity and/or expertise will raise or lower consumer views of what is new
in a new product. For example, Alba and Hutchinson (1987) suggest novices are likely to
view products non-analytically compared to experts, who actively seek more information
simply because they know it is likely to exist; novices rely on recall (familiarity) and fewer
details. In contrast Sujan (1985) argues that knowledgeable customers are less likely to be
extreme in their evaluations than novices, due to what they think they know, later research
supports this view. Wood and Lynch (2002) found that experts tended to punch above their
weight describing it as overconfidence – a feeling of knowing phenomenon, a prevalent bias
with people assuming they know more than they do; findings by Mehta et al. (2011) revealed
that sometimes experts had a hard time recalling product features and simply filled in missing
information, basically they took a guess.
Moreau et al. (2001) found that even experts with their entrenched knowledge require
supplementary information when faced with a discontinuous innovation. In addition, Johnson
and Russo (1984) found that experts rely on their knowledge to limit their searches for
information and their analysis of prior knowledge revealed an ‘inverted U’ effect where
information searches were more likely to be carried out by consumers who were moderately
familiar than those who were highly familiar with the product. There is a danger here that if
experts use what they think they know, rather than what they do know they will overlook a
lot of information, this can become problematic, as expert advice is known to sway consumer
demand (Simonsohn, 2011).
This is important as it demonstrates why the perception of the degree of product complexity
varies between novices and experts, and their understanding of new products. Peter and
Olson, (2010), expand on this; they suggest that during a decision-making process, only
experts and motivated consumers, with high interest in the product, seek out more detailed
information. Their evidence suggests that although information is available, it is not at a level
that consumers understand and this is something that needs to be resolved by marketers.

40
Yet this is not new, it has been a problem for some time. Johnson and Russo (1981) wrote
that simply providing information is ineffective, especially for technically complex products
and attributes. They suggest information relating to the importance and benefits of attributes
must be provided to help consumers make better decisions. Yet, at that time a study on search
behaviour for new automobiles, argued that the availability of information was so rich that
even unknowledgeable consumers could acquire enough information easily and that there
was no difference in the possession of product knowledge between more experienced and less
experienced consumers, the study concluded that manufacturers did not need to educate
customers, they only needed to supply specific product information (Punj and Staelin, 1983).
This may have had some validity back in 1983 but at that time complex developments were
rare. For example, it was 1985 before anti-lock braking systems (ABS) began to appear on
UK cars - even today there are a lot of people who still do not understand what it actually
does (Gibson, 2010). Current vehicles are highly complex and sophisticated, even with
greater access to modern day information cars are less understood by the general public than
they were in 1983.
More recently, Cowley and Mitchell (2005), proposed that experts remember functional
attributes compared to novices who remember functional benefits, but it would seem that an
understanding is required before any benefit can be established. Sometimes benefits can be
assumed; Hutchinson and Eisenstein (2008) found that whilst experts decide on the technical
aspects, novices simplify this - if it has a lot of technical aspects it must be better, regardless
of if those aspects are what they need. However, in the automotive sector research by
Wiedmann et al. (2011) found the main barrier to adoption for consumers with low levels of
technical knowledge, was lack of information. Innovation theory provides more insights into
how this information is diffused.
2.3.5 Innovation TheoryThe concept of innovation is associated with technical progress and creativity and innovation
theory states that everyone is creative (Kirton, 1994). Kirton (1994) suggests that as part of
the creative process, people respond to and/or seek out changes that the creative process
brings, some more than others, but the assumption is that change is a constant phenomenon.
For manufacturing it is fundamental to their viability that they continually produce new
innovative products, however Kirton (1994) states that adaption is more prevalent than

41
innovation, mainly because for manufacturing it means it involves less risk, but for a
consumer it usually means only a change in how it is used; Daniels and Henry (1998)
suggested that organisations tend to favour the adaptive approach.
If the philosophical arguments that people recognise forms are accepted, and when those
forms change they have to make choices, adapting may be the easier choice, providing the
adaption is still recognisable. How people recognise a change, an adaption, or an innovation,
is an important part of innovation theory, i.e. how innovation theory explores how
innovations are diffused, if this process is not undertaken correctly then often the innovation
can be overlooked (Rogers, 1995). Talke et al., (2009), suggest that new products have design
and/or technical newness and although each aspect is quite different, the focus of innovation
is centred on the technical aspect. Product innovativeness is not usually assessed from a
design perspective (Demiröz, 2007), but visual appearance is still seen as the key trigger in
product diffusion (Talke et al., 2009). A meta-analysis by Kock (2007) found that
innovativeness on its own could not be relied on for product success. An example of this in
the car industry was the launch of the new Volkswagen Passat in 2010. Although this model
was completely new and technologically advanced over the outgoing model, it was seen at
first glance, as being no different to the previous model, when in fact only the roof had been
carried over from the previous model (Conway, 2010)
From a producer’s point of view, Meyer and Roberts (1986) suggest that comparison of past
and present products, are measurable along two basic dimensions. The first is the newness of
technology in the product compared to technologies already developed by the firm; the
second is the newness of the market application for which the product has been developed.
Cooper et al. (2002) believe innovation is more complex that just a measure of a product’s
technical attributes. These authors differentiate among three types of innovations;
repositioning of existing products (minor improvements), new to the firm (but not to the
target consumer) and new-to-the-world (not seen before). All three classifications are based
on the view of the manufacturer and although Cooper et al. (2002) suggests an innovation is
more than just technical attributes their classification still suggests an innovation is about the
manufacturer’s technical capability.
Gobeli and Brown (1987) classified technology into four types of innovation, bringing
together the producer and consumer aspects, firstly incremental innovation (repositioning)

42
which incorporates only a small amount of new technology and only a few new benefits for
the consumer, secondly technical innovation (new to the firm) which embodies technology
that is new to the industry but is not perceived as providing many new benefits to the
consumer, thirdly application innovation (in effect this is new to consumer) which does not
utilise significant new technology, but requires changes in consumer usage behaviour
(implied newness) and finally radical innovation (new-to-the-world) is completely new
technology that has not been seen before and requires significant changes to existing
consumption patterns. Again, these classifications are mainly based on the technical
capability of the manufacturer.
There are similar views by other authors. Robertson’s (1971) view is that new products can
be classified along a continuum depending on how continuous or discontinuous their effects
are on established consumption patterns. A continuous innovation has the least disruption to
consumption patterns such as annual new model automobiles (incremental) compared with a
discontinuous innovation which involves completely new consumption patterns (radical) and
the creation of previously unknown products, such as the first personal computer. However,
new consumption patterns may not always be radical in terms of conceptualisation, Aristotle
philosophised that a house is still recognisable as a house regardless of what it is made from.
Similarly there have been several stages of music consumption such as vinyl records, tapes,
mp3 players etc., they were innovative, but not really disruptive as they were all still forms of
listening to music, only the interface had changed (McCormick et al., 2012). Urban et al.
(1996), Veryzer (1998) and Hoeffler (2003) add a further dimension – really-new-products, a
commercial discontinuous innovation, these are products that are perceived as being really
new regardless of whether or not they incorporate new technology such as the Sony Walkman
which utilised existing technology in a new way.
Hauser et al. (2006) highlight the need to identify and measure consumer innovativeness,
they see this as key in identifying those consumers who are more likely to adopt new
products. This approach will also allow companies to target their products more effectively.
Yet if it is difficult to measure product innovation, it is unlikely that a measure of consumer
innovativeness could be identified, in fact Blythe (1999) suggests it may be impossible to
determine what innovation is in a new product, in an objective way, and that what consumers
are really assessing is the product’s newness. However, Ozaki (2011) argues that consumer
perceptions of innovations are better predictors of adoption than using lifestyle profiles or

43
demographic data such as household income, education, age etc., although some
measurement is needed to identify an optimum level of these perceptions.
2.3.6 Optimum RangeThere appears to be an optimum range on the continuum of newness that consumers will
understand. At the lower end would be minor incremental innovations prompting some
interest, compared to the higher end radical innovations which create intense interest.
Research by Michaut (2004b) found that new products that fall outside these optimum limits
were likely to be rejected because they were ‘not new enough’ or ‘too new’, the more
complex products meeting initial resistance when they are unable to reconcile them with
known or familiar products. Early work by Wundt in 1874 (Berlyne, 1960) found that while
stimulation was pleasant at medium intensities, it became unpleasant at higher intensities
resulting in a lower evaluation of a product and proposed that optimum stimulation levels
should be sought. Schoormans and Robben (1997) support this view by proposing moderate
changes are the optimal level for maintaining interest and attention, even when the evaluation
process begins to decline. The evidence suggests an optimum level of newness can be found
through a process of categorisation.
2.3.7 Categorisation TheoryThere is a general acceptance that consumers place products into boxes (Meyers-Levy and
Tybout, 1989), perhaps by features and benefits - what they are and what they do. Sujan
(1985) suggest that experience, prior knowledge, product use, ownership and familiarity are
used to classify subjects on a single meaning. Although these may be valid, categorisation
theory suggests that consumers relate physical issues to perceptual experiences, a two part
combination (Medin and Barsalou, 1990). Categorical perception is defined as the use of
sensory information in the identification process, such as noises or colours. This is combined
with generic knowledge, the stored memories concerned with representation of physical
things as well as experiences, such as what a car is, or going out to restaurants (Medin and
Barsalou, 1990). The information from sensory perception and generic knowledge are then
analysed into component parts or attributes and share similarities such as colour and shape,
for example a Robin and a Canary, although different in colour would still be identified as a
bird (Techman and Evans, 1999). This supports Aristotle’s philosophy that a thing is
whatever it is by virtue of its form (Magee, 2010).

44
Some products are categorised by how they make us feel or by things they remind us of, these
similarities can be pooled into emotional characteristics. For example, it is commonly said
that the arrangement of the cars headlamps and radiator grill can portray a happy or sad face,
or a house can be described as being friendly or welcoming because of its ambience
(Chapman, 2005). The outcome of categorisation depends on how well it is defined.
Sometime this is not possible and results in fuzzy categories; particularly strong perceptual
deviations in new products can affect product categorisation and become unacceptable
(Schoormans and Robben, 1997). Medin and Barsalou, (1990), suggest this is because
categories are not formed on the basis of rules but on similarity relationships, this is where
physical attributes are related by resemblance to other attributes, for example wings and
beaks are more likely to be related to flying than swimming. However, how quickly these
assessments are made depends on the complexity of the categorisation process (Luhmann, et
al., 2006) and may still result in fuzzy or undefined categories. Clearly there is an intersection
of categorisation and innovation theory, particularly when choices have to be made and these
intersections should be considered when developing new products.
2.3.8 Product development theoryKotler et al. (2001), state that a product goes through a product lifecycle of introduction,
growth, maturity and decline. As a result there is a constant need to introduce new products to
replace the income and profit that will no longer be generated by current products. Product
development theory is concerned with the complete process of bringing a new product to
market; Kotler et al. (2001) suggest a nine step process as follows:`
New product strategy
Idea generation
Idea screening
Concept development and testing
Marketing strategy
Business analysis
Product development
Test marketing
Commercialization

45
Within this framework there are a number of hurdles that manufacturers will have to
overcome depending on their resources, not only in finance, but also in expertise and
capability, not just within the firm but from outside resources as well. This is also dependent
on the firms view to new product development, which can be an ongoing proactive process to
take advantage of new market opportunities, or a reactive process where nothing is done until
a competitor introduces a new idea that they must follow. Ozaki (2011) suggests that
whatever a firms resources are, they must adopt a sustainable innovation policy if they are to
continue to prosper, this means that sometimes they will lead in the market and other times
they will follow.
A proposal by Rothaermel and Deeds (2004) suggests that exploratory and exploitation
alliances on product development have significant benefits. In the automotive industry some
manufacturers have formed alliances with other manufacturers to collaborate on new product
development. Some alliances are exploratory in nature to share development costs; others are
sharing of technology as well as manufacturing capability (Agrawal et al., 2013). Some, but
not all of these exploitation alliances are successful, for example when Ford Motor Company
took over Jaguar in 1989, they shared the Ford Mondeo chassis with the Jaguar X-type
introduced in 2001. Mondeo owners viewed this as a positive, prestigious development,
whereas the Jaguar owners saw this is a very negative step backwards. In reality the use of
the Mondeo chassis had a major improvement on the quality of the Jaguar (Morley, 2006).
The first step to take in new product development is for the manufacturer to identify
consumer needs and usage that can then be turned into opportunities (Urban and Hauser,
2004; Vercauteren, 2005). This enables manufacturers to identify existing market gaps that
can be turned into product opportunities, providing the cost to develop them are feasible so
that the products are not only successful but profitable (Loch and Kavadias, 2008).
In the main, most product newness literature views the product from the perspective of the
technical resources and manufacturing capability necessary to produce the product.
Consideration of the consumer’s perspective on new products is not given much attention,
Moultrie and Fraser (2004), found there was insufficient attention given to the needs of
consumers, mainly because product development staff had very little training in identifying
consumer needs despite it having significant impact on new product performance (Henard

46
and Szymanski, 2001). How product development theory is applied in the automotive
industry and how new product development (NPD) is managed, is discussed in the following
section.
2.4 NEW PRODUCT DEVELOPMENT IN THE AUTOMOTIVE INDUSTRYHaving considered newness from a consumer’s perspective it is appropriate to look at
academic studies related to how products are evaluated and specifically developed by
automotive manufacturers. In the case of the motor industry most manufacturers introduce
new models annually with only a few minor changes, (Wiseman, 1971). Indeed many
manufacturers introduce similar products having changed only one attribute of the product
(Meyers-Levy and Tybout, 1989). Nearly eighty percent of new Fast Moving Consumer
Goods (FMCG) reviewed in a report by Ernst and Young in 1999 (in Morris et al., 2003) are
either me-too (copycat or similar) products or line extensions (to existing brands).
In 1963, style changes in the automotive industry were seen as an important market weapon
which had to be a continual process, as any changes only lasted until others imitated it
(Menge, 1962). By 1971, NPD in the automotive sector was focused on automotive styling
(Sherman and Hoffer, 1971), as this focus continued and styling cycles lengthened, car sales
declined (Hoffer and Reilly, 1984) reaching a point where cars produced by the volume
automotive manufacturers were only differentiated by minor technical improvements and
minimal styling differences (Lamming, 1993). In an attempt to create an ongoing interest
incremental cosmetic changes are made on a quarterly basis, these are known as “product
freshenings” which are intended to keep the product alive as opposed to the impact of a new
model (Wright, 2004; Wright, 2005); discussions with the Advanced Product Group (APG) at
Ford Motor Company in 2012 revealed that this is still current practice, even annual models
being limited to minor exterior styling changes, mostly because of development cost
constraints (this is discussed further in Section 3.3.3, Meetings with the Ford of Britain
Advanced Product Group).
Alba and Hutchinson (1987) argue that when new brands are formed from existing attributes
of a product class they will easily be identified as a member of that class, otherwise it would
be difficult to identify or grade the product (schema congruity/incongruity.) By moving away
from the comparison of existing attributes, especially into another group, consumers look for

47
‘nearest-neighbour’ models, a shift from shared-within attributes to shared-between attributes
(Meyers-Levy and Tybout, 1989, Mau et al., 2008). For example, some company car drivers
in the UK downsize their grade of car to benefit from lower company car taxation, in doing
so they look for similar attributes in the smaller car that they enjoyed in the larger model.
The development of new products can also involve new innovations that change how
consumers interface with or use the innovation. If consumers do not know what a product
does or how a product is used, the uncertainty results in schema incongruity and creates
potential barriers to adoption (Rogers, 1995). Research by Ziamou (2002), revealed that
providing a new interface is introduced with a pre-existing functionality, the consumers are
likely to perceive less uncertainty than if it was introduced with a new functionality;
familiarity reassures the consumer that the new interface will perform as promised and
provide the particular functionality that they expect from the product. This indicates that new
innovations are more readily accepted if they can be related to familiar/existing products
rather than radical new-to-the-world innovations. To some extent this is supported by
Brandes and Brehmer (2004) who suggested that future innovations in the European car
industry will take place stepwise rather than in a revolutionary manner, mainly due to the
changes in supply chain management (SCM) with the outsourcing of components to reduce
costs and capital employed; inevitably outsourced components are taken from existing
components that are available and shared across the industry resulting in any advantage in
new developments being short lived (Brocard and Donada, 2002; Brockman and Morgan,
2003).
Part of the SCM strategy for automotive manufacturers, is to share common components
across different car model platforms to the extent that they are collaborating on future designs
and shared components. This is a world away from when Henry Ford was supposed to have
offered customers ‘any colour you want - so long as it’s black’, to where it is now common
practice for manufacturers to share chassis and engine components, even production lines are
now producing similar models for a range of manufacturers with only minor modifications
but with different brand names (Simpson et al., 2006). In fact the practice of developing new
products is based on manufacturing processes and capability (Revelle et al., 1998) – an
Original Equipment Manufacturer (OEM)’s core and practical competences (Whittington,
1996), these take priority over all other requirements such as user needs and wants, with very

48
little focus on consumer issues or involvement even during design reviews (Moultrie and
Fraser, 2004).
Brandes and Brehmer (2004) suggest that the route from transforming ideas into good
currency (profitable return), in these type of collaborative circumstances, is a long one and
found it more common for manufacturers to focus on short-term economic goals and risk
avoidance. If these arguments are accepted then it seems less likely that radical new-to-the-
world innovations will be introduced in the automotive industry.
Ofek and Sarvary (2003) view was that innovation cycles are determined by the success of a
manufacturer’s last innovation. There is less incentive to shorten the time until the next
innovation is introduced if they continue to enjoy the fruits of their last innovation.
Consequently the manufacturer may invest less on research and development than the
competition and focuses more on advertising to take as much advantage as possible of the
strong demand for its current product.
Sometimes manufacturers are able to extend the innovation cycles particularly when new
applications are found that can utilise existing technology to continue the growth and size of
market; greater new product advantage corresponding to higher new product performance
(Nakata et al., 2006). A good example of this can be found in the automotive industry,
Micro–Electro-Mechanical-Systems (MEMS) is finding increasing use in cars – e.g. Torque
Vectoring Control. The market for MEMS was $1.7 billion in USA in 2010 with a growth
forecast of 10% per annum from 2009 – 2014 (Marek, 2011).
Research by Booz et al. (1982) identified that new-to-the-world products accounted for sixty
percent of products that were the most successful, yet manufacturers were reluctant to
introduce these types of products because of their variability of return. Their findings
revealed that success of new product performance was measured by profit contribution,
return on investment and sales volume. Inevitably the only advances in development resulted
in additions or improvements to existing product lines and cost reduction strategies. Yet
having a technologically superior product is cited as the most important factor for the
introduction of successful new products (Kaiser, 1974; Booz et al., 1982; Korenok et al.,
2010). Howell (2001) argues that most new products were line extensions, but that innovation
had not died, what seems new may in fact be something old, but with a new twist.

49
By 2004, Burrus (2004), suggests that line extensions or face-lifts had come to dominate the
NPD landscape with as much a 75% of all new product launches being line extensions to
existing brands, Chapman (2005), suggests this is mostly due to corporations who only make
changes when they have to, or as Korenok et al. (2010) found when they were forced to keep
up with competing brands, this is despite that new products are key to increasing long-term
financial performance (Pauwels et al., 2004).
Kirton (1994) suggests manufacturers may prefer an adaptive approach if they are content in
doing things better as opposed to the innovative approach to doing things differently,
particularly where they need to resolve a short-term problem or need to develop a number of
elements that are required for a large-scale change. This was the case with the Swedish
automotive manufacturer Volvo, consumers bought them because of their safety and
solidness, but even they had to change their tried and tested design in 1998, from their
characteristic boxy design, to a more sleek modern design which retained the safety integrity
of the vehicle, a process of change which they called ‘Revolvolution’ (Keinonen and Takala,
2006). Others have not been so fortunate, in late 2010 the death of an icon in America was
announced (Williams, 2010a). General Motors decided to close down manufacturing of the
Pontiac brand, one of the original so-called ‘muscle cars’, consumers simply moved away to
other brands and Pontiac failed to follow. Although not sold in the UK, the brand was fairly
well-known due to various TV and film appearances, but it shows how iconic brands can
become obsolete if they fail to move with the times.
Backman et al. (2007) stated that things need to change and that the fuzzy front-end design of
new product development should always strive to have new concepts that will not only be a
testimony to their expertise, but also attractive and available to consumers. There is a need to
build excitement into new cars, but it is hard to design a mass car; manufacturers don’t want
to offend consumers, so they don’t take chances on design (Halliday, 2005). There is some
evidence that this is starting to change, in the past automotive manufacturers have displayed
new concept vehicles at motor shows to give consumers a long-range vision of the direction
of their products, most of these never left the drawing board, whereas they are now
displaying cars that are not so far-fetched which are making it into production and the market
place more and more (Srinivasan et al., 2012).

50
2.5 MARKET SEGMENTATION AND PRACTIONERSThis section looks at the diffusion of new products and the tools used by automotive
manufacturers and their associated marketing companies in targeting and communicating new
products and new product innovations. The data collection, segmentation and classifications
are questioned as to their rationale and effectiveness of their consumer data, as well as the
usefulness of mass marketing.
2.5.1 Market SegmentationConsumer needs can no longer be met by a mass marketing approach, their needs are more
diverse and demanding in their product requirements (Dibb, 1998). Market segmentation is a
process that identifies consumer groups which share similar needs, characteristics and
behaviours that may require differing products or marketing mixes to other groups of
consumers (Kotler, 1991; Smith, 2009). The general rule is that the closer the needs match
up, the smaller the segment, and these smaller segments often attract premium prices because
customers are prepared to pay for products that are near to, or exactly meet their needs
(Goyat, 2011). There are concerns that some businesses believe they are following a market
segmentation approach, but are not carrying it out correctly, and those who do follow the
process correctly are finding results that cannot be implemented; this is particularly prevalent
where businesses view segmentation as a tactical rather than a strategic marketing tool and
become entrenched in the how, rather than the why (Dibb, 1998). Vercauteren, (2005) found
that it is not uncommon to find marketing campaigns are carried out without any
consideration as to who may be the users of the product.
Segmentation does not imply success, but it is the first step in identifying the target market it
is an absolute prerequisite to an effective marketing campaign (Dibb and Simkin, 1991).
Common types of market segmentation include: geographic, demographic, psychographic
and behavioural segmentation (Kotler and Keller, 2006; Malhotra and Birks, 2007;
Tkaczynski and Rundle-Thiele, 2011). In addition there are many practitioners with
segmented database products based on lifestages and lifestyles (Alpert and Gatty, 1969), most
are discussed in the Practitioner section, but even amongst these products there is a
disagreement about how these variables are defined, each having their own proprietary
categorisation (Du and Kamakura, 2006). Despite these differences these approaches
continue in popularity because of convenience, especially when they appear to provide an

51
off-the-peg solution for their marketing requirements and when there is a lack of any
alternative (Dibb, 1998).
Each of these segments may require different approaches depending on the product, however
the problem is that most companies know who buy their products and where they are located,
but not the reason why (Goyat, 2011). This is because very little information is captured
beyond demographic and geographic data and when products are matched to consumer
characteristics, this profiling is usually carried out in isolation as an ad hoc exercise and as a
result, they may have the reason why people buy, but still not know where they are located.
More sophisticated segmentation is required which combine other variables alongside
demographics to have more predictive power (Wells et al., 2010), yet this is not new, Haley
(1968) stated that the future of segmentation had to move from relying on descriptive factors
– the who, to causal factors – the why, but as will be seen, in the automotive sector there has
been little or no movement in this direction.
2.5.2 Introduction to the Practitioners Approach to Market SegmentationThe following sections (2.5.3 to 2.5.10) provide more insight into this problem by focusing
on the way in which real companies and government address the issue. This section draws on
documents and literature obtained from manufacturers and associated organisations through
direct requests and meetings to establish the methods and rationale that they currently use in
relation to new products and consumer data. Although the following information is usually
associated with methods and exploratory chapters, the literature relating to practitioners is
better placed here as it does form part of the foundation of the thesis.
2.5.3 Ford Motor Company LimitedSeveral meetings and conference calls were held with Ford personnel and their marketing
support agency, Wunderman. The meetings and calls were arranged through the Ford sponsor
of this study, the details on the need for a sponsor and how this was organised is provided in
Section 5.1 (introduction to the Methods chapter).
The following information was discussed/exchanged by telephone and e-mail with Branislav
Bucan, Brand and Product Insights Manager - Small cars, Ford Motor Company – Europe,

52
during November/December 2010. The discussions covered the segmentation they use and
rationale in connection with new product development.
Since 2000, under a new programme named GPS1, Ford have used attitudinal segmentation
at the onset of any new product development, this was developed by Global Consumer
Insights (GCI), an internal department. Responses from consumer surveys to personal attitude
statements are plotted into eight semi-quadrant categories using multidimensional scaling to
provide an attitudinal map (Lilley, 2004), an example follows:
Figure 2 – Source: Permission given by Branislav Bucan, Brand and Product Insights Manager, Ford MotorCompany – Europe – details supplied via email
These are then translated into lifestages (characteristics) which are then segmented into
attitudinal typologies through clustering techniques. Clustering is a common method for

53
identifying groups of this nature (Ogden and Nicholas, 2011). This comprised 9 groups with
‘hot buttons’ that characterise each segment:
Figure 3 – Source: Permission given by Branislav Bucan, Brand and Product Insights Manager, Ford MotorCompany – Europe – details supplied via email
Details of the codes used in the Consumer Attitudes Map are as follows:
FS Frustrated Strivers
ASI Active Self-Indulgents
F Funseekers
VA Visible Achievers
WBS Well-balanced Sociables
SP Social Pragmatists

54
CT Contented Traditionalists
CC Comfortable Conformists
QC Quiet Carefuls
Characterisations for each segment were also supplied but because of their commercial
nature/value they are withheld in this report. There is some segmentation overlap, however it
is stated that it does provide a 70% chance of identifying the correct typology.
The typologies are then overlaid with the brand positioning by manufacturer, model lines or
consumer lifestage in each country providing a ‘brand compass’ based on consumer attitudes
that identifies own product as well as competitor positioning.
Product development is initiated through a ‘Key Cost’ meeting which utilises a 6 box matrix,
one of which is ‘Why buys?’ They also use a customer base to identify the positioning of
new products i.e. Is it a vehicle for today, or for the future. The research is carried out in the
‘Big Five Markets’ ; UK, Spain, France, Italy and Germany, the UK is usually the lead
market or in the top 3 in most cases however, it depends on the product, for example Italy
would be the lead market for small cars as it is the biggest market for that size of car.
Currently they usually research 3 markets (due to cost-savings) targeting 200 quantitative
research respondents from each country (total 600) (questionnaire based), plus 6 to 10 in
depth qualitative interviews (usually home visits) from 6 to 8 groups in their attitudinal
segments (between 36 and 80 in total). The database of respondents that are used in the
research are established and maintained through a network of research/marketing agencies in
each country. They have never asked their groups specifically about newness in general
terms, they are usually asked to comment on a specific product or idea. The result is a
number of consumer profiles; the whole process is known as a ‘consumerscape,’ (Lilley,
2004).
2.5.4 Wunderman LtdWunderman are part of the Young and Rubicam Group (Young and Rubicam Inc, 2002), they
are reported first because of their direct relationship and relevance to Ford Motor Company.

55
During January 2012 a number of discussions took place with Orlando Machado, Head of
Analytics - Knowledge & Business Solutions – Wunderman Ltd, London. Wunderman are a
major supplier to Ford for direct mail communications, solutions and campaigns, they also
maintain and update consumer databases with consumer responses and requests for
product/service information. The discussions covered the segmentation they use and rationale
in connection with the development of marketing campaigns.
There are similarities between Ford and Wunderman in their models as well as terminology,
which should be no surprise considering how close their ties are with marketing campaigns.
The following example illustrates their use of lifestages and social profiles in assessing the
largest revenue segments for a ‘C’ segment car, in this case a Ford Focus:
C Segment Retail Market by Ford Lifestage
For full details on the standard motor industry classifications, and typical examples of the
models in each segment, i.e. ‘C’ segment, please refer to Appendix 1.
4% 5% 7%3%
21%
48%
13%
0%
5%
10%
15%
20%
25%
30%
35%
40%
45%
50%
SingleWomen
Under 45
Single MenUnder 45
ChildlessCouplesunder 45
Full NestersUnder 35
Full Nesters35+
EmptyNestersOver 45
Wifes Car,Multi Car
HH
Figure 4 - Source: Permission given by Orlando Machado, Head of Analytics - Knowledge & Business Solutions– Wunderman Ltd, London - supplied via email

56
In addition Wunderman use an analysis tool for identifying consumers that have the highest
propensity to purchase for a given segment – Social Values Insight – a conceptual framework
based on long lasting social values which underpin medium duration lifestyle typologies
which in turn underpin brief and transient product typologies (Wunderman Knabs, 2003;
Mordin, 2004). The resulting categorisation - ‘socialvaluesTM’, developed by an inhouse
company ‘thevaluescompany’ (thevaluescompany, 2004) propose seven lifestyle strategies-
self-explorer; experimentist; achiever; belonger; social resister; survivor and aimless. These
categorisations are then matched to the Lifestyle Universe Database owned and developed by
Claritas (Acxiom, 2004), which contains up to 380 key lifestyle, demographic and purchasing
characteristics for all UK households, approximately 44 million UK individuals.
There are similarities between Ford and Wunderman in their consumer typologies as well as
terminology, which should be no surprise considering how close their ties are with marketing
campaigns. Despite these similarities, for marketing campaigns Wunderman use the cross-
matched socialvaluesTM/Lifestyle Universe data source, as it is provides established access to
external prospects whereas the Ford segmentation is an internal concept without links to
names and addresses. To identify which SocialValues match the Ford profile, they have to
overlay the Ford Consumerscape typology using relational perspectives, as represented by the
following map:

57
Figure 5 – Source: Permission given by Orlando Machado, Head of Analytics - Knowledge & Business Solutions –Wunderman Ltd, London - supplied via email
Clearly something is lost in this hybrid of typologies, and only some, not all, of the data on
the Wunderman database were fully categorised into the SocialValues typologies.
Further discussions during January and February 2012 took place with a number of other
segmentation and marketing companies who have their own commercial categorisations, as
follows:

58
2.5.5 Experian LtdExperian Ltd is one of the largest commercial database companies in the UK. Their MOSAIC
classification is based on geodemographic classifications and behavioural lifestyles.
MOSAIC utilises the data from the National Census in the UK which is produced every ten
years, the last being March 2011. This is updated annually to allocate changes in postcode
demographics and is applied to existing categories (Experian Ltd, 2003). The MOSAIC
system has been developed in over twenty countries worldwide based on geodemographic
classifications and behavioural lifestyles (Schmidt and Pioch, 1996), the variables used in the
creation of their typology include:
• race and ethnic origin
• age
• family status
• non-family household types, including college
• dormitories and military quarters
• travel to work
• education
• employment by industry and occupation
• income
• forms of income
• housing tenure
• housing type
• vehicle ownership
• household size
• age of dwelling and tenure
These variables are then segmented and presented as twelve groups:
• A Affluent Suburbia
• B Upscale City Singles
• C Second City Leaders
• D Blue Collar Winners
• E Fortunate Retirees

59
• F Metro Market Fringes
• G Remote Working Towns
• H Lower Income Seniors
• I Rural Towns & Farms
• J Other City Centres
• K Major Market Cores
• L Anomalous Lifestyles
The limitations with a database of this type are the reliance on the accuracy of self-
administered forms and the time span between Census dates (Olson and Muderrisoglu, 1979).
For example Experian Ltd report that in the 1991 UK Census, under the religion and ethnicity
section, 390,000 people claimed to be Jedi knights!
In 2005 Experian (2005) developed a database specifically for the automotive market –
Mosaic Automotive – which uses their existing geodemographic classifications and
behavioural lifestyles. This is then matched to the 35 Million vehicle owner records held on
the Driver and Vehicle Licensing Authority (DVLA) national car database, this process is
carried out by the DVLA and the data returned to Experian is anonymous as it excludes
names and addresses, only post code areas are supplied. The enables Experian to establish
location patterns of vehicles to end user profiles based on the MOSAIC classifications.
Because of the anonymity of the data that is returned from the DVLA, names and addresses
would still be needed to carry out postal campaigns, but having identified and profiled the
post code areas it is argued that if marketing efforts are carried out in these areas there is an
increased likelihood of success. An example of MOSAIC in action is a survey carried out for
the Mayor of London’s Office in 2009 to identify consumer profiles and post code areas for
users of electric vehicles as the first step to an infrastructure strategy (Greater London
Authority, 2009). Whilst MOSAIC has the potential for more defined areas for product
marketing; the drawback is the inevitable obsoletion of time sensitive census data, however it
does have advantages in being more specialised rather than generalised in relation to the
automotive industry.

60
2.5.6 MORI ResearchThe most common demographic segmentation was developed by MORI research, known as
the Social Grade. This is based on the National Readership Survey (NRS) which was
originally formed to identify segments for daily newspaper media, and has been in use since
the 1960,s (Ipsos MediaCT, 2009). The segmentation is divided into six groups: A, B, C1,
C2, D and E, as below:
Social Grade of Chief Income EarnerSocial Grade Description %
PopulationA High managerial, administrative or professional 4B Intermediate managerial, administrative or professional 23C1 Supervisory, clerical and junior managerial, administrative
or professional29
C2 Skilled manual workers 21D Semi and unskilled manual workers 15E State pensioners, casual or lowest grade workers,
unemployed with state benefits only8
Figure 6 – Source: Redrawn from NRS (2000)
More detailed explanations on categorisation were supplied via email with their Research
Director :
‘In our studies we normally ask for the occupation of the chief income earner. You then need
to collate information on their:
Position/rank/grade
Industry/type of company
Qualifications/degree/apprenticeship
Number of staff responsible for
then from this information we code them into the appropriate social grade category’. Again
these are high level groupings and although they argue in their literature that they translate
well down to regional levels, they were specifically developed for newspaper media
targeting, because of this they are unlikely to be suitable for use with other products.

61
2.5.7 Euro RSCGThe following information was discussed/exchanged during three meetings and numerous
telephone and e-mail communications with a number of senior staff at two branches of Euro
RSCG – Euro RSCG Worldwide and Euro RSCG Skybridge, in particular Ms Robin Lauffer,
Head of Strategy and Consumer Insights at Euro RSCG Worldwide – London. Euro RSCG
Skybridge are a major supplier to Ford of Europe for training consultancy and reward and
recognition incentive programmes for dealership staff, they also supply marketing materials
and sales training for new product launches.
The discussions and meeting were the result of the literature research which revealed several
references to ‘Prosumerism’ and the use of ‘Prosumer’ in research carried out by Euro
RSCG. The word prosumer has been coined by many, McFedries (2002) suggesting the most
popular definitions:
1. A consumer who is an amateur in a particular field, but who is knowledgeable enough to
require equipment that has some professional features ("professional" + "consumer").
2. A person who helps to design or customize the products they purchase ("producer" +
"consumer").
The second sense of the term -- the producer consumer -- was invented by Toffler (1980).
Euro RSCG confirmed that this is the definition they investigated initially before defining
their own definition: A proactive, empowered consumer. They define a prosumer as having
the following characteristics (O'Reilly, 2001):
Get a rush from discovering new things
Transport trends “Human media”
Pursue timeless value
Seek out challenges and experiences
Recognise their own value as consumers and expect brand partners to do likewise
Are marketing savvy and plugged into multimedia sources
Demand top notch customer service and unlimited access to information
More plugged in, internet integrated into their lives
More likely to pay for premium services

62
Love to travel
Brand conscious / Brand Partners / Brand advocates
Their trust has to be earned
Euro RSCG summarise the prosumer as being proactive in seeking out information and
opinions and sharing their views and experiences with others. They suggest that prosumers
span Rogers and Shoemaker (1971) spectrum of early adopters and early majority profiles
and have a heavy influence when relating new products to other consumers (Lauffer, 2004).
Euro RSCG have established a database of approximately 2,000 consumers who are prepared
to participate on research in each of the following countries: UK, France, Germany, India,
China and USA, it is intended to add further countries. Prosumers are identified by an
algorithm of qualitative questions that are included in every survey; details of the algorithm
were supplied under a confidentiality clause for this research and due to the commercial value
cannot be disclosed in this report. Findings from their research suggested that prosumers
represent 20 – 30% of people who make and break markets, in every category and in every
geography by being early adaptors and early majority of new products whilst actively sharing
their views and spreading brand messages (Harris, 2004).
Although the classification is based on values and lifestyles, one aspect of the prosumer
mindset of particular relevance to this study, is that they love “new”.
2.5.8 Demographic and Geodemographic ClassificationsSome classification systems have been developed over a number of years and are in common
use throughout industry including automotive marketing. In the UK the most common
systems in use are demographic classifications:

63
National Readership Survey (NRS) produced by NRS UK Ltd and based on social grade
definitions:
socialgrade social status occupation
A upper middle class higher managerial, administrative orprofessional
B middle class intermediate managerial, administrativeor professional
C1 lower middle classsupervisory or clerical, juniormanagerial, administrative orprofessional
C2 skilled working class skilled manual workers
D working class semi and unskilled manual workers
E those at lowest level ofsubsistence
state pensioners or widows (no otherearner), casual or lowest grade workers
Figure 7 - Source: Redrawn from Businessballs (2003)
According to Blythe (1997) the use of social grade definitions, defined by occupations, is an
ambiguous concept in modern times because the opportunities to progress are much greater
for the old lower classes and the shift in labour patterns from manufacturing to service
industries involving more technological and administrative functions rather than physical
labour. If this is valid then the development by NRS of their NRS Super Profiles
classification may be more appropriate –
A - affluent achievers
B - thriving greys
C - settled suburbans
D - nest builders
E - urban ventures

64
F - country life
G - senior citizens
H - producers
I - hard-pressed families
J - have-nots
K - unclassifiableFigure 8 - Source: Redrawn from Businessballs (2003)
In comparison the Insight Value Group Ltd (2004) developed its own scale, which draws
heavily from Maslow’s Hierarchy of Needs, the Social Value Groups:
social valuegroup characteristics
self actualisersfocused on people and relationships, individualistic andcreative, enthusiastically exploring change, 'in a framework ofnon-prescriptive consideration for others'
innovators self-confident risk-takers, seeking new and different things,setting their own targets to achieve
esteem seekers acquisitive and materialistic, aspiring to what they see aresymbols of success, including things and experiences
striversattaching importance to image and status, as a means ofenabling acceptance by their peer group, at the same timeholding onto traditional values
contentedconformers
wanting to be 'normal', so follow the herd, accepting of theircircumstances, they are contented and comfortable in thesecurity of their own making
traditionalistsaverse to risk, guided by traditional behaviours and values,quiet and reserved, hanging back and blending in with thecrowd
disconnected detached and resentful, embittered and apathetic, tending tolive in the 'ever-present now'
Figure 9 - Source: Redrawn from Businessballs (2003)

65
Lastly, a more detailed system has been developed over many years by CACI Ltd and utilises
geographic and demographics into a geodemographic classification know as ACORN (CACI
Ltd, 2009), which stands for A Classification of Residential Neighbourhoods. The listings
have been widened over time into specialised segments and they are extensive, the original
classification comprised seventeen consumer groups and fifty four neighbourhood types.
A small section is reproduced as follows:
acorn 'types' acorn 'groups'
A - thriving
1.1 wealthy suburbs1.2 villages with wealthy commuters1.3 mature affluent home-owning areas1.4 affluent suburbs, older families1.5 mature well off suburbs2.6 agricultural villages, home-basedworkers2.7 holiday retreats, older people, home-based workers2.8 home owning areas, well-off olderresidents3.9 private flats, elderly people
1 - wealthy achievers, suburban areas
2 - affluent greys, rural communities
3 - prosperous pensioners, retirementareas
Figure 10 - Source: Redrawn from Businessballs (2003)
Halliburton and Hünerberg (1993) argue that it is no longer possible to classify people into
neat and stable segments, the geography that has usually ruled national marketing
programmes needs to re-think its basis for segmentation and look at customer groups with
similar needs; a bottom-up approach of identifying these customers is needed rather than the
top-down approach of grouping unknown individuals by demographic, lifestyle or industry
criterion.
2.5.9 Emotional GeographicsSheller (2003) also argues against these simplified patterns of identification stating that
consumers never simply choose a car on rational economic choices, it is a combination of
aesthetic, emotional and sensory responses to driving as well as kinship, sociability,

66
habitation and work that influences decisions, an emotional sociology which Sheller terms
‘emotional geography’.
There has been evidence in the past where emotional aspects have been utilised in automotive
adverts, Sheller (2003) provides some examples as follows:
Manufacturer Description of Advert
Audi Audi banks on its ‘German design’ reputation in England through the
‘Vorsprung durch Technik’ campaign
Seat Seat plays on its Hispanic ‘auto-emocione’
Renault Renault uses a French international footballer who plays for an English
team to talk about the Clio’s ‘va-va-voom’ and ‘je ne sais quoi’
Nissan Nissan goes further and tries to transcend national motorscapes in its ‘Do
you speak Micra?’ advertisements, set in a futuristic urban utopia where the
brand has evolved its very own language
Table 7 - Emotional Aspects in Automotive Advertising
Sheller (2003) does not infer there is any simple correlation of style with national identity but
it is suggested that producing such identities does establish emotional geographies of car
cultures. There is some agreement with this kind of emotional objective, Chapman’s (2005)
view is that consumers are becoming increasingly attached to emotionally durable products
which purport to be in touch with their feelings.
2.5.10 Government Social ClassificationsAlthough the last few sections were concerned with practitioners, attention must be drawn to
the vast amount of information that is collated by the government which is used extensively
to explain variations in the structure of socio economic positions, patterns of social behaviour
and other social phenomena. These are known as Socio Economic Classifications (SEC’s) is
used to inform government when making policy decisions on employment, health care,
benefits etc., etc. as well as data for information compiled by the Office for National
Statistics. The majority of information is gathered at the time of the 10 year census. Most of
the information is accessible to the public, but access to the depth of detailed information is
restricted (Office for National Statistics, 2010).

67
2.6 ADVERTISING AND COMMUNICATIONSThis section discusses how new products are promoted and communicated, the diffusion
process. Ries and Trout (1986) propose that advertising creates and heightens consumer
expectations by positioning a product in the mind of the consumer, but you are in trouble if
you get it wrong. Advertising people are continually on the outlook for gaps and holes in the
marketplace where they can create the illusion that a product or service will fill that gap as
well as how your product will be thought about. (Diwan and Bodla, 2011).
There are a number of ways how products are positioned:
Type of Positioning Method
Attribute Associating the product with features such as safety and durability
Use or application How it will be consumed
Product user Linking the product with user groups
Product class An alternative to existing products
Competitors Comparing to other well-accepted products
Table 8 - Product Positioning Methods
Usually a product map is produced to give a visual representation of how the features and
benefits of a product is positioned against competitors, in some cases there may be more than
one positioning strategy. An alternative method is to use surrogate positioning, this is where
only the products attributes are given without describing the features and benefits, allowing
consumers to draw their own conclusions (Crawford, 1985; Peter and Olson, 2010). Daneels
and Klienschmidt (2001) proposed that the strongest correlates of new product success was
the ability to provide features and benefits that were not offered by alternative products.
Ries and Trout (1986) suggest that most consumers rank products and brands in their minds
and the advertisers use product positioning as a weapon in the battle for your mind. Because
consumers have different levels of product knowledge, the amount of information needed to
position the product correctly needs careful consideration, for example an expert may
understand braking, acceleration and cornering ability in a car, a more abstract category that
groups these aspects such as ‘handling’ may be better understood by a novice (Peter and

68
Olson, 2010). Chapman (2005), the suggested that there should be layers of information or
narratives and the release or reveal of information should be controlled, particularly for
complex products. If the release is too slow it will generate frustration, and if too fast and it
may confuse and alienate the consumer, Chapman draws an analogy to a Russian doll, where
more is revealed as each layer is opened, perhaps a better analogy would be that the outer
layer of the Russian doll represents the most abstract layer and subsequent layers provide
more detailed information.
The content of marketing messages is dependent on the type of medium being used by
advertising companies and the options that are available to them. The TV advert has a much
greater impact than a static billboard or newspaper advert, although there are still limitations
(mainly because of cost) on how much information can be imparted in a short period of time
(Sethuraman et al., 2011). Chapman (2005) says this is the reason why most adverts
challenge the way we live and consume products by conjuring up provocative images and
ideas of how this could change if we bought into that product – probably the mostly used
product positioning promise being to make the consumer part of the advert theme, rather
than just a passive observer. Although some adverts may be viewed as being fictitious or
even dishonest, Chapman says it is simply manipulating the notions of what is possible and
that because everyday life is so hectic, fiction provides a necessary relief, an escape. And by
providing meanings, proactive or subversive - known as phantile drives – it provides more
depth to the consumer’s product exposure and experience. This is likely to be the thinking
behind why advertising is seen to be helpful, rather than believable (Hoch and Ha, 1986).
However, advertising and communications need to be continually monitored to avoid
marketing myopia (Steinberg, 2012).
2.6.1 Marketing MyopiaLevitt (1960) suggests a firms greatest danger is complacency and stagnation, especially
when they have enjoyed a market share and customer base that they have grown to rely on.
Marketing myopia occurs when firms become locked into producing products that they think
consumers want. In the automotive industry there are some well-known examples. Ford
Motor Company dominated the market in its early days by producing cheap cars through the
invention of the assembly line, but they refused to offer any cars in any other colour than
black, it wasn’t long before competitors stole their market share by offering consumers more

69
colours. Similarly in the late 1950’s, American automotive manufacturers failed to identify
that consumers would accept smaller cars and lost millions of customers to the influx of
smaller car manufacturers from Asia, this loss of market share is something that they have
never recovered from (Levitt, 1960). Levitt suggests that firms must not think of themselves
as just producing goods or services, they need to think of themselves as providers of things
that people want through the use of inventiveness and skill.
2.6.2 Summary of the Practitioners Approach to Market SegmentationThe literature highlights a preference for manufacturers to use product positioning based on
lifestyles in their marketing communications, rather than product information, despite the
evidence that complex innovations are often sidestepped or ignored because they are not
understood (Berlyne, 1978; Rogers, 1995; Chapman, 2005; Silvia, 2005). The literature
shows that advertising in general strives to position the product in the mind of the consumer,
by generating illusions and manipulating the notions of what is possible, yet consumers will
not buy what they do not understand (Gibson, 2010).
Instead of aspirations manufacturers need to look at providing product information,
particularly in the automotive industry where complex innovations are now the norm.
Whatever choice the consumer has, success can only be achieved if they are able to
understand the product. In helping people to make those choices the only way to fill that gap
in their knowledge is by providing the information that is relative to them (Rogers,1995).
2.7 LITERATURE REVIEW SUMMARYThe literature review provided valuable information and insights into the methods and
constructs used in the assessment of new products in particular how the complexity of new
innovations are understood and noticed by consumers. Many of the studies provide
categorisations of product innovation and the aspects of consumer behaviour in the
assessment of new products, some instruments measure these categorisations but none of
them provide a set of factors that match the complexity of innovations with consumer product
knowledge.
Research to date, published in the literature, suggests that for something to be new it must
have some perceivable change to differentiate it from previous products as well as competitor

70
alternatives (Rokeach, 1973; Rogers, 1995; Johannessen et al., 2001; Chapman, 2005;
Conway, 2010; Peter and Olsen, 2010). However, a number of academic authors suggest that
new innovations are often misunderstood as they can be too complex, particularly in the area
of new automobiles, the main problem being a lack of digestible information (Johannessen et
al., 2001; Chapman, 2005; Gibson, 2010; Sasu and Ariton, 2011; Wiedmann et al, 2011;
Tobin, 2012a; Wilcox, 2012). One key study by Johannessen et al. (2001) raises two
questions relating to new innovations “how new” and “new to whom” that should be
considered in all new product developments and that consumers would benefit from more
information that is appropriate to them as an individual, suggesting a measurement of both
the innovation and consumer, but from the consumer rather than the manufacturers
perspective.
Similar views are held by Gregan-Paxton and John (1997), who propose that product
comparisons are based on product attributes, tangible – what it does, and intangible – how it
does it, the more complex products invoking relational comparisons to match similarities
from a number of categorised products (Meyers-Levy and Tybout, 1989; Luhmann, et al.,
2006), using features and benefits - what they are and what they do (Sujan (1985). This does
not mean that gaining an understanding of a new product will result in automatic
endorsement or adoption, but it does mean that the product will be considered instead of
being overlooked (Rogers, 1971).
To do this, manufacturers need to identify and capture the aspects of consumer product
knowledge. This will enable them to categorise new models with an optimum range of
complexity that would be acceptable to their consumer base. The result would identify where
new products are positioned in terms of complexity, allowing them to provide the correct
level of information when communicating to the consumer segments. This would also
provide an indication to manufacturers of the success or failure for products that exceed or
fall below the upper and lower levels of complexity (Michaut, 2004b). The literature provides
a number of key variables to identify the knowledge held by consumers: expertise,
involvement and familiarity, in this research expertise is in the context of actual knowledge
(Zaichkowsky,1985a; Alba and Hutchinson, 1987; Gregan-Paxton and John, 1997; Novick,
1998; Kleiser and Mantel, 1994, 1999); involvement is perceived or accumulated knowledge
gained through a keen interest with a product (Bloch, 1981, 1984; Shimp and Sharma, 1983;
Lennox and MaClaren, 2003; Kassubeck et al., 2011) and familiarity is taken as previous

71
exposure through ownership or access to a specific product (Rogers, 1971; Alba and
Hutchinson, 1987; Danneels and Kleinschmidt, 2001).
The present literature does not provide a comprehensive understanding of how manufacturers
can get their new innovative products noticed by consumers and the data that is required to
measure the complexity of the innovation and consumer product knowledge. Therefore, this
study investigated the appropriateness of measures and constructs required to establish a
more reliable segmentation tool for marketing communications, in doing so the object was to
supplement the knowledge gained from literature with exploratory studies using field-based
discussions and interviews with practitioners and consumers. The detail of this research is
provided in the Exploratory Studies chapter.
In summary there are a number of gaps to be resolved. Firstly, manufacturers need data that
identifies consumer perceptions of product complexity which can be used to group consumers
into low, medium (optimum) and high segments. Secondly manufacturers need to identify the
level of complexity in all new products, from a consumer’s viewpoint – using the same
scaling as the consumer segments. Lastly, manufacturers need to match both sets of data –
perceived consumer complexity with perceived product complexity to provide relevant levels
of product information to a more reliable segmented target market. This literature review
provided the variables and constructs required to achieve those objectives.

72
CHAPTER: 3 EXPLORATORY STUDIES
3.1 INTRODUCTION TO THE CHAPTERThe exploratory studies are placed in this section of the thesis, before the Methods chapter,
because the investigations and pre-tests were necessary to form a conceptual framework.
They provided valuable insights into how this study should move forward, as well as testing
the appropriateness of existing constructs and a foundation for the main questionnaire. Some
of the studies are detailed and use online questionnaires and SPSS analysis. Normally studies
containing this level of detail are discussed first in the Methods chapter, but because they
were instrumental in the conceptualisation of the study the detail is given here.
The introduction to this thesis highlighted an abundance of well documented information and
research relating to product development and production techniques within the automotive
industry, whereas in the area of sales and marketing it is fragmented and uncoordinated with
no central collation. The information that is available is discrete in nature because it is
sourced on a local and mostly ad hoc basis by individual retailers.
Although the literature review covers theoretical constructs in detail there is a need to
develop a more in-depth understanding of industry specific information through the collation
of existing knowledge within the industry, and pull it together to create an understanding of
the strategic and tactical processes used in automotive retailing, as well as consumer reactions
and behaviour.
A number of constructs in the literature review needed to be investigated to identify if they
are appropriate to this current area of research and consumer as well as industry views need
to be obtained. This required a number of interviews and pilot studies through fieldwork -
investigations carried out in the field rather than a laboratory, as well as online
questionnaires. Therefore, an exploratory research design was chosen because little is known
in this area and the method of enquiry required an investigative approach (Spector, 1981;
Iacobucci and Churchill, 2010). The discussions also obtained a richness of data for cars in
general as well as new products.

73
3.2 OVERVIEW OF EXPLORATORY STUDIESThe exploratory studies utilised investigative and information gathering methods as shown in
Figure 11.
Figure 11 – Overview of Exploratory Studies
Findings were fundamental to conceptualisation and provided the research design for the
main methodology.
3.3 INTERVIEWS WITH MANUFACTURERS AND PRACTITIONERSTo investigate how automotive manufacturers and practitioners communicate new products to
consumers, a number of meetings and events were organised/attended to discover the nuts
and bolts of how this worked. This involved meetings with key informants and attendance at
two new product launches. The product launches were of particular interest as they are the
cornerstone of how salespeople are trained to communicate the new products, particularly the
innovations, to consumers. Note that the product launches took place after the main survey
had been completed, this could not be avoided because of the availability and timing of
events. The product launch information is provided in Section 7.2.

74
3.3.1 Meeting with Ford of Britain (FoB) Communications ManagerA meeting was held with Richard Beard, Ford of Britain (FoB) Communications Manager, at
the head office of Ford Motor Company Ltd based in Warley, Essex on 21st October 2011.
An outline of the topics that would be discussed in the meeting was requested and supplied in
advance. The purpose of the meeting was to ask about the Ford Consumerscape, their own in-
house segmentation tool (full details supplied previously in the Market Segmentation and
Practioners section), which provides a detailed profile of the type of person that will be
interested in particular models. Pre-meeting topics relating to the Ford Consumerscape were
provided to Richard Beard as bullet points:
How is the profile established – background research, sources of data that kind of thing.
How do they identify the market segment to match that profile from their marketing data.
How do they update the marketing data and how deep they go in their data collection
Pre-meeting notes on the structure of the meeting were compiled as an aide-memoire
(Appendix 6).
The meeting was recorded, transcribed and a summary was made of the key findings.
The meeting started with Richard Beard describing one of the key reports within Ford - the
Brand Equity and Awareness Tracking (BEAT). This is used to track brand health metrics
including purchase funnels, it is run quarterly with approximately 2000 Ford customers and
Ford prospects as a stand-alone activity, and asks questions on five key metrics, as follows:
Familiarity - have you heard of the brand
Favourable Opinion - how favourable is your opinion of Ford
Consideration - would you consider buying a Ford
Shopped - have you looked in detail at buying a Ford
Purchase Intention – do you intend to purchase a Ford
This report has been in operation for four years. Details of the findings were not supplied
because of the confidentiality of their nature, apart from Familiarity which returned 90% in

75
the last quarter; the Communications Manager commented “if you haven’t heard of Ford you
properly aren’t interested in cars at all”.
A question was asked on who does the profiling of a new car; who says this is the person that
will buy the car? The basis of product development and their marketing strategy is to
establish a consumer profile using the Consumerscape process, which provides a
characterisation of a typical consumer. For example, the characterisation for the Fiesta model
is called Antonella, a 28-year-old who lives in Milan and likes to drive her friends around and
sees it as a social mobility vehicle for her friends. She is more concerned with the outside
appearance rather than comfort. In comparison, the characterisation for the Focus model is
called Lorenzo, again an Italian, age 48 with children that have left, or just about to leave,
home and he is starting to enjoy the finer things in life.
As previously reported, Italy is the lead market for small cars for Ford as it is the biggest
market for that size of car, which is the reason for Italian characterisations, however for the
UK they are using a younger Lorenzo characterisation, aged 35 with a more active lifestyle,
as they believe this to be a higher target consumption group for the UK.
When asked about how they identified where Lorenzo’s lived, they outsource this to a
company called Mindshare and Wunderman who use conventional media consumption
methods, although this was not expanded upon. An observation was given that the
outsourcing companies would have to make some assumptions, particularly for the emotional
aspects of the Consumerscape profile when matching to the data they held, the response was
as follows:
‘The bit I’m struggling with is that within our database… these emotional metrics,
involvement, those are variables. Databases are not as sophisticated as some people feel .
Whilst you might have a Favourable Opinion when you buy the vehicle, your life time
experience might mitigate against that or you may have bought it as a transactional piece and
actually grown to like the product. So these things vary over time… they are more difficult to
gauge overtime unless you are doing that regular calling on the database… that draw that
information in. I don’t know how actionable that is going forward.’

76
The clear impression from the meeting was that the marketing strategy is to position the
product in the mind of the consumer and was heavily dependent on the Consumerscape being
a valid profile. This indicated that the information provided was downstream from how the
consumer profile was established and that further information was required on how the
Consumerscape was established; Richard Beard said this was the responsibility of Pat Farrell,
FoB Global Consumer Insights Manager.
3.3.2 Meeting with Ford of Britain Global Consumer Insights (GCI) ManagerAs a result, a conference call took place with Pat Farrell, FoB Global Consumer Insights
(GCI) Manager on 6th December 2011 to discuss how a Consumerscape was established. A
request to record the conference call was declined, therefore handwritten notes were taken
and typed up immediately after the call ended. The following is a summary of the notes
taken.
Establishing a Consumerscape involves considerable desktop research, they hypothesise what
customers are interested in, their beliefs and attitudes and establish a profile. They then have
to find the consumers who fit this profile, this is outsourced to agencies that use an algorithm,
the details of the algorithm were not revealed, but it was revealed that they are fairly loose
e.g. a few factors such as price bracket.
Ford then run a number of focus groups with the consumers that the agency have identified,
followed by more detailed interviews with individuals and finally an immersion stage where
they spend three days with individuals discussing product and observing their daily routines -
the objective is to validate the profile. At the same time consumer surveys using personal
attitude statements are carried out. Once they have this validation the data is then clustered to
form the characteristics of the consumer profile, such as Lorenzo, which then becomes the
basis of the design brief for a new car or major design change.
However, in the past Ford have produced models that have not had a pre-established
consumerscape, as a result they have had to shoehorn an existing Consumerscape, sometimes
without success. And there is evidence of this. The Ford Fusion was launched in 2002 based
on a consumerscape that was based on a young city dweller, an “urbane’ small estate vehicle
with raised suspension to cope with traffic calming road bumps. In reality it attracted elderly

77
and mobility consumers, who found it easy to get into the vehicle because of the raised access
and that it could carry a wheelchair. These points were discussed with Richard Beard and Pat
Farrell, they revealed that the Fusion did not match the anticipated volumes Ford expected,
Richard Beard blamed the advertising and Pat Farrell blamed the shoehorned
Consumerscape.
3.3.3 Meetings with the Ford of Britain Advanced Product Group (APG)A previous research project in 2005 involved a meeting with the Manager and two members
of the FoB Advanced Product Group at the Ford Dunton Research Centre, Essex to discuss
their involvement in new product development. The following is a summary of that meeting.
They are involved with three 3 car lines: Small, Medium and Large. The product cycle plan
has a horizon of 10/11 years, this is the normal replacement cycle mentality, although this is
changing to a 7 year cycle in terms of new models, however the basic platform (shared across
models) is much longer at 14 years with two major changes during that period. Additionally
they have a refresh every 3.5 years in addition to annual facelifts.
APG become involved at the boundary of where major changes need to take place, this is
known as scaleability in the product cycle plan.
APG is concerned with innovations NOT styling – styling is separate and innovations are
proposed for all three car lines, partly led by gaps in the market and any opportunities that are
identified. Niche products have normally been random although in the last two years they
have been more structured.
Product proposals have to be supported by an allocation of investment as well as planning
volumes. They have market pressures from national sales markets with “wish lists” this is
usually an internal view which is sales based from field teams and dealers as to what is
selling well or how the markets respond to product. APG prefer the external view, which is
looking at what is happening through consumer research, an example given was the use of an
attitudinal group of consumers when designing the new Focus and their opinions of the
feature levels of the product. In addition they use observational methods with consumers to

78
see how they react to new innovations. There is also input from management in the fleet
sector.
When asked how they defined an innovation their responses were as follows:
Obviously different
Obvious new function
Surprise and delight features
Evokes an emotional experience
Wow factor, really cool and it’s ours
Interestingly the ‘wow’ factor is something that is advocated by Radford and Bloch (2011) in
the stimulus section of the literature review (Section 2.2.7).
Changes in the product cycle plan occur annually – usually a facelift, followed by an in-cycle
refreshing after 3.5 years (mentioned earlier).
When asked about niche products as to what makes them a category killer, they said they
would rather use the term category reducer which shrinks the segment to a specific product.
They use ‘White Space Products’ as the terminology for brand new products where nothing
else currently exists in the market, these are aimed directly to the consumer segment they
target and are developed through customer involvement at two stages:
Real Immersion: spending time with consumers and the product such as consumers and
engineers carrying out joint test drives.
Market Immersion: consumer focus groups (participants are outsourced to a recruitment
agency).
Ideally APG would prefer people who either love or hate a product – a polarised style, rather
than ‘liked but do not buy’ – a safe style. On a scale of 1 to 9 they would rather have 1’s or
9’s as 7’s are seen as also-rans.

79
Changes need to have design cues on the outside of the product - described as ’Top Hat’, the
bits you see, although they point out that these have to be treated with care. They mentioned a
minor change that was proposed to the bumper of the Ka was rejected at the consumer
involvement stages as it changed the whole look of the car, moving away from the rounded
lines that buyers were familiar with.
This information was supplied to the new Manager, Richard Brown, of the APG in December
2011 with a request for a meeting or conference call to update this information and gain
support for the current PhD research. Setting up a working relationship with the APG took a
long time, requiring several presentations and phone calls before their support was gained.
The problem is they are very time poor, working to deadlines with what is a small team, and
although they thought this research would have some value for them, other priorities
frequently pushed discussions backwards.
Eventually, in February 2012 emails and a conference call took place with the Manager,
Richard Brown and Alicia Agius, Product Innovation Manager (Europe) of APG. A request
to record the conference call was declined, therefore handwritten notes were taken and typed
up immediately after the call ended. The following is a summary of the discussions:
Initially details of the meeting in 2005 were discussed. They confirmed that the details
obtained then are still valid. Essentially their views and how they do things has changed very
little, but automotive innovation is now an increasingly complex landscape, across feature,
technology and full vehicle. Whitespace remains the goal, but they do not solely look for
whitespace, nor do they solely look for polarizing ideas.
They were asked if they have any involvement with the GCI team and the development of the
Ford Consumerscape. They said they have a close working relationship with Pat Farrell’s
(Manager) Consumerscape team, but this was a bit vague, i.e. when asked if they were
involved in establishing the Consumerscape they said no, they were simply given the
Consumerscape profile. They added that although the Consumerscape is provided, they
apply a deliberate stretch to the profile when designing so that it will appeal to a wider
audience. This stretch is achieved by hypothesising what customers are interested in, their
beliefs and attitudes and this establishes the profile that APG developments are based on.

80
They then source consumers who match this profile to be able to carry out interviews and
focus groups; this is outsourced to a recruitment agency (no change to 2005).
The objective of the interviews and focus groups is to establish a product hypothesis by
identifying a number of aspects: e.g. ingress and egress needs identified a sliding side door
for the new Ford B-Max.
In conclusion they were interested in the three aspects identified in the PhD research:
familiarity, involvement and expertise as emotional segmentation tools and they agreed to
provide support and collaboration to investigate these aspects further, subject to work
priorities.
3.3.4 Meetings and discussions with Glass’s GuideA previous research project in 2005 involved a meeting with Jason King, Forecasting Editor,
Glass’s Information Services Limited, at the head office in Weybridge, Surrey. The company
produce a proprietary product used by most car dealers in the UK that forecasts used car
values, this is typically used as a reference by the dealers in the valuation of vehicles that are
taken in part exchange; this is known as a residual value. The purpose of the meeting was to
discuss how residuals of new vehicles are forecasted; the following is a summary of the notes
that were taken at that meeting.
Current values are set using benchmarking over the previous 7 years based on the following
main streams of data sources:
The values and volumes of cars sold at public, as well as closed, car auctions
Part exchange values given by participating dealers to their customers
Sale prices obtained by participating dealers
Disposal values of part exchange vehicles sold to the trade by car dealers.
All valuations contain the best- selling variant of each model. An algorithm is used to arrive
at the final valuation based on the data with an adjustment for the vehicles mileage and
condition.

81
Some sentiment is taken into account from press and industry, Top Gear etc., propitious as
well as adverse comments and reviews, equally government policies on taxation can affect
residual values as vehicles fall out of favour with buyers. However, a lot of decisions are
made by them as to what is new – for example the recent facelift on the BMW 5 series of
changing the bumper was not seen as new and added nothing to the residual values.
According to Glass’s this was all BMW could afford to do in the late life of the model, but
for a revaluation changes need to be noticeably significant and not just a minor alteration.
The conclusion was that newness has a value, new product and alterations must be seen to
have visibly changed in eyes of the buyer, the greater the degree of change the higher the
residual valuation.
In July 2012, following a number of emails, a conference call took place with Adrian
Rushmore, Managing Editor; the previous (Jason King, Forecasting Editor) contact had left
the company. A request to record the call was declined; therefore handwritten notes were
taken and typed up immediately after the call ended. The summary of the discussions in 2005
was still the way they carried out residual forecasting; basically the highest values were when
it looked different.
The changes to last Volkswagen Passat model were discussed. Volkswagen claimed the
Passat was completely new apart from the roofline, but still looked like the old Passat
(Conway, 2010). His view was that their revaluation of the new model would have been
higher if it had looked different whereas changes to engines and other technical advances
only make small incremental increases to their valuations, although there are times when
there is a demand for novel options. He gave an example of a built in satellite navigation
systems; at one time they would make £200 more – even with a cost of £900 as an option,
whereas now it would be about £100. He said the main rule of thumb is that a particular
brand, model and or options are sought after, such as BMW.
The discussion then turned new drive trains valuations, such as electric powered cars. He said
that for technology of this nature they have an initial surge of interest, but this is really from a
false sub-market. For example, the Toyota Prius hybrid –a car that can switch between a
petrol engine and electric motor, had a huge surge of interest when the first ones came back
onto the market. The interest increased residual valuations considerably but that interest

82
quickly subsided and residuals fell considerably. The problem is there are always a group of
people who want to buy the first used vehicles that come onto the market, once they have
bought them interest disappears.
In general he reiterated it was all about looks, but sometimes things like exceptional fuel
efficiency make a difference. With this in mind questions were asked about how he thought
the new Ford EcoBoost cars with a new 1.0 litre 3 cylinder engine would be viewed. This
new engine had the power output of a 2.0 litre engine under acceleration, but the economy of
a 1.0 litre engine. The view is that the first ones onto the used market, due at the start of
September, 2013, would be bolstered by Ford selling initial supplies of ex-demonstrators
through a closed auction to Ford Dealers, but there will also be the same surge of interest
from the enthusiasts/experts creating a sub-market which will then drop after that segment
has been satisfied. He suggested making contact again in December or in January next year to
discuss the used car market reaction to them.
This was subsequently followed up by telephone in February 2013, however Adrian
Rushmore has left and there is no replacement as yet, but the call was taken by Richard
Parkin who was caretaking the role at that time. The research background was discussed and
he gave feedback on the used car market reaction to the Ford EcoBoost. He agreed with
Adrian Rushmore that there appeared to be a surge of initial interest in the new engines, but
in general prices settled back to normal levels. He felt that it had not attracted any other
buyers apart from people who would normally buy a 1.0 litre engine, perhaps because it does
not compute to buyers that you can get 2.0 litre power from such a small engine, it is simply
something they do not understand.
3.3.5 Informal Meeting with BMW X6 Hybrid Manager – MunichThe following information is based on the memory recall of the author of this thesis from an
informal meeting with BMW X6 Hybrid Brand Manager on 21.9.2011; a chance meeting on
a tourist visit to the headquarters of BMW in Munich, which is open to members of the
public.
The Brand Manager for the new BMW X6 Hybrid was carrying out a photo shoot of the new
model. During the brief conversation, the background of this thesis was explained. The

83
conversation was based on the type of person that would buy the new BMW X6 Hybrid. The
Brand Manager had a specific profile of the person that would buy this type of vehicle – there
were a number of display boards around the vehicle depicting this lifestyle profile, but when
asked him if they had a database of people that they could contact directly (based on the
profile), he revealed that that was where they had a problem. They had data on addresses,
marital status, income, amount of children – all demographics, but he said they had no data
on any emotional factors, he corrected that by saying ‘they can’t capture that.’ He said there
were too many aspects to capture, as a result they come up with a composite profile and then
make the product to fit that profile. The difficult thing is then to decide who fits those
profiles, with the data they have already.
3.4 GENEVA MOTOR SHOWResearch was carried out on the Toyota stand at the Geneva Motor Show, Switzerland, held
in March 2011, with visitors to the show on public days.
The objective of the study was to establish the current reliability and validity of using the
reduced item scales: Automobile Involvement Scale (Shimp and Sharma, 1983) and Expertise
(Kleiser and Mantell, 1994). This would test measures that may be potential determinants on
how consumers perceive the complexity of new products. In addition, questions were asked
to identify familiarity with the Toyota models and the respondents view of how innovative
they were.
The method selected to source primary data was a quantitative approach using self-
administered questionnaires with visitors to the Geneva Motor Show. Data collection used a
novel approach where respondents used the new Apple iPad to complete an online
questionnaire – the collector of the data was on hand to monitor and advise if necessary. The
questionnaire was designed so that all questions had to be answered for completion. This
method allowed for the controlled collection of specific information from the participants
(Iacobucci and Churchill, 2010).
3.4.1 Background to Data CollectionThe survey was conducted over 2 public viewing days, Thursday April 3rd and Friday 4th
March 2011. The venue was the Geneva Motor Show, Geneva, Switzerland. This was chosen

84
because of its importance in the launch of new models in Europe for manufacturers and
availability in terms of timings for the research schedule. 161 self-completion questionnaires
were completed of which all were useable as they were completed online and they were
designed to only be accepted if they were completed in full, this was in line with the study
target of 150. Only 2 people declined to fill in the questionnaire, resulting in a response rate
of 98.77%. It is believed that this high response rate was due to the high level of interest in
the relatively new Apple iPad and that only this research was using this method of data
collection at the motor show. It had been anticipated the novel method would attract people to
participate in the questionnaire. The response indicates that the enthusiasm shown by the
participants to use the iPad to complete the questionnaires, showed the anticipation to be
valid.
A number of questions were asked to identify respondent demographics and reasons for
visiting the motor show. 89% of respondents were Male and 11% were Female. 51% of
respondents were in the sub-45 age group (all percentages are rounded – up and down). The
country of origin for respondents was France 32%, Germany 27%, Switzerland 15% and
Other 26%. 74% were visiting to ‘Look at the new models’. 45% owned a car that was up to
3 years old, 22% from 4 to 6 years old and 33% were > 6 years old. Finally 35% owned a
Ford car, 11% owned a Peugeot, 10% owned a Renault and Others were 44%.
Existing AIS and Expertise scales were used with two triangulation scales to test validity.
Likert scales, on a range of 1 to 7 (1 = Strongly Disagree; 7 = Strongly Agree), were used
throughout the survey.
Existing Scales
The 2 item instrument - Involvement - proposed by Taylor-West et al. (2008) as a reduction
of the Shimp and Sharma (1983) 8 item AIS scale, was used to measure Involvement. The
two items used were as follows:
Cars offer me relaxation and fun when life’s pressures build up.
Sometimes I get too wrapped up in my car.

85
The 3 item instrument – Expertise - proposed by Taylor-West et al. (2008) as a reduction of
the Kleiser and Mantel (1999) 10 item Consumer Expertise scale, was used to measure
Expertise. The three items used were as follows:
I enjoy learning about cars.
I can recall almost all existing brands of cars from memory.
I can recall almost all brand names of cars.
Triangulation Scales
To test the validity of the Involvement and Expertise scales the following two triangulation
questions were used, these were agreed with the panel of experts established for this research
(Section 5.2).
I really enjoy driving (Involvement scale)
I would consider myself to be an expert on automobiles (Expertise scale)
See Appendix 2 for the English version of the questionnaire used at the Geneva Motor Show,
participants could also choose German or French versions.
3.4.2 FindingsResults identified that Involvement had a large positive relationship with the triangulation
scale (Pearson Correlation r =.829), as shown in Figure 12. Note: r =.50 to 1.0 is considered
to be a large relationship, strengthened by the use of a high confidence level p>.05.
Similarly, it was found that Expertise had a large positive relationship with the triangulation
scale (Pearson Correlation r =.776, Figure 12).
The results also revealed a medium relationship between Involvement and Expertise (Pearson
Correlation r =.398, Figure 12). Note: r =.30 to .49 is considered to be a medium
relationship). The evidence suggests that the higher the Involvement the higher the Expertise.

86
Figure 12 - Correlations for Involvement and Expertise
The findings show positive relationships exist between a consumer’s expertise and their
involvement with the product, this concurs with previous findings by Taylor-West et al.
(2008) that expertise increases pro-rata to the involvement that one has with an automobile.
Previous research into the AIS scale (Shimp and Sharma, 1983; Lennox and McClaren, 2003)
suggested the original 17 item scale developed by Bloch (1981) was excessive and that a
reduced item scale of 8 items could be used in the future. And there are strong arguments for
using reduced item scales if you consider that statistical analysis needs 10 (or more) times as
many respondents as questions (Cohen et al., 2003; Hair et al., 1998; Tabachnick and Fidell,
2007; Pallant, 2010). As many surveys have respondents in the 100’s rather than 1000’s
reduced item scales would be beneficial.
Findings suggest the reduced two item scale for Involvement and the three item scale for
Expertise are reliable; the high relationships to the triangulation scales give support to their
validity – Involvement (Pearson Correlation r =.829) – Expertise ((Pearson Correlation r
=.766), and they are particularly useful to researchers where they are used as part of, rather
than the main focus of, the research.
The triangulation question “I would consider myself to be an expert on automobiles” was
tested for socially desirable responding bias using partial correlation; results showed little
effect on the outcome.
The reliability statistics compared well with previous studies (Figure 13)

87
Figure 13 - Comparisons of Previous studies - Reliability Statistics (Cronbach alpha)
The findings indicate strong correlations and construct validity for the reduced item and
triangulation scales.
3.5 CONSUMER DISCUSSION GROUPSAfter several meetings and interviews with automotive manufacturers (details in Section 3.3),
it appears that currently all automotive launches send the same marketing message to all
consumers; they do not take into account how consumers are likely to respond to the new
products. To investigate this further it was decided to explore new technological advances in
the automotive industry by obtaining consumer views and perceptions of current new
technology.
The new Ford Focus, launched by Ford Motor Company in February 2011 was chosen as the
target for the research, as this new mainstream model was introducing a number of advanced
technological option packs for the first time, for example the Convenience Pack comprising
Active Park Assist, when engaged this function identified parking places that the car could be
parked into and took over control of the steering when reversing into this space. A major TV
advertising campaign was used to demonstrate and promote this new technology during and
after the launch date. Other options included the Driver Assistance Pack comprising Traffic
Sign Recognition, Blind Spot Information System, Lane Departure Warning, Lane Keeping
Aid, Driver Fatigue Alert, Auto High Beam, and Low Speed Safety System. Discussion
groups were identified as a method of exploring customer views and perceptions (Langford et
al., 2002; Litosseliti, 2003). The introduction of the Ford Focus, with numerous new
technology options, presented the ideal opportunity to gain specific insights. An explanation
of the technological option packs for the Ford Focus is provided in Appendix 3.
As the nature of the investigation was exploratory, it was decided that a mixed methods
approach was the most appropriate. Discussion groups were chosen as the qualitative method

88
to stimulate discussions to uncover opinions and explore views (Bader and Rossi, 1999) for
cars in general as well as new products; whereas Likert scaling procedures were used as the
quantitative method to measure the views of new technological developments, expertixse,
involvement and familiarity with the products. This provided information to construct an
initial questionnaire to collect a larger qualitative data set. This was achieved through face-to-
face meetings with staff and students of a University faculty and an online survey to friends,
family and the staff and students who were unable to attend the meetings (Section 3.6).
3.5.1 Background to the MeetingsThree in-depth discussion group meetings were carried out at a Ford Retail Dealership with a
random sample of their customers over three evenings – Monday 13th, Wednesday 15th and
Thursday 16th June 2011. Each group had four participants and each session lasted between
60 and 90 minutes. The meetings were recorded on video and later transcribed and analysed.
Each participant was allocated a number to identify them and care was taken to allocate this
number to the transcription extracts. The discussion groups comprised two parts, the first part
was concerned with qualitative data collection, the second with quantitative data collection.
3.5.2 Qualitative DiscussionsThe discussion groups were asked to discuss three open ended topics:
What is new in a new model to you?
What is the minimum it must have?
What is the most/least important thing in a new model?
After transcription the extended text was then searched to highlight and extract sentences
which were grouped under the three topics used during the meetings, each sentence was
coded with the participants allocated identification number.
The groups were pasted into three separate excel spread-sheets with additional headings
added for analysis. The literature suggested several aspects of new products are considered
when forming an assessment, these aspects were added as additional columns to each spread-
sheet with the following headings:

89
Newness
Perceptions
Values
Characteristics
Complexity.
Each aspect had descriptives which were all derived from the literature review, for example
complexity had low, medium and high categories:
Figure 14 – Aspects of New Products
This enabled each sentence and aspect to be categorised. Figure 15 provides an example of
the spread-sheet headings and responses to the topic ‘What is new in a new model to you?’:

90
Figure 15 – Sentence and Aspect Categorisation

91
The categorisation process was repeated three times, on separate occasions, by the author of
this report to validate the selections (Krippendorff, 2004) – there were 6 conflicts overall, that
were resolved by agreement in the third iteration.
3.5.3 Quantitative Data CollectionThe opportunity was also taken to investigate the involvement, expertise and familiarity
variables identified in the literature review. Reduced item scales were used to identify the
participants Involvement and Expertise with automobiles. Likert scales, on a range of 1 to 7
(1 = Strongly Disagree; 7 = Strongly Agree), were used throughout for all qualitative scales.
The 2 item instrument - Involvement - proposed by Taylor-West et al. (2012) as a reduction
of the Shimp and Sharma (1983) 8 item AIS scale, was used to measure Involvement, with
the addition of a triangulation question which had been used previously at the Geneva Motor
Show (see Table 9 below)
.
The 3 item instrument – Expertise - proposed by Taylor-West et al. (2012) as a reduction of
the Kleiser and Mantel (1999) 10 item Consumer Expertise scale, was used to measure
Expertise, with the addition of a triangulation question which had been used previously at the
Geneva Motor Show (see Table 9 below).

92
In addition two questions were asked to identify how familiar the participants were with
Ford, and in particular the Ford Focus (see Table 9 below).
Construct ItemsInvolvement 1. Cars offer me relaxation and fun when life’s pressures build up
2. Sometimes I get too wrapped up in my car3. I really enjoy driving. (triangulation question)
Expertise 1. I enjoy learning about cars2. I can recall almost all existing brands of cars from memory.
3. I would consider myself to be an expert on automobiles (triangulation
question)
Familiarity 1. I am very familiar with Ford cars2. I am very familiar with the Ford Focus
Table 9 - Measure Items
They were then asked a number of questions relating to the advanced technological options of
the new Ford Focus.
To test their knowledge of an option they were asked to respond to:
‘I know what the blind spot information system is’ (example of one of the questions).
They were then shown a short video which explained the option in detail.
They were then asked if they would buy the option:
‘I would buy the blind spot information system option’ (example).
Finally they were asked if the option was something they would like to have:
‘I would like to have the blind spot information system’ (example).
Although this investigation was not about the price of the options, the participants were
interested in the cost. To satisfy their interest, the cost of all the options was provided at the

93
end of the discussions, and they were asked if they would purchase the options now they had
been provided with detailed information.
The scale data was then transformed into an overall mean score for the following constructs:
Knows the options
Would buy the options
Would like to have the options
In addition questions were asked to collate data for age, gender, current car owned and year
of registration. Although the discussion group data was too small for any statistical analysis,
cross-tabs were run to identify relationships with the constructs.
3.5.4 Combined DataThe headings used for the mean data was then added as additional columns to the qualitative
spreadsheet. This allowed the quantitative measurements to be matched to the qualitative
responses to provide a depth of richness to the observations, for example it allowed you to
compare the views of novices with experts, by what they said. Additional columns were
added to the qualitative spreadsheets (example in Figure 15) for the mean scores of the
quantitative responses for the variables: Expertise; Involvement; Familiarity; Knows the
option; Would buy the option; Would like to have the option. For an example of the
combined display data please refer to Appendix 4. This process revealed a number of
associations and patterns which are discussed in the result section.
3.5.5 FindingsThe data reduction and combined qualitative data provided a strong visual representation on
how the participants viewed new products; in particular new complex technological
developments. It also allowed an observation of what the participants said (qualitative) and if
this matched their responses to the quantitative measurements. This process also highlighted
a gap in the literature.

94
As expected there was a linear relationship between Expertise and Knows the option; the
lower the expertise the less knowledge participants had of the technological options;
Involvement had a similar relationship with Knows the option. However, in this study, eight
out of the twelve participants had high Familiarity with the Ford Focus, yet only three of the
eight had high Knows the options, further investigation revealed that this was due to low
Expertise.
There was no clear indication of any relationship between Would buy the option and
Involvement, Expertise or Familiarity, whereas all participants responded that they would
Like to have the options.
Responses to the topic ‘What is new in a new model to you?’ indicated that newness had to
be tangible, “…it has to have better credentials in terms of performance and economy…” but
also perceptual “It would have to look different”. In terms of perceptions it had to have
benefits, “…it had more features on it than the one I had previous…” and meet their needs;
social, functional and experiential, “The last car bought… it was the technology”. In terms of
value most had instrumental values, “With me it’s more… economy” or object value, “It has
to be visibly different”. For characteristics, it had to be relative, “I change my car for exactly
the same sort of car, but with a different engine”, as well as observability, “Sometimes it has
to be how a car looks”, and have advantage, “It has to be a new product as opposed to a
facelift product”. Finally for this topic most of the comments were related to low complexity.
Responses to the topic ‘What is the minimum it must have?’ indicated that newness had to
have familiarity, “What I have in the car now”, perceptions had to be functional, “You want
at least what you’ve got at the moment…”, values had to have innate preferences, “Air
conditioning… park sensors” and characteristics aspects were the same as the previous topic,
relative, observability and advantage. Finally for this topic all comments were related to low
complexity.
Responses to the topic ‘What is the most – least important thing in a new model?’ revealed
that all aspects of newness had to be tangible or perceptual. Perception aspects were
functional needs or benefits, values were either terminal or personal and the aspects of
characteristics were relative, advantage or compatibility. For this topic, 90% of the
comments were related to low complexity and 10% to medium complexity, for example the

95
most important in a new model were appearance, economy and reliability; there were no
significant least important comments.
3.5.6 Discussion and ConclusionsInvolvement and Expertise had linear relationships with Knows the options, this suggests that
you do not have to be an expert to have knowledge of new technology. In addition there is
some concern that most of those with high Familiarity of the Ford Focus were low in
knowledge of the new options, yet they scored high in Like to have the option. Although low
knowledge is explained by low Expertise it does not explain why they would still Like to
have the option. The answer lies in the short videos, which explained the options in detail.
These were shown to the participants between the questions: Knows the option and Would
buy the option which was then followed by the question Like to have the option. Clearly no
one is likely to buy or like to have an option if they do not understand what it is, therefore it
was important to explain the options to be able to gain those responses.
There was a clear indication that all would Like to have the option, whereas responses were
very mixed to Buy the option. This suggests that whilst they attached some value to the
option they were not prepared to pay for it. What is interesting, is that throughout the
meetings many of the participants asked the price of the options, however it was explained
that purpose of the discussions was to focus on the options for what they were and how they
are viewed, rather than the price of the option, although it was acknowledged price is an
important consideration in the final decision. However, at the end of each meeting prices
were revealed for the two option packs – Convenience Pack - comprising of Active park
Assist at a price of £525 and the Driver Assistance Pack – comprising several technological
options at a price of £750 (see Appendix 3 for complete details), and every participant said
they would buy the options as they thought they were good value. Clearly consumers are
price conscious and will not buy at any price.
The qualitative data reveals that new products need to be visibly different, something tangible
with features and benefits that met their social functional and experiential needs. It needs to
meet instrumental and object values in what it does and how it looks to them while being
relative to what they already know, yet different – not just a “facelift product”. The
indications are that whilst the product needs to be different it still needs to be familiar with

96
what they know, there is a strong underpinning that they need to have at least what they have
already have, based on innate preferences which were tangible rather than experiential in
nature. This was borne out by the discussions and comments which were low in complexity,
including the majority of comments made by those with high expertise.
In conclusion, if consumers needs are found to be low in expertise then adequate information
needs to be supplied so they have a clear understanding of the product and what it does. If
they are unable to identify the product with what they already know and understand then it
will not be considered and is likely to go unnoticed, this supports Rogers (1995) view; if the
product is too complex it can become a potential barrier to adoption by the consumer. This is
particularly relevant for consumers with high familiarity of a product, but low in expertise;
they may be expected to be aware of changes to the product, but because they don’t
understand them the result is they are overlooked.
The evidence suggests that gathering data from consumers on their involvement, expertise
and familiarity provides a more effective segmentation tools and if this was operationalized it
would allow marketers to communicate more relevant messages to the consumer segments,
and increase response to their marketing campaigns.
3.5.7 LimitationsThis study was carried out with only a small group of participants and care has been taken to
avoid any reliance on statistical data, the focus was intended for the qualitative analysis,
however, the results only provide pointers for further research and cannot be relied on as a
generalisation.
One limitation is that the Expertise scale may have been subject to participants scoring higher
than their true score, a limitation pointed out by Mehta et al. (2011), in this case it is possible
the relationship between Expertise and Knows the option scales could have been lower than
reported, however this would not have distorted the subsequent questions as the short videos
explaining the options levelled all the participants knowledge.

97
3.6 INITIAL QUESTIONNAIRE PRE-TESTThis section provides a background as to how the initial questionnaire was set up. This part of
the research follows on from the findings from the consumer discussion groups carried out in
June 2011 (Section 3.5). The objective was twofold. Firstly, to obtain a larger data set, based
on the framework of questions and product videos used in the consumer discussion groups;
this would enable statistical analysis. Secondly, to obtain feedback from academic peers on
the construction and content, as well as any amendments needed for errors and omissions.
Five face-to-face meetings were held at the end of April/early May 2012 with students and
staff of the School of Business and Economics, Loughborough University. The structure of
the meetings was a short background presentation before participants viewed the product
videos and completed a hard copy questionnaire. Face-to-face meetings were chosen so that
any difficulty with the complexity or interpretation of the questions could be clarified, as
suggested by Malhotra and Birks (2007); although notes were taken to make any amendments
required, none were needed.
3.6.1 Construction of the Initial QuestionnaireThe framework of questions was based on the questions used in the consumer discussion
groups. These were expanded to include questions relating to how many cars had been owned
or shared previously and reasons for changing their last car, this was to obtain more insight
into the depth of knowledge and familiarity through the previous product exposure, as well as
the things consumers look for in a new model. The same product videos on the Ford Focus
and 7-point Likert scales used in the consumer discussion groups were kept in the same
format. Details of the questionnaire are provided in Appendix 5.
3.6.2 Data CollectionAlthough the five sessions were run on separate days and over lunchtimes, the response was
lower than expected, only 32 over the period. To provide more flexible access, an online
questionnaire was made available to those who could not attend. The Ford Focus product
videos were embedded into the online questionnaire.
A number of reminders were sent to increase response; this raised the completed
questionnaire total to 61. To increase the data set an invitation was also emailed for the same

98
online questionnaire to family and friends; two reminders were sent to increase responses,
and a further 99 questionnaires were completed, making a combined total of 160 responses.
Response rates from friends and family was 99 from a total of 141 invitations (70.21%) and
61 from the University total of 283 invitations (21.55%). Friends and family were chosen
because of availability and convenience (Aaker et al., 2007).
All survey questions required an answer therefore, there were no incomplete surveys. Free
text responses were subsequently coded into descriptive groups, for example the free text
responses to the question “What was the reason for changing your last car?” Subsequent
analysis of all the survey data was carried out using the SPSS statistical analysis programme.
Respondents were asked to actively feedback any aspect of the survey that they did not
understand, including any errors. As a result several amendments were made for possible use
in the main survey.
3.6.3 FindingsResults confirmed positive correlations between Expertise, Involvement and ‘Knows the
option’ (p=<0.05), the lower the expertise or involvement the less knowledge participants
had of the technological options, this supports the earlier research that suggested to be aware
of an innovation it is not necessary to have in-depth technological knowledge. The
relationships were as follows:
Correlations
Expertise Involvement
Average of all
Knows options
Expertise Pearson Correlation 1 .708** .558**
Sig. (2-tailed) .000 .000
N 160 160 160
Involvement Pearson Correlation .708** 1 .387**
Sig. (2-tailed) .000 .000
N 160 160 160
Average of all Knows options Pearson Correlation .558** .387** 1
Sig. (2-tailed) .000 .000
N 160 160 160
**. Correlation is significant at the 0.01 level (2-tailed).
Table 10 - Expertise, Involvement and Knows Options Correlations

99
There was a strong linear relationship between ‘Expertise’ and ‘Involvement’, those who are
highly involved with automobiles having more expertise than those who are not and vice
versa (Pearson Correlation r =.708, n= 160, p <.05), note: r =.50 to 1.0 is considered to be a
large relationship (Pallant, 2010).
Yet the depth of expertise was clearly much deeper for Experts than those who were
Involved. The relationship between ‘Expertise’ and the average of all the ‘Knows the options’
(that is the knowledge participants had of the technological options) was much larger than
those with ‘Involvement’ (Expertise: r =.58, n= 160, p <.05; Involvement: r =.387, n= 160, p
<.05 - Note: r =.30 to .49 is considered to be a medium relationship; r =.50 to 1.0 is a large
relationship. (Table 11).
Expertise Involvement
Average of Knows the options Pearson Correlation
Sig. (2-tailed)
N
.558
.000
160
.387
.000
160
Involvement Pearson Correlation
Sig. (2-tailed)
N
.708
.000
160
n/a
Table 11 - Correlations
There was an expectation that consumers who were more familiar with a particular product
were more likely to be aware of the current available options. As expected there were positive
correlations between Expertise and Familiarity with Ford cars and the Ford Focus, this was
similar for Involvement, however the strength of the relationship was much less. Findings
revealed a large relationship between ‘Familiarity with the Ford Focus’ and ‘Knows the
options’ (r =.509, n= 160, p <.05). A partial correlation of the qualitative data controlling for
‘Expertise’ revealed only a small relationship (r =.292, n= 160, p <.05 – Note: r = .1 to .29 is
considered to be a small relationship (Table 12).

100
Control Variables Familiar with
Ford Focus
Average of all
Knows options Expertise
-none-a Familiar with Ford Focus Correlation 1.000 .509 .548
Significance (2-tailed) . .000 .000
df 0 158 158
Average of Knows options Correlation .509 1.000 .558
Significance (2-tailed) .000 . .000
df 158 0 158
Expertise Correlation .548 .558 1.000
Significance (2-tailed) .000 .000 .
df 158 158 0
Expertise Familiar with Ford Focus Correlation 1.000 .292
Significance (2-tailed) . .000
df 0 157
Average of Knows options Correlation .292 1.000
Significance (2-tailed) .000 .
df 157 0
a. Cells contain zero-order (Pearson) correlations.Table 12 - Partial Correlations
In addition there were large positive relationships with Familiarity with Ford Cars and the
Ford Focus and ‘Knows the options’ (Pearson Correlation r-.513 and r.509 respectively), this
supports the research proposals that familiarity is a moderator; the more familiarity with the
Brand and Model, the more likely they are to be aware of the options.
The indications are that Expertise, Involvement and Familiarity overlap and are key to the
awareness of options, see Figure 16 below. A partial correlation suggested that controlling for
Familiarity with Ford cars had very little effect in the relationship between Expertise and
Involvement (Pearson Correlation r-.708 reduced to r=.676) whereas Familiarity with the
Ford Focus did have an effect (r=.615). However, this needs further support and expansion
and the main survey included more questions on the background of their familiarity,
particularly with the Ford brand as well as questions to identify how they became aware of
the information.

101
Figure 16 - Expertise, Involvement and Familiarity overlap
The question of ‘Knows the options’ also had a medium positive relationship with ‘Like to
have the option’ and the ‘Would Buy the option’ (Pearson Correlation r-.407 and r.348
respectively) whereas ‘Like to have the option’ had a large positive relationship with ‘Would
Buy the option’ (Pearson Correlation r-.769). The obvious view is that a consumer is unlikely
to buy something that they do not know about, but the key here is that once they are made
aware of it and like the option, they are more likely to buy the option, just knowing about the
option is not good enough (see Table 13 for full correlations).

102
Table 13 - Correlations in detail
In brief, the other correlations of note were as follows:
The 35 to 49 age group had the strongest positive correlation between Expertise, Involvement
and ‘Knows the options’ (Pearson Correlation r-.772; r.748 and .803 respectively), whereas
the 20 to 34 age group had the lowest, with no correlation with ‘Knows the options’.
Males had a large relationship compared to the medium relationship females had with
Expertise. However, this was reversed for ‘Knows the options’. This supports the need to
identify how they became aware of the information.
Lastly, car age groups show a changing correlation with Expertise and Involvement, it
revealed that the 10 year or more age group had the largest relationship; this may be because
of necessity e.g. carrying out their own repairs. This data for this sector is mostly student
cars, so this could be likely.

103
Finally, comparison of the averages of ‘Like to have the options’ and ‘Buy the options’
showed a reduction in the average quartile scores, the top quartile reducing from an average
of 5.27 to 4.27 (see Table below).
Average of Like to
have options
Average of Buy
options
N Valid 160 160
Missing 0 0
Percentiles 25 3.30 2.27
50 4.36 3.09
75 5.27 4.27Table 14 - Like versus Buy
3.6.4 LimitationsBecause the sample was friends and family, and University students and staff, there may be
some bias in the results and findings and may not representative of the wider population. As
might be expected, because of the student’s low age group, and for most it was their first car
which had a fairly old average age (7 to 10 years group) they scored low in ‘Knows the
options’. As the research is aimed at innovations in new cars they were not representative of
new car buyers. However, the objectives of the research was to explore customer views and
perceptions of new technological advances in the automotive industry and provide an insight
for the questionnaire and main data collection with a more general public sample of car
owners.
3.7 EXPLORATORY STUDIES SUMMARYThe evidence suggests that manufacturers and practitioners use a number of well-known
commercial products for identifying the target market for their marketing communications,
some have established internal methods and categorisations, but all of them use high level
groupings. Most are based on a limited survey of consumers and can only be used as
generalisations or representations of the market, whereas this thesis is concerned with the
capturing and categorisation of individuals. The exploratory studies provided detailed
information and insights into how the study should move forward.

104
The findings from the Geneva Motor Show found positive relationships between Expertise
and Involvement and suggest that the scales are valid constructs for this research.
Data from the consumer discussion groups and questionnaire pre-test suggests that there are
strong relationships between expertise, involvement and familiarity. Results from the
questionnaire pre-test found correlations with Familiarity and the variables of Expertise,
Involvement ‘Knows the options’. However, in the discussion groups 67% of participants had
high ‘Familiarity with the Ford Focus’, yet only 37% those had high ‘Knows the options’,
further investigation revealed that this was due to low ‘Expertise’. In comparison,
Involvement and Expertise had linear relationships with ‘Knows the options’, the indications
being that although those with Expertise had a greater depth of knowledge, it suggests that
you do not have to be an expert to have knowledge of new technology. The evidence suggests
that those with high involvement may know what the new innovations do, but not necessarily
how they work. Similarly, Expertise moderates familiarity, there is a significant reduction in
the relationship between ‘Familiarity with the Ford Focus’ and ‘Knows the options’ when
there is low expertise. This indicates that owners of a Ford Focus may be aware of the new
options, through marketing and a general interest in their vehicle, but it is likely that they do
not understand what they actually do. This is supported by the findings of the discussion
groups, those with high ‘Familiarity of the Ford Focus’ were low in knowledge of the new
options.
Interestingly, although low knowledge is explained by low Expertise, all participants in the
discussion groups stated they would still ‘Like to have the option’, but this was only after
viewing the short videos, which explained the options in detail. Clearly no one is likely to
buy or like to have an option if they do not understand what it is; the evidence suggests that it
is important to explain the options to be able to stimulate those responses. More insight is
given by the results from the questionnaire pre-test survey which showed a drop in the
percentile average scores from ‘Like the options’ to ‘Buy the options’, indicating that whilst
they attached some value to the options they were not prepared to pay for it. Despite that,
71.9% of respondents in the quantitative survey said they would buy the option packs,
presumably for the same reasons given by the discussion group participants, that they
represented good value. Although the price of the options are not the focus of this research,
the findings show that consumers are price conscious and will not buy at any price and
certainly not without a clear understanding of what they are buying. The evidence suggests

105
that even when consumers are aware of new options, unless they understand what they do,
they will not be considered, whereas this behaviour changes when consumers are provided
with product knowledge. This still does not mean that consumers will buy the product; the
change simply means it will be considered, rather than ignored or overlooked.
According to Glass’s guide, who set residual values for second-hand cars, ideally new models
should be visibly different in the eyes of the consumer to the previous model or other
competitors in the market (Section 3.3.4). They suggest that the failure to attract consumers
to new innovations is because they do not compute to some buyers; it is simply something
they do not understand.
The information obtained from meetings/interviews with key informants from the automotive
sector revealed that positioning of the product in the mind of the consumer and aspirational
methods, such as behavioural lifestyles (Alpert and Gatty, 1969; Ries and Trout, 1986;
Chapman, 2005), are used in marketing communications of new models. This also forms the
basis of automotive product development. The Marketing Department establishes a
consumer profile that characterises a typical consumer for a new model, this is given to the
product development teams along with a “wish list” that has been provided by the
manufacturers sales field teams, with feedback from their retail dealership network as to what
is selling well or how the markets respond to product; the product team, APG at a Ford,
described this as being an internal view. APG stated that they preferred to work to the
external view - looking at what is happening through consumer research, however they are
not involved in establishing the consumer profile, known as the Ford Consumerscape, they
are simply given the profile to work to. What they do try to do is develop brand new
products where nothing else currently exists in the market – ‘White Space Products’ – but
these are developed with the Consumerscape profile in mind.
It appears that product profiling does have its limitations, in the case of the failure of the Ford
Fusion model there was a mismatch of the profile with the market segment; incorrect
advertising and a poorly formed Consumerscape being cited as the reasons. In part this is
likely to be because targeting the market is a problem, as none of the consumer data held by
Ford or their marketing agencies have any of the Consumerscape characteristics; they only
capture demographic data. The FoB Communications Manager acknowledged this:
‘Databases are not as sophisticated as some people feel’. BMW also highlighted the problem

106
by admitting that they had no data on any emotional factors: ‘they can’t capture that, they
come up with a composite profile and then make the product to fit that profile. The difficult
thing is then to decide who fits those profiles, with the data they have already.
Lastly an interesting variable, that Ford use on a global basis, is Familiarity, this is one of five
key items used in their Brand Equity and Awareness Tracking (BEAT) metrics.
The exploratory studies provided an insight into consumer perceptions and how manufactures
and practitioners develop and communicate new models. This provided valuable information
for conceptualising the study (CHAPTER: 4) and additional questions for the pilot
questionnaire (Section 5.8).

107
CHAPTER: 4 CONCEPTUALISATION OF THE STUDY
4.1 INTRODUCTION TO THE CHAPTERThis chapter pulls together the theoretical basis for the development of the main empirical
research using information and insights gained from the literature review (CHAPTER: 2)
and findings from the exploratory studies (CHAPTER: 3), this conceptual model justifies the
direction of the research and provides the conceptual framework and hypothesis for testing
the proposals.
The exploratory studies reveal that manufacturers and practitioners use segmentation data
that has limited effectiveness, with broad product consumer profiles that are an unlikely fit,
not only with the data, but also consumer behaviour. The studies identified in the literature
review provides more insight, but even these are very general in nature and need to be
unpacked to focus on the key concepts and ideas that capture and categorise new innovative
products and consumer perceptions. The following sections provide the framework and
representation of this model.
4.2 PHILOSOPHICAL ASPECTSPhilosophy as a discipline strives to gain a deeper understanding of how and why things
happen in our lives. It achieves this by questioning what we take for granted by focusing on
two things, Ontology, which is the nature of existence and how that came to be, and
Epistemology, the theory of knowledge. Those defined concepts result in the construction of
theories that support the ideas of our existence and knowledge (Teichman and Evans, 1991).
To understand how things are developed and moved forward, the branch of philosophy
relevant to this research is metaphysics, the study of being and knowing. Metaphysics was
developed through the works of Aristotle (382 – 332BC). Aristotle described his theory of
logic as the study of proof, and proposed that although formal logic is concerned with strict
or deductive proof, it is not necessary to consider questions of true and false, it is more
concerned with soundness i.e. is it logical.
Aristotle also systematised logic, working out which forms of inference were valid and those
that are invalid i.e. what in reality follows what, and what only appears to be. He established

108
that a thing is whatever it is by virtue of its form, and forms can change. For example, human
beings get older and change over time, but they are still human beings. Aristotle suggests that
the real point of everything is what it does and what it is for, and this is how we learn to
understand things (Magee, 2010). However, Heidegger (1889 – 1976) points out that
although things do change, sometimes we have to make choices without any certainty of the
outcomes (Teichman and Evans, 1991). In this research consumers are shown to consider
new innovations with little understanding and are faced with making choices without any
certainty.
In comparison, Plato (427 – 347BC), theorised that individuals are made up of three
conflicting elements: passion, intellect and will, and suggested that intellect must be in
control, governing passions through the will. He also believed there are two worlds, one
being only accessible by your intellect, a world of concepts and forms in which knowledge is
more real than in the other world, your everyday life, which is experienced through your
senses and opinion. The theory being that things can exist that we do not know about. This is
partly supported by the much later work by Kant (1724 – 1804) who proposed that things can
exist that we do not know about, not in Plato’s two worlds, but simply as being things that we
are unable to comprehend. His theory is that knowledge is gathered through experience and
understanding using our five senses. Anything that we are unable to understand or deal with
cannot become an experience and consequently cannot become knowledge, yet it does not
mean that it cannot exist (Magee, 2010). Searle (1995) argues that the only thing anyone
really knows is what they have derived from experiences, and it would be impossible to talk
about something that you couldn’t possibly know about unless you had experienced it; to do
so you would be making claims about something you could not possibly validate. This
research gathered knowledge through a consumer’s expertise, experience and understanding.
Yet research only moves forward if existing knowledge is developed by questioning accepted
paradigms and theories; through Socratic discourse - Socrates (470 – 399BC). This is the
teaching method that all of academia is built on to investigate and discover the truth using
questions and answers (Magee, 2010). In reality, we continually search for better theories in
our search for certainty. However, although a theory cannot be proven conclusively, they can
be disproved, which means they can be tested. Popper (1902 – 1994) suggests that theories
are only valid until others come along that are nearer the truth, in the meantime we use
existing theory providing it works (Magee, 2010). This research shows that demographic

109
based segmentation is inadequate and that using a consumer’s Expertise, Involvement and
Familiarity provides a better basis for segmentation.
4.3 RELEVANCE OF EXISTING RESEARCHStudies identified in the literature review provide categorisations of product innovation and
aspects of consumer behaviour in the assessment of new products, but none of them match
the complexity of innovations with consumer product knowledge. Most agree that for
something to be new it must have some perceivable change (Rokeach, 1973; Rogers, 1995;
Johannessen et al., 2001; Chapman, 2005; Conway, 2010; Peter and Olsen, 2010), but others
suggest that new innovations are often misunderstood by consumers because they are too
complex, coupled with the lack of digestible information (Johannessen et al., 2001; Chapman,
2005; Gibson, 2010; Sasu and Ariton, 2011; Wiedmann et al, 2011; Tobin, 2012a; Wilcox,
2012). Rogers and Shoemaker (1971) points out that whilst a consumers understanding of a
new product is important, it does not result in automatic adoption, but it does mean it will be
considered instead of being overlooked.
Johannessen et al. (2001) suggests two aspects – ‘How new’ and ‘New to whom’ - should be
considered in all new product developments, suggesting a measurement of both the product
and consumer, but from the consumer’s viewpoint, not manufacturers. Most studies
concerned with the measurement of product newness, identified in the literature, only
investigate the manufacturer’s view, the focus being centred on the technical aspect of
innovation (Booz et al., 1982; Meyer and Roberts, 1986; Gobeli and Brown, 1987; Urban et
al., 1996; Gregan-Paxton and John, 1997; Veryzer, 1998;Cooper et al., 2002; Talke et al.,
2009; Conway, 2010), most authors surmising that product complexity determines the actual
newness of the product, yet Kock (2007) suggests that innovativeness on its own could not be
relied on for product success.
If complexity determines the actual newness, then the aspect of ‘How new’, proposed by
Johannessen et al. (2001) would be more accurately represented by ‘How complex’ when
delineating this aspect, especially when Robertson (1971, p.199) states that consumer
perceptions set the level of innovation, and that a consumers understanding of product
complexity is required before it will be considered; views which are supported by a number
of other authors (Rogers and Shoemaker, 1971; Gatignon and Robertson, 1991; Ozaki, 2011).

110
Most authors agree that knowledge is key to understanding innovative products, the
understanding of their complex nature being dependant on the level and type of knowledge
that an individual holds. The antecedents of knowledge are described in Table 15.
Antecedent Description/Context for this
study
Authors
Expertise Actual Knowledge Zaichkowsky (1985c); Alba and Hutchinson
(1987); Gregan-Paxton and John (1997);
Novick (1998); Kleiser and Mantel (1994;
1999)
Involvement Perceived or Accumulated
Knowledge (gained through a
keen interest with a product)
Bloch (1981, 1984); Shimp and Sharma
(1983); Lennox and MaClaren (2003);
Kassubeck et al. (2011)
Familiarity Previous Exposure (through
ownership or access to a
specific product)
Rogers and Shoemaker (1971); Alba and
Hutchinson (1987); Danneels and
Kleinschmidt (2001)
Table 15 - Antecedents of Knowledge
The exploratory research suggests that consumer knowledge may be singular or a
combination of all three aspects. For example, an expert does not have to be involved or
familiar with a particular product and visa-versa for involvement and familiarity, although the
likelihood of recognising a new innovation diminishes if knowledge comprises only one
aspect and strongest when it is comprised of all three aspects. Data from the consumer
discussion groups and questionnaire pre-test, found strong relationships between expertise,
involvement and familiarity. The findings suggest that you do not have to be an expert to
have knowledge of new technology; the indications were that those with high involvement
may know what the new innovations do, but not necessarily how they work. In comparison
some respondents with high familiarity of the product were found to be low in expertise;
although they were aware of the innovation, they did not understand what it does. In the
exploratory research Glass’s Guide supported these findings (Section 3.3.4), they suggest that
innovations do not compute to some buyers; it is simply something they do not understand.

111
The view held by Michaut (2001a; 2004a) is that some complexity is required to hold a
consumers interest (epistemic newness), but the prerequisite is that the product is noticed
first, during the initial product exposure (perceptual newness). The inference in Michaut’s
work is that initial exposure is something visual, but most automotive innovations are under-
the-bonnet, in which case product information provides the initial exposure and the degree to
how this is communicated is key to how it is perceived and understood by consumers. This is
the main gap in the framework. The current situation is for manufacturers to develop new
products based on their perceptions of a consumer profile formed from behavioural lifestyles
(Section 3.3). This is then communicated using product positioning marketing methods that
appeal to consumer aspirations, a one-size-fits-all with limited product information, whereas
new products and consumers should be matched by their complexity levels, providing
manufacturers with the ability to supply appropriate levels of product information in their
communications to more accurate consumer segments.
In the exploratory studies, the FoB Communications Manager stated that their databases were
not very sophisticated (Section 3.3.1) and demographics were likely to remain the method of
targeting future marketing communications. Although the databases may be restricted to
demographics one important piece of data, that they appear to overlook, is that they have a
record of every customer that purchased one of their vehicles, something that could be used
as a key Familiarity variable. In this case it would seem to be more appropriate to send
differing marketing messages to existing owners, rather than the one-size -fits –all, when
changes and new innovations are made to that model.
In summary, the existing research reveals a number of gaps. Firstly, no scales exist which
measure the complexity of new innovative products, from a consumer’s perspective.
Secondly, existing scales which measure consumer product knowledge are only one-
dimensional e.g. Expertise; the evidence suggests this is multi-dimensional. Lastly, a gap
exists between consumer perceptions of new product innovations and manufacturer mass
marketing communications.
4.4 KEY CONSTRUCTS AND IDEASThis section deals with the development of constructs and ideas in more detail to justify their
inclusion in the main data collection.

112
4.4.1 Complexity ConstructCurrent constructs measure the technical aspect of complexity from a manufacturer’s view,
none measure consumer perceptions of how complex a product appears to an individual
(Booz et al., 1982; Meyer and Roberts, 1986; Gobeli and Brown, 1987; Urban et al., 1996;
Gregan-Paxton and John, 1997; Veryzer, 1998; Cooper et al., 2002; Talke et al., 2009;
Conway, 2010). Johannessen et al. (2001) posited that ‘What is new’, ‘How new’ and ‘New
to whom’ are questions that manufacturers should consider in the development of new
products. The evidence suggests that asking consumers ‘What is new’ and ‘How new’ would
be a more useful construct as they are the ‘New to whom’ for this research. The degree of
complexity will vary between individuals. Michaut (2001b, 2004a) proposed that products
need some complexity to attract and stimulate interest it may be possible to identify an
optimum complexity range with upper and lower limits to achieve this. For example, too
much complexity and it is not understood and ignored; too little complexity and it is not
viewed as being new and is overlooked. The questions and scales used in the research by
Johannessen et al. (2001) had to be changed from manufacturer to consumer perspectives; the
changes are discussed in Section 5.7.2.
4.4.2 Expertise ConstructKnowledge is delineated as Expertise, Involvement and Familiarity – antecedents that
represent the level and type of knowledge that an individual holds. To avoid any confusion,
consumer expertise in this research is used in the context of actual technical knowledge;
expertise being the adjective of expert knowledge (Zaichkowsky, 1985a; Alba and
Hutchinson, 1987; Gregan-Paxton and John, 1997; Novick, 1998; Kleiser and Mantel, 1994,
1999). This research argues that expertise gained through use of a product or service is know-
how or tacit knowledge, which is related more to familiarity than expert knowledge.
Similarly, as a result of exploratory research, it is proposed that awareness of a product or
service is possible without any detailed technical knowledge. For this research the Kleiser
and Mantell (1994) Expertise construct was found to be the most appropriate measure of
expert knowledge, with some adaption to the questions for the automotive study; the changes
are discussed in Section 5.7.3.

113
4.4.3 Involvement ConstructIt is argued here that the second antecedent of Knowledge is Involvement. The aspect
adopted for this research is the perceived or accumulated knowledge gained through a keen
interest with a product, advocated by Bloch (1981), Shimp and Sharma (1983), Lennox and
MaClaren (2003) and Kassubeck et al. (2011). The literature review identified other areas of
Involvement that proposed a temporal rather than enduring nature of the construct. For
example the increase of intensity during the actual purchase phase. For this research the
Shimp and Sharma (1983) Automobile Involvement Scale (AIS) was found to be the most
appropriate measure of Involvement, with some minor changes for this study; the changes are
discussed in Section 5.7.4. This is support by the findings from the Geneva Motor Show
(Section 3.4.2), which also found positive relationships between Expertise and Involvement
and suggest that the scales are valid constructs for this research.
4.4.4 Familiarity ConstructThe last antecedent of knowledge, proposed here, is Familiarity. It is proposed that this is
know-how or tacit knowledge, gained through the use of a product or service. A number of
authors support his view (Rogers, 1971; Alba and Hutchinson, 1987; Danneels and
Kleinschmidt, 2001) suggesting familiarity is gained through previous exposure; this could be
through ownership or access to a specific product.
Bettman and Park (1980) developed an instrument to group consumers with prior knowledge
and product experience; this was based on previous ownership of a specific product, use of
that product and if they had searched for previous information on that product, the results
placed respondents into low, medium and high familiarity groups. Although relevant to this
study, the Bettman and Park (1980) method appears too simplistic. Consumers can still have
familiarity with a product without ownership, use or information searches for that specific
product. For example, in this research familiarity could be with the manufacturer (Ford)
rather than the specific model (Ford Focus), or someone they know who owns that model.
Equally, the level of familiarity could be high because they are an expert or have a keen
interest (involvement) in automobiles. Recency of ownership is also relevant; it is likely that
current owners will be more familiar than past owners and possibly more alert to new
developments of that model. This instrument was subsequently expanded to provide

114
triangulation of the familiarity groupings and provide the basis of the Familiarity construct,
the details on how this was developed is provided in Section 5.7.5.
In the introduction to this chapter it was observed that manufacturers hold data on existing
car owners which is something that could be used as a key Familiarity variable. It was also
observed that manufacturers hold demographic data for existing car owners as well as
potential customers, gained through marketing campaign enquiries. If records are matched by
house number and postcode data it is likely to identify the number of instances of current and
previous ownership for all the members of a family of a particular make and/or model. Using
Ford as an example, if one or more members of the same household owned a Ford, the other
members of the household are likely to be more familiar with Ford products than those in
households that did not own a Ford. The level of familiarity would be more focused if the
matching was made for a specific model, and more so if members of the household shared or
had access to that model. This suggests that questions relating to the background of car
ownership/usage would provide a much deeper insight into the level of familiarity with a
specific product; i.e. the Ford Focus; questions used to identify this are discussed in Section
5.7.6.
Whilst familiarity, in this context, contributes to consumer knowledge, it is limited to a
specific product and it only has value if the focus is on that product, in the wider aspect of
automotive knowledge only expertise and involvement are the basis of a consumers product
experience (CPE), whereas familiarity is an intervening variable which may moderate the
outcomes of CPE and new product complexity (NPC), the overall outcome being a
consumers categorisation of innovation (CCI).
4.4.5 IdeasAlthough the key constructs are central to this study, demographics are needed to be able to
provide group segmentation. Not only will it indicate what the groups look like such as i.e.
age, gender, marital status and location. In addition there are other dynamic factors that need
to be considered i.e. life cycle stage, education, household income and occupation. All these
variables may change over time, suggesting data updates should be an ongoing housekeeping
process, but their dynamic nature may have a moderating effect on the key constructs. For
example, a change in occupation to the automotive industry may increase product knowledge.

115
Other changes, such as life cycle stage may change attitudes towards convenience (size of
car), the environment (Co2 emissions) and performance (engine size; electronic connectivity
such as Bluetooth); van Rijnsoever et al. (2009) found correlations with the most important
aspects of car purchase and involvement (Section 2.2.10). In addition to dynamic and
attitudinal changes there may be other reasons for changing a car. In Section 2.2.9, Punj and
Staelin (1983) suggest that a change may simply be that the consumer just fancied a new car
– something that was mentioned in the consumer discussion groups (Section 3.5) – or the
consumer thought it best to change every two or three years - these type of responses may
indicate the laissez-faire attitude associated with the inertia segment of consumers (Section
2.2.8).
It is likely that manufacturers will continue to use lifestyle marketing communications,
despite calls to change the strategy to provide product information that consumers will
understand (Wood, 2012; English, 2013). The indications are that consumers must access
secondary sources of information to obtain the level of automotive product knowledge
required, this may be ongoing for those with a keen interest or something they notice because
of familiarity. The study by van Rijnsoever et al. (2009) not only looked at the most
important aspects of car purchase, it also investigated the information sources used by
consumers. Information sources would reveal how consumers obtain new product
information and it likely that the amount and depth of information sourced will differ
between those with Expertise, Involvement and Familiarity. For this study the sources and
categorisations of information, with minor amendments to update current consumer
considerations, used by van Rijnsoever et al. (2009) are used in the main questionnaire
(Section 5.7.7)
The following section summarises the major dependent and independent variables used in
this research followed by a schematic diagram that presents the relationships as a conceptual
framework (Section 4.7).

116
4.5 VARIABLESThe following variables represent the main constructs to measure, consumer product
experience (CPE), new product complexity (NPC) and the overall outcome of a consumer’s
categorisation of innovation (CCI)
4.5.1 Independent (presumed cause)Expertise
Involvement
Complexity
4.5.2 Dependent (presumed effect)Consumer Product Experience
New Product Complexity
Consumer’s Categorisation of Innovation
4.5.3 Intervening (presumed moderators)Product Information
Socio-Demographics
Familiarity

117
4.6 HYPOTHESISReflecting on the conceptualisation of the study, the identification of the main constructs and
variables, the following hypotheses are proposed:
Hypothesis 1a: A Consumer’s Product Experience (CPE) is based on their Expertise and
Involvement with the product
Hypothesis 1b: Socio-demographics have a direct relationship with CPE
Hypothesis 2a: Familiarity has a direct relationship with socio-demographics
Hypothesis 2b: Higher levels of Familiarity has a positive effect on CPE
Hypothesis 2c: Lower levels of Familiarity has a negative effect on New Product
Complexity (NPC)
Hypothesis 3a: The provision of relevant product information has a positive effect on NPC
Hypothesis 3b: Inadequate product information has a negative effect on the Consumer
Categorisation of the Innovation (CCI)
Hypothesis 4: Higher levels of CPE has a positive effect on NPC
Hypothesis 5: Lower levels of NPC have a positive effect on CCI
4.7 CONCEPTUAL FRAMEWORKThis framework provides a visual presentation of the main constructs and variables with their
presumed relationships and hypothesis (Figure 17), as advocated by Miles and Huberman
(1994) and is a reflection of the conceptualisation of the study (Smyth, 2004).

118
Figure 17 - Conceptual Framework
Currently there are no relationships between CPE and Product Information. This gap is likely
to remain until manufacturers start to supply relevant Product Information that is matched to
CPE to reduce NPC. In doing so it allows manufacturers to identify an optimal level of CCI
for new innovative products and increases consumer awareness.
4.8 MODEL SUMMARYThis chapter discussed the theoretical background and conceptualisation of the study through
a model of constructs and variables that affect consumer perceptions of new product
innovations. A framework was developed to show how consumer perceptions fit within a
manufacturer’s product development and marketing communications, and identifies gaps
within that framework.
The resulting hypothesis and conceptual; framework provides the way forward from
descriptive explanations to empirical investigations, in line with the theoretical background,
and forms the basis of the methods employed to collect empirical data.

119
CHAPTER: 5 METHODS
5.1 INTRODUCTION TO THE CHAPTERThis chapter provides a detailed description of the methods used for the research, including
methods to collect empirical data, the sampling frame, questionnaire design, pre-testing and
the main survey procedure. An overview is shown in Figure 18.
To develop a robust investigation, a post-positivist approach was taken to the research, rather
than relying on the assumptions of previously used scales and constructs (Cresswell and
Clark, 2007). A positivist view is that things can be understood through scientific methods
and that there are things that are known to be true, compared to a post-positivist who
questions known assumptions, especially when they are ambiguous or complex in nature,
their view is that predictability cannot be a foregone conclusion (Bryman, 2001; Groff, 2004).
The approach adopted was to consider how consumers responded to questions and enquiry;
the purpose was to discover if the methods used were objective or subjective and that they did
not stretch the bounds of realism (Groff, 2004).
Initial enquiries into literature involved desktop research searching for relevant topics related
to this study (Dunleavy, 2003; Oliver, 2004; Quinton and Smallbone, 2006; Lee and Lings,
2008); a retrospective approach was taken initially followed by the citation approach (Brown,
2006; Brewer, 2007). This identified core texts and search items which were used to set up
alerts with Zetoc and ScienceDirect databases for future publications of relevant papers,
using the following crtiteria: journals, authors and keywords/phrases (Appendix 14). In
addition, the motoring sections of the national press and magazines, e.g. The Daily
Telegraph, were monitored as well as automotive websites e.g. Society of Manufacturers and
Motor Traders (SMMT) for relevant articles. A critique was made of each source of
information, with extracts and comments indexed by source and then grouped by topic/theme
of information (Hair et al., 2007).

120
Figure 18 - Overview of Methods

121
A mixed methods approach of qualitative and quantitative research was used for the
exploratory studies. The rationale for using mixed methods is that neither qualitative nor
quantitative methods are sufficient on their own to understand the research problem
completely (Cresswell and Clark, 2007), but when used in combination they complement
each other and allow for more complete analysis (Neuman, 1991; Teddlie and Tashakkori,
2009). Whereas quantitative methods rely on numerical data for testing the predictive power
of variables, they are unable to capture consumer views or explore trends and tangents with
key informants to the extent of qualitative methods (Greene, 2008). By using mixed methods
it provided the opportunity to explore theoretical concepts with consumers as well as
manufacturers to find out what happens in real situations, e.g. how marketing information is
received and understood by consumers.
5.2 METHODS AND DIRECTIONThe literature review suggested that the practice of developing new products is based on
manufacturing processes, their capability and practical competences. The evidence suggests
that these take priority over user needs and wants and very little focus is given to consumer
issues or involvement (Section 2.4), this required further investigation. The first part of the
process was to gather information on how new cars are developed, in particular the new Ford
Focus launched in February 2011. The Ford Focus was chosen because it had several
technological developments that have not been seen before in a mainstream volume model,
and also because of the timing of the launch in relation to this research. It has been reported
as the most average car on the road (Williams, 2012).
To gain access to sources of information a relationship had to be established with Ford Motor
Company Ltd. A sponsor was required within Ford, to act as a supporter of the research and
facilitate referrals and introductions to the product development and marketing personnel.
The sponsor was the Manager of the Henry Ford College, who was chosen because of the
close relationship between the Ford College and Loughborough University; formal approval
was given by the Marketing Director, Ford of Britain (FoB) who also approved the supply of
consumer data for the target population and sample (Section 5.5) used for the main survey of
this study.

122
The second part of the process was to gather information on consumer perceptions of new
automotive products. Malcolm Waite Ltd., a Ford Retail Dealer based in Sandwich, Kent,
agreed to provide support and resources to carry out face-to-face meetings and discussions
with their customers. Gaining support from both these sources was a key milestone.
The research commenced with an early opportunity to carry out exploratory research at the
Geneva Motor Show in March, 2011 (Section 3.4). This enabled the testing of two previously
used scales identified in the literature review: AIS (Shimp and Sharma, 1983) and Expertise
(Kleiser and Mantell, 1994), (Section 3.3). The scales were found to be reliable and had
current validity. These were used with participants in the consumer discussion groups
(Section 3.5).
There were three consumer discussion group meetings (4 attendees each meeting), these were
carried out over 3 evenings in June 2011. They were chosen to gain insights into their
perceptions of new innovations and assisted in the development of questions for the surveys.
It also allowed feedback on their views of the product videos which were being used for the
first time. The qualitative and quantitative data collected and feedback from these meetings
were used to construct the pre-test presentations and questionnaires (Section 3.6).
The pre-test was carried out at the end of April/early May 2012 with students and staff of the
School of Business and Economics, Loughborough University. These were five face-to-face
presentations using an expanded format of the product videos and a paper-based
questionnaire using in the consumer discussion groups and the scales tested at the Geneva
Motor Show. The purpose of the pre-test was to gain direct feedback from participants on the
structure and content so that errors and improvements could be carried out. This was then
developed into an online questionnaire and rolled out to students and staff who were unable
to attend the face-to-face presentations and friends and family, the purpose being to obtain
high numbers of data collection and feedback on the clarity and understanding of the online
survey. Participants were actively encouraged to point out any errors or omissions and raise
any concerns over the wording of the survey. Feedback enabled minor changes and
amendments to be made. The pre-test also provided sufficient data to carry out the statistical
analysis and gain an early insight into correlations.

123
Having gained feedback the final version of the main survey was constructed (Section 5.9).
Invitations to the main survey were sent out to 91,968 consumers (Section 5.6.1) by email in
August 2012. This was a one-off opportunity that did not allow any follow-ups, therefore it
was decided to carry out a pilot survey (Section 5.8) in July 2012, with staff and students and
friends and family as per the pre-test questionnaire rather than risk any problems with the
main survey. No errors were reported or any further amendments.
Following the main survey data collection, and subsequent analysis, training courses for the
product launch of two new automotive models were attended, in October 2012 (Section 7.2).
The objective was to identify and observe the marketing plans and methods used to
communicate the innovative features through the resources of mass media and front-line sales
personnel in the automotive dealerships.
Part of the training courses was delivered using product videos and previews of TV adverts
for the diffusion of information, this prompted further investigation into which type of
video/advert consumers are likely to prefer. To achieve this, a further online survey was
carried out in February 2013 to gain insights into consumer preferences; this was carried out
with an Automotive Research Panel that was established for this research (Section 5.3).
5.3 RESOURCESThe instruments identified in the literature required a review of the scale and items used. It
was decided to establish a panel of industry experts to scrutinise the instruments and items
and advise/approve the wording and clarification of questions and to trim redundant or
irrelevant questions, so that participants in the survey had a clear understanding. The panel
consisted of five experts with extensive experience of the automotive industry with dealership
and academic backgrounds.
Two key aspects of newness, identified in the literature review (Section 2.3.2), were ‘What is
new?’ and ‘How new?’ (Johannessen et al., 2001). This required scales that categorise the
aspects of newness of a car and provide complexity ratings of the models innovations. These
were devised in collaboration with the Ford of Britain Advanced Product Group (APG) and
their team of six experts based in Cologne, who were involved in the development of the

124
Ford Focus. By having this resource of people, who were knowledgable in this area, their
review of scales and items served as a measure of content validity (DeVellis, 1991)
It was decided that would be useful to establish a consumer research panel to carry out any
further investigations or clarification required after the main survey was completed. This was
acheived by inviting respondents to the main survey; 178 respondents agreed to participate
(Section 5.9.4).
5.4 EXPLORATORY RESEARCHDetails on the exploratory studies are provided in CHAPTER: 3. The justification for placing
this part of the research before the Methods chapter was because the investigations and pre-
tests were necessary to test the appropriateness of existing constructs and the
conceptualisation of the study.
5.5 TARGET POPLULATION AND SAMPLEThe unit of analysis for this study is individual consumers, with the level of analysis being
owners of new cars. The study is concerned with how consumers perceive the complexity of
new car innovations, therefore the sampling population was restricted to owners of cars up to
four years old; it was agreed by the panel of experts that recall and experience of new cars
would diminish after this period. In addition, an age criteria of 18 or over was also agreed, as
the amount of new car owners below this age would be limited.
Ford Motor Company agreed to supply the sampling frame of consumer data for carrying out
the research surveys for this study. As well as the criteria for new car ownership and
minimum age, a random mixture of Ford customer and prospects (50/50) was applied as well
as an even split of gender - male/female.
5.6 DATA COLLECTIONFor this study, secondary data was not available, therefore primary data was required. To
achieve this, a mixed methods approach was used. Firstly, qualitative data was obtained
through discussion groups and in-depth interviews with consumers, and semi-structured
interviews with automotive industry staff and practitioners. The qualitative methods were

125
chosen to stimulate discussions to uncover opinions and explore views, as suggested by
Bader and Rossi (1999).
Qualitative data collection used paper-based and online survey methods; data was analysed
using SPSS and LISREL statistical programs; the tests used for correlation, analysis of
variance, regression and structural equation modelling are given in CHAPTER: 6.
A Gantt chart (Clark and Gantt, 1938) provides an overview of the timings of the data
collection (Figure 19).
Figure 19- Meetings/Interviews and Data Collection Time Frame
Nine exploratory interviews were carried out with key informants of the automotive industry
during the research, these were face-to-face or by telephone (Appendix 15); some required
further discussion and clarification.
5.6.1 Main Survey Data SourceApproval had been obtained from the Marketing Director, Ford of Britain (FoB) for the
supply of consumer contact information in the form of email addresses to carry out an online
survey. The original approval was for 50,000 email addresses to be supplied, subsequently
because of concerns with data protection the survey was administered through Ford’s
marketing agency – Wunderman.

126
The original proposal was to send out an initial email invitation, followed by two reminders
to participate in the survey, at weekly intervals, however only one email was allowed as they
did not want to ‘overfish’ their consumers.
As the survey was administered by Ford concerns over the possible negative reaction by
consumers to what might appear to be a Ford marketing campaign were expressed, as well as
the reduced responses due to the lack of any follow-up reminders. As a result, an agreement
was made to use an email supplied by the researcher of this study, including the
Loughborough University logo and researchers contact details. The contents of the email
were subjected to Ford scrutiny by their legal department who required several amendments
before acceptance. It was also agreed that whilst the email was to be sent out by Wunderman
(Ford’s agency), the ‘From:’ address would be Loughborough University. In addition a
request to increase the volume of emails from 50,000 to 150,000 was approved to alleviate
the problem of only one email attempt, although subsequently only 91,968 emails were
available on their database that fulfilled the sample criteria, a breakdown of the 91,968 was
supplied: 89,510 (97.33%) were Ford customers and 2,458 (2.67%) were prospects; 62,170
(67.6%) were male and 29,798 (32.4%) were female.
A number of online survey providers were considered to set up and run the research
questionnaire, the final choice was FreeOnlineSurveys.com as they provided the facility for
external videos to be embedded into their online surveys (Section 5.7).
5.7 QUESTIONNAIRE DESIGNTo ensure the questionnaire produced reliable and valid data, a systematic process was
followed using the nine step procedure suggested by Iacobucci and Churchill, (2010). Similar
approaches are advocated by a number of authors of methodological literature – Oppenheim
(1992), Jankowicz (2000), Aaker et al. (2007), Hair et al. (2007) and Saunders et al. (2009).

127
Step Procedure
1 Specify what information will be sought
2 Determine type of questionnaire and method of administration
3 Determine content of individual questions
4 Determine form of response to each question
5 Wording of each question
6 Sequence of questions
7 Physical characteristics of questionnaire
8 Re-examine steps 1-7 and revise if necessary
9 Pre-test the survey, revise where needed
Table 16- Procedure for Developing a Questionnaire
The initial design grew from questions formed from findings in the literature review and
which were used as a framework for the exploratory studies with consumer discussion groups
(Section 3.5). They were developed during the pre-test presentations and questionnaire
(Section 3.6). Although Aaker et al. (2007) suggests the construction of a questionnaire is an
imperfect art, care was taken to obtain as much feedback as possible through the pre-testing
and pilot stages to ensure that questions were clearly defined, to avoid ambiguity, so they
could be accurately answered by respondents (Hair et al., 2007). The answers given in the
pre-test and pilot stages were also scrutinised for response substitution (Gal and Rucker,
2011) where respondents may reflect their attitudes to a brand or model (i.e. bad
experiences). There were no answers to indicate ambiguous or response substitution content
in the pre and pilot tests, but this could not be ruled out completely.
5.7.1 Information SoughtThere is a wide variation in the methods, research designs and model operationalisations of
the variables used in the areas of consumer perceptions of new innovative products. Although
many instruments and constructs were identified in the literature review, very few are specific
to the automotive industry and because of the passage of time some required verification for
current validity, others required modification to ensure they were appropriate for this
research. A summary of the instruments that underpin this research are provided in Appendix
17. Note: all the scales used in this thesis are 7-point Likert scales; the scales are discussed in
the following sections.

128
5.7.2 ComplexityInnovation implies newness. Johannessen et al. (2001) carried out research to define and
measure innovation better, they investigated three dimensions of newness: ‘What is new’,
‘How new’, and ‘New to whom’. The instrument used 5-point Likert scales measuring six
areas of innovative activity by manufacturers: new products, new services, new methods of
production, opening new markets, new sources of supply, and new ways of organizing. They
found that innovation as newness represents a unidimensional construct, distinguished only
by the degree of radicalness/complexity.
The study suggested that success of an innovation is determined by the extent of its adoption
rather than how technologically advanced it is, and surmised that what makes it innovative is
its newness as judged by consumers. The weakness of this instrument is that the research was
industry based; although it identified consumers as the judge of new products, it would have
been more beneficial if it had been carried out with consumers.
It was decided that with some modification that the aspects of ‘What is new’ and ‘How new’
would be suitable measures of a consumers viewpoint of innovation. ‘New to whom’ was not
required as only consumers would be responding to this question. In the conceptual chapter it
was observed that the aspect of ‘How new’ would be more accurately represented by ‘How
complex’ when delineating this aspect, therefore an additional question was proposed to gain
a consumers perception of complexity. Questions were devised through an iterative process
with a panel of experts (Section 5.2) to measure these aspects in relation to new innovative
options on a new car, the Ford Focus. As a result the following questions were asked after the
respondents had viewed short product videos relating to the options:

129
Innovation aspect Item to measure the aspect
What is new I would class this option as being new, e.g.
not seen before
How new I think this option is very innovative, e.g.
very advanced; ground-breaking.
Complexity I think this option is very complex to
understand
Table 17 - Items to measure Innovation Aspects
To gain more insight into consumer adoption of new innovations, after discussion with the
panel of experts, two questions were added as follows:
I would like to have this option
I would buy this option
In addition to these two questions an additional question was added. The literature review
suggests familiarity of a product is an important variable in the initial exposure to a new
product as well as schema congruity and product knowledge. To measure prior awareness of
the options used in this research, the following question was asked of each option, prior to
viewing the product video; respondents were only given the name of the product –as defined
by the manufacturer:
I know what the option is
At the end of the survey additional questions were asked to identify if they were aware of the
options prior to the product video and if so, the source of information, as follows:
‘Were you aware of any of the options you have just seen prior to this survey? If you were,
please click one of the options for how you became aware of that option. If you were not
aware, then just leave the option blank.’

130
Option Newspaper
or
Magazine
advert
Newspaper
or
Magazine
article
TV
Advert
Online
Internet
information
Manufacturer
or Dealer
mailshot
Word
of
mouth
– from
a
friend
etc.
e.g. Traffic
Sign
Recognition
Table 18 - Prior Awareness: Sources of Information
The categories were an amended extracts of the information sources options used by van
Rijnsoever et al. (2009) in their research on consumer car preferences, the changes were
agreed with the panel of experts.
The final instrument used for this study contained five questions relating to innovation and
one question relating to prior awareness plus six possible sources of that awareness.
5.7.3 ExpertiseKleiser and Mantell (1994) developed an expertise scale based on previous research by Alba
and Hutchinson (1987). The original instrument had 39 items scored on a seven- point Likert
scale, Kleiser and Mantell (1994) reduced the scale to 15 items using exploratory and
confirmatory factor analysis (LISREL) with a sample of 118 students using a camera as the
focal point for study. The results suggested four dimensions of customer expertise: cognitive
effort, analysis, elaboration and memory with respective alphas of .90, .72, .89 and .86, an
overall coefficient was not supplied, although they found that a three-factor model combining
the analysis and elaboration dimensions fitted the data as well as the four-factor model. For
this study the cognitive effort dimension questions were omitted, this was because the
questions were concerned with loyalty and side-by-side brand comparisons rather than
knowledge of the product. Similarly a question in the elaboration dimension was omitted as it
was concerned with marketing messages. The panel of experts agreed that the omitted
questions were redundant; they also approved minor changes to the wording to use cars as the

131
focal point of the study and clarification. The final instrument used for this study contained
nine items relating to the construct of expertise. For the purposes of triangulation the question
used for the Geneva Motor Show research (Section 3.4.1) and pre-test questionnaire (Section
3.6.1) – I would consider myself to be an expert on automobiles – was used again in the pilot
and main survey.
5.7.4 InvolvementBloch (1981) developed the Automobile Involvement Scale (AIS), the original scale included
69 items, which was reduced through factor analysis to 17 items. Subsequently, in later
studies carried out by Shimp and Sharma (1983) and Lennox and McClaren (2003) this was
reduced to an 8 item scale. The original 69 items were analysed by a group of six judges to
trim redundant and/or irrelevant statements to 44 retained items, which were reduced further
using a student sample (n = 381) via coefficient alpha ( .83) and item-to-total correlations. A
second student sample (n = 57) was used for test-retest reliability, the retest being taken after
a two week interval, alpha was .79 and .78 resulting in a final 17 item measure. Shimp and
Sharma (1983) factor-analysed the AIS with a sample of 696 adult non-student respondents
to test the dimensionality of the scale and reduced the scale to 8 items; alpha was .76. Lennox
and McClaren (2003) ran the reduced 8 item scale (Shimp and Sharma, 1983) with 178
customers of a car dealership reporting; alpha was .71.
All items in the three research projects used a 6-point Likert scale. Terence Shimp (Shimp
and Sharma, 1983) was contacted by email and asked why a 6-point scale (instead of a 7-
point) had been used, although he was unable to recollect he suggested it was to avoid
respondents choosing a middle-of-the-road score. The evidence suggests the eight item scale
(Shimp and Sharma, 1983) was the most appropriate and was adopted for this study. For the
purposes of triangulation the question used for the Geneva Motor Show research (Section
3.4.1) and pre-test questionnaire (Section 3.6.1) – I really enjoy driving – was used again in
the pilot and main survey.
5.7.5 FamiliarityBettman and Park (1980) developed an instrument to group consumers with prior knowledge
and product experience; the focal point of the research was a microwave oven. 99 housewives
were contacted by telephone and were asked three questions: had they ever owned a

132
microwave; used a microwave; and had they searched for information on microwaves. Those
who responded negatively to all three questions were assigned to a low group; those who had
searched for information or used but not owned a microwave were assigned to a medium
group, and finally those who owned a microwave were assigned to a high group. The design
of the research suggests this could be applied to a variety of products, including cars.
Discussions with the panel of industry experts agreed that the groups would be appropriate to
represent low, medium and high familiarity groupings for the Ford Focus used in this study,
obviously the wording of the questions was changed from microwave to Ford Focus. The
panel also agreed minor amendments to the second question –used a microwave – to Have
you shared or had use of the Ford Focus, as this was more appropriate for multi-car
households. However, the Bettman and Park (1980) groupings do not take into account
consumers who had no familiarity and group those who had searched for information and
those who had past use of the product in a Medium group. It is likely that familiarity would
be higher for those who had used a product than those who had searched for information on a
product and similarly the groupings do not discriminate between current and past owners of a
Ford Focus - the former being likely to have the highest level of familiarity for current and
past owners of a Ford Focus, therefore an additional question was added: Is your current car a
Ford Focus. This provided five levels of familiarity – None; Low; Moderate; High and Very
High.
It was also agreed with the panel of experts to provide triangulation of the familiarity
groupings to ask two further questions: I am very familiar with Ford cars; I am very familiar
with the Ford Focus. The questions used a 7-point Likert scale to measure the strength of
familiarity.
The triangulation questions were expected to correlate with the familiarity groupings. The
final instrument used for this study contained six items relating to the construct of familiarity.
5.7.6 Car Ownership/UsagePunj and Staelin (1983) carried out research into automobile purchase decision; reasons for
changing their car; how many makes/models were considered at the time of purchase and
how many makes of cars they had owned in the previous 10 years. They suggest that the

133
more cars owned “…captures a decision-maker's desire to be exposed to new models…”
(Punj and Staelin, 1983, p.372). Some questions used in the Punj and Staelin (1983) research
were reworded for clarification and to update current consumer considerations i.e. CO2
emissions.
Additional questions were added to obtain a profile of the experience with manufacturers and
car models. For manufacturers - 10 classifications were established using the top five car
manufacturer registrations in the UK in 2011 with a market share >5%, e.g. Ford; Vauxhall,
the rest being grouped by manufacturing region, e.g. Asian; Japanese. Secondly, to identify
the segment of their current car, e.g. small - large, the Motor Industry Vehicle Classifications
was adopted (Appendix 1). Reasons for changing their car was updated by assembling a
document archive from a broad range of manufacturers’ product brochures, these were
scrutinised using content analysis techniques, at the terminological level (Neuendorf, 2002;
Bryman and Bell, 2007) to determine categories of newness that manufacturers describe in
communications to target customers, and the way they group such features. Whilst there were
differences in terminology across manufacturers, it was possible to categorise them into four
main groups: Style and Design; Functionality: On-Board Equipment and Post Purchase
Offerings. This categorisation was subsequently agreed with the panel of experts (Section
5.3) and the Ford APG team based in Cologne (Section5.3).
The final instrument used for this study contained nine items relating to car ownership and
usage.
5.7.7 Information SourcesThe study by van Rijnsoever et al. (2009) investigated relationships between what was most
important in the purchase of a car; the information sources consumers used in the appraisal
process and their level of involvement (utilising the Bloch, 1981 AIS scale). The instrument
used for information sources comprised seventeen items grouped into five factors relating to:
internal search, personal channels, mass media channels, Internet searches and retailers.
Some items were reworded to accommodate current source i.e. Internet web sites.
This instrument was chosen as it was expected that would correlate with the expertise and
involvement scales. The final instrument used for this study contained fifteen items relating
to information sources.

134
5.7.8 Most Important Aspect of Car PurchaseThe other instrument used in the van Rijnsoever et al. (2009) research contained nineteen
items and three factors to measure the most important factors when deciding which cars
consumers would consider. The items were grouped into three factors relating to:
environment, performance and convenience.
Some questions were reworded for clarification i.e. CO2 emissions, rather than Greenhouse
gas emissions, others to accommodate current technology e.g. blue tooth and phone
connectivity. All changes were agreed by the panel of industry experts. The final instrument
used for this study contained fifteen items relating to the most important aspects of car
purchase.
By utilising the van Rijnsoever et al. (2009) most important aspects of car purchase and
sources of information constructs in the main survey of this study it provided more insight
into consumer profiles, particularly for those with low involvement - the so-called inertia
segment.
5.7.9 Socio-DemographicsSocio-demographics are a representation of the attributes of consumers; some of these are
readily available and can be verified, such as the respondent’s age, gender, marital status,
formal education and location. Others, such as social class and cultural aspects can only be
relative, rather than absolute measures of an individual’s place in society (Hofstede et al.,
1999). Income and occupation can also be difficult to verify, particularly in self-reporting
situations, because some respondents may want to appear to have a higher level/status than
they currently have (Dibb and Lyndon, 1996; Hofstede et al., 1999; Weinstein, 2004; Aaker
et al., 2007; Hair et al., 2007; McDonald and Dunbar, 2004; Lacobucci and Churchill Jr.,
2010; Wells et al., 2010; Tkaczynski and Rundle-Thiele, 2011).
Some demographics change over time, e.g. age and marital status and there are numerous
categorisations in use by authors and researchers (Dibb and Lyndon, 1996; Hofstede et al.,
1999; Weinstein, 2004; Aaker et al., 2007; Hair et al., 2007; McDonald and Dunbar, 2004;
Iacobucci and Churchill, 2010; Wells et al., 2010; Tkaczynski and Rundle-Thiele, 2011). For

135
this study, extracts were made of these categorisations and proposed and agreed through an
iterative process with the panel of experts. The education categorisation was based on four
groupings taken from the National Qualification Framework (NQF). Five lifecycle
classifications were considered (Wells and Grubar, 1966; Murphy and Staples, 1979; Gilly
and Ennis, 1982; Lawson, 1988; Watson, 1999), the three stage Lifecycle scale (Watson,
1999) was chosen for ease of completion by respondents (Rolstad et al., 2011); some changes
were made to the wording used after feedback from the pilot survey; these were also agreed
by the panel of experts. The final categorisations used in this study are provided in Appendix
16.
5.8 PILOT QUESTIONNAIREA pilot questionnaire was carried out prior to the main survey after additional questions were
added to the pre-test questionnaire: socio-demographic; car ownership; information sources
and most important aspect of car purchase.
The product videos used in the pre-test surveys were retained, as well as 7-point Likert
scales. All questions required a response, any missing answers prompted a reminder and
respondents were unable to proceed to the next page of the questionnaire until they were
completed. If respondents failed to complete the questionnaire, the system discarded the
record. This ensured that there were no incomplete questionnaires or missing data and
avoided detailed data checking routines before analysis could be carried out.
The survey went live on schedule in the second week of July, 2012. Email invitations were
sent out to the same sample as the pre-test survey; students and staff of the School of
Business and Economics, Loughborough University and to family and friends. This time no
reminders were sent, instead an incentive of a £25 cash prize draw was offered for
completion. There were 114 responses. Response rates from friends and family was 66 from a
total of 141 invitations (46.8%) and 48 from the University total of 283 invitations (16.96%).
Respondents were asked to feedback any queries or comments that had errors or required
clarification. Monitoring of the responses over the seven day period that the questionnaire
was open revealed an early surge in responses, but this quickly subsided and the result was a
much lower response rate, compared to the pre-test survey (Table 19).

136
Respondents Pre-test Response Pilot Response
Friends & Family 99 (70.21%) 66 (46.80%)
University 61 (21.55%) 48 (16.96%)
Table 19 - Pre-Test and Pilot Questionnaire Responses
It was anticipated that there would be fewer responses to the pilot questionnaire, as the
questionnaire was similar to the pre-test survey, a number of authors point this out as one of
the negative outcomes of frequent requests for respondents to participate in online surveys
(Oppenheim, 1992; Nakash et al., 2006; Aaker et al., 2007; Iacobucci and Churchill, 2010).
The pilot proved to be a precautionary measure as further feedback was obtained for items
that required clarification as well as errors that needed to be corrected for the main
questionnaire; a sample of the email feedback is provided in Appendix 7. The questions used
in the pilot survey are the same as the main questionnaire - after the minor amendments had
been applied (Appendix 8).
5.9 CONSTRUCTION OF MAIN SURVEYThe main survey was structured as an undisguised questionnaire with clear guidelines and
explanations that followed a structured path (Iacobucci and Churchill, 2010; Slater and
Crumley 2011); as this was an online questionnaire the wording and order of the questions
were the same for all participants (Hoyle et al. 2001).
Participants were provided with introductions to each section explaining the purpose of the
survey and the reasons behind each section. For example, this is an introduction and
explanation for one of the sections:
Are you familiar with Ford Cars?
There are a number of cars with new innovations on the market, but for this research we are
looking at the new innovations that have been developed on the Ford Focus.
The next questions will let me know how familiar you are with Ford cars in general as well
as the Ford Focus.

137
At the beginning of the questionnaire respondents were assured that all the information
supplied was totally anonymous and confidential and that none of the information could
identify them individually. As Ford Motor Company sent out the invitations to their
customers asking them to participate in the survey, the objective was to ensure this opening
introduction would reassure participants (Hoyle et al. 2001).
The option to participate in a prize draw of £100 in Amazon Gift Vouchers was offered as an
incentive to all respondents. To participate, respondents had to reveal their email address,
with the reassurance that it would be destroyed after the prize draw had taken place.
5.9.1 StructureThe questionnaire had a number of sections designed to capture data identified in
Questionnaire Design (Section 5.7). The questionnaire began with a brief introduction
indicating the time to complete the questionnaire and a statement of anonymity. Respondents
were then asked to provide some information on their background this included socio-
demographics and questions relating to car ownership/usage and what was the most important
aspect of car purchase to them. These were followed by questions relating to expertise,
involvement and familiarity constructs as well as the sources of information they used when
looking for a new or newer car.
Questions were then asked on the eleven new innovative options for the Ford Focus;
questions were the same for all the options. Firstly the option was described and respondents
were asked: ‘I know what the option is’. Respondents were then asked to view a product
video for that option before continuing to respond the following questions:
I would like to have the… (name of option)
I would buy this as an option
I think this option is very complex to understand
I would class this option as being new, e.g. not seen before
I think this option is very innovative, e.g. very advanced, ground-breaking
Respondents were then asked if they had been aware of any of the options they had just
viewed prior to the survey and indicate the source from an options list. The price of the

138
complete options package was then revealed and the final question was asked if they
would buy the options at that price.
The survey closed with the option to participate in the prize draw incentive, thank-you
message and instructions to exit the survey.
As in the pilot questionnaire, respondents were required to answer all questions for their entry
to be recorded; this was to ensure there were no incomplete questionnaires or missing data. A
copy of the main questionnaire is provided in Appendix 8.
5.9.2 ProcedureThe main survey was launched on 23rd August 2012. As agreed in Section 5.6.1, email
invitations with links to the online survey were sent out by Wunderman, the marketing
support agency for Ford Motor Company; a sample of the email invitation is provided in
Appendix 9.
Under the terms of the agreement of the mailshot, Ford retained all the email contact data and
only one mailshot was carried out without any follow ups. However, although it had been
agreed that the ‘From:’ address of the email would be Loughborough University, Wunderman
had only changed the hypertext title of the email address they use for marketing purposes.
This meant that when recipients hovered over Loughborough University, it revealed the true
email address - <[email protected]>. This was only revealed at the time of
deployment when a sample email invitation was supplied (Appendix 9). It was expected that
any respondents that became of this were likely to have an adverse reaction, this proved to be
the case (see Response, Section 5.9.3).
To recap, the following criteria, discussed in Section 5.5, were applied for data selection:
• Owners of new cars up to 4 years old
• A random mixture of Ford customer and prospects (50/50)
• Even gender split of male/female
• Age criteria is 18 or over

139
As mentioned in Section 5.6.1 it had been agreed to send out 150,000 email invitations,
however only 91,968 consumers met the criteria when the data selection was extracted.
5.9.3 ResponseA number of authors have carried out research into online survey response rates (Kaplowitz
et al., 2004; Wright, 2005; Edwards et al., 2009; Fan and Yan, 2010; Buhrmester et al., 2011;
Jin, 2011). Although they provide some useful guidelines and point out the limitations of this
data collection method, there is great variation between authors on what can be expected in
response rates (Baruch, 1999; Baruch and Holtom, 2008). The evidence suggests that without
being able to send out any follow up reminders, a low response rate of 3% was likely
(Edwards et al., 2009). This indicated circa. 2,750 responses to the 91,968 email invitations.
The actual response to the survey was 1,401 (1.53%), much lower than anticipated. Not
having control of the contact data it is difficult to provide reasons for this low response rate.
For example, it is not known if there were any invalid/incorrect email addresses as the agency
who carried out the survey used a no-reply service. However, concerns raised in Section 5.9.2
of an adverse reaction when recipients hovered over the From: section of the email that
revealed <[email protected]>, were founded. An email address for the author
of this research had been given on the opening page of the online questionnaire for any
respondents to contact in case of any difficulties in accessing the survey. Although this was
used by respondents who had difficulties, it was also used by 287 potential respondents that
were checking to see if the research survey was genuine, as most suspected it was a ploy by
Ford Motor Company to gather data for a marketing campaign. What is unknown is how
many consumers deleted the invitation believing it to be junk mail, compared to the ones that
took the trouble to investigate further. This is a limitation of not having direct control of a
survey (Jin, 2011).
It should be noted that there may be some problems with the low response rate, in that the
survey may have attracted only those consumers with a propensity to completing online
surveys. However, findings showed similar results with the various groups used in the
research – Staff & Students; Friends and Family, as well as respondents to the main survey.

140
Of the 1,401 respondents to the survey, 1055 (75.3%) provided their email address to
participate in the prize draw, unfortunately when notifications were sent out that the draw had
been completed, 14 (1.3%) were returned as undeliverable - it was assumed that an error had
been made when the respondents had entered their address, but because of the confidentiality
of the data, this could not be followed up and resolved. The prize draw took place at
Loughborough University on 10th September 2012 using the RAND function of Excel to
assign a random number to each email address and again to select the winner. The process
was observed and confirmed by a member of the administration staff at the School of
Business and Economics at the University. The winner was notified by email the same day.
A breakdown of the respondents, based on the selection criteria, is shown in Table 20
Data Criteria Number of Respondents Proportion in Population
Ford Customers 1,177 (84%) 89,510 (97%)
Ford Prospects 224 (16%) 2,458 (3%)
Male 827 (59%) 62,170 (68%)
Female 574 (41%) 29,798 (32%)
Table 20 - Responses based on Data Criteria – Percentages are round up for ease of comparison
Results of the main data collection are provided in Section 6.4.
5.9.4 Participation in Automotive Research PanelThe opportunity was taken to ask the respondents to the main questionnaire if they would be
interested in joining an Automotive Research Panel. This was seen as an opportunity to build
a resource for further research required for this current study and similar future projects
carried out by the Centre for Automotive Management within Loughborough University (the
author of this study is a member). In return for participation, they were informed that the
results of the findings would be shared with panel members.
Ethical concerns were discussed with the PhD supervisors resulting in the following actions.
A thank you email, for taking part in the survey, was sent to all respondents notifying them
that the prize draw prize had taken place and the winner had claimed the prize. Respondents
were then invited to join the Automotive Research Panel, to do so they had to click on a link
to an online form where they had to indicate their agreement to joining the panel by entering

141
their email address – bearing in mind that the email address, currently held for them, was
being deleted. A copy of the invitation to join the Automotive Research Panel and the online
consent form is provided in Appendix 10.
Of the 1,041 that received invitations to join the Automotive Research Panel, 184 (17.67%)
agreed to join, however 6 (3.26%) of the email addresses supplied were subsequently found
to be incorrect, resulting in a net figure of 178 members. This should be noted by future
researchers using email addresses for contact data, as this indicates that entry errors are likely
when capturing this format of information and may be costly in lost respondents to research
surveys – in this study 20 contacts were lost due to respondent input errors.
It should be noted that there may be some limitations with the research panel. Although the
members were originally in the 1,041 respondents to the main survey, they are unlikely to be
representative of the general population, although they are clearly representative of highly
involved consumers (Section 6.5).
5.10 COMPLEXITY RATINGSOne of the objectives of the study is to measure new product complexity. The literature
review suggests consumers and manufacturers have differing views of complexity (Section
2.3.2). To test this assumption the Ford Advanced Product Group and a panel of 5 Sales
people from the Ford Retail Dealership who hosted the Consumer Discussion Groups,
(Section 3.5) were asked to rate the complexity of the eleven innovative options for the Ford
Focus (Appendix 3). The Ford Retail Dealership was chosen because they are directly
involved in communicating product information to consumers on a daily basis. The findings
are discussed in Section 6.4.9.
5.11 POST-MAIN SURVEY RESEARCHFurther research was carried out post-main survey. Evidence from the literature review
suggests that complex innovative products are poorly communicated to consumers. The
conceptual framework suggests a gap exists between consumer perceptions and new product
innovations, because manufacturers provide inadequate product information. To achieve this,
two areas were investigated: the product launch of two new automotive models products and

142
consumer views of TV adverts and product videos. The investigations were carried out post-
main survey because of timings of the product launches and the availability of product
videos.
5.11.1 Product LaunchesThere was a need to look at how manufacturers launch new models and the methods and
processes used to communicate and diffuse information on new innovations to consumers. To
achieve this, two product launches were attended:
Ford B-Max Launch - Salesman Training Event at the Henry Ford College,
Loughborough University, in October 2012
Toyota Auris Launch - European Train-the-Trainer Event in Madrid, Spain in
October 2012
Permission to attend the product launches had to be sought from the Ford sponsor, Stuart
Harris and Toyota training organisers, the latter was arranged through Professor Jim Saker,
Loughborough University, who was providing training support for the event. Full details on
the content and discussion of the events are provided in Sections 7.2.1 and 7.2.2.
5.11.2 : TV Adverts and Product VideosDuring the product launches a number of product videos were used in the training sessions
and participants were shown proposed TV adverts to support the model launch. To test the
assumption that manufacturers provided inadequate information it was decided to carry out
further research using the established Automotive Research Panel (Section 5.9.4) to obtain
consumer views of TV adverts and product videos, discussion and findings are provided in
Section 6.5.
The method for this research was similar in structure and procedure as the main survey. The
method used an online questionnaire containing 19 questions and 3 short car videos.
Invitations to participate were sent out by email to the 178 members of the Automotive
Research Panel, an assurance was given that the information supplied would remain
confidential at all times and would not be shared with anyone. This point is reiterated here as

143
one of the panel members subsequently questioned the validity of the stated confidentially.
The panel member had started to receive a number of car marketing emails, a copy of the
email exchanges with the panel member addressing their concerns is provided in Appendix
11; the concerns were fully resolved. There were no other queries of this nature. A copy of
the email invitation to participate in the TV Advert and Product Video survey is provided in
Appendix 12. The response to the survey was high, 150 (84.26%) members completed the
survey; a valuable resource for future research.
The questionnaire began with an explanation that some questions had been asked in the
previous questionnaire (main survey), but as it was totally anonymous it was not possible to
match them to an individual – hence the need to ask these questions again. They were
informed that this time the information would be retained so that some of the questions will
not need to be answered again in any future research surveys. Email addresses were asked,
and retained, for identification.
The structure of the survey utilised similar sections used in the main survey ; socio-
demographics, car ownership; Expertise, Involvement and familiarity scales; followed by
questions relating to preferences and perceptions of TV Adverts and Product Videos. The
latter was carried out in two parts:
First Part
Participants were asked to view two videos:
Toyota Auris TV Advert
Toyota Auris Hybrid System Product Video
This was followed by 2 single choice questions with a free-text comments box to give the
reasons for their choice:
1) Indicate which video appealed the most
2) Indicate which video they would prefer to see on TV
Two further questions using a 7-point Likert scale - 1 Strongly Disagree to 7 Strongly Agree
were used to indicate how complex respondents thought each video was to understand.

144
Second Part
Participants were then asked to view one video:
Audi A6 TV Advert
They were then asked to say what the thought the video was about in a free-text comments
box.
This was followed by a 7-point Likert scale - 1 Strongly Disagree to 7 Strongly Agree to
indicate how complex respondents thought the Audi video was to understand
As in the previous questionnaires, respondents were required to answer all questions for their
entry to be recorded to ensure there were no incomplete questionnaires or missing data. A
copy of the TV Adverts and Product Videos questionnaire is provided in Appendix 13.
Discussion and findings for this part of the research are detailed in Section 6.5.
5.12 METHODS SUMMARYThis chapter provided detailed information on the methods used for this research. Exploratory
studies were carried out using interviews with key informants in the automotive sector and
discussion group meetings with automotive consumers. These were supported with pre-test
and pilot questionnaires using face-to-face and online data collection methods. The pre-test
and pilot studies explored theories and tested the suitability of previous constructs for this
research. In addition an Automotive Research Panel was established to support the current
and future research and was used effectively for a confirmatory survey following the main
data collection.
During the period of the research a number of papers based on proposals and findings were
subjected to academic rigour involving discussion and peer review at conferences, doctoral
colloquiums, seminars and publications in two academic journals.
The pre-test and pilot studies provided confirmation that constructs and questions were clear
and unambiguous; a number of triangulation questions were used to establish construct
validity. Changes and amendments to questions used in the original constructs were made to
update current consumer considerations i.e. Internet web sites, adding incremental validity to

145
the original constructs (Netemeyer et al., 2003); a panel of experts were used to support,
advise and approve the changes. Findings and results enabled modifications to the
instruments at each stage, before being finalised for the main data collection.
This chapter provided criteria for the effective capture of data to address the research
questions and demonstrates that the research design provides internal validity to the study’s
ability to determine cause and effect.
Finally the pre-test questionnaire resulted in 160 usable responses; the findings were
presented in Section 3.6.3. The pilot questionnaire resulted in 114 usable responses for
further analysis; the main questionnaire 1401, the results and findings are presented in
Sections 6.2.9 and 6.5.

146
CHAPTER: 6 DATA ANALYSIS
6.1 INTRODUCTION TO THE CHAPTERThis chapter provides details of the statistical analysis of the pilot and main surveys. It begins
with details of the analysis methods and confidence levels used, followed by the rational for
using triangulation methods to test the internal validity of the Expertise, Involvement and
Familiarity scales. The results of the pilot and main surveys are provided, followed by the
findings, discussions and conclusions, and finally the limitations of the analysis. The overall
concern is to show that the scales are valid and distinct.
Both online surveys were designed so that respondents answered all the questions. If the
survey was started but not completed the system discarded the entries. The objective was to
ensure there was no missing data or incomplete records, however frequencies were run in
SPSS and checked for any outliers or irregularities to confirm that the system was robust;
none were found.
6.2 METHODS USEDThroughout the analysis, 7-point Likert scales (1 = Strongly Disagree; 7 = Strongly Agree),
were used and Confidence level: p<.05. 7-point scales rather than an even 6 point scale were
chosen to offer respondents a ‘neutral’ or ‘not sure response’, in most cases the midpoint of 4
being the equivalent of neither agree nor disagree. The reason for this is because of the
complex nature of this research, the view held by Netemeyer et al. (2003) that a neutral
response is a valid answer, was appropriate and that 7-point scales provide an optimum level
of detail than a 5-point scale. A 7-point scale also puts less pressure on respondents than the
decision making of larger scales such as 10-point and above (Netemeyer et al., 2003; Pallant,
2010). A number of authors (Nunnally, 1978; Aiken and West, 1991; DeVellis, 1991, 2003;
Byrne, 1998; Diamantopoulos and Siguaw, 2000; Curwin and Slater, 2002; Diamantopoulos
and Schlegelmilch, 2002; Cohen et al., 2003; Huizingh, 2007; Hair et al., 2010; Pallant, 2010;
Schumacker and Lomax, 2010) point out the issues of using appropriate techniques for
variables with different scaling properties, it is found to be common practice to use interval-
based analytic methods for items in Likert scales where the response format is ordinal. The
view by Nunally (1978) and DeVellis (1991) is that it is acceptable in behavioural sciences,
but suggests that a practical approach is to follow the acceptable analysis in a particular

147
research area. The instruments identified in the literature review for this research employed
interval-based methods to analyse Likert scale, therefore this practice was adopted for the
analysis in this thesis.
6.2.1 Coefficient AlphaCoefficient alpha (Cronbach, 1951) is the method used for assessing the reliability of the
scales. Alpha indicates the proportion of variance in the scale that is attributable to the true
score of the latent construct by looking at the items simultaneously (Cortina, 1993). SPSS
computes alpha for the full scale taking into account every possible version with a single item
removed, it also provides corrected and uncorrected item-scales correlations (DeVellis, 1991;
Pallant 2010). In theory alpha values range from 0.0 to 1.0; a negative Alpha indicates
something is wrong (DeVellis, 1991), Nunnally (1978) suggests .70 is a lower acceptable
boundary, although it is not uncommon to find scales published with lower alphas. DeVellis
(2003) provides more guidance: <.60 unacceptable; between .60 and .65 undesirable; between
.65 and .70 minimally acceptable; between .70 and .80 respectable; between .80 and .90 very
good; >0.90 the researcher should consider shortening the scale, although it is pointed out
that longer scales are more reliable. Most studies take >.70 as being acceptable, regardless of
the items in the scale, whereas Cortina (1993) compared the alpha values of .80 for scales
made up of three and 10 items, which revealed an average inter-item correlation of .57 for the
three item scale and only .28 for the 10 item scale, a difference of .29. The view by Pallant
(2010) is that small item scales do result in small alpha values but the responsibility lies with
researchers to base their decision on whether an alpha value is reliable, not only in value, but
also the number of items in the scale; optimal inter-item correlations should be between .2
and .4.
6.2.2 Eta-SquaredMeasures of effect summarize the strength of the association between independent and
dependent variable and identify precisely how large the effects in data really are (Pallant,
2010). Eta squared is one method that should be routinely calculated for t-tests and ANOVA
as part of the evaluative process and reported in the summary analysis (Cohen et al., 2003).
Cohen et al. (2003) classifies .01 as a small effect, .06 as a medium effect and .14 as a large
effect.

148
The formula for calculating eta squared is as follows:
t-test: t2/t2+(N1+N2-2)
ANOVA: Between Groups Sum of Squares/ Total Sum of Squares
6.2.3 t-testIndependent-samples t-test was used to identify differences between dichotomous groups e.g.
Males/Females and continuous scales e.g. Expertise (Caputi and Reddy, 1999; Netemeyer et
al., 2003; Pallant, 2010). Eta squared was used to calculate effect size.
6.2.4 Pearson CorrelationPearson correlation (r value) was used to identify and explore the negative/positive strength
of relationships between interval scales (Pallant, 2010). The correlation coefficient (r) ranges
from -1.00 to 1.00 indicating a perfect negative or positive correlation, the guidelines for the
strength of the relationship used in this thesis is: small r=.10 to .29; medium r=.30 to .49;
large r=.50 to 1.00, if ‘r’ is preceded by a negative sign it only refers to the direction of the
relationship, not the strength (Pallant, 2010).
6.2.5 One-way ANOVAOne-way analysis of variance (F-value) was used to identify and explore the differences
between means for dependent variables e.g. Expertise, broken down by the levels of
independent variables e.g. Sources of Information Used. An investigation of the ANOVA
multiple comparisons output was used to identify significant differences between the groups
of the independent variable (Chatfield and Collins, 1992; Pallant, 2010). Eta squared was
used to calculate effect size.
6.2.6 TriangulationThe survey included triangulation questions, the purpose being to provide content validity to
the items used in the Expertise, Involvement and Familiarity constructs. Although Rossiter
(2002) argues that content validity should not be established through correlation, his
proposals are controversial and others argue that statements such as: ‘ the validity of the
instrument had been tested by comments of experts’ or ‘content validity was determined

149
through a review of literature or panel experts' are unacceptable and invalid statements
(Yaghmale 2009, p26). The view by Pallant (2010) is that validity of a scale is that it
measures what it is supposed to measure, but also points out that there is no universal
agreement on what does indicate a scale’s validity. DeVellis (1991) points out that scale
validity is not a one-off, but an ongoing process and care should be taken with the present use
of constructs as they may differ to the original validation. This thesis sought to identify a
linear relationship between the scale items and the triangulation questions. Correlation
establishes this relationship and validates the scale items and their use in this current study.
6.2.7 Socially Desirable Response BiasOne of the triangulation questions ‘I would consider myself to be an expert on automobiles’
was considered to be susceptible to individuals making themselves to appear to be more
expert than they are by giving answers that would reflect a more positive image (DeVellis,
2003). The outcome of socially desirable responding can distort correlations between
constructs the phenomenon known as the spuriousness effect (DeVellis 2003). To reveal the
presence of bias the Marlowe-Crowne Social Desirability Scale (Crowne and Marlow, 1960),
using partial correlation, was used to test for this phenomenon.
6.2.8 Reverse Scoring of Negative QuestionsFor each of the eleven Ford Focus options participants were asked to respond to the question
‘I think this option is very complex to understand’ using a 7-point Likert scale (1 = Strongly
Disagree; 7 = Strongly Agree). This is a negatively worded question, the purpose of the scale
was to have 1-point as the most complex and the 7-point as least complex, so that when it
was compared with other variables it would correlate correctly e.g. the higher the Expertise
the lower the complexity. All other scales were constructed as 1 = Strongly Disagree through
7 = Strongly Agree. If this scale had been set up differently it is likely that the reversing of
the scale for these questions would result in inadvertent responses; by keeping them in the
same format it would avoid response myopia. To prevent this happening, responses were
reversed after the data was collected (Curwin and Slater, 2002; Devellis, 2003; Pallant 2010).

150
6.2.9 Structural Equation Modelling - LISRELTo confirm the theoretical factor structure proposed in the conceptual framework and
establish goodness of fit to the questions and constructs, structural equation modelling (SEM)
using LISREL (Byrne, 1998) was used to apply confirmatory factor analysis (CFA) (Sharma,
1996; Hair et al., 2010).
6.3 PILOT SURVEY RESULTSThe purpose of the pilot survey was to test the final version of the questionnaire with
feedback on any errors and omissions before rolling out to the main survey. This was carried
out using an email invitation to complete the online survey with friends and family and
students and staff at Loughborough University, many of whom had participated in the initial
pre-test questionnaire (Section 3.6). The questions used in the pilot and main surveys were
the same as no amendments were required.
A substantial number of the respondents were young, single, low income and
students/trainees (Table 21). Although this is not surprising due to the sample used, it is not
representative of new car owners of cars up to four years old that is used in the main survey
and this is evident in the in-depth analysis, particularly for the small sample size (n=114). To
alleviate repetitive output for the reader, the results reported here for the pilot survey are
limited to the main constructs, whereas in-depth analysis is reported for the main survey.
Total Responses 114 n %Age Group - 20 to 34 42 36.8Marital Status - Single 42 36.8Household Income - Less than £15k 39 34.2Occupation - Student/Trainee 29 25.4
Table 21- Frequencies of Pilot Survey Respondents

151
All constructs reported good Cronbach alpha coefficients and compared well with previous
studies (Table 22Table 22 - Pilot Study - Cronbach Alpha Coefficient Comparisons).
PilotStudy
Pre-Test
GenevaMotorShow
2008StudybyTaylor-Westet al.
2003Study byLennox &MaClarren
1983StudybyShimp&Sharma
1999StudybyKleiser&Mantel
Expertise .936 .739 .890 .870 ns ns .860Involvement .953 .770 .830 .860 .900 .840 ns
MostImportant forchanging car
Environment .950 ns ns ns ns ns nsPerformance .821 ns ns ns ns ns nsConvenience .794 ns ns ns ns ns ns
Sources ofInformation
Used
Internal .887 ns ns ns ns ns nsPersonal .818 ns ns ns ns ns nsMass Media .927 ns ns ns ns ns nsInternet .788 ns ns ns ns ns ns
ns = not significant
Table 22 - Pilot Study - Cronbach Alpha Coefficient Comparisons
Results revealed a large positive relationship between Expertise and Involvement (Pearson
Correlation r =.860, n=114, p<.05), this compares well with the Pre-Test findings (r =.708,
n=160, p<.05), (Section 3.6.3). This suggests positive relationships exist between a
consumer’s expertise and their involvement with the product; expertise increases pro-rata to
the involvement that one has with an automobile.
Familiarity with the Ford Focus was expected to have a positive moderating effect on
Expertise and Involvement. Results show a statistically significant difference at the p < .05
level for Expertise and no relationship with Involvement (Table 23), although actual
differences in mean scores between the groups was quite small; Eta squared value was less
than .01 (eta=.007). The results are likely to be due to the sample used - only 18.4% of
respondents currently owned a Ford Focus; 50.9% had no familiarity with the Ford Focus and
for the age of cars owned, 67.5% were 4 years or older.

152
ANOVA
Sum of Squares df Mean Square F Sig.
Expertise - actual
knowledge on cars
Between Groups 20.333 3 6.778 2.782 .044
Within Groups 268.027 110 2.437
Total 288.360 113
Involvement with cars Between Groups 17.390 3 5.797 2.320 .079
Within Groups 274.864 110 2.499
Total 292.254 113Table 23 - One-way ANOVA: Familiarity with Expertise and Involvement
Relationships were sought between Information Sources Used by the respondents when they
look for a new or newer car and the measures of Expertise and Involvement. Colour
highlights are provided for ease of identification. Results from Pearson correlations (Table
24) identified that Internal had a medium positive relationship with Expertise (r =.428). Mass
Media had large positive relationships with Expertise (r =.754) and Involvement (r=.549).
Internet had a large positive relationship with Expertise m(r=.706) and a medium positive
relationship with Involvement (r=.421). Retailer had a medium positive relationship with
Expertise (r=.333).
Correlations Matrix – Large Medium
Scale 1 2 3 4 5 61. Expertise – actual knowledge oncars
-
2. Involvement with cars .860 -
3. Internal – Information source used .428 .249 -
4. Personal – Information source used sig>.05 sig>.05 sig>.05 -
5. Mass Media – Information sourceused
.754 .549 .429 .186 -
6. Internet – Information source used .706 .421 .535 .140 .807 -
7. Retailer – Information source used .333 .258 .394 sig>.05 .426 .423
n=114, p < .001 (2-tailed)Table 24 - Pearson Correlation: Information Sources Used with Expertise and Involvement

153
Results from a One-way ANOVA identified that Knows the options Average had medium
positive relationships with Expertise, Involvement and Familiarity (Table 25).
Correlations Matrix – Medium
Scale 1 2 3
1. Expertise – actual knowledge on cars -
2. Involvement with cars .860 -
3. Familiarity .203 .228 -
4. Knows the options - Average .419 .300 .332
n=114, p < .001 (2-tailed)
Table 25 - Pearson Correlation: Knows the Options with Expertise, Involvement and Familiarity
A partial correlation to explore the relationships between Familiarity and Knows the options
whilst controlling for Expertise, showed only a small decrease in the strength of the
correlations: from .332 to .319, suggesting that Expertise had very little effect on the strength
of the relationship between these two variables.
No discussion or conclusions are entered into here as the sample used for the pilot survey is
not representative of the population used for the main survey and the analysis provided was
limited to the main constructs. Greater detail and in-depth analysis is reported for the main
survey (Section 6.4).
6.4 MAIN SURVEY RESULTS
6.4.1 Construct ReliabilityThe first part of the analysis was to test the reliability of the scales. All constructs reported
good Cronbach alpha coefficients and compared well with previous studies (Table 25).
Inspection of the ‘Cronbach’s Alpha if item Deleted’ column in the Item-Total Statistics
matrix revealed that the removal of the second item in the Involvement construct: ‘I will
search for the latest information on cars before I purchase’, increased the final alpha from
.948 to 951. As this was only marginal it was decided not to remove the item so that it could
be compared with the results of previous studies that had used the scale. No other items in
any of the other constructs resulted in an alpha that exceeded the final alpha.

154
MainStudy
PilotStudy
Pre-Test
GenevaMotorShow
2008StudybyTaylor-Westet al.
2003Study byLennox &MaClarren
1983StudybyShimp&Sharma
1999StudybyKleiser&Mantel
Expertise .948 .936 .739 .890 .870 ns ns .860Involvement .926 .953 .770 .830 .860 .900 .840 ns
MostImportant
for changingcar
Environment .913 .950 ns ns ns ns ns nsPerformance .838 .821 ns ns ns ns ns ns
Convenience .747 .794 ns ns ns ns ns ns
Sources ofInformation
Used
Internal .879 .887 ns ns ns ns ns nsPersonal .861 .818 ns ns ns ns ns nsMass Media .857 .927 ns ns ns ns ns nsInternet .861 .788 ns ns ns ns ns ns
ns = not significant
Table 26- Main Study Cronbach Alpha Coefficient Comparisons
The next part of the process was to test relationships of constructs identified in the conceptual
framework (Section 4.7)
6.4.2 Expertise and Involvement RelationshipsResults identified that Expertise had a large positive relationship with the triangulation scale:
I would consider myself to be an expert on automobiles - (Pearson Correlation r =.973, n=
1401, p <.05); Involvement had a large positive relationship with the triangulation scale: I
really enjoy driving - (Pearson Correlation r=.901, n=1401, p <.05).
The results also revealed a large positive relationship between Expertise and Involvement
(Pearson Correlation r =.795, n=1401, p<.05), (Table 27). These findings show positive
relationships exist between a consumer’s expertise and their involvement with the product,
this concurs with previous findings by Taylor-West et al. (2008) that expertise increases pro-
rata to the involvement that one has with an automobile and provides a reliable measurement
of a Consumers Product Experience (CPE). The results compare well with the Pre-Test
findings (r =.708, n=160, p<.05), (Section 3.6.3) and the Pilot Survey (r =.860, n=114,
p<.05), (Section 6.3).

155
To reveal the presence of socially desirable responding bias for the triangulation question ‘I
would consider myself to be an expert’ the Marlowe-Crowne Social Desirability Scale
(Crowne and Marlow, 1960), using Pearson Partial Correlation, was applied; results showed a
small decrease in the strength of the relationship (from .795 to .786) suggesting that
controlling for socially desirable responding had little effect on the strength of the
relationship between Expertise and Involvement variables.
Triangulation Scales Involvement with cars
Expertise – actual knowledge on cars .973 .795
Involvement with cars .901 -
Table 27 - Pearson Correlations for Involvement, Expertise and Triangulation scales
The findings show positive relationships exist between a consumer’s expertise and their
involvement with the product, this concurs with previous findings by Taylor-West et al.
(2008) and the results of the Geneva Motor Show research (Section 3.4.2).
6.4.3 Familiarity Constructs and TriangulationIn the conceptualisation of the study (Section 4.5.3) familiarity with a product was identified
as an intervening variable; the online survey utilised contained two familiarity constructs.
The Bettman and Park (1980) construct (Familiarity LMH) was used to categorise consumers
into three groups of familiarity with the Ford Focus – Low; Medium and High. It was
proposed in the questionnaire design (Section 5.7.5) that the Bettman and Park (1980)
groupings did not take into account consumers who had no familiarity and grouped those who
had searched for information and those who had past use of the product into the Medium
group. It was observed that it was likely that familiarity would be higher for those who had
used a product than those who had searched for information on a product and similarly for
current and past owners of a Ford Focus. In comparison the Familiarity 1 to 5 construct
categorised consumers into five groups of familiarity with the Ford Focus – None - No
Familiarity; Low – Searched for |Information; Moderate – Shared or had use of ; High – Past
Owner and Very High – Current Owner.
Two triangulation questions were used to test scale reliability. A one-way between groups
analysis of variance was conducted with the nominal constructs: Familiarity LMH;

156
Familiarity 1 to 5 and the triangulation scales: ‘I am very familiar with Ford Cars’; I am very
familiar with the Ford Focus’. There was a statistically significant difference at the p < .05
level in overall scores for the Low, Medium and High familiarity groups (Table 28). Eta
Squared values indicated a medium effect with Familiarity with Ford Cars (eta = .07) and a
large effect with Familiarity with Ford Focus (eta = .11).
ANOVA
Sum of Squares df Mean Square F Sig.
Familiar with Ford cars Between Groups 297.236 2 148.618 60.223 .000
Within Groups 3449.956 1398 2.468
Total 3747.192 1400
Familiar with Ford Focus Between Groups 672.572 2 336.286 90.697 .000
Within Groups 5183.471 1398 3.708
Total 5856.043 1400Table 28 - One-Way ANOVA: Familiarity LMH Construct
Results for the Familiarity 1 to 5 construct and the triangulation scales show a statistically
significant difference at the p < .05 level in overall scores for the None - No Familiarity; Low
– Searched for Information; Moderate – Shared or had use of ; High – Past Owner and Very
High – Current Owner groups (Table 29). Eta Squared values indicated a large effect with
Familiarity with Ford Cars (eta = .10) and a large effect Familiarity with Ford Focus (eta =
.16).
ANOVA
Sum of Squares df Mean Square F Sig.
Familiar with Ford cars Between Groups 395.385 4 98.846 41.169 .000
Within Groups 3351.807 1396 2.401
Total 3747.192 1400
Familiar with Ford Focus Between Groups 874.901 4 218.725 61.299 .000
Within Groups 4981.142 1396 3.568
Total 5856.043 1400Table 29 - One Way ANOVA: Familiarity 1 to 5 Construct
Despite reaching statistical significance overall, inspection of the multiple comparisons of the
Familiarity 1 to 5 construct showed there was no significance difference between the
Moderate – Shared or had use of and High – Past Owner groups (Table 30). To resolve this,

157
the construct was modified by combining the Moderate – Shared or had use of and High –
Past Owner groups in SPSS into one group. The outcome produced a new construct:
Familiarity NLMH which categorised consumers into four groups of familiarity with the
Ford Focus – None - No Familiarity; Low – Searched for Information; Moderate – Past
Owner, Shared or had use of ; High – Current Owner.
Dependent
Variable
(I) Familiarity 1 to 5 (J) Familiarity 1 to 5 Mean
Difference (I-
J) Std. Error Sig.
Familiar with Ford cars
3 Moderate – Shared or
had use of
1 None - No Familiarity 1.505* .240 .000
2 Low – Searched for
Information
.654* .115 .000
4 High – Past Owner -.171 .131 .691
5 Very High – Current
Owner
-.561* .133 .000
4 High – Past Owner 1 None - No Familiarity 1.676* .240 .000
2 Low – Searched for
Information
.825* .114 .000
3 Moderate – Shared or
had use of
.171 .131 .691
5 Very High – Current
Owner
-.390* .132 .026
Familiar with Ford
Focus 3 Moderate – Shared or
had use of
1 None - No Familiarity 1.831* .293 .000
2 Low – Searched for
Information
.799* .141 .000
4 High – Past Owner -.343 .160 .202
5 Very High – Current
Owner
-1.138* .162 .000
4 High – Past Owner 1 None - No Familiarity 2.175* .292 .000
2 Low – Searched for
Information
1.142* .139 .000
3 Moderate – Shared or
had use of
.343 .160 .202
5 Very High – Current
Owner
-.795* .161 .000
Table 30 - Multiple Comparisons: Familiarity 1 to 5 Construct

158
Results for the new Familiarity NLMH construct and the triangulation scales show a
statistically significant difference at the p < .05 level in overall scores for the None - No
Familiarity; Low – Searched for Information; Moderate – Past Owner, Shared or had use of ;
High – Current Owner groups (Table 29). Eta Squared values indicated a large effect with
Familiarity with Ford Cars (eta = .10) and a large effect with Familiarity with Ford Focus (eta
= .14).
ANOVA
Sum of Squares df Mean Square F Sig.
Familiar with Ford cars Between Groups 395.385 4 98.846 41.169 .000
Within Groups 3351.807 1396 2.401
Total 3747.192 1400
Familiar with Ford Focus Between Groups 874.901 4 218.725 61.299 .000
Within Groups 4981.142 1396 3.568
Total 5856.043 1400Table 31 - 32 - One Way ANOVA: Familiarity NLMH Construct
Results suggest that Familiarity LMH and Familiarity NLMH have construct validity; they
are measuring what they are supposed to measure, in this study that is the degree of
familiarity that a consumer has with the Ford Focus. As you would expect, there was a large
positive correlation between Familiarity with Ford cars and Familiarity with the Ford Focus
(Pearson Correlation r=.508, n = 1401, p <.05). Having established construct validity, a
decision was taken to carry out further analysis using only the Familiarity NLMH construct.
In the context of familiarity with the Ford Focus, the Familiarity NLMH construct is the one
to be used when referred to as Familiarity. The reasons for this is that eta squared had large
effects with the triangulation questions, and four groupings provide more insight than the
three group Familiarity LMH construct by having more degrees of freedom – more
independent pieces of information available to estimate another piece of information
(Rowntree, 1981). It also supports the proposal in the questionnaire design (Section 5.7.5)
that current owners would have the highest level of familiarity with a product compared with
past or shared ownership.
The Familiarity construct was expected to have an overall positive moderating effect on the
latent variable CPE (Section 4.7) by correlating with Expertise and Involvement constructs.
Results show a statistically significant difference at the p < .05 level in overall scores for the
None - No Familiarity; Low – Searched for Information; Moderate – Past Owner, Shared or

159
had use of ; High – Current Owner groups (Table 33). Eta Squared values indicated a large
effect with Expertise (eta = .34) and a large effect with Involvement (eta = .23).
ANOVA
Sum of Squares df Mean Square F Sig.
Expertise - actual
knowledge on cars
Between Groups 1350.775 3 450.258 250.322 .000
Within Groups 2512.807 1397 1.799
Total 3863.582 1400
Involvement with cars Between Groups 749.397 3 249.799 141.341 .000
Within Groups 2468.988 1397 1.767
Total 3218.385 1400Table 33 - One-way ANOVA: Familiarity with Expertise and Involvement
Post hoc analysis using Tukey subsets show that Familiarity has a greater positive effect with
Expertise (Table 34) than Involvement (Table 35). Each of the four familiarity levels give
statistically significant differences from each of the other familiarity levels.
Expertise - actual knowledge on cars
Tukey HSDa,b
Familiarity - None, Low,
Moderate, High N
Subset for alpha = 0.05
1 2 3 4
1 None - No Familiarity 49 1.82
2 Low – Searched for
Information
525 2.94
3 Moderate – Past Owner,
Shared or had use of
557 4.07
4 High – Current Owner 270 5.44
Sig. 1.000 1.000 1.000 1.000Table 34 - Mean Scores for Familiarity and Expertise

160
Involvement with cars
Tukey HSDa,b
Familiarity - None, Low,
Moderate, High N
Subset for alpha = 0.05
1 2 3 4
1 None - No Familiarity 49 2.18
2 Low – Searched for
Information
525 3.08
3 Moderate – Past Owner,
Shared or had use of
557 3.92
4 High – Current Owner 270 4.93
Sig. 1.000 1.000 1.000 1.000Table 35 - Means Scores for Familiarity and Involvement
6.4.4 Socio-Demographics RelationshipsIt was expected that Socio-Demographics would have a direct relationship with CPE e.g. high
levels of education with high levels of expertise.
An independent-samples t-test found that males had more Expertise and Involvement with
cars than females and more Familiarity with the Ford Focus: Expertise had a large
relationship (eta= .180); Involvement and Familiarity had medium relationships (eta= .64;
.119), (Table 36).
Independent samples T-Test - Group Statistics & Eta squaredGender
N MeanStd.
DeviationStd. Error
MeanEta
squaredExpertise - actualknowledge on cars
1 Male 827 4.42 1.559 .054 .180
2 Female 574 2.99 1.423 .059
Involvement with cars 1 Male 827 4.06 1.432 .050 .064
2 Female 574 3.28 1.516 .063
Familiarity - None, Low,Moderate, High
1 Male 827 2.98 .777 .027 .119
2 Female 574 2.41 .718 .030
Table 36 - T-test and Eta squared values: Male and Female with Expertise, Involvement and Familiarity
Comparisons with the remaining Socio-Demographics were run with One-way ANOVA
(Table 37). Statistically significant differences were found with all of the remaining Socio-
Demographics, except for the Area they lived in (p>.05), although actual differences in mean
scores between the groups were quite small; Eta squared values were close to or less than .01
(Table 38).

161
ANOVAF-values
Socio-Demographic Expertise Involvement FamiliarityAge Group 4.57 7.18 2.59Marital Status 3.53 3.91 4.99Lifecycle stage sig >.05 7.85 sig >.05Education sig >.05 3.67 2.94Household Income sig >.05 sig >.05 4.07Occupation 3.09 2.82 4.2Area you live in sig >.05 sig >.05 sig >.05
Table 37 – One-way ANOVA F-values: Socio-Demographics with Expertise, Involvement and Familiarity
ANOVAEta squared (.01 Small; .06 Medium; .14 Large)
Socio-Demographic Expertise Involvement FamiliarityAge Group 0.012 0.019 0.006Marital Status 0.007 0.008 0.009Lifecycle stage sig >.05 0.010 sig >.05Education sig >.05 0.007 0.006Household Income sig >.05 sig >.05 0.011Occupation 0.021 0.019 0.028Area you live in sig >.05 sig >.05 sig >.05
Table 38 – One-way ANOVA Eta squared values: Socio-Demographics with Expertise, Involvement and Familiarity
6.4.5 Car Ownership/Usage RelationshipsThis section is concerned with relationships of car ownership and usage. The questions were
a development of the Punj and Staelin (1983) research (Section 5.7.6). The expectation was
to find relationships with Expertise and Involvement, e.g. the more cars owned the greater the
Expertise.
The question on the Make of Current Car had to be modified from 10 groups to 9, this was
because the American group had only one case and prevented post-hoc ANOVA analysis,
therefore the American group was merged with the Other group. Three additional groups
were compiled from the data for comparison:
1. 4 Groups –All European; Asian; Japanese; Other
2. 2 Groups – Ford and All other makes
3. Top 5 in the UK – Ford; Vauxhall; Volkswagen; Audi; BMW

162
The dataset was combined for the first two groups and split using select cases in SPSS to run
the analysis for the third group.
One-way ANOVA found statistically significant differences (Table 39), although actual
differences in mean scores between the groups were quite small; Eta squared values indicated
small effects, some less than .01 (Table 40).
ANOVAF-values
Socio-Demographic Expertise Involvement9 Groups 4.399 4.6134 Groups sig >.05 3.3272 Groups 7.333 11.582Top 5 in UK 7.570 6.067
Table 39 - One-way ANOVA F-values: Make of Current Car Groups with Expertise and Involvement
ANOVAEta squared
Makes of Car Expertise Involvement9 Groups 0.024 0.0254 Groups sig >.05 0.0072 Groups 0.005 0.008Top 5 in UK 0.023 0.018
Table 40 - One-way ANOVA Eta squared values: Make of Current Car Groups with Expertise and Involvement
An inspection of multiple comparisons in the ANOVA output revealed only limited
significant differences (p<.05) between group items e.g., significant differences between
Expertise and Involvement exist with Volkswagen and BMW, but as can be seen from
Descriptives, n counts are too small to be able to draw any reliable generalisations (Table 41).

163
Descriptives
Make N1 Ford 11772 Vauxhall 243 Volkswagen 244 Audi 85 BMW 266 Other European 807 Asian 78 Japanese 379 Other 18Total 1401
Table 41 – Descriptives: Count of Make of Current Car – 9 Groups
Similar outcomes were found with the analysis output for Type of Current Car (Table 42).
Eta squared values indicated small effects.
ANOVAType of Car Comparisons
Expertise InvolvementEta squared 0.041 0.032F-value 10.133 17.243
Table 42 – One-way ANOVA F-values and Eta squared values: Type of Current Car with Expertise and Involvement
An inspection of multiple comparisons in the ANOVA output revealed only limited
significant differences (p<.05) between group items. In this output the means plots (Figure 20
and Figure 21) indicate strong positive relationships between Expertise and Involvement with
Sports Car users, which is something that most people might associate with such owners, but
as can be seen from Descriptives, n counts (Table 43), there are only 17 in this category and
is too small to be able to draw any reliable generalisations.

164
Figure 20 – Means Plot: Type of Current Car with Expertise
Figure 21 - Means Plot: Type of Current Car with Involvement

165
Descriptives
Type of Current Car N1 Small 701
2 Medium 430
3 Large 1184 Sports 175 4x4 SUV 686 People Carrier 587 Other 9Total 1401
Table 43 - Descriptives: Count of Type of Current Car
An independent-samples t-test was run to identify any differences between car owners that
purchased a new car or a used car with Expertise and Involvement. There were no significant
differences (p<.05). Similarly the results of a One-way ANOVA found no significant
differences in the Age of the Current Car with Expertise and Involvement, this was expected
as the criteria given for the data selection was Owners of new cars up to 4 years old, the
Descriptives n count show that only a small amount of data supplied fell outside this criteria
(Table 44). The pre-test results showed a large positive relationship between the Over 10 year
group and Expertise, however it was suggested that it may be because of necessity e.g.
carrying out their own repairs (Section 3.6.3).
Descriptives
Age of Current Car inYears N
1. 1 to 3 1177
2. 4 to 6 149
3. 7 to 10 474. Over 10 28Total 1401
Table 44 - Descriptives: Count of Age of Current Car in Years
Results of a One-way ANOVA comparing the Number of Cars Owned or Shared with
Expertise and Involvement found statistically significant differences (Table 39). Eta squared
values indicated a medium effect with Expertise. An inspection of multiple comparisons
revealed the Over 10 group was significantly different (P<.05), the means plot indicating a

166
positive relationship with Expertise (Figure 22). As can be seen from Descriptives, the Over
10 is the largest group (Table 46).
ANOVANumber of Cars Owned or Shared Comparisons
Expertise InvolvementEta squared 0.063 0.03F-value 31.57 14.566
Table 45 - One-way ANOVA F-values and Eta squared values: Number of Cars Owned or Shared with Expertise,and Involvement
Descriptives
Number of CarsOwned or Shared N
1. 1 to 3 153
2. 4 to 6 294
3. 7 to 10 3624. Over 10 592Total 1401
Table 46 - Descriptives: Count of Number of Cars Owned or Shared
Figure 22 - Means Plot: Number of Cars Owned or Shared with Expertise

167
A similar question to the Number of Cars Owned or Shared was asked: Number of different
Makes (Not Models) Owned or Shared, to compare differences. Results of a One-way
ANOVA found statistically significant differences (Table 47), although actual differences in
mean scores between the groups were quite small; Eta squared values indicated small effects.
Descriptives provide a breakdown of the categories (Table 48).
ANOVANumber of Different Makes Owned or Shared Comparisons
Expertise InvolvementEta squared 0.024 0.014F-value 11.857 6.764
Table 47 - One-way ANOVA F-values and Eta squared values: Number of Different Makes Owned or Shared withExpertise and Involvement
Descriptives
Number of Different MakesOwned or Shared N
1. 1 to 3 549
2. 4 to 6 549
3. 7 to 10 2004. Over 10 103Total 1401
Table 48 - Descriptives: Count of Number of Different Makes Owned or Shared
Punj and Staelin (1983, p372) suggested that the more cars owned “…captures a decision-
maker's desire to be exposed to new models…” (Section 5.7.6), this was not found to be the
case in this study, the more cars owned only revealed a moderate increase in Expertise and a
small increase in Familiarity. The difference in findings to the Punj and Staelin (1983) paper
is that their suggestion is based on qualitative research – no information is supplied to
indicate how many cars substantiate ‘the more cars owned’ whereas this research compared
quantitative data and found no justification for their suggestion. In addition differences may
be due to the different locations (US versus UK) and due to changes in attitudes over time.
It was also expected that consumers with high levels of Expertise and Involvement would
consider more makes and or more models when buying a car. Results of a One-way ANOVA
found statistically significant differences with the Number of Makes (Table 49), although
actual differences in mean scores between the groups were quite small; Eta squared values

168
indicated small effects. Descriptives indicate that most consumers (n=1073) considered 1 to 3
makes when buying their last car (Table 50).
ANOVANumber of Makes considered when buying last car Comparisons
Expertise InvolvementEta squared 0.020 0.010F-value 9.528 4.548
Table 49 – One-way ANOVA F-values and Eta squared values: Number of Makes considered when buying last carwith Expertise and Involvement
Descriptives
Number of Makes consideredwhen buying last car N
1. 1 to 3 1073
2. 4 to 6 289
3. 7 to 10 254. Over 10 14Total 1401
Table 50 – Descriptives: Count of Number of Makes considered when buying last car
Similar results were found for the Number of Models considered when buying their last car.
Results of a One-way ANOVA found statistically significant differences (Table 51), although
actual differences in mean scores between the groups were quite small; Eta squared values
indicated small effects. Descriptives indicate that most consumers (n=1117) considered 1 to 3
models when buying their last car (Table 52).
ANOVANumber of Models considered when buying last car Comparisons
Expertise InvolvementEta squared 0.015 0.006F-value 18.674 6.748
Table 51 - One-way ANOVA F-values and Eta squared values: Number of Models considered when buying last carwith Expertise and Involvement

169
Descriptives
Number of Models consideredwhen buying last car N
1. 1 to 3 1117
2. 4 to 6 231
3. 7 to 10 414. Over 10 12Total 1401
Table 52 - Descriptives: Count of Number of Models considered when buying last car
It was expected that for consumers with high expertise and/or involvement, their reasons for
changing their last car would be to obtain a newer model. Results of a One-way ANOVA
found statistically significant differences for the Reasons for changing their last car (Table
53), although actual differences in mean scores between the groups were quite small; Eta
squared values indicated small effects. Descriptives provide a breakdown of the categories
(Table 54).
ANOVAReason for Changing Last Car Comparisons
Expertise InvolvementEta squared 0.030 0.034F-value 14.707 13.801
Table 53 - One-way ANOVA F-values and Eta squared values: Reason for Changing Last Car with Expertise andInvolvement
Descriptives
Reason for Changing Last Car N1 First car - not changing 40
2 I had a car but needed one more 31
3 I just fancied a new car. 2014 Needed car for a different purpose 1495 Best to change every 2 to 3 years 2446 More economy e.g. mpg, Co2 emissions 1277 I wanted a smaller car 688 Old car became uneconomic to run and repair 2909 To get a newer model (including changing to another brand) 251Total 1401
Table 54 - Descriptives: Count of Reason for Changing Last Car

170
If respondents gave the reason to change was to get a newer model, they were asked what
was new about it. Results of a One-way ANOVA found statistically significant differences
(Table 55). Eta squared values indicated a small effect with Involvement. An inspection of
multiple comparisons revealed Style & Design and On Board Equipment was significantly
different (p<.05), the means plot indicating a positive relationship with Involvement (Figure
23). Descriptives provide a breakdown of the categories (Table 56).
ANOVAIf reason to change was to get a new model, what was new about
it? ComparisonsExpertise Involvement
Eta squared sig >.05 0.015F-value sig >.05 7.061
Table 55 – One-way ANOVA F-values and Eta squared values: If reason to change was to get a new model, what wasnew about it? With Expertise and Involvement
Descriptives
If reason to change was to get a new model, what wasnew about it? N
1 Style & Design 261
2 Functionality 365
3 On Board Equipment 584 Post Purchase Offerings 44Total 728
Table 56 - Descriptives: Count of: If reason to change was to get a new model, what was new about it?

171
Figure 23 – Means Plot: If reason to change was to get a new model, what was new about it?
In summary for this section, the expectation was to find relationships between Car
Ownership/ Usage with Expertise and Involvement. There are significant differences with
some makes and types of car but the n counts were too small to be able to draw any reliable
generalisations.
Contrary to the assumption by Punj and Staelin (1983) that the more cars owned was an
indicator of high Involvement, this was not found to be the case, whereas there was a
relationship with Expertise, particularly for the over 10 or more cars group. This indicates
that Expertise is gained from product exposure.
It was also expected that consumers with higher levels of expertise and involvement would
consider more makes and/or models when buying a car, the findings show that most
customers only considered 1 to 3 makes and/or models when they bought their last car.
Reasons for buying a new car reveal that Style and Design and On Board Equipment was
significantly different and showed a positive relationship with Involvement; no relationships
were found with expertise.

172
The descriptives provide some interesting insights into Car Ownership/ Usage, but no
significant relationships in the measurement of Expertise and Involvement. What can be said
is that Expertise is gained through product exposure and that those with high Involvement are
attracted to the emotional pull of the design and gadgetry of the product rather than the
practical aspects.
6.4.6 Product Information RelationshipsThis section looks at relationships with product information. The analysis investigated
relationships between Information Sources Used by consumers when they look for a new or
newer car and the measures of CPE (Expertise and Involvement). It also sought to establish
correlations between Information Sources Used and Previous Awareness Source - the source
of a consumer’s prior awareness of the Ford Focus options. Colour highlights are provided
for ease of identification.
The first part of the analysis investigated Information Sources Used – Internal; Personal;
Mass-Media; Internet; Retailer (Section 5.7.7). Results from Pearson correlations (Table 57)
identified that Internal information sources had a large positive relationship with Expertise (r
=.550) and a medium positive relationship with Involvement (r=.457). Mass Media had a
large positive relationship with Involvement (r=.511) and a medium positive relationship
with Expertise (r=.490). The Internet had medium positive relationships with Expertise and
Involvement (r =.489; r=.435). Personal and Retailer information sources had small positive
relationships that were not significantly different from zero.
Correlations Matrix – Large Medium
Scale 1 2 3 4 5 6 7
1. Expertise – actual knowledge on cars -
2. Involvement with cars .795 -
3. Internal – Information source used .550 .457 -
4. Personal – Information source used .099 .147 .186 -
5. Mass Media – Information source used .490 .511 .391 .413 -
6. Internet – Information source used .489 .435 .367 .279 .544 -
7. Retailer – Information source used .167 .196 .346 .101 .285 .315 -
n=1401, p < .001 (2-tailed)
Table 57 - Pearson Correlation: Information Sources Used with Measures of Consumer Product Experience

173
The second part of the analysis investigated Previous Awareness Sources of Information.
Respondents only needed to answer this question if they had been aware of the Ford Focus
options prior to viewing the product videos. Respondents had six options to indicate the
source of their awareness:
1. Newspaper or magazine advert
2. Newspaper or magazine article
3. TV advert
4. Online internet information
5. Manufacturer or Dealer mailshot
6. Word of mouth e.g. from a friend etc.
Non-responses were coded with a zero (0): No Previous Awareness to enable ANOVA
analysis to be carried out, if this group was omitted it would have reduced the F-value
significantly and made interpreting the output more difficult because there would be no
baseline for comparisons. Results of a One-way ANOVA found statistically significant
differences with Previous Awareness Sources of Information and Expertise, Involvement and
Familiarity. A matrix provides the F-value and Eta squared values (Table 58).
Note that whilst Eta squared values are provided and indicate a number of small, medium and
large effects; they are influenced by including the No Previous Awareness group. In
particular, it is not possible for that group to have any correlation with the sources of
information e.g. TV advert. The significant differences in the Previous Sources of
Information between the other groups were identified by inspecting the multiple comparisons
output (Table 58), but the bulk of effects are from No Previous Awareness.

174
ANOVA Matrix
Expertise Involvement Familiarity
OptionEta
squared
F-value Eta
squared
F-value Eta
squared
F-value
Blind Spot Information
System0.082 20.848 0.048 11.866 0.143 38.783
Traffic Sign Recognition 0.126 33.529 0.078 19.775 0.204 59.614
Low Speed Safety System 0.133 35.706 0.081 20.402 0.189 53.999
Active Park Assist 0.079 19.904 0.047 11.42 0.152 41.685
Torque Vectoring Control sig>.05 sig>.05 sig>.05 sig>.05 sig>.05 sig>.05
Ford Eco Boost 0.146 39.63 0.09 22.973 0.21 61.652
Power Start Button 0.072 18.004 0.041 9.945 0.092 23.411
Lane Departure Warning sig>.05 sig>.05 sig>.05 sig>.05 sig>.05 sig>.05
Lane Keeping Aid sig>.05 sig>.05 sig>.05 sig>.05 sig>.05 sig>.05
Driver Alert 0.055 13.634 0.026 6.17 0.01 25.822
Auto High Beam 0.099 25.517 0.063 15.565 0.15 40.869
p<.05
Table 58 - One-way ANOVA Matrix: Previous Awareness Source (for the options) with Expertise, Involvement andFamiliarity
Inspection of the ANOVA multiple comparisons output identified which Previous Awareness
Sources of Information items were significantly different (p<.05), the items and means were
combined in a matrix (Table 59).

175
One-Way ANOVA Multiple Comparisons - Significant DifferencesExpertise Involvement Familiarity
Previousawareness
Source Mean
Previousawareness
Source Mean
Previousawareness
Source MeanBlind SpotInformationSystem
Significantvariation
between:
Word of mouth 3.99 ns ns ns nsNewspaper orMagazine Article 4.65 ns ns ns ns
Traffic SignRecognition
Significantvariation
between:
Word of mouth 3.89 ns ns ns nsOnline Internetinformation 4.59 ns ns ns ns
Low Speed SafetySystem
Significantvariation
between:
Word of mouth 3.88 Word of mouth 3.59 ns nsNewspaper orMagazine Article 4.61 Online Internet
information 4.28 ns ns
Significantvariation
between:
TV Advert 3.84 Word of mouth 3.59 ns nsOnline Internetinformation 4.57 Manufacturer or
Dealer Mailshot 4.24 ns ns
Active Park Assist
Significantvariation
between:
Word of mouth 3.43 Word of mouth 3.38 TV Advert 2.67Newspaper orMagazine Article 4.62 Online Internet
information 4.13 Newspaper orMagazine Article 3.06
Significantvariation
between:
Word of mouth 3.43 TV Advert 3.72 ns nsOnline Internetinformation 4.53 Online Internet
information 4.13 ns ns
Significantvariation
between:
TV Advert 3.72 ns ns ns nsNewspaper orMagazine Article 4.62 ns ns ns ns
Significantvariation
between:
TV Advert 3.72 ns ns ns nsOnline Internetinformation 4.53 ns ns ns ns
Torque VectoringControl
No significantvariations n/a n/a ns ns ns ns
Ford Eco Boost
Significantvariation
between:
Manufacturer orDealer Mailshot 4.16 Word of mouth 3.63 ns nsNewspaper orMagazine Article 4.86 Newspaper or
Magazine Article 4.43 ns ns
Significantvariation
between:
TV Advert 4.17 ns ns ns nsNewspaper orMagazine Article 4.86 ns ns ns ns
p<.05 ns = not significantTable 59- One-Way ANOVA Multiple Comparisons: Significant Differences with Options and Previous AwarenessSource (continued on next page)

176
Power StartButton
Significantvariation
between:
TV Advert 3.80 Word of mouth 3.55 TV Advert 2.72Newspaper orMagazine Article 4.73 Newspaper or
Magazine Article 4.14 Newspaper orMagazine Article 2.83
Significantvariation
between:
Word of mouth 3.53 Word of mouth 3.55 ns nsNewspaper orMagazine Article 4.73 Online Internet
information 4.06 ns ns
Significantvariation
between:
TV Advert 3.80 Word of mouth 3.55 ns nsOnline Internetinformation 4.47 Manufacturer or
Dealer Mailshot 3.98 ns ns
Significantvariation
between:
Manufacturer orDealer Mailshot 4.08 ns ns ns nsNewspaper orMagazine Article 4.73 ns ns ns ns
Significantvariation
between:
Word of mouth 3.53 ns ns ns nsOnline Internetinformation 4.47 ns ns ns ns
Significantvariation
between:
Word of mouth 3.53 ns ns ns nsManufacturer orDealer Mailshot 4.08 ns ns ns ns
Lane DepartureWarning
No significantvariations ns ns ns ns ns ns
Lane Keeping Aid No significantvariations ns ns ns ns ns ns
Driver Alert No significantvariations ns ns ns ns ns ns
Auto High Beam
Significantvariation
between:
TV Advert 3.55 ns ns ns nsNewspaper orMagazine Article 4.94 ns ns ns ns
Significantvariation
between:
Word of mouth 4.00 ns ns ns nsNewspaper orMagazine Article 4.94 ns ns ns ns
p<.05 ns = not significantTable 59 (continued) - One-Way ANOVA Multiple Comparisons: Significant Differences with Options and PreviousAwareness Source
Further relationships were considered to identify relationships between the Information
Sources Used by consumers when they look for a new or newer car and Previous Awareness
Sources of Information. However, it is not possible to run any statistical analysis unless all of
the Ford Focus options had been advertised across all the sources, whereas this was not the
case. For example, whilst the Ford Focus options were discussed in newspaper and magazine
articles none of the options were placed as adverts.
Attempts were made to identify the main overall source used for Previous Awareness Sources
of Information by taking the Mode and Median values, however some sources only had two
responses, making Mode impossible. Similarly Median gave middle values e.g. 4.5, meaning

177
it has no category as it this is halfway between 4 - Online internet information and 5-
Manufacturer or Dealer mailshot.
A clearer picture of the Previous Awareness Source for the Ford Focus options is provided by
a frequency matrix (Table 60). The matrix reveals that those with No Prior Awareness had
high frequencies across most categories. It also reveals that the highest source was a TV
Advert for the Active Park Assist and Power Start Button options (Table 60 – highlighted in
green). Ford did run TV adverts when the Ford Focus was launched; both options were
shown in the adverts which featured Active Park Assist.
Crosstabulation
Option No PreviousAwareness
Newspaperor Magazine
Advert
Newspaperor Magazine
ArticleTV Advert
OnlineInternet
Information
Manufactureror DealerMailshot
Word ofmouth e.g.from friend
etc.
Blind SpotInformation System 775 55% 29 2% 105 7% 34 2% 201 14% 150 11% 107 8%
Traffic SignRecognition 747 53% 21 1% 101 7% 41 3% 234 17% 168 12% 89 6%Low Speed SafetySystem 674 48% 16 1% 127 9% 49 3% 271 19% 164 12% 100 7%
Active Park Assist 58 4% 25 2% 85 6% 744 53% 142 10% 209 15% 138 10%Torque VectoringControl 983 70% 15 1% 67 5% 8 1% 199 14% 68 5% 61 4%
Ford Eco Boost 528 38% 27 2% 96 7% 186 13% 186 13% 300 21% 78 6%
Power Start Button 210 15% 35 2% 81 6% 453 32% 144 10% 264 19% 214 15%Lane DepartureWarning 985 70% 22 2% 100 7% 26 2% 184 13% 23 2% 61 4%
Lane Keeping Aid 1054 75% 18 1% 59 4% 13 1% 182 13% 25 2% 50 4%
Driver Alert 1026 73% 24 2% 44 3% 25 2% 189 13% 30 2% 63 4%
Auto High Beam 903 64% 14 1% 95 7% 20 1% 188 13% 110 8% 71 5%Table 60 – Crosstabulation: Ford Focus with Previous Awareness Source
Further investigation of the TV advert for Active Park Assist was carried out using the SPSS
split cases method, this allowed cross-tabulation comparisons of Expertise, Involvement and
Familiarity. Cross-tabulations (Table 61 and Table 62) show split case totals as well as total
cases to indicate the percentages for those that responded to being previously aware of the
Active Park Assist option through a TV advert; bar charts provide a graphical representation
of the output. The output suggests that Familiarity with the Ford Focus is the key factor for
previous awareness of this option, even for those with low Expertise and Involvement. In
Section 6.4.3 Familiarity was found to have a positive moderating effect on CPE (Expertise

178
and Involvement), whilst this is evident the evidence from the crosstabulation suggests that
Familiarity is also a CPE variable in the context of experience of a specific product.
The Split to Total Cases output in Table 61 and Table 62 show there is a good proportion for
each category.
Split Groups - Active Park Assist TV Advert Crosstabulation - Familiarity * Expertise - actual knowledge on carsCountActive Park Assist - previous awareness source -TV Advert
Expertise - actual knowledge of carsSplit
CasesTotalCases
Splitto
TotalCases
1 LowExpertise 2 3 4 5 6 7 High
Expertise3 TVAdvert
Familiarity- None,Low,Moderate,High
1 None - No Familiarity 9 4 0 1 0 0 0 14 49 29%
2 Low Familiarity –Searched for Information 46 91 76 67 37 8 1 326 525 62%
3 Moderate Familiarity –Past Owner, Shared orhad use of
11 28 58 67 84 45 2 295 557 53%
4 High Familiarity –Current Owner 0 7 14 9 20 35 24 109 270 40%
Split Cases 66 130 148 144 141 88 27 744 1401 53%
Total Cases 111 240 266 279 244 183 78
Split to Total Cases 59% 54% 56% 52% 58% 48% 35%Table 61 - Crosstabulation: Active Park Assist - TV Advert with Familiarity and Expertise
Figure 24 – Bar Chart: Active Park Assist - TV Advert with Familiarity and Expertise

179
Split Groups - Active Park Assist TV Advert Crosstabulation - Familiarity * Involvement with carsCountActive Park Assist - previous awarenesssource - TV Advert
Involvement with carsSplit
CasesTotalCases
Splitto
TotalCases
1 LowInvolvement 2 3 4 5 6 7 High
Involvement
3 TVAdvert
Familiarity- None,Low,Moderate,High
1 None - No Familiarity 4 7 0 2 1 0 0 14 49 29%2 Low Familiarity –Searched forInformation
41 78 76 77 38 14 2 326 525 62%
3 Moderate Familiarity– Past Owner, Sharedor had use of
12 24 53 91 82 32 1 295 557 53%
4 High Familiarity –Current Owner 2 11 9 13 37 25 12 109 270 40%
Split Cases 59 120 138 183 158 71 15 744 1401 53%Total Cases 112 226 258 332 291 157 25Split to Total Cases 53% 53% 53% 55% 54% 45% 60%
Table 62 - Crosstabulation: Active Park Assist - TV Advert with Familiarity and Involvement
Figure 25 - Bar Chart: Active Park Assist - TV Advert with Familiarity and Involvement
Table 63 summarises the Information Sources Used relationships. A large correlation exists
between Mass Media and Involvement; this is corroborated by the findings that 60% of those
with 7 - High Involvement also had Previous Awareness through the TV advert source (Table
61 ). In comparison Expertise shows a large correlation with Internal sources of information
(Table 63); whereas only 35% of those with 7 - High Expertise also had Previous Awareness
through the TV advert source (Table 62), indicating that they do rely heavily on their own
Internal knowledge. Therefore, Table 63 is a reliable representation of the preferences of
Information Sources Used by those with Expertise and Involvement.

180
In addition the evidence suggests that Familiarity is not only a moderator of CPE, but also a
variable of CPE in its own right.
Information Sources Used by consumers whenthey look for a new or newer car
LargeCorrelation
MediumCorrelation
SmallCorrelation
ExpertiseInternal Internet Retailer
Mass Media
Involvement Mass Media Internal RetailerInternet Personal
Table 63 - Information Sources Used Summary
In summary for this section, the product information relationships suggest the information
sources used by consumers differ according to their Expertise and Involvement when they
look for a new or newer car.
6.4.7 Most Important Aspect of Car PurchaseThis section is concerned with the Most Important Aspect of Car Purchase when deciding
which cars consumers would consider. The items were grouped into three factors:
environment, performance and convenience and compared with Expertise, Involvement and
Familiarity.
Results from Pearson correlations (Table 64) identified that Performance had a medium
positive relationship with Expertise (r =.456) and a large positive relationship with
Involvement (r=.055). Convenience had small, but still statistically significant, positive
relationships with Expertise and Involvement.

181
Correlations Matrix – Large MediumScale 1 2 3 4 5
1. Expertise – actual knowledge on cars -
2. Involvement with cars .795 -3. Environment sig >.05 sig >.05 -4. Performance .456 .550 .061 -5. Convenience .109 .124 .167 .337 -n=1401, p < .001 (2-tailed)
Table 64- Pearson Correlation: Most Important Aspect of Car Purchase with Measures of Consumer ProductExperience
6.4.8 New Product Complexity (NPC)NPC is the outcome of a number of constructs and moderators, a latent variable that cannot
be measured directly. Firstly, it was proposed in the conceptualisation of the study
(CHAPTER: 4) that Expertise and Involvement were the independent variables that formed
the dependent variable CPE. Secondly, it was proposed that Socio-Demographics are
intervening variables that moderate CPE and Familiarity. Lastly, NPC is the presumed result
of moderated CPE and the intervening variables of Familiarity and Product Information. NPC
in turn is the basis on which a consumer is able to evaluate new product innovations and
establish a Consumer Categorisation of Innovation (CCI) – in this study that relates to an
assessment of the Ford Focus options.
The first part of the CCI evaluation is for the consumer to establish if they know what the
options are, failure at this stage brings the evaluation to a halt, if not this is followed by
subsequent appraisals as to their view of a products complexity, innovativeness and newness
before they establish if they like the product and finally decide if they would buy the product.
The results of the CCI variables are given in Section 6.4.10.
6.4.9 Complexity RatingsThese ratings are different to NPC, these variables measure a consumer’s perceived
complexity of the Ford Focus as part of the CCI appraisal process. Respondents were asked
to rate the complexity of each of the eleven Ford Focus options, these were combined to
provide an overall average complexity rating for the Ford Focus. This enabled comparison
with complexity ratings obtained from Manufacturer Experts (Ford Advanced Product

182
Group) and Retailing Experts (Ford Retail Dealership) on the Ford Focus options. They were
asked to measure how complex each option would be from the perspective of the consumer
on a 7-point Likert scale, 1 = Low Complexity to 7 = High complexity. The same measures
were used in the main consumer survey; this allowed comparisons of complexity perceptions,
as shown in Figure 26.
Results reveal differing perceptions, trends are similar but consumers thought the options
were more complex than the retailing experts, who in turn thought they were more complex
than the manufacturer experts. This might be expected because of the day to day involvement
and familiarity with complex innovations. When the scores are added for all the option
ratings to provide an overall complexity rating for the Ford Focus, the manufacturer experts
complexity rating is 2, retailing experts 3 and consumers 5. This supports the findings from
the literature review that consumers and manufacturers have differing views of complexity
(Section 2.3.2). The averages were round to the nearest whole number for ease of
identification and comparison.
Figure 26 - Complexity Perceptions of Ford Focus Options

183
6.4.10 Consumer Categorisation of InnovationThis section seeks to establish relationships with CCI and NPC. CCI is a combination of
consumer perceptions of a products Newness, Complexity and Innovativeness, and whether
they Know the options, Like the options and/or if they would Buy the option. The final three
options are identified as Knows, Likes, Buy in the analysis. The summary of the variables are
as follows:
Newness
Complexity
Innovativeness
Knows
Likes
Buy
Respondents were asked to rate the eleven Ford Focus options on each of these variables, the
responses were combined to provide an overall average rating for each variable. This enabled
comparison with the NPC variables.
It was suspected that the high awareness of the TV Advert - Previous Awareness Source -
for the Active Park Assist option may skew the overall average for the Knows the options
variable, therefore the Mode was also calculated for this variable to identify differences.
Colour highlights are provided for ease of identification.
Results from a One-way ANOVA identified that Knows the options Average had large
positive relationships with Expertise , Involvement and Familiarity, in comparison results for
Knows the options Mode show a reduction in the size of the relationship; Involvement
indicating a medium positive relationship (Table 65).

184
Correlations Matrix – Large Medium
Scale 1 2 3 4 5
1. Expertise – actual knowledge on cars -
2. Involvement with cars .795 -
3. Familiarity .590 .482 -
4. Knows the options - Average .617 .507 .951 -
5. Knows the options - Mode .533 .416 .824 .864 -
n=1401, p < .001 (2-tailed)
Table 65 - Pearson Correlation: Knows the Options with Measures of New Product Complexity
A partial correlation to explore the relationships between Familiarity and Knows the options
whilst controlling for Expertise, showed only a small decrease in the strength of the
correlations: from .951 to .923 for Knows the options Average and .864 to .804 for Knows
the options Mode, suggesting that Expertise had very little effect on the strength of the
relationship between these two variables.
The results suggest that Familiarity has the largest relationship with Knows the options, a
clearer picture of this is provided by a One-way ANOVA. Statistically significant differences
were found for the four levels of Familiarity with Knows the options Average (F= 4461.735,
p < .001), similarly for Knows the options Mode (F=1156.428, p<.001). Eta squared values
indicate very large effects: Knows the options Average (eta = .905) and Knows the options
Mode (eta = .712). Post-hoc comparisons using the Tukey HSD test reveal significant
changes in mean values (Table 66 and Table 67). As expected, the output suggests that the
TV Advert did affect the Knows the options Average scores for Low Moderate and High
categories, in particular the Low category who had searched for information, the likelihood
being that they noticed the TV advert more than any others. The findings are a strong
indicator of the positive effect of providing product information through a mass media source
of this nature.
Tukey subsets show that each of the four familiarity levels give statistically significant
differences from each of the other familiarity levels for Table 66 and Table 67. However, the
mean scores for Knows the Options- Average (Table 66) are much lower than those shown

185
for Knows the Options – Mode (Table 67). This supports the suggestion that the TV advert
biased the results and the more reliable comparison is Knows-the Options – Mode.
Knows the options - Average
Tukey HSDa,bFamiliarity - None, Low, Moderate, High
N
Subset for alpha = 0.05
1 2 3 41 None - No Familiarity 49 1.002 Low – Searched for Information 525 2.563 Moderate – Past Owner, Shared orhad use of
557 4.51
4 High – Current Owner 270 6.34Sig. 1.000 1.000 1.000 1.000
Table 66 - Mean Scores for Familiarity and Know the Options Average
Knows the options - Mode
Tukey HSDa,bFamiliarity - None, Low, Moderate, High
N
Subset for alpha = 0.05
1 2 3 41 None - No Familiarity 49 1.002 Low – Searched for Information 525 1.623 Moderate – Past Owner, Shared orhad use of
557 4.92
4 High – Current Owner 270 6.85Sig. 1.000 1.000 1.000 1.000
Table 67 - Mean Scores for Familiarity and Know the Options Mode
An independent-samples t-test found that males had a higher mean than females for Knows
the options Average (eta = .136) and Knows the options Mode (eta = .116), (Table 68).
Independent samples T-Test - Group Statistics & Eta squared
Gender N Mean Std.Deviation
Std.ErrorMean
Etasquared
Knows the Options -Average
1 Male 827 4.48 1.534 .053 .136
2Female
574 3.32 1.374 .057
Knows the Options -Mode
1 Male 827 4.61 2.380 .083 .116
2Female
574 2.92 2.240 .094
Table 68 - T-test and Eta squared values: Male and Female with Knows the Options – Average and Mode

186
The relationships of the three components of CCI: Newness, Complexity and Innovativeness,
and the three components of NPC: Expertise, Involvement and Familiarity were explored.
The results are given in a Pearson Correlations matrix (Table 69); the output of correlations
between Expertise, Involvement and Familiarity are excluded for ease of identification; they
have been reported several times in previous analysis (Table 33; Table 34; Table 35; Table
59; Table 61; Table 62). Colour highlights are provided for ease of identification.
Results identified large negative relationships between Involvement and Complexity;
Expertise and Complexity - as Expertise and Involvement increases, Complexity decreases. A
similar medium negative relationship was found with Familiarity and Complexity. The
evidence suggests that consumers with higher levels of Expertise, Involvement and
Familiarity perceived the Ford Focus as less complex.
The results also suggest that consumers with higher levels of Expertise and Familiarity did
not view the Ford Focus as being a new model as small negative relationships were found
with Expertise and New – average and also Familiarity and New – average, but not
Involvement and New – average. The reasons for this are unclear, one possibility is that
respondents with high Familiarity may have been comparing changes between the new and
old model and those with High Expertise had seen the options before in other products, in
both cases this did not manifest itself as a negative relationship with the innovative aspect of
the product, one possibility is that although the Ford Focus was not seen as being new, the
consumer still perceived it as being innovative. Conversely, products can be viewed as being
new, e.g. not seen before, but not necessarily innovative. In this study the findings for the
innovative variable revealed a large positive relationship between New – average and
Innovative – average.

187
Correlations Matrix – Large Medium Small
Expertise -actual
knowledgeon cars
Involvementwith cars
Familiarity -None, Low,Moderate,
HighNew -
averageComplexity
- averageNew - average -.174 -.085 -.221 - -Complexity - average -.676 -.857 -.394 sig>.05 -
Innovative - average sig>.05 sig>.05 -.067 .791 -.085
n=1401, p < .001 (2-tailed)
Table 69 - Pearson Correlation: Measures of Consumer Categorisation of Innovation with Measures of New ProductComplexity
The relationships of the two remaining components of CCI: Likes and Buy, and three
components of NPC: Expertise, Involvement and Familiarity were explored. The results are
given in a Pearson Correlations matrix (Table 70); the output of correlations between
Expertise, Involvement and Familiarity are excluded for ease of identification; they have
been reported several times in previous analysis (Table 33; Table 34; Table 35; Table 59;
Table 61; Table 62). Colour highlights are provided for ease of identification.
Although negative relationships are shown for expertise involvement and familiarity the R-
values are <.10 and are not significant. However, there is a large positive relationship
between Likes and Buy.
Correlations Matrix – LargeExpertise -
actualknowledge on
cars
Involvementwith cars
Familiarity -None, Low,
Moderate, HighLikes
Likes -0.069 -0.074 -0.055 -
Buy sig>.05 sig>.05 sig>.05 0.715n=1401, p < .001 (2-tailed)
Table 70 - Pearson Correlation: Likes and Buy with Measures of New Product Complexity
Relationships were also explored for Likes, Buy, Newness, Complexity and Innovativeness
using Pearson Correlation, but no relationships were found (sig>.05).

188
During the survey no reference was made to the cost of any of the Ford Focus options,
however at the end of the survey this information was provided. All the options were sold as
a complete pack price. During the research with the Discussion Groups, participants had been
interested in the cost (Section 3.5.3), this was accommodated in the main survey.
Respondents were provided with the price and they were asked: ‘Now knowing what the
options are would you buy the options pack?’ (Yes/No) - 66.1% of respondents said they
would buy the options pack.
An independent-samples t-test compared the question with the Likes the option and Buy the
option variables, a relationship was not found (sig>.05). If a relationship had been found this
would have provided triangulation to Likes and Buys; whereas this was not the case. This is
the same as findings in the discussion groups, when participants were asked if they would
buy the options individually, most said they would not, yet when the price was finally
revealed all participants said they would buy the options, when probed as to why, they all
said that they thought they were good value, this suggests that this may also have been the
case with the respondents of the main survey.
6.4.11 LISRELFinally, to confirm the theoretical factor structure, and establish goodness of fit, structural
equation modelling (SEM) using LISREL was used to apply confirmatory factor analysis
(Kelloway, 1998).
Constructs used in the model (Figure 27) are as follows:
Measures of Consumer Product Experience (CPE) – Expertise, Involvement and
Familiarity
Measures of Product Information – Information Sources Used (INFOSOUR) and
Previous Awareness Source for each option (AWARENES)
Measures of Consumer Categorisation of Innovation (CCI) - Know the options; Likes
the options; Buy the options; Complexity; Newness; Innovativeness.

189
LISREL (SIMPLIS) Structural Equations Model (Confirmatory Factor Analysis)
Figure 27 - LISREL: Confirmatory Factor Analysis

190
Although RMSEA is larger than .10 the reduced chi-squared statistic is 24.41 (chi-squared
divided by the number of degrees of freedom – Bartlett, 1954); guidelines suggest that <100
is a good match between the model and data; the smaller the better (Sharma, 1996; Byrne,
1998; Hair et al., 2010). Goodness of fit statistics were acceptable; GFI = 0.727.
As can be seen from the output none of the items load on more than one latent variable
making the causal relationships unidimensional. All the items in the model were retained,
including the negative loadings in the CCI variable as the model would not converge with
their removal.
Confirmatory factor analysis shows that the theory driven structure of the research is justified
and that the small set of latent variables are a good fit of the larger set of underlying observed
variables. It pulls together all the individual statistical analysis that was carried out with SPSS
and completes the findings by providing a sound structural model. The conclusion is that the
questions and constructs are reliable and valid, and measure what they are supposed to
measure.
6.5 PRODUCT VIDEOS AND TV ADVERTS RESULTSThis section discusses the results and findings of the research into consumer preferences for
product video and TV adverts detailed in the methods section (Section 5.11.2). The reason for
this part of the research is that it links to all the previous findings and serves as a helpful way
in evaluating the outcomes in practical situations.
The research was carried out with the established Automotive Research Panel (Section 5.9.4).
The purpose of the survey was to investigate consumer perceptions of TV adverts and
product videos. There were 150 responses from the panel of 178 members resulting in a high
response rate 84%, this is likely because the respondents had previously consented to join a
research panel and therefore interest and participation is likely to be strong.
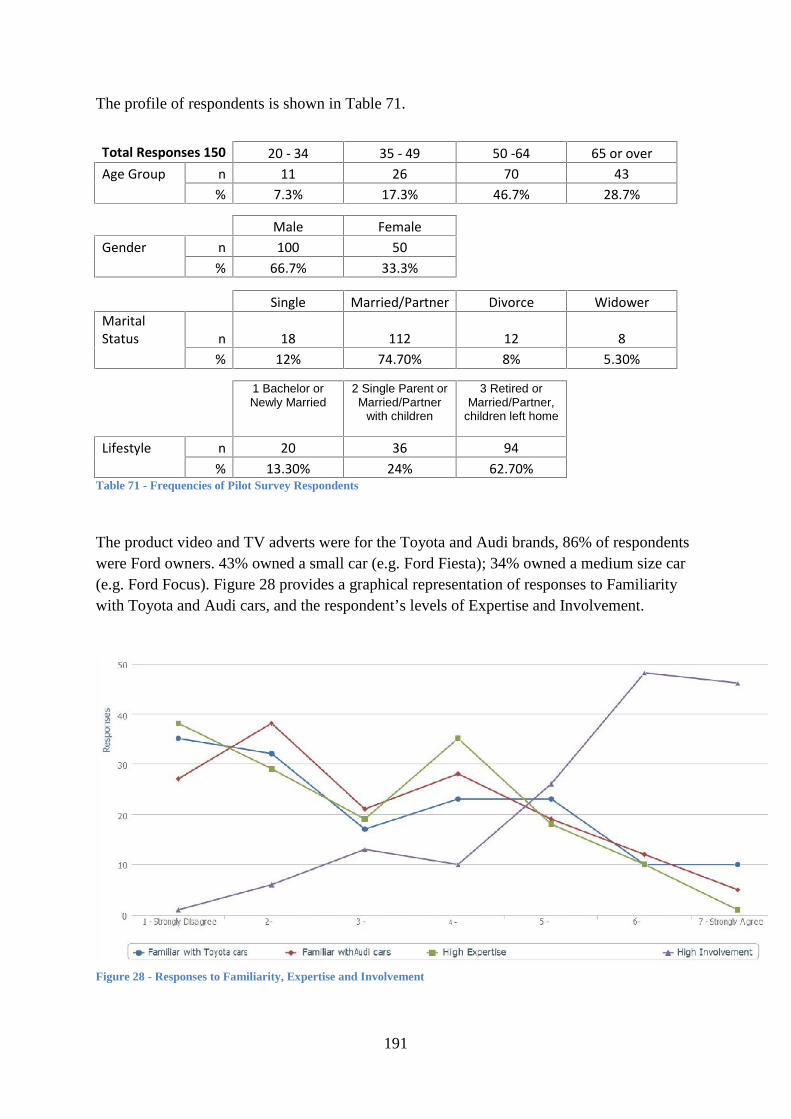
191
The profile of respondents is shown in Table 71.
Total Responses 150 20 - 34 35 - 49 50 -64 65 or overAge Group n 11 26 70 43
% 7.3% 17.3% 46.7% 28.7%
Male FemaleGender n 100 50
% 66.7% 33.3%
Single Married/Partner Divorce WidowerMaritalStatus n 18 112 12 8
% 12% 74.70% 8% 5.30%
1 Bachelor orNewly Married
2 Single Parent orMarried/Partner
with children
3 Retired orMarried/Partner,
children left home
Lifestyle n 20 36 94% 13.30% 24% 62.70%
Table 71 - Frequencies of Pilot Survey Respondents
The product video and TV adverts were for the Toyota and Audi brands, 86% of respondentswere Ford owners. 43% owned a small car (e.g. Ford Fiesta); 34% owned a medium size car(e.g. Ford Focus). Figure 28 provides a graphical representation of responses to Familiaritywith Toyota and Audi cars, and the respondent’s levels of Expertise and Involvement.
Figure 28 - Responses to Familiarity, Expertise and Involvement

192
Figure 28 shows that most of the respondents were not high in Expertise, but most of them
had high Involvement. This is another indicator for such a high response rate of 84%, and that
those with high Involvement have a strong willingness to participate in research.
As another way of evaluating practical situations, participants were asked for their
perceptions and views in response to the viewing of a Toyota TV advert and a Toyota
Product Video. Findings revealed that 69.3% thought the product video appealed the most;
the most typical reason given was that it was more interesting and gave you information.
Other responses revealed the following:
63.3% would prefer to see the Toyota product video on TV
The most typical reason given was that it gave you more information.
Figure 29 reveals that most respondents thought the Toyota TV advert was easy to understand
(scoring 1 to 3), in comparison most respondents thought the Toyota product video was a bit
more complex to understand (scoring 3 to 5)
Figure 29 - Responses to the perceived complexity of the Toyota TV advert and Toyota product video
The Audi video, was about new technology, but only three people actually named some (not
all) of the features showed. Two of those three were not experts, but scored the maximum (7)
for involvement. Most respondents thought the Audi video was fairly difficult to understand

193
(scoring 6 to 7 – see Figure 30), one commented “You had to know what features were being
shown to understand what the car was actually doing”, another commented “I didn't
understand it at all. I have always presumed that adverts like this are for cars that are not
meant for me!”
Figure 30 - Responses to the perceived complexity of the Audi TV advert
6.6 DISCUSSION OF ANALYSIS FINDINGSThis section presents a discussion of the findings of the statistical analysis and the
relationships between the independent, dependent and the intervening variables.
6.6.1 ConstructsCronbach alpha results compared well with previous studies and the evidence suggests good
construct reliability. This is supported by SEM results which confirmed a good match
between the model and data (Section 6.4.11) with none of the items loading on more than one
latent variable making the causal relationships unidimensional. More in-depth and detailed
insights were provided by the SPSS data analysis (6.4) and qualitative feedback from the
online surveys (Section 6.5) to give support for construct validity.
The Expertise scale provides a good measure to identify the level of technical knowledge
held by novices and experts; this was cross-validated by triangulation. The findings reflect
the view that consumer expertise is the accumulation of expert knowledge (Zaichkowsky,

194
1985a; Alba and Hutchinson, 1987; Gregan-Paxton and John, 1997; Novick, 1998; Kleiser
and Mantel, 1994, 1999).
Similarly the Involvement scale provided a good measure of the keen interest shown in a
product; this was cross-validated by triangulation. The results indicate that consumer
involvement of this nature accumulate knowledge because of the interest in the product.
Those with high involvement may know what the new innovations do, but not necessarily
how they work. The results support previous findings (Bloch, 1981; Shimp and Sharma,
1983; Lennox and MaClaren, 2003; Kassubeck et al., 2011). The results also show positive
relationships exist between Involvement and Expertise; Expertise increases pro-rata to the
Involvement that one has with an automobile, this concurs with previous findings by Taylor-
West et al. (2008), but as the LISREL model shows these are still separate constructs.
In comparison, familiarity is knowledge gained through previous exposure through
ownership or access to a specific product (Section 4.4.4). The data analysis investigated a
number of alternative measures. The Familiarity scale chosen provides a good measure to
identify the level of awareness for a specific product, in this case the Ford Focus; this was
cross-validated by triangulation. It was hypothesised that familiarity was an intervening
variable that moderates the levels of Expertise and Involvement on the assumption that only
expertise and involvement are the basis of a consumer’s product experience (CPE). The
results show that although Familiarity contributes to the highest levels of CPE, Familiarity
had a greater positive effect with Expertise than Involvement. The results also showed that
Familiarity is a form of localised knowledge, it had the largest positive relationship with
Knows the options and was the key factor for Previous Awareness Sources. The largest
response was for the TV advert for Active Park Assist, Familiarity was found to be the key
factor, even for those with low Expertise and Involvement. This supports previous research
that suggested a novice that is familiar with a particular product may have greater expertise,
than an expert that is unfamiliar with the same product (Taylor-West et al., 2012). This
suggests that Familiarity is not only a moderator of CPE, but also a variable of CPE in its
own right in the context of experience of a specific product.
The findings for Familiarity and Involvement support the exploratory research results (3.7)
which suggested that awareness of a product or service is possible without any detailed
technical knowledge. This is supported by previous investigations that suggest know-how or

195
tacit knowledge is related to familiarity and exposure to a product (Rogers, 1971; Alba and
Hutchinson, 1987; Danneels and Kleinschmidt, 2001). Similarly, consumers with high
interest and involvement with a product accumulate knowledge about what the product does
(Bloch, 1981; Shimp and Sharma, 1983; Lennox and MaClaren, 2003; Kassubeck et al.,
2011). In both cases – Familiarity and Involvement - consumers may know what the product
does, but not necessarily on how it does it.
6.6.2 Intervening VariablesAs discussed already, Familiarity is a variable of CPE as well as a moderator. Additionally, it
was expected that Socio-Demographics would have a direct relationship with CPE e.g. high
levels of education with high levels of expertise. This was not found to be the case, although
some significant differences were found the actual differences were quite small, with the
exception that Males were found to have more Expertise and Involvement with cars than
Females and more Familiarity with the Ford Focus. Males were also more likely to Know the
option than Females. These fit with usual stereotypes of presumed masculinity associated
with automobiles.
6.6.3 Other RelationshipsThe product information relationships suggest different information sources are used by
consumers with high levels of Expertise and Involvement when they look for a new or newer
car. Specifically, consumers with high levels of Expertise rely on their Internal sources of
information compared to those with high levels of Involvement who look to Mass Media as
their main source of information.
Investigations into other variables in the survey revealed several small relationships. Small
relationships were found between Expertise and Involvement with Sports Car users. The most
important reason for changing a car was found to be Performance – Expertise had a medium
positive relationship, Involvement a large positive relationship. The main reasons for
changing a car for a newer model was for Style and Design and/or On Board Equipment.
The literature suggested that for experts and those highly involved with a product that there
would be a propensity to them own more cars than those who were not, and that they would
also consider more makes and/or more models when buying a car (Punj and Staelin, 1983).

196
This was not found to be the case; most people consider just 1 to 3 makes and/or models,
regardless of their level of Expertise or Involvement.
Product complexity also revealed a range of differing views. The literature suggests
consumers and manufacturers have differing views of complexity (Section 2.3.2), this was
found to be the case in this research, the manufacture rating a lower level of complexity from
the Ford Focus compared to the people who retail the product and consumers who purchase
the product. The results found that consumers with higher levels of Expertise, Involvement
and Familiarity perceived the Ford Focus as less complex.
Large positive relationships were found between Expertise, Involvement and Familiarity with
Knows the options. Similarly large positive relationship exists between Likes the option and
Buy the option. The key factor here is the variable Knows the option, unless a relationship is
established here no further interactions can take place in the appraisal process and this is
clearly important. In this research consumers were provided with product information, using
product videos, so that comparisons with the Likes the option and Buy the option could take
place to highlight their importance in a consumer’s intention to purchase.
Finally, the results of the research into TV adverts and product videos clearly show that
consumers found the product video to be the most appealing and would prefer to see this type
of communication as a TV advert; they were seen as more interesting and provided them with
better information. This desire for better information was not because the respondents had
high expertise and a desire for more knowledge, the majority of them had high involvement
suggesting they seek out information to satisfy their interest in a product. The results also
show that the product video shown was seen as more complex that the lifestyle TV advert,
and is likely to be indicative of the view identified in the literature that a new product must
have some degree of complexity to attract and gain initial interest from consumers (Michaut
et al., 2001b). In comparison, the Audi TV advert, which attempts to show new technology,
was found to be too complex to understand, making a case for manufacturers and their
marketing channels to provide clear unambiguous messages when communicating new
innovative products.

197
6.7 SUMMARYThe concern at the start of the Data Analysis chapter was to show that the scales are valid and
distinct. The subsequent sections and detailed analysis show that the findings are consistent
with those from previous studies that the scales were appropriate and valid. The structural
equation modelling show that the constructs used in this research do measure separate things
and that the overall model shows the causal relationships are unidimensional. However, there
is strong correlation between Expertise and Involvement. Also, these scales help explain
differing views of TV adverts and product videos.

198
CHAPTER: 7 FURTHER POST-MAIN SURVEY INVESTIGATIONS
7.1 INTRODUCTION TO THE CHAPTERDue to the timing of events, some of the research had to be carried out after the main survey
had been completed. This concerned the research into the methods and processes used to
communicate new innovations to consumers. The objective for this part of the research was
to gain support to the claim that manufacturers provide inadequate product information, not
only to consumers, but also to sales personnel who are the first point of contact for consumers
when visiting dealerships.
7.2 ATTENDANCE AT NEW PRODUCT LAUNCHESCommunication is important to the launch of any new product, one major resource in the
diffusion of new products for automotive manufacturers are the sales teams of their
franchised dealers. To discover how these teams are trained by the manufacturers and the
methods used to cascade product information, two major product launches of new car models
were attended to observe the methods, quality and depth of information that are provided to
the sales teams and how appropriate these are to potential customers.
7.2.1 Ford B-Max Launch - Salesman Training EventA product training event was attended at the Henry Ford College, Loughborough University,
in October 2012. The training was for their franchise dealer network car sales teams on the
Sales teams for the pending launch of the new Ford B-Max model. The training event is
supported by e-learning (incorporating product videos) and technology courses for the
dealers.
The training consisted of a number of training modules within the Henry Ford College –
Safety and Quality; B-Max crash test; Design and Loading equipment. This was followed by
a test drive of the B-Max and a further training module on the new Ford Sync system: basic
operation; functionality; syncing the phone; Blue Tooth streaming; voice control and music
via the USB.
Observation of the training did not highlight any obvious weaknesses, however one piece of
anecdotal information that was relevant, came from an older salesman attending the training.

199
When asked if there was any part of the Ford Sync training that they did not understand, he
replied all of it! He elaborated that he lost track when the trainer opened the session with “As
you all know smart phones…” this was because he did not know, as he had never owned a
smart phone. The trainers decided that they needed to change their introduction and provide
clearer background and details for this area of training.
7.2.2 Toyota Auris Launch Train-the-Trainer Event - MadridThe training event for pending launch of the new Toyota Auris, was attended at a temporary
training facility in Madrid in October 2012. The training was for Toyota staff: Sales Trainers
and Sales Training Managers; Service Advisor and Handover Specialist Trainers; Toyota
Financial Services Trainers
Most of the training was centred on how to carry out training, only minimal information was
provided on the new innovations of the model, such as the hybrid drivetrain (electric power
and petrol engine), although there were a number of videos that provided greater detail.
During the course of the training it appeared that most trainers were familiar with the Toyota
hybrid technology, which is probably the reason that this area had limited presentations or
discussion.
The videos included a TV advert and product videos which explained the innovative aspects
in detail, such as how the hybrid technology worked. Toyota is market leader in hybrid
vehicles but like most hybrid campaigns they don’t communicate their technology very well
(Gibson, 2010). To gain more insight it was decided to obtain consumer views and opinions
on the appeal of TV adverts in when compared to internal product videos, full details of how
this was carried out is given in Section 6.5.
Overall the level of detail in communicating the innovative aspects of the new model was
minimal. Although the personnel who were attending the training were experienced
professionals it is unlikely that they will be able to communicate an understanding of the new
innovations effectively.

200
7.3 SUMMARYIn summary, there are weaknesses in how manufacturers diffuse information to sales trainers
and sales staff. In the case of the Ford training one participant who was not familiar with the
technology being presented, was clearly lost at the start of the presentation, it is possible that
there may have been others.
The Toyota training only delivered minimal presentations on new innovations and this is
concerning as it was a train-the-trainer event and the likelihood of information being
cascaded down effectively to customer facing staff is doubtful.
In the case of cascading information to sales trainers and sales staff, the findings of this partof the research support the claim that manufacturers provide inadequate product information.

201
CHAPTER: 8 CONCLUSIONS
8.1 INTRODUCTION TO THE CHAPTERThe main purpose of the study was to provide empirical evidence of how consumers perceive
the complexity of new innovative products. The basis of the study was to establish and test
independent variables that measure consumers’ product expertise, involvement and
familiarity with a product as measures of a consumer’s product experience (CPE).
Comparisons were made with the sources of information used by consumers and the
information supplied by manufacturers and how each source contributes to product
awareness. This framework was used with information related to a specific product, the Ford
Focus, to gain consumer perceptions of the new innovative options.
The outcome of this research identified that new product complexity (NFC) can be alleviated
through the provision of appropriate product information. This can be achieved by assessing
new product complexity through the eyes of the consumer. If consumers know what the
innovative options are on a product, they can make a satisfactory appraisal of the product.
This research established that consumers who like product innovations are more likely to
consider buying the product. Other factors contributing to the appraisal process include
perceptions of how new and complex the product is. The outcome of the overall appraisal is
a consumer categorisation of the innovation (CCI).
This thesis builds upon previous studies in the areas of product newness (Rokeach, 1973;
Booz et al., 1982; Herstatt and von Hippel, 1992; Rogers, 1995; Berlyne 1966; Nurrenbern
and Robinson 1998; Johannessen et al., 2001; Moors et al. 2003; Michaut et al. 2001a;
Chapman, 2005; Vercauteren, 2005; Conway, 2010; Peter and Olsen, 2010; Johannessen and
Olsen, 2011; Simonsohn, 2011) and market segmentation (Haley 1968; Alpert and Gatty,
1969; Dibb, 1998; Dibb and Simkin, 1991; Kotler, 1991; Du and Kamakura, 2006; Kotler and
Keller, 2006; Malhotra and Birks, 2007; Smith, 2009; Wells et al., 2010; Goyat, 2011;
Tkaczynski and Rundle-Thiele, 2011). In doing so it provides important guidelines for
manufacturers and marketing departments on the collection of data and the diffusion of
product information (Section 8.3).

202
8.2 HYPOTHESIS CONCLUSIONSThe relationships between the constructs and new product innovations were found to support
the structure of consumer product experience (CPE), new product complexity (NPC) and the
overall outcome of a consumer’s categorisation of innovation (CCI).
In terms of the specific hypotheses put forward in Section 4.6, each hypothesis is presented
below with supporting evidence for acceptance or rejection.
8.2.1 Hypothesis 1a and 1b: Consumer Product Experience (CPE)Strong positive relationships were found between the two components of a consumer’s
product experience – Expertise and Involvement - identified from the analysis of sixteen
measures and two triangulation measures; Expertise increases pro-rata to the Involvement
that one has with an automobile. The expertise scale provides a good measure to identify the
level of technical knowledge held by novices and experts, similarly the involvement scale
provides a good measure of the keen interest shown in a product; both scales were cross-
validated by the triangulation questions. The results support previous findings (Bloch, 1981;
Shimp and Sharma, 1983; Lennox and MaClaren, 2003; Kassubeck et al., 2011). Therefore,
hypothesis 1a: A Consumer’s Product Experience (CPE) is based on their Expertise and
Involvement with the product, is accepted.
It was expected that socio-demographics would have a direct relationship with CPE. Of the
eight components identified from the analysis of thirty eight measures: Age group; Gender;
Lifecycle; Education; Income; Occupation; Country of Residence, it was found that only
Gender had a significant relationship; males had more Expertise ( large relationship) and
Involvement (medium relationship) with cars than females. These findings add little value as
Automobiles is an area that is normally associated with masculinity, without any other
correlations e.g. Education (knowledge) there is not enough support for hypothesis 1b: Socio-
demographics have a direct relationship with CPE, therefore this hypothesis is rejected.
8.2.2 Hypothesis 2a - 2c: FamiliarityFamiliarity, identified from the analysis of four measures and one triangulation measure, was
expected to have a direct relationship with socio-demographics. It was found that only
Gender had a significant relationship; males had more Familiarity (medium relationship) with

203
the Ford Focus than females. Again as with hypothesis 1b, the finding adds little value as
Automobiles is an area that is normally associated with masculinity; without any other
correlations there is not enough support for hypothesis 2a: Familiarity has a direct
relationship with socio-demographics, therefore this hypothesis is rejected.
It was hypothesised that Familiarity was an intervening variable that moderates the
components of CPE - Expertise and Involvement. Findings revealed that although Familiarity
contributes positively to the highest levels of CPE, it had a greater positive effect with
Expertise than Involvement. Findings also reveal that Familiarity is a form of localised
knowledge; a novice that is familiar with a particular product may have greater expertise,
than an expert that is unfamiliar with the same product, albeit that the knowledge is restricted
to an awareness of a product without any detailed technical knowledge. Therefore, hypothesis
2b: Higher levels of Familiarity has a positive effect on CPE, is accepted.
In comparison, findings revealed a medium negative relationship between Familiarity and
Complexity. Whilst consumers with higher levels of Familiarity perceived the Ford Focus as
less complex, low levels of Familiarity had the opposite effect. This is similar to the
intervening effect of Familiarity with CPE (hypothesis 2b); in this case Familiarity has a
moderating effect of New Product Complexity (NPC). Therefore, hypothesis 2c: Lower
levels of Familiarity has a negative effect on New Product Complexity (NPC), is accepted
8.2.3 Hypothesis 3a and 3b: Product InformationNPC is the outcome of CPE which is moderated by the intervening variables of Familiarity
and Product Information. NPC in turn is the basis on which a consumer is able to evaluate
new product innovations and achieve a Consumer Categorisation of the Innovation (CCI).
Findings revealed that the appraisal of innovative options comes to an abrupt halt unless the
consumer is provided with enough information. If consumers do not understand the product
or ‘Know the option’ no further interactions can take place in the appraisal process, whereas
the provision of Product Information - in this research this was supplied in the form of short
product videos – allowed the consumer to continue with the assessment process and achieve
their CCI by having a positive effect on reducing their NPC. In this research consumers
indicated a preference for product information style TV adverts, as they were more

204
interesting and gave you information than a typical lifestyle TV advert. Therefore, hypothesis
3a: The provision of relevant product information has a positive effect on NPC, is accepted
In comparison the opposite is true. Whilst consumers can be provided with product
information, if the information is insufficient or of an abstract nature, then consumers will
ignore or overlook the product. Findings revealed that most consumers found an Audi video
about new technology was too complex to understand; only 2% of all respondents knew what
the video was about, in this case the appraisal process resulted in a negative CCI. Therefore,
hypothesis 3b: Inadequate product information has a negative effect on the Consumer
Categorisation of the Innovation (CCI), is accepted.
8.2.4 Hypothesis 4 and 5: New Product Complexity (NPC)NPC is the outcome of relationships between the components of CPE – Expertise and
Involvement, Familiarity and Product Information. Anything that reduces the levels of
complexity in a new product has a valid contribution in the formation NPC.
It has already been established that Expertise and Involvement are valid components of CPE
(hypothesis 1a) and that Familiarity contributes to consumer knowledge (hypothesis 2b).
Confirmatory factor analysis confirms that all three components are valid measures of CPE
(Section 6.4.11), and SPSS findings show that those with higher Expertise and Involvement
have greater awareness of new product information (Section 6.4.6). The result is that these
factors have a positive effect on lowering NPC. Therefore, hypothesis 4: Higher levels of
CPE has a positive effect on NPC, is accepted.
Without low levels of NPC a consumer is unable to evaluate new product innovations and
establish a Consumer Categorisation of Innovation (CCI). It has been established from key
informants (Section 3.3.4) and data analysis (Section 6.4.8) that consumers will not buy what
they do not understand. Consumers cannot make an appraisal or categorise an innovation
unless they are provided with information that reduces NPC. If NPC remains high then an
assessment cannot take place. Therefore, hypothesis 5: Lower levels of NPC have a positive
effect on CCI, is accepted.

205
8.3 IMPLICATIONS AND GUIDELINESThis section summarises the practical implications arising from the findings of this study,
including guidelines for manufacturers and practitioners on the collection of data on the
diffusion of new product innovations and information sources.
The exploratory investigations found that manufacturers and practitioners use a number of
well-known commercial products for identifying the target market for their marketing
communications, but all of these products use high level groupings based on a limited survey
of consumers and can only provide generalisations or representations of the market. In
interviews with key informants (Section 3.3), Ford Motor Company acknowledged that:
‘Databases are not as sophisticated as some people feel’ and BMW admitted that: ‘…they
come up with a composite profile and then make the product to fit that profile. The difficult
thing is then to decide who fits those profiles, with the data they have already’
Ford, like other manufacturers already have data of current/past owners and households that
may have shared or used previous models, as well as consumers who have enquired for
product information such as brochure requests. In effect they already have access to a lot of
information that they do not use to effectively target marketing communications. This data
could be used as a key Familiarity variable.
As well as existing car owners, manufacturers hold demographic data for potential customers,
gained through marketing campaign enquiries. If records are matched by house number and
postcode data it is likely to identify the number of instances of current and previous
ownership for all the members of a family of a particular make and/or model. Using Ford as
an example, if one or more members of the same household owned a Ford, the other members
of the household are likely to be more familiar with Ford products than those in households
that did not own a Ford. The level of familiarity would be more focused if the matching was
made for a specific model, and more so if members of the household shared or had access to
that model.
This research has shown only limited usefulness for Socio-Demographic data, the only
relationships being the usual stereotypes of masculinity associated with automobiles.

206
These findings added little value without any other correlations e.g. Education (knowledge),
in fact hypotheses 1b: that Socio-demographics have a direct relationship with CPE, was
rejected. Other researchers have also questioned businesses that have become entrenched in
using demographic segmentation tools that are no longer appropriate, and that it is not
uncommon to find marketing campaigns are carried out without any consideration as to who
may be the users of the product (Dibb, 1998; Vercauteren, 2005). This means that
manufacturers and practitioners need to look at the type of data they collect from current as
well as potential customers.
There is also a need for manufacturers and practitioners to re-assess the type and style of their
communication methods, this research shows that product knowledge is gained through
product exposure, how much knowledge is accumulated depends on a consumers Expertise,
Involvement and Familiarity with the product. The highest level of knowledge was found to
be a combination of all three constructs. However, even consumers with low levels of
Expertise and Involvement but high Familiarity with a particular product means that a novice
may have greater expertise than an expert who is unfamiliar with the same product. This
shows that Familiarity for most consumers is of a very localised nature and supports the view
by Paredes (2011) that the last purchase experience is the best information for the next
purchase.
If consumers have low levels of Expertise, Involvement and Familiarity, it is likely that they
will find new innovative products to be high in complexity. To alleviate this adequate and
appropriate information needs to be supplied so consumers have a clear understanding of the
product and what it does. If consumers are unable to identify the product, with what they
already know and understand, then it is likely the product will not be considered. This is
particularly relevant for consumers with high familiarity of a product but low in expertise that
may be expected to be aware of changes to the product, whereas in practice changes to a
product are often overlooked.
The actual measurement of how much complexity is seen to be in a new innovative product is
also an area of concern. The research found that not only is there a difference between
consumers and manufacturers, there is also a difference with car dealer staff who are
consumer facing. The results of the measurement of complexity in a Ford Focus (Section
6.4.9) revealed that manufacturers and dealers viewed the products as less complex than

207
consumers. The implication is that because of this, they are likely to provide fewer details or
explanations when presenting or communicating the product. There is some support for this
view, part of the research included the observation of new product launches which revealed
weaknesses in how manufacturers diffuse information to sales trainers and sales staff; it was
found that manufacturers provide inadequate product information.
This research found that consumers knew about some of the Ford Focus options, but did not
understand them. Therefore, the recommendation is for manufacturers to introduce a similar
method of complexity scaling to gain insight into consumer perceptions of the complexity of
their new products. This would identify which options were perceived as having the most
complexity and identify the appropriate levels of communication that are required.
The research found that the method of communication is also a key factor. The information
sources used by consumers differ according to their Expertise and Involvement when they
look for a new car. Those with Expertise had a preference for using their own Internal
knowledge followed by Mass-Media and the Internet and then Retailers e.g. car dealers. In
comparison those with Involvement had a preference for Mass-Media followed by the
Internet and Internal knowledge and then Retailers.
Findings of the previous awareness of the options for the new Ford focus revealed that the
TV Advert, demonstrating the Easy Park Assist option, had a high recall even for those with
low Expertise and Involvement. This is a strong indicator of the positive effect of providing
product information through a mass media source of this nature. Further research
consolidated this view. The comparison of a lifestyle TV Advert and a product video revealed
the product video appealed the most and prospective consumers would prefer to see this type
of communication as a TV Advert. The most typical reason given was that it was more
interesting and gave you information. However, findings also revealed that if the product
information is too abstract it resulted in negative outcomes.
The key is to provide consumers with adequate product information, when this is provided it
has positive results. After viewing the short product videos for the Ford Focus, all
participants in the exploratory studies, and 66.1% of respondents in the main study, stated
they would buy the options. Clearly no one will buy an option if they do not understand what
it is, therefore it is important to explain the options to be able to stimulate those responses.

208
This study investigated the appropriateness of measures and constructs required to establish a
more reliable segmentation tool for marketing communications in doing so it concludes that
collecting data relating to a consumers Expertise and Involvement as well as Familiarity will
provide manufacturers and practitioners with an understanding of a Consumers Product
Experience. This would enable the tailoring of marketing communications by providing the
correct level of product information based on the individual’s CPE, rather than the current
one-size-fits-all lifestyle messages. This would be particularly useful for manufacture launch
campaigns of new products where new complex innovations are not easily understood. Not
only would this increase the appeal of the marketing messages, it would make them more
cost-effective as they would reach more accurate market segments.
These variables would also be useful in developing new communication channels. In
particular where new products contain complex innovative components, whether active or
passive, the technology needs to be explained in more detail to avoid them being perceived as
being too complex and therefore excluded from the product evaluation process. Explanations
could be provided by using language which is more familiar to consumers. For example,
innovations that are designed to protect passengers could be communicated as a ‘Safety’
feature as opposed to the more complex sounding ‘Torque Vectoring Control’, although care
should be taken not to raise concerns about safety issues, because for some consumers safety
is taken as being implicit in cars. Explanations could be provided by using language which is
more familiar to consumers. For example, innovations that are designed to protect passengers
could be communicated as a ‘Safety’ feature as opposed to the more complex sounding
‘Torque Vectoring Control’, although care should be taken not to raise concerns about safety
issues, because for some consumers safety is taken as being implicit in cars. Clearly, retail
marketing channels and the messages they convey need to be investigated in more detail and
changed.
This does not mean that all consumers require detailed technical knowledge. It was found that
consumers with high Familiarity i.e. the owner of a Ford Focus, but low in expertise may be
aware of new options being introduced to that model, through marketing and a general
interest in their vehicle, but they do not necessarily understand what they actually do. In
contrast those with high involvement may know what the new innovations do, but not

209
necessarily how they work. This means that you do not have to be an expert to have
knowledge of new technology.
One practical suggestion for more localised development would be to investigate the
customer qualification process in automotive dealerships. Scripts could be developed to
identify Expertise, Involvement and Familiarity, but it may be difficult to ask a customer
some of the questions needed to qualify them without alienating them as well as making it
feel awkward for sales staff. However, future research into this area should persevere in
developing qualification methods that identify the depth of product knowledge a consumer
has or needs for a particular product to be able to deliver the relevant level of information.
The findings are useful for academics carrying out future research in this area as well in the
establishment and categorisation of automotive product groups. It is suggested that future
research investigates where and how consumers source their information, this would provide
valuable information for developing the appropriate marketing channels. If this information
can be obtained by manufacturers/practitioners during their marketing campaigns, together
with Expertise, Involvement and Familiarity it offers academics as well as manufacturers
segmentation opportunities for future research, new product launches and may be useful for
other high value purchases in other industries.
In conclusion, the findings provide clear implications for automotive manufacturers and
practitioners as it gives insight on consumer awareness, acceptance and the appeal of new
technological developments and how these are moderated by a consumer’s Expertise,
Involvement and Familiarity with their products. If these suggestions are put into practice it
will provide them with improved consumer segmentation and a more effective measure of
their new products.
8.4 LIMITATIONS AND FUTURE RESEARCH RECOMMENDATIONSThis research has clear implications for manufacturers and practitioners but it should be noted
that there are a number of possible limitations with the research.
In considering any research, it is important to evaluate the limitations of the work. Firstly, the
respondents to the main research were current customers of Ford Motor Company Limited,

210
with only a small amount of prospects (Section 5.6.1). Research was also centred on a
specific model, the Ford Focus. Whilst this was deliberate, to enable the Familiarity construct
to be evaluated, the findings can only be relied upon in the context of this specific model.
Replication of this research with other manufacturers and models is needed to be able to draw
wider comparisons.
Secondly, the constructs and relationships between Expertise, Involvement and Familiarity
may only be applicable to mainstream models. For example, they may have no value in the
assessment of expensive prestige models such as Rolls-Royce; there is likely to be a variety
of other variables and influences that contribute to their appraisal, but these unmeasured
variables are beyond the scope of this research.
Thirdly, all questionnaires used in the research were carefully worded to avoid ‘the right
answers’ being given. In addition, because of the nature of an online questionnaire which
relied on self-administration by the intended recipients, the validity of respondents cannot be
guaranteed. It is also important to note that research methods and practices, including
established scales do not remain constant over time, by nature research is in a state of flux
and scale items that may well have been reliable and valid in 1981, such as the AIS
developed by Bloch, may not hold today. Similarly the scales used in the current research
may be subject to change in the future.
Fourthly, the age range and occupation of respondents in the main survey may be typical of
people who respond to surveys in general (e.g. elderly and retired). This means that it can
only be said that the findings are indicative of this group of people. Future surveys could be
carried out using a face-to-face questionnaire with a stratified sample, this would also
alleviate the problems of respondent validity to an online survey, but this would limit the
volume of responses and increase the cost of data collection considerably.
Lastly, although no useful relationships were found with Socio-Demographic measures, they
should not be overlooked. For example, demographics are, and will remain, essential when
describing respondents – there is little value in establishing links between variables and
constructs without being able to identify what those respondents look like or where they live.

211
In terms of future research recommendations, there is considerable scope for developing the
proposals put forward in this research. The main development would be to apply the
theoretical contributions to a practical situation in the workplace environment of a
manufacturer, practitioner or dealership. This could be achieved by self-implementation of
the guidelines put forward in Section 8.3, but for robustness and rigour the preference would
be to carry out longitudinal action research over two/three years in an immersive role to
monitor and implement the proposals.
Taking these limitations into account, the current study makes a significant contribution to
categorisation theory, consumer behaviour and new product development literature, and has
identified a number of potential areas for future development in this important area research.
In the introduction to this thesis it was argued that the focus of explaining and asking
questions on “how new” and “new to whom” would be valid questions for marketers when
introducing new products. The research has provided evidence that these questions would be
valuable alongside a better understanding of Expertise, Involvement and Familiarity.

212
REFERENCES
Aaker, D.A., Kumar, V. & Day, G.S. 2007, Marketing Research, 9th edn, John Wiley &Sons, Inc., New Jersey, USA.
Acxiom 2004, Lifestyle Universe Database [Homepage of Acxiom, Teddington, Middlesex],[Online]. Available: http://www.claritas.co.uk/uk/acquisition/targeting/43455 [2010,12/17].
Agrawal, T., Sao, A., Fernades, K.J., Tiwari, M.K. & Kim, D.Y. 2013, "A hybrid model ofcomponent sharing and platform modularity for optimal product family design",International Journal of Production Research, vol. 52, no. 2, pp. 614-625.
Aiken, L.S. & West, S.G. 1991, Multiple Regression: Testing and interpreting interactions,Sage Publications, Inc., Thousand Oaks, California.
Akdeniz, B., Calantone, R.J. & Voorhees, C.M. 2013, "Effectiveness of Marketing Cues onConsumer Perceptions of Quality: The Moderating Roles of Brand Reputation andThird‐Party Information", Psychology & Marketing, vol. 30, no. 1, pp. 76-89.
Alba, J.W. & Hutchinson, J.W. 1987, "Dimensions of Consumer Expertise", Journal ofConsumer Research (1986-1998), vol. 13, no. 4, pp. 411.
Allen, M.W. 2001, "A practical method for uncovering the direct and indirect relationshipsbetween human values and consumer purchases", Journal of Consumer Marketing, vol.18, no. 2, pp. 102-120.
Alpert, L. & Gatty, R. 1969, "Product positioning by behavioral life-styles", The Journal ofMarketing, vol. 33, pp. 65-69.
Backman, M., Börjesson, S. & Setterberg, S. 2007, "Working with concepts in the fuzzy frontend: exploring the context for innovation for different types of concepts at Volvo Cars",R & D Management, vol. 37, no. 1, pp. 17-28.
Bader, G.E. & Rossi, C.A. 1999, Focus groups: A step-by-step guide, The Bader Group, SanDiego, CA.
Bandura, A. & McClelland, D.C. 1977, Social Learning Theory, Prentice-Hall, New Jersey.
Barnett, M. 2012, Tech geeks are open to online ad campaigns [Homepage of MarketingWeek], [Online]. Available:http://m.marketingweek.co.uk/4002316.article?mobilesite=enabled [2012, 07/02].
Barroso, A. & Llobet, G. 2012, "Advertising and Consumer Awareness of New,Differentiated Products", Journal of Marketing Research, vol. 49, no. 6, pp. 773-792.
Barsalou, L.W. 1995, "Deriving categories to achieve goals", Goal Directed Learning.MITPress, Cambridge MA, , pp. 121-176.

213
Bartlett, M.S. 1954, "A note on the multiplying factors for various chi squareapproximations", Journal of the Royal Statistical Society, vol. 16 (Series B), pp. 296-298.
Baruch, Y. 1999, "Response rate in academic studies-A comparative analysis", Humanrelations, vol. 52, no. 4, pp. 421-438.
Baruch, Y. & Holtom, B.C. 2008, "Survey response rate levels and trends in organizationalresearch", Human Relations, vol. 61, no. 8, pp. 1139-1160.
Bauer, H.H., Sauer, N.E. & Becker, C. 2006, "Investigating the relationship between productinvolvement and consumer decision‐making styles", Journal of Consumer Behaviour,vol. 5, no. 4, pp. 342-354.
Bayus, B.L. 1991, "The consumer durable replacement buyer", The Journal of Marketing,vol. 55, pp. 42-51.
Beck, P., Hofmann, E. & Stölzle, W. 2012, "One size does not fit all: An approach fordifferentiated supply chain management", International Journal of Services Sciences,vol. 4, no. 3, pp. 213-239.
Becker, H.S. & Richards, P. 2007, Writing for social scientists, 2nd edn, University ofChicago Press, Chicago.
Bennett, C. & Dewar, J. 2004, Carnegie Project: Epistemic Knowledge [Homepage ofLoyola Marymount University], [Online]. Available:http://myweb.lmu.edu/carnegie/webport/Ep_kn_fg.htm [2005, 03/03].
Berger, P. & Luckmann, T. 1991, The Social Construction of Reality: A Treatise in theSocialogy of Knowledge, Penguin Books, London.
Berlyne, D.E. 1978, "Curiosity and Learning" in Motivation and Emotion (Serials) PlenumPublishing Corporation, New York, pp. 97-175.
Berlyne, D.E. 1970, "Novelty, complexity, and hedonic value.", Perception andPsychophysics, vol. 8.
Berlyne, D.E. 1966, "Curiosity and Exploration", Science, vol. 153, pp. 25-33.
Berlyne, D.E. 1960, Conflict, arousal and curiosity, McGraw-Hill, USA.
Bettman, J.R. & Park, C.W. 1980, "Effects of prior knowledge and experience and phase ofthe choice process on consumer decision processes: A protocol analysis", Journal ofConsumer Research, vol. 7, no. 3, pp. 234-248.
Bettman, J.R. & Sujan, M. 1987, "Effects of framing on evaluation of comparable andnoncomparable alternatives by expert and novice consumers", Journal of ConsumerResearch, vol. 14, no. 2, pp. 141-154.

214
Bloch, P.H. 1986, "Product enthusiasm: many questions, a few answers", Advances inconsumer research, vol. 13, no. 1, pp. 534-544.
Bloch, P.H. 1981, "An exploration into the scaling of consumers' involvement with a productclass", Advances in consumer research, vol. 8, pp. 61-65.
Bloch, P.H. & Bruce, G.D. 1984, "Product involvement as leisure behavior", Advances inconsumer research, vol. 11, no. 1, pp. 197-202.
Bloch, P.H. & Richins, M.L. 1983, "A theoretical model for the study of product importanceperceptions", Journal of Marketing, vol. 47, no. 3, pp. 69-81.
Blythe, J. 1999, "Innovativeness and newness in high-tech consumer durables", Journal ofProduct & Brand Management, vol. 8, no. 5, pp. 415-429.
Blythe, J. 1997, The Essence of Consumer Behaviour, Prentice Hall, London.
Booker, C. 2010, The Leaf that could be heading for an expensive fall, Motoring Section edn,Telegraph Media Group Limited, London.
Booz, Allen & Hamilton 1982, New products management for the 1980s, Booz Allen &Hamilton Inc., New York.
Botschen, G., Thelen, E.M. & Pieters, R. 1999, "Using means-end structures for benefitsegmentation: An application to services", European Journal of Marketing, vol. 33, no.1, pp. 38-58.
Brandes, O. & Brehmer, P. 2004, Networks as Barriers to Innovators -the case of cardistribution in the European Union [Homepage of Industrial Marketing and Purchasing(IMP) Group], [Online]. Available: http://www.impgroup.org/uploads/papers/4305.pdf[2013, 02/01].
Brewer, R. 2007, Your PhD Thesis: How to Plan, Draft, Revise and Edit Your Thesis,Studymates Limited, Abergele, UK.
Brewin, C.R. 1989, "Cognitive change processes in psychotherapy.", Psychological review,vol. 96, no. 3, pp. 379-394.
Brocard, P. & Donada, C. 2002, The automotive equipment chain accelerating technology[Homepage of Le 4 Pages des statistiques industrrielles No. 164, 2002.], [Online].Available: http://www.industrie.gouv.fr/biblioth/docu/4pages/pdf/4p164-anglais.pdf[2004, 05/25].
Brockman, B.K. & Morgan, R.M. Spring 2003, "The Role of Existing Knowledge in NewProduct Innovativeness and Performance", Decision Sciences, vol. 34, no. 2, pp. 385-418.
Brookes, R., Smart, J. & Punj, G. March, 2004, "What Does 'NEW' Mean? Investigating theappeal/unappeal of 'new' in car purchasing", Paper presented to ESOMAR AutomotiveMarketing conference, Lausanne, Switzerland.

215
Brosnan, M.J. 1998, Technophobia: The psychological impact of information technology,Routledge, London.
Brown, R.B. 2006, Doing your dissertation in business and management : the reality ofresearching and writing, Sage, London.
Bryman, A. 2001, Social research methods, Oxford University Press, Oxford.
Bryman, A. & Bell, E. 2007, Business Research Methods, Oxford University Press, Oxford.
Buhrmester, M., Kwang, T. & Gosling, S.D. 2011, "Amazon's Mechanical Turk A NewSource of Inexpensive, Yet High-Quality, Data?", Perspectives on PsychologicalScience, vol. 6, no. 1, pp. 3-5.
Burrus, B. 2004, Drive incremental sales with line extensions [Homepage of AC Nielsen],[Online]. Available: http://www2.acnielsen.com/pubs/2004_09_eu_extensions.shtml[2010, 01/02].
Businessballs 2003, Demographic Classifications. Available:http://www.businessballs.com/demographicsclassifications.htm [2011, 02/17].
Byrne, B.M. 1998, Structural equation modeling with LISREL, PRELIS, and SIMPLIS: Basicconcepts, applications, and programming, Lawrence Erlbaumb Associates Inc., NewJersey.
CACI Ltd 2009, ACORN - the smarter consumer classification. Available:http://www.caci.co.uk/acorn2009/acornmap_ext.asp [2011, 2/11].
Caputi, P. & Reddy, P. 1999, "A comparison of triadic and dyadic methods of personalconstruct elicitation", Journal of Constructivist Psychology, vol. 12, no. 3, pp. 253-264.
Chapman, J. 2005, Emotionally durable design : objects, experiences and empathy,Earthscan, London.
Chatfield, C. & Collins, A.J. 1992, Introduction to multivariate analysis, Chapman and Hall,London.
Chi, M.T.H., Glaser, R. & Rees, E. 1982, "Expertise in problem solving" in Advances in thepsychology of human intelligence, ed. R.J. Sternberg, Volume 1 edn, Laurence Erlbaum,New Jersey, pp. 7-75.
Chikweche, T. & Fletcher, R. 2012, "Revisiting the marketing mix at the bottom of pyramid(BOP): from theoretical considerations to practical realities", Journal of ConsumerMarketing, vol. 29, no. 7, pp. 507-520.
Clark, M.S. & Fiske, S.T. 1982, Affect and cognition : the seventeenth annual CarnegieSymposium on Cognition, L.awrence Erlbaum Associates, New Jersey.
Clark, W. & Gantt, H.L. 1938, The Gantt Chart, 2nd edn, Pitman, London.

216
Cohen, J., Cohen, P., West, S.G. & Aiken, L.S. 2003, Applied multiple regression/correlationanalysis for the behavioral sciences, 3rd edn, Lawrence Erlbaum Associates, Mahwah,N.J.
Cohen, J.B. & Basu, K. 1987, "Alternative Models of Categorization: Toward a ContingentProcessing Framework", Journal of Consumer Research, vol. 13, no. 4, pp. 455.
Connors, M.H., Burns, B.D. & Campitelli, G. 2011, "Expertise in Complex Decision Making:The Role of Search in Chess 70 Years After de Groot", Cognitive Science, vol. 35, no. 8,pp. 1567-1579.
Conway, G. 2010, Drive of the week: Nanny's in natty new togs, The Sunday Times, London.
Cooper, R.G., Edgett, S.J. & Kleinschmidt, E. 2002, Portfolio management for new products,2nd edn, Perseus, Reading, Mass. ; Oxford.
Cortina, J.M. 1993, "What is coefficient alpha? An examination of theory and applications.",Journal of Applied Psychology, vol. 78, no. 1, pp. 98.
Coulson, S. 2001, Semantic leaps : frame-shifting and conceptual blending in meaningconstruction, Cambridge University Press, Cambridge, UK.
Cowley, E. & Mitchell, A.A. 2005, "What Do Novice Consumers Remember?", Advances inConsumer Research, vol. 32, pp. 437-438.
Crawford, C.M. 1985, "A new positioning topology", Journal of Product InnovationManagement, vol. 2, no. 4, pp. 243-253.
Creswell, J.W. & Clark, V.L.P. 2007, Designing and conducting mixed methods research,Sage Publications, Inc., Thousand Oaks, California.
Creswell, J.W. & Clark, V.L.P. 2007, Designing and conducting mixed methods research,Sage Publications, Inc., Thousand Oaks, California.
Crilly, N., Moultrie, J. & Clarkson, P.J. 2004, "Seeing things: consumer response to thevisual domain in product design", Design Studies, vol. 25, no. 6, pp. 547-577.
Cronbach, L.J. 1951, "Coefficient alpha and the internal structure of tests", Psychometrika,vol. 16, no. 3, pp. 297-334.
Crowne, D.P. & Marlowe, D. 1960, "A new scale of social desirability independent ofpsychopathology.", Journal of Consulting Psychology, vol. 24, no. 4, pp. 349-354.
Curwin , J. & Slater, R. 2002, Quantitative Methods for Business Decisions, 5th edn,Thomson Learning, London.
Daniels, K. & Henry, J. 1998, "Strategy: a cognitive perspective" in The strategy reader, ed.S. Segal-Horn, Blackwell, Oxford, pp. 312-323.

217
Danneels, E. & Kleinschmidt, E.J. 2001, "Product innovativeness from the firm's perspective:its dimensions and their relation with project selection and performance", Journal ofProduct Innovation Management, vol. 18, no. 6, pp. 357-373.
Demiröz, O.Y. 2007, "Product Character: A Semantic Differential Analysis of AutomobileDesign", DesForM 2007 - School of Design, Northumbria University, 2007, pp. 152.
Department of Transport 2003, Assessing the Impact of Graduated Vehicle Excise Duty -Quantitative Research [Homepage of Department of Transport], [Online]. Available:http://webarchive.nationalarchives.gov.uk/20100514000613/http://www.dft.gov.uk/print/pgr/roads/environment/research/consumerbehaviour/assessingtheimpactofgraduate3817[2012, 07/05].
DeVellis, R.F. 2003, Scale Development: Theory and Applications, 2nd edn, SagePublications, Thousand Oaks, California.
DeVellis, R.F. 1991, Scale Development. Theory and Applications. Applied Social ResearchMethods Series, Vol 26, Sage, London.
Dholakia, U.M. 2001, "A motivational process model of product involvement and consumerrisk perception", European Journal of Marketing, vol. 35, no. 11/12, pp. 1340-1362.
Diamantopoulos, A. & Schlegelmilch, B.B. 2002, Taking the fear out of data analysis,Thomson, London.
Diamantopoulos, A. & Siguaw, J.A. 2000, Introducing LISREL: A guide for the uninitiated,Sage Publications Ltd, London.
Dibb, S. 1998, "Market segmentation: strategies for success", Marketing Intelligence &Planning, vol. 16, no. 7, pp. 394-406.
Dibb, S. & Lyndon, S. 1996, The market segmentation workbook : target marketing formarketing managers, Routledge, London.
Dibb, S. & Simkin, L. 1991, "Targeting, segments and positioning", International Journal ofRetail & Distribution Management, vol. 19, no. 3, pp. 4-10.
Diwan, S.P. & Bodla, B. 2011, "Development of empirically based customer-derivedpositioning typology in the automobile industry", Journal of Strategic Marketing, vol.19, no. 6, pp. 531-550.
Du, R.Y. & Kamakura, W.A. 2006, "Household life cycles and lifestyles in the UnitedStates", Journal of Marketing Research, vol. 43, no. 1, pp. 121-132.
Dunleavy, P. 2003, Authoring a PhD: how to plan, draft, write, and finish a doctoral thesisor dissertation, Palgrave Macmillan, Basingstoke, UK.
Edwards, P., Roberts, I., Clarke, M., DiGuiseppi, C., Wentz, R., Kwan, I., Cooper, R., Felix,L. & Pratap, S. 2009, "Methods to increase response to postal and electronicquestionnaires (Review)", Cochrane Database of Systematic Reviews, vol. 3, pp. 1-12.

218
Energy Saving Trust 2007, Passenger Car Market transformation model [Homepage ofEnergy Savings Trust, London], [Online]. Available:http://www.lowcvp.org.uk/.../PCWG-P-07-29%20EST%20MTM%20Passenger%20Car%20Report%20FINAL.pdf [2011, 4/15].
English, A. 2013, US Giants show the way to profitability; After facing bankruptcy,America's Big Three now set the benchmark for Europe, 1st edn, Telegraph MediaGroup Limited, London.
Erdem, O., Oumlil, A.B. & Tuncalp, S. 1999, "Consumer values and the importance of storeattributes", International Journal of Retail and Distribution Management, vol. 27, no. 4,pp. 137-144.
Experian Ltd 2005, Experian launches Mosaic Automotive. Available:http://www.uk.experian.com/corporate/vision/e-vision/december09-2004.html [2010,01/12].
Experian Ltd 2003, 21st Century Consumer Targetting: Understanding the 2001 Census andits Implications for MOSAIC [Homepage of Experian Ltd], [Online]. Available:http://www.business-strategies.co.uk/Content.asp?ArticleID=566 [2004, 06/15].
Fan, W. & Yan, Z. 2010, "Factors affecting response rates of the web survey: A systematicreview", Computers in Human Behavior, vol. 26, no. 2, pp. 132-139.
Folkes, V.S. & Kielser, T. 1991, "Social Cognition: Consumers' Inferences About the Selfand Others" in Handbook of Consumer Behavior, ed. H.H. Kassarjian, Prentice-Hall,New Jersey, pp. 281-315.
Foxall, J. 2013, Safety Margins, 1st edn, Telegraph Media Group Limited, London.
Furse, D.H., Punj, G.N. & Stewart, D.W. 1984, "A Typology of Individual Search StrategiesAmong Purchasers of New Automobiles", The Journal of Consumer Research, vol. 10,no. 4, pp. 417-431.
Gal, D. & Rucker, D.D. 2011, "Answering the Unasked Question: Response Substitution inConsumer Surveys", Journal of Marketing Research, vol. 48, no. 1, pp. 185-195.
Garcia, R. & Calatone, R. 2002, "A critical look at technological innovation typology andinnovativeness terminology: a literature review", The Journal of Prodcut Innovationmanagement, vol. 19, no. 2, pp. 110-132.
Gatignon, H. & Robertson, T.S. 1991, "Innovative Decision Processes" in Handbook ofConsumer Behavior, eds. T.S. Robertson & H.H. Kassarjian, Prentice Hall International,New Jersey, pp. 316-348.
Gibson, T. 2010, RAC Future Car Challenge - Electric cars: are they the answer to ourenvironmental problems? [Homepage of Telegraph Media Group Limited], [Online].Available: http://www.telegraph.co.uk/sponsored/motoring/future-car-challenge/8093045/Electric-cars-are-they-the-answer-to-our-environmental-problems.html [2010, 11/05].

219
Gillespie, J. & Tobin, D. 2011, Look, no hands!; the driverless car is just around thecorner. After years of test models, manufacturers are close to bringing out cars thatdrive themselves.
Gilly, M. & Ennis, B. 1982, "Recycling the family life cycle: A proposal for redefinition" inAdvances in Consumer Research, eds. A. Mitchell & A. Arbor, Association forConsumer Research, , pp. 271-276.
Gobeli, D.H. & Brown, D.J. 1987, "Analyzing Product Innovations", Research Management,vol. 30, pp. 25-31.
Goldsmith, R. & Flynn, L.R. 1992, "Identifying Innovators in Consumer Product Markets",European Journal of Marketing, vol. 26, no. 12, pp. 42-55.
Goldsmith, R.E. & Hofacker, C.F. 1991, "Measuring consumer innovativeness", Journal ofthe Academy of Marketing Science., vol. 19, no. 3, pp. 209-221.
Goyat, S. 2011, "The basis of market segmentation: a critical review of literature", EuropeanJournal of Business and Management, vol. 3, no. 9, pp. 45-54.
Greater London Authority 2009, London's Electric Vehicle Infrastructure Strategy[Homepage of Greater London Authority], [Online]. Available:http://legacy.london.gov.uk/electricvehicles/charging/ [2011, 4/15].
Greene, J.C. 2008, "Is mixed methods social inquiry a distinctive methodology?", Journal ofmixed methods research, vol. 2, no. 1, pp. 7-22.
Gregan-Paxton, J. & John, D.R. 1997, "Consumer learning by analogy: A model of internalknowledge transfer", Journal of Consumer Research, vol. 24, no. 3, pp. 266-284.
Greig, I.D. 2003, "Towards a typology of consumer survey research", European Journal ofMarketing, vol. 37, no. 10, pp. 1314-1331.
Groff, R. 2004, Critical realism, post-positivism and the possibility of knowledge, Routledge,London.
Hair Jr., J.F., Anderson, R.E., Tatham, R.L. & Black, W.C. 1998, Multivariate data analysis:Fifth Edition, 5th edn, Prentice Hall, New Jersey.
Hair, J.F., Black, W.C., Babin, B.J. & Anderson, R. 2010, Multivariate Data Analysis. AGlobal Perspective, Seventh edn, Pearson Prentice Hall, New Jersey.
Hair, J.F., Money, A.H., Samouel, P. & Page, M. 2007, Research methods for business, JohnWiley & Sons Ltd, Chichester, England.
Haley, R.I. 1968, "Benefit segmentation: a decision-oriented research tool", The Journal ofMarketing, vol. 32, no. 3, pp. 30-35.
Hall, M. 2013, UK now has seven social classes, with traditional model 'too simplistic',Telegraph Media Group Limited, London.

220
Halliburton, C. & Hünerberg, R. 1993, European Marketing : readings and cases, Addison-Wesley, Wokingham.
Halliday, J. 2005, "The Drive for Design", Advertising Age. (Midwest region edition)., vol.76, no. 29, pp. 4-5.
Harris, M. 2011, Jumpsuit on, driver - 'Top Gun' displays signal death of the dashboard,Times Newspapers Ltd, London.
Hauser, J., Tellis, G.J. & Griffin, A. 2006, "Research on innovation: A review and agenda formarketing science", Marketing Science, vol. 25, no. 6, pp. 687-717.
Henard, D.H. & Szymanski, D.M. Aug. 2001, "Why Some New Products Are MoreSuccessful Than Others.", Journal of Marketing Research, vol. 38, no. 3, pp. 362-375.
Herstatt, C. & von Hippel, E. 1992, "Developing New Product Concepts Via the Lead UserMethod: A Case Study in a "Low Tech" Field", Journal of Product InnovationManagement, vol. 9, no. 3, pp. 213-227.
Hoch, S.J. & Ha, Y.W. 1986, "Consumer learning: Advertising and the ambiguity of productexperience", Journal of consumer research, vol. 13, pp. 221-233.
Hoeffler, S. 2003, "Measuring preferences for really new products", Journal of MarketingResearch, vol. 40, no. 4, pp. 406-420.
Hoffer, G.E. & Reilly, R.J. 1984, "Automobile styling as a shift variable: An investigation byfirm and by industry", Applied Economics, vol. 16, no. 2, pp. 291-298.
Hofstadter, D. 1998, Fluid Concepts and Creative Analogies: Computer models of thefundamental mechanisms of thought. Penguin Books, London.
Hofstede, F.T., Steenkamp, J.E.M. & Wedel, M. 1999, "International market segmentationbased on consumer-product relations", Journal of Marketing Research, vol. 36, no. 1, pp.1-17.
Holbrook, M.B. & Stern, B.B. (eds) 1999, Consumer value : a framework for analysis andresearch, Routledge, London.
Home, P. & Kahle, L.R. 1988, "A structural equation test of the value-attitude-behaviourhierarchy", Journal of Personality and Social Psychology, vol. 54, no. 4, pp. 638-646.
Howell, D. 2001, "Newness is in the eye of the beholder", DSN Retailing Today, vol. 40, no.22, pp. 16.
Hoyle, R., Judd, C. & Harris, M. 2001, Research Methods in Social Relations, 7th Revisededition edn, Wadsworth Publishing Co. Inc., Belmont, CA.
Huizingh, E. 2007, Applied Statistics with SPSS, Sage Publications, Thousand Oaks,California.

221
Hupfer, N.T. & Gardner, D.M. 1971, "Differential involvement with products and issues: Anexploratory study", Proceedings of the Second Annual Conference of the Association forConsumer Research, Association for Consumer Research, College Park, MD, pp. 262.
Hutchinson, W.J. & Eisenstein, E.M. 2008, "Consumer Learning and Expertise" in Handbookof Consumer Psychology, eds. C.P. Haugtvedt, P.M. Herr & F.R. Kardes, PschologyPress, New York, pp. 103–131.
Iacobucci, D. & Churchill, G.A. 2010, Marketing Research: Methodological Foundations,10th International Edition edn, South-Western, Cengage learning, Florence, USA.
Insight Value Group Ltd 2004, Social Value Groups [Homepage of CONSUMER INSIGHTLTD], [Online]. Available: http://www.insightmc.com/insightmc_groups.htm [2004,06/01].
Ipsos MediaCT 2009, Social Grade - A Classification Tool [Homepage of Ipsos MediaCT],[Online]. Available: http://www.ipsos-mori.com/DownloadPublication/1285_MediaCT_thoughtpiece_Social_Grade_July09_V3_WEB.pdf [2012, 07/06].
Jankowicz, A.D. 2000, Business research projects for students, 3rd edn, Thomson Learning,London.
Jensen, J.M. & Hansen, T. 2006, "An empirical examination of brand loyalty", Journal ofProduct & Brand Management, vol. 15, no. 7, pp. 442-449.
Jiao, J., Simpson, T.W. & Siddique, Z. 2007, "Product family design and platform-basedproduct development: a state-of-the-art review", Journal of Intelligent Manufacturing,vol. 18, no. 1, pp. 5-29.
Jin, L. 2011, "Improving response rates in web surveys with default setting The effects ofdefault on web survey participation and permission", International Journal of MarketResearch, vol. 53, no. 1, pp. 75-94.
Johannessen, J.A. & Olsen, B. 2011, "Aspects of a cybernetic theory of tacit knowledge andinnovation", Kybernetes, vol. 40, no. 1/2, pp. 141-165.
Johannessen, J.A., Olsen, B. & Lumpkin, G.T. 2001, "Innovation as newness: what is new,how new, and new to whom?", European Journal of Innovation Management, vol. 4, no.1, pp. 20-31.
Johnson, E.J. & Russo, J.E. 1984, "Product familiarity and learning new information",Journal of Consumer Research, vol. 11, no. June, pp. 542-550.
Johnson, E.J. & Russo, J.E. 1981, "Product Familiarity And Learning New Information",Advances in Consumer Research, vol. 8, pp. 151-155.
Jowit, J. 2011, Electric car sales appear to slow despite government grants [Homepage ofGuardian News & Media Limited], [Online]. Available:

222
http://www.guardian.co.uk/environment/2011/jul/25/electric-car-sales-slow-grants[2011, 7/25].
Kahle, L.R. & Chiagouris, L. (eds) 1997, Values, lifestyles, and psychographics, LawrenceErlbaum Associates, New Jersey.
Kahle, L.R., Beatty, S.E. & Homer, P. 1986, "Alternative measurement approaches toconsumer values: the list of values (LOV) and values and life style (VALS)", Journal ofconsumer research, vol. 13, pp. 405-409.
Kaiser, H.F. 1974, "An index of factorial simplicity", Psychometrika, vol. 39, no. 1, pp. 31-36.
Kaplowitz, M.D., Hadlock, T.D. & Levine, R. 2004, "A comparison of web and mail surveyresponse rates", Public opinion quarterly, vol. 68, no. 1, pp. 94-101.
Kassubek, D.O.M., Wiedmann, K.P., Pankalla, D.O.L., Hennigs, N., Seegebarth, D.O.B. &Platz, K. 2011, "The Adoption of Sustainable Solutions in the Automotive Sector", 10thInternational Marketing Trends Conference, Paris, 20th-22nd January, 2011.
Keinonen, T. & Takala, R. 2006, Product concept design : a review of the conceptual designof products in industry, Springer, Berlin ; London.
Keller, K.L. 2003, "Brand Synthesis: The Multidimensionality of Brand Knowledge",Journal of Consumer Research, vol. 29, no. 4, pp. 595-600.
Kelloway, E.K. 1998, Using LISREL for structural equation modeling: A researcher's guide,Sage Publications, Inc, Thousand Oaks, California.
Kiel, G.C. & Layton, R.A. 1981, "Dimensions of Consumer Information Seeking Behavior",Journal of Marketing Research, vol. 18, no. 2, pp. 233-239.
Kim, J., Forsythe, S., Gu, Q. & Moon, S.J. 2002, "Cross-cultural consumer values, needs andpurchase behaviour", Journal of Consumer Marketing, vol. 19, no. 6, pp. 481-502.
Kirton, M.J. 1994, Adapters and innovators : styles of creativity and problem solving,Routledge, London.
Kleiser, S.B. & Mantel, S.P. 1999, "Expertise: Consumer Expertise" in Handbook ofmarketing scales : multi-item measures for marketing and consumer behavior research,2nd edn, Sage Publications, Thousand Oaks, California, pp. 71-72.
Kleiser, S.B. & Mantel, S.P. 1994, "The dimensions of consumer expertise: A scaledevelopment", AMA Summer Educators Proceedings, vol. 5, pp. 20–26.
Knapman, C. 2012, Quantum leap for road safety, Telegraph Media Group Limited, London.
Kock, A. 2007, "Innovativeness and Innovation Success-A Meta-Analysis", Zeitschrift fürBetriebswirtschaft, , no. Special Issue 2, pp. 1-21.

223
Korenok, O., Hoffer, G.E. & Millner, E.L. 2010, "Non-price determinants of automotivedemand: Restyling matters most", Journal of Business Research, vol. 63, pp. 1282-1289.
Kotabe, K. & Swan, K.S. 1995, "The Role of Strategic Alliances in High Technology NewProduct Development", Strategic Management Journal (1986-1998), vol. 16, no. 8, pp.621.
Kotler, P., Armstrong, G., Saunders, J. & Wong, V. 2001, Principles of Marketing. ThirdEuropean edn, Prentice Hall, New Jersey.
Kotler, P. 1991, Marketing management : analysis, planning, implementation, and control,7th edn, Prentice-Hall, New Jersey.
Kotler, P. & Keller, K.L. 2006, Marketing management, Twelfth edn, Prentice Hall, NewJersey.
Kressmann, F., Sirgy, M.J., Herrmann, A., Huber, F., Huber, S. & Lee, D.J. 2006, "Directand indirect effects of self-image congruence on brand loyalty", Journal of BusinessResearch, vol. 59, no. 9, pp. 955-964.
Kreuzbauer, R. & Malter, A.J. 2007, "Product Design Perception and Brand Categorization",Advances in Consumer Research Vol Xxxiv, vol. 34, pp. 240-246.
Krippendorff, K. 2004, Content analysis : an introduction to its methodology, 2nd. edn, Sage,Thousand Oaks, Calif. ; London.
Kurpis, L.H.V., Bozman, C.S. & Kahle, L.R. 2010, "Distinguishing between amateur sportparticipants and spectators: the List of Values approach", International Journal of SportManagement and Marketing, vol. 7, no. 3, pp. 190-201.
Laaksonen, P. 1994, Consumer Involvement: Concepts and Research, Routledge, London.
Lakshmanan, A. & Krishnan, H.S. 2011, "The Aha! Experience: Insight and DiscontinuousLearning in Product Usage", Journal of Marketing, vol. 75, no. 6, pp. 105-123.
Lamming, R. 1993, Beyond partnership: strategies for innovation and lean supply, PrenticeHall, New York.
Lane, B. & Banks, N. 2010, Low Carbon Vehicle Partnership Car Buyer Survey: Improvedenvironmental information for customers [Homepage of Low Carbon VehiclePartnership], [Online]. Available: http://www.lowcvp.org.uk/infosearch.asp [2011,4/15].
Langford, B.E., Schoenfeld, G. & Izzo, G. 2002, "Nominal grouping sessions vs focusgroups", Qualitative Market Research, vol. 5, no. 1, pp. 58-70.
Laroche, M., Kim, C. & Zhou, L. 1996, "Brand Familiarity and Confidence as Determinantsof Purchase Intention: An Empirical Test in a Multiple Brand Context", Journal ofBusiness Research, vol. 37, pp. 115-120.

224
Lauffer, R. 2004, The Global Prosumer: Some headline findings, Euro RSCG Worldwide,London.
Laurent, G. & Kapferer, J.N. 1985, "Measuring consumer involvement profiles", Journal ofMarketing Research, vol. 22, no. 1, pp. 41-53.
Lawson, R.W. 1988, "The Family Life Cycle: A Demographic Analysis", Journal ofMarketing Management, vol. 4, no. 1, pp. 13-32.
Lee, N. & Lings, I. 2008, Doing business research: a guide to theory and practice, SagePublications Ltd, London.
Lennox, N. & McClaren, N., 2003. "Measuring consumer involvement: a test of theautomobile involvement scale", Australian and New Zealand Marketing Academy.Conference (1st - 3rd December 2003: Adelaide, South Australia), pp. 364.
Levitt, T. 1960, "Marketing Myopia", Harvard business review, vol. 38, no. 4, pp. 45-56.
Lilley, C. 2004, European Consumer Attitudes: Using Consumer Attitudes as the BrandCompass, Unpublished Powerpoint Presentation Dec, 2004 edn, Brentwood, Essex.
Lindemann, U., Maurer, M. & Braun, T. 2009, Structural complexity management : anapproach for the field of product design, Springer, Berlin.
Litosseliti, L. 2003, Using focus groups in research, Continuum, New York ; London.
Loch, C. & Kavadias, S. 2007, Handbook of new product development management,Routledge.
Loginova, O. 2010, "Brand familiarity and product knowledge in customization",International Journal of Economic Theory, vol. 6, no. 3, pp. 297-309.
Luhmann, C.C., Ahn, W. & Palmeri, T.J. 2006, Theory-based categorization under speededconditions, Springer, New York.
Magee, B. 2010, The story of philosophy, Doring Kindersley Ltd, London.
Malhotra, N.K. & Birks, D. 2007, Marketing Research: an applied approach: 3rd EuropeanEdition, 3rd edn, Pearson Education, Harlow.
Mandler, G. 1981, "The Structure of Value: Accounting for Taste" in Affect and cognition :the seventeenth annual Carnegie Symposium on Cognition, eds. M. Clark & S.T. Fiske,Lawrence Erlbaum Associates, Hillsdale, New Jersey, pp. 3-36.
Mantonakis, A., Whittlesea, B.W.A. & Yoon, C. 2008, "Consumer memory, fluency, andfamiliarity" in Handbook of Consumer Psychology, eds. C.P. Haugtvedt, P.M. Herr &F.R. Kardes, Psychology Press, New York, pp. 77–102.

225
Marek, J. 2011, "Automotive MEMS sensors — Trends and applications", VLSI Technology,Systems and Applications (VLSI-TSA), 2011 International Symposium, April, 2011, pp.1.
Mau, P., Eyzaguirre, J., Jaccard, M., Collins-Dodd, C. & Tiedemann, K. 2008, "The‘neighbor effect’: Simulating dynamics in consumer preferences for new vehicletechnologies", Ecological Economics, vol. 68, pp. 504-516.
May, J. 2011, We need to crack the hydrogen headache, 1st edn, Telegraph Media GroupLimited, London.
McCarthy, M. 1995, "Cars of the future: What consumers want", Adweek, vol. 45, no. 41, pp.4.
McCormick, S., Underwood, S. & Wang, S. 2012, "The Changing Car: New VehicleTechnologies" in Aging America and Transportation: Personal Choices and PubliucPolicy, eds. J.F. Coughlin & L.A. D'Ambrosio, Springer Publishing Company, NewYork, pp. 57-76.
McDonald, M. & Dunbar, I. 2004, Market Segmentation: How to do it, How to profit from it,Elsevier Butterworth Heinemann, Oxford.
McFadden, D.L. & Train, K.E. 1996, "Consumers' evaluation of new products: Learningfrom self and others", Journal of Political Economy, vol. 104, no. 4, pp. 683-703.
McFedries, P. 2002, The Word Spy [Homepage of Logophilia Limited], [Online]. Available:http://www.wordspy.com/words/prosumer.asp [2004, 8/26].
McManus, W. 2012, Ford ejects in-car CD players – will you miss them? [Homepage ofWhich? Conversation - Transport and Travel], [Online]. Available:http://conversation.which.co.uk/transport-travel/ford-ejects-in-car-cd-players-will-you-miss-them/ [2012, 01/15].
Medin, D.L. & Barsalou, L.W. 1990, "16 Categorization processes and categoricalperception" in Categorical perception : the groundwork of cognition, ed. S.R. Harnad,Reprint Edition edn, Cambridge University Press, Cambridge, pp. 455-490.
Mehta, R., Hoegg, J. & Chakravati, A. 2011, "Knowing Too Much: Expertise Induced FalseRecall Effects in Product Comparison", Journal of Consumer Research, vol. 38, no. 3,pp. 535-554.
Menge, J.A. 1962, "Style change costs as a market weapon", The Quarterly Journal ofEconomics, vol. 76, no. 4, pp. 632-647.
Meyer, M.H. & Roberts, E.B. July, 1986, "New Product Strategy in Small Technology-BasedFirms: A Pilot Study", Management Science, vol. 32, no. 7, pp. 806-821.
Meyers-Levy, J. & Tybout, A.M. 1989, "Schema Congruity As A Basis For ProductEvaluation", Journal of Consumer Research, vol. 16, no. 1, pp. 39.

226
Michaut, A. 2004b, Bring structure, make it simple! Template-based products overcomeinitial product complexity, Presentation to the 33rd EMAP Conference, Murcia, Spain(May, 2004).
Michaut, A. 2004a, Consumer acceptance of new products with application to foods.,Unpublished Thesis - Wageningen University, Holland.
Michaut, A., van Trijp, H. & Steenkamp, J.E.M. 2001b, "What’s new? A multi-dimensionalapproach to product newness", European Advances in Consumer Research, vol. 5, pp. 1-15.
Michaut, A., van Trijp, H. & Steenkamp, J.E.M. 2001a, Dimensions of Product newness andtheir differential effect on market success, Presentation to EMAC Conference, Braga,Portugal.
Miles, M.B. & Huberman, A.M. 1994, Qualitative data analysis: An expanded sourcebook,2nd edn, SAGE publications, Inc.
Moors, E., Enzing, C., van der Giessen, A. & Smitts, R. 2003, "User-producer interactions infunctional genomics innovations", Innovation: management, policy & practice, vol. 5,no. 2-3, pp. 120-143.
Mordin, C. 2004, Connecting with Consumers - 4Cs Genesis [Homepage of Young &Rubicam], [Online]. Available:http://www.4cs.yr.com/public_ftp/_outgoing/origin4c.ppt [2013, 1/20].
Moreau, C.P., Lehmann, D.R. & Markman, A.B. 2001, "Entrenched knowledge structuresand consumer response to new products", Journal of Marketing Research, vol. 38, no. 1,pp. 14-29.
Morley, D. 2006, Look at what the cat dragged in [Homepage of Drive], [Online]. Available:http://www.drive.com.au/editorial/articledetail.aspx?ArticleID=11249 [2013, 01/24].
Morris, L., Abrams, D., Randsley de Moura, G. & Durlach, P. 2003, "Delaying theinevitable?: The effects of "time to think" on responses to innovative concepts",European Journal of Marketing, vol. 37, no. 10, pp. 1440-1456.
Morton, M.C., Schuitema, G. & Anable, J. 2011, "Electric Vehicles: Will Consumers getCharged Up?", 43rd Annual Conference - Universities' Transport Study GroupOpenUniversity, Milton Keynes, 5-7, January, 2011.
Moultrie, J. & Fraser, P. 2004, Better product design : assessing and improving productdesign capability, Institute for Manufacturing, Cambridge.
Mowen, J.C. & Harris, E.G. 2003, "The MDPS method of message theme development: anew tool for managers", Journal of Consumer Marketing, vol. 20, no. 5, pp. 428-445.
Mukherjee, A. & Hoyer, W.D. 2001, "The effect of novel attributes on product evaluation",Journal of Consumer Research: An Interdisciplinary Quarterly, vol. 28, no. 3, pp. 462-472.

227
Muncy, J.A. & Hunt, S.D. 1984, "Consumer involvement: definitional issues and researchdirections", Advances in Consumer Research, vol. 11, no. 1, pp. 193-196.
Murphy, P. & Staples, W. 1979, "A modernized family life cycle", Journal of ConsumerResearch, vol. 6, pp. 12-22.
Nakash, R., Hutton, J., Jørstad-Stein, E., Gates, S. & Lamb, S. 2006, "Maximising responseto postal questionnaires–a systematic review of randomised trials in health research",BMC medical research methodology, vol. 6, no. 1, pp. 5-14.
Nakata, C., Im, S., Park, H. & Ha, Y. 2006, "Antecedents and consequence of Korean andJapanese new product advantage", Journal of Business Research, vol. 59, no. 1, pp. 28-36.
Nel, K. 2012, Why I Hate “Like” [Homepage of Esomar], [Online]. Available:http://rwconnect.esomar.org/2012/01/17/why-i-hate-like/ [2012, 01/18].
Netemeyer, R.G., Bearden, W.O. & Sharma, S. 2003, Scaling procedures: Issues andapplications, Sage Publications, Inc, Thousand Oaks, California.
Neuendorf, K.A. 2002, The Content Analysis Guidebook, Sage, London.
Neuman, W.L. 1991, Social research methods: qualitative and quantitative approaches,Allyn and Bacon, Boston.
Novick, L. 1988, "Analogical Transfer, Problem Similarity and Expertise", Journal ofExperimental Psychology: Learning, Memory and Cognition, vol. 14, no. 3, pp. 510-520.
Nunnally, J.C. 1978, Psychometric theory, 2nd edn, McGraw-Hill, New York.
Nurrenbern, S.C. & Robinson, W.R. 1998, Conceptual Questions and Challenge Problems -Conceptual Questions (CQs): What Are Conceptual Questions? [Homepage of Journalof Chemical Education], [Online]. Available:http://jchemed.chem.wisc.edu/JCEDLib/QBank/collection/CQandChP/CQs/WhatAreCQs.html [2010, 30/11].
Ofek, E. & Sarvary, M. 2003, "R&D, marketing, and the success of next-generationproducts", Marketing Science, vol. 22, no. 3, pp. 355-370.
Office for National Statistics 2011, Family Spending 2011 Edition, Office for NationalStatistics, Newport.
Office for National Statistics 2010, The National Statistics Socio-economic Classification(NS-SEC rebased on the SOC2010) [Homepage of Office for National Statistics],[Online]. Available: http://www.ons.gov.uk/ons/guide-method/classifications/current-standard-classifications/soc2010/soc2010-volume-3-ns-sec--rebased-on-soc2010--user-manual/index.html?format=print [2012, 07/06].
Ogden, J. & Nicholas, M. 2011, "Analysis of a “cluster” strategy for introducing hydrogenvehicles in Southern California", Energy Policy, , pp. 1-16.

228
Oliver, P. 2004, Writing your thesis, Sage Publications Ltd, London.
Olson, J.C. & Muderrisoglu, A. 1979, "The stability of responses obtained by free elicitation:Implications for measuring attribute salience and memory structure", Advances inConsumer Research, vol. 6, pp. 269-275.
Oppenheim, A.N. 1992, Questionnaire design, interviewing and attitude measurement,Pinter, London.
O'Reilly, A. 2001, The Empowered Consumer in the Age of Globilization - White Paper -Number Five. [Homepage of Euro RSCG Worldwide], [Online]. Available:http://www.eurorscglife.ca/WPGlocal.pdf [2004, 05/26].
Ostlund, L.E. 1974, "Perceived Innovation Attributes as Predictors of Innovativeness",Journal of Consumer Research (pre-1986), vol. 1, no. 2, pp. 23-29.
Ozaki, R. 2011, "Adopting sustainable innovation: what makes consumers sign up to greenelectricity?", Business Strategy and the Environment, vol. 20, no. 1, pp. 1-17.
Pallant, J. 2010, SPSS Survival Manual, 4th edn, Open University Press, Maidenhead.
Paredes, M. 2011, Brand Loyalty, Volume of Trade and Leapfrogging: Consumer Behavior inMarkets of Durable Experience Goods. Available:http://scholar.google.co.uk/scholar?hl=en&q=brand+loyalty%2C+volume+of+trade+and+leapfrogging&lr=lang_en&as_sdt=0%2C5&as_ylo=&as_vis=0 [2011, 04/15].
Park, C.W., Jaworski, B.J. & MacInnis, D.J. 1986, "Strategic brand concept imagemanagement", Journal of Marketing, vol. 50, pp. 133-145.
Park, C.W. & Lessig, V.P. 1981, "Familiarity and its impact on consumer decision biases andheuristics", Journal of Consumer Research, vol. 8, no. 2, pp. 223-231.
Park, C.W., Mothersbaugh, D.L. & Feick, L. 1994, "Consumer knowledge assessment",Journal of Consumer Research, vol. 21, no. 1, pp. 71-82.
Pauwels, K., Silva-Risso, J., Srinivasan, S. & Hanssens, D.M. 2004, "New products, salespromotions, and firm value: The case of the automobile industry", Journal of Marketing,vol. 68, no. 4, pp. 142-156.
Pell, A. 2011, I really feel we're getting to know each other, Driver., The Sunday Times,London.
Peter, J.P. & Olson, J.C. 2010, Consumer Behavior, 10th edn, McGraw-Hill HigherEducation, London.
Punj, G.N. & Staelin, R. 1983, "A model of consumer information search behavior for newautomobiles", Journal of Consumer Research, vol. 9, pp. 366-380.
Quester, P. & Lim, A.L. 2003, "Product involvement/brand loyalty: is there a link?", Journalof Product & Brand Management, vol. 12, no. 1, pp. 22-38.

229
Quinton, S. & Smallbone, T. 2006, Postgraduate research in business : a critical guide,Sage, London.
Radford, S.K. & Bloch, P.H. 2011, "Linking innovation to design: Consumer responses tovisual product newness", Journal of Product Innovation Management, vol. 28, no. s1,pp. 208-220.
Ratneshwar, S., Pechmann, C. & Shocker, A.D. 1996, "Goal-Derived Categories and theAntecedents of Across-Category Consideration", Journal of Consumer Research, vol.23, no. 3, pp. pp. 240-250.
Revelle, J.B., Moran, J.W. & Cox, C.C. 1998, The QFD handbook, Wiley, New York.
Reynolds, N. & Ruiz de Maya, S. 2013, "The impact of complexity and perceived difficultyon consumer revisit intentions", Journal of Marketing Management, vol. 29, no. 5-6, pp.625-645.
Richins, M.L. & Bloch, P.H. 1986, "After the new wears off: the temporal context of productinvolvement", Journal of Consumer Research, vol. 13, pp. 280-285.
Ries, A.l. & Trout, J. 1986, Positioning: the battle for your mind, McGraw-Hill, London.
Robertson, T.S. 1971, Innovative Behavior and Communication, Holt, Rinehart, and Winston,New York.
Rogers, E.M. 1995, Diffusion of innovations, 4th edn, Free Press, New York ; London.
Rogers, E.M. & Shoemaker, F.F. 1971, Communication of innovations : a cross-culturalapproach, 2nd edn, Free Press, New York.
Rokeach, M. 1973, The Nature of Human Values, Collier-Macmillan Publishers, London.
Rolstad, S., Adler, J. & Rydén, A. 2011, "Response Burden and Questionnaire Length: IsShorter Better? A Review and Meta-analysis", Value in Health, vol. 14, pp. 1101-1108.
Rossiter, J.R. 2002, "The C-OAR-SE procedure for scale development in marketing",International Journal of Research in Marketing, vol. 19, no. 4, pp. 305-335.
Rothaermel, F.T. & Deeds, D.L. 2004, "Exploration and exploitation alliances inbiotechnology: A system of new product development", Strategic Management Journal,vol. 25, no. 3, pp. 201-221.
Rowley, J. 2000, "Product search in e-shopping: a review and research propositions", Journalof Consumer Marketing, vol. 17, no. 1, pp. 20-35.
Rowntree, D. 1991, Statistics without tears: a primer for non-mathematicians, Penguin,London.
Rufford, N. 2012, Electric dream powers down, The Sunday Times, London.

230
Sahar, S. 1999, "Interestingness via what is not interesting", Proceedings of the fifth ACMSIGKDD international conference on Knowledge discovery and data miningACM, , pp.332.
Saker, J. 2013, MSc Induction - Foundations in Management, Course Notes - Lecture (9thApril, 2013) edn, Loughborough University, School of Business & Economics,Loughborough.
Santini, D.J. & Vyas, A.D. 2005, Suggestions for a New Vehicle Choice Model SimulatingAdvanced Vehicles Introduction Decisions (AVID): Structure and Coefficients, Centerfor Transportation Analysis, Energy Systems Division, Argonne National Laboratory,University of Chicago, Illinois.
Sasu, C. & Ariton, M.V. 2011, "Factors Influencing Passenger Car Consumer Behavior andtheir Use in the Environmental Public Policy", EuroEconomica, vol. 27, no. 1, pp. 20-26.
Saunders, M., Lewis, P. & Thornhill, A. 2009, Research methods for business students, 5thedn, Pearson Education Limited, Harlow.
Scherer, K.R. (ed) 1999, Appraisal theory, John Wiley & Sons Ltd, New York.
Schlosser, A.E. 2003, "Experiencing products in the virtual world: The role of goal andimagery ininfluencing attitudes versus purchase intentions", Journal of ConsumerResearch, vol. 30, no. 2, pp. 184.
Schmidt, R.A. & Pioch, E. 1996, "Serving the Euro-consumer: a marketing challenge or acase for intervention?", Marketing Intelligence & Planning, vol. 15, no. 5, pp. 14-19.
Schoormans, J.P.L. & Robben, H.S.J. 1997, "The effect of new package design on productattention, categorization and evaluation", Journal of Economic Psychology, vol. 18, no.2-3, pp. 271-287.
Schumacker, R.E. & Lomax, R.G. 2010, A beginner's guide to structural equation modeling,Third edn, Taylor Francis Group, New York.
Searle, J.R. 1995, The construction of social reality, Allen Lane, London.
Sethuraman, R., Tellis, G.J. & Briesch, R.A. 2011, "How Well Does Advertising Work?Generalizations from Meta-Analysis of Brand Advertising Elasticities", Journal ofMarketing Research (JMR), vol. 48, no. 3, pp. 457-471.
Shapiro, S., Spence, M.T. & Gregan‐Paxton, J. 2009, "Factors affecting the acquisition andtransfer of novel attribute relationships to new product categories", Psychology andMarketing, vol. 26, no. 2, pp. 122-144.
Sharma, S.C. 1996, Applied multivariate techniques, Wiley, New York.
Sheller, M. 2003, Automotive Emmotions: Feeling the Car [Homepage of Department ofSociology], [Online]. Available: http://www.comp.lancs.ac.uk/socilogy/soc124ms.pdf[2004, 05/25].

231
Sherman, R. & Hoffer, G. 1971, "Does Automobile Style Change Payoff?", AppliedEconomics, vol. 3, no. 3, pp. 153-165.
Shillito, M.L. 2001, Acquiring, processing, and deploying voice of the customer, St. LuciePress, Boca Raton, Florida.
Shimp, T. & Sharma, S. 1983, "The Dimensionality of Involvement: A Test of theAutomotive Involvement Scale", Winter Conference in Causal Modeling,AmericanMarketing Association, , pp. 58.
Silvia, P.J. 2005, "What is interesting? Exploring the appraisal structure of interest.",Emotion, vol. 5, no. 1, pp. 89-102.
Simonsohn, U. 2011, "Lessons from an "Oops" at Consumer Reports: Consumers followexperts and ignore invalid information", Journal of Marketing Research, vol. 48, no. 1,pp. 1-12.
Simpson, T.W., Siddique, Z. & Jiao, J. 2006, Product platform and product family design :methods and applications, Springer, New York.
Slater, R. & Crumley, D. 2011, Creating a Critical Path Analysis Diagram: Activity on NodeMethod-Mini Lecture. Available: http://hdl.handle.net/10633/31070 [2011, 06/08].
Smith, G. 2009, Political marketing : segmentation, brand and competitive strategies in theU.K., PhD edn, Loughborough University, Business School, Loughborough.
Smyth, R., 2004, "Exploring the usefulness of a conceptual framework as a research tool: Aresearcher's reflections", Issues in Educational Research, vol. 14, no. 2, pp. 167-180.
Spector, P.E. 1981, Research Designs, Sage Publications Inc., Beverley Hills, California.
Srinivasan, R., Lilien, G.L., Rangaswamy, A., Pingitore, G.M. & Seldin, D. 2012, "The totalproduct design concept and an application to the auto market", Journal of ProductInnovation Management, vol. 29, no. S1, pp. 3-20.
Steg, L. 2005, "Car use: lust and must. Instrumental, symbolic and affective motives for caruse", Transportation Research Part A: Policy and Practice, vol. 39, no. 2-3, pp. 147-162.
Steinberg, B. 2012, Study: Young Consumers Switch Media 27 Times An Hour, AdvertisingAge, New York.
Stern, H. 1962, "The significance of impulse buying today", The Journal of Marketing, vol.26, no. 2, pp. 59-62.
Stradling, S.G. 2002, Persuading People Out Of Their Cars [Homepage of Napier UniversityProfessional Lecture, 27 March 2002.], [Online]. Available:http://www.its.leeds.ac.uk/projects/mobilenetwork/downloads/StradlingESRCMobNetPleasureDec02.doc [2004, 05/18].

232
Stuteville, J.R. 1968, "The buyer as a salesman", The Journal of Marketing, vol. 32, no. 3, pp.14-18.
Sujan, M. 1985, "Consumer knowledge: Effects on evaluation strategies mediating consumerjudgments", Journal of Consumer Research, vol. 12, no. 1, pp. 31-46.
Sweeney, J.C. & Soutar, G.N. 2001, "Consumer perceived value: The development of amultiple item scale", Journal of Retailing, vol. 77, no. 2, pp. 203-220.
Tabachnick, B.G. & Fidell, L.S. 2007, Using multivariate statistics, 5th edn, PearsonEducation, Boston.
Talke, K., Salomo, S., Wieringa, J.E. & Lutz, A. 2009, "What about Design Newness?Investigating the Relevance of a Neglected Dimension of Product Innovativeness",Journal of Product Innovation Management, vol. 26, no. 6, pp. 601-615.
Taylor-West, P., Fulford, H., Reed, G., Story, V. & Saker, J. 2008, "Familiarity, expertise andinvolvement: key consumer segmentation factors", Journal of Consumer Marketing, vol.25, no. 6, pp. 361-368.
Taylor-West, P., Saker, J. & Champion, D. 2013b, "Simply being aware of a new productdoesn’t mean it is understood", Proceedings of the Academy of Marketing Conference,pp. [CD-ROM].
Taylor-West, P., Saker, J. & Champion, D. 2012, "The benefits of using reduced itemvariable scales in marketing segmentation.", Journal of Marketing Communications,[Online], , pp. 1-9. Available from: http://dx.doi.org/10.1080/13527266.2012.723026.
Taylor-West, P., Saker, J. & Champion, D. 2011b, "Segmentation and Communication ofEnvironmental Products in the European Car Market", Proceedings of the BritishAcademy of Management, pp. [CD-ROM].
Taylor-West, P., Saker, J. & Champion, D. 2011a, "The Need for Differing MarketingMessages and Segmentation Strategies in the Automotive Sector", Proceedings of theAcademy of Marketing Academy of Marketing, Liverpool, June, 2011, pp. [CD-ROM].
Taylor-West, P., Saker, J. & Champion, D. 2013a, "Segmenting for complexity: persuadingpeople to buy what they don't understand", Journal of Strategic Marketing, vol. 21, no.4, pp. 332-346.
Teddlie, C. & Tashakkori, A. 2009, Foundations of mixed methods research: Integratingquantitative and qualitative approaches in the social and behavioral sciences, SagePublications Inc., Thousand Oaks, California.
Teichman, J. & Evans, K.C. 1991, Philosophy: a beginner's guide, Basil Blackwell Ltd,Oxford.
The Economist 2012b, Self-driving cars: Safer at any speed? [Homepage of The Economist],[Online]. Available: http://www.economist.com/node/21548992 [2012, 03/19].

233
The Economist 2012a, What happened to the flying car? [Homepage of The Economist],[Online]. Available: http://www.economist.com/node/21548491 [2012, 03/19].
thevaluescompany , socialvaluesTM [Homepage of thevaluescompany, Hindhead, Surrey],[Online]. Available: http://www.thevaluescompany.com/insight/how_it_works.html[2004, 12/17].
Tkaczynski, A. & Rundle-Thiele, S.R. 2011, "Event segmentation: A review and researchagenda", Tourism Management, vol. 32, pp. 426-434.
Tobin, D. 2012b, 24-carat protection on a cotton wool budget, The Sunday Times, London.
Tobin, D. 2012a, It's like I always say Daddy - less is more, The Sunday Times, London.
Tomaseti, E. & Ruiz, S. May, 2004, "Attribute type and product meaning on new productevaluation: the additional moderating effects of need for cognition", 33rd EMACConference, Murcia, SpainEMAC, Brussels, 18-21 May , 2004.
Train, K.E. & Winston, C. 2007, "Vehicle choice behavior and the declining market share ofUS automakers", International Economic Review, vol. 48, no. 4, pp. 1469-1496.
Transport Research Board 2004, TCRP Report 36 - Market Segmentation Strategies toIncrease Transit Ridership [Homepage of National Academy of Sciences], [Online].Available: http://www4.nationalacademies.org/trb/crp.nsf/All+Projects/TCRP+B-09[2005, 10/20].
Urban, G.L. & Hauser, J.R. 2004, "“Listening In” to Find and Explore New Combinations ofCustomer Needs", Journal of Marketing, vol. 68, no. 2, pp. 72-87.
Urban, G.L., Weinberg, B.D. & Hauser, J.R. 1996, "Premarket forecasting of really-newproducts", The Journal of Marketing, vol. 60, no. 1, pp. 47-60.
van Raaij, W.F. & Verhallen, T.M.M. 1994, "Domain-specific market segmentation",European Journal of Marketing, vol. 28, no. 10, pp. 49-66.
van Rijnsoever, F., Farla, J. & Dijst, M.J. 2009, "Consumer car preferences and informationsearch channels", Transportation Research Part D-Transport and Environment, vol. 14,no. 5, pp. 334-342.
Vercauteren, A. 2005, "Customer and User Terminology in the Context Of TechnologicalInnovation: A Literature Review and a Tentative Terminological Framework.", 12thInternational Product Development Management Conference, CopenhagenEuropeanInstitute for Advanced Studies in Management, Brussels, 12-14 June, 2005.
Veryzer, R.W. 1998, "Discontinuous Innovation and the New Product DevelopmentProcess", Journal of Product Innovation Management, vol. 15, pp. 304-321.
von Hippel, E. 1986, "Lead Users: A Source of Novel Product Concepts", ManagementScience, vol. 32, no. 7, pp. 791-805.

234
VonRiesen, R.D. & Herndon, N.C. 2011, "Consumer Involvement With the Product and theNature of Brand Loyalty", Journal of Marketing Channels, vol. 18, no. 4, pp. 327-352.
Warman, M. 2011, Making gadgets beautiful, Telegraph Media Group Limited, London.
Watson, J.J. 1999, "A Cross-Cultural Comparison Of The Explanatory Power Of MaterialismAnd Life Cycle Stage For Important Possessions", Seventh Cross-Cultural Consumerand Business Studies Research ConferenceCross-Cultural Consumer and BusinessStudies Research Conference, Cancun, Mexico, 12-15 December, 1999.
Weinstein, A. 2004, Handbook of Market Segmentation, Third edn, Haworth Press, NewYork.
Wells, V.K., Chang, S.W., Oliveira-Castro, J. & Pallister, J. 2010, "Market segmentationfrom a behavioral perspective", Journal of Organizational Behavior Management, vol.30, no. 2, pp. 176-198.
Wells, W.D. & Gubar, G. 1966, "Life cycle concept in marketing research", Journal ofMarketing Research, vol. 3, pp. 355-363.
Whitfield, T.W.A. 2009, "Theory confrontation: Testing the categorical-motivation model",Empirical Studies of the Arts, vol. 27, no. 1, pp. 43-59.
Whittington, R. 1996, "Strategy as practice", Long range planning, vol. 29, no. 5, pp. 731-735.
Wiedmann, K.P., Hennigs, N., Pankalla, L., Kassubek, M. & Seegebarth, B. 2011, "Adoptionbarriers and resistance to sustainable solutions in the automotive sector", Journal ofBusiness Research, vol. 64, no. 11, pp. 1201-1206.
Wilcox, J. 2012, Fickle Americans sure return lots of tech devices [Homepage of betanews],[Online]. Available: http://betanews.com/2012/10/01/fickle-americans-sure-return-lots-of-tech-devices/ [2012, 10/02].
Wilcox, J. 2011, Microsoft will take Toyota cars to thecloud [Homepage of Betanews], [Online]. Available:http://www.betanews.com/joewilcox/article/Microsoft-will-take-Toyota-cars-to-the-cloud/1302123564 [2011, 04/08].
Williams, D. 2012, A peek under Britain's bonnet, 1st edn, The Sunday Times, London.
Williams, D. 2010b, Dream new Mercedes-Benz Biome - the car at one with nature[Homepage of Telegraph Media Group Limited], [Online]. Available:http://www.telegraph.co.uk/motoring/motor-shows/los-angeles-auto-show/8146053/Dream-new-Mercedes-Benz-Biome-the-car-at-one-with-nature.html[2010, 11/10].
Williams, D. 2010a, Pontiac - death of an American icon [Homepage of Telegraph MediaGroup Limited], [Online]. Available:

235
http://www.telegraph.co.uk/motoring/news/8102644/Pontiac-death-of-an-American-icon.html [2010, 11/5].
Wiseman, F. 1971, "A Segmentation Analysis on Automobile Buyers During the New ModelYear Transition Period", The Journal of Marketing, vol. 35, no. 2, pp. 42-49.
Wood, C. 2012, Ford Focus Torque Vectoring Control Explained [Homepage ofAutoguide.com News], [Online]. Available: http://www.autoguide.com/auto-news/2010/12/2012-ford-focus-torque-vectoring-control-explained.html [2012, 03/06].
Wood, S.L. & Lynch Jr, J.G. 2002, "Prior knowledge and complacency in new productlearning", Journal of Consumer Research, vol. 29, no. 3, pp. 416-426.
WPP Group 2005, Homepage of the WPP Group. Available: http://www.wpp.com/ [2005,1/10].
Wright, A. 2004, Email on Freshenings Data, Email message received 23rd Jan, 2004 edn,Ford Motor Company UK, Essex.
Wright, K.B. 2005, "Researching Internet‐based populations: Advantages and disadvantagesof online survey research, online questionnaire authoring software packages, and websurvey services", Journal of Computer‐Mediated Communication, vol. 10, no. 3, pp. 00-00.
Wu, L.W. 2011, "Inertia: Spurious Loyalty or Action Loyalty?", Asia Pacific ManagementReview, vol. 16, no. 1, pp. 31-50.
Wunderman Knabs 2003, Using Social Values to Enhance Focus 2003 - DirectCommunications, Unpublished Powerpoint presentation edn, Wunderman, London.
Yaghmale, F. 2009, "Content validity and its estimation", Journal of medical education, vol.3, no. 1, pp. 25-27.
Young and Rubicam Inc. 2002, There are seven kinds of people in the world, Young &Rubicam Inc., London.
Zaichkowsky, J.L. 1985b, "Measuring the involvement construct", Journal of consumerresearch, vol. 12, pp. 341-352.
Zaichkowsky, J.L. 1985a, "Familiarity: product use, involvement or expertise?", Advances inconsumer research, vol. 12, pp. 296-299.
Zajonc, R.B. 1984, "On the primacy of affect.", American Psychologist, vol. 39, no. 2, pp.117-123.
Zajonc, R.B. 1980, "Feeling and Thinking: preferences need no inferences.", AmericanPsychologist, vol. 35, no. 2, pp. 151-175.
Ziamou, P.L. 2002, "Commercializing new technologies: consumers' response to a newinterface", Journal of Product Innovation Management, vol. 19, no. 5, pp. 365-374.

236
Ziamou, P.L. 1999, "The effect of the degree of newness of a really new product onconsumers' judgments", Advances in Consumer Research, vol. 26, pp. 368-371.

237
APPENDICES
Appendix 1 - Motor Industry Vehicle Classifications
SEGMENT NOTES FORD VAUXHALL ROVER OTHERS (for example)
A - - Mini Fiat Cinquecento, Suzuki Alto
Sub B Ka - Rover 100 Peugeot 107, Citroen Saxo,
Seat Arosa
B Fiesta Corsa - Renault Clio, VW Polo, Fiat
Punto, Nissan Micra, Skoda
Felicia
C Focus Astra Rover
200/400
Peugeot 307, Renault Megane,
Toyota Corolla, VW Golf,
Honda Civic, Citroen Xsara
C/D Mondeo
(Focus)
Vectra Rover 600 Renault Laguna, Nissan
Primera, Peugeot 407, VW
Passat, Audi A4, BMW 3
Series, Toyota
Avensis
D/E - Omega Rover 800 Audi A6, BMW 5 Series,
Volvo S/V 70, Mercedes E
Class
Speciality(S) Sports
Coupes
Probe
Puma
(Cougar)
Calibra
Tigra
Rover 200
Coupe
Fiat Coupe, BMW 3 Series
Coupe, Peugeot 407
Coupe
F Luxury (Lincoln) - - Rolls Royce, Jaguar, BMW 7
Series, Audi V8, Mercedes S
Class
G Luxury
Sports
- - - Porsche, BMW 6/8 Series,
Ferrari, Jaguar XK8
J Off Road
Vehicles
Maverick
Explorer
Frontera
Monterey
Land Rover
Discovery
Range Rover
Chrysler Cherokee, Toyota
Landcruiser
M Multi
Purpose
Vehicles
Galaxy Sintra - Peugeot 807, Renault Espace,
VW Sharan
H (Others) - - - Other Specialist Manufacturers

238
Appendix 2 – Geneva Motor Show Questionnaire –English version

239
Appendix 3 - Explanation of Technological Option Packs for Ford Focus
Convenience Pack – cost £525 including VAT (available on Zetec and above models only)
comprising the following:
Active Park Assist: Uses sensors to park the car without touching the steering wheel. You
control the accelerator and brake.
Driver Assistance Pack - cost £750 including VAT (available on Titanium and Titanium X
models only) comprising the following items:
Traffic Sign Recognition: Automatically reads standard road signs and displays the speed
limit in the cockpit.
Blind Spot Information System: Alerts you to vehicles in your blind spots with a warning
light in the door mirror.
Lane Departure Warning: Detects when your car strays unintentionally towards road lane
markings and provides a warning via the steering wheel.
Lane Keeping Aid: Applies steering force away from the direction of travel to help you
recognise that corrective action is required.
Driver Fatigue Alert: Visual and audio warning if the system detects driving behaviour that
indicates a drop in alertness.
Auto High Beam: Switches the headlights from high beam to low beam when oncoming
traffic is detected and then back to high beam when the road is clear.
Low Speed Safety System: Automatically applies the brakes in slow moving traffic if the
system detects that a collision is likely.

240
Appendix 4 – Combined Data DisplayQ
2: W
hat i
s th
e m
inim
um it
mus
t hav
e?Ne
wne
ssPe
rcep
tions
Valu
esCh
arac
teris
tics
Com
plex
ityEx
pert
ise
Invo
lvem
ent
Fam
iliarit
y -
Ford
Fam
iliarit
y -
Focu
sKn
ows
optio
ns
Wou
ldbu
yop
tions
Wou
ldlik
e to
have
optio
ns1.
Air
cond
ition
ing…
par
k se
nsor
sFa
milia
rity
Need
s: F
unct
iona
lIn
nate
pre
fere
nces
Com
patib
ility
Low
35
77
54
62.
It w
ould
hav
e to
hav
e AB
SFa
milia
rity
Need
s: F
unct
iona
lIn
nate
pre
fere
nces
Com
patib
ility
Low
76
77
74
53.
Hea
ted
front
scr
een…
ABS
, air
cond
ition
ing…
any
thin
g th
at I
can
affo
rd re
ally
for c
omfo
rt an
dpl
easu
re…
Fam
iliarit
yNe
eds:
Fun
ctio
nal
Inna
te p
refe
renc
esLo
w6
67
76
55
4. A
ir co
nditi
onin
g, fo
ldin
g m
irror
s, c
ity p
ack,
hea
ted
front
scr
een…
and
par
k se
nsor
sFa
milia
rity
Need
s: F
unct
iona
lIn
nate
pre
fere
nces
Com
patib
ility
Low
64
73
25
64.
Doo
r lig
hts
in th
e bo
ttom
of t
he d
oor p
ocke
t, pu
ddle
ligh
t... a
nyth
ing
with
saf
ety
is a
plu
s.Fa
milia
rity
Need
s: F
unct
iona
lIn
nate
pre
fere
nces
Com
patib
ility
Low
64
73
25
65.
Rel
iabi
lityTa
ngib
leBe
nefit
sTe
rmin
al (e
nd)
Adva
ntag
eLo
w3
43
52
44
6. I
woul
dn’t
cons
ider
now
buy
ing
a ca
r tha
t did
n’t h
ave
powe
r ste
erin
g, a
utom
atic
bra
king
syst
em, t
hose
sor
t of t
hing
s.Fa
milia
rity
Need
s: F
unct
iona
lIn
nate
pre
fere
nces
Com
patib
ility
Low
32
33
23
5
7. I
thin
k pr
obab
ly th
e lo
oks.
.. bu
t I w
ould
wan
t the
func
tions
as
well
Perc
eptu
alNe
eds:
Soc
ial
Obj
ect
Obs
erva
bility
Low
67
75
34
38.
… d
efro
stin
g of
the
front
win
dscr
een
Fam
iliarit
yNe
eds:
Fun
ctio
nal
Inna
te p
refe
renc
esC
ompa
tibilit
yLo
w3
54
34
44
9. Y
ou w
ant a
t lea
st w
hat y
ou’ve
got
at t
he m
omen
t and
if p
ossi
ble
som
ethi
ng w
hich
that
mak
eslif
e a
little
bit
mor
e co
nven
ient
Fam
iliarit
yNe
eds:
Fun
ctio
nal
Inna
te p
refe
renc
esAd
vant
age
Low
45
27
12
3
10. I
wou
ld w
ant e
very
thin
g th
at w
as th
ere
befo
re, I
had
an
expe
rienc
e wh
en I
chan
ged
toTo
yota
... a
nd fo
und
I cou
ldn’
t get
traf
fic re
ports
any
mor
e...
I nea
rly g
ot to
the
poin
t to
taki
ng it
back
.
Fam
iliarit
yNe
eds:
Fun
ctio
nal
Inna
te p
refe
renc
esC
ompa
tibilit
yLo
w2
45
52
35
11.W
hat I
hav
e in
the
car n
ow.
Fam
iliarit
yNe
eds:
Fun
ctio
nal
Inna
te p
refe
renc
esC
ompa
tibilit
yLo
w5
74
23
35
12. I
agr
ee th
at p
eopl
e do
n’t l
ike
to g
o ba
ckwa
rds
beca
use
you
beco
me
accu
stom
ed to
thin
gsdo
n’t y
ou,
Fam
iliarit
yNe
eds:
Fun
ctio
nal
Inna
te p
refe
renc
esC
ompa
tibilit
yLo
w6
65
54
34
Fam
iliarit
ySc
hem
asPe
rson
alRe
lativ
eLo
wEx
posu
reC
once
ptua
l ble
ndin
gO
bjec
tAd
vant
age
Med
ium
Sens
ory
Bene
fits
Pseu
doC
ompa
tibilit
yHi
ghTa
ngib
leNe
eds:
Fun
ctio
nal
Soci
al C
ogni
tion
Com
plex
ityIn
tang
ible
Need
s: S
ocia
lIn
stru
men
tal (
mea
ns)
Tria
labi
lityNo
velty
Need
s: E
xper
ient
ial
Term
inal
(end
)O
bser
vabi
lityVa
riety
How
new?
Inna
te p
refe
renc
esC
ompl
exity
New
to w
hom
?C
ogni
tive
stim
ulat
ion
Perc
eptu
alEp
iste
mic
Con
cept
ual
Conc
eptu
al h
eadi
ngs
take
n fro
m L
itera
ture
Rev
iew

241
Appendix 5 – Pre-test Questionnaire – Page 1 of 3

242
Appendix 5 – Pre-test Questionnaire – Page 2 of 3

243
Appendix 5 – Pre-test Questionnaire – Page 3 of 3

244
Appendix 6 – Meeting structure with FoB Communications Manager
Meeting with Richard Beard 21.10.11
I want to ask them about segmentation; basically from my own experience from working for
a Ford agency, I know they have brand managers that provide a detailed profile of the type of
person that will be interested in particular models and I know it is very detailed.
My questions will be about how they come up with the profile – background research,
sources of data that kind of thing.
And then I want to discuss how they then identify the market segment to match that profile
from their marketing data.
I would also like to discuss how they update the marketing data and how deep they go in their
data collection.
I appreciate that some detail of the discussions will have to remain confidential because of
their commercial value/intellectual property; all I need is an understanding.

245
Appendix 7 – Sample of Feedback to the Pilot Questionnaire

246
Appendix 8 – Main Questionnaire – Page 1 of 12

247
Appendix 8 – Main Questionnaire – Page 2 of 12

248
Appendix 8 – Main Questionnaire – Page 3 of 12

249
Appendix 8 – Main Questionnaire – Page 4 of 12

250
Appendix 8 – Main Questionnaire – Page 5 of 12

251
Appendix 8 – Main Questionnaire – Page 6 of 12

252
Appendix 8 – Main Questionnaire – Page 7 of 12

253
Appendix 8 – Main Questionnaire – Page 8 of 12

254
Appendix 8 – Main Questionnaire – Page 9 of 12

255
Appendix 8 – Main Questionnaire – Page 10 of 12

256
Appendix 8 – Main Questionnaire – Page 11 of 12

257
Appendix 8 – Main Questionnaire – Page 12 of 12

258
Appendix 9 – Email Invitation for Main Questionnaire – Page 1 of 2

259
Appendix 9 – Email Invitation for Main Questionnaire – Page 2 of 2

260
Appendix 10 – Automotive Research Panel Invitation and Consent Form - Page
1 of 2

261
Appendix 10 – Automotive Research Panel Invitation and Consent Form - Page
2 of 2

262
Appendix 11 – Confidentiality Query by Panel Member

263
Appendix 12 – TV Car Adverts Invitation

264
Appendix 13 – TV Adverts and Product Video Questionnaire – Page 1of 6

265
Appendix 13 – TV Adverts and Product Video Questionnaire – Page 2 of 6

266
Appendix 13 – TV Adverts and Product Video Questionnaire – Page 3 of 6

267
Appendix 13 – TV Adverts and Product Video Questionnaire – Page 4 of 6

268
Appendix 13 – TV Adverts and Product Video Questionnaire – Page 5 of 6

269
Appendix 13 – TV Adverts and Product Video Questionnaire – Page 6 of 6

270
Appendix 14 – Doctoral Colloquiums and PhD Seminars attended
Doctoral Colloquium Papers
European Marketing Academy, Ljubljana, Slovenia – May, 2011
‘Empirical investigation into the use of complexity levels in marketing segmentation and the
categorisation of new automotive products’
Academy of Marketing, Liverpool – June, 2011
‘Empirical investigation into the use of complexity levels in marketing segmentation and the
categorisation of new automotive products’
Midlands Regional Doctoral Colloquium, Birmingham Business School – April, 2013
‘The benefits of using reduced item variable scales in marketing segmentation’
PhD Seminars
Marketing & Retailing Doctoral Presentations, Loughborough University, School of Business
& Economics, - May, 2011.
‘Using complexity levels as a tool for marketing segmentation and the categorisation of new
automotive products’
Graduate School Research Gala, Loughborough University, - May, 2011.
‘Epistemic and Perceptual Newness – Segmentation Strategy in the European car Market’
Marketing & Retailing Doctoral Presentations, Loughborough University, School of Business
& Economics, - May, 2013.
‘Empirical investigation into the use of complexity levels in marketing segmentation and the
categorisation of new automotive products’

271
Appendix 15 – Core Texts and Search Terms Used

272
Appendix 16 – Summary of Exploratory Meetings and Interviews

273
Appendix 17 – Socio-Demographic Categorisations used in the study

274
Appendix 18 – Summary of Instruments used in the surveys