empirical investigation of how user experience is...
TRANSCRIPT

Empirical investigation of how user experience is affected by response time in a web application.
MASTER OF SCIENCE THESIS IN SOFTWARE ENGINEERING
Johan Rangardt Matthias Czaja
Software Engineering and Technology CHALMERS UNIVERSITY OF TECHNOLOGY Gothenburg, Sweden, 2017

2
The Author grants to Chalmers University of Technology and University of Gothenburg the non-exclusive right to publish the Work electronically and in a non-commercial purpose make it accessible on the Internet. The Author warrants that he/she is the author to the Work, and warrants that the Work does not contain text, pictures or other material that violates copyright law.
The Author shall, when transferring the rights of the Work to a third party (for example a publisher or a company), acknowledge the third party about this agreement. If the Author has signed a copyright agreement with a third party regarding the Work, the Author warrants hereby that he/she has obtained any necessary permission from this third party to let Chalmers University of Technology and University of Gothenburg store the Work electronically and make it accessible on the Internet.
Empirical investigation of how user experience is affected by response time in a web application
© JOHAN RANGARDT, MATTHIAS CZAJA, April 2017.
Supervisor: PROF. DR. TONY GORSCHEK Examiner: MIROSLAW STARON
Chalmers University of TechnologyDepartment of Software Engineering and Technology SE-412 96 GöteborgSwedenTelephone + 46 (0)31-772 1000
Department of Software Engineering and Technology Göteborg, Sweden, April 2017

3
Abstract User experience (UX) is the user’s perceptions of a system or service, as well as the behavioural and emotional responses from usage or anticipated use of a system or service. Furthermore, UX is multidimensional in its nature, and it is influenced by the system of use, the context in which the system is used, and the user’s internal state.
UX is divided into four main dimensions, namely pragmatic, hedonic, appealingness, and emotions, where pragmatic is considered the perceived usability by the user, and hedonic represents the attributes that create stimulation and identification for the user. Moreover, appealingness is the user’s overall judgement of the system, meanwhile emotions are the outcomes from usage of a system.
The aim of this study was to investigate the impact that response time, which is an attribute of the system component, of a web application, has on the user experience attributes; pragmatic, hedonic, appealingness and emotions.This study was carried out by first executing a literature review that covers important literature in the field of user experience. Second, designing and executing an online- based experiment, which involved two identical web applications, where the only difference was one second in response time. In total, 100 participants attended the experiment, of which 50 participants were assigned to the fast version, and the other 50 were assigned to the slow version of the web application. The experiment was conducted within 20 days.
The results of statistical analysis, which was performed on the experiment data, revealed that there was no significant impact that response time has on user experience.Several factors have been identified that possibly had a negative impact on the experiment. However, the results of this study can be used to continue with further research on user experience in relation to response time of web applications.
Keywords: User Experience, pragmatic, hedonic, appealingness, pleasure, response time, web application.

4
Table of Content 1 Introduction ............................................................................................................................ 6
1.1 Delimitations ............................................................................................................................... 8
2 Background ............................................................................................................................ 9 2.1 User Experience ........................................................................................................................ 9
2.1.1 Context ..................................................................................................................................... 9 2.1.2 User ...................................................................................................................................... 10 2.1.3 System .................................................................................................................................. 10 2.1.4 Hedonic Quality (HQ) ............................................................................................................ 11 2.1.5 Pragmatic Quality (PQ) .......................................................................................................... 12 2.1.6 Appeal .................................................................................................................................... 12 2.1.7 Consequence .......................................................................................................................... 12
2.2 Response Time .......................................................................................................................... 13
3 Related Work ....................................................................................................................... 14
4 Methodology ......................................................................................................................... 15 4.1 Literature Review Methodology ............................................................................................. 15
4.1.1 Design and Execution of the Literature Review .................................................................... 16 4.1.2 Data Extraction ...................................................................................................................... 19
4.2 Experiment Design ................................................................................................................... 20 4.2.1 Goal ........................................................................................................................................ 20 4.2.2 Hypotheses ............................................................................................................................. 20 4.2.3 Variables ................................................................................................................................ 21 4.2.4 Participants ............................................................................................................................. 21 4.2.5 Objects ................................................................................................................................... 22 4.2.6 Instrumentation ...................................................................................................................... 22 4.2.7 Data Collection Procedure ..................................................................................................... 26 4.2.8 Data Analysis Procedure ........................................................................................................ 26 4.2.9 Hypotheses Testing ................................................................................................................ 29 4.2.10 Evaluation of Validity ........................................................................................................ 30 4.2.11 Experiment Testing ............................................................................................................ 32
4.3 Analysis ...................................................................................................................................... 32 4.3.1 Normality tests ....................................................................................................................... 32

5
5 Results ................................................................................................................................... 34 5.1 Experiment Execution .............................................................................................................. 34 5.2 Hypothesis Testing ................................................................................................................... 38 5.3 Additional Tests ........................................................................................................................ 40
6 Conclusion ............................................................................................................................ 42 6.1 Future Work ............................................................................................................................. 43
7 References ............................................................................................................................. 44
8 Appendix ............................................................................................................................... 48 8.1 Appendix A. .............................................................................................................................. 48 8.2 Appendix B. ............................................................................................................................... 49
8.2.1 Appendix B1. Guidelines in English ...................................................................................... 49 8.2.2 Appendix B2. Guidelines in Swedish .................................................................................... 49 8.2.3 Appendix B3. Guidelines in German ..................................................................................... 50
8.3 Appendix C. .............................................................................................................................. 51 8.3.1 Appendix C1. Pre-Questionnaire in English .......................................................................... 51 8.3.2 Appendix C2. Pre-Questionnaire in Swedish ........................................................................ 52 8.3.3 Appendix C3. Pre-Questionnaire in German ......................................................................... 53
8.4 Appendix D. .............................................................................................................................. 54 8.5 Appendix E. ............................................................................................................................... 55
8.5.1 Appendix E1. Final Questionnaire in English ....................................................................... 55 8.5.2 Appendix E2. Final Questionnaire in Swedish ...................................................................... 56 8.5.3 Appendix E3. Final Questionnaire in German ....................................................................... 57
8.5 Appendix F. Raw Experiment Data. ....................................................................................... 58
8.5 Appendix G. Table of varience, mean, and number of participants ................................... 61 8.5 Appendix H. Results From the Normality Tests. .................................................................. 64 8.5 Appendix I. Hypothesis Testing Test Results. ....................................................................... 55

6
1 Introduction
User experience (UX) is a fuzzy term that is defined in several ways by different researchers and practitioners. Current definitions of UX focus towards different perspectives that reach from psychology to business [1]. Some definitions are more quality oriented, while others are more value oriented [1].
This paper is based on the UX definition by ISO 9241-210:2010, “A person’s perceptions and responses that result from the use or anticipated use of a product, system or service” [2], which is considered as a quality oriented definition.
Moreover, a person’s perception of a product is classified into three main categories, namely pragmatic qualities, hedonic qualities, and appealingness, which eventually result in different responses represented by behavioural and emotional reactions [3]. Furthermore, UX is influenced by three major components. The user’s internal state, characteristics of the system that the user is interacting with, and the context in which the interaction takes place. All have a major influence on the user’s experience [4]. Elaboration on UX will be continued in 2. Background.
Usability related research focuses on objective measurements, like for example users’ accomplishments, efficiency and effectiveness [5], UX in comparison is subjective in its nature because it relates to users’ perceptions and feelings about a product [5].
However, UX research up to now is primarily focusing on aesthetics and beauty, even though users’ experience may be affected by usability related factors as well [5]. The response time of a system for example, which is considered an important factor in the field of usability [6] and a significant important system attribute particularly in web- based applications [7], has an impact on the user satisfaction [8], but its impact on user experience remains unclear from a research perspective. In other words, most research discussing response time focuses on software quality and usability [8] [9]. Due to this reason, response time in relation to UX has been predominantly neglected up to now. This thesis is therefore approaching the question of how users perceive different response times in specific contexts of a web-based application and what the consequences might be.
Since not much work is done in the field of UX related to response time, this study is important to widen the UX studies towards other directions than traditional human- computer-interaction areas, such as beauty and aesthetics. This study can also be a starting point for future, more in depth, studies on UX related to response time.

7
Due to usability and UX being quality aspects of a system and to the importance of increasing awareness of UX and usability throughout development processes, it can be stated that the content of this thesis might be helpful for all software practitioners [43].
By investigating the effect response time has on UX, practitioners may get a better idea of how important the response time is in web applications and therefore spend appropriate amount of resources on optimizing their servers and web applications.
In this study, an experiment was conducted, in which two different response times of a web application were evaluated. The web applications were identical, except one version responded one second faster than the other one. The purpose of this study was to evaluate the different response times’ impact on the user experience related attributes: hedonic qualities, pragmatic qualities, appealingness, and emotions from a researcher's point of view. The experiment was run using web users as participants performing the test online.
However, according to the results of the experiment, all four hypotheses stated within this study were rejected. That means, that the impact of response time on different users experience attributes was not statistically supported. Further hypotheses were stated in relation to the participants’ characteristics, but the results revealed no statistical significance.
Nevertheless, this study provides a new approach in the field of user experience and can be used for future research, to investigate this field more from a pragmatic perspective.
This thesis is divided into six sections. The introduction and background section provide an overview of the topic and introduce the problem domain based on related work. The methodology section covers research question and applied research methodologies including literature review, experiment design and performance. Results from the experiment performed within this study are outlined in the results section. The results are then further discussed in the conclusion section, which also contains personal reflections upon the study and ideas for future work.

8
1.1 Delimitations This study is delimited to the following constraints:
• This study is only investigating how UX is affected by response time, and no other attributes.
• This study is restricted to investigate UX for web usage, and the results may not apply to other usage areas.
• None of the newly constructed attributes of UX are investigated. The reason for this is that many have no relation to the established UX models and frameworks [10].
• The emotion concept, in this study, is limited to the pleasure dimension of emotions. The reason is because emotions are mainly studied in psychology, which requires more work than possible in a master thesis study.
• Traditional usability is not investigated in this study. However, the perceived usability by the users, named as pragmatic qualities, is one of the concepts measured.

9
2 Background
2.1 User ExperienceThere are various approaches to describe and define user experience (UX), but most researchers agree that UX is dynamic, subjective, context dependent [11] and non-task oriented [4].Users perceive systems along two different dimensions, which are defined as pragmatic qualities and hedonic qualities. Based on the perceptions of these qualities during system use, the user forms judgement of appealingness, which further has an impact on users’ behavior and emotions [3]. Figure 2.2 illustrates the order of these events. Moreover, experiences can be made within different time spans that are classified into four categories. Users’ might have an indirect experience with a system before using it for the first time (anticipated UX). That experience is generated by previous experience with similar or related technologies, or other peoples’ opinions [1]. Momentary UX (during usage) describes the experiences users’ make during the interaction with an encountered system [1], while cumulative UX focuses on experiences made with the system over a significant longer period. Another category, namely episodic UX, relates to how users reflect upon their experiences after a specific episode of usage [1]. However, episodic UX should not be seen as a sum of the momentary UX, it is rather a measure of the peak effect and the end effect of an experience [12]. Research has also shown that quantitative data gathered during usage and after usage is similar, but the qualitative data differs [13]. Moreover, the context, user, and system, which form the user experience will be further explained in this chapter. The concepts pragmatic qualities, hedonic qualities, appealingness and consequences will also be explained in this chapter.
2.1.1 Context Context change may have an impact on UX, even though the object of interaction remains the same. Context in UX is multidimensional. Examples of different contextual situations are to use a system in a bus or in the office but also to use it alone or with other people.Context in UX can be classified into four categories, namely physical context, social context, temporal context, and task context [11] and represents environment and circumstances in which the user interacts with the system (see Figure 2.1).

10
• Physical context refers to tangible physical surroundings and their movement, temperature, lighting, but also the current location and noises. In other words, the physical context includes everything that the user can feel or see in the surroundings [11].
• Social context refers to the impact and expectations that surrounding people have for the user [11]. An example would be if a user browses a web page meanwhile interacting with a couple of friends, the focus of the webpage experience would be different than if the user was alone.
• Temporal context refers to the time that a user has for interacting with a system. However, time itself has no direct effect on the user experience, but rather affects other attributes, which in turn have an impact on user experience [11]. An example of temporal context is finding out what track the train is on, when the time to departure is short.
• Task context refers to the surrounding tasks, which are not part of the system, but that also require attention [1] [11]. Making a phone call, for instance, might be a surrounding task while booking train tickets through web site on a computer, which represents the main task.
2.1.2 UserThe user’s current internal state, which includes mood, motivation, needs, predispositions, and expectations, may have an impact on the UX as well. A user in a good mood for example will more likely have a better experience than a user in a bad mood interacting with the same product [14].However, user’s internal state might alter while interacting with the system. In other words, the user experience can change the user’s mood, as well as the user’s mood might change the user experience.Besides, the user’s physical resources may influence UX, for example carrying a bag in one hand while interacting with a mobile device with the other. However, physical resources do not belong to the user’s internal state, even though it contributes to the UX component “User” [11].As mentioned earlier, users also form expectations before encountering a system. These expectations are formed by previous experiences with related technology [1].
2.1.3 SystemA system’s characteristics, such as usability, functionality, aesthetic, and designed interactive behaviour, naturally have an impact on the user experience during product use [15].The system component does not only refer to the part of the system being used, but rather all the subsystems being involved as well [11]. The parts of a system may include products, objects, services, persons, and infrastructure [11].Parts that the user cannot manipulate or control, are considered parts of the context component rather than of the system component [11]. Likewise, parts that do not communicate with the system being used or investigated are also considered a part of the

11
context component [11].
Figure 2.1: An overall explanation of the three main components forming the user experience
To clarify what is a part of the system component, an example is when browsing a web application on the computer. The webpage itself, the computer, the Internet connection and the used browser are all parts of the system component.
2.1.4 Hedonic Quality (HQ)Hedonic attributes are non-instrumental, subjective, and relate to the product’s perceived ability to support the user’s feelings, for example feeling competent, feeling related to others, or feeling special. Hedonic attributes are also considered as the attributes that provide pleasure for the users [16].Furthermore, hedonic qualities can be divided into three dimensions, namely stimulation, identification, and evocation.
Stimulation refers to the products ability to help the user towards personal development, such as development of skills [17]. In order for a product to do so, it needs to be novel, challenging, provide users with new impressions and opportunities [17] [18]. An example that would provide high stimulation is a new, interesting, and fun way of interacting with a web application.

12
Identification in contrast, is about people’s needs to identify themselves through what physical objects they have [17]. People do this to be accepted by their relative others, and for social recognition in general. Therefore, identification is an entirely social aspect [18].
An example of situation where identification is important is, if an individual has decided to purchase a new mobile phone, and all his friends have an iPhone, most likely this individual will also purchase the same product.Moreover, evocation refers to the fact, that products can induce memories. In other words, a user might connect a certain product with feelings, relationships, or events from the past, in which the user encountered that product before [17].
An example would be to play a vintage computer game that one used to play as a child. These games rather provide positive memories of one’s childhood, rather than superb graphics and complex interaction possibilities.
2.1.5 Pragmatic Quality (PQ)Pragmatic attributes represent the perceived usability by the users [16]. In order to understand pragmatic qualities, they can be seen as so called do-goals [18]. Do-goals are the user’s overall practical goals of using a product. An example of a do-goal is to find and listen to a podcast episode on a webpage.To assist the users in achieving their do-goals, the product needs proper functionality and understandable ways to access this functionality [17].
Typically, a system with good pragmatic qualities should be clear, supporting, and controllable, but can also possess other pragmatic qualities [17].
2.1.6 AppealUsers form judgement of a system’s appealingness, which can be considered as an overall judgement. Appeal includes attributes such as good/bad and pleasant/unpleasant. Based on a products hedonic qualities and pragmatic qualities, users form this overall judgement named as appeal (see Figure 2.2). Pragmatic qualities and hedonic qualities both contribute equally to the users’ judgement of appeal [3].
2.1.7 ConsequenceUsing a product with particular characteristics in a particular context can lead to two different outcomes. One of them is behavioural consequence, such as increased usage frequency. The other outcomes that product use can lead to are emotional consequences such as satisfaction, pleasure or joy, but also frustration and disappointment [3] [17] [19].

13
Figure 2.2: Illustration of how the user perceives a system, forms an overall judgement, which results in behavioral and
emotional consequences [20].
2.2 Response TimeIn most cases, response time is defined as the time it takes from the point when a user initializes a request to the point when the server responds with the first byte [8]. However, in this study, response time is defined as the time it takes from the point when the server responds with the first byte to point when the webpage is fully rendered by the user’s browser.The reason for this definition is that there is no possibility within this experiment to measure the DNS-lookup, initial connection, and the time to first byte (TTFB).Also, according to the speed tests done, the DNS-lookup, initial connection, and TTFB seem stable, and differ between 0.2-0.4 seconds.

14
3 Related Work
There is not much research done addressing response time in relation to user experience. However, work and material related to this study is presented below.
[8] is measuring usability attributes such as ease of use, learning, and user satisfaction in relation to response time of a web application. The results of the paper indicate that user satisfaction, which is considered an emotion in user experience; decreases as the response time increases. To measure user satisfaction, the expectations need to be measured prior to usage of a system, to have something to compare with [17], which was not done in [8]. Furthermore, response time is stated in [6] as an important factor in usability, which is perceived by users as pragmatic quality. In addition, Hassenzahl states in [20] that users perceive both, pragmatic and hedonic qualities, as two separate attributes.
[21] measures a system's usefulness, response time and entertainment in relation to the emotional attributes surprise and delight. The response time had a minor effect on surprise and no effect on delight. The limitation of the paper is the fact that the emotional responses are only investigated on one car manufacturers website. The authors encourage other researchers to make similar investigations in other contexts.

15
4 Methodology
4.1 Literature Review MethodologyA literature review methodology is used to ensure the reliability of the references in this thesis (step 1, Figure 4.1). Two methodologies were reviewed, namely Systematic Literature Review and Snowball Sampling.
Figure 4.1: Overview of the literature review, divided into planning phase and an execution phase
Systematic Literature Review (SLR) is a mature, rigid and heavy methodology, developed by Kitchenham. SLR is based on keyword searches to gather all relevant research in a field of study [22]. Snowball sampling on the other hand uses a starting paper, and either goes backwards in time by investigating the references of the starting paper or forward in time by investigating
16
papers, which cite the starting paper. Even though SLR provides a larger quantity of papers, the conclusion of the same study [23] using the two different literature review methods were proven to be similar. Therefore, a variant of snowball sampling is used in this thesis (step 2, Figure 4.1).
4.1.1 Design and Execution of the Literature ReviewThe snowball sampling method was designed as [24] suggests. Additionally, citation as a criterion for judging papers were added to the literature review design in order to prevent validity threats such as cognitive biases [25] (step 3, Figure 4.1).
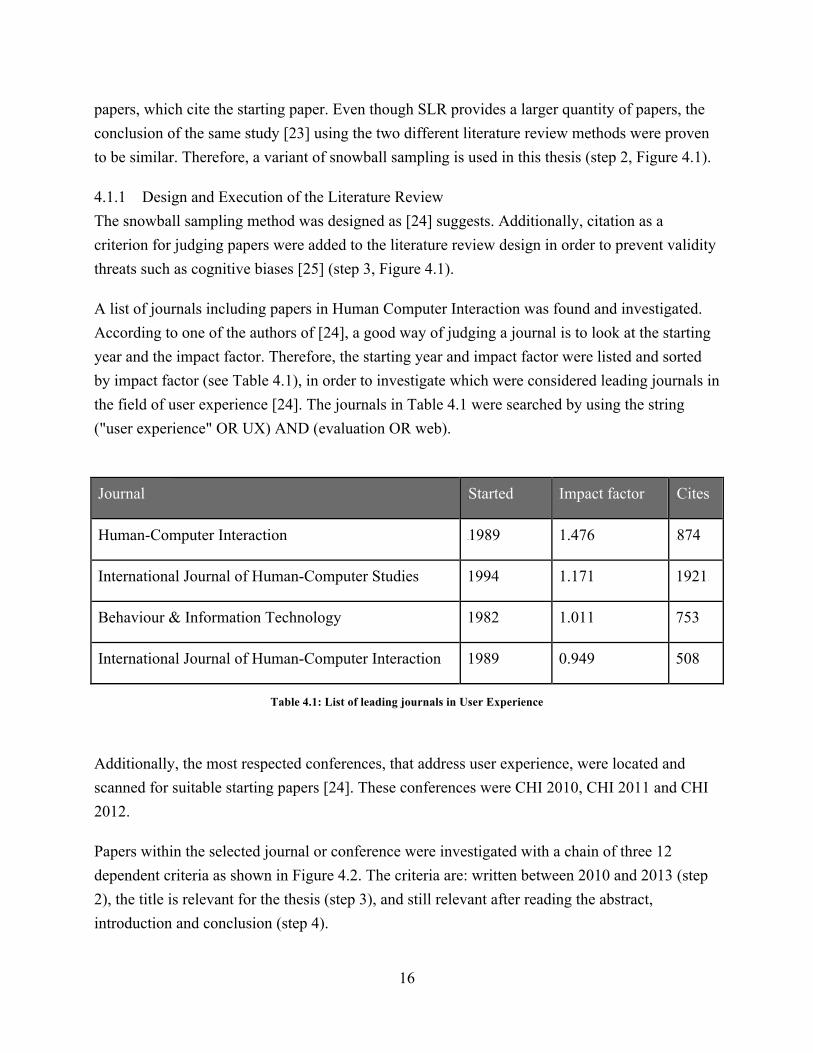
A list of journals including papers in Human Computer Interaction was found and investigated. According to one of the authors of [24], a good way of judging a journal is to look at the starting year and the impact factor. Therefore, the starting year and impact factor were listed and sorted by impact factor (see Table 4.1), in order to investigate which were considered leading journals in the field of user experience [24]. The journals in Table 4.1 were searched by using the string ("user experience" OR UX) AND (evaluation OR web).
Journal Started Impact factor Cites
Human-Computer Interaction 1989 1.476 874
International Journal of Human-Computer Studies 1994 1.171 1921
Behaviour & Information Technology 1982 1.011 753
International Journal of Human-Computer Interaction 1989 0.949 508
Table 4.1: List of leading journals in User Experience
Additionally, the most respected conferences, that address user experience, were located and scanned for suitable starting papers [24]. These conferences were CHI 2010, CHI 2011 and CHI 2012.
Papers within the selected journal or conference were investigated with a chain of three 12 dependent criteria as shown in Figure 4.2. The criteria are: written between 2010 and 2013 (step 2), the title is relevant for the thesis (step 3), and still relevant after reading the abstract, introduction and conclusion (step 4).

17
Figure 4.2: The process used to select a starting paper for the snowball sampling
Papers that did not fulfill all criteria were rejected.The authors of this thesis discussed how to define the relevance, and agreed on that the judged papers need to be written in English, published in year 2000 or later, and furthermore they were supposed to be user experience related.However, there were a few exceptions to these rules. Some papers reviewed were published earlier than 2000. Additionally, papers that address long term UX were excluded, mainly because the possibilities of making a long term UX study within a master thesis was not possible. Domain specific UX papers were also excluded. However, if the papers specifically addressed UX in web usage, they were still considered relevant to this thesis.Eleven papers were selected in total, of which nine were accessible. The final nine papers were ranked by citation, which is considered a more objective way of judging a paper, since it will partly prevent cognitive biases [25]. Finally, the most cited paper was selected. The starting paper was found in the conference CHI 2011. CHI is considered one of the most reputable conferences in HCI. Several citations of the chosen starting paper were examined by reviewing in what context the starting paper was cited. This was done in order to ensure the starting paper’s credibility and reputation (step 4, Figure 4.1).

18
The Snowball Sampling execution phase was performed backwards in time (step 5, Figure 4.1). Similar to the starting paper selection model, determined criteria were used in the Snowball Sampling execution model in order to select relevant literature for the thesis.
Figure 4.3: The overall snowball sampling process
Starting systematically from top of the starting paper’s reference list, first, references were verified not to already been reviewed in order to prevent duplicates and thus redundant work (step 2, Figure 4.3). Second, each paper was judged based on the relevance of the title (step 3, Figure 4.3). If the title was considered relevant, the paper was added into the set of papers to be further reviewed but if the title was considered irrelevant, the paper was judged based on the number of citations as Table 4.2 illustrates. If a paper fulfilled the required number of citations, it was added to the set of papers to be further reviewed (step 4, Figure 4.3). Third, abstract, introduction, and conclusion were read of the papers that were to be further reviewed. This was done in order to make a final judgement of their relevance (step 5, Figure 4.3). Papers, which were excluded from this judgement, were: non-English written papers, long term UX studies,

19
domain specific UX studies (except UX web studies), and non-UX and non-usability studies. If the paper fulfilled all the criteria, it was added to the set of accepted papers (step 6, Figure 4.3).
The second level of snowball sampling was performed on all papers that were selected throughout the first level of the snowball sampling. Three levels of snowball sampling are considered enough to cover a field of studies [25]. Therefore, one level of snowball sampling forward in time from the starting paper was also performed.
To perform one level of snowball sampling forward in time is also necessary to include the most recent studies. The papers selected through the forward sampling were judged by the same method as seen in Figure 4.3.
In total, 768 papers were investigated. Abstract, introduction, and conclusion were read in 227 papers, and 71 papers were in the end accepted. Out of the 768 papers, 125 papers were not accessible.
Publishing years Required number of citations
2012 - 2013 5
2010 - 2011 20
2008 - 2009 40
2006 - 2007 60
2004-05 100
Up to 2003 150
Table 4.2: The citation criteria for the snowball sampling
Additionally, the snowball sampling was complemented by searches on Google Scholar for more relevant work.
4.1.2 Data ExtractionA data extraction form was made in order to capture the relevant information in the accepted papers. This was done by designing a set of questions that were then answered for each accepted paper. The data extraction form contained questions about the UX definition and its attributes

20
represented in the specific paper and what methods were used in order to measure them. The entire set of questions can be seen in Appendix A.
The authors of this thesis then individually performed the data extraction for one paper. This was done in order to make sure that the authors had the same understanding of the questions to answer. The results of the data extraction were then compared and discussed.
The other papers were then divided among the authors once the questions were interpreted in the same way.
4.2 Experiment DesignThis experiment aimed to investigate how response time affects user experience on a web application. By investigating this, two different groups were used. One group were exposed to the original web application, and the other group were exposed to the exactly same web application, except that the response time was manipulated to add one additional second. These two groups are further on referred to as the two treatments, and response time is considered to be the factor.Participants were asked to use the web application to fulfill a specific task and additionally to answer a pre-questionnaire and a final questionnaire.
The experiment design was heavily influenced by the book Experimentation in Software Engineering [26], and will be described in detail in this chapter.
4.2.1 GoalThe goal of this study was to evaluate if response time has an impact on hedonic and pragmatic qualities, appealingness, and emotions when using a web application.
4.2.2 Hypotheses In respect to related work of this study (see 3. Related Work), four hypotheses were formulated.Based on that response time is considered an important factor in usability [6] and that pragmatic qualities represent perceived usability; the first hypothesis was formulated:
H1. Longer response time will decrease the perceived pragmatic qualities of the web application.
Results from Hassenzahl’s work show that users can independently perceive pragmatic and hedonic qualities as separate concepts [20], which lead to the second hypothesis:
H2. Response time will not affect the perceived hedonic qualities of the web application.
Since appealingness is formed by the pragmatic and hedonic qualities [20], and based on the

21
previously created hypothesis, H1, that response time has an impact on pragmatic qualities, the third hypothesis was formulated as follows:
H3. Longer response time will decrease the judgement of appealingness.
Surprisingly little work has been done investigating emotional responses in user experience [10]. Some attributes, such as satisfaction and positive surprise, which are considered emotions in UX, have been investigated in relation to response time in earlier studies [8] [21]. The results of those studies show, that both attributes were increasing with lower response times. Therefore, the following hypothesis was derived:
H4. Longer response time will negatively influence the pleasure dimension of emotions.
4.2.3 Variables 4.2.3.1 Independent Variables The independent variable in the experiment will be response time. Response time is also the factor that will be manipulated within the two different treatments, which in this case are:1. Fast response, which refers to the standard response time of the web application. 2. Slow response, which refers to a manipulated version of the web application, where one additional second is added to the standard response time.
4.2.3.2 Dependent VariablesThe dependent variables are perceived hedonic qualities, pragmatic qualities, appealingness and the pleasure dimension of emotions. Those are the variables that are being measured in this experiment.
4.2.4 ParticipantsThe target group of participants in this experiment were web users. Since it is very common to use the web today, the target group must be considered a large group with large variability, which means that a large number of participants is needed. The aim of the participant selection was to get as many participants as possible to reduce errors when generalizing the results [26], therefore convenience sampling was used.
Convenience sampling is based on using people that are nearest and most convenient to reach. Therefore, the nine contributors that have been involved in this project were asked to collect as many participants as possible. The aim was to recruit at least 100 participants or more within a time frame of two weeks. If this was not possible, the time frame needed to be extended until 100

22
participants were recruited. It is also important to point out that participants did not get anything in reward for participating in the experiment due to financial restrictions within this study.
4.2.5 ObjectsThe experimental object was a full working beta version of a web application for podcast users, which was designed and implemented by the researchers for the purpose of this study. Participants had to login through their personal Facebook account which automatically generated their own profile on the web application. The web application provided participants with a set of features that they could explore and interact with. Participants could listen and like podcast episodes that other podcasters previously uploaded. The upload feature also allowed participants to upload their own podcast episodes as well. Before initiating the experiment, 52 different podcast episodes were uploaded by the researchers to provide content. Several performance tests on the web application have revealed that the total loading time of the web application’s landing page is approximately 1.6 seconds. Approximately 80 % of the 1.6 seconds, which is 1.28 seconds, are due to DNS-lookup, initial connections of HTTP-requests, and time to first byte (TTFB). These factors are not affected by the users’ internet connection speeds. However, the download speed of the content relies on the internet connection speed. The total size of the web application’s landing page is 334 kB. Assuming that the internet connections reach their full potentials, a 5 Mbit/s connection will render the page in ≈0.53 seconds, 10 Mbit/s connection in ≈0.27 seconds, and 100 Mbit/s connection in ≈0.03 seconds.
The difference between 5 Mbit/s connection and 10 Mbit/s connection is 0.5 seconds, which means that the additional second of response time that the slow group experience will make a difference even though the internet connection speeds are different.
4.2.6 Instrumentation 4.2.6.1 Guidelines Participants were provided with a general introductory text, which contained short information about the web application, focus of study, and process steps of the experiment specified in order. Additionally, participants were informed about the experiment task, which can be seen in Appendix B. The participants were also informed that they could see the task at any point during the experiment by hovering a button at the bottom of the page.
However, the participants were not informed about the factor, response time, which means that the participants, that were assigned to the slow application, were not aware of that the web application’s response time was manipulated.Furthermore, the participants were informed that

23
they were anonymous, that no sensitive data was stored, and that they were able to withdraw from the experiment if desired at any time.
4.2.6.2 Experiment Task All participants in this experiment performed the same task. This was done due to ensure that the users interacted with the web application and prevent participants to go to the final questionnaire instantly. The task given to the participants included the following five steps:
1. Login with your Facebook login. 2. Like a podcast episode. 3. Follow a user or podcaster. 4. Go to “My Page” to see if the likes and follows are shown 5. Click on “To the Questionnaire” just above this window.
The web application was implemented in such a way that the participants were obligated to fulfill the task for the final questionnaire button to become enabled. If they did not fulfill the task, they were not able to access the final questionnaire and thus not able to complete the experiment.
4.2.6.3 Pre-Questionnaire & Group Dividing Nine general questions were asked in the pre-questionnaire to gather information about the participants’ characteristics, these questions are attached in Appendix C. Participants were additionally asked to type in the code they received to identify them as selected participants. Three of those nine questions were used by an algorithm to divide participants into the two treatments. The algorithm divided participants into the two treatments based on their age, internet experience in years, and level of education. Those characteristics were compared with already existing participants in the database to decide about in which group a particular participant should be placed into. Approximately equal large groups resulted from this procedure, which positively contributed to create an as balanced design as possible from the beginning. The algorithm is attached in Appendix D.
In order to validate the algorithm that was dividing participants into two groups, artificial participants were created by letting the algorithm answer the pre-questionnaire by random. The artificially created participants were equally likely to answer any of the options in the pre-questionnaire. The characteristics of the artificial participants were divided in an equal way, where one group had at most three more participants with a certain character than the other.

24
4.2.6.4 Experiment Requirements Participants, that did not use Mozilla Firefox, Google Chrome, or Safari as their web browser, were not allow to participate in the experiment, since the application was only fully supported by these browsers. If a potential participant did not use any of those browsers, they were advised to download Mozilla Firefox or Google Chrome, and then perform the experiment.
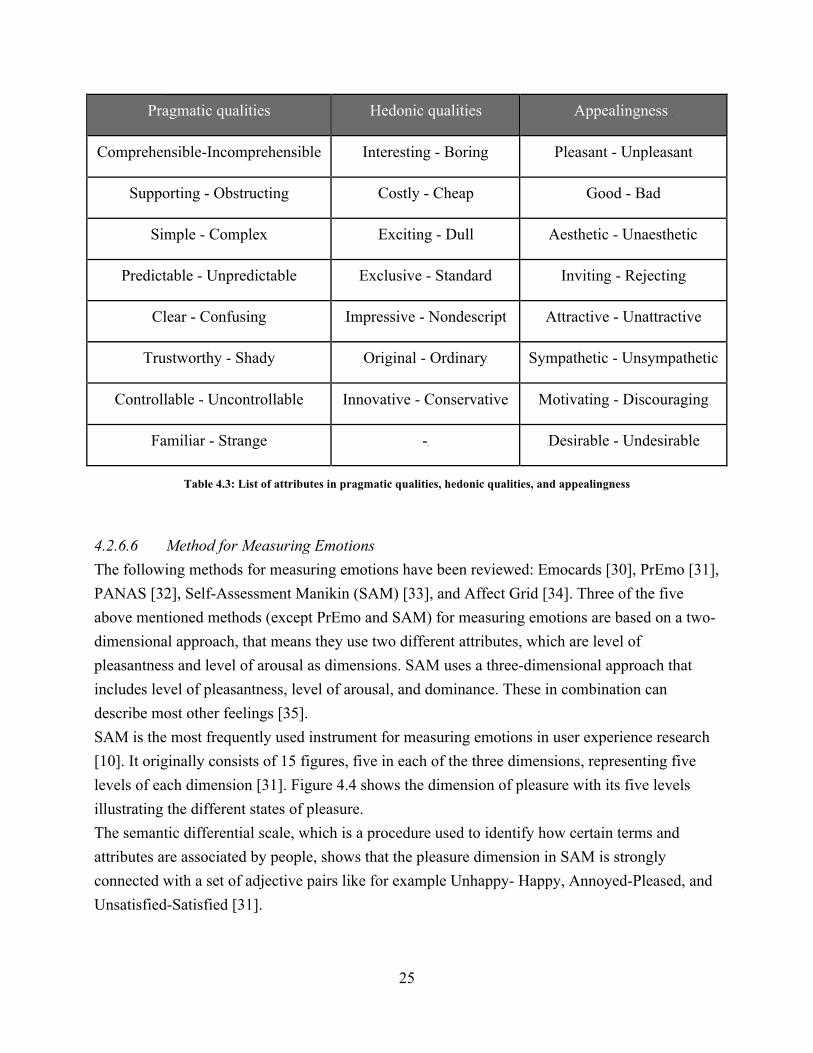
4.2.6.5 Overall UX Measurement Method With the aim to measure pragmatic qualities, hedonic qualities, appealingness, and emotions, several overall user experience and emotion evaluation methods were reviewed.Three methods for measuring overall user experience were reviewed, namely AttrakDiff [27], SUMI [28], and Web Performance Scale [29] were reviewed. SUMI focuses mostly on user satisfaction and traditional usability, rather than on the emotional state of users. Web Performance Scale is tailored for web use and measures pragmatic and hedonic qualities, but it lacks appealingness attributes.AttrakDiff is based on the same model of user experience as presented in this study (see 2. Background) and since it measures pragmatic qualities, hedonic qualities and appealingness, it appeared to be the most suitable method for this study. The measurement model used in this study is therefore inspired by AttrakDiff. Considering that an online-based experiment was run in this study, a subjective measurement scale was used. Furthermore, comparative data was necessary to compare the outcomes of the two treatments. Therefore, a quantitative approach was chosen. Eight pragmatic quality attributes, seven hedonic quality attributes, and eight attributes reflecting appealingness were used. Pragmatic and hedonic qualities are statistically validated to be perceived as independent concepts using the attributes presented in Table 4.3 [20]. The attributes were measured using a 7-item Likert scale, which was presented to the participants after usage of the web application. As mentioned previously in this report, the time span, in which UX is measured, is important to define during experiment planning (see 2.1. User Experience). In this study, Momentary UX and cumulative UX were disregarded due to time and resource restrictions. Therefore, anticipated UX, using a pre-questionnaire before usage, and episodic UX, using a final questionnaire after usage, were in focus within this study.
25
Pragmatic qualities Hedonic qualities Appealingness
Comprehensible-Incomprehensible Interesting - Boring Pleasant - Unpleasant
Supporting - Obstructing Costly - Cheap Good - Bad
Simple - Complex Exciting - Dull Aesthetic - Unaesthetic
Predictable - Unpredictable Exclusive - Standard Inviting - Rejecting
Clear - Confusing Impressive - Nondescript Attractive - Unattractive
Trustworthy - Shady Original - Ordinary Sympathetic - Unsympathetic
Controllable - Uncontrollable Innovative - Conservative Motivating - Discouraging
Familiar - Strange - Desirable - Undesirable
Table 4.3: List of attributes in pragmatic qualities, hedonic qualities, and appealingness
4.2.6.6 Method for Measuring Emotions The following methods for measuring emotions have been reviewed: Emocards [30], PrEmo [31], PANAS [32], Self-Assessment Manikin (SAM) [33], and Affect Grid [34]. Three of the five above mentioned methods (except PrEmo and SAM) for measuring emotions are based on a two-dimensional approach, that means they use two different attributes, which are level of pleasantness and level of arousal as dimensions. SAM uses a three-dimensional approach that includes level of pleasantness, level of arousal, and dominance. These in combination can describe most other feelings [35]. SAM is the most frequently used instrument for measuring emotions in user experience research [10]. It originally consists of 15 figures, five in each of the three dimensions, representing five levels of each dimension [31]. Figure 4.4 shows the dimension of pleasure with its five levels illustrating the different states of pleasure. The semantic differential scale, which is a procedure used to identify how certain terms and attributes are associated by people, shows that the pleasure dimension in SAM is strongly connected with a set of adjective pairs like for example Unhappy- Happy, Annoyed-Pleased, and Unsatisfied-Satisfied [31].

26
However, SAM was found to be the most appropriate method to measure emotions, more specifically the pleasure dimension, in context of this study. Pleasure was decided to be the most interesting dimension to measure. Moreover, due to time and resource restrictions within this study, the dimensions of arousal and dominance were disregarded. It is important to mention that the pleasure dimension in context of SAM refers to the emotion users experience during usage of a system, while the pleasure dimension of appealingness (see Table 4.3) refers to how users judge upon the system.
Figure 4.4: SAM 5-Item Pleasure Scale
4.2.7 Data Collection ProcedureThe data was collected using questionnaires. First, a pre-questionnaire was answered to gather general data about the users.A final questionnaire was used to measure the attributes of the instrumentations. This questionnaire included seven item Likert-scales for the attributes in Table 4.3. In addition, a five-item Likert-scale for measuring the pleasure dimension of emotions was used. Figure 4.4 was used to measure the pleasure dimension as SAM proposes.Since an online-based experiment was conducted, the questionnaires were implemented for web usage and integrated in the web application used in this thesis.
4.2.8 Data Analysis ProcedureFirst, the collected data was tested for normal distribution. To eliminate any possible doubts of the data's distribution, three different tests were reviewed and performed. The used normality tests were CHI-2 Goodness of fit test, Shapiro-Wilk test, and Anderson-Darling test, which will be further described later. If the data was normally distributed, a t-Test and Welch’s t-Test were used for hypothesis testing, and if the data was not normally distributed, a Mann-Whitney and a Kolmogorov-Smirnov test was performed instead. Based on the results of the hypothesis testing, conclusions were drawn. This workflow is illustrated in Figure 4.5.

27
Figure 4.5: Data Analysis Procedure Model
CHI-2 Goodness of Fit Test The CHI-2 test was performed to investigate if the collected data is normally distributed or not. A null hypothesis was constructed as:
H0. The data set is normally distributed.
As described in this thesis earlier, four categories of attributes were measured namely pragmatic qualities, hedonic qualities, appealingness, and emotions. Table 4.4 shows the categories in both treatment groups, which are the slow web application and the fast web application. One CHI-2 test was performed for each of the four categories in the two different treatment groups. In total eight CHI-2 tests were performed.
Web Application, Slow Web Application, Fast
Pragmatic Qualities Pragmatic Qualities
Hedonic Qualities Hedonic Qualities
Appealingness Appealingness
Pleasure dimension of emotions Pleasure dimension of emotions
Table 4.4: Illustrates the four categories in the two treatments

28
The average value of all the attributes in all categories for every participant was calculated. For example, when calculating the average value for one participant’s pragmatic qualities, the values of all the eight attributes included in the pragmatic qualities (see Table 4.3) were added together and divided by the number of attributes, which is eight. Since every attribute was rated between one and seven, the average score of one participant’s pragmatic qualities was a number between one and seven.
The range of participants’ average scored value was then divided into ten segments. Each segment needed to have the same probability to include a participant’s average score. This means that each segment had 10 % possibility to include a value.
To illustrate how the upper limit values of the segments were calculate, here is the example of the first segment:X is the data set, which now is assumed to be normally distributed N(m, s), where m is the mean value of X, and s is the standard deviation of X. P(X < x) = 0.10 To be able to calculate the x value, which is the upper limit of the first segment, the equation was transformed to fit a standard normal distribution, N(0, 1). P( XS < z) = 0.10, where XS is a standard normal distribution N(0, 1) and z = ((x-m)/s).
When this was done, a standard normal distribution table was used to find the z-value for P( XS < z) = 0.10.
The equation z = ((x-m)/s) was then transformed into x = sy + m, and that way the x-value, which is the upper limit, was found. The above described procedure was repeated to calculate the upper values for all ten segments.
The expected number of scores in each segment is the number of participants divided by ten.In order to test if H0 was supported or not, the following formula was used:

29
Where n is the number of segments, in this case ten, Oi is the number of values in segment
number i, and E is the expected number of values in each segment.
Furthermore, the degree of freedom, f, was calculated as: f = n-e-1, where n is the number of segments, e is the parameters estimated from the original data. In this case, the degree of freedom was calculated to 7. The chosen level of significance for the CHI- 2 test was 5%.
The calculated X 2 value was then compared to the critical value, which corresponds to the calculated degree of freedom and chosen significance level, X 20,05,7. If X 2 is larger than X 20,05,7
, H0 is rejected, otherwise H0 was accepted. If H0 was rejected, that means that the data set is not normally distributed, but if H0 was accepted, H1 could not be supported with a significance of 5%. That means that H0 is supported by a significance of 95%, and the data set is normally distributed.
Shapiro-Wilk Test In addition to the CHI-2 Goodness of fit test, the Shapiro-Wilk test was reviewed and found adequate for investigating the distribution of the data sets. Much like the CHI-2 test, the Shapiro-Wilk test checks if the null hypothesis, which states that the data set is normally distributed, can be rejected or not.
However, the Shapiro-Wilk test is very beneficial in the context of this study, due to its high statistical power, especially when working with sample sizes smaller than 50 [36].
Anderson-Darling Test A third normality test was considered to increase the validity of the results from the previously made tests. According to [36], the Anderson-Darling test can be considered as powerful as the Shapiro-Wilk test and thus, capable of making the results of this study more credible.
4.2.9 Hypotheses TestingIn order to test all four hypotheses stated in this study, several tests were reviewed and used. Depending on the results of the previous made normality tests, if the data is normally distributed or not, specific tests were performed. Each test and the conditions under which it was used will be explained in the following.
T-Test The t-Test is a parametric test comparing two independent samples to investigate if their means are reliably different from each other, or if those differences happened by chance. However, t-Test provides generally high statistical power and can be used on smaller samples, and thus

30
smaller experiments [26].
The t-Test was performed, if the two specific corresponding data sets were normally distributed and had equal variances.
Welch’s T-Test The Welch’s t-Test, also called unequal variance t-Test, is an adaption of the t-Test and is used when two normally distributed samples show unequal variances. In this study, the Welch’s t-Test was used to complement the t-Test. However, if the difference of variance between corresponding data sets appeared to be significantly different, the Welch's test was considered to be more reliable as suggested in [37].
Mann-Whitney Test The Mann-Whitney test is a non-parametric test, which means that the sample is not of a normal distribution, and can be used alternatively to the t-Test [26]. Therefore, this test was conducted when the data was not normally distributed and the variance of two independent samples was equal.
Kolmogorov-Smirnov Test Much like the Mann-Whitney test, the Kolmogorov-Smirnov test requires no assumptions about the samples distribution. Furthermore, this test was conducted on samples with an unequal variance.
4.2.10 Evaluation of ValidityThis chapter covers known validity issues within this study.
4.2.10.1 Conclusion Validity An online-based experiment was run to involve as many participants as possible within the scope of this study to ensure an acceptable statistical power. Determining the statistical power of the study was done by investigating the relationship between the treatments and the outcome of the experiment. However, the choice of conducting an online-based experiment negatively influences the internal validity to a certain extent, which is explained in the chapter 4.2.10.2 Internal validity.
4.2.10.2 Internal Validity User experience is subjectively perceived by the users, and thus context and the user’s internal state have an impact on UX (see also 2. Background). An online-based experiment cannot block the physical context, which is where the user is performing the test. Therefore, the question “In

31
what environment are you doing this test?” was asked in the pre-questionnaire. This threat could have been blocked by initiating a lab-based experiment, but the number of participants would have been too low to ensure enough statistical power. In both cases the results of study can suffer, but an online-based approach was chosen due to the promising number of participants. Furthermore, to reduce the impact of user’s internal state and expectations as good as possible, two additional questions were asked in the pre-questionnaire. These questions were “How are you doing today?” and “What expectations do you have regarding the web application?”.
There are more external factors that have an impact on user experience, such as the users’ needs and the social context. However, considering the amount of questions and data that would have resulted by covering all factors, the pre-questionnaire was kept as small as possible with highly prioritized questions, also to not ask too much of the participants.
Blocking age, internet experience, and level of education was done by dividing the participants into two balanced groups, as explained in 4.2.6.3. Pre-questionnaire & group dividing.
To ensure no other functionalities or elements of the application will have an effect on participants, two exact same applications were used that only differed in their response time.Each group also used one and only one of the two applications instead of both to avoid influencing participants’ attitude after using the first application.
4.2.10.3 Construct Validity This experiment was conducted online, and thus subjective measurements were necessary to use. However, there are problems with all subjective measurement scales. There is a risk that more variables than what is supposed to be measured are taken into consideration by participants [38].
Both measurement instruments, a simplified version of AttrakDiff and SAM, used in this study are considered as widely used in the research field of user experience. AttrakDiff, which is the measurement model that inspired the instrument used within this study to measure pragmatic qualities, hedonic qualities, and appealingness of participants, has been used in several previous UX studies [39] [40] [19] [3] [20].
4.2.10.4 External Validity The target group of this experiment is web users in general. Web users are a very heterogeneous group, since almost 35% of the world’s population uses the Internet [41]. It is very challenging to get a representative sample of the world’s web users. However, participants with different backgrounds, education levels, and web experience were gathered to represent the web users as well as possible within the time frame of the experiment.

32
The experiment was required to be performed on a computer only. The reason for this is that the web application used in this study was implemented only for computer usage. Even though statistics show that mobile device web browsing and usage increased significantly over the past years, mobile devices were excluded from this study, which might be a threat to the experiment results. Moreover, another reason for excluding mobile devices was because the physical context varies heavily depending if the participants use a computer or a mobile phone. The web application also looks different depending on the device used when browsing.
4.2.11 Experiment TestingBefore starting the experiment execution, the experiment was tested by using the think aloud method [42], which was performed on two potential participants individually. The test took place in one of the office rooms both participants work at to provide a familiar environment to them. Furthermore, they were introduced to the testing procedure by asking them to perform the experiment and while doing so, to say everything out loud what comes to their mind. Comments of the participants were then written down by the researchers that were in the same room as the participants while they were doing the test and were as quiet as possible to not distract the participants from their performance. These two participants were not allowed to participate during the execution phase due to the gained knowledge about the experiment.The experiment test revealed several major usability issues in the experiment. Based on the test results, the pre-questionnaire and the final questionnaire were translated into two additional languages, namely Swedish and German. This was done to ensure that the participants know what is asked for. This can prevent faulty data due to language barriers.Another discussion with the participants was initialized to make sure that the Swedish translation of the UX attributes corresponded the original English version. Furthermore, the task steps, which were presented in the guidelines, were numbered from one to four to make the order of steps more obvious.More explicit buttons for viewing the task and going to the final questionnaire were implemented, since they were easy to miss out from the beginning.
4.3 Analysis 4.3.1 Normality testsThree different normality tests were performed on each data set, namely CHI-2 Goodness of fit, Anderson-Darling, and Shapiro-Wilk. For all tests, the null hypothesis was stated as following:
H0. The data set is normally distributed.

33
If the p-value calculated from each test is less than 0.05, the null hypothesis was rejected, which means that the data was not normally distributed.

34
5 Results
The raw data of this experiment includes all the answers of the pre-questionnaire, the average score in pragmatic, hedonic, and appealingness for each participant, the participant's ID-number, and what treatment they belonged to (see Appendix F). Every judgement in the final questionnaire belongs to one of the categories, pragmatic qualities, hedonic qualities, appealingness or emotions, as can be seen in Table 3.3. Additionally, the variances, mean values, and number of participants for all the samples are attached in Appendix G. Finally, the results from the three different normality tests are attached in Appendix H.
5.1 Experiment ExecutionThe experiment was running for 20 days in total, which was 6 days more than expected. During this period, 134 participants started the experiment. The participants were primarily approached personally by the researchers and the seven other contributors via email, or other online social networks.Furthermore, the participants were provided with the URL to the web application and a personal code to be able to perform the experiment. They were then asked to read the guidelines carefully and to complete the experiment on their own.
Out of the 134 participants that started the experiment, 33 participants did not complete it. Those were automatically disregarded for the remaining data analysis procedures. In total, 101 participants completed the experiment and thus provided valid data for further analyses.
The final data set was then sorted by the average response time of each the participant. This revealed that one participant, assigned to the group using the web application with fast response time, had an average response time slower than some participants assigned to the slow version of the web application. This participant was removed from the final data set, because all participants that used the slower version should have a slower response time than all participants using the fast version.
The final data set now contained 100 participants, whereof 64 were males, and 36 were female. 32 participants specified their age to be between 20 and 24, and 53 participants between 25 and 29. Only 15 participants were between 30 and 39 years old (see Table 5.1). Strikingly, no participants younger than 20 or older than 39 attended the experiment.

35
Age Slow Web Application
(Number of participants) Fast Web Application
(Number of participants)
10 - 14 - -
15 - 19 - -
20 - 24 16 16
25 - 29 26 27
30 - 39 8 7
40 - 49 - -
50 - 59 - -
60 - 69 - -
70 - 79 - -
Table 5.1: Age distribution between the two treatments
Moreover, 31 participants in total specified to have no academic background, while 32 participants stated to have a Bachelor degree, 29 participants have a Master degree, and 8 participants claimed to have another educational background. Besides that, no participants with a PhD were attending the experiment (see Table 5.2).

36
Education Slow Web Application
(Number of participants) Fast Web Application
(Number of participants)
None 16 15
Bachelor 17 15
Master 14 15
PhD - -
Other 3 5
Table 5.2: Education distribution between the two treatments
In addition, 7 of the 100 participants had only 4 to 7 years of internet experience, while 32 participants had between 8 and 12 years, 41 participants between 13 and 16 years, and 20 participants stated to have even more than 17 years of internet experience. No participants claimed to have less than 4 years of internet experience (see Table 5.3).
Internet Experience (Years)
Slow Web Application (Number of participants)
Fast Web Application (Number of participants)
0 - 3 - -
4 - 7 3 4
8 – 12 16 16
13 - 16 21 20
17 + 10 10
Table 5.3: Overview of how participants with different internet experience were distributed among the two treatments
As can be seen in Table 5.1, Table 5.2, and Table 5.3, the algorithm (see Appendix D.) distributed the participants evenly between the two treatments based on age, level of education,

37
and internet experience. In the end, 50 participants were assigned to the slow version, and 50 participants were assigned to the fast version of the web application. Moreover, a significant difference between the response times was also ensured. Accordingly, the average response time of the slow version was 1.4634 seconds, while the fast versions average response time was 0.2971 seconds.
As can be seen in Table 5.4 and Table 5.5, the normality tests indicated that the pragmatic qualities, hedonic qualities, and the fast group’s appealingness are normally distributed. Moreover, the pleasure dimension cannot be considered as normally distributed, and there are uncertainties for the slow group’s appealingness.
SLOW CHI 2 Shapiro-Wilk Anderson-Darling
P p-value W p-value A p-value
PQ (General)
5.16 0.2713 0.9808 0.5859 0.2703 0.6624
HQ (General)
3.2 0.5249 0.9863 0.8238 0.2326 0.7881
Appealingness (General)
8.24 0.08317 0.9626 0.1147 0.7449 0.04901
Pleasure (General)
24.08 9.242*10-7 0.8401 8.447*10-7 3.6572 2.894*10-9
Table 5.4: Normality test results for the slow web application

38
FAST CHI 2 Shapiro-Wilk Anderson-Darling
P p-value W p-value A p-value
PQ (General)
0.96 0.9158 0.9785 0.4914 0.3452 0.4711
HQ (General)
3.76 0.4395 0.9897 0.9399 0.1802 0.911
Appealingness (General)
10.76 0.0294 0.9769 0.4286 0.3398 0.4848
Pleasure (General)
28.88 7.7*10-8 0.7881 4.706*10-6 4.5802 1.585*10-11
Table 5.5: Normality test results for the fast web application
5.2 Hypothesis TestingBased on the normality tests, t-Tests were performed when both data sets were considered normally distributed and the variances were equal. When the variances were unequal, the Welch’s t-Test was performed. Moreover, Mann-Whitney was performed when the data sets were not normally distributed, but the variances were equal. If the data sets were not normally distributed, and the variances were not equal, a Kolmogorov-Smirnov test was performed.
As stated in 3.2.1.4. Hypotheses, the four hypotheses in this study are:
H1. Longer response time will decrease the perceived pragmatic qualities of the web application.
H2. Response time will not affect the perceived hedonic qualities of the web application.
H3. Longer response time will decrease the judgement of appealingness.H4. Longer response time will negatively influence the pleasure dimension of emotions.

39
t-Test Welch’s Test Mann-Whitney Kolmogorov-
Smirnov
t p-
value t
p-value
W p-
value D
p-value
PQ (General)
-0.3128
0.6225 -
0.3128 0.6225 - - - -
HQ (General)
0.0724 0.9425 0.0724 0.9425 - - - -
Appealingness (General)
-0.1206
0.5479 -
0.1206 0.5479 1195 0.6479 0.2 0.1353
Pleasure (General)
- - - - 1228.5 0.5639 0.04 0.9231
Table 4.3: Hypothesis testing results
H1 cannot be accepted since both the t-Test and Welch’s t-Test provided the p-value = 0.6225. By looking at the mean values, which are shown in Appendix M, one can see that the treatment exposed to the slow version rated the pragmatic qualities higher than the treatment exposed to the fast version.
H2 would be accepted if the p-value is equal or larger than 0.95. However, according to the t-Test and Welch’s t-Test, the p-value is 0.9425 and thus the hypothesis is rejected. Since the normality test strongly reveals that the data is normally distributed, no other hypothesis testing is done for H2.H3 is also rejected, because none of the four performed tests revealed a statistical significance. The reason for performing four different tests was due to the insecurity of the normality tests in one of the treatments. However, the difference in mean value is 0.02, which must be considered as a small difference considering the number of participants. This strongly indicates that there is no significance as well. The data in the pleasure dimension, H4, was considered not normally distributed by the three normality tests. To test this hypothesis, the non-parametric tests, Mann-Whitney and Kolmogorov-Smirnov, were performed. None of the two tests shows a statistical significance,

40
however, the two methods show a large difference in p-values. The p- value of Kolmogorov-Smirnov is considered the most reliable since the difference in variance is ≈0.11 and the Likert-scale of the pleasure dimension was ranging from one to five. Also, considering that the mean value of the slow treatment was higher than the fast treatment, the high p-value of Kolmogorov-Smirnov must be considered reliable. The summary of the hypothesis testing can be seen in Table 4.4.
Hypothesis Status
H1. Longer response time will decrease the perceived pragmatic qualities of the web application.
Rejected
H2. Response time will not affect the perceived hedonic qualities of the web application.
Rejected
H3. Longer response time will decrease the judgement of appealingness Rejected
H4. Longer response time will negatively influence the pleasure dimension of emotions.
Rejected
Table 4.4: Hypothesis summary
5.3 Additional TestsEven though no differences between the two treatments were found, further statistical analyses were made to investigate if participants with certain characteristics were more affected by the difference in response time. As stated in 3.2.4.2. Pre-Questionnaire & Group Dividing, an algorithm divided the participants into the two treatments based on their age, internet experience and level of education. The additional tests are based on this data.The original data set were filtered by the following characteristics of the participants:
• Age: 20-24 • Age: 25-29 • No education • Bachelor degree • Master degree • 8-12 years of internet experience • 13-16 years of internet experience

41
The other groups of the characteristics had too few participants to make any statistical analyses. The additional tests among the 7 characteristics required new hypotheses. So, our four main hypotheses were used again, but specified for each characteristic. An example of this is: New H1. Longer response time will decrease the perceived pragmatic qualities of the web application, among the participants whose age is between 20 and 24. New H2. Response time will not affect the perceived hedonic qualities of the web application, among the participants whose age is between 20 and 24. New H3. Longer response time will decrease the judgement of appealingness, among the participants whose age is between 20 and 24. New H4. Longer response time will negatively influence the pleasure dimension of emotions, among the participants whose age is between 20 and 24. The process from 4.1.1. Normality tests and 4.1.2. Hypothesis testing was repeated by first calculating normality tests for the four new hypotheses within each of the seven characteristics. In total, this resulted in 84 additional normality tests. These tests can be found in Appendix F1. The tests revealed that all the data sets containing the average pragmatic attributes and hedonic attributes were normally distributed. All data sets for average appealingness were also normally distributed, except for the age group 20-24. There were also uncertainties about appealingness for participants with a bachelor degree. Furthermore, none of the data sets containing information about the pleasure dimension could be considered normally distributed.
Furthermore, the hypotheses were also tested by performing different tests. To support New H1, New H3, or New H4, the p-value of the tests needed be equal or lower than 0.05. However, to support New H2, the p-value needed to be equal to or higher than 0.95.
The results of the hypothesis testing turned out in a way that none of the hypotheses could be supported. These tests are attached in Appendix F2.

42
6 Conclusion
The answer to the question of how users perceive different response times in context of a web-based application and what the consequences might be remains unclear after this investigation.
The online experiment designed and performed in this study involved two identical web applications that only differed in response time. Therefore, one of the two web applications were implemented to be one second slower than the other. In total, 100 participants performed the experiment, whereof 50 participants used the fast web application, and the other 50 used the slow web application. All participants were asked to perform the same task on the web application and to complete the experiment with a final questionnaire.
The analysis of the experiment revealed, that there was no significant difference in the results between the two groups of participants. In other words, different response times in context of this study were perceived with no significant differences by users and had no affect on user experience. Further hypotheses were formed throughout the experiment to investigate if response time had any significant effects on participants with certain characteristics. However, this showed not to be the case, and thus those hypotheses were also rejected.
There might be several factors involved that lead to the results of this study. One of the most influential factors was the time and resource restriction in the study. Due to this reason, it was not possible to run the experiment longer in order to increase the sample size, which in the end was 100 participants. This number might be considered too small for statistical analysis and thus, not reliable enough for investigating user experience. Furthermore, experiment attendants were not rewarded for participating, which could have had an impact on their motivation doing the experiment. In other words, participants might go through the experiment task quickly instead of interacting with the web application seriously. Another factor that might have influenced the results negatively are discrepancies between the two groups of participants. As shown in table X (see appendix table: podcast consumption) 31 participants that listen to podcasts never/very seldom were assigned to the slow web application, whereas in comparison only 20 participants that listen to podcasts never/very seldom were assigned to the fast version. More specifically, more frequent podcast consumers were assigned to the fast web application, which leads to the possibility that those participants were judging upon the web application more critically. This could be a reason for why the fast application, according to the mean values, scored only slightly higher on hedonic qualities compared to the mean values of all the other attributes. Another reason why the mean value of most of the attributes scored lower on the fast web application is

43
that participants who stated to make the experiment from home were predominantly assigned to the slow web application than to the fast version by random. This can be interpreted as that the circumstances or the context, in which the participants interacted with the slow web application, were more natural and relaxing, than for instance at work.
Another reason why the results of this experiment did not show any significant differences could be, that the used two response times were simply not different enough. That means, that one second difference in response time is not perceived differently by the users.
Nevertheless, investigating the impact of response time on users is of much importance in terms of software development. Response times will likely continue to vary in the future in certain contexts with significant higher time differences than presented in this thesis, understanding how such response times form an impact on the user experience might help software practitioners to react accordingly during development processes and to implement counteracting solutions to keep the user experience on a balanced level.
6.1 Future WorkThis thesis represents a starting point in the investigation of response time and its impact on user experience, thus, further investigation can be done. A suggestion would be to investigate the same attributes as presented in this study, but with a larger sample size, and more than two treatments to investigate several different response times. Furthermore, it should be considered to run the experiment during a longer period, to diminish the impact of context and the participants’ current mood.Findings of such a study could reveal the real relation between UX and response time. Moreover, more detailed investigations into how response time affects the emotional outcome needs to be done.

44
7 References
[1] V. Roto, E. L.-C. Law, A. Vermeeren, and J. Hoonhout, “User Experience White Paper,” 2011.
[2] “ISO 9241-210:2010. Ergonomics of human system interaction - Part 210: Human-centred design for interactive systems (formerly known as 13407).,” International Organization for Standardization (ISO). Switzerland., Dec. 2010.
[3] M. Hassenzahl, “The Effect of Perceived Hedonic Quality on Product Appealingness,” International Journal of Human-Computer Interaction, vol. 13, no. 4, pp. 481–499, Dec. 2001.
[4] E. L.-C. Law, V. Roto, M. Hassenzahl, A. P. O. S. Vermeeren, and J. Kort, “Understanding, scoping and defining user experience: a survey approach,” CHI 2009, pp. 719–728, 2009.
[5] J. Hartmann, A. De Angeli, A. Sutcliffe, and B. S. West, “Framing the User Experience : Information Biases on Website Quality Judgement,” CHI 2008, pp. 855–864, 2008.
[6] D. F. Galletta, R. M. Henry, S. McCoy, and P. Polak, “When the Wait Isn’t So Bad: The Interacting Effects of Website Delay, Familiarity, and Breadth,” Information Systems Research, vol. 17, no. 1, pp. 20–37, Mar. 2006.
[7] E. W. Zegura, M. H. Ammar, S. Member, Z. Fei, and S. Bhattacharjee, “Application-Layer Anycasting : A Server Selection Architecture and Use in a Replicated Web Service,” vol. 8, no. 4, pp. 455–466, 2000.
[8] J. A. Hoxmeier and C. DiCesare, “System Response Time and User Satisfaction : An Experimental Study of Browser-based Applications,” no. 2, pp. 1–26, 2000.
[9] M. Gusat, R. Birke, and C. Minkenberg, “Delay-Based Cloud Congestion Control,” GLOBECOM 2009 - 2009 IEEE Global Telecommunications Conference, pp. 1–8, Nov. 2009.
[10] J. Bargas-Avila and K. Hornbæk, “Old wine in new bottles or novel challenges: a critical analysis of empirical studies of user experience,” CHI 2011, 2011.
[11] V. Roto, “User Experience Building Blocks,” no. Jordan 2003, pp. 1–5, 2005.
[12] M. Hassenzahl and D. Ullrich, “To do or not to do: Differences in user experience and retrospective judgments depending on the presence or absence of instrumental goals,” Interacting

45
with Computers, vol. 19, no. 4, pp. 429–437, Jul. 2007.
[13] I. Wechsung, A. Köhler, K. Jepsen, R. Schleicher, and F. Burkhardt, “View from a Distance: Comparing Online and Retrospective UX-Evaluations,” MobileHCI’12, vol. 1, pp. 113–118, 2012.
[14] M. Hassenzahl and A. Monk, “The Inference of Perceived Usability From Beauty,” vol. 25, pp. 235–260, 2010.
[15] M. Hassenzahl and N. Tractinsky, “User experience - a research agenda,” Behaviour & Information Technology, vol. 25, no. 2, pp. 91–97, Mar. 2006.
[16] P. Van Schaik and J. Ling, “Modelling user experience with web sites: Usability, hedonic value, beauty and goodness,” Interacting with Computers, vol. 3, pp. 419–432, 2008.
[17] M. Hassenzahl, “The thing and I: understanding the relationship between user and product,” in in Funology From Usability to Enjoyment, vol. 3, M. Blythe, C. Overbeeke, A. F. Monk, and P. C. Wright, Eds. Kluwer Academic Publishers, 2003, pp. 31–42.
[18] M. Hassenzahl, “The Hedonic/Pragmatic Model of User Experience,” no. September 2007, 2007.
[19] M. Hassenzahl, “The Interplay of Beauty, Goodness, and Usability in Interactive Products,” Human-Computer Interaction, vol. 19, no. 4, pp. 319–349, Dec. 2004.
[20] M. Hassenzahl, A. Platz, M. Burmester, and K. Lehner, “Hedonic and ergonomic quality aspects determine a software’s appeal,” Proceedings of the SIGCHI conference on Human factors in computing systems - CHI ’00, vol. 2, no. 1, pp. 201–208, 2000.
[21] C. Bartl, M. H. J. Gouthier, and M. Lenker, “Delighting Consumers Click by Click: Antecedents and Effects of Delight Online,” Journal of Service Research, no. March, Mar. 2013.
[22] B. Kitchenham and S. Charters, “Guidelines for performing Systematic Literature Reviews in Software Engineering,” 2007.
[23] S. Jalali and C. Wohlin, “Systematic Literature Studies : Database Searches vs . Backward Snowballing,” in 6th ACM-IEEE International Symposium on Empirical Software Engineering and Measurements, ESEM, 2012.

46
[24] J. Webster and R. T. Watson, “Analyzing the past to prepare for the future: Writing a literature review,” vol. 26, no. 2, 2002.
[25] J. Lecy and G. State, “Structured Literature Reviews Using Constrained Snowball Sampling and Citation Network Analysis,” pp. 1–15, 2012.
[26] C. Wohlin, P. Runeson, M. Hst, and M. Ohlsson, Experimentation in software engineering. Springer, 2012.
[27] F. Koller and M. Hassenzahl, “What is AttrakDiff?” [Online]. Available: http://www.attrakdiff.de/en/AttrakDiff/What-is-AttrakDiff/. [Accessed: 14-Aug- 2013].
[28] J. Kirakowski, “Background notes on the SUMI questionnaire.” [Online]. Available: http://sumi.ucc.ie/sumipapp.html. [Accessed: 28-Jun-2013].
[29] M.-H. Huang, “Web performance scale,” Information & Management, vol. 42, no. 6, pp. 841–852, Sep. 2004.
[30] P. M. A. Desmet, C. J. Overbeeke, and S. J. E. T. Tax, “Designing products with added emotional value; development and application of an approach for research through design,” The Design Journal, vol. 1, pp. 32–47, 2001.
[31] M. Bradley and P. J. Lang, “Measuring Emotion: The Self-Assessment Manikin and the Semantic Differential,” J. Behav. Ther. & Exp. Psychiat., vol. 25, no. I, 1994.
[32] D. Watson, L. a Clark, and A. Tellegen, “Development and validation of brief measures of positive and negative affect: the PANAS scales.,” Journal of personality and social psychology, vol. 54, no. 6, pp. 1063–1070, Jun. 1988.
[33] J. D. Morris, “Observations : SAM: The Self-Assessment Manikin An Efficient Cross-Cultural Measurement Of Emotional Response 1,” Journal of Advertising Research, no. December, 1995.
[34] J. a. Russell, A. Weiss, and G. a. Mendelsohn, “Affect Grid: A Single-Item Scale of Pleasure and Arousal.,” Journal of Personality and Social Psychology, vol. 57, no. 3, pp. 493–502, 1989.
[35] P. J. Lang, “Behavioral treatment and bio-behavioral assessment: Computer applications,” in in Technology in mental health care delivery systems, vol. 59, 1980, pp. 119–137.

47
[36] N. M. Razali, Y. B. Wah, and M. Sciences, “Power comparisons of Shapiro-Wilk , Kolmogorov-Smirnov , Lilliefors and Anderson-Darling tests,” vol. 2, no. 1, pp. 21–33, 2011.
[37] G. D. Ruxton, “The unequal variance t-test is an underused alternative to Student’s t-test and the Mann-Whitney U test,” Behavioral Ecology, vol. 17, no. 4, pp. 688–690, Apr. 2006.
[38] G. M. Wilson and M. A. Sasse, “Investigating the Impact of Audio Degradations on Users : Subjective vs . Objective Assessment Methods,” 2000.
[39] H. Väätäjä, T. Koponen, and V. Roto, “Developing Practical Tools for User Experience Evaluation – A Case from Mobile News Journalism,” 2009.
[40] M. Hassenzahl, S. Diefenbach, and A. Göritz, “Needs, affect, and interactive products – Facets of user experience,” Interacting with Computers, vol. 22, no. 5, pp. 353–362, Sep. 2010.
[41] “Internet Usage Statistics - The Internet Big Picture.” [Online]. Available: http://www.internetworldstats.com/stats.htm. [Accessed: 06-Jun-2013].
[42] Y. F. Barnard and J. A. C. Sandberg, THE THINK ALOUD METHOD A practical guide to modelling cognitive processes. 1994. [43] A. Holzinger, “Usability Engineering Methods For Software Developers” Communications of the ACM, vol. 48, no. 1, pp. 481–499, Dec. 2005.

48
8 Appendix 8.1 Appendix A.
• Title of the paper • Authors • Journal • Publication year • Is the research qualitative or quantitative? • What is the hypothesis/research question(s)? • How is UX defined according to the paper? • What attribute(s) of UX are measured? • Briefly explain the research methodology design. • Provide information about the participants in the study. • What are the results? • Additional notes

49
8.2 Appendix B.8.2.1 Appendix B1. Guidelines in English
8.2.2 Appendix B2. Guidelines in Swedish

50
8.2.3 Appendix B3. Guidelines in German

51
8.3 Appendix C.8.3.1 Appendix C1. Pre-Questionnaire in English

52
8.3.2 Appendix C2. Pre-Questionnaire in Swedish

53
8.3.3 Appendix C3. Pre-Questionnaire in German

54
8.4 Appendix D.
function algorithm (var P) {var slow = calculate amount of participants that has finished the experiment in the slow group; var fast = calculate amount of participants that has finished the experiment in the fast group;
if((slow + fast) < 4) { if(slow > fast) { put P in the fast group; } else { put P in the slow group; } } else {if((slow - fast) > 5) { put P in the fast group; } else if((fast - slow) > 5) { put P in the slow group; } else {var age = (number of participants in the same age range as P in the slow group) - (number of participants in the same age range as P in the fast group);
var education = (number of participants with same education as P in the slow group) - (number of participants with the same education as P in the fast group);
var internet = (number of participants with the same amount of internet experience as P in the slow group) - (number of participants with the same amount of internet experience as P in the fast group);
if((age+education+internet) > 0) { put P in the fast group; } else if((age+education+internet) < 0) { put P in the slow group; } else {if(slow > fast) { put P in the fast group; } else { put P in the slow group; }}}}}

55
8.5 Appendix E.8.5.1 Appendix E1. Final Questionnaire in English

56
8.5.2 Appendix E2. Final Questionnaire in Swedish

57
8.5.3 Appendix E3. Final Questionnaire in German

54
Appendix F. Raw Experiment Data ID Group Age Gender CR Education IE CM Expt CE P PQ HQ Appeal
1 Slow 25-29 Female Sweden Other 13-16 Alright Neutral Home 3 4.5000 4.8571 5.2500 2 Fast 25-29 Male Sweden Master 17+ Very Good Very Low Home 3 4.2500 2.8571 3.2500 3 Fast 30-39 Male Sweden Master 13-16 Alright Neutral Other 4 5.0000 5.1429 5.2500 4 Fast 30-39 Female Sweden Master 13-16 Good High School/Work 4 5.8750 5.0000 5.6250 5 Slow 25-29 Male Sweden Master 17+ Good Neutral Home 3 4.0000 3.7143 4.3750 6 Fast 25-29 Male Sweden Other 13-16 Very Good Neutral School/Work 4 5.3750 4.5714 5.3750 7 Fast 25-29 Male Sweden No 13-16 Very Good High School/Work 4 3.8750 4.0000 4.2500 8 Fast 20-24 Female Sweden Bachelor 8-12 Very Good Neutral Home 3 5.0000 4.1429 4.7500 9 Slow 25-29 Female Sweden Bachelor 13-16 Good Neutral School/Work 4 4.3750 4.4286 4.6250 10 Slow 20-24 Male Sweden No 17+ Alright Neutral School/Work 4 4.8750 5.0000 5.1250 11 Slow 20-24 Female Sweden Bachelor 13-16 Good High Home 4 5.8750 6.1429 6.0000 12 Fast 20-24 Female Sweden Bachelor 8-12 Good Very High Home 5 5.7500 6.4286 6.5000 13 Slow 25-29 Female Sweden Bachelor 17+ Alright Neutral School/Work 3 6.5000 5.1429 6.1250 14 Fast 20-24 Female Sweden No 13-16 Good Neutral Home 4 2.8750 4.4286 4.3750 15 Slow 20-24 Male Sweden Bachelor 8-12 Good Neutral Home 4 6.3750 4.8571 5.7500 16 Slow 25-29 Male Sweden Bachelor 17+ Alright Neutral School/Work 3 4.7500 3.8571 4.3750 17 Fast 30-39 Male USA Master 13-16 Alright Neutral Home 3 3.5000 4.0000 4.1250 18 Fast 20-24 Male Sweden Other 8-12 Good Neutral School/Work 4 4.6250 4.8571 5.5000 19 Fast 20-24 Male Sweden Bachelor 8-12 Alright Neutral Home 3 5.6250 3.2857 4.5000 20 Fast 20-24 Male Sweden No 13-16 Very Good Very High Home 5 5.7500 5.4286 6.5000 21 Slow 20-24 Female Sweden No 8-12 Good Very High Home 5 5.3750 5.5714 6.6250 22 Fast 25-29 Male Sweden No 17+ Very Good Very High School/Work 5 4.2500 5.5714 4.0000 23 Slow 25-29 Male Sweden No 13-16 Good Neutral Home 4 4.8750 3.8571 4.5000 24 Fast 20-24 Male Sweden Bachelor 13-16 Good High Home 3 4.3750 5.1429 4.8750 25 Fast 25-29 Male Sweden Bachelor 13-16 Good Neutral Other 4 4.5000 2.5714 3.5000 26 Slow 20-24 Male Sweden No 8-12 Very Good High Home 4 5.8750 5.5714 5.8750 27 Slow 20-24 Male Sweden No 13-16 Alright High Home 4 5.1250 4.5714 5.1250 28 Slow 20-24 Male Sweden No 4-7 Alright Neutral Home 3 4.0000 4.0000 4.0000 29 Slow 20-24 Male Sweden Bachelor 8-12 Good Neutral Home 4 4.2500 5.1429 5.2500 30 Fast 20-24 Female Sweden No 8-12 Good Neutral Home 4 5.6250 5.8571 6.6250 31 Fast 20-24 Male Sweden No 17+ Alright Very High Home 3 5.7500 4.4286 6.0000 32 Slow 30-39 Male Sweden Master 13-16 Alright Very High Home 3 5.1250 4.5714 5.6250

55
33 Fast 25-29 Male Sweden Bachelor 17+ Alright Neutral Home 3 4.6250 3.7143 4.6250 34 Fast 20-24 Male Sweden No 13-16 Good High School/Work 4 4.6250 5.1429 4.6250 35 Slow 25-29 Male Sweden Master 13-16 Good Neutral School/Work 3 4.8750 3.4286 4.0000 36 Fast 25-29 Male Sweden Master 17+ Good Neutral School/Work 4 5.3750 4.2857 5.7500 37 Fast 25-29 Male Germany Bachelor 8-12 Alright Neutral School/Work 3 4.2500 4.7143 5.2500 38 Slow 30-39 Male Sweden Bachelor 17+ Very Good Neutral School/Work 5 4.0000 5.7143 5.8750 39 Slow 25-29 Male Germany Master 13-16 Alright Neutral Home 3 4.1250 2.4286 3.7500 40 Fast 25-29 Male Sweden Bachelor 8-12 Alright High School/Work 3 4.6250 4.4286 5.0000 41 Slow 20-24 Female Germany Bachelor 4-7 Good High Home 3 5.2500 4.5714 5.5000 42 Slow 25-29 Female Germany No 13-16 Very Good Neutral School/Work 4 5.8750 5.1429 6.2500 43 Slow 25-29 Male Sweden Master 8-12 Good Neutral School/Work 4 4.3750 4.8571 5.6250 44 Fast 30-39 Male United States Bachelor 17+ Very Good Very High School/Work 4 5.6250 4.7143 5.3750 45 Fast 25-29 Male Sweden Master 13-16 Very Good Neutral School/Work 5 6.3750 4.2857 4.8750 46 Fast 25-29 Male Sweden Master 17+ Good Neutral School/Work 4 4.1250 4.5714 4.7500 47 Slow 30-39 Male Germany No 17+ Good Neutral Home 2 5.3750 4.8571 5.2500 48 Fast 25-29 Male Germany Other 4-7 Alright Neutral Home 3 3.1250 4.4286 3.7500 49 Fast 25-29 Female Sweden Bachelor 8-12 Very Good Neutral Home 4 3.5000 3.8571 3.7500 50 Slow 25-29 Male Germany No 13-16 Alright Neutral Home 3 3.6250 3.5714 4.2500 51 Slow 25-29 Female Sweden Master 17+ Good Low Home 3 4.6250 3.5714 4.2500 52 Slow 25-29 Female Sweden Master 8-12 Alright Neutral Home 3 3.5000 4.0000 3.2500 53 Fast 30-39 Male Sweden Master 17+ Very Good High Home 4 5.8750 5.8571 6.0000 54 Fast 25-29 Male Sweden Master 4-7 Good Very Low Home 4 5.2500 4.7143 5.8750 55 Slow 25-29 Male Germany Other 17+ Good Neutral Home 4 6.1250 4.7143 5.7500 56 Slow 25-29 Female Canada Bachelor 13-16 Good Neutral School/Work 4 5.1250 4.4286 5.5000 57 Slow 30-39 Male Sweden Master 13-16 Alright Neutral Home 4 6.5000 5.2857 6.0000 58 Fast 25-29 Female Sweden Master 13-16 Good Neutral Home 3 3.6250 4.2857 4.8750 59 Slow 25-29 Male Sweden Bachelor 17+ Very Good High Home 4 4.8750 5.1429 5.1250 60 Slow 20-24 Male Germany No 8-12 Good Neutral Home 5 5.8750 4.4286 5.1250 61 Fast 25-29 Male Germany Master 13-16 Good Low Public 3 4.1250 3.1429 3.8750 62 Fast 25-29 Male Germany No 8-12 Good Neutral Home 4 5.3750 5.0000 5.6250 63 Slow 30-39 Male Sweden No 8-12 Alright Neutral Home 3 4.3750 4.4286 4.8750 64 Fast 25-29 Female Sweden Bachelor 8-12 Alright Neutral Home 4 4.7500 3.8571 4.7500 65 Fast 30-39 Male Sweden Master 17+ Very Good Very Low Home 3 3.8750 4.0000 4.6250 66 Slow 25-29 Female Sweden Bachelor 8-12 Good Neutral Other 3 3.8750 3.8571 4.6250 67 Slow 20-24 Male Sweden Bachelor 8-12 Very Good High Home 4 5.6250 4.2857 5.3750 68 Slow 25-29 Male Sweden Master 13-16 Bad High Home 4 5.3750 4.1429 5.0000

56
69 Fast 20-24 Female Sweden No 8-12 Good Neutral Home 5 6.2500 5.2857 6.6250 70 Fast 25-29 Female Germany Other 8-12 Alright Very Low School/Work 4 6.1250 5.1429 6.0000 71 Fast 25-29 Male Sweden Master 13-16 Alright Neutral School/Work 3 5.2500 3.8571 4.0000 72 Slow 20-24 Male Sweden No 13-16 Alright Neutral Home 4 5.7500 5.4286 5.1250 73 Slow 25-29 Female Germany Other 13-16 Alright Neutral Other 3 4.2500 4.7143 5.1250 74 Slow 25-29 Female Germany Master 8-12 Very Good Neutral School/Work 5 5.1250 4.4286 5.5000 75 Fast 25-29 Female Germany No 4-7 Good High Home 4 5.7500 6.4286 6.5000 76 Fast 25-29 Female Austria No 8-12 Good Neutral Home 5 5.1250 4.7143 5.1250 77 Slow 20-24 Female Austria No 8-12 Bad Neutral Home 3 3.6250 3.2857 3.7500 78 Fast 20-24 Male Austria No 13-16 Very Good High Other 3 6.5000 4.1429 5.8750 79 Slow 30-39 Female Sweden No 13-16 Good Neutral Home 4 5.5000 5.0000 5.6250 80 Slow 30-39 Female Germany Master 13-16 Very Good Low Home 5 4.6250 4.4286 4.6250 81 Fast 30-39 Male Sweden No 17+ Good Low Home 3 3.8750 3.7143 4.5000 82 Slow 25-29 Female Germany Master 8-12 Very Good Neutral School/Work 5 5.5000 4.1429 5.5000 83 Fast 25-29 Female Sweden Bachelor 13-16 Good Neutral Home 4 4.7500 4.8571 5.6250 84 Fast 20-24 Female Germany Bachelor 8-12 Good Neutral School/Work 4 5.6250 5.1429 6.7500 85 Fast 25-29 Female Sweden No 13-16 Alright Neutral School/Work 3 4.0000 5.4286 5.2500 86 Slow 20-24 Male Sweden No 13-16 Good Neutral Other 4 6.1250 4.8571 5.6250 87 Slow 20-24 Male Sweden Bachelor 13-16 Very Good High Home 3 3.6250 3.2857 3.8750 88 Fast 20-24 Male Sweden No 8-12 Very Good Neutral Home 5 6.0000 4.8571 5.8750 89 Fast 20-24 Male Sweden Bachelor 13-16 Very Good Neutral Home 4 5.0000 5.7143 4.7500 90 Slow 25-29 Female Sweden Bachelor 17+ Very Good Neutral School/Work 5 5.8750 5.1429 5.6250 91 Slow 25-29 Male Sweden Bachelor 13-16 Alright Neutral Home 4 5.7500 5.2857 5.7500 92 Fast 20-24 Female Germany Bachelor 4-7 Good Neutral School/Work 3 3.7500 4.5714 4.8750 93 Fast 25-29 Male Sweden Master 13-16 Good Neutral Home 4 5.2500 4.1429 4.6250 94 Slow 25-29 Male Germany Master 13-16 Good Neutral Home 4 3.8750 4.4286 5.1250 95 Slow 30-39 Male Germany Master 4-7 Alright Neutral Home 4 5.1250 4.8571 5.2500 96 Fast 25-29 Male Sweden Master 13-16 Alright Neutral School/Work 3 4.3750 3.5714 4.3750 97 Slow 20-24 Male Finland Bachelor 8-12 Alright Neutral School/Work 3 4.7500 4.1429 5.0000 98 Slow 25-29 Male Germany No 8-12 Good Neutral Home 5 4.7500 6.1429 6.1250 99 Slow 25-29 Female Sweden Bachelor 8-12 Very Bad Very High Home 5 2.8750 4.1429 3.3750 100 Fast 25-29 Female Germany Other 8-12 Good Neutral Home 4 4.8750 4.1429 4.8750 *CR = Country of residence *CE = Current Environment *IE = Internet experience *P = Pleasure *CM = Current mood *PQ = Pragmatic qualities *Expt = Expectations *HQ = Hedonic qualities

57
Appendix G. Table of variance, mean, and number of participants
Slow Web Application Fast Web Application
variance mean number of participants variance mean number of
participants
PQ (General) 0.7526 4.9275 50 0.7930 4.8725 50
PQ (Age: 20 - 24) 0.7796 5.1484 16 0.9208 5.1953 16
PQ (Age: 25 - 29) 0.7681 4.7452 26 0.6193 4.6991 27
PQ (Internet Experience:
8 -12) 0.9781 4.7578 16 0.5520 5.1253 16
PQ (Internet Experience:
13 -16) 0.6898 4.994 21 0.9161 4.75 20
PQ (Education: Bachelor) 1.0236 4.9265 17 0.4609 4.7833 15
PQ (Education: Master) 0.6078 4.7679 14 0.7921 4.8083 15
PQ (Education: No) 0.6583 5.0625 16 1.1265 5.0417 15
HQ (General) 0.5633 4.5571 50 0.6835 4.5686 50
HQ (Age: 20 - 24) 0.6364 4.6964 16 0.5878 4.9286 16

58
HQ (Age: 25 - 29) 0.5815 4.3681 26 0.6769 4.3386 27
HQ (Internet Experience:
8 -12) 0.5428 4.5804 16 0.6201 4.7321 16
HQ (Internet Experience:
13 -16) 0.7053 4.4898 21 0.655 4.4429 20
HQ (Education: Bachelor) 0.5396 4.6807 17 0.9291 4.4762 15
HQ (Education: Master) 0.5176 4.1633 14 0.5845 4.2476 15
HQ (Education: No) 0.6119 4.7321 16 0.5495 4.9619 15
Appealingness (General) 0.6040 5.1 50 0.7703 5.08 50
Appealingness (Age: 20 - 24) 0.6062 5.1953 16 0.7667 5.5625 16
Appealingness (Age: 25 - 29) 0.7 4.9519 26 0.6781 4.7963 27
Appealingness (Internet Experience:
8 -12) 0.9067 5.1016 16 0.7677 5.4688 16
Appealingness (Internet Experience:
13 -16) 0.5224 5.0833 21 0.5531 4.8313 20
Appealingness (Education: Bachelor) 0.5874 4.9917 17 0.7376 5.1618 15
Appealingness (Education: Master) 0.6735 4.8482 14 0.6421 4.7917 15

59
Appealingness (Education: No) 0.6581 5.2031 16 0.8634 5.45 15
Pleasure - - - - - -

60
Appendix H. Results From the Normality Tests
SLOW CHI 2 Shapiro-Wilk Anderson-Darling
P p-value W p-value A p-value
PQ (Education: No) 4.125 0.3894 0.9174 0.1532 0.4559 0.2319
PQ (Education: Bachelor) 2.3529 0.6711 0.9763 0.9165 0.1617 0.9331
PQ (Education: Master) 2 0.7358 0.9697 0.8728 0.2131 0.8158
PQ (Internet experience:
8 - 12) 2.375 0.6671 0.9756 0.9196 0.182 0.896
PQ (Internet experience:
13 - 16) 6 0.1991 0.9696 0.7242 0.2055 0.8515
PQ (Age: 20 - 24) 2.375 0.6671 0.922 0.182 0.4671 0.2171
PQ (Age: 25 - 29) 3.6154 0.4606 0.9902 0.9954 0.132 0.9778
HQ (Education: No) 2.375 0.6671 0.9792 0.9567 0.1817 0.8964
HQ (Education: Bachelor) 4.8235 0.3059 0.9765 0.9185 0.255 0.6837
HQ (Education: Master) 3 0.5578 0.9479 0.5285 0.3167 0.5045

61
HQ (Internet experience:
8 - 12) 8.5 0.07489 0.9507 0.5015 0.4394 0.2556
HQ (Internet experience:
13 - 16) 6.6667 0.1546 0.967 0.6661 0.3573 0.4214
HQ (Age: 20 - 24) 2.375 0.6671 0.9721 0.8713 0.1803 0.8988
HQ (Age: 25 - 29) 5.2308 0.2644 0.973 0.7025 0.2964 0.5663
Appealingness (Education: No) 5.875 0.2087 0.9731 0.8858 0.2254 0.783
Appealingness (Education: Bachelor) 2.3529 0.6711 0.4873 0.1943 0.4873 0.1943
Appealingness (Education: Master) 6 0.1991 0.9467 0.5104 0.3332 0.4608
Appealingness (Internet experience:
8 - 12) 0.536 0.143 0.9258 0.2092 0.3332 0.4608
Appealingness (Internet experience:
13 - 16) 7.3333 0.1193 0.9559 0.4375 0.3446 0.4518
Appealingness (Age: 20 - 24) 7.625 0.1063 0.9236 0.193 0.6073 0.09452
Appealingness (Age: 25 - 29) 5.2308 0.2644 0.9598 0.3867 0.3497 0.4463
Pleasure (Education: No) 8.5 0.003551 0.8722 0.02942 1.0323 0.007407

62
Pleasure (Education: Bachelor) 27.8824 1.318*10-5 0.809 0.002707 1.3975 0.0008599
Pleasure (Education: Master) 21 0.0003167 0.7981 0.004723 1.1573 0.003296
Pleasure (Internet experience:
8 - 12) 5.5 0.01902 0.7962 0.002429 1.2741 0.001744
Pleasure (Internet experience:
13 - 16) 20.7143 5.332*10-6 0.7275 6.185*10-5 2.9318 1.179*10-7
Pleasure (Age: 20 - 24) 32.125 1.804*10-6 0.7936 0.002241 1.5884 0.0002674
Pleasure (Age: 25 - 29) 11.8462 0.0005778 0.7904 0.0001214 2.2139 8.677*10-6
FAST CHI 2 Shapiro-Wilk Anderson-Darling
P p-value W p-value A p-value
PQ (Education: No) 3.2 0.5249 0.9324 0.2963 0.4657 0.2163
PQ (Education: Bachelor) 4.1333 0.3883 0.9399 0.3808 0.3661 0.3865
PQ (Education: Master) 6.9333 0.1395 0.9446 0.4433 0.3752 0.367
PQ (Internet experience:
8 - 12) 3.25 0.5169 0.9578 0.6227 0.2553 0.6793

63
PQ (Internet experience:
13 - 16) 1 0.9098 0.9872 0.9918 0.1091 0.992
PQ (Age: 20 - 24) 4.125 0.3894 0.9169 0.1505 0.5665 0.1183
PQ (Age: 25 - 29) 5.9259 0.2047 0.985 0.9537 0.2014 0.8668
HQ (Education: No) 1.3333 0.8557 0.9861 0.9952 0.1275 0.9788
HQ (Education: Bachelor) 1.3333 0.8557 0.9884 0.9984 0.1623 0.93
HQ (Education: Master) 3.2 0.5249 0.9804 0.972 0.2088 0.8317
HQ (Internet experience:
8 - 12) 3.25 0.5169 0.9771 0.9365 0.2252 0.7837
HQ (Internet experience:
13 - 16) 6.6 0.1586 0.9637 0.6206 0.2795 0.6076
HQ (Age: 20 - 24) 4.125 0.3894 0.9851 0.9913 0.1778 0.9032
HQ (Age: 25 - 29) 1.7778 0.7765 0.9798 0.8576 0.2687 0.6544
Appealingness (Education: No) 5.0667 0.2805 0.913 0.1508 0.4517 0.2351
Appealingness (Education: Bachelor) 3.2 0.5249 0.5456 0.1329 0.5456 0.1329

64
Appealingness (Education: Master) 3.2 0.5249 0.9661 0.7962 0.2154 0.812
Appealingness (Internet experience:
8 - 12) 0.2903 0.5648 0.9533 0.5433 0.2154 0.812
Appealingness (Internet experience:
13 - 16) 1.7 0.7907 0.9848 0.9806 0.1604 0.9378
Appealingness (Age: 20 - 24) 10.25 0.03642 0.8774 0.03539 0.764 0.03693
Appealingness (Age: 25 - 29) 1.2593 0.8682 0.984 0.9389 0.1766 0.9126
Pleasure (Education: No) 5.5333 0.01866 0.8166 0.006055 1.1031 0.004719
Pleasure (Education: Bachelor) 31.2 2.787*10-6 0.7613 0.001223 1.6919 0.0001384
Pleasure (Education: Master) 31.2 2.787*10-6 0.7613 0.001223 1.6919 0.0001384
Pleasure (Internet experience:
8 - 12) 8 0.004678 0.8197 0.005028 1.2605 0.001892
Pleasure (Internet experience:
13 - 16) 13.6 0.0002262 0.7801 0.0004426 2.0147 2.437*10-5
Pleasure (Age: 20 - 24) 22.5 0.0001593 0.8077 0.003452 1.2259 0.002327
Pleasure (Age: 25 - 29) 18.1852 2.004*10^-5 0.7816 6.691*10-5 2.6799 5.94*10-7

65
Appendix I. Hypothesis Testing Test Results
t-Test Welch’s Test Mann-Whitney Kolmogorov-Smirnov
t p-value t p-value W p-value D p-value
PQ (Education: No) -0.0616 0.5244 -0.0611 0.5241 - - - -
PQ (Education: Bachelor)
-0.4632 0.6767 -0.4747 0.6807 - - - -
PQ (Education: Master) 0.1299 0.4488 0.1305 0.4486 - - - -
PQ (Internet experience:
8 - 12) 1.4148 0.08372 1.4148 0.08411 - - - -
PQ (Internet experience:
13 - 16) -0.8733 0.8061 -0.8702 0.8051 - - - -
PQ (Age: 20 - 24) 0.1438 0.4433 0.1438 0.4433 - - - -
PQ (Age: 25 - 29) -0.2017 0.5795 -0.2013 0.5794 - - - -
HQ (Education: No) 0.8382 0.4088 0.8397 0.4079 - - - -
HQ (Education: Bachelor)
-0.6681 0.749 -0.6681 0.745 - - - -

66
HQ (Education: Master) 0.3054 0.7624 0.3061 0.7619 - - - -
HQ (Internet experience:
8 - 12) 0.563 0.5776 0.563 0.5776 - - - -
HQ (Internet experience:
13 - 16) -0.1821 0.8565 -0.1822 0.8563 - - - -
HQ (Age: 20 - 24) 0.8393 0.4079 0.8393 0.4079 - - - -
HQ (Age: 25 - 29) -0.1353 0.8929 -0.1355 0.8927 - - - -
Appealingness (Education: No) 0.7894 0.2181 0.7859 0.2193 - - - -
Appealingness (Education: Bachelor)
-0.5922 0.7209 -0.5878 0.7194 101 0.8419 0.3137 0.2083
Appealingness (Education: Master) -0.1877 0.5737 -0.1875 0.5737 - - - -
Appealingness (Internet experience:
8 - 12) 1.1351 0.1327 1.1351 0.1327 - - - -
Appealingness (Internet experience:
13 - 16) -1.1007 0.8611 -1.0999 0.8609 - - - -
Appealingness (Age: 20 - 24) - - - - 150 0.203 0 1

67
Appealingness (Age: 25 - 29) -0.6824 0.751 -0.6822 0.7509 - - - -
Pleasure (Education: No) - - - - 138.5 0.2171 0 1
Pleasure (Education: Bachelor)
- - - - 106.5 0.8081 0.1137 0.8137
Pleasure (Education: Master) - - - - 93 0.7164 0.1476 0.7294
Pleasure (Internet experience:
8 - 12) - - - - 122 0.5952 0.1476 0.7294
Pleasure (Internet experience:
13 - 16) - - - - 204 0.5706 0 1
Pleasure (Age: 20 - 24) - - - - 132 0.4351 0 1
Pleasure (Age: 25 - 29) - - - - 349.5 0.5116 0.0812 0.8398