empirical investigation towards the effectiveness of test first programming
TRANSCRIPT
Information and Software Technology 51 (2009) 182–194
Contents lists available at ScienceDirect
Information and Software Technology
journal homepage: www.elsevier .com/ locate / infsof
Empirical investigation towards the effectiveness of Test First programming
Liang Huang *, Mike HolcombeDepartment of Computer Science, University of Sheffield, Sheffield, United Kingdom
a r t i c l e i n f o
Article history:Received 6 February 2007Received in revised form 13 March 2008Accepted 20 March 2008Available online 31 March 2008
Keywords:Agile methodsEmpirical software engineeringSoftware testingTesting strategiesSoftware engineering processProgramming paradigms
0950-5849/$ - see front matter � 2008 Elsevier B.V. Adoi:10.1016/j.infsof.2008.03.007
* Corresponding author.E-mail addresses: [email protected] (L. Huang
(M. Holcombe).
a b s t r a c t
The Test First (TF) programming, which is based on an iterative process of ‘‘setting up test cases, imple-menting the functionality, and having all test cases passed”, has been put forward for decades, howeverknowledge of the evidence of the Test First programming’s success is limited. This paper describes a con-trolled experiment that investigated the distinctions between the effectiveness of Test First and that ofTest Last (TL) (the traditional approach). The experimental results showed that Test First teams spenta larger percentage of time on testing. The achievable minimum external quality of delivered softwareapplications increased with the percentage of time spent on testing regardless of the testing strategy(TF or TL) applied, although there does not exist a linear correlation between them. With four years’ data,it is also found that a strong linear correlation between the amount of effort spent on testing and codingin Test First teams, while this phenomenon was not observed in Test Last teams.
� 2008 Elsevier B.V. All rights reserved.
1. Introduction For the programmers following TDD, they write a number of
The Test First programming is a software development practicewhich has been proposed for decades [21,35] and mentioned asone of the central components of Test Driven Development (TDD)[6,1] and eXtreme Programming (XP) [5]. It starts with writing unittests for the proposed functionality using a unit testing framework.Afterwards, the programmers write code to pass these test cases, butare not allowed to write code that does not aim to pass the tests thatare already produced. Code for the proposed functionality is consid-ered to be fully implemented if and only if all the existing test casespass successfully. Moreover, when defects are detected, the corre-sponding test cases are to be added before fixing the code. In sodoing, the test cases are incrementally added and periodically exe-cuted, and the code is produced as small implementations after writ-ing tests, continuously. An important rule of Test First approach is:‘‘If you can’t write a test for what you are about to code, then youshould not even be thinking about coding” [9].
According to Ambler [1], the relationship between Test DrivenDevelopment (TDD) and Test First programming (TFP) or Test Firstdevelopment(TFD)canbedescribedwiththefollowingsimpleformula:
TDD ¼ TFD=TFPþ refactoring
In other words, TDD is a set of processes for developing a wholesoftware system, in which every ‘‘small bits of functional code” iswritten following TFP or TFD. If the programmers refactor everypiece of code written with TFP/TFD method to ensure its qualityafter it works, they are considered to program following TDD.
ll rights reserved.
unit tests for every single story before coding, run those tests afterthe implementation of the story, rework until all test cases havepassed, and then decide which story should be implemented next.All tests should be rerun periodically to ensure that newly devel-oped functionalities do not break tests written previously. Thatis, a new functionality would never be considered to be success-fully implemented unless all tests, including the ones for otherfunctionalities, are passed. Compared with Test First, traditionalsoftware development process is different. Software engineersare supposed to design the system at an early stage in the develop-ment process, and write code for functionalities one by one, using aset of test cases written after implementation to test.
Test First programming is claimed to help programmers [5,6]:
(1) get continuous feedback during the development process andidentify problems with the code early, reduce time/effort usedfor debugging, thereby enhancing the productivity;
(2) write automatically testable code with test cases, makingthe software system more reliable; and
(3) prevent new defects from coming into being in debuggingand the long term maintenance by continuously runningautomated test cases.
There exist a number of studies to investigate the distinctionbetween Test First/XP and traditional methods [44,54,41,22,36,18,32,19,29]. However, the results obtained vary from onestudy referred above to another (discussed in Section 2). This formsthe general research question for this research:
Are there any differences between the effectiveness of the TestFirst programming and the Test Last approach?
L. Huang, M. Holcombe / Information and Software Technology 51 (2009) 182–194 183
To answer the research questions, it is necessary to work outthe effectiveness from the perspective of testing, coding, code qual-ity, and productivity, of the Test First and the Test Last program-mers, respectively.
Accordingly comparative experiments were conducted in thespring semesters from the academic year 2002 to 2006 in SheffieldSoftware Engineering Observatory (SSEO), a semi-industry contextin which real projects, small sized goal systems that requiredapproximate 1000 person*hours on average, real clients, and stu-dent programmers were involved, to expand what is known con-cerning the effectiveness of Test First programming beforesoftware delivery.
The remainder of this paper is organized as follows: Section 2reviews empirical research related to the Test First. Section 3 pre-sents the goals as well as hypotheses that are set up, and describesthe experimental design. Section 4 provides the data analysis andstatistical results. Sections 5 presents the threats to validity, fol-lowed by Section 6 that provides a discussion for all empirical re-sults in this research. Finally, Section 7 summarizes the findingsand future work.
2. Related work
2.1. Previous studies
In this section, we selected only those that focused on the effec-tiveness of Test First programming in terms of testing, code quality,or productivity for review due to the large volume of literaturespertained to the Test First.
A comparative study [44] with 19 undergraduate students in-volved in an academic setting showed that Test First method didnot help programmers obtain higher productivity or programs ofhigher reliability but subjects using Test First understood the pro-grams better. A similar result was obtained by Pancur et al. [36]who carried out an experiment with 38 senior undergraduates,showing that Test First group obtained neither higher external qual-ity nor better code coverage. However, Edwards [18] got some dif-ferent results, which revealed that defect rate decreased andhigher code coverage was obtained after TDD’s adoption. Erdogmuset al. [19] also obtained similar results in a formal investigation with24 students who worked independently. It was found that the TestFirst students wrote more tests, and the minimum external qualityincreased with the number of tests. Moreover, students who wrotemore tests were more productive regardless of testing strategy em-ployed. While Test First programmers in those studies mentionedabove [44,36,18,19] did not obtained higher productivity, A resultregarding the improvement of productivity was obtained in theexperiment of Kaufmann et al. [32]. The amount of code producedby Test First team was 50% more. As Test First team and Test Lastteam were given the same amount of time and the code producedby two groups was of the same complexity level [42], the result indi-cated that the Test First team was significantly more productive.And Janzen et al. [29] found that the Test First teams delivered twiceas many features as Test Last teams did. Additionally, Test Firstteams wrote more tests and obtained higher code coverage.
In a case study based on the industrial setting at IBM, the pairprogrammers using Test First obtained a 40% to 50% improvementof code quality, whereas their productivity did not decrease corre-spondingly [54,41]. Another structured experiment run by Georgeet al. [22], delivered an alternative view again. In this study, 24professional pair programmers were divided into two groups, theTDD group of which was less productive but produced code ofhigher quality because 18% more black-box test cases were passedwhereas 16 percent more time were consumed in TDD group. Cris-pin [13] reported the experience in several companies saying that
using TDD has positive effect on the quality of code – the defectrate of delivered software in her company went down 62% afterone year and a half since TDD was adopted, and it decreased by an-other 39% one year later, although programming following TDDwas difficult and had no obvious positive effect on the softwarequality at early stage of its adoption.
2.2. Research motivation
In the studies reviewed above, the effectiveness of Test First pro-gramming was observed from the perspective of testing, code qual-ity, productivity, and the correlations between them. And thestatistical results that were reported did reveal that the effective-ness of Test First programming was different from that of Test Last.However, the results varied from one experiment to another: Insome study Test First programmers obtained higher productivity[29] while in others they did not [44,54,41,22,19]; in some studiesTest First programmers delivered software applications of higherquality [54,41,18] whereas in some others they failed to[44,36,19]. Moreover, all the observations reviewed above werebased on the development of small sized goal systems with fixedrequirements. The reviewed studies were based on small softwareapplications developed by solo programmer or one pair of program-mers but this is not always the case in the industry. Besides, in eachof the controlled experiments above, there was only one goal sys-tem, which possibly resulted in bias [12] because the technical fea-tures in one small goal system were quite limited – these limitationshad a negative effect on the external validity of those empirical stud-ies and therefore reduced the generalizability of results.
Since the empirical results regarding programmers’ productiv-ity and software’s external quality varied from one study to an-other as presented in the last paragraph, this research focusesessentially on the same dependent variables (productivity andexternal quality) as the reviewed studies [27]. Besides, becauseone of our colleagues [38] found that Test First programmers andTest Last programmers spent different proportions of time on cod-ing and testing, and the results of some empirical study supportedthat the more emphasis made on testing, the higher the productiv-ity is [18], we also focus on the effort spent on testing and coding.
However, we apply a different experimental design (presentedin Section 3) from other researchers did due to the limitations dis-cussed above – although some of those are quite difficult to beavoided or even inevitable, it is possible to make some changesto the experiment design, to get rid of, or at least alleviate the im-pact of some limitations, namely, the size of the goal system, thenumber of the goal system, and the team organization. To do this,experiments are carried out in the SSEO (Sheffield Software Engi-neering Observatory) environment for further investigation, as de-scribed in the following sections.
3. Experimental design
This section generally describes this study following Basili’sGoal-Question-Metric template [3,4]: the goal of this research ispresented in Section 3.1. The research questions (R1–R6), whichare generated from the discussion in Section 2.2, are raised in thenext two sections (Sections 3.2 and 3.3). And the measurementsfor effort spent on testing, effort spent on coding, productivity,and external quality are presented in Section 3.4. Afterwards, theexperiment procedure is described in detail.
3.1. Goal
The experimental goal is to compare the effectiveness of TestFirst programming with that of Test Last in terms of effort spent
Table 1Formalized hypotheses
Researchquestion
Null hypothesis – N Alternative hypothesis – A
R1 ProductivityTF = ProductivityTL ProductivityTF > ProductivityTL
R2 TestEffortTF = TestEffortTL TestEffortTF > TestEffortTL
R3 QualityTF = QualityTL QualityTF > QualityTL
R4 Quality = c + d � TestEffort, d = 0 Quality = c + d � TestEffort, d – 0R5 Productivity = f + g � TestEffort,
g = 0Productivity = f + g � TestEffort,g – 0
R6 CodeEffort = h + i � TestEffort, i = 0 CodeEffort = h + i � TestEffort, i – 0
184 L. Huang, M. Holcombe / Information and Software Technology 51 (2009) 182–194
on testing, effort spent on coding, productivity, external quality,and possible correlations between them.
3.2. Research questions
As presented in Sections 2.2 and 3.1, the effort spent on testing,effort spent on coding, productivity, external quality, and possiblecorrelations between them are focused in this research. The re-search questions are listed as follows.
R1. Can Test First help programmers obtain higher productivityat the team level?
R2. Do programmers using Test First spend more effort on test-ing when they work as a team?
R3. Which group of subjects is more likely to deliver software ofhigher quality, as the requirements are changing?From R1, R2, and R3, we may find that there possibly existsome relationships between the testing effort and someother aspects in the software development process, namely,the coding effort, productivity and software external quality.Thus the fourth, the fifth, and the sixth research question are
R4. Are there any correlations between the testing effort andproductivity?
R5. Are there any correlations between the testing effort andsoftware external quality?
R6. Are there any correlations between the testing effort andcoding effort?
3.3. Hypotheses and formalized hypotheses
With the research questions outlined in Section 3.2, the hypoth-eses for R1 to R6 are established as follows.
For R1,Null hypothesis (N1): Test First teams are of same productivitywith Test Last teams overall.Alternative hypothesis (A1): Test First teams are more produc-tive overall.Formalized hypotheses: N1: ProductivityTF = ProductivityTL
A1: ProductivityTF > ProductivityTL
For R2,Null hypothesis (N2): Test First teams spend same amount ofeffort on testing than Test Last teams do.Alternative hypothesis (A2): Test First teams make more efforton testing than Test Last teams do.Formalized hypotheses: N2: TestEffortTF = TestEffortTL
A2: TestEffortTF > TestEffortTL
For R3,Null hypothesis (N3): The external quality of software deliv-ered by Test First teams and Test Last teams is of the same level.Alternative hypothesis (A3): The quality of software deliveredby Test First teams is higher than that of software deliveredby Test Last teams.Formalized hypotheses: N3: QualityTF = QualityTL A3:QualityTF > QualityTL
For R4,Null hypothesis: The testing effort has nothing to do with thesoftware external quality.Alternative hypothesis (N4): The increase of testing effort leadsto the improvement of software external quality.Formalized hypotheses (A4): N4: Quality = c + d � TestEffort,d = 0A4: Quality = c + d � TestEffort, d – 0For R5,Null hypothesis (N5): The testing effort has nothing to do withthe productivity.
Alternative hypothesis (A5): The increase of testing effort leadsto productivity improvement.Formalized hypotheses: N5: Productivity = f + g � TestEffort,g = 0A5: Productivity = f + g � TestEffort, g – 0For R6,Null hypothesis (N6): The testing effort has nothing to do withthe coding effort.Alternative hypothesis (A6): The increase of testing effortreduces the effort on coding.Formalized hypotheses: N6: CodeEffort = h + i � TestEffort, i = 0A6: CodeEffort = h + i � TestEffort, i – 0
The formalized hypotheses are presented in Table 1 above.
3.4. Subjects
Students in the Software Hut [24,25] module were used as sub-jects in this research.
The Software Hut module consists of the level 2 undergradu-ate students from Computer Science and Software Engineeringdegrees, and the level 3 (3rd year is the final year) undergradu-ate students from Mathematics and Computer Science degreestudying in Department of Computer Science at the Universityof Sheffield, UK. The students are required to complete all thecourses in level 1 and those in the first semester of level 2 beforeregistering for the Software Hut module. The ones that are re-lated to the Software Hut projects are ‘‘Java Programming”,‘‘Requirements Engineering”, ‘‘Object Oriented Programming”,‘‘System Design and Testing”, ‘‘Functional Programming”, ‘‘Sys-tems Analysis and Design”, and ‘‘Database Technology”. In thesemodules, they have received the training of coding using tradi-tional method with different programming languages, testing atdifferent levels with software tools such as JUnit [30], developingsoftware applications at the teams level (usually consisted of 4–6members), and they were also introduced the concept and basicknowledge of agile methods.
Software Hut module ran over 12 weeks. Students were ex-pected to spend 120 h of effort per person on the module. In thefirst 5 sessions (approximately 10 h) all the students are given ad-vanced training of programming using Test First programming andother 11 practices of XP. They were expected to work as a team anddata was collected at the team level. There were 39 subjects/10teams involved in the experiment in 2006. Moreover, data was alsoextracted from the 2002, 2003, and 2004 archive (There were 60subjects/12 teams in 2004, 80 subjects/17 teams in 2003, and 96subjects/20 teams in 2002) when we investigated the correlationbetween TestEffort and CodingEffort to increase the number of datapoints (see Section 4.5).
In this research, software hut students are allocated to twogroups: the Test First and Test Last group, for comparing the effec-tiveness of Test First programming with that of Test Last.
L. Huang, M. Holcombe / Information and Software Technology 51 (2009) 182–194 185
3.5. Group formation and team allocation
In this research, software hut students were allocated to twogroups: the Test First and Test Last group. The Test First groupwas expected to program using Test First programming and other11 practices of XP, whereas the Test Last group was expected toprogram using XP practices except Test First.
One session of the module was given to 3–4 external businessclients to present the software systems they wanted in front ofall students. That is, each project had an external business client.After that, to help the subjects to form into teams consisted of 3–6 members and two groups (Test First group and Test Last group),we gave them an opportunity of telling us their preferred teammembers, projects, and testing strategies, to ensure that they werehappy with the allocation and thus had enough motivation – we donot want any of them to drop out during the experiment. For thegroup balancing, not all teams were assigned to do the project orprogram using the approach of their first preference. Those whohad no preference were assigned randomly. Since part of the stu-dents had no preference, the subjects’ academic records obtainedin the previous related courses were used for team/group balanc-ing in the process of team/group formation – they were expectedto work as a team and data was collected at the team level. Thesubjects’ levels of expertise of Test First group and Test Last groupwere proved statistically the same by applying a T-test, the resultof which was insignificant.
Three or four teams worked for one client. And we introduced acompetition mechanism to ensure every single team worked sepa-rately from other ones. The requirements kept changing naturallyin the first five weeks – some new features were raised by the cli-ents and a number of old ones were changed, but after the fifth andsixth week most of the requirements were stable. Subjects weretold that the requirements would change before the experimentbut did not know which ones of them would change. For each pro-ject, a manager was appointed, to ensure that students conform tothe practices as they were expected to. The students were asked to
Table 2Team allocation in 2006 as an example
Project Externalclients
Team No. Testingstrategies
Manager New/maintenanceproject
NHS database K 1, 9 Test First S New project6, 7 Test Last
PDA system A 4 Test First H Maintenance project5, 10 Test Last
Ethics system G 2, 8 Test First J New project3 Test Last
Table 3The experiment tasks
Year Project name Description for goal systems
2006 NHS database A tracking system for monitoring research activities iillegal or not
PDA system A database system which is used to keep track on thEthics system An automating ethics review application system for t
electronically
2004 Fizzilink A web based booking system for physiotherapy clinicDating An online dating agency for men and womenDebt collection A planning tool for the allocation of bailiffs to visit p
2003 Domestic violence An information system for a police service which recPharmaco A web based system for GPs to subscribe data or advControl engineering CD or video game to explain the use of control engin
2002 SFEDI A web based system to against small companies in gDentistry An online learning system with assessment and autoUFI An analysis tool for cell phone enquiries, sales and reNCSS An archive for managing publications on the treatme
upload all the code and artifacts that were produced weekly fromthe sixth week to the end of the semester (the end of 12th week,Easter vocation excluded).
The group formation and team allocation in academic year 2006is presented as an example in Table 2.
3.6. Apparatus
The subjects were allowed to use the Lewin Labarotory locatedon the first floor of Regent Court (Of course they can also use theirown computers in any place, but they must submit all work to thedata repository every week). The lab is equipped with far morethan 40 personal computers, all of which have an Internet connec-tion, Eclipse IDE [17] with the JUnit [30] plugin and CVS [8] clientbuilt in. Each of the students had an account for the managementtool [52] while each team has a ‘‘private” repository, which canonly be accessed by their team members, managers, andresearchers.
3.7. Experiment task
The goal systems are small sized ones, which took the subjects12 weeks time to develop (Easter vocation excluded). They wereNHS Database, the PDA system, and Ethics System in 2006, Fizzilink,Dating, and Debt Collection in 2004, Domestic Violence, Pharmaco,and Control Engineering in 2003, SFEDI (Small Firms EnterpriseDevelopment Initiative), Dentistry, UFI, and NCSS (National CancerScreening Service) in 2002, as described in the Table 3 below.
3.8. Procedure
As mentioned in Section 3.4, all students have experience ofdeveloping software systems using traditional approach at bothof individual and team level when they completed the prerequisitecourses of Software Hut. Additionally, the concept of Test First pro-gramming had been introduced to the students and they receivedtraining of programming using agile methods before the start ofthe module. After they were assigned to their teams and projects,5 advanced training sessions on Test First programming and other11 XP practices were provided.
The projects were executed following the agile paradigm as de-scribed as follows. From the third week to the fifth week, the sub-jects had meetings with the external business clients for therequirements capture, and were asked to submit the requirementdocuments by the sixth week. The requirements kept changing inthe first five weeks, but after the fifth and sixth week most of the
n hospitals having thousands of employees to find whether the ongoing research is
e clients with their loan on equipments, and to record their visit and episodeshe applicants, reviewers and administrators to process and review procedure
s
roperties and agencies to carry out their court order
ords domestic violence incidents and detailerse reactions to pharmaceuticals or reactantseering techniques in public activities
aining information about Government support schemesmated mailinglated issues for the University for Industrynts for cancer and related diseases
186 L. Huang, M. Holcombe / Information and Software Technology 51 (2009) 182–194
requirements were stable. All the requirement documents wereapproved and signed by the corresponding clients.
The appointed managers (academic and research staffs) hadmeetings with their teams once a week for team management,and to remind students to ensure that they conformed to the prac-tices, if necessary, as they were supposed to. The managers as-sessed the methodology conformance at the team level using theconformance assessment scheme set up by the teaching staff (seeSection 3.9.2). The students worked on their projects accordingto the plan made by themselves. And they were asked to uploadall the code and artifacts as soon as they were produced from thefirst week to the end of the semester. They were given instructionson classifying the documents required to upload files of differentcategories to directories with different names (in a server) andwere told that they would lose marks if they did not (so the docu-ments were classified by the subjects). Moreover, students wererequired to fill in timesheets for their working time.
Data was collected from the management tool [52] as well asthe data archive. One interview was given before the fifth weekto assess their knowledge and motivation of doing Test First or TestLast, to ensure that they were happy with the assigned team mem-bers and job. During the development process, data was extractedfrom the management tool and data archive week by week. Addi-tional interviews were also given to validate the data if any prob-lems with the data were found. Students were informed that theinterviews and data collection were conducted for research, butthe goals and hypotheses of experiments were kept confidential.The detailed data collection process is presented with the experi-mental variables described in Section 3.9.
In the analysis phase of the experiment, the effectiveness of TestFirst and traditional approach was assessed from the perspective ofexternal business clients and experimenters, using the measure-ments presented in Section 3.9.
3.9. Variables and measurements
3.9.1. Context variablesThe main independent variables in the experiment were per-
sonal data of subjects and team/group affiliations (see Table 4),all of which do not appear in the hypotheses but are indispensablefor the results interpretation and generalization [33]. The contextvariables are independent variables that were set before theexperiment.
3.9.2. Intermediate variablesIn this experiment, the process conformance of the subjects
(variable Conformance) and TestEffort were dependent on the con-text variables and experiment design, because the maturity of sub-jects and the experiment settings had an impact on the processconformance and the testing-related activities [49]. At the sametime, the variables closely related to the effectiveness of Test Firstprogramming, namely, CodingEffort, Productivity, and Quality, weredependent on Conformance and TestEffort. The process confor-mance also had an impact on the testing effort [49]. Therefore,two variables in the experiment, Conformance and TestEffort, wereconsidered to be intermediate variables in this multi-dependencysystem, because they were both independent and dependent.
Table 4Context variables
Name Description
Subjects Level 2 undergraduates major in computer scienceProgramming language Java and PHPEnvironment Management tool, Eclipse, JUnit, CVS, and PHP 5.0Course Software engineering course (Level 2, Spring Semester)
The managers played the role of assessors of methodology con-formance, where the measurement of the variable Conformancewas partially based on the conformance assessment scheme setup by teaching staffs (see Appendix A). Throughout the develop-ment process, managers were given privilege of reading docu-ments in the data archive, and asked to assess the developmentprocess using 11 criterions (name/weight): requirements/5, time-sheets/2, action lists/2, meetings/2, stories and XXMs (eXtremeX-Machines)/7, design elegance/3, Demo and poster/4, QualityAssurance/6, Solution/2, Unit tests/10, and documents qualityand content/5 [39]. The weight (importance) of those criterionswas decided by the teaching staffs of software hut module.
The subjects were encouraged by a potential reward of up to50% of the marks being directly related to the development pro-cess. That is, the final marks awarded were composed of two parts:the process conformance mark (50%) and the quality mark (50%).As stated above, in the development process assessment scheme,the weight for each of the criterions was decided by teaching staffsof software hut module – it was subject to the aim of teaching, anda number of those were not really related to the methodology con-formance. So, in this research, 8 criterions of the 11 were selected.They are (1) timesheets, (2) action lists, (3) meetings, (4) storiesand XXMs, (5) quality assurance, (6) solution, (7) unit tests, and(8) documents quality and content, which were set to be of thesame weight in the assessment scheme of the extent of methodol-ogy conformance. According to the raw data, there were not signif-icant differences (by applying T-test) between managers’ processmarks and the assessment marks of the variable Conformance.
The managers had meetings with the subjects at least once ineach of the 12 weeks. The aim of the management meetings wasto (1) remind the subjects about doing what they were expectedto, and (2) make records for the subjects’ responses to the manag-ers’ record sheet (see Appendix A) as the validation process oftimesheets. The subjects were told that they were assessed interms of process conformance, NOT the progress of software devel-opment. So in very few cases the subjects were found not to tell thetruth in the management meeting. Data from teams with low con-formance level (below 25 out of 50) was considered to be invalid.
The variable TestEffort was defined as the amount of effort spenton testing. Theoretically, the amount of effort can be measured bythe time spent on testing, the number of tests, and the amount of testcode. However, in this research, it was not applicable to use the dataindicating the number of tests or the amount of test code as mea-surements, because different teams worked on different projects.Thus we use the percentage of time spent on testing as the measure-ment for TestEffort [16]. The numbers of hours were collected fromtimesheets in the management tool. The timesheets were not con-sidered to be valid unless subjects filled them out regularly.
3.9.3. Dependent variables focused in this researchThe main dependent variables related to the effectiveness of
Test First in this study are Productivity, Quality, and CodingEffort,the ones mentioned in Section 3.3.
The variable Productivity is defined as output per hour. Theamount of ‘‘output” here can be measured by lines of code (LOC)[20]. In this case, the Productivity was measured by LOC per personper hour. The LOC was obtained by a parser, which can automati-cally remove comments and empty lines from the source code offinal delivery.
The variable CodingEffort was defined as the amount of effortspent on coding. The percentage of time spent on coding was usedas the measurement for this variable. The numbers of hours werecollected from timesheets in the management tool. The timesheetswere not considered to be valid unless (1) subjects filled them outregularly in the management tool (they were supposed to fill outthe timesheets every time they logged out), and/or (2) there did
L. Huang, M. Holcombe / Information and Software Technology 51 (2009) 182–194 187
not exist any inconsistencies between the time sheets, the manag-ers’ record (see Appendix A), and the files uploaded to the reposi-tory. For example, the timesheet would considered to be invalidand an interview would be further given if the timesheet said littletime was spent on coding however a number of features wereimplemented according to managers’ record or files in therepository.
Since software quality is a subjective issue [14,15], defect rate isnot the only measurement for external quality. In this research, themeasure of Quality was based on external clients’ assessment, dueto the heavy work load of doing acceptance testing for 10 imple-mentations for 3 different goal systems. The external clients usedthe delivered software for one month’s time and were asked to as-sess the quality of delivered software using 10 criteria, which ha-ven been approved by our business clients and this assessmentscheme has been used for over 15 years [39,53]: (1) the presenta-tion (to provide a brief outline for the delivered software), (2) usermanual, (3) installation guide, (4) ease of use, (5) error handling,(6) understandability, (7) base functionality, (8) innovation, (9)robustness, and (10) happiness (overall satisfactory). Each of theten criterions is of the same weight [39].
Similar to the assessment scheme of Conformance, there weresome items that were not closely related to the code quality inthe assessment scheme of software external quality, for instance,the presentation (a brief outline for the delivered software), usermanual, installation guide, and innovation. However, those wereitems showing the clients’ satisfactory levels, which are contrib-uted by a number of factors, including technical and non-technical.Thus all the items on the clients’ assessment scheme were takeninto account in the measurement of variable Quality in this re-search. With the clients’ assessment forms as the feedback, it ispossible to select some specific sets of items from the existingscheme, and examine the software quality in different ways, aswe did in the measurement of variable Conformance.
All the intermediate and dependent variables for the quantita-tive research and the corresponding measurements are listed inTable 5.
4. Experiment results
In this section, the effectiveness of Test First programming iscompared with that of Test Last from the perspective of productiv-ity, testing effort, external quality, and coding effort, where 2 pre-diction models (M1 and M2) were built, and the methodologyconformance is used in the data validation.
Since the testing strategies applied were not the only differ-ences between two groups of subjects in software hut 2002,2003, and 2004, only data collected from software hut 2006 wasused in the data analysis for the Test First and Test Last effective-ness comparison (for research question 1–5 raised in Section3.2). For research question 6, as the result of Pearson Correlationfor Test First teams is very close to the significance value and TestFirst teams in those 4 years were of no difference, data for Test Firstteams of software hut 2002, 2003, 2004, and 2006, which was ex-acted from the data archive, was also put into statistics.
Table 5Intermediate and dependent variables with their measurements for the quantitativeresearch
Dependent variables Measurements
Productivity LOC per person per hourTestEffort Time spent on testing as a percentageQuality 10 criteria approved by business clients (in Section 5.3.2)CodingEffort Time spent on coding as a percentageConformance 8 criterions selected form approved by teaching staffs
4.1. Productivity
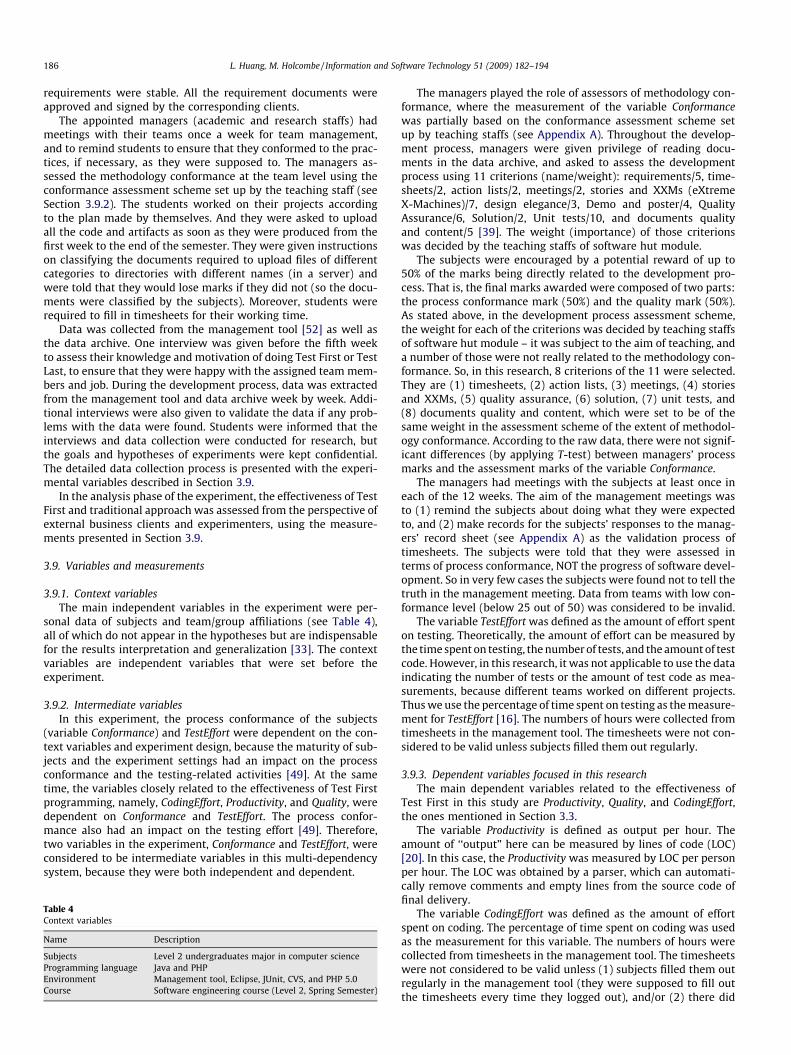
Where the variable Productivity was measured by LOC/(per-son*hour), the effect was in the predicted direction – the medianof TF teams’ productivity was higher than that of TL teams (seeFig. 1). According to the results of the Kolmogorov–Smirnov Test[34,48], the data points of Productivity were normally distributed.Thus Students’ one-tailed T-test [23] and Mann–Whitney U-test[40] were applied to test whether the difference between twogroups was significant or not. In our experiment, we collected dataat the team level – 5 Test First teams and 5 Test Last teams. The dif-ference was considered to be significant if the result of T-test/Mann–Whitney test equalled to or was smaller than 0.1 due tothe small number of data points [40]. Thus, the power of this testwas 0.57, which was poor [11]. However, we had to live with thisdrawback, as it is quite difficult and expensive to acquire moreteams for experiments of larger scale [3].
The result of T-test (P = 0.128) and the result of the Mann–Whit-ney U-test (P = 0.289) revealed that the difference was not remark-able enough (see Table 6). Therefore, we can accept the nullhypothesis N1.
The results for productivity obtained by Test First teams andTest Last teams are presented below in a boxplot graph [20]. Theboxes contain 50% of the data points, the lower/upper border ofthe box stand for the 25/75 percentile. Solid horizontal line inthe middle of a box shows the median. The position of the lower‘‘arm” is computed by the formula: 25 percentile � 1.5 * (75 per-centile � 25 percentile), the position of the upper ‘‘arm” is com-puted as 75 percentile + 1.5 * (75 percentile � 25 percentile).Possible outliers are marked by small circles.
According to the results, it is safe to claim that Test First pro-gramming positively helped programmers obtained higher produc-tivity (As discussed in Section 3, the researchers managed toensure different projects were comparable). However in this re-search, the improvement was not statistically significant. It possi-bly resulted from the small scale of the experiment, or humanfactors like subjects’ motivation and personality [50,31].
Although the null hypothesis N1 was accepted, the result of T-test was close to the significance level. It was calculated that the
Table 6Statistical results of R1
Mean Std. deviation T-testsignificance
Mann–WhitneyU-test, p value
LOC per personper hour
TF: 12.38 TF: 6.71 0.128 0.289TL: 7.21 TL: 1.56
Fig. 1. Productivity, TF versus TL.
188 L. Huang, M. Holcombe / Information and Software Technology 51 (2009) 182–194
mean value of productivity of Test First teams was 70% higher thanthat of Test Last teams. It was also observed that the standard devi-ation of productivity of Test First teams was much greater (6.71versus 1.56). One explanation to the results is the Test First pro-gramming did help programmers obtain higher productivity; how-ever, the extent of productivity improvement in different teamsvaried, because the involved subjects were novices who did nothave experience of programming following XP and Test First. Incontrast, subjects had had experience of doing Test Last, and thusthe productivity in different Test Last teams was close to eachother.
4.2. Testing effort
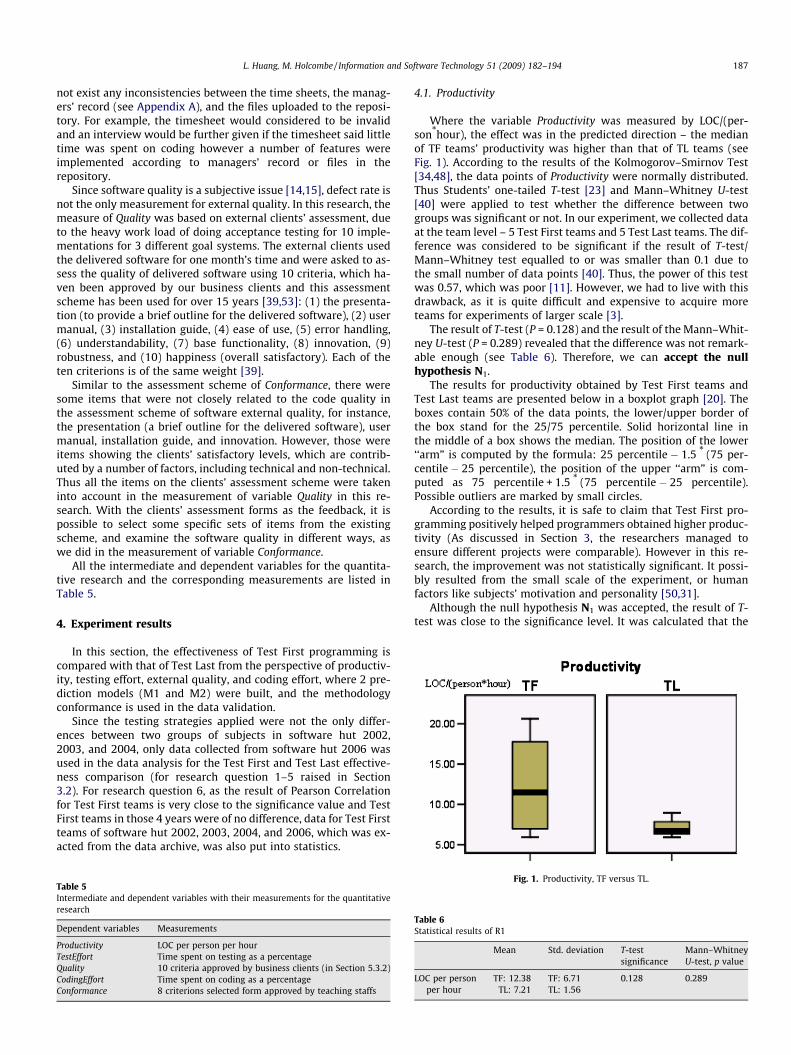
The variable TestEffort was measured by the amount of timespent on testing as a percentage. The effect was in the predicteddirection (see Fig. 2). As shown in Table 7 – the median and meanof Test First groups’ data is significantly higher than that of TestLast groups’, and the difference between the two groups of datawere normally distributed and significant according to the resultof the T-test (P = 0.077) and Mann–Whitney U-test (P = 0.086).The power of this test was 0.41.
In this case, we were able to reject the null hypothesis N2. Theresult pertaining to the effort made on testing was reasonable. TestFirst programmers should had created more unit tests and runthose tests more frequently, however according to our managers’feedback, Test Last teams seldom wrote tests at the early stage ofsoftware development, or even left testing to be the last thing todo before the software delivery which is also reported in [54,41],although all programmers, regardless of the testing method theyused, are supposed to do an incremental development and regres-sion testing.
A second explanation was that subjects had little experience ofdoing Test First, so they spent time on learning how to use themethod new to them. Thus, it appeared that Test First programmerspent more time on testing – they spent more time on learningdoing Test First actually.
A third explanation was that subjects doing Test First wrotetests in accordance with the requirements at the early stage ofdevelopment process; however, the requirements were changing
Table 7Statistical results of R2
Mean Std.deviation
T-testsignificance
Mann–WhitneyU-test, p value
Percentage of timefor testing
TF: 8.56 TF: 7.41 0.077 0.086TL: 4.58 TL: 3.98
Fig. 2. Time spent on testing as a percentage, TF versus TL.
in the first five weeks. Therefore, subjects in the Test First grouphad to rewrite some tests correspondingly [6] and thus made moreeffort on testing.
Nevertheless, of those three explanations outlined above, it wasnot studied which one or which ones were our case in thisresearch.
4.3. External quality
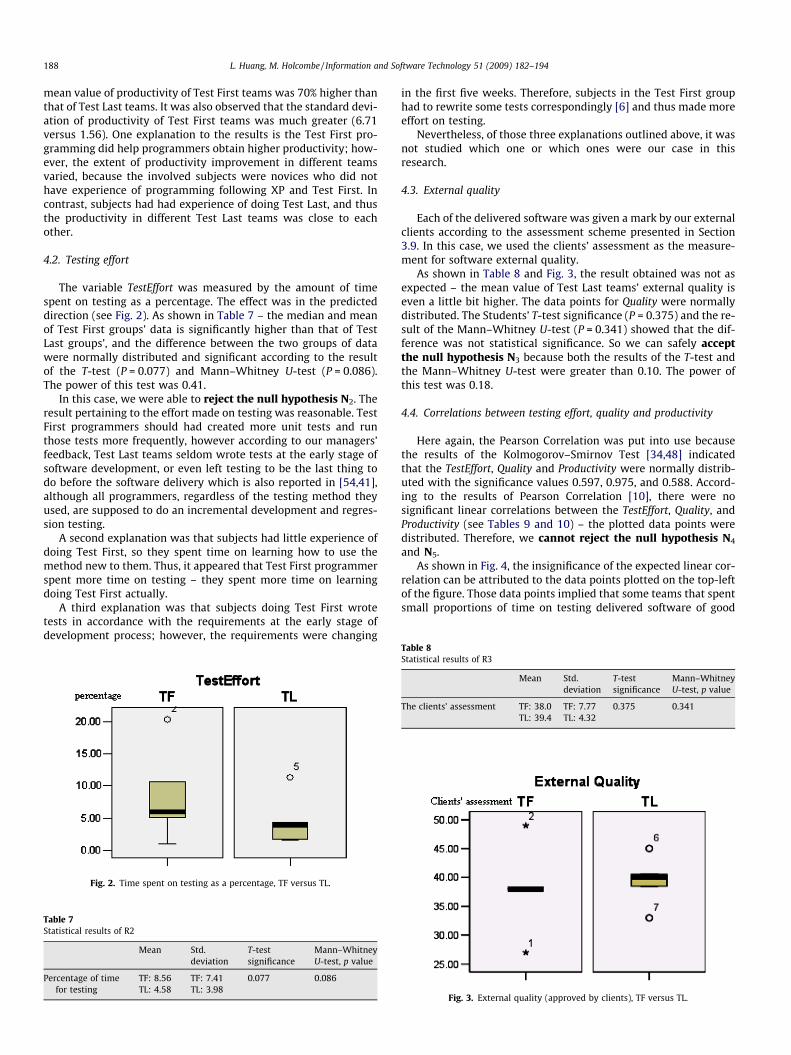
Each of the delivered software was given a mark by our externalclients according to the assessment scheme presented in Section3.9. In this case, we used the clients’ assessment as the measure-ment for software external quality.
As shown in Table 8 and Fig. 3, the result obtained was not asexpected – the mean value of Test Last teams’ external quality iseven a little bit higher. The data points for Quality were normallydistributed. The Students’ T-test significance (P = 0.375) and the re-sult of the Mann–Whitney U-test (P = 0.341) showed that the dif-ference was not statistical significance. So we can safely acceptthe null hypothesis N3 because both the results of the T-test andthe Mann–Whitney U-test were greater than 0.10. The power ofthis test was 0.18.
4.4. Correlations between testing effort, quality and productivity
Here again, the Pearson Correlation was put into use becausethe results of the Kolmogorov–Smirnov Test [34,48] indicatedthat the TestEffort, Quality and Productivity were normally distrib-uted with the significance values 0.597, 0.975, and 0.588. Accord-ing to the results of Pearson Correlation [10], there were nosignificant linear correlations between the TestEffort, Quality, andProductivity (see Tables 9 and 10) – the plotted data points weredistributed. Therefore, we cannot reject the null hypothesis N4
and N5.As shown in Fig. 4, the insignificance of the expected linear cor-
relation can be attributed to the data points plotted on the top-leftof the figure. Those data points implied that some teams that spentsmall proportions of time on testing delivered software of good
Table 8Statistical results of R3
Mean Std.deviation
T-testsignificance
Mann–WhitneyU-test, p value
The clients’ assessment TF: 38.0 TF: 7.77 0.375 0.341TL: 39.4 TL: 4.32
Fig. 3. External quality (approved by clients), TF versus TL.
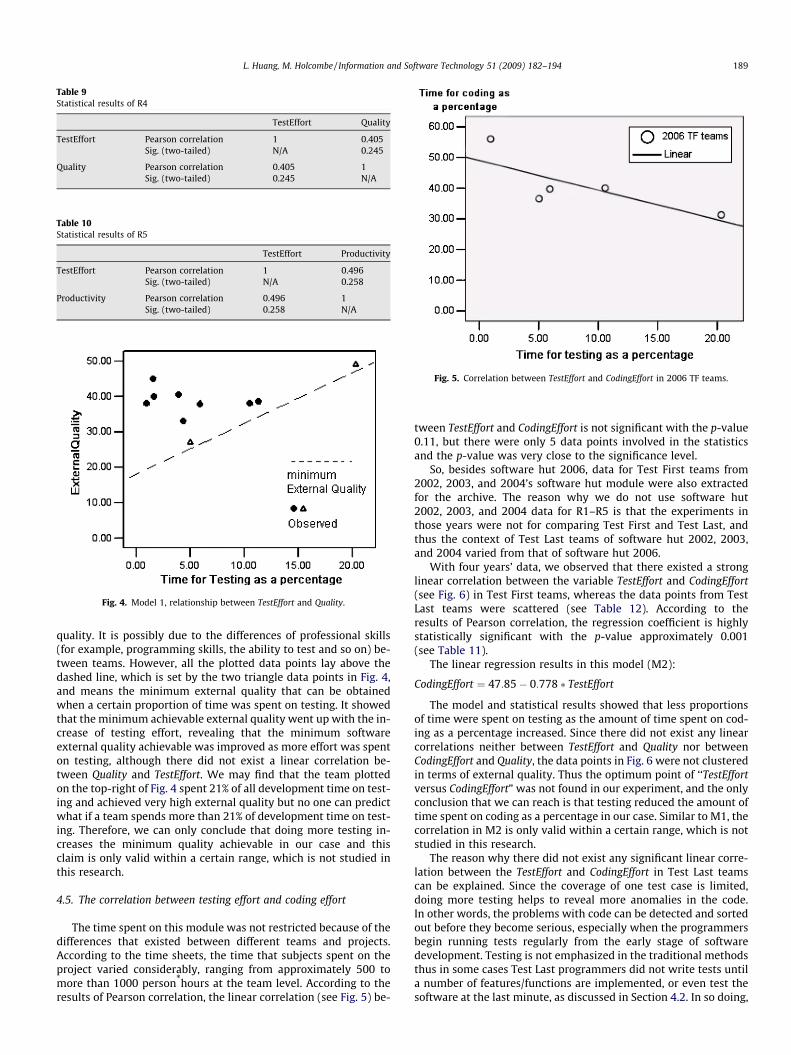
Table 9Statistical results of R4
TestEffort Quality
TestEffort Pearson correlation 1 0.405Sig. (two-tailed) N/A 0.245
Quality Pearson correlation 0.405 1Sig. (two-tailed) 0.245 N/A
Table 10Statistical results of R5
TestEffort Productivity
TestEffort Pearson correlation 1 0.496Sig. (two-tailed) N/A 0.258
Productivity Pearson correlation 0.496 1Sig. (two-tailed) 0.258 N/A
Fig. 4. Model 1, relationship between TestEffort and Quality.
Fig. 5. Correlation between TestEffort and CodingEffort in 2006 TF teams.
L. Huang, M. Holcombe / Information and Software Technology 51 (2009) 182–194 189
quality. It is possibly due to the differences of professional skills(for example, programming skills, the ability to test and so on) be-tween teams. However, all the plotted data points lay above thedashed line, which is set by the two triangle data points in Fig. 4,and means the minimum external quality that can be obtainedwhen a certain proportion of time was spent on testing. It showedthat the minimum achievable external quality went up with the in-crease of testing effort, revealing that the minimum softwareexternal quality achievable was improved as more effort was spenton testing, although there did not exist a linear correlation be-tween Quality and TestEffort. We may find that the team plottedon the top-right of Fig. 4 spent 21% of all development time on test-ing and achieved very high external quality but no one can predictwhat if a team spends more than 21% of development time on test-ing. Therefore, we can only conclude that doing more testing in-creases the minimum quality achievable in our case and thisclaim is only valid within a certain range, which is not studied inthis research.
4.5. The correlation between testing effort and coding effort
The time spent on this module was not restricted because of thedifferences that existed between different teams and projects.According to the time sheets, the time that subjects spent on theproject varied considerably, ranging from approximately 500 tomore than 1000 person*hours at the team level. According to theresults of Pearson correlation, the linear correlation (see Fig. 5) be-
tween TestEffort and CodingEffort is not significant with the p-value0.11, but there were only 5 data points involved in the statisticsand the p-value was very close to the significance level.
So, besides software hut 2006, data for Test First teams from2002, 2003, and 2004’s software hut module were also extractedfor the archive. The reason why we do not use software hut2002, 2003, and 2004 data for R1–R5 is that the experiments inthose years were not for comparing Test First and Test Last, andthus the context of Test Last teams of software hut 2002, 2003,and 2004 varied from that of software hut 2006.
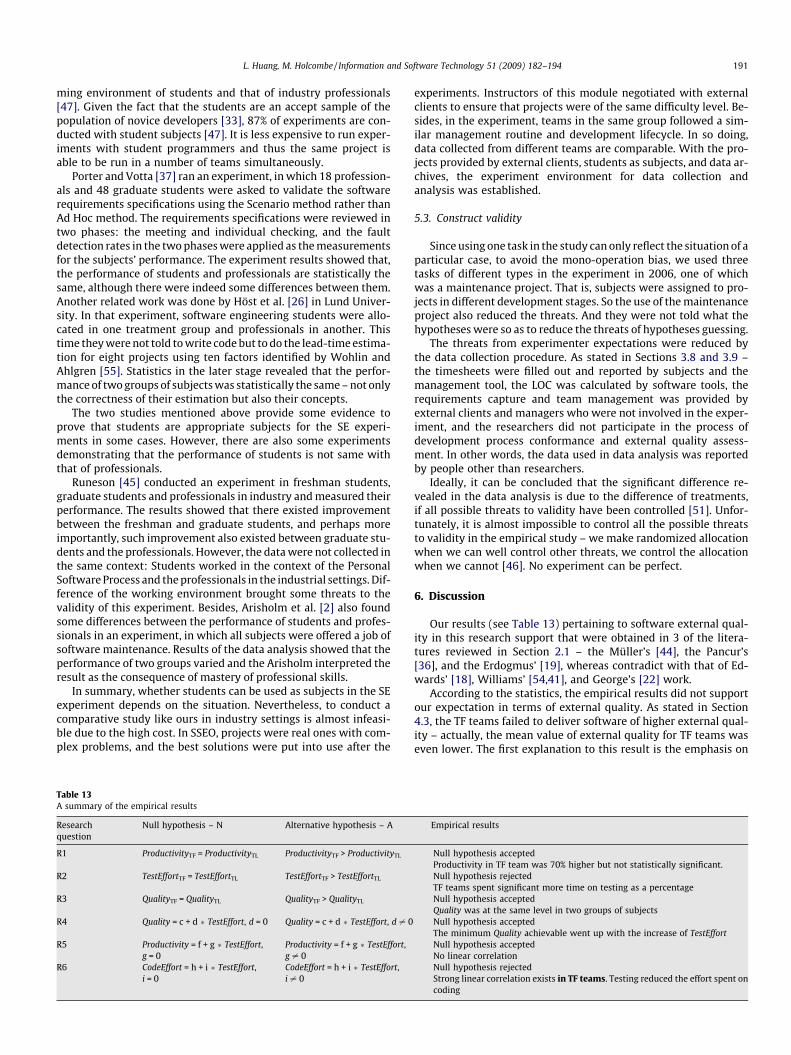
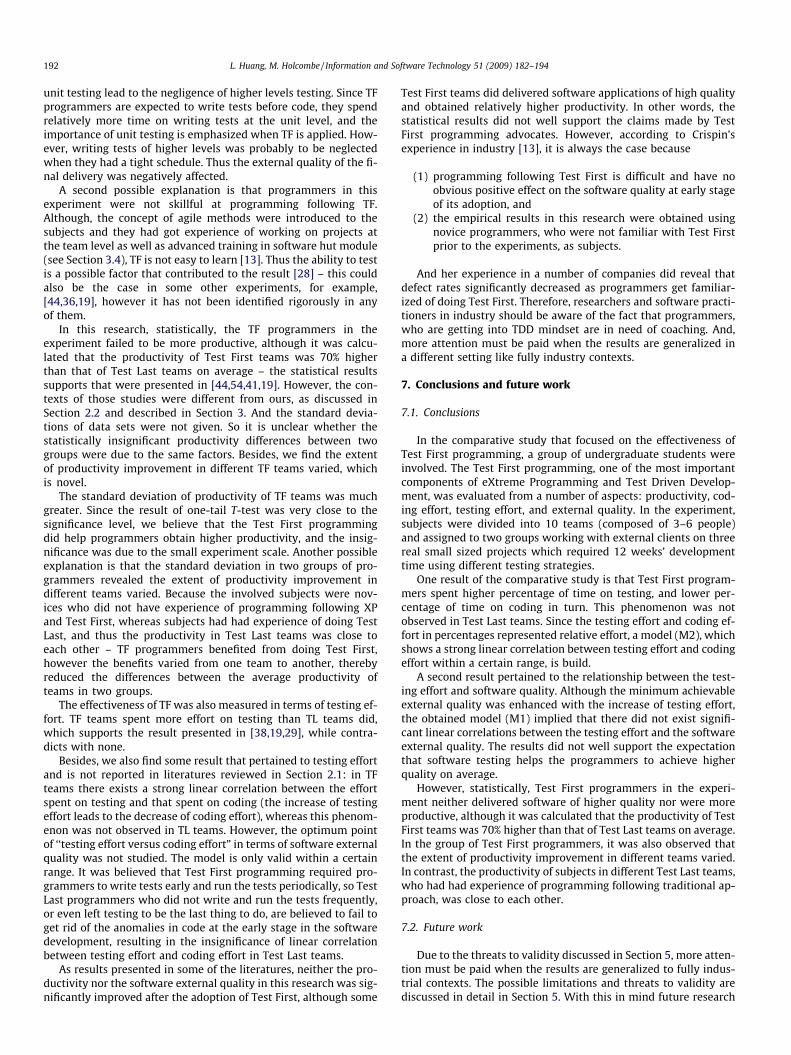
With four years’ data, we observed that there existed a stronglinear correlation between the variable TestEffort and CodingEffort(see Fig. 6) in Test First teams, whereas the data points from TestLast teams were scattered (see Table 12). According to theresults of Pearson correlation, the regression coefficient is highlystatistically significant with the p-value approximately 0.001(see Table 11).
The linear regression results in this model (M2):
CodingEffort ¼ 47:85� 0:778 � TestEffort
The model and statistical results showed that less proportionsof time were spent on testing as the amount of time spent on cod-ing as a percentage increased. Since there did not exist any linearcorrelations neither between TestEffort and Quality nor betweenCodingEffort and Quality, the data points in Fig. 6 were not clusteredin terms of external quality. Thus the optimum point of ‘‘TestEffortversus CodingEffort” was not found in our experiment, and the onlyconclusion that we can reach is that testing reduced the amount oftime spent on coding as a percentage in our case. Similar to M1, thecorrelation in M2 is only valid within a certain range, which is notstudied in this research.
The reason why there did not exist any significant linear corre-lation between the TestEffort and CodingEffort in Test Last teamscan be explained. Since the coverage of one test case is limited,doing more testing helps to reveal more anomalies in the code.In other words, the problems with code can be detected and sortedout before they become serious, especially when the programmersbegin running tests regularly from the early stage of softwaredevelopment. Testing is not emphasized in the traditional methodsthus in some cases Test Last programmers did not write tests untila number of features/functions are implemented, or even test thesoftware at the last minute, as discussed in Section 4.2. In so doing,
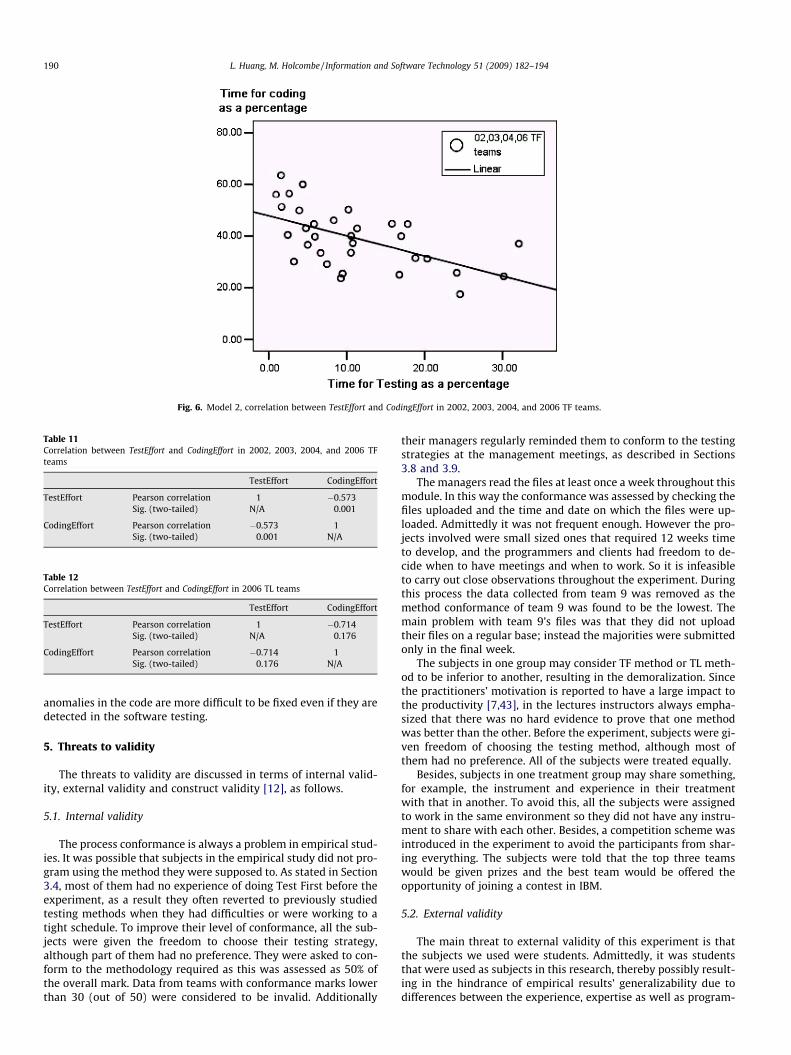
Fig. 6. Model 2, correlation between TestEffort and CodingEffort in 2002, 2003, 2004, and 2006 TF teams.
Table 11Correlation between TestEffort and CodingEffort in 2002, 2003, 2004, and 2006 TFteams
TestEffort CodingEffort
TestEffort Pearson correlation 1 �0.573Sig. (two-tailed) N/A 0.001
CodingEffort Pearson correlation �0.573 1Sig. (two-tailed) 0.001 N/A
Table 12Correlation between TestEffort and CodingEffort in 2006 TL teams
TestEffort CodingEffort
TestEffort Pearson correlation 1 �0.714Sig. (two-tailed) N/A 0.176
CodingEffort Pearson correlation �0.714 1Sig. (two-tailed) 0.176 N/A
190 L. Huang, M. Holcombe / Information and Software Technology 51 (2009) 182–194
anomalies in the code are more difficult to be fixed even if they aredetected in the software testing.
5. Threats to validity
The threats to validity are discussed in terms of internal valid-ity, external validity and construct validity [12], as follows.
5.1. Internal validity
The process conformance is always a problem in empirical stud-ies. It was possible that subjects in the empirical study did not pro-gram using the method they were supposed to. As stated in Section3.4, most of them had no experience of doing Test First before theexperiment, as a result they often reverted to previously studiedtesting methods when they had difficulties or were working to atight schedule. To improve their level of conformance, all the sub-jects were given the freedom to choose their testing strategy,although part of them had no preference. They were asked to con-form to the methodology required as this was assessed as 50% ofthe overall mark. Data from teams with conformance marks lowerthan 30 (out of 50) were considered to be invalid. Additionally
their managers regularly reminded them to conform to the testingstrategies at the management meetings, as described in Sections3.8 and 3.9.
The managers read the files at least once a week throughout thismodule. In this way the conformance was assessed by checking thefiles uploaded and the time and date on which the files were up-loaded. Admittedly it was not frequent enough. However the pro-jects involved were small sized ones that required 12 weeks timeto develop, and the programmers and clients had freedom to de-cide when to have meetings and when to work. So it is infeasibleto carry out close observations throughout the experiment. Duringthis process the data collected from team 9 was removed as themethod conformance of team 9 was found to be the lowest. Themain problem with team 9’s files was that they did not uploadtheir files on a regular base; instead the majorities were submittedonly in the final week.
The subjects in one group may consider TF method or TL meth-od to be inferior to another, resulting in the demoralization. Sincethe practitioners’ motivation is reported to have a large impact tothe productivity [7,43], in the lectures instructors always empha-sized that there was no hard evidence to prove that one methodwas better than the other. Before the experiment, subjects were gi-ven freedom of choosing the testing method, although most ofthem had no preference. All of the subjects were treated equally.
Besides, subjects in one treatment group may share something,for example, the instrument and experience in their treatmentwith that in another. To avoid this, all the subjects were assignedto work in the same environment so they did not have any instru-ment to share with each other. Besides, a competition scheme wasintroduced in the experiment to avoid the participants from shar-ing everything. The subjects were told that the top three teamswould be given prizes and the best team would be offered theopportunity of joining a contest in IBM.
5.2. External validity
The main threat to external validity of this experiment is thatthe subjects we used were students. Admittedly, it was studentsthat were used as subjects in this research, thereby possibly result-ing in the hindrance of empirical results’ generalizability due todifferences between the experience, expertise as well as program-
L. Huang, M. Holcombe / Information and Software Technology 51 (2009) 182–194 191
ming environment of students and that of industry professionals[47]. Given the fact that the students are an accept sample of thepopulation of novice developers [33], 87% of experiments are con-ducted with student subjects [47]. It is less expensive to run exper-iments with student programmers and thus the same project isable to be run in a number of teams simultaneously.
Porter and Votta [37] ran an experiment, in which 18 profession-als and 48 graduate students were asked to validate the softwarerequirements specifications using the Scenario method rather thanAd Hoc method. The requirements specifications were reviewed intwo phases: the meeting and individual checking, and the faultdetection rates in the two phases were applied as the measurementsfor the subjects’ performance. The experiment results showed that,the performance of students and professionals are statistically thesame, although there were indeed some differences between them.Another related work was done by Höst et al. [26] in Lund Univer-sity. In that experiment, software engineering students were allo-cated in one treatment group and professionals in another. Thistime they were not told to write code but to do the lead-time estima-tion for eight projects using ten factors identified by Wohlin andAhlgren [55]. Statistics in the later stage revealed that the perfor-mance of two groups of subjects was statistically the same – not onlythe correctness of their estimation but also their concepts.
The two studies mentioned above provide some evidence toprove that students are appropriate subjects for the SE experi-ments in some cases. However, there are also some experimentsdemonstrating that the performance of students is not same withthat of professionals.
Runeson [45] conducted an experiment in freshman students,graduate students and professionals in industry and measured theirperformance. The results showed that there existed improvementbetween the freshman and graduate students, and perhaps moreimportantly, such improvement also existed between graduate stu-dents and the professionals. However, the data were not collected inthe same context: Students worked in the context of the PersonalSoftware Process and the professionals in the industrial settings. Dif-ference of the working environment brought some threats to thevalidity of this experiment. Besides, Arisholm et al. [2] also foundsome differences between the performance of students and profes-sionals in an experiment, in which all subjects were offered a job ofsoftware maintenance. Results of the data analysis showed that theperformance of two groups varied and the Arisholm interpreted theresult as the consequence of mastery of professional skills.
In summary, whether students can be used as subjects in the SEexperiment depends on the situation. Nevertheless, to conduct acomparative study like ours in industry settings is almost infeasi-ble due to the high cost. In SSEO, projects were real ones with com-plex problems, and the best solutions were put into use after the
Table 13A summary of the empirical results
Researchquestion
Null hypothesis – N Alternative hypothesis – A
R1 ProductivityTF = ProductivityTL ProductivityTF > ProductivityTL
R2 TestEffortTF = TestEffortTL TestEffortTF > TestEffortTL
R3 QualityTF = QualityTL QualityTF > QualityTL
R4 Quality = c + d � TestEffort, d = 0 Quality = c + d � TestEffort, d – 0
R5 Productivity = f + g � TestEffort,g = 0
Productivity = f + g � TestEffort,g – 0
R6 CodeEffort = h + i � TestEffort,i = 0
CodeEffort = h + i � TestEffort,i – 0
experiments. Instructors of this module negotiated with externalclients to ensure that projects were of the same difficulty level. Be-sides, in the experiment, teams in the same group followed a sim-ilar management routine and development lifecycle. In so doing,data collected from different teams are comparable. With the pro-jects provided by external clients, students as subjects, and data ar-chives, the experiment environment for data collection andanalysis was established.
5.3. Construct validity
Since using one task in the study can only reflect the situation of aparticular case, to avoid the mono-operation bias, we used threetasks of different types in the experiment in 2006, one of whichwas a maintenance project. That is, subjects were assigned to pro-jects in different development stages. So the use of the maintenanceproject also reduced the threats. And they were not told what thehypotheses were so as to reduce the threats of hypotheses guessing.
The threats from experimenter expectations were reduced bythe data collection procedure. As stated in Sections 3.8 and 3.9 –the timesheets were filled out and reported by subjects and themanagement tool, the LOC was calculated by software tools, therequirements capture and team management was provided byexternal clients and managers who were not involved in the exper-iment, and the researchers did not participate in the process ofdevelopment process conformance and external quality assess-ment. In other words, the data used in data analysis was reportedby people other than researchers.
Ideally, it can be concluded that the significant difference re-vealed in the data analysis is due to the difference of treatments,if all possible threats to validity have been controlled [51]. Unfor-tunately, it is almost impossible to control all the possible threatsto validity in the empirical study – we make randomized allocationwhen we can well control other threats, we control the allocationwhen we cannot [46]. No experiment can be perfect.
6. Discussion
Our results (see Table 13) pertaining to software external qual-ity in this research support that were obtained in 3 of the litera-tures reviewed in Section 2.1 – the Müller’s [44], the Pancur’s[36], and the Erdogmus’ [19], whereas contradict with that of Ed-wards’ [18], Williams’ [54,41], and George’s [22] work.
According to the statistics, the empirical results did not supportour expectation in terms of external quality. As stated in Section4.3, the TF teams failed to deliver software of higher external qual-ity – actually, the mean value of external quality for TF teams waseven lower. The first explanation to this result is the emphasis on
Empirical results
Null hypothesis acceptedProductivity in TF team was 70% higher but not statistically significant.Null hypothesis rejectedTF teams spent significant more time on testing as a percentageNull hypothesis acceptedQuality was at the same level in two groups of subjectsNull hypothesis acceptedThe minimum Quality achievable went up with the increase of TestEffortNull hypothesis acceptedNo linear correlationNull hypothesis rejectedStrong linear correlation exists in TF teams. Testing reduced the effort spent oncoding
192 L. Huang, M. Holcombe / Information and Software Technology 51 (2009) 182–194
unit testing lead to the negligence of higher levels testing. Since TFprogrammers are expected to write tests before code, they spendrelatively more time on writing tests at the unit level, and theimportance of unit testing is emphasized when TF is applied. How-ever, writing tests of higher levels was probably to be neglectedwhen they had a tight schedule. Thus the external quality of the fi-nal delivery was negatively affected.
A second possible explanation is that programmers in thisexperiment were not skillful at programming following TF.Although, the concept of agile methods were introduced to thesubjects and they had got experience of working on projects atthe team level as well as advanced training in software hut module(see Section 3.4), TF is not easy to learn [13]. Thus the ability to testis a possible factor that contributed to the result [28] – this couldalso be the case in some other experiments, for example,[44,36,19], however it has not been identified rigorously in anyof them.
In this research, statistically, the TF programmers in theexperiment failed to be more productive, although it was calcu-lated that the productivity of Test First teams was 70% higherthan that of Test Last teams on average – the statistical resultssupports that were presented in [44,54,41,19]. However, the con-texts of those studies were different from ours, as discussed inSection 2.2 and described in Section 3. And the standard devia-tions of data sets were not given. So it is unclear whether thestatistically insignificant productivity differences between twogroups were due to the same factors. Besides, we find the extentof productivity improvement in different TF teams varied, whichis novel.
The standard deviation of productivity of TF teams was muchgreater. Since the result of one-tail T-test was very close to thesignificance level, we believe that the Test First programmingdid help programmers obtain higher productivity, and the insig-nificance was due to the small experiment scale. Another possibleexplanation is that the standard deviation in two groups of pro-grammers revealed the extent of productivity improvement indifferent teams varied. Because the involved subjects were nov-ices who did not have experience of programming following XPand Test First, whereas subjects had had experience of doing TestLast, and thus the productivity in Test Last teams was close toeach other – TF programmers benefited from doing Test First,however the benefits varied from one team to another, therebyreduced the differences between the average productivity ofteams in two groups.
The effectiveness of TF was also measured in terms of testing ef-fort. TF teams spent more effort on testing than TL teams did,which supports the result presented in [38,19,29], while contra-dicts with none.
Besides, we also find some result that pertained to testing effortand is not reported in literatures reviewed in Section 2.1: in TFteams there exists a strong linear correlation between the effortspent on testing and that spent on coding (the increase of testingeffort leads to the decrease of coding effort), whereas this phenom-enon was not observed in TL teams. However, the optimum pointof ‘‘testing effort versus coding effort” in terms of software externalquality was not studied. The model is only valid within a certainrange. It was believed that Test First programming required pro-grammers to write tests early and run the tests periodically, so TestLast programmers who did not write and run the tests frequently,or even left testing to be the last thing to do, are believed to fail toget rid of the anomalies in code at the early stage in the softwaredevelopment, resulting in the insignificance of linear correlationbetween testing effort and coding effort in Test Last teams.
As results presented in some of the literatures, neither the pro-ductivity nor the software external quality in this research was sig-nificantly improved after the adoption of Test First, although some
Test First teams did delivered software applications of high qualityand obtained relatively higher productivity. In other words, thestatistical results did not well support the claims made by TestFirst programming advocates. However, according to Crispin’sexperience in industry [13], it is always the case because
(1) programming following Test First is difficult and have noobvious positive effect on the software quality at early stageof its adoption, and
(2) the empirical results in this research were obtained usingnovice programmers, who were not familiar with Test Firstprior to the experiments, as subjects.
And her experience in a number of companies did reveal thatdefect rates significantly decreased as programmers get familiar-ized of doing Test First. Therefore, researchers and software practi-tioners in industry should be aware of the fact that programmers,who are getting into TDD mindset are in need of coaching. And,more attention must be paid when the results are generalized ina different setting like fully industry contexts.
7. Conclusions and future work
7.1. Conclusions
In the comparative study that focused on the effectiveness ofTest First programming, a group of undergraduate students wereinvolved. The Test First programming, one of the most importantcomponents of eXtreme Programming and Test Driven Develop-ment, was evaluated from a number of aspects: productivity, cod-ing effort, testing effort, and external quality. In the experiment,subjects were divided into 10 teams (composed of 3–6 people)and assigned to two groups working with external clients on threereal small sized projects which required 12 weeks’ developmenttime using different testing strategies.
One result of the comparative study is that Test First program-mers spent higher percentage of time on testing, and lower per-centage of time on coding in turn. This phenomenon was notobserved in Test Last teams. Since the testing effort and coding ef-fort in percentages represented relative effort, a model (M2), whichshows a strong linear correlation between testing effort and codingeffort within a certain range, is build.
A second result pertained to the relationship between the test-ing effort and software quality. Although the minimum achievableexternal quality was enhanced with the increase of testing effort,the obtained model (M1) implied that there did not exist signifi-cant linear correlations between the testing effort and the softwareexternal quality. The results did not well support the expectationthat software testing helps the programmers to achieve higherquality on average.
However, statistically, Test First programmers in the experi-ment neither delivered software of higher quality nor were moreproductive, although it was calculated that the productivity of TestFirst teams was 70% higher than that of Test Last teams on average.In the group of Test First programmers, it was also observed thatthe extent of productivity improvement in different teams varied.In contrast, the productivity of subjects in different Test Last teams,who had had experience of programming following traditional ap-proach, was close to each other.
7.2. Future work
Due to the threats to validity discussed in Section 5, more atten-tion must be paid when the results are generalized to fully indus-trial contexts. The possible limitations and threats to validity arediscussed in detail in Section 5. With this in mind future research
L. Huang, M. Holcombe / Information and Software Technology 51 (2009) 182–194 193
should seek to strengthen and expand these findings to softwaredevelopment projects of different complexity with a larger samplesize in various settings, and find out in which circumstances TestFirst programming is of the highest effectiveness.
Since advocates of Test First programming claim that the testsets produced by Test First programmers throughout the develop-ment process positively contribute to the maintenance after thesoftware delivery, not only is it useful to observe the new projectsbut also helpful to focus on more maintenance projects in futureresearch – there were only 3 teams (1 Test First team and 2 TestLast teams) working on one maintenance project in software hut2006 thus statistically it was not meaningful to compare the im-pact of Test First and Test Last on maintenance projects. Moreover,the value of test sets produced by Test First programmers involvedin the maintenance projects is worth of being further investigatedin future research.
Appendix A. Managers record sheet
Software Hut Managers Record Sheet
Date:
Team: TF/L Members absent:a. What has the team changed/done this week?b. Wha
ments a t new/changed require re there?b.1. Fr
om the client?b.2. As the result of bugs?
c. What problems have they encountered this week?
Things to check –d. Results of testing (per team member):
1. 4. 2. 5. 3. 6.e. Production of at least one set of minutes:
f. Time Sheets ADEQUATE and FILLED IN, with EVIDENCE: (perteam member)
1.
4. 2. 5. 3. 6.g. Stories to be implemented in the next week: (per team member)(IF A STORY TAKES MORE THAN 2 WEEKS TO IMPLEMENT IT IS TOO
LONG)
1. 4. 2. 5. 3. 6.Please record any problems with the management tool or testserver here:
Appendix B. A completed clients assessment form
Software Hut Client Assessment FormTeam:
Category
Clients Comments Marks OutofDemo
System worked to plan andexcellent presentation. CD copydeveloped. More than twosections incomplete4
5Appendix B (continued)
Category
Clients Comments Marks OutofUser manual
Very comprehensive guide tousing the CD4
5Installation Guide
Good idea to put a briefinstallation guide within theCD. Brief but helpful installationguide, could have had more tipsas to how to deal with problems2
5Maintenance Doc
Again brief, but does notaddress any potential problems1
5Ease of use
Good to use but no visible linksto next section on screen. Somesections did not turn greenwhen completed2
5Understandability
The manual was easy to follow.The only complicated part wastrying to create a CD copy of myprofile4
5Completeness
Everything included, thoughoddly no ‘‘finish” button on ‘‘selfassessment” page4
5Innovation
The users page was good withdifferent sections turning greenon completion, though not alldid information pages verythorough3
5Robustness
Software run OK, though hadproblems with copying profileto CD, though did eventuallywork4
5Happiness
Overall a very good program,good to use, though has itsweaknesses3
5Total
———————– 31 50Any comments you would like to make on the team in order toaid their assessment (continue overleaf if necessary):
1. A progress bar would have been visually more helpful, includ-ing what the next section is, though the side panel did some ofthem.
2. The software and program could have been easier to use.3. The details in the information sections are very good, as is the
rankings and percentage score for the Holland model in interests.
Name (Print): _____S______________ Date: ______28/5_____Sign: ___________________________
References
[1] S.W. Ambler, Introduction to Test Driven Development, in: Agile DatabaseTechniques: Effective Strategies for the Agile Software Developer, John Wiley &Sons, 2003.
[2] E. Arisholm, D.I.K. Sjøberg, Evaluating the effect of a delegated versuscentralized control style on the maintainability of object-orientedsoftware, IEEE Transactions on Software Engineering 30 (8) (2004) 521–534.
[3] V.R. Basili, R.W. Selby, D.H. Hutchens, Experimentation in softwareengineering, IEEE Transactions on Software Engineering SE-12 (7) (1986)733–743.
[4] V.R. Basili, H.D. Rombach, The TAME project: towards improvement-orientedsoftware environments, IEEE Transactions on Software Engineering 14 (6)(1988) 758–773.
[5] K. Beck, Extreme Programming Explained: Embrace Change, Addison Wesley,Longman, Reading, Mass, USA, 2000.
194 L. Huang, M. Holcombe / Information and Software Technology 51 (2009) 182–194
[6] K. Beck, Test Driven Development: By Example, Addison Wesley, Reading, MA,2003.
[7] B. Boehm, Software Engineering Economics, Prenctice Hall, Englewood Cliffs,NJ, 1981.
[8] P. Cederqvist, Version Management with CVS, Network Theory Ltd., Bristol, UK,1993.
[9] D. Chaplin, Test first Programming, TechZone, 2001.[10] J. Cohen, P. Cohen, Applied Multiple Regression/Correlation Analysis for the
Behavioral Sciences, Erlbaum, Hillsdale, NJ, 1975.[11] J. Cohen, Statistical Power Analysis for the Behavioral Sciences, second ed.,
Lawrence Earlbaum and Associates, Hillsdale, NJ, 1988.[12] T.D. Cook, D.T. Campbell, Quasi-Experimentation: Design and Analysis Issues
for Field Settings, Houghton Mifflin Co., Boston, 1979.[13] L. Crispin, Driving software quality: how test-driven development impacts
software quality, IEEE Software 23 (6) (2006) 70–71.[14] W.E. Deming, Quality, Productivity, and Competitive Position, Center for
Advanced Engineering Study, MIT, 1982.[15] R.F. Delgado, Planning for quality software, SAM Advanced Management
Journal 57 (2) (1992) 24–28.[16] E. Dustin, J. Rashka, J. Paul, Automated software testing: Introduction,
management, and performance, Addison Wesley, 1999.[17] ‘‘Eclipse Platform Technical Overview”, Object Technology Int’l, 2003.[18] S.H. Edwards, Using test-driven development in the classroom: providing
students with automatic, concrete feedback on performance, in: Proceedingsof the International Conference on Education and Information Systems:Technologies and Applications (EISTA’03), August 2003.
[19] H. Erdogmus, M. Morisio, M. Torchiano, On the effectiveness of the Test-Firstapproach to programming, IEEE Transactions on Software Engineering 31 (3)(2005).
[20] N. Fenton, S. Pfleeger, Software Metrics: A Rigorous and Practical Approach,second ed., International Thomson Computer Press, London, 1997.
[21] D. Gelperin, W. Hetzel, Software quality engineering, in: Proceedings of4th International Conference on Software Testing, Washington DC, June1987.
[22] B. George, L. Williams, A structured experiment of test-driven development,Information and Software Technology 46 (2004) 337–342.
[23] W.S. Gossett, The probable error of a mean, Biometrika 6 (1) (1908) 1–25.[24] M. Holcombe, H. Parker, Keeping our clients happy: myths and management
issues in ‘client-led’ student software projects, Computer Science Education 9(3) (1999) 230–241.
[25] M. Holcombe, M. Gheorghe, F. Macias, Teaching XP for real: Some initialobservations and plans, in: Proceedings of 2nd International Conference onExtreme Programming and Flexible Processes in Software Engineering(XP2001), Italy, May 2001, pp. 14–17.
[26] M. Höst, B. Regnell, C. Wohlin, Using students as subjects – a comparativestudy of students and professionals in lead-time impact assessment, EmpiricalSoftware Engineering 5 (2000) 201–214.
[27] L. Huang, M. Holcombe, Empirical assessment of Test-First approach,Proceedings of Testing: Academic & Industrial Conference, IEEE ComputerSociety, 2006. pp. 197–200.
[28] L. Huang, C. Thomson, M. Holcombe, How good are you testers? An assessmentof testing ability, Proceedings of Testing: Academic & Industrial Conference,IEEE Computer Society, 2007. pp.82–86.
[29] D. Janzen, Software architecture improvement through test-drivendevelopment, in: Proceedings of the Conference on Object OrientedProgramming Systems Languages and Applications, ACM, 2005, pp. 222–223.
[30] JUnit.org, Available from: <www.junit.org>.[31] J. Karn, Empirical Software Engineering: Developing Behavior and Pretence,
Ph.D. thesis, the University of Sheffield, April 2006.[32] R. Kaufmann, D. Janzen, Implications of test-driven development: a pilot study,
in: Proceedings of the 18th Annual ACM SIGPLAN Conference on Object-
oriented Programming, Systems, Languages, and Applications, ACM, 2003, pp.298–299.
[33] B.A. Kitchenham, S.L. Pfleeger, L.M. Pickard, P.W. Jones, D.C. Hoaglin, K. El-Emam,J. Rosenberg, Preliminary guidelines for empirical research in softwareengineering, IEEE Transactions on Software Engineering 28 (8) (2002) 721–734.
[34] A.N. Kolmogorov, Sulla determinazione empirica di una leggi di distribuzione,Giornale dell’Istituta Italiano degli Attuari 4 (1933) 33.
[35] C. Larman, V. Basili, A history of iterative and incremental development, IEEEComputer 36 (2003) 47–56.
[36] M. Pancur, M. Ciglaric, M. Trampus, T. Vidmar, Towards empirical evaluation oftest-driven development in a university environment, in: Proceedings ofEUROCON 2003, Computer as a Tool, The IEEE Region, 8(2) (2003), pp. 83–86.
[37] A. Porter, L. Votta, Comparing detection methods for software requirementsinspection: a replication using professional subjects, Empirical SoftwareEngineering 3 (1998) 355–380.
[38] F. Macias, M. Holcombe, M. Gheorghe, Design-led & design-less: oneexperiment and two approaches, in: Proceedings of 4th InternationalConference on Extreme Programming and Flexible Processes in SoftwareEngineering (XP2003), 2003, pp. 394–401.
[39] F. Macias, Empirical Assessment of Extreme Programming, Ph.D. thesis,University of Sheffield, UK, 2004.
[40] H.B. Mann, D.R. Whitney, On a test of whether one of two random variables isstochastically larger than the other, Annals of Mathematics and Statistics(1947).
[41] E.M. Maximilien, L. Williams, Assessing test-driven development at IBM, in:Proceedings of International Conference of Software Engineering, Portland,2003.
[42] T.J. McCabe, A complexity measure, IEEE Transactions on Software Engineering2 (1976) 308–320.
[43] S. McConnell, Rapid Development, Microsoft Press, Redmond, WA, 1996.[44] M. Müller, O. Hanger, Experiment about Test-First programming, IEEE
Proceedings on Software 149 (5) (2002) 537–544. October.[45] P. Runeson, Using students as experiment subjects – an analysis on graduate
and freshmen student data, in: Proceedings of 7th International Conferenceon Empirical Assessment and Evaluation in Software Engineering (EASE 03),2003.
[46] W.R. Shadish, T.D. Cook, D.T. Campbell, Experimental and Quasi-ExperimentalDesigns for General Causal Inference, Houghton Mifflin, Boston, 2002.
[47] D.I.K. Sjøeberg, J.E. Hannay, O. Hansen, V.B. Kampenes, A. Karahasanovic, N.K.Liborg, A.C. Rekdal, A survey of controlled experiments in softwareengineering, IEEE Transactions on Software Engineering 31 (9) (2005) 733–753.
[48] N.V. Smirnov, Approximation of distribution laws of random variables on thebasis of empirical data, Uspekhi Matematicheskikhi Nauka 10 (1944) 179–206.
[49] M. Stephens, D. Rosenberg, Extreme Programming Refactored: The CaseAgainst XP, 2003.
[50] S. Syed-Abdullah, Empirical Study on Extreme Programming, Ph.D. thesis, TheUniversity of Sheffield, UK, April 2005.
[51] R. Tate, Experimental design, in: H.E. Mitzel, J.H. Hardin Best, W. Rabinowitz(Eds.), Encyclopaedia of Education Research, Collier Mac Millan, London, 1982,pp. 553–561.
[52] C. Thomson, Defining and Describing Change Events in Software DevelopmentProjects, Ph.D. Thesis, the University of Sheffield, UK, 2007.
[53] C. Thomson, M. Holcombe, 20 Years of teaching and 7 years of research:research when you teach, in: Proceedings of 3rd South East European FormalMethods Workshop, 2007, pp. 141–153.
[54] L. Williams, E. Maximilien, M. Vouk, Test driven development as a defect-reduction practice, in: Proceedings of the 14th International Symposium onSoftware Reliability Engineering, 2004, pp. 34–45.
[55] C. Wohlin, M. Ahlgren, Soft factors and their impact on time to market,Software Quality Journal 4 (1995) 189–205.