empirical modeling of ultrasound- assisted - doiserbia
TRANSCRIPT

Available on line at
Association of the Chemical Engineers of Serbia AChE www.ache.org.rs/CICEQ
Chemical Industry & Chemical Engineering Quarterly 18 (1) 115−127 (2012) CI&CEQ
115
JELENA M. AVRAMOVIĆ
OLIVERA S. STAMENKOVIĆ ZORAN B. TODOROVIĆ
MIODRAG L. LAZIĆ VLADA B. VELJKOVIĆ
University of Niš, Faculty of Technology, Leskovac, Serbia
SCIENTIFIC PAPER
UDC 662.756.3
DOI 10.2298/CICEQ110705053A
EMPIRICAL MODELING OF ULTRASOUND-ASSISTED BASE-CATALYZED SUNFLOWER OIL METHANOLYSIS KINETICS
Ultrasound-assisted sunflower oil methanolysis catalyzed by KOH was studied to define a simple empirical kinetic model useful for reactor design without complex computation. It was assumed that the neutralization of free fatty acids and the saponification reactions were negligible. The methanolysis process rate was observed to be controlled by the mass transfer limitation in the initial heterogeneous regime and by the chemical reaction in the later pseudo-ho-mogeneous regime. A model featuring irreversible second-order kinetics was established and used for simulation of the triacylglycerol conversion and the fatty acid methyl esters formation in the latter regime. Good agreement between the proposed model and the experimental data in the chemically controlled regime was found.
Keywords: biodiesel; kinetics; methanolysis; modeling; sunflower oil; ultrasound.
Fatty acid alkyl esters, known as biodiesel, are a renewable, biodegradable and non-toxic fuel, which is a good alternative to fossil fuels. The use of biodiesel leads to many environmental benefits such as less air, water and soil pollution and a minimal impact on human health [1]. The most commonly used process for biodiesel production is methanolysis, a reaction between triacylglycerols (TAG) from a variety of plant oils and animal fats and methanol, in the presence of a catalyst. Base catalysts such as potassium and sodium hydroxides and methoxides in homogeneous media are usually utilized in industrial biodiesel production.
The operational variables that affect fatty acid methyl ester (FAME) formation are: the type and amount of catalyst, molar ratio of methanol to vege-table oil, reaction temperature, agitation intensity and purity of the reactants. Methanol and TAG are immis-cible [2] and the reaction between the reactants oc-curs on the interfacial surface [3]. Intensive mixing should be applied in order to enhance the contact sur-face area between the two immiscible reactants,
Correspondening author: V.B. Veljković, University of Niš, Fa-culty of Technology, Bulevar Oslobodjenja 124, 16000 Lesko-vac, Serbia. E-mail: [email protected] Paper received: 5 July, 2011 Paper revised: 25 October, 2011 Paper accepted: 4 November, 2011
causing the increase of the methanolysis reaction rate [3,4]. Based on the known effects of ultrasonic cavi-tation such as mixing, heating and disruption of the in-terface, some researchers have sped up the reaction rate by carrying out methanolysis in the presence of ultrasound [5-12]. Ultrasound-assisted transesterifica-tion is an efficient, time-saving and economically viable process as it requires lower quantities of alcohol and catalyst [5] and lower energy than the process em-ploying mechanical agitation [8,12,13]. By maximizing the contact area between the immiscible TAG and al-cohol at a lower external energy input than mechani-cally-stirred reactors, ultrasonic reactors might im-prove the performance of the transesterification pro-cess by obtaining higher biodiesel yields within shorter reaction times [14].
During the base-catalyzed methanolysis reac-tion, an initial heterogeneous stage controlled by the mass transfer rate and a chemically-controlled pseu-do-homogeneous stage are well-recognized. The former stage is usually observed at lower reaction tempera-tures and in the case of non-adequate mixing. Under these reaction conditions, the methanolysis kinetic model should include the mass transfer limitations [15]. The kinetics of the base-catalyzed methanolysis reaction have been widely studied by several resear-chers. In these studies, either complex (rigorous) ki-netic models based on the mechanism of the metha-

J.M. AVRAMOVIĆ et al.: EMPIRICAL MODELING OF ULTRASOUND-ASSISTED… CI&CEQ 18 (1) 115−127 (2012)
116
nolysis reaction consisting of three reversible conse-cutive-competitive reactions [4,16-19] or simplified (empirical) kinetic models involving irreversible reac-tion [10,11,15,20] have been used. Each of these mo-dels has its specific advantages and shortcomings. The rigorous models have the advantage related to their prediction accuracy over wide ranges of the re-action conditions, but they are usually mathematically complicated and require complex computer calcula-tions. In modeling the chemically controlled stage, for-ward and reverse second-order reactions have most often been used [5,17-19]. Exceptionally, Freedman et al. [16] used a combination of the second-order consecutive and fourth-order shunt reactions to des-cribe the kinetics of methanolysis. Darnoko and Che-ryan [21] suggested a second-order kinetic for the ini-tial stages of the reaction, but they considered the for-ward reactions only. The empirical models assume the irreversible overall reaction, have the rate cons-tant determined by fitting to experimental data and al-low simple computation. Therefore, these models can not explain the real reaction mechanism. Their major advantage is their simplicity, although it is often not clear if they can be extrapolated outside the range of the reaction conditions they are based on. Stamenko-vić et al. [15] reported such a simple kinetic model that consisted of an irreversible second-order reaction followed by a reversible second-order reaction close to the completion of the methanolysis reaction. Being not only simple, accurate and able to describe vari-ations of FAME and TAG during methanolysis reac-tion but also requiring short computation time, empi-rical models can be successfully used for simplifying reactor design and even help quick decision making in industrial conditions.
The base-catalyzed methanolysis kinetics in the presence of ultrasound has hardly been studied. Only empirical models have been used and contradictory results were reported. For a 6:1 methanol/soybean oil molar ratio and a 25 to 60 °C temperature range in the presence of low frequency ultrasound (20 kHz), Colucci et al. [20] established a pseudo second-order kinetic model with respect to TAG for the base-catal-yzed methanolysis of soybean oil. Mahamuni and Adewuyi [22] concluded from their study that the me-thanolysis reaction for conversion of soybean oil to biodiesel in the presence of ultrasound at the opti-mum conditions (611 kHz and 139 W ultrasound, 0.5% catalyst, and 6:1 molar ratio of methanol/oil) at 35 °C is second-order (first-order with respect to both TAG and methanol). On the other hand, Georgogianni et al. [10,11] reported the first- and second-order re-action with respect to TAG for the base-catalyzed me-thanolysis of sunflower and cottonseed oils using both
low frequency ultrasonication and mechanical agita-tion, although a better fit was obtained for the first-or-der reaction kinetics. Deshmane et al. [23] verified a kinetic model based on the first-order reaction fol-lowed by the second-order with respect to fatty acids for ultrasound-assisted acid-catalyzed esterification of palm fatty acid distillate.
We have been investigated the kinetics of the ultrasound-assisted sunflower oil methanolysis catal-yzed by potassium hydroxide in a continuing study. Recently, we have reported the results of the optimi-zation of this process obtained by using a full factorial experiment design with replication [24]. The effects of methanol/oil molar ratio, catalyst loading and the re-action temperature on FAME yield were evaluated by the analysis of variance and the surface response methodology. At the 95% confidence level all three main operational variables and the two-way interac-tion of the reaction temperature and methanol/oil mo-lar ratio were effective on the FAME yield. However, the most important factor was the catalyst loading. It was found that the FAME yield generally increased with the increase of the methanol/oil molar ratio, the catalyst loading and the reaction temperature. The best reaction conditions (temperature of 40 °C, me-thanol/oil molar ratio of 7.5:1 and catalyst loading of 0.7%) ensured the highest FAME yield of about 95% in 60 min. However, the optimum reaction conditions could be different for other systems depending on the type of sonicator (ultrasonic bath or processing probe), ultrasound frequency and intensity, type of reactants (oil and alcohol), type of catalyst and the geometry and dimensions of the reactor.
In the present work, the kinetics of the ultra-sound-assisted sunflower oil methanolysis catalyzed by potassium hydroxide was studied in the same ranges of three main operational variables applied in the previous study [24], namely methanol/oil molar ratio (4.5:1, 6:1 and 7.5:1), catalyst loading (0.3, 0.5 and 0.7% based on the oil weight) and the reaction temperature (20, 30 and 40 °C). Some other resear-chers have carried out their studies on ultrasound-as-sisted methanolysis in the similar ranges of the reac-tion conditions. The FAME formation in the ultra-sound-assisted methanolysis of soybean oil was not substantially increased with increasing the metha-nol/oil molar ratio from 6:1 to 12:1 and the catalyst loading from 0.6 to 1.0% [22]. For the same reaction driven by low-frequency ultrasound, Santos et al. [25]
optimized the methanol/oil molar ratio and the catalyst loading in the ranges of 3:1 to 12:1 and 0.2 to 0.6%, respectively. By increasing the catalyst loading, the FAME yield and reaction rate also increase [25] but the excess catalyst negatively affects the FAME yield

J.M. AVRAMOVIĆ et al.: EMPIRICAL MODELING OF ULTRASOUND-ASSISTED… CI&CEQ 18 (1) 115−127 (2012)
117
[8,11,15,17]. The reaction in the presence of sodium hydroxide at the concentration higher than 1.0% [5,10,12,26] was followed by strong soap formation, decreasing the FAME yield. Since the reaction tem-perature should be relatively low to reduce the energy consumption and the use of ultrasound at boiling tem-perature is futile, the temperature range below 40 °C was chosen.
The main goal of the present study was to de-velop a simple empirical kinetic model of the base- -catalyzed methanolysis reaction in the presence of ultrasound and to simulate the TAG conversion and the FAME formation in the chemically controlled stage of the process. Also, it was intended to compare the obtained model with that for the base-catalyzed me-thanolysis in the absence of ultrasound to check whether the same phenomena control the reaction rate independently of the type of mixing applied (ul-trasound versus mechanical agitation).
Theoretical background
The mechanism of vegetable oil methanolysis reaction can be presented by Scheme 1, where C is the base catalyst [27].
The overall methanolysis reaction can be pre-sented by the following stoichiometric equation:
A + 3B Catalyst 3R + S
where A is TAG, B is methanol, R is FAME and S is
glycerol. For the purpose of modeling the ultrasound-as-
sisted sunflower oil methanolysis, the following as-sumptions are introduced:
a) The methanolysis process occurs via the ini-tial heterogeneous regime, followed by the pseudo- -homogeneous regime, where the mass transfer and the chemical reaction control the overall process kine-tics, respectively. These regimes are well recognized in the studies of the methanolysis reaction kinetics in the absence of ultrasound, which is characterized by the sigmoidal variation of FAME yield with time [15]. The same shape of the curves describing the FAME yield with the progress the ultrasound-assisted me-thanolysis of soybean oil under certain sonication con-ditions, which indicates the existence of mass transfer limitations in the initial reaction period, has been re-cently reported by Mahamuni and Adewuyi [22].
b) The methanolysis of TAG is an irreversible second-order reaction with respect to TAG in the che-mically controlled regime. Due to the excess of me-thanol and the low product concentration one can ex-pect the reverse reactions to be negligible. The irre-versible second-order reaction kinetic model with res-pect to TAG has already been employed for base-ca-talyzed methanolysis of palm [21] and sunflower [15] oils in the absence of ultrasonic irradiation, as well as for the ultrasound-assisted base-catalyzed methanol-ysis of soybean [20,22], sunflower and cottonseed
Scheme 1. The mechanism of vegetable oil methanolysis reaction.

J.M. AVRAMOVIĆ et al.: EMPIRICAL MODELING OF ULTRASOUND-ASSISTED… CI&CEQ 18 (1) 115−127 (2012)
118
[10,11] oils. c) The dispersion and the composition of each
phase of the reaction mixture are uniform. d) The content of free fatty acid in the oil is ne-
gligible, so the neutralization reaction can be ignored. From the oil and initial catalyst amounts, as well as the acid value of the oil, it was estimated that only less than 3% of the catalyst amount could participate in the neutralization of free fatty acids.
e) The saponification reaction is negligible be-cause low catalyst amounts are used to enhance me-thanolysis [5].
Mass transfer controlled regime
In the modeling of the methanolysis kinetics, only Stamenković et al. [15] have included the mass transfer limitation in the initial heterogeneous regime of the reaction carried out in a batch stirred reactor. According to assumption (a), the rate of TAG con-version (–rA) must be equal to the rate of TAG mass transfer from the oil phase towards the methanol/oil interfacial area. Since the TAG concentration on the interfacial area is equal to zero (cA,s → 0), it follows [15]:
=− = − AA c A
d
d
cr k ac
t (1)
where kc is the TAG mass transfer coefficient, a is the specific interfacial area, cA is TAG concentration in the oil phase and t is the time.
The TAG concentration is related to the conver-sion degree of TAG, xA:
A A0 A(1 )c c x= − (2)
So, Eq. (1) is transformed into the following:
Ac A
d(1 )
d
xk a x
t= − (3)
where cA and cA0 are the actual and initial TAG concentrations.
The instantaneous overall volumetric TAG mass transfer coefficient, kca, for the mass transfer con-trolled regime can be estimated from Eq. (3) as follows:
Ac
1 d
(1 ) dA
xk a
x t=
− (4)
Chemical reaction controlled regime
According to the assumption (b), the rate of the TAG conversion in the chemically controlled regime is:
2AA 2,app A
d
d
cr k c
t− = − = (5)
The apparent reaction rate constant, k2,app, is ex-pected to depend on the reaction temperature, the initial methanol concentration and the catalyst con-centration as:
2,app B0 C( , )kf c c=k (6)
where k is the reaction rate constant, cB0 is the initial methanol concentration and cC is the catalyst concen-tration.
Equation (6) can be easily transformed into:
( )2A2,app A0 A
d1
d
xk c x
t= − (7)
For boundary values: t = t1, xA = xA1 and t = t, xA = xA (the beginning and any moment of the chemi-cally controlled regime, respectively), the integration of Eq. (7) gives:
2,app A0 1A
1
1k c t C
x= +
− (8)
where the integration constant is defined as:
1 2,app A0 1A1
1
1C k c t
x
= − + −
(9)
The apparent reaction rate constant, k2,app, and the integration constant, C1, can be estimated from the slope and intercept of the linear dependence of
( )A1 1 x− versus time, respectively. With known va-lues of the apparent reaction rate and integration constant, the TAG conversion degree can be calcul-ated for any moment of the reaction during the che-mically controlled regime using Eq. (9).
EXPERIMENTAL
Materials
Refined, edible sunflower oil (Vital, Vrbas, Ser-bia) was used. The acid, saponification and iodine va-lues of the oil were 0.09 mg KOH/g, 190 mg KOH/g and 129 g I2/100 g respectively, determined by AOCS official methods [28]. The content of water was 0.07% as determined by the volumetric Karl Fisher titration. Absolute methanol of 99.5% purity was purchased from Zorka Pharma (Šabac, Srbija). Potassium hydro-xide pellets of min 95% purity were purchased from Mos-Lab (Belgrade, Srbija). Hydrochloric acid (36%) was obtained from Lach-Ner (Neratovce, Czech Re-public). Methanol, 2-propanol and n-hexane, all of HPLC grade, were obtained from Lab-Scan (Dublin, Irland). The HPLC standards for methyl esters of palmitic, stearic, oleic and linoleic acids, triolein, diolein and monoolein were purchased from Sigma Aldrich.

J.M. AVRAMOVIĆ et al.: EMPIRICAL MODELING OF ULTRASOUND-ASSISTED… CI&CEQ 18 (1) 115−127 (2012)
119
Equipment
The reaction was carried out in a 250 cm3 three-neck round-bottom glass flask equipped with a con-denser which was immersed in an ultrasonic cleaning bath (Sonic, Niš, Serbia; total power: 3×50 W; and in-ternal dimensions: 30 cm×15 cm×20 cm) operating at 40 kHz frequency. The ultrasound generator had to be switched off after 60 min and therefore the ultra-sound-assisted reaction was being followed for 60 min. The bath was filled with distilled water up to 1/3 of its volume (about 2.5 dm3). The temperature was con-trolled and maintained at the desired level (±0.1 °C) by water circulating from a thermostated bath by means of a pump.
Reaction conditions
The methanolysis of sunflower oil was carried out at methanol/oil molar ratios of 4.5:1, 6:1 and 7.5:1, KOH loadings of 0.3, 0.5 and 0.7% (based on the oil weight) and the reaction temperatures of 20, 30 and 40 °C under atmospheric pressure. The experiments were done in duplicate.
Experimental procedure
Methanol and KOH were fed into a three-neck glass vessel. The vessel was placed into the ultra-sonic bath and submitted to ultrasound at the desired temperature until all the catalyst was dissolved. The sunflower oil (45.96 g) was thermostated separately and added to the vessel. As soon as the oil was ad-ded, the reaction was timed. During the reaction, samples (1 cm3) were removed from the reaction mix-ture at certain time intervals, immediately quenched by adding a required amount of the aqueous hydro-chloric acid solution (4.5%) to neutralize KOH and centrifuged at 3500 rpm (average 700×g) for 15 min using a laboratory centrifuge (LC 320, Tehtnica, Ze-lezniki, Slovenia). The upper layer was withdrawn, dissolved in a 2-propanol/n-hexane (5:4 v/v) in an ap-propriate ratio (1:200) and filtered through a 0.45 μm Millipore filter. The resulting filtrate was used for HPLC analysis.
Composition of the reaction mixture
The composition of the reaction mixture samples was determined by an HPLC chromatograph (Agilent 1100 Series) using the somewhat modified method of Holčapek et al. [29] as described elsewhere [3]. A Zorbax Eclipse XDB-C18 column (4.6 mm×150 mm with 5 µm particle size) held at constant temperature (40 °C) was used for separation. The mobile phase was methanol (reservoir A) and 2-propanol/n-hexane (5:4 v/v; reservoir B). A linear gradient from 100% A to 40% A + 60% B in 15 min was employed. The mo-
bile phase flow rate was 1 cm3/min. The injection vo-lume was 20 µL and the components were detected at 205 nm. The calibration curves were prepared by using the standard mixture of FAME and the standard acylglycerols and used for the quantification of the FAME and the acylglycerols present in the samples analyzed.
The conversion degree of TAG was calculated from the content of TAG in the FAME/oil fraction of the reaction mixture, TAG (in %), by the following equation:
A 1 /100x TAG= − (10)
The TAG conversion degree was fitted to give a sigmoidal curve (Boltzman function), which describes appropriately the variation of TAG conversion degree from its lowest (= 0) to the highest (A2) asymptotic value:
1 22
0
1
1 expA
A Ax A
t tt
−= + −+
(11)
where t0 is the time at which TAG conversion degree is halfway between the lowest and the highest value, and t1 is the steepness of the curve. The values of A1, A2, t0 and t1 were calculated by the non-linear regres-sion method using a computer program (Sigma Plot 11.0, trial).
RESULTS AND DISCUSSION
Methanolysis reaction analysis
Typical variations of the reaction mixture com-position with the progress of the ultrasound-assisted sunflower oil methanolysis are shown in Figure 1. The decrease of the TAG concentration was followed by the increase of FAME concentration. The concentra-tions of intermediate products, monoacylglycerols (MAG) and diacylglycerols (DAG), increased at the beginning of the reaction achieving the maximum, then decreased and finally remained nearly constant. The same shapes of the curves representing varia-tions of the reaction mixture composition with the re-action time have already been observed for the base-catalyzed sunflower oil methanolysis in the absence of ultrasound [15].
The shape of the curves representing the va-riations of FAME fraction with time was sigmoidal, showing the change of the reaction rate with time. The initial rate was slow due to mass transfer limi-tation caused by a very low interfacial area available for the reaction. As the reaction proceeded, the drops of methanol were disintegrated by an ultrasound ac-

J.M. AVRAMOVIĆ et al.: EMPIRICAL MODELING OF ULTRASOUND-ASSISTED… CI&CEQ 18 (1) 115−127 (2012)
120
tion and additionally stabilized by MAG, DAG and soaps that acted as emulsifiers [30], which resulted in the increase of the interfacial area available for mass transfer. We did not observe that ultrasound was as much efficient in emulsifying the reactants at the be-ginning of the reaction as previously reported by Sta-varache et al. [7] according to whom the major part of the ultrasound-assisted base-catalyzed alcoholisys of vegetable oils takes place in the first 3 to 10 min of the reaction. The observed disagreement between that and the present study is probably due to different re-actor geometries and dimensions (a 250 cm3 round- -bottom flask in the present study and a 100 cm3 Er-lenmeyer flask in the study of Stavarache and co-workers [7], which were filled with approximately 64 and 69 cm3 of the reaction mixture, respectively at 6:1 methanol/oil molar ratio) and sonication intensity (150 and 840 W of total power, respectively) applied in the two studies. The specific power density was likely lower in the present study, causing a lower emulsifi-cation rate of the oil into methanol, a smaller inter-facial area between the immiscible reactants and a lower methanolysis reaction rate. This conclusion seemed to be supported by the results of Mahamuni and Adewuyi [22] who first reported the sigmoidal shape of curves representing the variation of FAME yield during the base-catalyzed methanolysis of soy-bean oil in the presence of high-frequency ultrasound at certain reaction conditions. They showed that po-wer and frequency of ultrasound played significant roles in the methanolysis reaction, affecting the drop breakage process and the critical size of the cavi-tation bubble, respectively. The initial induction period shortened and the formation rate increased with in-creasing the power of ultrasound, while an optimum
frequency for maximum FAME formation for a set of other reaction conditions was observed.
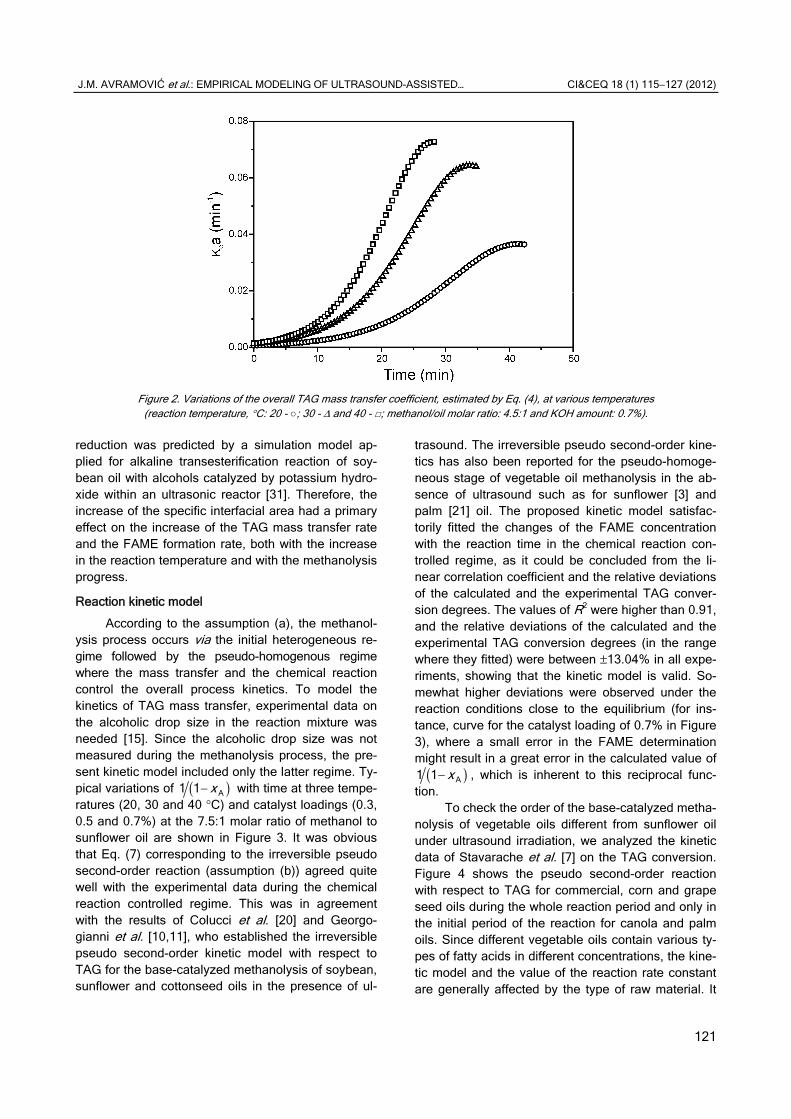
The sigmoidal shape of the curves representing the variation of the FAME yield means that the metha-nolysis reaction occurred via the initial heterogeneous regime where TAG mass transfer from the bulk of the oil phase to the interfacial area limits the overall pro-cess rate (assumption (a)). Thus, it would be useful to analyze the variation of the overall volumetric TAG mass transfer coefficient with reaction time at different temperatures. For this purpose, Figure 2 shows the variations of the overall volumetric TAG mass transfer coefficient with the reaction time at 20, 30 and 40 °C in the initial mass transfer controlled regime of the methanolysis process performed at methanol/oil molar ratio of 7.5:1 and catalyst loading of 0.7%. The overall volumetric TAG mass transfer coefficient was cal-culated using Eq. (4) and sigmoidal-fitted values of xA (Eq. (11)).
At higher reaction temperature, the overall volu-metric TAG mass transfer coefficient was higher at any moment of the reaction and increased rapidly with the methanolysis progress. This was explained by a faster MAG and DAG formation at higher tempe-ratures, which was favorable to the stabilization of the emulsion formed. The increase of the reaction tempe-rature decreased the reaction mixture viscosity, which favored the agitation action on the drop breakage pro-cess [15]. The specific interfacial area was increased due to the drop breakage causing the increase of the overall volumetric TAG mass transfer coefficient. On the other hand, the TAG mass transfer coefficient decreased with the drop size reduction due to lower internal circulation inside small drops. The decrease of TAG mass transfer coefficient with the drop size
Figure 1. Variations of the reaction mixture composition with the progress of the sunflower oil methanolysis (FAME - ○; MAG - Δ;
DAG - □ and TAG - ●; reaction conditions: 30 °C, methanol/oil molar ratio: 6:1 and KOH amount: 0.7%).
J.M. AVRAMOVIĆ et al.: EMPIRICAL MODELING OF ULTRASOUND-ASSISTED… CI&CEQ 18 (1) 115−127 (2012)
121
reduction was predicted by a simulation model ap-plied for alkaline transesterification reaction of soy-bean oil with alcohols catalyzed by potassium hydro-xide within an ultrasonic reactor [31]. Therefore, the increase of the specific interfacial area had a primary effect on the increase of the TAG mass transfer rate and the FAME formation rate, both with the increase in the reaction temperature and with the methanolysis progress.
Reaction kinetic model
According to the assumption (a), the methanol-ysis process occurs via the initial heterogeneous re-gime followed by the pseudo-homogenous regime where the mass transfer and the chemical reaction control the overall process kinetics. To model the kinetics of TAG mass transfer, experimental data on the alcoholic drop size in the reaction mixture was needed [15]. Since the alcoholic drop size was not measured during the methanolysis process, the pre-sent kinetic model included only the latter regime. Ty-pical variations of ( )A1 1 x− with time at three tempe-ratures (20, 30 and 40 °C) and catalyst loadings (0.3, 0.5 and 0.7%) at the 7.5:1 molar ratio of methanol to sunflower oil are shown in Figure 3. It was obvious that Eq. (7) corresponding to the irreversible pseudo second-order reaction (assumption (b)) agreed quite well with the experimental data during the chemical reaction controlled regime. This was in agreement with the results of Colucci et al. [20] and Georgo-gianni et al. [10,11], who established the irreversible pseudo second-order kinetic model with respect to TAG for the base-catalyzed methanolysis of soybean, sunflower and cottonseed oils in the presence of ul-
trasound. The irreversible pseudo second-order kine-tics has also been reported for the pseudo-homoge-neous stage of vegetable oil methanolysis in the ab-sence of ultrasound such as for sunflower [3] and palm [21] oil. The proposed kinetic model satisfac-torily fitted the changes of the FAME concentration with the reaction time in the chemical reaction con-trolled regime, as it could be concluded from the li-near correlation coefficient and the relative deviations of the calculated and the experimental TAG conver-sion degrees. The values of R2 were higher than 0.91, and the relative deviations of the calculated and the experimental TAG conversion degrees (in the range where they fitted) were between ±13.04% in all expe-riments, showing that the kinetic model is valid. So-mewhat higher deviations were observed under the reaction conditions close to the equilibrium (for ins-tance, curve for the catalyst loading of 0.7% in Figure 3), where a small error in the FAME determination might result in a great error in the calculated value of
( )A1 1 x− , which is inherent to this reciprocal func-tion.
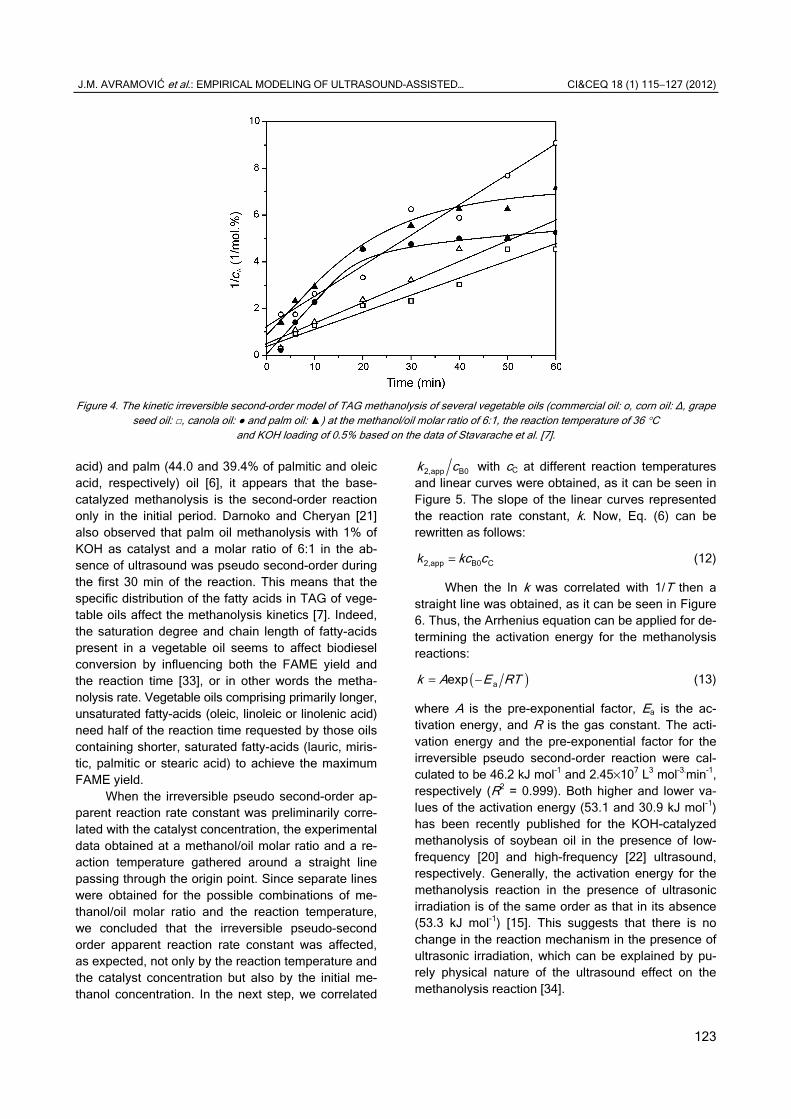
To check the order of the base-catalyzed metha-nolysis of vegetable oils different from sunflower oil under ultrasound irradiation, we analyzed the kinetic data of Stavarache et al. [7] on the TAG conversion. Figure 4 shows the pseudo second-order reaction with respect to TAG for commercial, corn and grape seed oils during the whole reaction period and only in the initial period of the reaction for canola and palm oils. Since different vegetable oils contain various ty-pes of fatty acids in different concentrations, the kine-tic model and the value of the reaction rate constant are generally affected by the type of raw material. It
Figure 2. Variations of the overall TAG mass transfer coefficient, estimated by Eq. (4), at various temperatures
(reaction temperature, °C: 20 - ○; 30 - Δ and 40 - □; methanol/oil molar ratio: 4.5:1 and KOH amount: 0.7%).

J.M. AVRAMOVIĆ et al.: EMPIRICAL MODELING OF ULTRASOUND-ASSISTED… CI&CEQ 18 (1) 115−127 (2012)
122
Figure 3. The kinetic model of TAG methanolysis at various temperatures: 20 (a), 30 (b) and 40 °C (c) (reaction conditions: methanol/oil molar ratio 7.5:1; catalyst loading, %: 0.3 - ● 0.5 - ▲ and 0.7 - ■).
appears that base-catalyzed methanolysis of vege-table oils with high percentage of linoleic acid follows the second-order reaction kinetics such as for the commercial, corn, grape seed (52.5, 66.5 and 82.2%,
respectively) [6] sunflower (68.7%) [11], cottonseed (57.4%) [10] and soybean (typically 55.5%) [22,32] oils. However, for the oils with higher contents of pal-mitic and oleic acids, such as canola (60.0% of oleic
J.M. AVRAMOVIĆ et al.: EMPIRICAL MODELING OF ULTRASOUND-ASSISTED… CI&CEQ 18 (1) 115−127 (2012)
123
acid) and palm (44.0 and 39.4% of palmitic and oleic acid, respectively) oil [6], it appears that the base-catalyzed methanolysis is the second-order reaction only in the initial period. Darnoko and Cheryan [21] also observed that palm oil methanolysis with 1% of KOH as catalyst and a molar ratio of 6:1 in the ab-sence of ultrasound was pseudo second-order during the first 30 min of the reaction. This means that the specific distribution of the fatty acids in TAG of vege-table oils affect the methanolysis kinetics [7]. Indeed, the saturation degree and chain length of fatty-acids present in a vegetable oil seems to affect biodiesel conversion by influencing both the FAME yield and the reaction time [33], or in other words the metha-nolysis rate. Vegetable oils comprising primarily longer, unsaturated fatty-acids (oleic, linoleic or linolenic acid) need half of the reaction time requested by those oils containing shorter, saturated fatty-acids (lauric, miris-tic, palmitic or stearic acid) to achieve the maximum FAME yield.
When the irreversible pseudo second-order ap-parent reaction rate constant was preliminarily corre-lated with the catalyst concentration, the experimental data obtained at a methanol/oil molar ratio and a re-action temperature gathered around a straight line passing through the origin point. Since separate lines were obtained for the possible combinations of me-thanol/oil molar ratio and the reaction temperature, we concluded that the irreversible pseudo-second order apparent reaction rate constant was affected, as expected, not only by the reaction temperature and the catalyst concentration but also by the initial me-thanol concentration. In the next step, we correlated
2,app B0k c with cC at different reaction temperatures and linear curves were obtained, as it can be seen in Figure 5. The slope of the linear curves represented the reaction rate constant, k. Now, Eq. (6) can be rewritten as follows:
2,app B0 Ckc c=k (12)
When the ln k was correlated with 1/T then a straight line was obtained, as it can be seen in Figure 6. Thus, the Arrhenius equation can be applied for de-termining the activation energy for the methanolysis reactions:
( )aexpk A E RT= − (13)
where A is the pre-exponential factor, Ea is the ac-tivation energy, and R is the gas constant. The acti-vation energy and the pre-exponential factor for the irreversible pseudo second-order reaction were cal-culated to be 46.2 kJ mol-1 and 2.45×10⁷ L3 mol-3.min-1, respectively (R2 = 0.999). Both higher and lower va-lues of the activation energy (53.1 and 30.9 kJ mol-1) has been recently published for the KOH-catalyzed methanolysis of soybean oil in the presence of low-frequency [20] and high-frequency [22] ultrasound, respectively. Generally, the activation energy for the methanolysis reaction in the presence of ultrasonic irradiation is of the same order as that in its absence (53.3 kJ mol-1) [15]. This suggests that there is no change in the reaction mechanism in the presence of ultrasonic irradiation, which can be explained by pu-rely physical nature of the ultrasound effect on the methanolysis reaction [34].
Figure 4. The kinetic irreversible second-order model of TAG methanolysis of several vegetable oils (commercial oil: o, corn oil: Δ, grape
seed oil: □, canola oil: ● and palm oil: ▲) at the methanol/oil molar ratio of 6:1, the reaction temperature of 36 °C and KOH loading of 0.5% based on the data of Stavarache et al. [7].

J.M. AVRAMOVIĆ et al.: EMPIRICAL MODELING OF ULTRASOUND-ASSISTED… CI&CEQ 18 (1) 115−127 (2012)
124
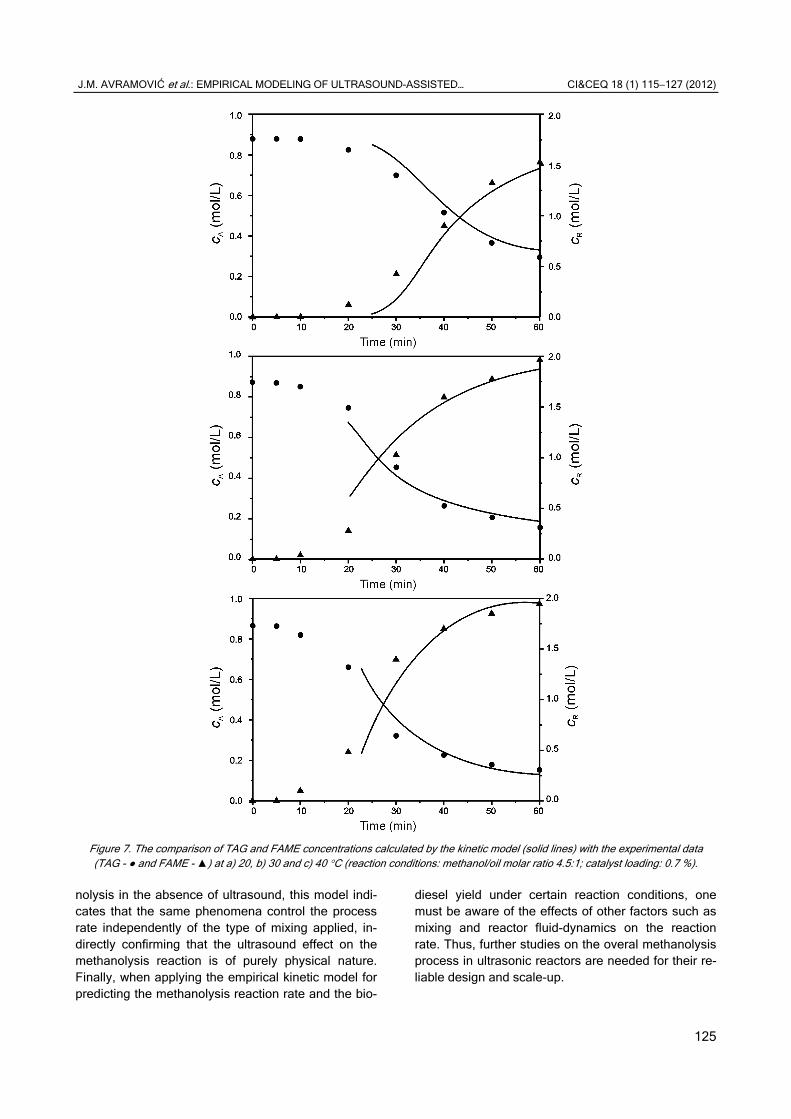
The kinetic model and the experimental data were also compared based on the variations of the molar concentrations of TAG and FAME. Figure 7 shows that the kinetic model agrees well with the experimental data in the chemical reaction controlled regime. The molar TAG concentration was calculated by Eq. (2) and the molar FAME concentration was calculated using the TAG conversion degree cor-rected for the MAG and DAG formation.
CONCLUSIONS
Ultrasound-assisted base-catalyzed sunflower oil methanolysis was studied under various reaction conditions in order to model the methanolysis reaction kinetics. A sigmoidal shape of the FAME yield va-riation with the progress of the methanolysis reaction
was observed under the applied reaction conditions, thus indicating that the overall process included the initial mass transfer controlled regime followed by the chemical reaction controlled regime. The former re-gime was not included in the modeling of the overall process kinetics because the alcohol phase drop size was not measured. In the second regime, the ultra-sound-assisted methanolysis was the irreversible pseudo second-order reaction with respect to TAG. Being simple, in good accordance with the experi-mental data and useable without complex computa-tion, this empirical kinetic model is valuable for che-mical engineering applications such as design, ope-ration and scale-up of reactor and process analysis, simulation and optimization. Additionally, being actu-ally the same as that for the base-catalyzed metha-
Figure 5. 2,app B0k c versus cC at different reaction temperatures (20 °C - o; 30 °C – Δ; and 40 °C - □).
Figure 6. Arrhenius plot of the reaction rate constant versus temperature.
J.M. AVRAMOVIĆ et al.: EMPIRICAL MODELING OF ULTRASOUND-ASSISTED… CI&CEQ 18 (1) 115−127 (2012)
125
Figure 7. The comparison of TAG and FAME concentrations calculated by the kinetic model (solid lines) with the experimental data (TAG - ● and FAME - ▲) at a) 20, b) 30 and c) 40 °C (reaction conditions: methanol/oil molar ratio 4.5:1; catalyst loading: 0.7 %).
nolysis in the absence of ultrasound, this model indi-cates that the same phenomena control the process rate independently of the type of mixing applied, in-directly confirming that the ultrasound effect on the methanolysis reaction is of purely physical nature. Finally, when applying the empirical kinetic model for predicting the methanolysis reaction rate and the bio-
diesel yield under certain reaction conditions, one must be aware of the effects of other factors such as mixing and reactor fluid-dynamics on the reaction rate. Thus, further studies on the overal methanolysis process in ultrasonic reactors are needed for their re-liable design and scale-up.

J.M. AVRAMOVIĆ et al.: EMPIRICAL MODELING OF ULTRASOUND-ASSISTED… CI&CEQ 18 (1) 115−127 (2012)
126
Acknowledgment
This work has been funded by the Ministry of Education and Science of the Republic of Serbia (Project 45001).
Nomenclature
a - Specific interfacial area, m-1 A - Pre-exponential factor, Eq. (13), L3 mol-3 min-1 A1, A2 - Parameters in Eq. (11), 1 cA - Concentration of TAG in the oil phase, mol L-1 cA0 - Initial concentration of TAG, mol L-1 cA,s - Concentration of TAG on the interfacial area, mol L-1 cB0 - Initial concentration of methanol, mol L-1 cC - Concentration of catalyst, mol L-1 C1 - Integration constant, 1 cR - Concentration of FAME, mol L-1 Ea - Activation energy of the reaction, kJ mol-1 kc - TAG mass transfer coefficient, min-1 kca - Instantaneous overall volumetric TAG mass transfer coefficient, min-1 k - Reaction rate constant, L3 mol-3 min-1 k2,app - Apparent reaction rate constant for the irreversible pseudo second-order reaction, L3 mol-3 min-1 –rA - Rate of TAG disappearance, mol-1 L-1 min-1 R - Gas constant, J mol-1 K-1 t - Time, min t0, t1 - Parameters in Eq (11), min T - Temperature, K TAG - Content of TAG in the FAME/oil fraction of the reaction mixture, % xA - TAG conversion degree, 1
Abbreviations
DAG - Diacylglycerols FAME - Fatty acid methyl esters MAG - Monoacylglycerols TAG - Triacylglycerols
REFERENCES
[1] J.Hill, E. Nelson, D. Tilman, S. Polasky, D. Tiffany, Proc. Natl. Acad. Sci. U. S. A. 103 (2006) 11206-11210
[2] H. Zhou, H. Lu, B. Liang, J. Chem. Eng. Data 51 (2006) 1130-1135
[3] O.S. Stamenković, M.L. Lazić, Z.B. Todorović, V.B. Velj-ković, D.U. Skala, Bioresour. Technol. 98 (2007) 2688- –2699
[4] H. Noureddini, D. Zhu, J. Am. Oil Chem. Soc. 74 (1997) 1457-1463
[5] C. Stavarache, M. Vinatoru, R. Nishimura, Y. Maeda, Ultrason. Sonochem. 12 (2005) 367-372
[6] J. Lifka, B. Ondruschka, Chem. Eng. Technol. 27 (2004) 1156-1159
[7] C. Stavarache, M. Vinatoru, Y. Maeda, Ultrason. Sono-chem. 13 (2006) 401-407
[8] S.C. Stavarache, M. Vinatoru, Y. Maeda, Ultrason. Sono-chem. 14 (2007) 380-38
[9] J. Ji, J. Wang, Y. Li, Y. Yu, Z. Xu, Ultrasonics 44 (2006) 411-414
[10] N.G. Siatis, A.C. Kimbaris, C.S. Pappas, P.A. Tarantilis, M.G. Polissiou, J. Amer. Oil Chem. Soc. 83 (2006) 53-57
[11] K.G. Georgogianni, M.G. Kontominas, P.J. Pomonis, D. Avlonitis, V. Gergis, Energy Fuels 22 (2008) 2110-2115
[12] K.G. Georgogianni, M.G. Kontominas, P.J. Pomonis, D. Avlonitis, V. Gergis, Fuel Process. Technol. 89 (2008) 503-509
[13] P. Chand, V.R. Chintareddy, J.G. Verkade, D. Grewell, Energy Fuels 24 (2010) 2010-2015
[14] V.B. Veljković, J. Avramović, O.S. Stamenković, Renew. Sust. Energ. Rev. (2011), submitted for publication
[15] O.S. Stamenković, Z.B. Todorović, M.L. Lazić, V.B. Velj-ković, D.U. Skala, Bioresour. Technol. 99 (2008) 1131- -1140
[16] B. Freedman, R.O. Buttefield, E.H. Pryde, J. Am. Oil Chem. Soc. 63 (1986) 1375-1380
[17] K. Komers, F. Skopal, R. Stloukal, J. Machek, Eur. J. Li-pid Sci. Technol. 104 (2002) 728-737
[18] G. Vicente, M. Martinez, J. Aracil, A. Esteban, Ind. Eng. Chem. Res. 44 (2005) 5447-5454
[19] F.F.P. Santos, S. Rodrigues, F.A.N. Fernandes, Fuel Pro-cess. Technol. 90 (2009) 312-316
[20] G. Vicente, M. Martinez, J. Aracil, Energy Fuels 20 (2006) 1722–1726
[21] J.A. Colucci, E.E. Borrero, F. Alape, J. Am. Oil Chem. Soc. 82 (2005) 525-530
[22] D. Darnoko, M. Cheryan, J. Am. Oil Chem. Soc. 77 (2000) 1263-1267
[23] N.N. Mahamuni, Y.G. Adewuyi, Energy Fuels 23 (2009) 2757-2766
[24] V.G. Deshmane, P.R. Gogate, A.B. Pandit, Ind. Eng. Chem. Res. 48 (2009) 7923-7927
[25] J.M. Avramović, O.S. Stamenković, Z.B. Todorović, M.L. Lazić, V.B. Veljković, Fuel Process. Technol. 91 (2010) 1551–1557
[26] K. G. Georgogianni, A.K. Katsoulidis, G. Pomonis, M.G. Kontominas, Fuel Process. Technol. 90 (2009) 671-676
[27] E. Lotero, Y. Liu, D.E. Lopez, K. Suwannakarn, D.A. Bruce, J.G. Jr. Goodwin, Ind. Eng. Chem. Res. 44 (2005) 5353-5363
[28] AOCS. Official and Tentative Methods. American Oil Chemists’ Society, Chicago, 1980
[29] M. Holčapek, P. Jandera, J. Fischer, B. Prokeš, J. Chro-matogr., A 858 (1999 ) 13–31
[30] M. Černoch, M. Hájek, F. Skopal, Bioresour. Technol. 101 (2010) 2071–2075
[31] F.A. Benitez, Ph.D. Thesis, University of Puerto Rico, Mayagüez, Puerto Rico, 2004, (available at http://grad-works.umi.com/31/40/3140277.html)
[32] F. Ma, M. A. Hanna, Bioresour. Technol. 70 (1999) 1-15

J.M. AVRAMOVIĆ et al.: EMPIRICAL MODELING OF ULTRASOUND-ASSISTED… CI&CEQ 18 (1) 115−127 (2012)
127
[33] S. Pinzi, J.M. Mata-Granados, F.J. Lopez-Gimenez, M.D. Luque de Castro, M.P. Dorado, Bioresour. Technol. 102 (2011) 1059–1065
[34] A. Kalva, T. Sivasankar, V.S. Moholkar, Ind. Eng. Chem. Res. 48 (2009) 534-544.
JELENA M. AVRAMOVIĆ
OLIVERA S. STAMENKOVIĆ
ZORAN B. TODOROVIĆ
MIODRAG L. LAZIĆ
VLADA B. VELJKOVIĆ
University of Niš, Faculty of Technology,Leskovac, Serbia
NAUČNI RAD
EMPIRIJSKO MODELOVANJE BAZNO-KATALI-ZOVANE METANOLIZE SUNCOKRETOVOG ULJA U ULTRAZVUČNOM REAKTORU
Bazno (KOH) katalizovana metanoliza sunokretovog ulja u ultrazvučnom reaktoru je pro-
učavana radi definisanja jednostavnog empirijskog kinetičkog modela koji će biti primen-
ljiv bez složenog izračunavanja pomoću računara. Pretostavljeno je da se reakcije neu-
tralizacije slobodnih masnih kiselina i reakcije saponifikacije mogu zanemariti. Uočeno je
da je brzina metanolize kontrolisana maseno-prenosnim ograničenjima u početnom hete-
rogenom režimu i hemijskom reakcijom u kasnijem pseudo-homogenom režimu. Potvr-
đen je model koji uključuje kinetiku nepovratne reakcije drugog reda, koji je zatim koriš-
ćen za simulaciju konverzije triacilglicerola u metilestre masnih kiselina u kasnijem reži-
mu. Konstatovano je dobro slaganje između pretpostavljenog modela i eksperimentalnih
podataka u hemijski kontrolisanom režimu.
Ključne reči: biodizel; kinetika; metanoliza; modelovanje; sunokretovo ulje; ultra-zvuk.