employee benefits in the u.s., march 2011 (news … · in order to qualify for domestic partner...
TRANSCRIPT

For release 10:00 a.m. (EDT) Tuesday, July 26, 2011 USDL-11-1112 Technical information: (202) 691-6199 • [email protected] • www.bls.gov/ebs Media contact: (202) 691-5902 • [email protected]
EMPLOYEE BENEFITS IN THE UNITED STATES – MARCH 2011
Paid leave benefits continued to be the most widely available benefit offered by employers, with paid vacations available to 91 percent of full-time workers in private industry in March 2011, the Bureau of Labor Statistics reported today. Access to these benefits, however, varied by employee and establishment characteristics. In private industry, paid vacation benefits were available to only 37 percent of part-time workers. Paid sick leave was available to 75 percent of full-time workers and 27 percent of part-time workers. (See chart 1.) Paid vacations were available to 90 percent of workers earning wages in the highest 10th percent of private industry employees and only to 38 percent of workers in the lowest 10 percent of private industry wage earners. Access to paid sick leave benefits ranged from 21 percent for the lowest wage category to 87 percent for the highest wage category. (See chart 2.) These data are from the National Compensation Survey (NCS), which provides comprehensive measures of compensation cost trends and incidence and provisions of employee benefit plans.
For unmarried domestic partner benefits, about half the workers in state and local government have access to survivor benefits, as compared to 7 percent of the workers in private industry, reflecting in part the difference in the availability of defined benefit plans between these groups. Thirty-three percent of state and local government workers and 29 percent of private sector workers have access to health care benefits for unmarried domestic partners of the same sex. Access to benefits varies by employer and employee characteristics and by whether the unmarried domestic partner is of the same or opposite sex.
In percent
Chart 2. High- and low-wage earners: Access to selected paid leave benefits, private industry, March 2011
In percent
Chart 1. Full- and part-time workers: Access to selected paid leave benefits, private industry, March 2011
Unmarried Domestic Partner Data For the first time, the National Compensation Survey produced data on employer-provided benefits available to unmarried domestic partners. Two tables show these benefits. Table 7 has information on survivor benefits in defined benefit retirement plans. Table 8 has data on health care benefits. See the Technical Note for additional information on unmarried domestic partner definitions and data.

- 2 -
Additional findings include:
Sixty-four percent of all private industry employees had access to retirement benefits, compared with 90 percent of state and local government employees. Eighty-five percent of state and local government employees actually participated in a retirement plan, compared with 49 percent of private industry workers. (See table 1.)
Medical care benefits were available to 69 percent of private industry workers,
compared with 87 percent among state and local government workers. About half of private industry workers participated in a medical plan, compared with about three-quarters of state and local government workers. (See table 2.)
Full-time workers in state and local government had a high rate of access to
employer-provided benefits. Retirement and medical benefits were offered to 99 percent and paid sick leave to 98 percent of full-time workers. By comparison, only 73 percent of full-time employees in private industry had access to retirement benefits, 85 percent to medical care, and 75 percent to paid sick leave. (See tables 1, 2, and 6.)
For single coverage, employers paid 88 percent of the medical care premiums for
full-time state and local government workers and 80 percent of the medical care premiums for full-time private industry workers. For family coverage, employers paid 71 percent of the medical care premiums for full-time workers in state and local government and 69 percent in private industry. (See tables 3 and 4.)
Paid sick leave was available to approximately two-thirds of workers. Nearly 9 out
of 10 state and local government workers had access, compared with approximately 6 of 10 private industry workers. (See table 6.)
More information can be obtained by calling (202) 691-6199, sending e-mail to [email protected], or by visiting the BLS Internet site, http://www.bls.gov/ebs/home.htm. Regional information offices, listed on the Internet site, http://www.bls.gov/bls/regncon.htm, also are available to answer any of your questions.
NOTE
More information will be published in early fall, including March 2011 data for civilian, private industry, and state and local government workers on the incidence and provisions of health care benefits, retirement benefits, life insurance, short-term and long-term disability benefits, paid holidays and vacations, and other selected benefits.
In addition, new editions of Program Perspectives will be published featuring the latest benefits data. Program Perspectives brings together employee benefits information from various National Compensation Survey publications into one convenient and easy-to-read format. For the latest benefit publications, see: http://www.bls.gov/ncs/ebs.
- 3 -
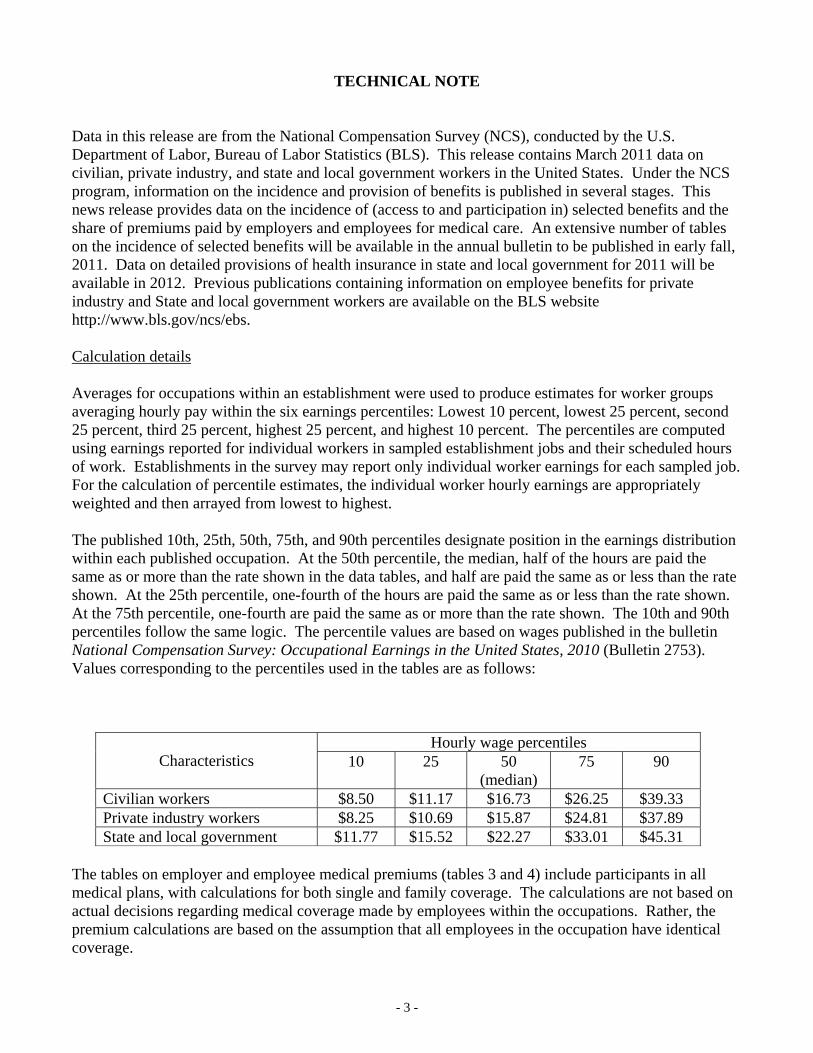
TECHNICAL NOTE Data in this release are from the National Compensation Survey (NCS), conducted by the U.S. Department of Labor, Bureau of Labor Statistics (BLS). This release contains March 2011 data on civilian, private industry, and state and local government workers in the United States. Under the NCS program, information on the incidence and provision of benefits is published in several stages. This news release provides data on the incidence of (access to and participation in) selected benefits and the share of premiums paid by employers and employees for medical care. An extensive number of tables on the incidence of selected benefits will be available in the annual bulletin to be published in early fall, 2011. Data on detailed provisions of health insurance in state and local government for 2011 will be available in 2012. Previous publications containing information on employee benefits for private industry and State and local government workers are available on the BLS website http://www.bls.gov/ncs/ebs. Calculation details Averages for occupations within an establishment were used to produce estimates for worker groups averaging hourly pay within the six earnings percentiles: Lowest 10 percent, lowest 25 percent, second 25 percent, third 25 percent, highest 25 percent, and highest 10 percent. The percentiles are computed using earnings reported for individual workers in sampled establishment jobs and their scheduled hours of work. Establishments in the survey may report only individual worker earnings for each sampled job. For the calculation of percentile estimates, the individual worker hourly earnings are appropriately weighted and then arrayed from lowest to highest. The published 10th, 25th, 50th, 75th, and 90th percentiles designate position in the earnings distribution within each published occupation. At the 50th percentile, the median, half of the hours are paid the same as or more than the rate shown in the data tables, and half are paid the same as or less than the rate shown. At the 25th percentile, one-fourth of the hours are paid the same as or less than the rate shown. At the 75th percentile, one-fourth are paid the same as or more than the rate shown. The 10th and 90th percentiles follow the same logic. The percentile values are based on wages published in the bulletin National Compensation Survey: Occupational Earnings in the United States, 2010 (Bulletin 2753). Values corresponding to the percentiles used in the tables are as follows:
Characteristics
Hourly wage percentiles 10 25 50
(median) 75 90
Civilian workers $8.50 $11.17 $16.73 $26.25 $39.33 Private industry workers $8.25 $10.69 $15.87 $24.81 $37.89 State and local government $11.77 $15.52 $22.27 $33.01 $45.31
The tables on employer and employee medical premiums (tables 3 and 4) include participants in all medical plans, with calculations for both single and family coverage. The calculations are not based on actual decisions regarding medical coverage made by employees within the occupations. Rather, the premium calculations are based on the assumption that all employees in the occupation have identical coverage.

- 4 -
Unmarried domestic partner benefits
A domestic partnership is usually understood to mean two unrelated, unmarried adults who share the same household. In order to qualify for domestic partner benefits, an employee may need to demonstrate that his or her ‘eligible partner’ meets certain criteria set by the employer. The employer determines who is a domestic partner. Employers are also not required to offer benefits, regardless of whether or not their State recognizes domestic partners.
Analysis of unmarried domestic partner data on defined benefit survivor benefits must take into account the percent of workers who have access to defined benefit plans. For example, employees in private industry have less access to defined benefit plans (20 percent in 2010) than State and local government employees (84 percent in 2010). As a result, approximately 35 percent of private industry employees with access to a defined benefit plan have a plan that provides domestic partner benefits for same sex partners, while the figure in state and local government is 60 percent.
Health care Health care is a collective term for preventative and protective coverage for the following measures: medical, dental, vision, and outpatient prescription drug plans. If workers have access to or participate in at least one of these benefits, they are considered as having access to or participating in health care. Medical care Medical care plans provide services or payments for services rendered in the hospital or by a qualified medical care provider. Take-up rates Take-up rates are the percentage of workers with access to a plan who participate in the plan. They are computed by using the number of workers participating in a plan divided by the number of workers with access to the plan, multiplied by 100, and rounded to the nearest one percent. Since the computation of take-up rates is based on the number of workers collected rather than rounded percentage estimates, the take-up rates in the tables may not equal the ratio of participation to access estimates. Leave benefits for teachers Primary, secondary, and special education teachers typically have a work schedule of 37 or 38 weeks per year. Because of this work schedule, they are generally not offered vacation or holidays. In many cases, the time off during winter and spring breaks during the school year is not considered vacation days for the purposes of this survey. Survey scope The March 2011 NCS benefits survey represented about 120 million civilian workers; of this number, about 101 million were private industry workers and 19 million, state and local government workers (see Appendix table 2).

- 5 -
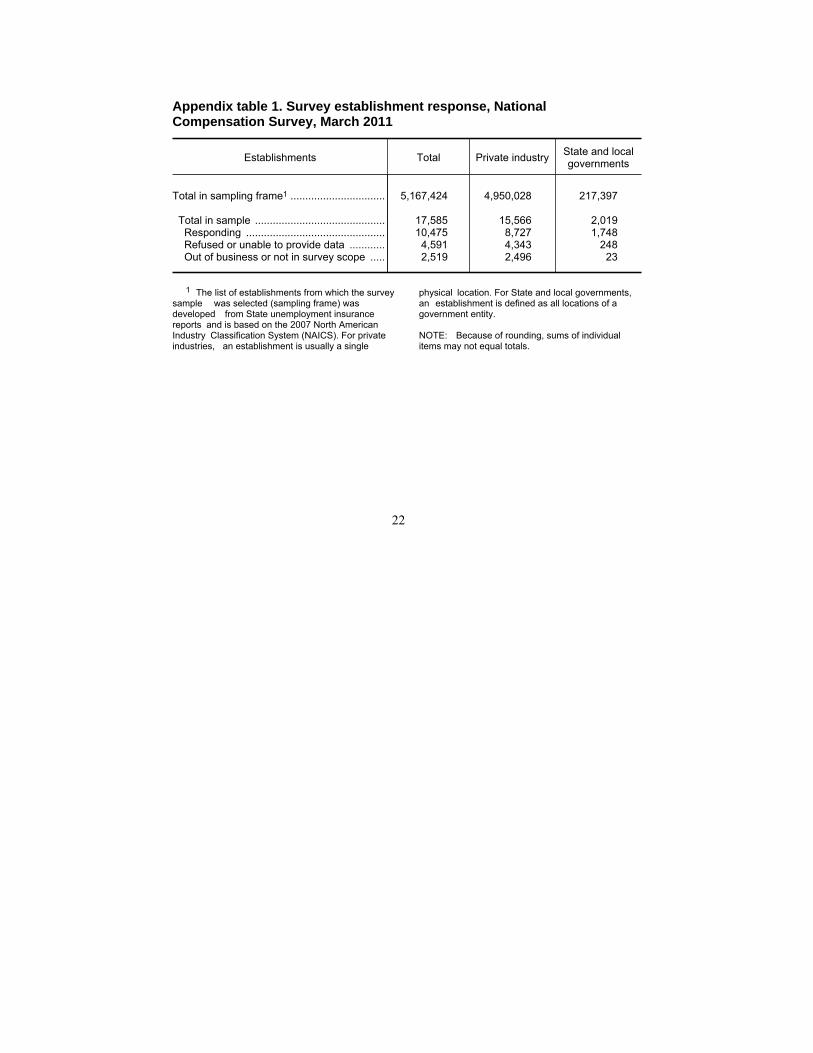
Survey response The March 2011 benefits survey included a sample of 17,585 establishments. The definitions in Appendix table 1 are as follows: Responding. The establishment provided information on at least one usable occupation. An occupation is classified as usable if the following data are present: earnings, occupational characteristics (full- vs. part-time schedule, union vs. nonunion status, and time vs. incentive pay type), and work schedule. Refused or unable to provide data. The establishment did not provide earnings, occupational characteristics, and work schedule data for any occupation. Out of business or not in survey scope. The establishment is no longer in operation. Establishments not in the survey scope include farm and private households, the self-employed, the Federal government, and locations of an establishment that are not in the sampled area. Also excluded are establishments with no workers within the survey scope. For example, an establishment where all the workers are also owners would be excluded. Obtaining information For research articles on employee benefits, see the Monthly Labor Review or Compensation and Working Conditions Online at the BLS Web sites http://www.bls.gov/opub/mlr/home.htm and http://www.bls.gov/opub/cwc/home.htm. For further technical information, see Chapter 8, "National Compensation Measures," of the BLS Handbook of Methods at: http://www.bls.gov/opub/hom/pdf/homch8.pdf and http://www.bls.gov/opub/hom/homch8_a.htm.

Table 1. Retirement benefits:1 Access, participation, and take-up rates,2 National Compensation Survey, March 2011
(All workers = 100 percent)
Characteristics
Civilian3 Private industry State and local government
Access Participation Take-uprate Access Participation Take-up
rate Access Participation Take-uprate
All workers ............................................................. 68 55 80 64 49 76 90 85 95
Worker characteristics
Management, professional, and related ................ 83 74 88 80 68 85 92 87 95Management, business, and financial ............... 86 78 91 84 75 90 – – –Professional and related .................................... 82 72 88 78 65 83 92 87 95
Teachers ........................................................ 86 81 94 – – – 91 86 95Primary, secondary, and special educationschool teachers ........................................ 95 90 96 – – – 99 95 96
Registered nurses ......................................... 83 69 83 – – – – – –Service ................................................................... 47 31 66 40 22 56 84 79 95
Protective service .............................................. 74 62 84 49 24 50 91 87 96Sales and office ..................................................... 71 55 78 69 52 76 90 86 95
Sales and related ............................................... 66 44 67 66 44 66 – – –Office and administrative support ...................... 73 61 84 71 58 81 92 87 95
Natural resources, construction, and maintenance 65 53 81 62 49 79 94 90 96Construction, extraction, farming, fishing, andforestry ............................................................. 63 50 80 59 45 76 – – –
Installation, maintenance, and repair ................. 68 57 83 66 53 82 – – –Production, transportation, and material moving ... 67 52 78 66 51 77 87 84 96
Production ......................................................... 67 53 79 67 53 79 – – –Transportation and material moving .................. 66 51 77 65 49 76 – – –
Full time ................................................................. 78 65 84 73 59 80 99 94 95Part time ................................................................ 38 22 58 37 20 54 41 37 91
Union ..................................................................... 93 88 94 90 83 93 97 92 95Nonunion ............................................................... 64 49 77 61 45 74 84 79 95
Average wage within the following categories:4Lowest 25 percent ............................................. 41 23 56 39 19 50 74 70 94
Lowest 10 percent ......................................... 29 12 40 28 10 35 60 56 94Second 25 percent ............................................ 70 54 78 66 48 73 94 89 95Third 25 percent ................................................ 78 67 86 74 61 83 95 91 96Highest 25 perecent .......................................... 88 80 91 84 75 89 98 93 95
Highest 10 percent ........................................ 90 83 92 87 79 90 97 92 94
See footnotes at end of table.
6

Table 1. Retirement benefits:1 Access, participation, and take-up rates,2 National Compensation Survey, March2011—Continued
(All workers = 100 percent)
Characteristics
Civilian3 Private industry State and local government
Access Participation Take-uprate Access Participation Take-up
rate Access Participation Take-uprate
Establishment characteristics
Goods-producing industries ................................... 73 61 83 73 60 83 – – –
Service-providing industries .................................. 67 54 80 62 47 75 90 85 95Education and health services ........................... 79 67 85 71 55 77 91 86 95
Educational services ...................................... 87 82 93 73 63 86 91 87 95Elementary and secondary schools ........... 91 86 95 – – – 92 88 96Junior colleges, colleges, and universities 88 80 91 90 79 88 86 80 93
Health care and social assistance ................. 73 56 77 71 54 76 93 86 92Hospitals .................................................... 90 78 87 – – – 95 86 90
Public administration ......................................... 90 86 95 – – – 90 86 95
1 to 99 workers ...................................................... 51 36 71 49 34 69 78 75 961 to 49 workers .................................................. 46 33 72 45 32 70 73 70 9550 to 99 workers ................................................ 64 44 69 62 41 66 87 84 97
100 workers or more .............................................. 84 72 85 81 66 82 91 87 95100 to 499 workers ............................................ 79 62 79 77 59 76 87 84 96500 workers or more .......................................... 89 81 91 86 76 88 93 88 95
Geographic areas
New England ......................................................... 63 53 83 60 48 80 84 81 97Middle Atlantic ....................................................... 70 58 83 66 53 80 92 85 92East North Central ................................................. 70 57 82 68 53 79 85 81 95West North Central ................................................ 70 58 83 66 53 80 89 81 91South Atlantic ........................................................ 69 52 76 64 46 72 91 85 93East South Central ................................................ 71 56 80 65 47 73 92 89 96West South Central ............................................... 67 52 78 63 45 72 90 87 98Mountain ................................................................ 68 53 78 65 48 74 89 86 97Pacific .................................................................... 65 53 82 60 46 77 92 90 98
1 Includes defined benefit pension plans and defined contribution retirement plans.Workers are considered as having access or as participating if they have access to orparticipating in at least one of these plan types.
2 The take-up rate is an estimate of the percentage of workers with access to a planwho participate in the plan, rounded for presentation. See Technical Note for more details.
3 Includes workers in the private nonfarm economy except those in private households,and workers in the public sector, except the federal government. See Technical Note forfurther explanation.
4 The categories are based on the average wage for each occupation surveyed, whichmay include workers with earnings both above and below the threshold. The average wagesare based on the estimates published in the "National Compensation Survey: OccupationalEarnings in the United States, 2010." See Technical Note for more details.
NOTE: Dash indicates no workers in this category or data did not meet publication criteria.For definitions of major plans, key provisions, and related terms, see the "Glossary ofEmployee Benefit Terms" at www.bls.gov/ncs/ebs/glossary20092010.htm.
7

Table 2. Medical care benefits: Access, participation, and take-up rates,1 National Compensation Survey, March 2011
(All workers = 100 percent)
Characteristics
Civilian2 Private industry State and local government
Access Participation Take-uprate Access Participation Take-up
rate Access Participation Take-uprate
All workers ............................................................. 72 54 75 69 51 73 87 72 83
Worker characteristics
Management, professional, and related ................ 88 68 78 87 66 77 89 73 82Management, business, and financial ............... 94 73 78 94 72 76 – – –Professional and related .................................... 85 67 78 83 64 77 89 73 82
Teachers ........................................................ 85 68 80 – – – 89 73 82Primary, secondary, and special educationschool teachers ........................................ 95 77 81 – – – 98 81 82
Registered nurses ......................................... 82 63 77 – – – – – –Service ................................................................... 48 33 70 42 27 65 81 68 84
Protective service .............................................. 72 58 81 47 32 68 88 76 86Sales and office ..................................................... 72 52 72 71 50 70 88 73 82
Sales and related ............................................... 63 42 67 63 42 66 – – –Office and administrative support ...................... 78 58 74 76 55 73 89 73 82
Natural resources, construction, and maintenance 77 59 77 75 56 75 95 82 86Construction, extraction, farming, fishing, andforestry ............................................................. 71 57 80 69 54 79 – – –
Installation, maintenance, and repair ................. 83 61 73 81 58 72 – – –Production, transportation, and material moving ... 76 59 78 75 58 77 82 69 84
Production ......................................................... 82 65 80 82 65 80 – – –Transportation and material moving .................. 70 53 76 69 52 75 – – –
Full time ................................................................. 88 67 77 85 64 75 99 82 83Part time ................................................................ 24 14 58 23 13 57 26 18 69
Union ..................................................................... 93 77 82 92 75 82 95 78 82Nonunion ............................................................... 69 50 73 67 48 72 81 67 83
Average wage within the following categories:3Lowest 25 percent ............................................. 39 24 62 36 21 59 69 57 82
Lowest 10 percent ......................................... 22 12 56 20 11 53 54 43 81Second 25 percent ............................................ 77 56 73 74 53 71 91 77 84Third 25 percent ................................................ 87 69 79 85 66 77 94 79 84Highest 25 perecent .......................................... 93 74 80 91 71 79 97 79 81
Highest 10 percent ........................................ 94 75 79 93 73 79 97 79 82
See footnotes at end of table.
8
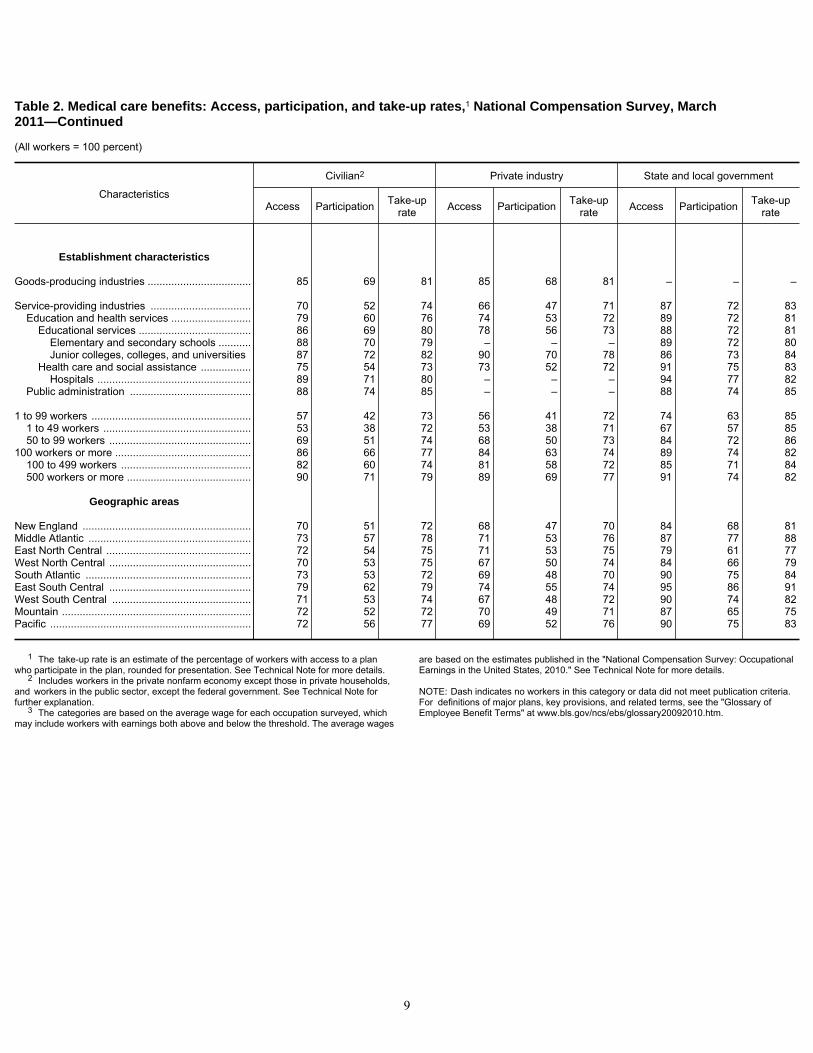
Table 2. Medical care benefits: Access, participation, and take-up rates,1 National Compensation Survey, March2011—Continued
(All workers = 100 percent)
Characteristics
Civilian2 Private industry State and local government
Access Participation Take-uprate Access Participation Take-up
rate Access Participation Take-uprate
Establishment characteristics
Goods-producing industries ................................... 85 69 81 85 68 81 – – –
Service-providing industries .................................. 70 52 74 66 47 71 87 72 83Education and health services ........................... 79 60 76 74 53 72 89 72 81
Educational services ...................................... 86 69 80 78 56 73 88 72 81Elementary and secondary schools ........... 88 70 79 – – – 89 72 80Junior colleges, colleges, and universities 87 72 82 90 70 78 86 73 84
Health care and social assistance ................. 75 54 73 73 52 72 91 75 83Hospitals .................................................... 89 71 80 – – – 94 77 82
Public administration ......................................... 88 74 85 – – – 88 74 85
1 to 99 workers ...................................................... 57 42 73 56 41 72 74 63 851 to 49 workers .................................................. 53 38 72 53 38 71 67 57 8550 to 99 workers ................................................ 69 51 74 68 50 73 84 72 86
100 workers or more .............................................. 86 66 77 84 63 74 89 74 82100 to 499 workers ............................................ 82 60 74 81 58 72 85 71 84500 workers or more .......................................... 90 71 79 89 69 77 91 74 82
Geographic areas
New England ......................................................... 70 51 72 68 47 70 84 68 81Middle Atlantic ....................................................... 73 57 78 71 53 76 87 77 88East North Central ................................................. 72 54 75 71 53 75 79 61 77West North Central ................................................ 70 53 75 67 50 74 84 66 79South Atlantic ........................................................ 73 53 72 69 48 70 90 75 84East South Central ................................................ 79 62 79 74 55 74 95 86 91West South Central ............................................... 71 53 74 67 48 72 90 74 82Mountain ................................................................ 72 52 72 70 49 71 87 65 75Pacific .................................................................... 72 56 77 69 52 76 90 75 83
1 The take-up rate is an estimate of the percentage of workers with access to a planwho participate in the plan, rounded for presentation. See Technical Note for more details.
2 Includes workers in the private nonfarm economy except those in private households,and workers in the public sector, except the federal government. See Technical Note forfurther explanation.
3 The categories are based on the average wage for each occupation surveyed, whichmay include workers with earnings both above and below the threshold. The average wages
are based on the estimates published in the "National Compensation Survey: OccupationalEarnings in the United States, 2010." See Technical Note for more details.
NOTE: Dash indicates no workers in this category or data did not meet publication criteria.For definitions of major plans, key provisions, and related terms, see the "Glossary ofEmployee Benefit Terms" at www.bls.gov/ncs/ebs/glossary20092010.htm.
9

Table 3. Medical plans: Share of premiums paid by employer and employee for singlecoverage, National Compensation Survey, March 2011
(In percent)
Characteristics
Civilian1 Private industry State and localgovernment
Employershare ofpremium
Employeeshare ofpremium
Employershare ofpremium
Employeeshare ofpremium
Employershare ofpremium
Employeeshare ofpremium
All workers participating in single coveragemedical plans ....................................................... 81 19 80 20 88 12
Worker characteristics
Management, professional, and related ................ 83 17 81 19 88 12Management, business, and financial ............... 82 18 80 20 – –Professional and related .................................... 83 17 81 19 88 12
Teachers ........................................................ 87 13 – – 89 11Primary, secondary, and special educationschool teachers ........................................ 88 12 – – 88 12
Registered nurses ......................................... 81 19 – – – –Service ................................................................... 81 19 78 22 88 12
Protective service .............................................. 85 15 75 25 88 12Sales and office ..................................................... 79 21 78 22 89 11
Sales and related ............................................... 75 25 75 25 – –Office and administrative support ...................... 81 19 79 21 88 12
Natural resources, construction, and maintenance 82 18 81 19 89 11Construction, extraction, farming, fishing, andforestry ............................................................. 83 17 82 18 – –
Installation, maintenance, and repair ................. 81 19 80 20 – –Production, transportation, and material moving ... 81 19 81 19 88 12
Production ......................................................... 81 19 81 19 – –Transportation and material moving .................. 81 19 81 19 – –
Full time ................................................................. 82 18 80 20 88 12Part time ................................................................ 78 22 77 23 84 16
Union ..................................................................... 89 11 89 11 89 11Nonunion ............................................................... 79 21 78 22 88 12
Average wage within the following categories:2Lowest 25 percent ............................................. 78 22 76 24 88 12
Lowest 10 percent ......................................... 75 25 72 28 89 11Second 25 percent ............................................ 80 20 78 22 89 11Third 25 percent ................................................ 82 18 80 20 89 11Highest 25 perecent .......................................... 83 17 82 18 88 12
Highest 10 percent ........................................ 84 16 82 18 90 10
See footnotes at end of table.
10
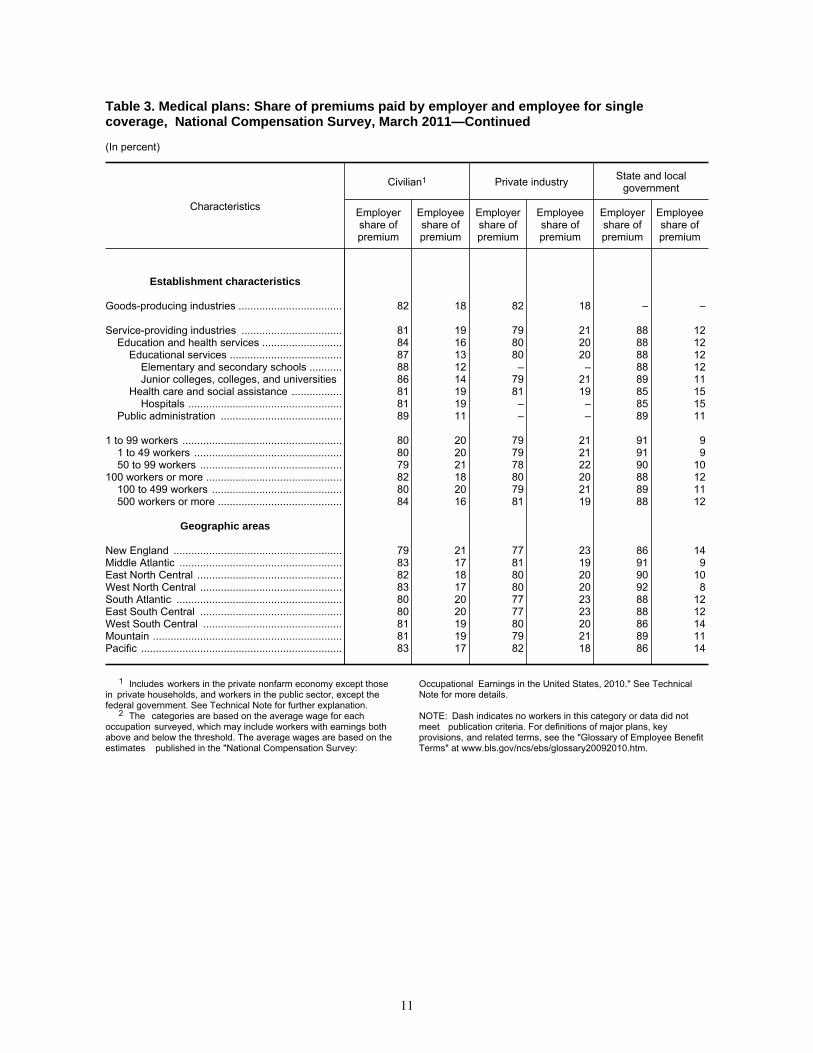
Table 3. Medical plans: Share of premiums paid by employer and employee for singlecoverage, National Compensation Survey, March 2011—Continued
(In percent)
Characteristics
Civilian1 Private industry State and localgovernment
Employershare ofpremium
Employeeshare ofpremium
Employershare ofpremium
Employeeshare ofpremium
Employershare ofpremium
Employeeshare ofpremium
Establishment characteristics
Goods-producing industries ................................... 82 18 82 18 – –
Service-providing industries .................................. 81 19 79 21 88 12Education and health services ........................... 84 16 80 20 88 12
Educational services ...................................... 87 13 80 20 88 12Elementary and secondary schools ........... 88 12 – – 88 12Junior colleges, colleges, and universities 86 14 79 21 89 11
Health care and social assistance ................. 81 19 81 19 85 15Hospitals .................................................... 81 19 – – 85 15
Public administration ......................................... 89 11 – – 89 11
1 to 99 workers ...................................................... 80 20 79 21 91 91 to 49 workers .................................................. 80 20 79 21 91 950 to 99 workers ................................................ 79 21 78 22 90 10
100 workers or more .............................................. 82 18 80 20 88 12100 to 499 workers ............................................ 80 20 79 21 89 11500 workers or more .......................................... 84 16 81 19 88 12
Geographic areas
New England ......................................................... 79 21 77 23 86 14Middle Atlantic ....................................................... 83 17 81 19 91 9East North Central ................................................. 82 18 80 20 90 10West North Central ................................................ 83 17 80 20 92 8South Atlantic ........................................................ 80 20 77 23 88 12East South Central ................................................ 80 20 77 23 88 12West South Central ............................................... 81 19 80 20 86 14Mountain ................................................................ 81 19 79 21 89 11Pacific .................................................................... 83 17 82 18 86 14
1 Includes workers in the private nonfarm economy except thosein private households, and workers in the public sector, except thefederal government. See Technical Note for further explanation.
2 The categories are based on the average wage for eachoccupation surveyed, which may include workers with earnings bothabove and below the threshold. The average wages are based on theestimates published in the "National Compensation Survey:
Occupational Earnings in the United States, 2010." See TechnicalNote for more details.
NOTE: Dash indicates no workers in this category or data did notmeet publication criteria. For definitions of major plans, keyprovisions, and related terms, see the "Glossary of Employee BenefitTerms" at www.bls.gov/ncs/ebs/glossary20092010.htm.
11
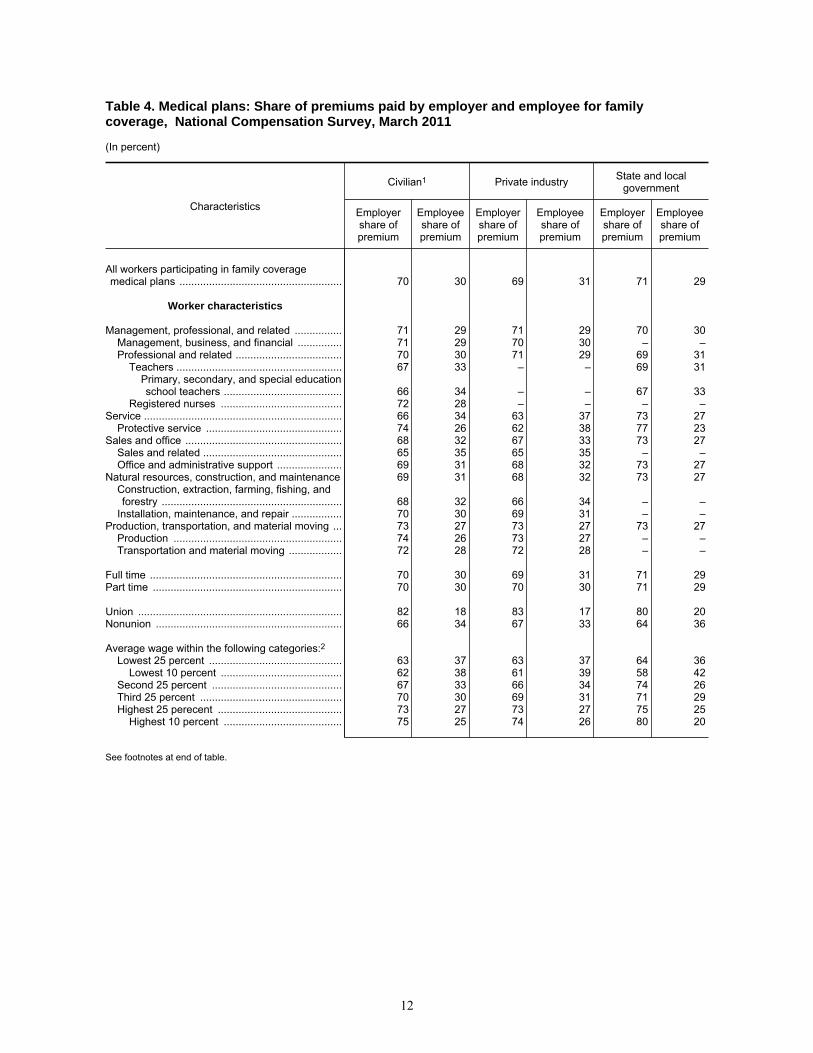
Table 4. Medical plans: Share of premiums paid by employer and employee for familycoverage, National Compensation Survey, March 2011
(In percent)
Characteristics
Civilian1 Private industry State and localgovernment
Employershare ofpremium
Employeeshare ofpremium
Employershare ofpremium
Employeeshare ofpremium
Employershare ofpremium
Employeeshare ofpremium
All workers participating in family coveragemedical plans ....................................................... 70 30 69 31 71 29
Worker characteristics
Management, professional, and related ................ 71 29 71 29 70 30Management, business, and financial ............... 71 29 70 30 – –Professional and related .................................... 70 30 71 29 69 31
Teachers ........................................................ 67 33 – – 69 31Primary, secondary, and special educationschool teachers ........................................ 66 34 – – 67 33
Registered nurses ......................................... 72 28 – – – –Service ................................................................... 66 34 63 37 73 27
Protective service .............................................. 74 26 62 38 77 23Sales and office ..................................................... 68 32 67 33 73 27
Sales and related ............................................... 65 35 65 35 – –Office and administrative support ...................... 69 31 68 32 73 27
Natural resources, construction, and maintenance 69 31 68 32 73 27Construction, extraction, farming, fishing, andforestry ............................................................. 68 32 66 34 – –
Installation, maintenance, and repair ................. 70 30 69 31 – –Production, transportation, and material moving ... 73 27 73 27 73 27
Production ......................................................... 74 26 73 27 – –Transportation and material moving .................. 72 28 72 28 – –
Full time ................................................................. 70 30 69 31 71 29Part time ................................................................ 70 30 70 30 71 29
Union ..................................................................... 82 18 83 17 80 20Nonunion ............................................................... 66 34 67 33 64 36
Average wage within the following categories:2Lowest 25 percent ............................................. 63 37 63 37 64 36
Lowest 10 percent ......................................... 62 38 61 39 58 42Second 25 percent ............................................ 67 33 66 34 74 26Third 25 percent ................................................ 70 30 69 31 71 29Highest 25 perecent .......................................... 73 27 73 27 75 25
Highest 10 percent ........................................ 75 25 74 26 80 20
See footnotes at end of table.
12
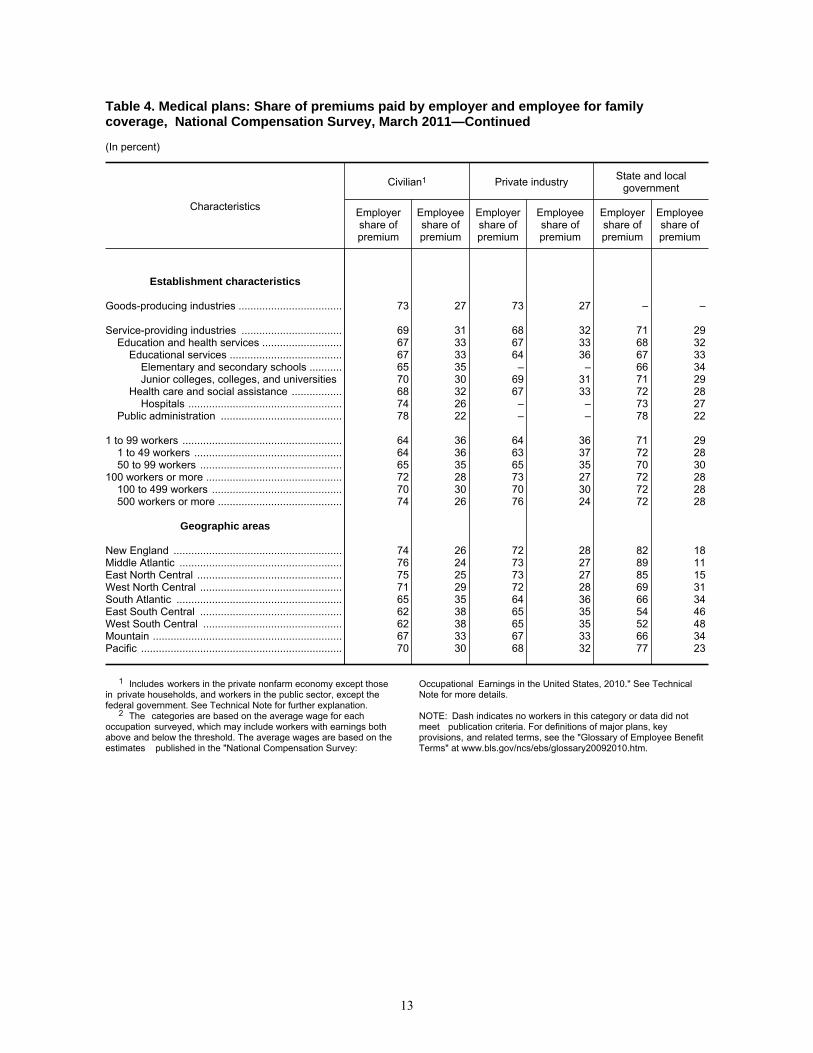
Table 4. Medical plans: Share of premiums paid by employer and employee for familycoverage, National Compensation Survey, March 2011—Continued
(In percent)
Characteristics
Civilian1 Private industry State and localgovernment
Employershare ofpremium
Employeeshare ofpremium
Employershare ofpremium
Employeeshare ofpremium
Employershare ofpremium
Employeeshare ofpremium
Establishment characteristics
Goods-producing industries ................................... 73 27 73 27 – –
Service-providing industries .................................. 69 31 68 32 71 29Education and health services ........................... 67 33 67 33 68 32
Educational services ...................................... 67 33 64 36 67 33Elementary and secondary schools ........... 65 35 – – 66 34Junior colleges, colleges, and universities 70 30 69 31 71 29
Health care and social assistance ................. 68 32 67 33 72 28Hospitals .................................................... 74 26 – – 73 27
Public administration ......................................... 78 22 – – 78 22
1 to 99 workers ...................................................... 64 36 64 36 71 291 to 49 workers .................................................. 64 36 63 37 72 2850 to 99 workers ................................................ 65 35 65 35 70 30
100 workers or more .............................................. 72 28 73 27 72 28100 to 499 workers ............................................ 70 30 70 30 72 28500 workers or more .......................................... 74 26 76 24 72 28
Geographic areas
New England ......................................................... 74 26 72 28 82 18Middle Atlantic ....................................................... 76 24 73 27 89 11East North Central ................................................. 75 25 73 27 85 15West North Central ................................................ 71 29 72 28 69 31South Atlantic ........................................................ 65 35 64 36 66 34East South Central ................................................ 62 38 65 35 54 46West South Central ............................................... 62 38 65 35 52 48Mountain ................................................................ 67 33 67 33 66 34Pacific .................................................................... 70 30 68 32 77 23
1 Includes workers in the private nonfarm economy except thosein private households, and workers in the public sector, except thefederal government. See Technical Note for further explanation.
2 The categories are based on the average wage for eachoccupation surveyed, which may include workers with earnings bothabove and below the threshold. The average wages are based on theestimates published in the "National Compensation Survey:
Occupational Earnings in the United States, 2010." See TechnicalNote for more details.
NOTE: Dash indicates no workers in this category or data did notmeet publication criteria. For definitions of major plans, keyprovisions, and related terms, see the "Glossary of Employee BenefitTerms" at www.bls.gov/ncs/ebs/glossary20092010.htm.
13

Table 5. Life insurance benefits: Access, participation, and take-up rates,1 National Compensation Survey, March 2011
(All workers = 100 percent)
Characteristics
Civilian2 Private industry State and local government
Access Participation Take-uprate Access Participation Take-up
rate Access Participation Take-uprate
All workers ............................................................. 61 59 97 58 56 97 80 78 97
Worker characteristics
Management, professional, and related ................ 78 76 98 77 76 98 81 78 97Management, business, and financial ............... 85 84 98 85 84 99 – – –Professional and related .................................... 75 74 98 73 72 98 80 77 97
Teachers ........................................................ 75 73 98 – – – 79 77 97Primary, secondary, and special educationschool teachers ........................................ 82 81 98 – – – 86 84 98
Registered nurses ......................................... 72 71 98 – – – – – –Service ................................................................... 38 36 95 31 29 94 75 73 97
Protective service .............................................. 72 69 96 54 49 90 84 83 98Sales and office ..................................................... 60 57 96 58 55 96 81 79 98
Sales and related ............................................... 48 45 92 48 44 92 – – –Office and administrative support ...................... 66 65 97 64 62 97 81 79 98
Natural resources, construction, and maintenance 61 59 96 58 55 96 90 89 99Construction, extraction, farming, fishing, andforestry ............................................................. 53 51 96 49 46 95 – – –
Installation, maintenance, and repair ................. 68 66 97 66 64 97 – – –Production, transportation, and material moving ... 65 63 97 64 62 97 76 75 99
Production ......................................................... 71 69 97 71 69 97 – – –Transportation and material moving .................. 59 57 97 58 56 96 – – –
Full time ................................................................. 76 74 97 73 71 97 90 88 98Part time ................................................................ 15 14 91 14 13 91 23 21 94
Union ..................................................................... 85 83 98 83 81 98 86 85 98Nonunion ............................................................... 57 55 96 55 53 96 74 72 97
Average wage within the following categories:3Lowest 25 percent ............................................. 28 26 92 25 22 91 62 60 97
Lowest 10 percent ......................................... 15 14 91 13 12 90 46 44 95Second 25 percent ............................................ 64 62 96 61 59 95 84 82 97Third 25 percent ................................................ 75 73 97 71 69 97 85 84 98Highest 25 perecent .......................................... 83 82 98 81 80 99 89 87 97
Highest 10 percent ........................................ 87 85 98 85 84 99 89 86 97
See footnotes at end of table.
14

Table 5. Life insurance benefits: Access, participation, and take-up rates,1 National Compensation Survey, March2011—Continued
(All workers = 100 percent)
Characteristics
Civilian2 Private industry State and local government
Access Participation Take-uprate Access Participation Take-up
rate Access Participation Take-uprate
Establishment characteristics
Goods-producing industries ................................... 72 70 97 72 70 97 – – –
Service-providing industries .................................. 59 57 97 55 53 96 80 77 97Education and health services ........................... 69 67 97 62 61 98 80 77 97
Educational services ...................................... 77 75 98 68 67 99 79 77 97Elementary and secondary schools ........... 77 75 98 – – – 78 77 98Junior colleges, colleges, and universities 83 80 96 86 85 99 82 77 94
Health care and social assistance ................. 63 61 97 61 60 97 83 80 97Hospitals .................................................... 85 84 98 – – – 89 85 97
Public administration ......................................... 82 80 98 – – – 82 80 98
1 to 99 workers ...................................................... 42 40 96 41 39 96 64 62 971 to 49 workers .................................................. 38 36 95 37 35 95 63 61 9650 to 99 workers ................................................ 55 54 97 55 53 97 66 64 98
100 workers or more .............................................. 78 76 97 76 74 97 82 80 97100 to 499 workers ............................................ 70 68 96 70 67 96 73 72 98500 workers or more .......................................... 85 84 98 86 84 99 85 83 97
Geographic areas
New England ......................................................... 60 58 97 58 56 98 72 69 95Middle Atlantic ....................................................... 60 59 99 56 55 98 84 83 99East North Central ................................................. 66 63 96 64 61 97 78 74 95West North Central ................................................ 63 61 97 60 58 97 78 77 99South Atlantic ........................................................ 61 59 97 57 55 97 83 80 97East South Central ................................................ 69 66 96 64 62 96 85 80 94West South Central ............................................... 61 58 95 58 54 94 76 75 98Mountain ................................................................ 61 58 95 57 54 95 84 82 98Pacific .................................................................... 55 53 97 51 49 97 76 75 99
1 The take-up rate is an estimate of the percentage of workers with access to a planwho participate in the plan, rounded for presentation. See Technical Note for more details.
2 Includes workers in the private nonfarm economy except those in private households,and workers in the public sector, except the federal government. See Technical Note forfurther explanation.
3 The categories are based on the average wage for each occupation surveyed, whichmay include workers with earnings both above and below the threshold. The average wages
are based on the estimates published in the "National Compensation Survey: OccupationalEarnings in the United States, 2010." See Technical Note for more details.
NOTE: Dash indicates no workers in this category or data did not meet publication criteria.For definitions of major plans, key provisions, and related terms, see the "Glossary ofEmployee Benefit Terms" at www.bls.gov/ncs/ebs/glossary20092010.htm.
15

Table 6. Selected paid leave benefits: Access, National Compensation Survey, March 2011
(All workers = 100 percent)
Characteristics
Civilian1 Private industry State and local government
Paid sickleave
Paidvacation
Paidpersonal
leave
Paid sickleave
Paidvacation
Paidpersonal
leave
Paid sickleave
Paidvacation
Paidpersonal
leave
All workers ............................................................. 67 74 42 63 77 38 89 60 59
Worker characteristics
Management, professional, and related ................ 87 74 59 86 87 56 90 43 64Management, business, and financial ............... 91 94 59 91 96 59 – – –Professional and related .................................... 85 67 59 83 83 55 90 36 65
Teachers ........................................................ 84 17 64 – – – 88 12 69Primary, secondary, and special educationschool teachers ........................................ 94 12 75 – – – 96 9 78
Registered nurses ......................................... 81 82 63 – – – – – –Service ................................................................... 50 61 28 43 58 24 84 75 51
Protective service .............................................. 69 77 42 39 62 25 89 87 53Sales and office ..................................................... 68 80 42 66 79 41 90 85 54
Sales and related ............................................... 56 69 33 55 69 33 – – –Office and administrative support ...................... 76 86 48 74 86 46 91 86 55
Natural resources, construction, and maintenance 56 81 28 51 80 26 94 94 45Construction, extraction, farming, fishing, andforestry ............................................................. 44 72 22 38 69 19 – – –
Installation, maintenance, and repair ................. 67 91 35 64 90 33 – – –Production, transportation, and material moving ... 55 82 33 54 83 32 87 63 59
Production ......................................................... 55 90 31 54 90 31 – – –Transportation and material moving .................. 56 74 35 54 75 33 – – –
Full time ................................................................. 79 87 48 75 91 45 98 67 64Part time ................................................................ 28 35 20 27 37 19 41 21 29
Union ..................................................................... 84 74 59 71 90 49 97 57 70Nonunion ............................................................... 64 74 38 62 76 37 83 62 49
Average wage within the following categories:2Lowest 25 percent ............................................. 36 53 21 32 51 18 75 56 44
Lowest 10 percent ......................................... 23 40 13 21 38 11 62 41 37Second 25 percent ............................................ 69 83 43 66 84 41 93 84 57Third 25 percent ................................................ 79 89 47 74 90 43 94 70 63Highest 25 perecent .......................................... 88 78 60 85 89 56 96 36 71
Highest 10 percent ........................................ 90 75 61 87 90 58 98 34 64
See footnotes at end of table.
16

Table 6. Selected paid leave benefits: Access, National Compensation Survey, March 2011—Continued
(All workers = 100 percent)
Characteristics
Civilian1 Private industry State and local government
Paid sickleave
Paidvacation
Paidpersonal
leave
Paid sickleave
Paidvacation
Paidpersonal
leave
Paid sickleave
Paidvacation
Paidpersonal
leave
Establishment characteristics
Goods-producing industries ................................... 56 88 31 56 88 31 – – –
Service-providing industries .................................. 69 72 43 64 75 40 89 59 59Education and health services ........................... 83 66 58 78 80 54 90 43 64
Educational services ...................................... 87 40 61 76 57 46 90 36 65Elementary and secondary schools ........... 90 27 70 – – – 91 27 72Junior colleges, colleges, and universities 86 68 47 82 72 54 88 66 43
Health care and social assistance ................. 79 84 55 78 84 55 91 90 55Hospitals .................................................... 89 90 70 – – – 93 93 49
Public administration ......................................... 89 88 53 – – – 89 88 53
1 to 99 workers ...................................................... 55 70 28 54 70 27 78 66 441 to 49 workers .................................................. 53 68 25 52 68 25 72 68 3750 to 99 workers ................................................ 60 75 35 58 76 33 87 64 56
100 workers or more .............................................. 78 79 54 73 86 51 91 59 61100 to 499 workers ............................................ 69 79 47 67 82 45 87 59 60500 workers or more .......................................... 86 78 61 82 90 60 92 59 61
Geographic areas
New England ......................................................... 72 71 49 70 75 44 84 48 81Middle Atlantic ....................................................... 71 74 52 67 76 49 90 58 70East North Central ................................................. 62 74 44 58 78 41 85 52 63West North Central ................................................ 66 72 34 61 76 30 89 56 50South Atlantic ........................................................ 65 77 40 60 79 36 93 68 56East South Central ................................................ 65 76 38 58 78 38 92 67 38West South Central ............................................... 68 75 39 64 80 35 86 52 59Mountain ................................................................ 66 74 38 63 77 35 84 55 52Pacific .................................................................... 69 74 37 65 75 33 93 68 58
1 Includes workers in the private nonfarm economy except those in privatehouseholds, and workers in the public sector, except the federal government. SeeTechnical Note for further explanation.
2 The categories are based on the average wage for each occupation surveyed,which may include workers with earnings both above and below the threshold. Theaverage wages are based on the estimates published in the "National Compensation
Survey: Occupational Earnings in the United States, 2010." See Technical Note for moredetails.
NOTE: Dash indicates no workers in this category or data did not meet publicationcriteria. For definitions of major plans, key provisions, and related terms, see the"Glossary of Employee Benefit Terms" at www.bls.gov/ncs/ebs/glossary20092010.htm.
17
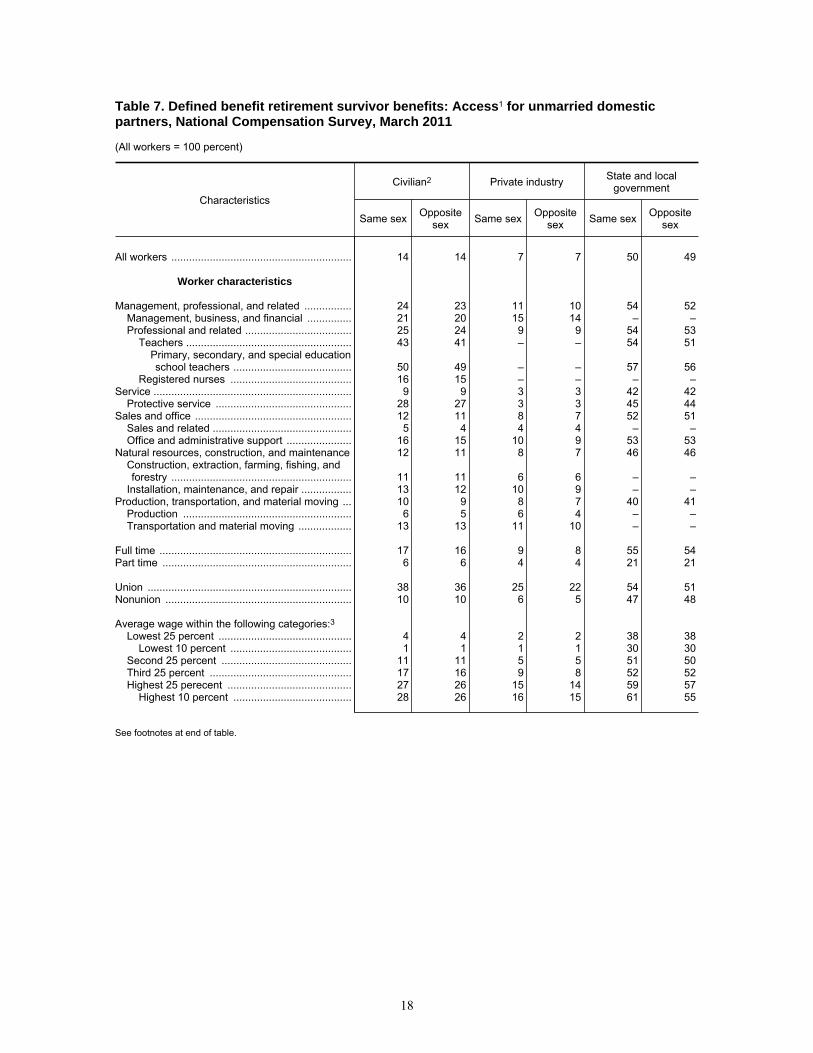
Table 7. Defined benefit retirement survivor benefits: Access1 for unmarried domesticpartners, National Compensation Survey, March 2011
(All workers = 100 percent)
Characteristics
Civilian2 Private industry State and localgovernment
Same sex Oppositesex Same sex Opposite
sex Same sex Oppositesex
All workers ............................................................. 14 14 7 7 50 49
Worker characteristics
Management, professional, and related ................ 24 23 11 10 54 52Management, business, and financial ............... 21 20 15 14 – –Professional and related .................................... 25 24 9 9 54 53
Teachers ........................................................ 43 41 – – 54 51Primary, secondary, and special educationschool teachers ........................................ 50 49 – – 57 56
Registered nurses ......................................... 16 15 – – – –Service ................................................................... 9 9 3 3 42 42
Protective service .............................................. 28 27 3 3 45 44Sales and office ..................................................... 12 11 8 7 52 51
Sales and related ............................................... 5 4 4 4 – –Office and administrative support ...................... 16 15 10 9 53 53
Natural resources, construction, and maintenance 12 11 8 7 46 46Construction, extraction, farming, fishing, andforestry ............................................................. 11 11 6 6 – –
Installation, maintenance, and repair ................. 13 12 10 9 – –Production, transportation, and material moving ... 10 9 8 7 40 41
Production ......................................................... 6 5 6 4 – –Transportation and material moving .................. 13 13 11 10 – –
Full time ................................................................. 17 16 9 8 55 54Part time ................................................................ 6 6 4 4 21 21
Union ..................................................................... 38 36 25 22 54 51Nonunion ............................................................... 10 10 6 5 47 48
Average wage within the following categories:3Lowest 25 percent ............................................. 4 4 2 2 38 38
Lowest 10 percent ......................................... 1 1 1 1 30 30Second 25 percent ............................................ 11 11 5 5 51 50Third 25 percent ................................................ 17 16 9 8 52 52Highest 25 perecent .......................................... 27 26 15 14 59 57
Highest 10 percent ........................................ 28 26 16 15 61 55
See footnotes at end of table.
18

Table 7. Defined benefit retirement survivor benefits: Access1 for unmarried domesticpartners, National Compensation Survey, March 2011—Continued
(All workers = 100 percent)
Characteristics
Civilian2 Private industry State and localgovernment
Same sex Oppositesex Same sex Opposite
sex Same sex Oppositesex
Establishment characteristics
Goods-producing industries ................................... 7 6 6 6 – –
Service-providing industries .................................. 16 15 8 7 50 49Education and health services ........................... 24 24 7 7 53 51
Educational services ...................................... 44 42 4 3 54 52Elementary and secondary schools ........... 49 48 – – 53 52Junior colleges, colleges, and universities 37 35 6 5 55 53
Health care and social assistance ................. 11 10 8 8 43 44Hospitals .................................................... 20 20 – – 39 42
Public administration ......................................... 49 48 – – 49 48
1 to 99 workers ...................................................... 5 4 3 3 34 341 to 49 workers .................................................. 4 4 3 3 31 3150 to 99 workers ................................................ 7 7 5 4 40 39
100 workers or more .............................................. 23 22 12 12 52 51100 to 499 workers ............................................ 12 12 7 7 42 42500 workers or more .......................................... 33 32 19 18 56 54
Geographic areas
New England ......................................................... 11 10 8 7 32 27Middle Atlantic ....................................................... 17 15 9 8 61 54East North Central ................................................. 7 6 7 5 – –West North Central ................................................ – 8 5 4 – –South Atlantic ........................................................ 13 13 6 6 46 46East South Central ................................................ 19 19 5 5 67 68West South Central ............................................... 14 14 5 5 57 58Mountain ................................................................ 14 14 6 6 61 60Pacific .................................................................... 24 23 12 12 84 82
1 The percentage of workers with access to the benefit reflectsboth the availability of the benefit and the employer’s policy onproviding the benefit to unmarried domestic partners. For example,this table shows that 14 percent of all civilian workers have accessto a defined benefit retirement plan that provided survivor benefitsfor unmarried domestic partners. Data from March 2010 show that31 percent of civilian workers had access to a defined benefitretirement plan.
2 Includes workers in the private nonfarm economy exceptthose in private households, and workers in the public sector,except the federal government. See Technical Note for furtherexplanation.
3 The categories are based on the average wage for eachoccupation surveyed, which may include workers with earnings bothabove and below the threshold. The average wages are based onthe estimates published in the "National Compensation Survey:Occupational Earnings in the United States, 2010." See TechnicalNote for more details.
NOTE: Dash indicates no workers in this category or data did notmeet publication criteria. For definitions of major plans, keyprovisions, and related terms, see the "Glossary of EmployeeBenefit Terms" at www.bls.gov/ncs/ebs/glossary20092010.htm.
19

Table 8. Health care benefits: Access1 for unmarried domestic partners, NationalCompensation Survey, March 2011
(All workers = 100 percent)
Characteristics
Civilian2 Private industry State and localgovernment
Same sex Oppositesex Same sex Opposite
sex Same sex Oppositesex
All workers ............................................................. 30 25 29 25 33 28
Worker characteristics
Management, professional, and related ................ 42 36 46 38 34 29Management, business, and financial ............... 50 43 52 45 – –Professional and related .................................... 40 33 43 35 34 29
Teachers ........................................................ 31 26 – – 31 26Primary, secondary, and special educationschool teachers ........................................ 28 24 – – 30 25
Registered nurses ......................................... 31 24 – – – –Service ................................................................... 19 15 17 14 30 24
Protective service .............................................. 29 20 20 10 35 26Sales and office ..................................................... 30 26 30 26 36 31
Sales and related ............................................... 24 20 24 20 – –Office and administrative support ...................... 34 30 34 29 37 32
Natural resources, construction, and maintenance 23 18 22 18 29 22Construction, extraction, farming, fishing, andforestry ............................................................. 17 17 16 16 – –
Installation, maintenance, and repair ................. 29 20 29 20 – –Production, transportation, and material moving ... 25 21 25 21 29 26
Production ......................................................... 24 20 24 20 – –Transportation and material moving .................. 26 22 26 22 – –
Full time ................................................................. 37 31 36 31 37 31Part time ................................................................ 10 8 9 8 13 12
Union ..................................................................... 49 38 46 31 53 45Nonunion ............................................................... 27 23 28 24 17 14
Average wage within the following categories:3Lowest 25 percent ............................................. 11 9 11 9 15 13
Lowest 10 percent ......................................... 7 5 6 4 8 7Second 25 percent ............................................ 26 23 26 23 35 29Third 25 percent ................................................ 37 31 35 30 37 31Highest 25 perecent .......................................... 49 40 50 41 47 39
Highest 10 percent ........................................ 57 48 59 49 57 49
See footnotes at end of table.
20

Table 8. Health care benefits: Access1 for unmarried domestic partners, NationalCompensation Survey, March 2011—Continued
(All workers = 100 percent)
Characteristics
Civilian2 Private industry State and localgovernment
Same sex Oppositesex Same sex Opposite
sex Same sex Oppositesex
Establishment characteristics
Goods-producing industries ................................... 27 23 27 24 – –
Service-providing industries .................................. 31 25 30 25 33 28Education and health services ........................... 30 26 29 25 32 27
Educational services ...................................... 33 27 38 29 32 26Elementary and secondary schools ........... 28 24 – – 28 24Junior colleges, colleges, and universities 49 37 58 43 43 33
Health care and social assistance ................. 28 25 28 24 35 31Hospitals .................................................... 34 26 – – 36 32
Public administration ......................................... 37 31 – – 37 31
1 to 99 workers ...................................................... 18 16 18 16 16 151 to 49 workers .................................................. 17 15 17 15 12 1150 to 99 workers ................................................ 23 20 23 20 22 21
100 workers or more .............................................. 41 33 42 34 36 30100 to 499 workers ............................................ 32 28 34 30 22 19500 workers or more .......................................... 49 38 54 41 40 34
Geographic areas
New England ......................................................... 37 33 38 33 34 28Middle Atlantic ....................................................... 34 28 31 24 54 49East North Central ................................................. 22 14 22 15 23 –West North Central ................................................ 19 16 20 16 – –South Atlantic ........................................................ 21 16 22 18 12 7East South Central ................................................ 17 12 21 14 2 3West South Central ............................................... 19 18 20 19 10 11Mountain ................................................................ 41 34 39 33 51 36Pacific .................................................................... 57 53 52 48 84 82
1 The percentage of workers with access to the benefit reflectsboth the availability of the benefit and the employer’s policy onproviding the benefit to unmarried domestic partners. For example,this table shows that 30 percent of all civilian workers have accessto a health care plan that provide coverage for unmarried same sexdomestic partners. Data from March 2010 show that 74 percent ofcivilian workers had access to a health care plan.
2 Includes workers in the private nonfarm economy exceptthose in private households, and workers in the public sector,except the federal government. See Technical Note for furtherexplanation.
3 The categories are based on the average wage for eachoccupation surveyed, which may include workers with earnings bothabove and below the threshold. The average wages are based onthe estimates published in the "National Compensation Survey:Occupational Earnings in the United States, 2010." See TechnicalNote for more details.
NOTE: Dash indicates no workers in this category or data did notmeet publication criteria. For definitions of major plans, keyprovisions, and related terms, see the "Glossary of EmployeeBenefit Terms" at www.bls.gov/ncs/ebs/glossary20092010.htm.
21
Appendix table 1. Survey establishment response, NationalCompensation Survey, March 2011
Establishments Total Private industry State and localgovernments
Total in sampling frame1 ................................ 5,167,424 4,950,028 217,397
Total in sample ............................................ 17,585 15,566 2,019 Responding ............................................... 10,475 8,727 1,748 Refused or unable to provide data ............ 4,591 4,343 248 Out of business or not in survey scope ..... 2,519 2,496 23
1 The list of establishments from which the surveysample was selected (sampling frame) wasdeveloped from State unemployment insurancereports and is based on the 2007 North AmericanIndustry Classification System (NAICS). For privateindustries, an establishment is usually a single
physical location. For State and local governments,an establishment is defined as all locations of agovernment entity.
NOTE: Because of rounding, sums of individualitems may not equal totals.
22

Appendix table 2. Number of workers1 represented, NationalCompensation Survey, March 2011
Occupational group2 Civilian workers Private industryworkers
State and localgovernment
workers
All workers ..................................................... 119,726,200 100,764,900 18,961,200Management, professional, and related .... 35,035,700 24,576,700 10,459,000
Management, business, and financial ... 9,362,500 7,785,200 –Professional and related ........................ 25,673,100 16,791,500 8,881,600
Teachers ........................................... 6,190,800 – 4,921,200Primary, secondary, and specialeducation school teachers ........... 4,128,500 – 3,602,900
Registered nurses ............................. 2,683,500 – –Service ...................................................... 26,216,500 22,190,000 4,026,500
Protective service .................................. 3,024,800 1,214,300 1,810,400Sales and office ......................................... 31,364,800 28,600,200 2,764,600
Sales and related .................................. 11,452,500 11,303,100 –Office and administrative support .......... 19,912,300 17,297,100 2,615,200
Natural resources, construction, andmaintenance ............................................ 9,401,500 8,443,700 957,800
Construction, extraction, farming,fishing, and forestry ............................. 4,746,700 4,217,700 –
Installation, maintenance, and repair .... 4,654,800 4,226,000 –Production, transportation, and materialmoving ..................................................... 17,707,600 16,954,300 753,300
Production ............................................. 8,534,300 8,416,300 –Transportation and material moving ...... 9,173,300 8,538,000 –
1 The number of workers represented by thesurvey are rounded to the nearest 100. Estimates ofthe number of workers provide a description of thesize and composition of the labor force included inthe survey. Estimates are not intended, however, forcomparison to other statistical series to measureemployment trends or levels.
2 The 2000 Standard Occupational Classificationsystem is used to classify workers.
NOTE: Because of rounding, sums of individualitems may not equal totals. Dashes indicate that noestimates for this characteristic are provided in thispublication.
23