employers skill survey 2002 - dera.ioe.ac.ukdera.ioe.ac.uk/4589/1/rr372.pdf · acknowledgements the...
TRANSCRIPT
Employers Skill Survey 2002Jim Hillage, Jo ReganInstitute for Employment Studies
Jenny Dickson, Kirsten McLoughlinMORI
Research Report RR372
RESEARCH
Research Report
No 372
Employers Skill Survey 2002
Jim Hillage, Jo Regan
Institute for Employment Studies
Jenny Dickson, Kirsten McLoughlin
MORI
The views expressed in this report are the authors' and do not necessarily reflect those of the Department for Education and Skills.
© Queen’s Printer 2002. Published with the permission of DfES on behalf of the Controller of Her Majesty's Stationery Office. Applications for reproduction should be made in writing to The Crown Copyright Unit, Her Majesty's Stationery Office, St Clements House, 2-16 Colegate, Norwich NR3 1BQ.
ISBN 1 84185 793 9
September 2002

Acknowledgements
The Employers Skill Survey 2002 and this report is the product of a lot of hard work by a range of people in the Institute and at MORI. The authors are extremely grateful for all their efforts and for the guidance and support offered by Carol Stanfield and others at the Department for Education and Skills and other policy agencies. However, any errors or omissions in this report are the responsibility of the authors and any views expressed in the report are their own and do not necessarily reflect those of the Department.
Contents
Contents
Executive Summary
Recruitment difficulties in 2002 Skill gaps in 2002 Gaps and shortages Future skills Comparisons with previous surveys Implications for future skills research
1. Introduction 1
1.1 Background 1 1.2 The 2002 survey 1 1.3 Structure of this report 4
2. Recruitment Problems 6
2.1 Incidence and number of vacancies and recruitment difficulties 6 2.2 The overall number of vacancies 9 2.3 Variations by size of establishment 9 2.4 Vacancies by occupation 12 2.5 Vacancies by sector 15 2.6 Vacancies by region 27 2.7 Factors affecting skill-shortage vacancies 30 2.8 Duration of hard-to-fill vacancies 31 2.9 Skills sought 33 2.10 Causes of recruitment problems 39 2.11 Employers’ responses 44 2.12 Impact 48 2.13 Key points 52
3. Skill Gaps 54
3.1 Skill proficiency 54 3.2 The overall extent of skill gaps 56 3.3 Distribution of internal skills gaps 61 3.4 What skills are missing? 73 3.5 Reasons for skill gaps 76 3.6 Impact of skill gaps 84 3.7 Future skill needs 88 3.8 Key points 91
4. The Changing Pattern of Skill Deficiencies 94
4.1 Incidence of recruitment difficulties 95 4.2 Skill gaps 104 4.3 Impact of skill deficiencies 111 4.4 Key points 114
5. Conclusions and Future Skills Research 115
5.1 Future skill research 116
Appendix 1: References 120
Appendix 2: Telephone Survey Method 121
Appendix 3: Method for Follow-up Interviews 128
Appendix 4. Telephone Survey Questionnaire 130
Executive Summary
The 2002 Employers Skill Survey is the third in a series designed to investigate the extent, causes and implications of skill deficiencies in England. It is based on a structured sample of 4000 telephone interviews with employers with five or more employees in the nine English regions, conducted between January and March 2002. The responses have been weighted to make them representative of all employers in the country. While every effort was taken to ensure consistency with the previous two surveys (conducted in 1999 and 2001) the sample for the 2002 survey is considerably smaller than before and other differences in the survey procedure mean that care needs to be taken in drawing comparisons with past results.
In departure from previous exercises, this year a series of follow-up interviews were conducted with respondents to explore their understanding of some of the terms and definitions used in the survey in more depth.
The key messages to emerge from this latest survey of employers’ skill deficiencies are:
Eight per cent of employers in England have skill-shortage vacancies and 23 per cent reported internal skill gaps — in each case higher than those reported in the 2001 survey and at or above the level reported in the first Employers Skill Survey in 1999.
The extent of skill deficiencies reported by employers has therefore not fallen over the past three years.
It is not immediately clear from this study why skills shortages and gaps are still prevalent although it is not totally surprising given the unprecedented tight state of the labour market and the length of time it takes for any remedies to take effect.
Recruitment difficulties in 2002 The survey asked employers whether they had any vacancies and if so whether any were hard to fill and why. Vacancies that are hard to fill for skill-related reasons (ie lack of applicants with appropriate skills, qualifications or experience) are categorised as ‘skill-shortage vacancies’.
The 2002 survey found that 30 per cent of establishments had a vacancy. Some 16 per cent reported that at least some of those vacancies were hard to fill and eight per cent attributed their recruitment difficulty to a lack of skills, experience or qualifications (referred to as skill-shortage vacancies). Grossing up the survey results produces estimates of some 550,000 vacancies, of which around 45 per cent
(245,000) were said by employers to be hard to fill and of those 46 per cent (ie just over 110,000) were classified as skill-shortage vacancies.
In the follow-up interviews it was clear that respondents had a clear idea of what constituted a vacancy and also understood the notion of a hard-to-fill vacancy. We can therefore be fairly confident of this measure as an indicator of recruitment difficulty.
Characteristics of workplaces with skill shortages
The survey found that larger workplaces were far more likely to report hard-to-fill and skill-shortage vacancies than smaller establishments, reflecting the larger number of jobs that may need filling at any one time. Further analysis of the data, taking into account the number of people employed in a workplace, suggests that skill-shortage vacancies formed a higher proportion of all vacancies in smaller workplaces than larger ones.
Skill-shortage vacancies were most likely to occur among professional staff (most commonly in education), associate professionals (in health and social care) and skilled trades (in construction). In terms of sector, recruitment difficulties were most concentrated in the construction sector, with 15 per cent of workplaces reporting skill-shortage vacancies, compared with eight per cent overall and almost two skill-shortage vacancies for every 100 employees. Two-thirds of the skill-shortage vacancies in this sector were for skilled trades. Looking at the results by region, recruitment difficulties were most commonly reported in the West Midlands and the East of England, although the South East had a higher than average number of hard-to-fill and skill-shortage vacancies as a proportion of the number employed. Other factors associated with skill-shortage vacancies included the level of activity and business strategy — growing workplaces and those operating above full capacity experienced a higher than average share of skill-shortage vacancies as did those establishments with a business strategy focussed on improving quality, although regression analysis suggest such factors only explain a small part of the incidence of skill-shortage vacancies.
The skills in short supply
When asked what skills they had difficulty finding to fill their skill-shortage vacancies, employers most often cited a range of technical or practical skills, however these were often sought in combination with generic skills such as communications, customer handling and team-working. Over a quarter of employers with skill-shortage vacancies said that they only found generic skills in short supply. In the follow-up interviews, respondents often saw communication, customer service and team working skills as inter-related and inter-changeable, perhaps suggesting that such terms are ill-defined in many labour market situations.
Causes
The main reason why employers thought vacancies were hard to fill was a lack of applicants — either a low number of applicants with the right skills (particularly
affecting vacancies for skilled trades and professional occupations), a low number generally or just not enough people interested. Looking at skill-shortage vacancies, while the lack of skilled applicants affected most occupations, a lack of work experience was felt to be the main problem in trying to fill managerial, customer service and sales jobs and a lack of qualifications was a particular issue for managers, associate professionals and professionals.
Responses
The main response among employers to their recruitment difficulties was to redouble their recruitment efforts by spending more money on recruitment and/or expanding their recruitment channels.
Impact
Problems recruiting employees generally meant employers suffered difficulties with customer service and also delays introducing new products and increased operating costs.
Skill gaps in 2002 Internal skill gaps are measured by asking employers to assess the proportion of their employees who are fully proficient. If they respond that they have a significant number of people who are less than fully proficient in a particular job or occupation, they are classified as having an internal skills gap (using the ‘narrow’ measure). On this basis, 23 per cent of establishments reported an internal skills gap. Using a different method of calculation but the same measure, the 2002 survey suggests that some six per cent of employees (just over one million) have a skills gap. Responses in the follow-up interviews indicate employers tend to see proficiency as a high hurdle to cross. Proficient employees, according to the respondents interviewed, are at least ‘up to standard’ and most thought them ‘better than adequate’. Employers linked proficiency to performance, ie not just whether people possessed the required skills but whether they were willing and able to deploy them efficiently and effectively. Relatively few measured proficiency in any systematic way.
Where skill gaps occur
Skills gaps appeared to be most common among sales staff (particularly in wholesale, retail and hospitality) and least likely to be reported for managerial and professional staff. Other occupations where skills gaps were most prevalent included administrative and secretarial staff (particularly in finance and business services and to a lesser extent, public administration). The incidence of skills gaps increases with size of establishment, but not uniformly. Smaller workplaces (with between five and 24 employees) were least likely to report an internal skills gap. At least a third of employers with 100 or more employees, have an internal skills gaps — compared with 23 per cent overall.
Transport and communications, and wholesale, retail and hospitality were the sectors where employers were most likely to report an internal skills gap and they were least likely in education.
Areas of skill deficiency
The main areas of skill deficiency reported were: Communication skills — reported in over half of the cases with an internal skills
gap and affecting most occupational groups, particularly in personal services. Customer handling —affecting almost half of the employers with internal gaps
and prominent among personal service, sales and professional staff. Team-working — evenly spread across most occupational groups. Problem-solving — particularly in personal service and also in associate
professional and elementary occupations.
Causes
Survey respondents identified lack of experience, and to a lesser extent lack of motivation and a failure to train staff sufficiently as the main reasons for a lack of proficiency.
Responses
The main response to skill deficiencies among employers was to provide training or increase or expand existing training. Many employers also responded by changing working practices.
Barriers to skill development
In the survey, most employers, 60 per cent, felt there were no barriers to developing or maintaining a fully proficient team of staff. Where barriers were reported they generally referred to the lack of sufficient time, cover or funding for training. Employers with skill gaps are more likely to report barriers. In the follow-up interviews respondents also identified a range of individual-centred constraints concerning a lack of personal interest or motivation to improve, change or learn.
Impact
Internal skill gaps tend to result in sub-optimal standards of customer service and quality rather than restricting the scope or level of service or products offered by employers. Larger workplaces were more likely to report negative impacts from skill gaps than smaller ones.
Gaps and shortages There is little cross-over between establishments with a skills gap and those with a skill-shortage vacancy. Only three per cent reported both and nearly three-quarters of establishments said they faced neither problem.
Future skills Most employers in the survey thought skill needs were likely to change over the next few years to cope with new technology and new working practices (although follow-up interviewees felt the demand for information and communication technology related skills might change at a faster pace ie over six months to a year rather than two to three years). The most common areas of change expected by employers were: communication skills; customer handling skills; teamworking; and management skills.
Comparisons with previous surveys
Recruitment difficulties
Although the incidence of hard-to-fill and skill-shortage vacancies reported by employers has risen between 2001 and 2002, it is no higher than in 1999. The number of hard-to-fill vacancies reported in each of the three surveys is almost identical, although the number of skill-shortage vacancies reported has risen by ten per cent compared with previous years. While there is some evidence to suggest that recruitment difficulties are higher in this survey than the last, the safest conclusion to draw is that the 2002 survey provides no evidence to suggest that recruitment difficulties have eased over the past year. Comparisons of the data by sector, size, occupation and region show:
Construction remaining as the sector where skill shortage vacancies are most concentrated. Recruitment difficulties appear to be growing in health and social care and education and declining in retail and hospitality and in finance and business services.
Little major change in the pattern of recruitment difficulties by size of workplace, although the proportion of skill-shortage vacancies experienced by smaller establishments is in decline.
A growing share of skill-shortage vacancies among professional and associate professional groups and a decline in the share of such vacancies taken by administrative and clerical, personal service and operative jobs.
A fall in the share of skill-shortage vacancies reported in London.
Technical and practical skills continue to be the area employers are finding most difficulty securing on the external labour market although the trend over the three surveys suggests this is a declining area of difficulty. Generic skills such as communication, customer handling and team working skills are areas of growing demand.
Skill gaps
Skill deficiencies in the form of reported internal skill gaps appear to be at or higher than the level recorded in the first employers’ skill survey and appear to have risen considerably over the past year, since the 2001 survey. The increasing incidence of skills gaps affects all size of workplace — though especially larger ones — and all sectors, except the public service sectors of public administration and education.
The 2002 survey indicates a rise in the share of internal skill gaps taken by customer service occupations, compared with previous surveys. Communication skills, customer handling and team working skills continue to be the main areas of internal skill deficiency.
Implications for future skills research The follow-up interviews asked respondents various questions about the concepts used in the survey and generally found them to be valid although:
Respondents tended to associate proficiency — the concept at the heart of the measure of skills gaps - as much with performance as the possession of skills, provoking questions as to what precisely is being measured with implications as to what can be done about any deficiencies that are revealed.
Respondents also had an imprecise understanding of what was meant by many of the important generic skills and often merged, for example communication and customer handling skills.
Finally, the results of the survey suggest that the extent of skill deficiencies do not change rapidly and many of our follow-up interviewees thought that the skill demand changed over years rather than months. It may therefore be sufficient, unless the state of the labour market itself changes dramatically, to measure change in the extent to which employers experience of skill gaps and shortages every two or even three years rather than annually.
1
1. Introduction
1.1 Background This report presents the findings from the Employers Skill Survey 2002 (ESS 2002). This is the third in a series of surveys initially undertaken as part of the comprehensive analysis of skill deficiencies undertaken by the Skills Task Force. The first was published in 1999 (Bosworth et al.) and the second in 2001 (Hogarth et al.). The aim of the surveys, continued in 2002, was to investigate the extent, causes and implications of skill deficiencies in England. ESS 2002 is a much shorter survey than its predecessors, with a significantly more limited sample and was designed primarily to maintain the continuity of the dataset and provide an update on skill deficiencies in England.
In addition, this time around a number of follow-up interviews were undertaken with survey respondents in an attempt to explore their understanding of some of the terms and definitions used in the survey in more depth. These interviews and subsequent analysis of the dataset throw some light on the validity and reliability of the data series.
1.2 The 2002 survey As before, the survey addresses a number of related research questions:
To what extent do employers face difficulties recruiting employees and whether the lack of available skills contribute to these difficulties?
Do employers perceive that they have internal skill gaps among their employed workforce
Do these deficiencies vary by size, sector and occupation? What do employers think are the main causes of any skill deficiencies they face,
and what are the consequences?
This year’s survey involved telephone interviews with 4054 respondents across England. Details of the achieved sample are set out in Appendix 2. The survey was establishment based and covered all sectors. This year, establishments with fewer than five employees, which were included in ESS 2001, but not in ESS 1999, were excluded. The principal respondent was the person responsible for human resources or personnel issues. Interviewing took place between 21 January 2002 and 13 March 2002.
The survey sample was therefore considerably smaller than in the previous two exercises. In 1999 23,070 telephone and 3,882 face-to-face interviews were conducted among establishments with five or more employees, but excluding the
2
agricultural sector. Last year, ESS 2001 involved 27,031 telephone interviews with respondents from establishments across all sectors and including establishments with one or more employees.
Other differences with the previous surveys include:
The questionnaire was shorter — taking an average of 16 minutes — and did not include the questions about training and e-commerce included in ESS 2001. However the remaining questions were generally asked in a similar way to the previous surveys, in an attempt to maintain continuity, especially in the key areas.
The survey was conducted by a different set of researchers and telephone interviewers and inevitably there will be some differences in the way data were collected, coded or analysed. These differences should be taken into account when drawing comparisons with previous surveys.
The questionnaire is set out in Appendix 4.
1.2.1 Piloting
The survey was piloted in December 2001 to test the internal validity of the interviewing script and trial the length of the interview. A few minor changes to the wording were made as a result of feed-back from the interviewers.
1.2.2 Sample frame
The sample frame from which the sample was drawn was BT’s Business Database. The population from which the survey sample was drawn was all business establishments (rather than business enterprises) in England with five or more employees. The sample was structured to ensure that the final achieved sample allowed analysis by different size bands as well as by industry sector. Therefore, medium to large establishments were over-sampled and the number of small businesses reduced accordingly. Minimum targets were also set for each of the nine English regions. Details of the sampling process are given in Appendix 2.
1.2.3 Response rates
The overall response rate was 53 per cent (see Appendix 2).
1.2.4 Weighting and grossing up procedure
The survey data were weighted against the Annual Business Inquiry (ABI) survey data to make them representative of workplaces in England (by size and sector), see Appendix 2, and where appropriate grossed up to provide estimates for all workplaces in England.
Previous surveys have been weighted by the Annual Employment Survey (AES), which has been discontinued. The first ABI employee jobs data was released in April 2001, based on the survey year 1999. The ABI was proposed as a replacement by The Office of National Statistics to improve coherence and reduce duplication across
3
its range of business surveys (Partington, 2000). Therefore, the ABI collects data from the same sample of businesses that are asked to provide economic data that feed into the National Accounts. The key differences between ABI and AES are:
ABI collects information on employee jobs for a date in mid-December. AES collected data for a date in mid-September.
AES collected local site-level data and built aggregate statistics for enterprises from the sum of parts. ABI collects figures for the organisation from the business' headquarters. This information is allocated between sites using data from the Annual Register Inquiry (which collects site-level information and forms the basis of the Inter-Departmental Business Register).
There are some discrepancies in the data collected using the ABI compared with data measuring the same variables collected using AES. The key differences are:
The level of employee jobs measured through ABI is between 500,000 and 750,000 higher than the level obtained from the AES. However, the ABI figures are more closely aligned with Labour Force Survey figures.
The discrepancies between ABI and AES employee jobs count are largest in the retail, distribution, catering and leisure service sectors. The smallest differences are in the manufacturing sector.
Two main factors are thought to explain the discrepancy (based on a study where 13,000 businesses were included in the ABI and AES in 1998):
Contributor difference - in other words people supplying figures for the survey mis-reporting. This was most pronounced in the AES where contributors were asked to complete a survey form for every site. Where AES and ABI figures diverged it was often because the contributor had not completed a form for all sites which resulted in under-reporting. This was a particular problem in firms with 250+ employees.
Estimation procedure - problems with the AES estimation methodology which resulted in a shortfall in estimates of employee numbers.
The difference in the weighting procedure will mean that ESS 2002 is not strictly comparable with ESS 2001. We have re-weighted ESS 2001 using the ABI and compared the key results, taking account also of the difference in the sample structure, to assess the impact of the new weighting procedure. The results suggest that the ABI weighting process has the effect of slightly increasing the estimated prevalence of skill deficiencies. For instance, the proportion of workplaces reporting a vacancy rises from 27 to 28 per cent and the estimated number of skill shortage vacancies rise from 94,000 to 100,000 (although the percentage of establishments reporting skill-shortage vacancies is unchanged at six per cent). On skills gaps, the proportion of establishments reporting any skills gap rises from 50 to 51 per cent, although the key indicator of the percentage with an internal skills gaps (on the 'narrow’ measure, see 1.3.1) remains at 16 per cent. While the number of skill gaps (using the employee-based measure) rises slightly using the ABI — the figure for skill gaps as a percentage of employees remains unaffected (see Table 3.1).
4
In making any comparisons with previous surveys we have re-based the 2001 survey (but not the 1999 survey) using the ABI (see Chapter 4).
1.2.5 View on the validity of the data
While a number of steps have been taken to maintain the continuity of the data series the different weighting procedure and the differences in data collection, coding and analysis between the 2002 and previous surveys mean that any comparisons should be made with caution.
Various checks have been conducted on the 2002 dataset and we are happy that it is internally consistent and robust within the confidence limits set out in Appendix 2.
1.2.6 Cognitive interviews
In departure from the previous surveys, 50 follow-up interviews were conducted with survey respondents, in March 2002. These interviews were designed to explore some of the terminology used in the survey (eg what respondents understood by the terms ‘vacancy’ or ‘proficiency’) and examine some of the issues in greater depth (eg the causes of skill deficiencies and employers’ responses to them). The interviews were conducted by telephone with a cross-section of respondents (in production and service sectors and from all regions of the country) by researchers from MORI and IES. Details of the sample and an outline of the questions asked are set out in Appendix 3.
1.3 Structure of this report The structure of this report largely follows that of previous survey reports:
Chapter 2 looks at recruitment difficulties and skill shortage vacancies and also includes data on the impact of such problems.
Chapter 3 focuses on the incidence and impact of skill gaps. Comparisons with previous surveys are drawn in Chapter 4. Please note that in
the interests of clarity, we have only drawn comparisons with the equivalent data from previous surveys, ie that excluding establishments with fewer than five employees, with the 2001 data re-weighted using the ABI.
Chapter 5 draws together our conclusions in two respects: the key findings of the survey; and their implications, and those of the other elements of the study, for future skills research in England.
In addition there are a number of appendices covering the references cited and the methodology in more detail (Appendix 3 and 4).
1.3.1 Definitions
ESS 2002 continues with the definitions established in ESS 1999 and used in ESS 2001. Thus we distinguish between two kinds of skill deficiency:
5
Recruitment difficulties in the external labour market, where we focus on hard-to-fill vacancies, particularly those caused by an excess of demand over supply of the required skills1, referred to in the report as skill shortage vacancies. The precise definition of skill shortage vacancies are hard-to-fill vacancies that are attributed by respondents to one of the following causes: low number of applicants with required skills; lack of work experience the employer demands; lack of required qualifications.
Internal skill gaps, between an establishment’s current skill levels and what is needed to meet business objectives. The survey measures such gaps by asking respondents about the level of proficiency among current staff. A further distinction is drawn between workplaces who report a significant proportion of employees in an occupational group to be less than fully proficient (referred to, as in ESS 2001, as the ‘narrow’ measure of skills gaps) and those who report only that ‘not all’ employees are fully proficient, ie a few are less than fully proficient (referred to, as before, as the ‘broad’ measure). Unless otherwise stated the standard indicator of internal skill gaps used in this report is the narrow measure.
1.3.2 Presentation of the data
All data presented in the tables have been weighted and grossed up to reflect the population as a whole. In some cases the base for the data is the number of establishments (in these cases we talk in terms of x percentage of employers or workplaces did this etc.) and in other cases the base is the number of vacancies or skill gaps (when we talk about x percentage of vacancies etc. look like that etc.). In each case the base of any table or figure is clearly labelled.
Each table also reports the weighted and the unweighted base numbers. Where the unweighted number of cases falls below 50 (which it does for instance when analysing skill-shortage vacancies by some sectors or regions) the data is expressed in italics and should be treated with caution. Where the numbers fall below 25, the data are not reported (indicated by ‘!’ where appropriate). Where a percentage is lower than 0.5 per cent, it is represented by ‘*’.
As in previous reports, percentages are rounded to the nearest whole number (and therefore totals in some of the tables may not add up to 100). Also the sectoral tables only include responses from agriculture and other services in the total ‘all industries and services’ column, which may be another reason why in some cases the tables do not internally sum.
1.3.3 Cognitive interview data
The data from the follow-up cognitive interviews is either presented in clearly labelled panels or used in the text to illustrate points from the survey data.
1 As opposed to company-specific factors such as poor recruitment techniques or unattractive pay
or conditions.
6
2. Recruitment Problems
This Chapter examines the scale and nature of the recruitment problems (in terms of hard-to-fill or skill-shortage vacancies) reported by the respondents to the survey and their causes and consequences.
The survey followed a similar course to ESS 1999 and ESS 2001. Respondents were asked to identify occupations in which they currently had vacancies. In each case respondents were then asked whether any of the vacancies were proving hard-to-fill and why. Vacancies that were reported to be hard to fill for skill-related reasons1 are classified as skill-shortage vacancies. Thus there are three measures referred throughout this report:
General vacancies — which are a measure of overall recruitment demand, or at least recruitment activity, and two measures of recruitment difficulties:
Hard-to-fill vacancies — as defined by employers; Skill-shortage vacancies — vacancies that are hard to fill for what employers
believe to be skill-based reasons.
2.1 Incidence and number of vacancies and recruitment difficulties
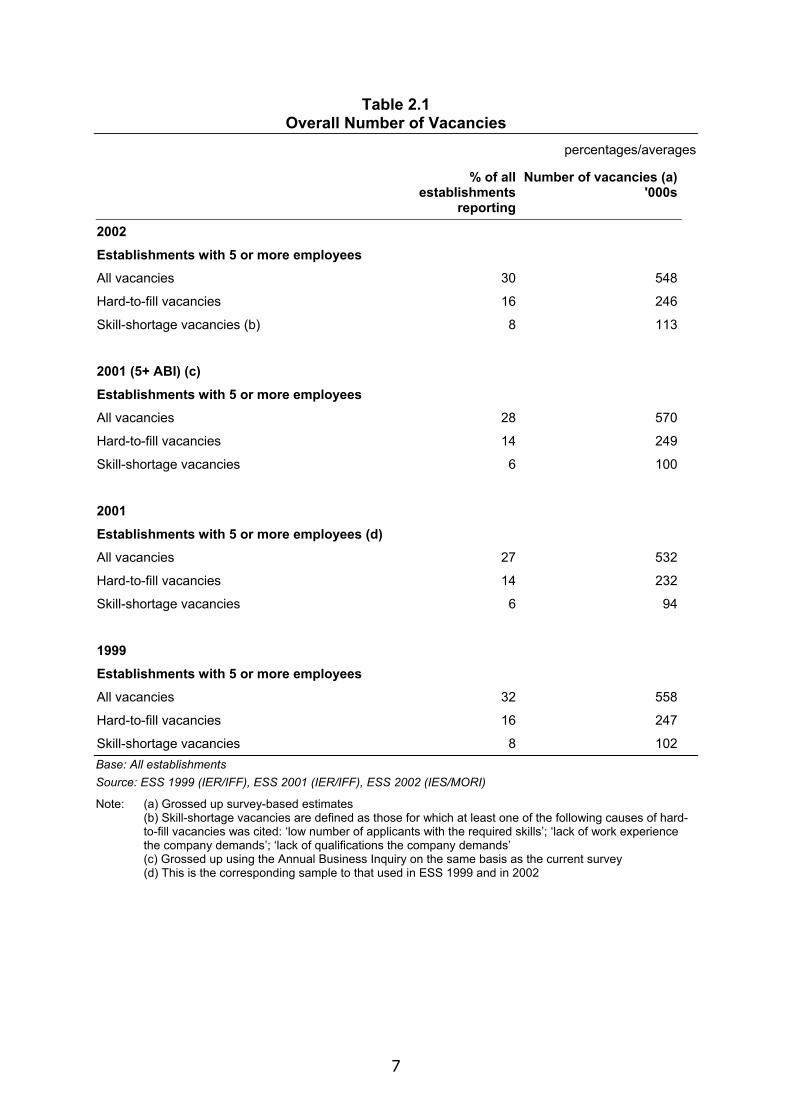
Some 30 per cent of establishments had at least one vacancy at the time of the survey, with 16 per cent reporting that a vacancy was hard-to-fill and eight per cent reporting skill shortage vacancies. Table 2.1 presents these summary results for ESS2002, with comparable results from previous surveys. It should be noted in making these comparisons that:
The population base for grossing up the data has changed between the 2001 and 2002 surveys and the survey has now been weighted on the basis of the Annual Business Inquiry (ABI) data rather than the now defunct Annual Employment Survey (AES). In Table 2.1 we present the ESS 2001 results using both bases.
The 2001 survey included establishments with between one and four employees. These have been excluded for the purposes of comparisons with the latest survey.
1 ie due to low number of applicants with the required skills or applicants lacking relevant work
experience or qualifications.
7
Table 2.1 Overall Number of Vacancies
percentages/averages
% of all establishments
reporting
Number of vacancies (a) '000s
2002
Establishments with 5 or more employees
All vacancies 30 548
Hard-to-fill vacancies 16 246
Skill-shortage vacancies (b) 8 113
2001 (5+ ABI) (c)
Establishments with 5 or more employees
All vacancies 28 570
Hard-to-fill vacancies 14 249
Skill-shortage vacancies 6 100
2001
Establishments with 5 or more employees (d)
All vacancies 27 532
Hard-to-fill vacancies 14 232
Skill-shortage vacancies 6 94
1999
Establishments with 5 or more employees
All vacancies 32 558
Hard-to-fill vacancies 16 247
Skill-shortage vacancies 8 102 Base: All establishments Source: ESS 1999 (IER/IFF), ESS 2001 (IER/IFF), ESS 2002 (IES/MORI)
Note: (a) Grossed up survey-based estimates (b) Skill-shortage vacancies are defined as those for which at least one of the following causes of hard-to-fill vacancies was cited: ‘low number of applicants with the required skills’; ‘lack of work experience the company demands’; ‘lack of qualifications the company demands’ (c) Grossed up using the Annual Business Inquiry on the same basis as the current survey (d) This is the corresponding sample to that used in ESS 1999 and in 2002
8
Broadly the 2002 headline results are similar to those of previous surveys. While there is some evidence that recruitment difficulties have slightly worsened since the 2001 survey, at least part of the difference can be attributed to the change in the grossing procedure and other technical differences between the surveys. Detailed comparisons between the latest survey results and previous surveys are made in Chapter 4.
What is a vacancy?
In the follow-up interviews respondents were asked what they understood by the term ‘vacancy’. A relatively unambiguous view emerged. Our interviewees had a fairly clear idea of what a vacancy was. Generally, there was a degree of formality attached to it. There was a specific slot to fill, which may have required approval, especially where there was a defined staffing level or establishment. A vacancy referred to permanent positions and involved active recruitment, rather than taking people ‘on spec’.
The most common descriptions (cited by over half the interviewees) centred around one of two phrases: ‘a job that needs filling’ or ’positions available’. The terms ‘job’ or ‘position’ were generally used interchangeably. Some of the interviewees from smaller establishments, were fairly vague about the nature of the vacancy, eg ‘jobs currently recruiting for’ or ‘a job that is available to apply for’, while others (one in seven respondents) gave more detailed explanations of the circumstances around a vacancy:
‘A position that needs filling either because a line manager says they need some-one, because some-one is leaving, there has been an internal promotion or resignation, or because there is a restructuring which means more employees are needed.’
In larger workplaces two other aspects of vacancies were volunteered by interviewees: the notion of an establishment figure; and approval to fill a vacancy. Around one in ten (one in five of interviewees from larger workplaces) talked about an establishment level. For instance, the respondent from a relatively large manufacturing company told us:
‘We have an establishment figure for the whole company, and vacancies are where that establishment figure has not been reached.’
A similar proportion said that management or the personnel department had to approve the filling of a vacancy — either in all cases or where there was a change in the establishment level:
‘If we were extending the staffing in a particular area it would be put to approval, rather than willy nilly take staff on.’
Hardly any of our respondents would take anybody ‘on spec’, without there being a clear vacancy. Two main reasons for this were given:
Adherence to formal staffing levels — eg one respondent said that: ‘We plan manning levels quite carefully and would not employ some-one unless there was a formal vacancy.’ Another said: ‘If we feel the business demands more resources we would identify the kinds of areas where there are a shortage of skills, then basically come up with vacancies in particular areas. But we wouldn’t create a vacancy on a speculative CV.’ Fairness in recruitment — usually public sector organisations who argued that vacancies had to be subject to open competition.
9
Thus in responding to the telephone survey, most respondents were thinking of a specific post they were trying to fill.
Finally a few respondents distinguished between permanent and temporary positions (eg less than three months duration), including only the former as a ‘vacancy’.
2.2 The overall number of vacancies Table 2.1 also includes estimates of the total number of vacancies in England, based on grossing up the survey data (using the ABI). On this basis it is estimated that at the time of the survey there were some 550,000 vacancies, which is equivalent to about three per cent of the number of people employed. In other words, at the time of the survey around three in one hundred jobs in England were unfilled. Of these vacancies, the survey suggests that around 45 per cent were hard-to-fill, ie around 245,000 in all, of which 46 per cent were caused by skill-related difficulties, ie there were just over 110,000 skill-shortage vacancies.
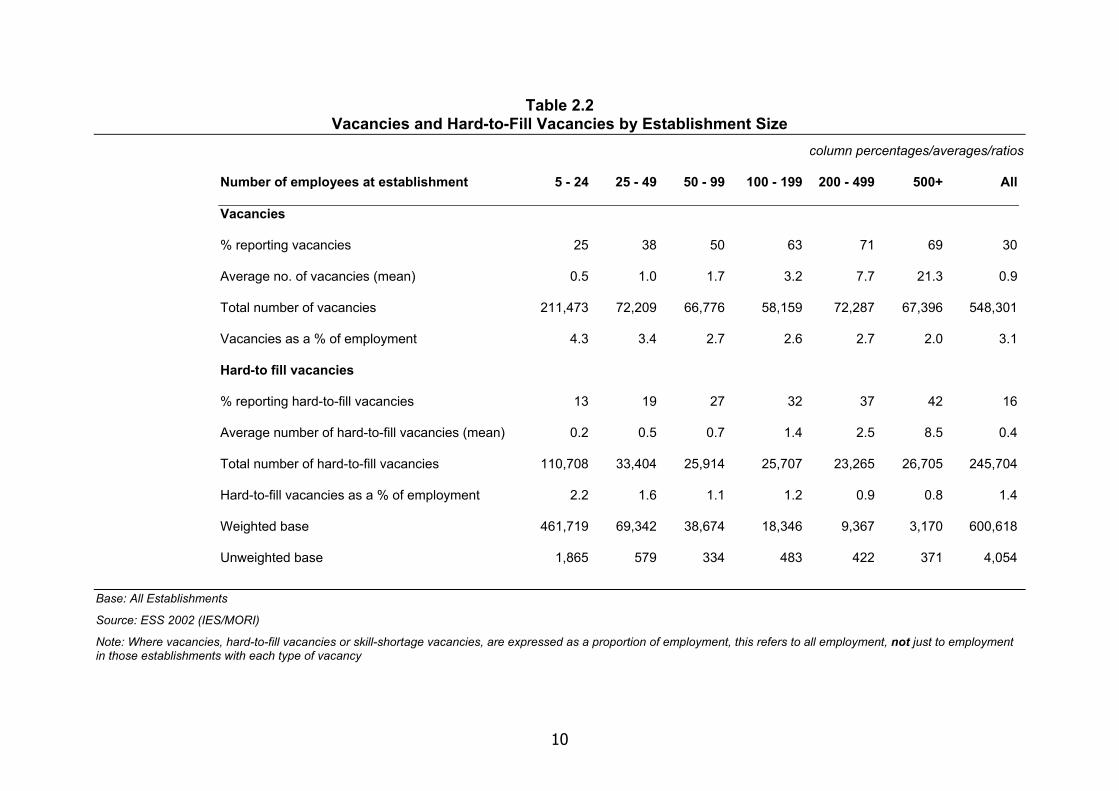
2.3 Variations by size of establishment On average there was just under one vacancy for every establishment in the survey (looking at grossed up data, see Table 2.2). Not surprisingly vacancies varied by establishment size. The larger the workplace the more likely it was to have a vacancy, obviously reflecting the larger number of jobs available. Around seven in ten workplaces with 200 or more employees reported a vacancy, compared with around a quarter of those employing fewer than 25 people. The average number of vacancies in a workplace also varied between 0.5, in workplaces with between five and 24 employees to over 21 in workplaces with 500 or more employees. Looking at vacancies as a proportion of total employment takes account of this size issue and suggests that vacancies are more important in smaller establishments, with vacancies representing over four per cent of employment in the smaller size bands, but only around two per cent in the larger workplaces.
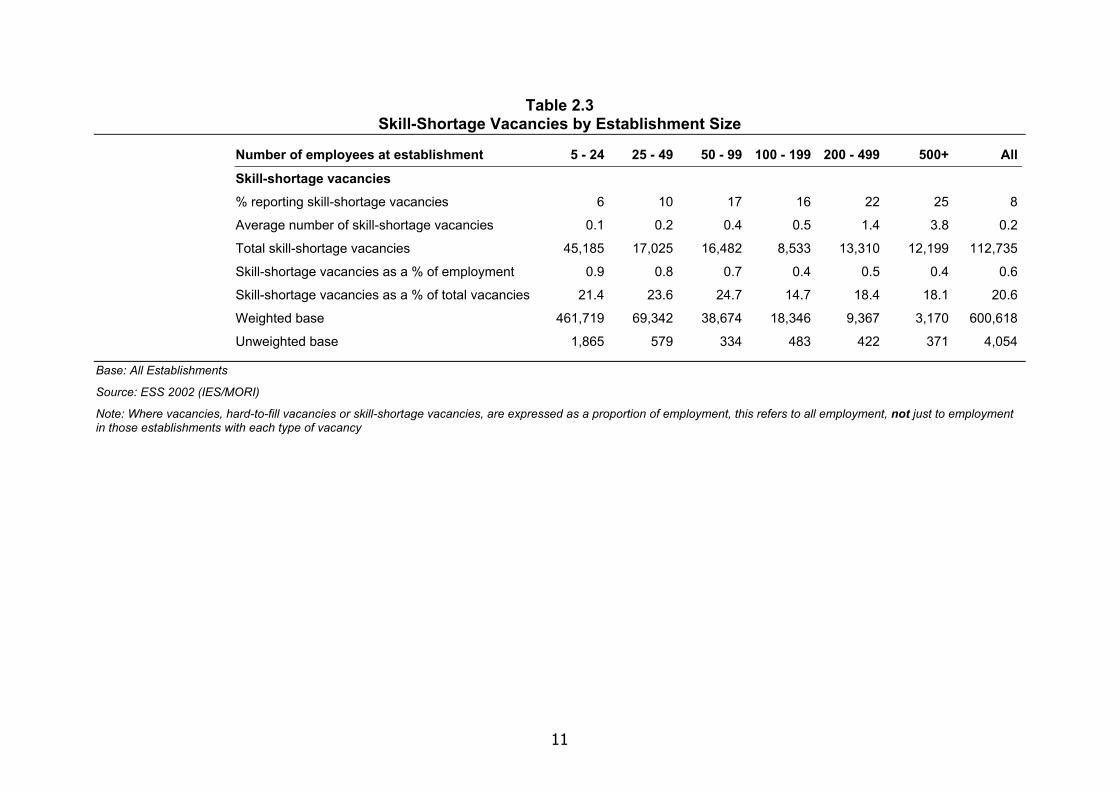
The incidence of hard-to-fill and skill-shortage vacancies also varied with size, with over a third of larger workplaces (ie with 200 or more employees) reporting a vacancy that was hard to fill, and almost a quarter saying that they had hard-to-fill vacancies caused by skill-related reasons. By contrast, fewer than a fifth of workplaces with under 50 employers had a hard-to-fill vacancy and fewer than one in ten had a skill-shortage vacancy (Table 2.2 and 2.3).
One of the key points to emerge from the data presented in Tables 2.2 and 2.3 is that: while larger workplaces were more likely to report larger number of recruitment difficulties, where they occur they may be more significant in smaller workplaces. For example, over a fifth of all vacancies in smaller workplaces were attributed to skill-related reasons, compared to under a fifth in sites with 500 or more employees. Furthermore, skill-shortage vacancies accounted for twice the proportion of employment at the smaller end of the workplace scale: 0.9 per cent (five to 24 employees) compared with 0.4 per cent (500 plus employees).
10
Table 2.2 Vacancies and Hard-to-Fill Vacancies by Establishment Size
column percentages/averages/ratios
Number of employees at establishment 5 - 24 25 - 49 50 - 99 100 - 199 200 - 499 500+ All
Vacancies
% reporting vacancies 25 38 50 63 71 69 30
Average no. of vacancies (mean) 0.5 1.0 1.7 3.2 7.7 21.3 0.9
Total number of vacancies 211,473 72,209 66,776 58,159 72,287 67,396 548,301
Vacancies as a % of employment 4.3 3.4 2.7 2.6 2.7 2.0 3.1
Hard-to fill vacancies
% reporting hard-to-fill vacancies 13 19 27 32 37 42 16
Average number of hard-to-fill vacancies (mean) 0.2 0.5 0.7 1.4 2.5 8.5 0.4
Total number of hard-to-fill vacancies 110,708 33,404 25,914 25,707 23,265 26,705 245,704
Hard-to-fill vacancies as a % of employment 2.2 1.6 1.1 1.2 0.9 0.8 1.4
Weighted base 461,719 69,342 38,674 18,346 9,367 3,170 600,618
Unweighted base 1,865 579 334 483 422 371 4,054
Base: All Establishments
Source: ESS 2002 (IES/MORI)
Note: Where vacancies, hard-to-fill vacancies or skill-shortage vacancies, are expressed as a proportion of employment, this refers to all employment, not just to employment in those establishments with each type of vacancy
11
Table 2.3 Skill-Shortage Vacancies by Establishment Size
Number of employees at establishment 5 - 24 25 - 49 50 - 99 100 - 199 200 - 499 500+ All
Skill-shortage vacancies % reporting skill-shortage vacancies 6 10 17 16 22 25 8
Average number of skill-shortage vacancies 0.1 0.2 0.4 0.5 1.4 3.8 0.2
Total skill-shortage vacancies 45,185 17,025 16,482 8,533 13,310 12,199 112,735
Skill-shortage vacancies as a % of employment 0.9 0.8 0.7 0.4 0.5 0.4 0.6
Skill-shortage vacancies as a % of total vacancies 21.4 23.6 24.7 14.7 18.4 18.1 20.6
Weighted base 461,719 69,342 38,674 18,346 9,367 3,170 600,618
Unweighted base 1,865 579 334 483 422 371 4,054
Base: All Establishments
Source: ESS 2002 (IES/MORI)
Note: Where vacancies, hard-to-fill vacancies or skill-shortage vacancies, are expressed as a proportion of employment, this refers to all employment, not just to employment in those establishments with each type of vacancy
12
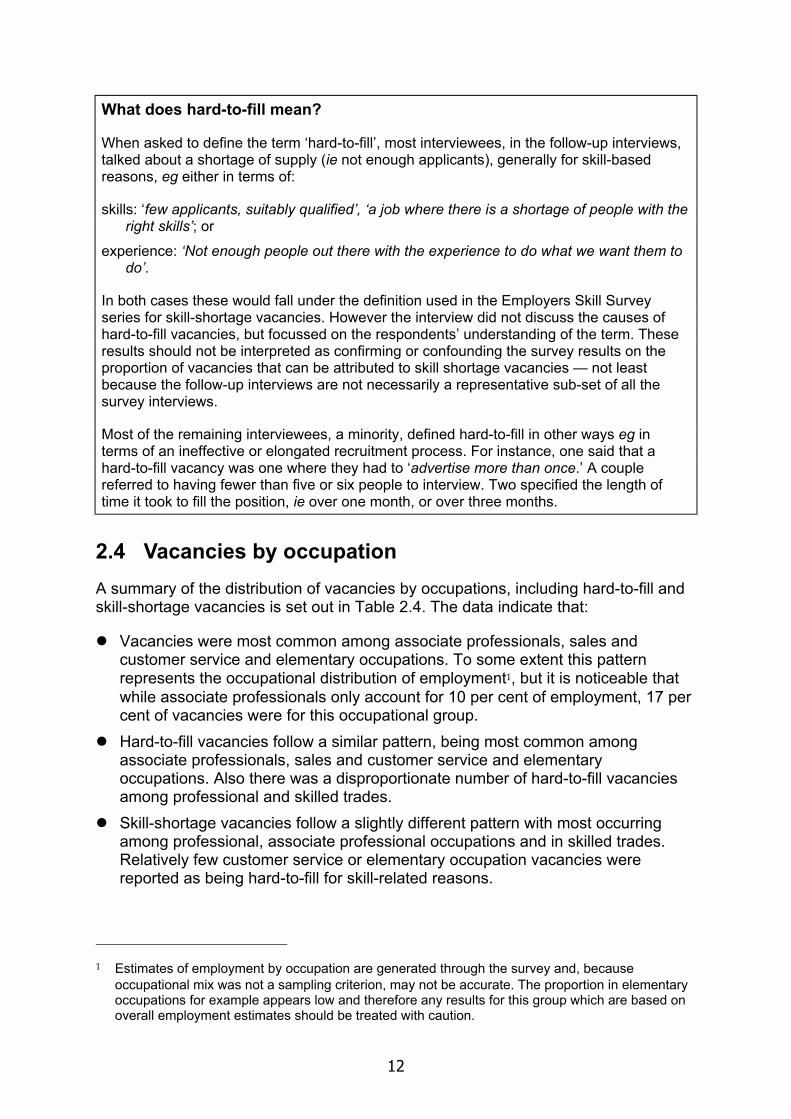
What does hard-to-fill mean?
When asked to define the term ‘hard-to-fill’, most interviewees, in the follow-up interviews, talked about a shortage of supply (ie not enough applicants), generally for skill-based reasons, eg either in terms of:
skills: ‘few applicants, suitably qualified’, ‘a job where there is a shortage of people with the right skills’; or
experience: ‘Not enough people out there with the experience to do what we want them to do’.
In both cases these would fall under the definition used in the Employers Skill Survey series for skill-shortage vacancies. However the interview did not discuss the causes of hard-to-fill vacancies, but focussed on the respondents’ understanding of the term. These results should not be interpreted as confirming or confounding the survey results on the proportion of vacancies that can be attributed to skill shortage vacancies — not least because the follow-up interviews are not necessarily a representative sub-set of all the survey interviews.
Most of the remaining interviewees, a minority, defined hard-to-fill in other ways eg in terms of an ineffective or elongated recruitment process. For instance, one said that a hard-to-fill vacancy was one where they had to ‘advertise more than once.’ A couple referred to having fewer than five or six people to interview. Two specified the length of time it took to fill the position, ie over one month, or over three months.
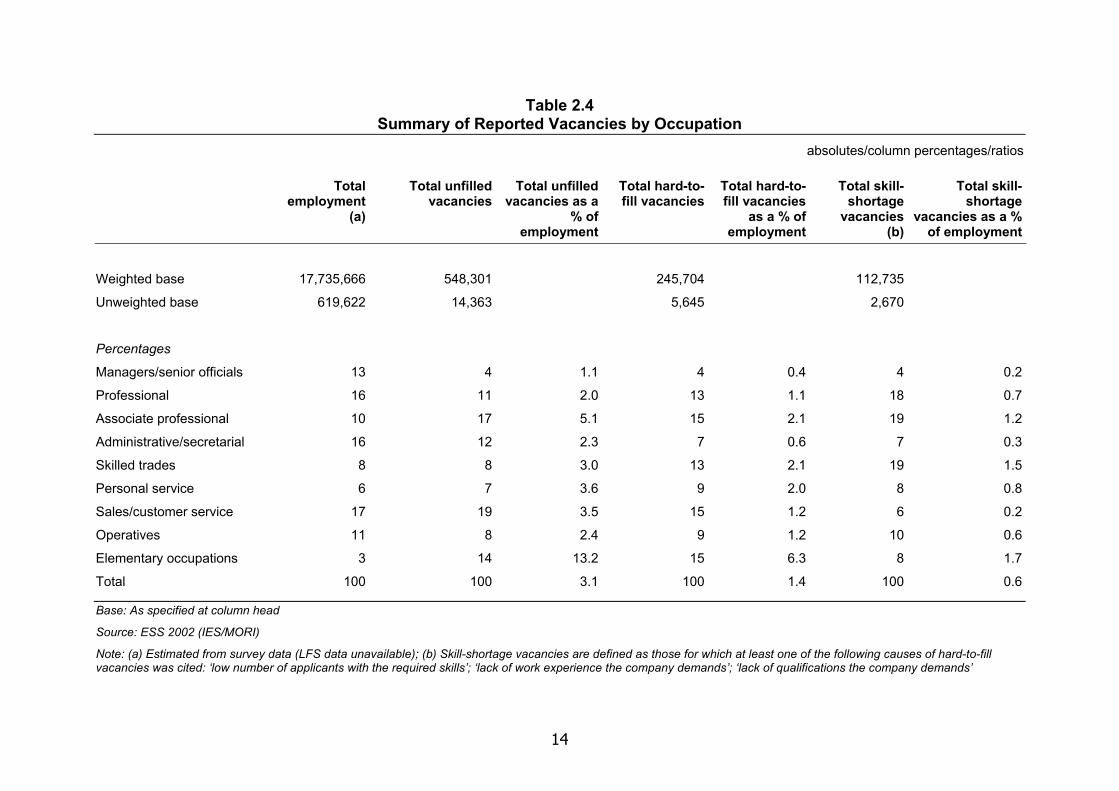
2.4 Vacancies by occupation A summary of the distribution of vacancies by occupations, including hard-to-fill and skill-shortage vacancies is set out in Table 2.4. The data indicate that:
Vacancies were most common among associate professionals, sales and customer service and elementary occupations. To some extent this pattern represents the occupational distribution of employment1, but it is noticeable that while associate professionals only account for 10 per cent of employment, 17 per cent of vacancies were for this occupational group.
Hard-to-fill vacancies follow a similar pattern, being most common among associate professionals, sales and customer service and elementary occupations. Also there was a disproportionate number of hard-to-fill vacancies among professional and skilled trades.
Skill-shortage vacancies follow a slightly different pattern with most occurring among professional, associate professional occupations and in skilled trades. Relatively few customer service or elementary occupation vacancies were reported as being hard-to-fill for skill-related reasons.
1 Estimates of employment by occupation are generated through the survey and, because
occupational mix was not a sampling criterion, may not be accurate. The proportion in elementary occupations for example appears low and therefore any results for this group which are based on overall employment estimates should be treated with caution.
13
On the basis of the results reported in Table 2.4 the occupational ‘hot spots’ appear to centre on:
Skilled trades — where there were an average number of vacancies, but a disproportionate number of them were hard to fill for skill-related reasons.
Associate professionals — with large proportion of recruitment difficulties in terms of hard-to-fill and skill-shortage vacancies relative to the number employed in such jobs.
A relatively large proportion of skill-shortage vacancies also affect professional occupations — although the picture does not look as severe when such vacancies are viewed as a percentage of employment — and elementary occupations (where the data may need careful interpretation due to the way total employment is estimated in the survey).
14
Table 2.4 Summary of Reported Vacancies by Occupation
absolutes/column percentages/ratios
Total employment
(a)
Total unfilled vacancies
Total unfilled vacancies as a
% of employment
Total hard-to-fill vacancies
Total hard-to-fill vacancies
as a % of employment
Total skill-shortage
vacancies (b)
Total skill-shortage
vacancies as a % of employment
Weighted base 17,735,666 548,301 245,704 112,735
Unweighted base 619,622 14,363 5,645 2,670
Percentages
Managers/senior officials 13 4 1.1 4 0.4 4 0.2
Professional 16 11 2.0 13 1.1 18 0.7
Associate professional 10 17 5.1 15 2.1 19 1.2
Administrative/secretarial 16 12 2.3 7 0.6 7 0.3
Skilled trades 8 8 3.0 13 2.1 19 1.5
Personal service 6 7 3.6 9 2.0 8 0.8
Sales/customer service 17 19 3.5 15 1.2 6 0.2
Operatives 11 8 2.4 9 1.2 10 0.6
Elementary occupations 3 14 13.2 15 6.3 8 1.7
Total 100 100 3.1 100 1.4 100 0.6
Base: As specified at column head
Source: ESS 2002 (IES/MORI)
Note: (a) Estimated from survey data (LFS data unavailable); (b) Skill-shortage vacancies are defined as those for which at least one of the following causes of hard-to-fill vacancies was cited: ‘low number of applicants with the required skills’; ‘lack of work experience the company demands’; ‘lack of qualifications the company demands’
15
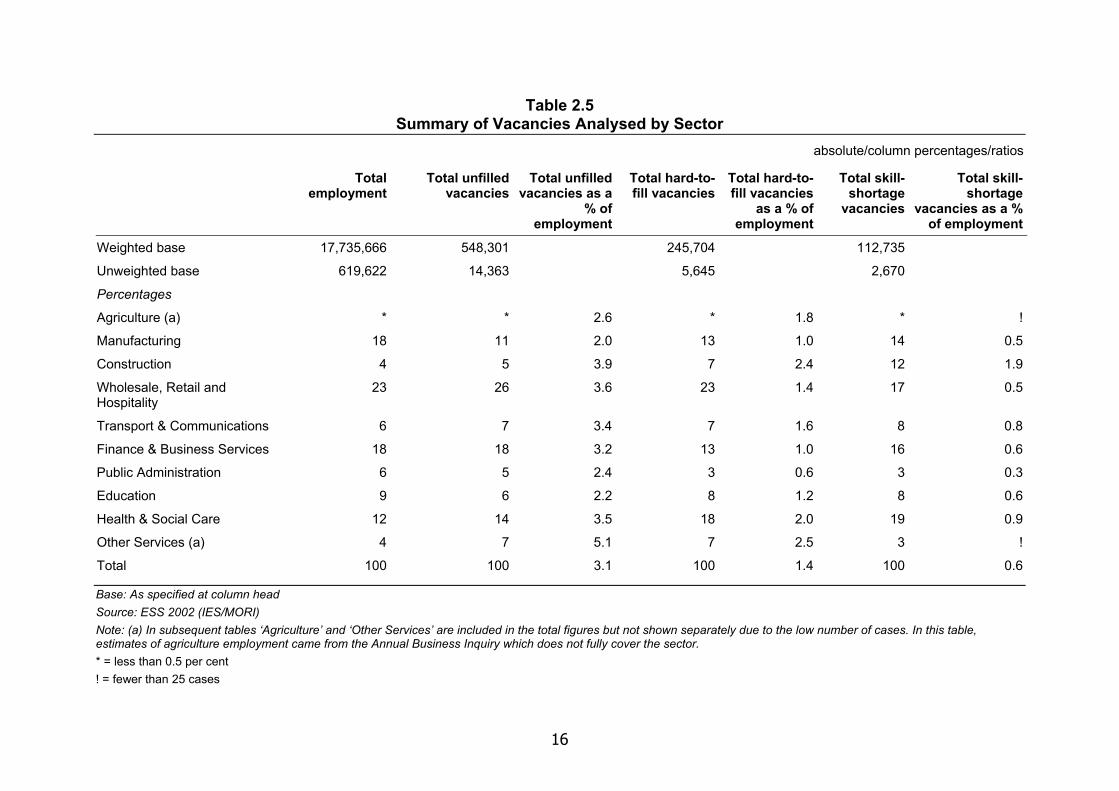
2.5 Vacancies by sector The data in vacancies by sector are set out in Tables 2.5, 2.6 and 2.7. Apart from in Table 2.5, data on the agriculture or other services sectors are not presented separately, as the number of cases with skill-shortage and/or hard-to-fill vacancies were too small to report with confidence1.
As with the occupational data the distribution of vacancies largely reflect the distribution of employment. Thus most vacancies occurred in retail and hospitality and in finance and business services, the sectors with most employment. It is more interesting to focus on those sectors with recruitment problems in greater proportion than their proportion of employment would suggest. On this basis:
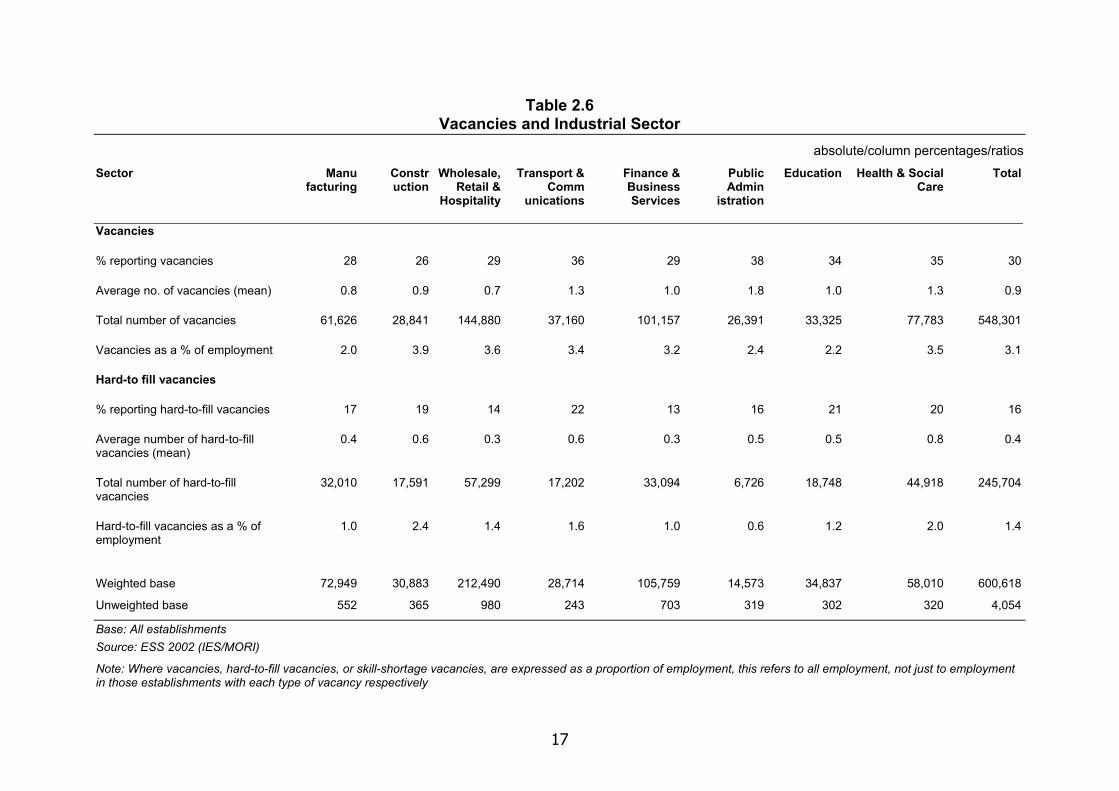
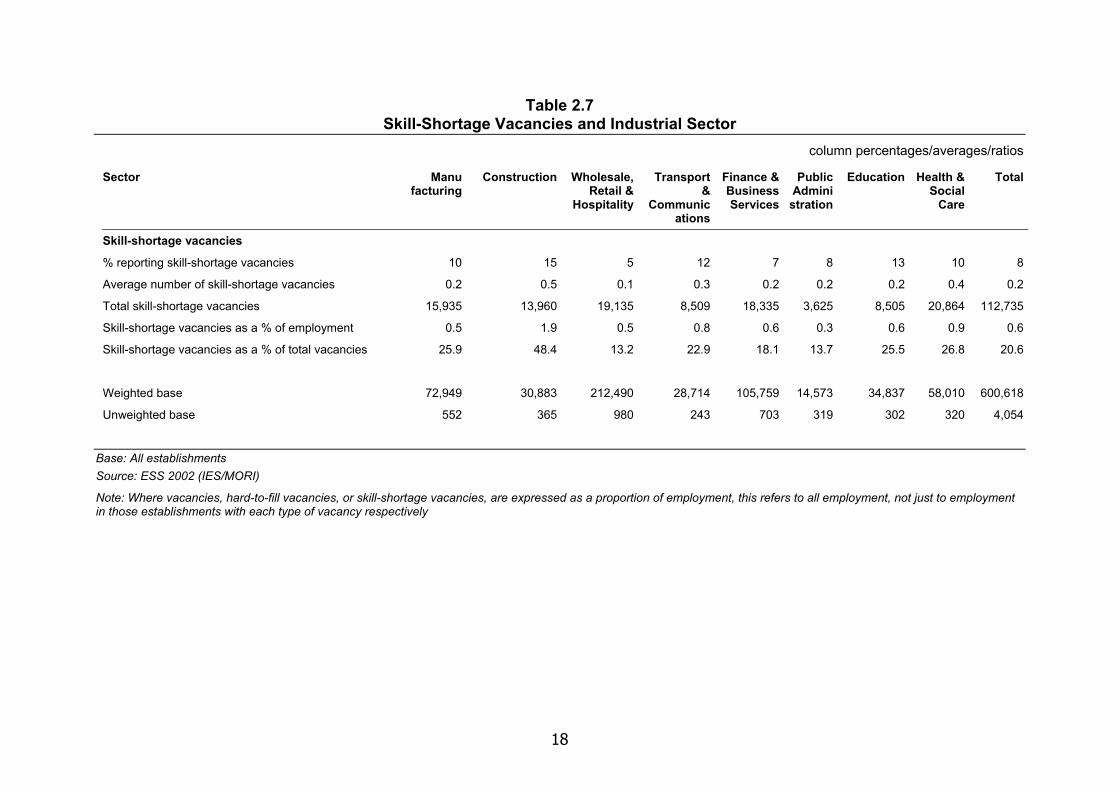
Construction has 12 per cent of skill-shortage vacancies and only four per cent of employment, with almost two skill-shortage vacancies for every 100 employees. Looking at the establishment based data (Tables 2.6 and 2.7) it can be seen that almost one in four construction sites had a vacancy at the time of the survey (a below average incidence). However almost half of them were skill related and 15 per cent of construction employers reported a skill-shortage vacancy, compared with eight per cent overall.
Health and social care is another area of difficulty, accounting for 12 per cent of employment but 19 per cent of skill-shortage vacancies — although skill-shortage vacancies as a percentage of employment are relatively low compared with construction at 0.9 per cent they are still well above average. Over a third of health and social care establishments had a vacancy — above the 30 per cent average and over a quarter of those were proving hard to fill for skill-related reasons.
The sectors with the least difficulty appeared to be public administration and retail and hospitality.
• Although public administration has an above average incidence of vacancies, the level of vacancies is in line with employment and the proportion of vacancies that are proving hard-to-fill for skill related reasons are relatively low.
• Wholesale, retail and hospitality is a large sector and therefore has a large absolute number of vacancies, but relatively few proved to be hard to fill.
1 Which is why in some tables totals do not add up to 100.
16
Table 2.5 Summary of Vacancies Analysed by Sector
absolute/column percentages/ratios
Total employment
Total unfilled vacancies
Total unfilled vacancies as a
% of employment
Total hard-to-fill vacancies
Total hard-to-fill vacancies
as a % of employment
Total skill-shortage
vacancies
Total skill-shortage
vacancies as a % of employment
Weighted base 17,735,666 548,301 245,704 112,735
Unweighted base 619,622 14,363 5,645 2,670
Percentages
Agriculture (a) * * 2.6 * 1.8 * !
Manufacturing 18 11 2.0 13 1.0 14 0.5
Construction 4 5 3.9 7 2.4 12 1.9
Wholesale, Retail and Hospitality
23 26 3.6 23 1.4 17 0.5
Transport & Communications 6 7 3.4 7 1.6 8 0.8
Finance & Business Services 18 18 3.2 13 1.0 16 0.6
Public Administration 6 5 2.4 3 0.6 3 0.3
Education 9 6 2.2 8 1.2 8 0.6
Health & Social Care 12 14 3.5 18 2.0 19 0.9
Other Services (a) 4 7 5.1 7 2.5 3 !
Total 100 100 3.1 100 1.4 100 0.6
Base: As specified at column head Source: ESS 2002 (IES/MORI) Note: (a) In subsequent tables ‘Agriculture’ and ‘Other Services’ are included in the total figures but not shown separately due to the low number of cases. In this table, estimates of agriculture employment came from the Annual Business Inquiry which does not fully cover the sector. * = less than 0.5 per cent ! = fewer than 25 cases
17
Table 2.6 Vacancies and Industrial Sector
absolute/column percentages/ratios Sector Manu
facturing Constr uction
Wholesale, Retail &
Hospitality
Transport & Comm
unications
Finance & Business Services
Public Admin
istration
Education Health & Social Care
Total
Vacancies
% reporting vacancies 28 26 29 36 29 38 34 35 30
Average no. of vacancies (mean) 0.8 0.9 0.7 1.3 1.0 1.8 1.0 1.3 0.9
Total number of vacancies 61,626 28,841 144,880 37,160 101,157 26,391 33,325 77,783 548,301
Vacancies as a % of employment 2.0 3.9 3.6 3.4 3.2 2.4 2.2 3.5 3.1
Hard-to fill vacancies
% reporting hard-to-fill vacancies 17 19 14 22 13 16 21 20 16
Average number of hard-to-fill vacancies (mean)
0.4 0.6 0.3 0.6 0.3 0.5 0.5 0.8 0.4
Total number of hard-to-fill vacancies
32,010 17,591 57,299 17,202 33,094 6,726 18,748 44,918 245,704
Hard-to-fill vacancies as a % of employment
1.0 2.4 1.4 1.6 1.0 0.6 1.2 2.0 1.4
Weighted base 72,949 30,883 212,490 28,714 105,759 14,573 34,837 58,010 600,618
Unweighted base 552 365 980 243 703 319 302 320 4,054
Base: All establishments Source: ESS 2002 (IES/MORI)
Note: Where vacancies, hard-to-fill vacancies, or skill-shortage vacancies, are expressed as a proportion of employment, this refers to all employment, not just to employment in those establishments with each type of vacancy respectively
18
Table 2.7 Skill-Shortage Vacancies and Industrial Sector
column percentages/averages/ratios
Sector Manu facturing
Construction Wholesale, Retail &
Hospitality
Transport &
Communications
Finance & Business Services
Public Admini
stration
Education Health & Social
Care
Total
Skill-shortage vacancies
% reporting skill-shortage vacancies 10 15 5 12 7 8 13 10 8
Average number of skill-shortage vacancies 0.2 0.5 0.1 0.3 0.2 0.2 0.2 0.4 0.2
Total skill-shortage vacancies 15,935 13,960 19,135 8,509 18,335 3,625 8,505 20,864 112,735
Skill-shortage vacancies as a % of employment 0.5 1.9 0.5 0.8 0.6 0.3 0.6 0.9 0.6
Skill-shortage vacancies as a % of total vacancies 25.9 48.4 13.2 22.9 18.1 13.7 25.5 26.8 20.6
Weighted base 72,949 30,883 212,490 28,714 105,759 14,573 34,837 58,010 600,618
Unweighted base 552 365 980 243 703 319 302 320 4,054
Base: All establishments Source: ESS 2002 (IES/MORI)
Note: Where vacancies, hard-to-fill vacancies, or skill-shortage vacancies, are expressed as a proportion of employment, this refers to all employment, not just to employment in those establishments with each type of vacancy respectively
19
2.5.1 Vacancies by sector and occupation
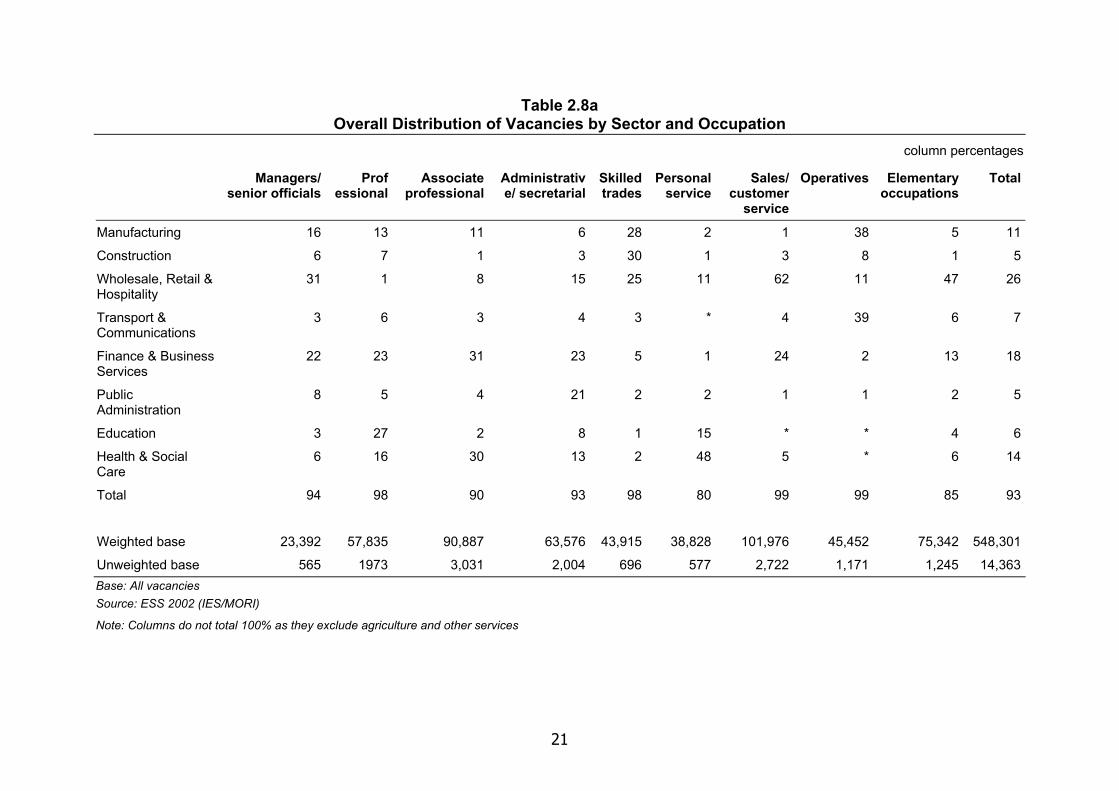
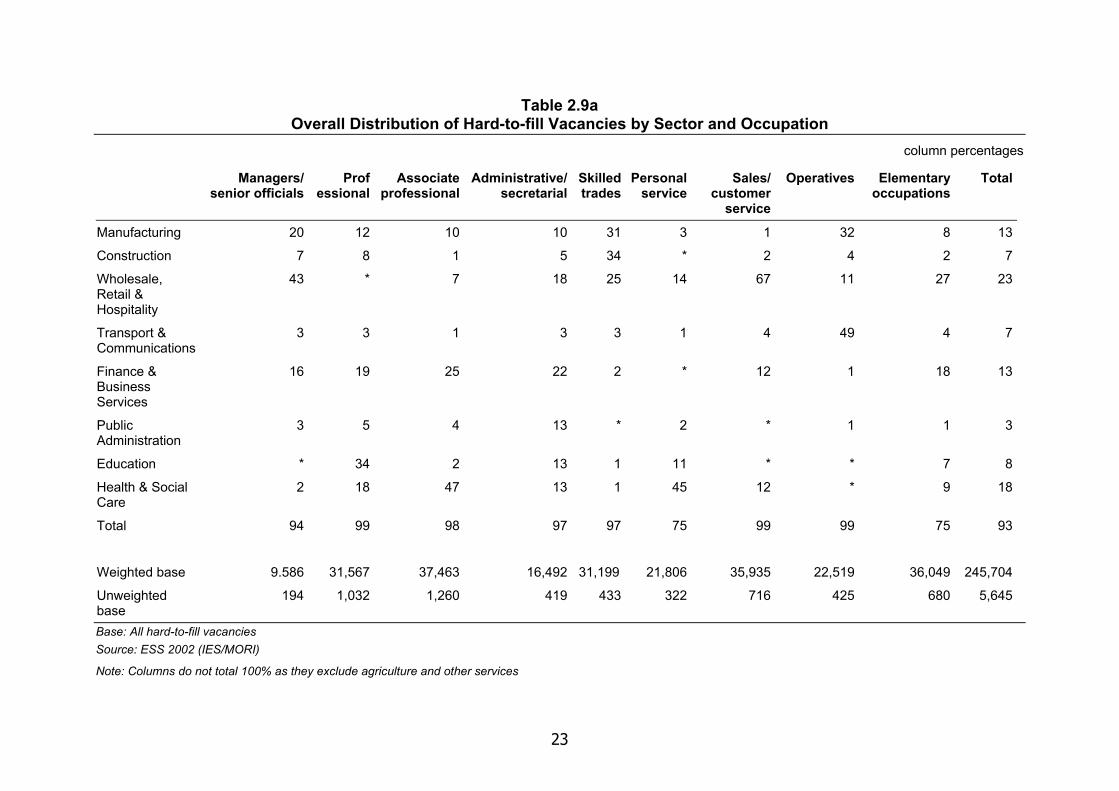
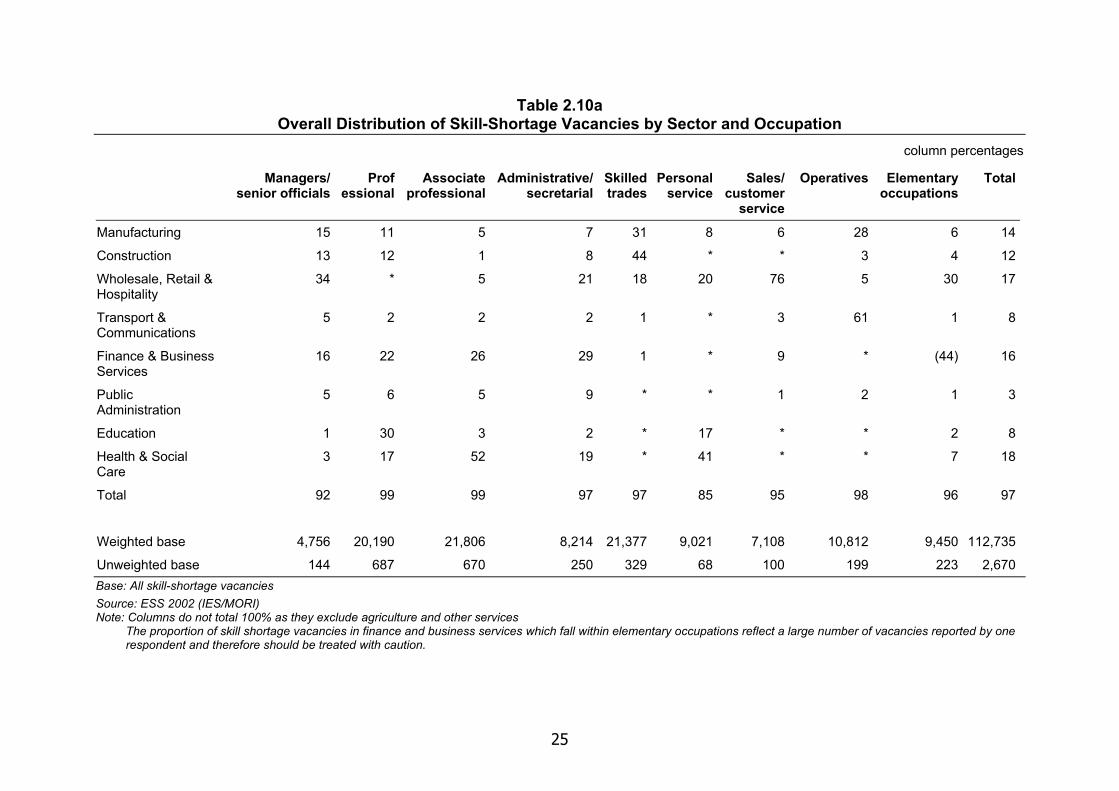
Tables 2.8a, 2.9a and 2.10a look at the distribution of occupational vacancies, hard-to-fill vacancies and skill-shortage vacancies by sector. Around a quarter of all vacancies and hard-to-fill vacancies were in the wholesale, retail and hospitality sector. Sectors with the most skill-shortage vacancies were health and social care (18 per cent), wholesale, retail and hospitality (17 per cent) and finance and business services (16 per cent).
The main points to emerge for each of the main occupational groups are that:
Managerial vacancies were most commonly found in distribution (ie wholesale, retail and hospitality), finance and business services and manufacturing. Hard-to-fill vacancies followed a similar pattern, with almost half in wholesale, retail and hospitality. Skill-shortage vacancies were also centred on these three sectors, with a relatively high proportion in construction as well.
Vacancies, including hard-to-fill and skill-shortage vacancies, for professional occupations were focused on the education, finance and business service sectors and to a lesser extent health and social care.
While the finance and business services and health and social care sectors shared almost two-thirds of all types of vacancies for associate professionals, recruitment difficulties appear to be most acute in the latter. Over half the skill-shortages vacancies for this group of employees were in the health and social care sector.
Administrative and secretarial vacancies were spread across a number of sectors, with approaching a quarter in finance and business services. Hard-to-fill vacancies for these jobs were found in most sectors, although 29 per cent of skill-shortage vacancies were concentrated in finance and business services and just over a fifth in distribution.
Vacancies for skilled trades occupations were heavily centred on construction, manufacturing and distribution. The construction sector had 44 per cent of skill-shortage vacancies for skilled trades.
Around four out of ten personal service skill-shortage vacancies were in the health and social care sector. There are also significant proportions of skill-shortage vacancies for personal service jobs in wholesale, retail and hospitality and education.
Almost two-thirds of sales and customer service vacancies were in retail and hospitality and a further quarter in finance and business services — however it is distribution where the recruitment difficulties appeared to be, accounting for almost four in five skill-shortage vacancies for sales related jobs.
Vacancies for operatives were concentrated in two sectors: transport and communications and manufacturing, with most problems recorded in the former. Some 40 per cent of all vacancies for operative jobs were in transport, but the sector accounted for almost half of the hard-to-fill vacancies for this group and 61 per cent of skill-shortage vacancies.
Vacancies for elementary occupations were centred on the wholesale, retail and hospitality sectors, but the main problems appear to be in the finance and
20
business service sectors. This sector had 13 per cent of all the vacancies for elementary occupations, but 44 per cent of skill-shortage vacancies.
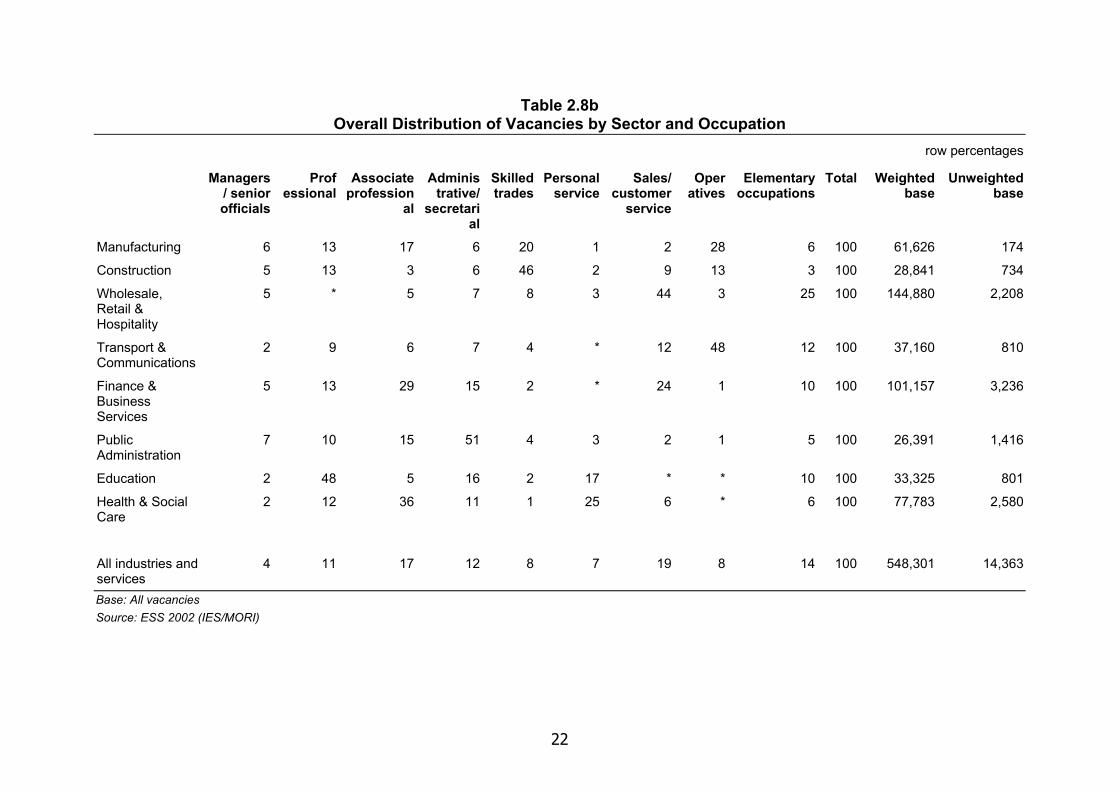
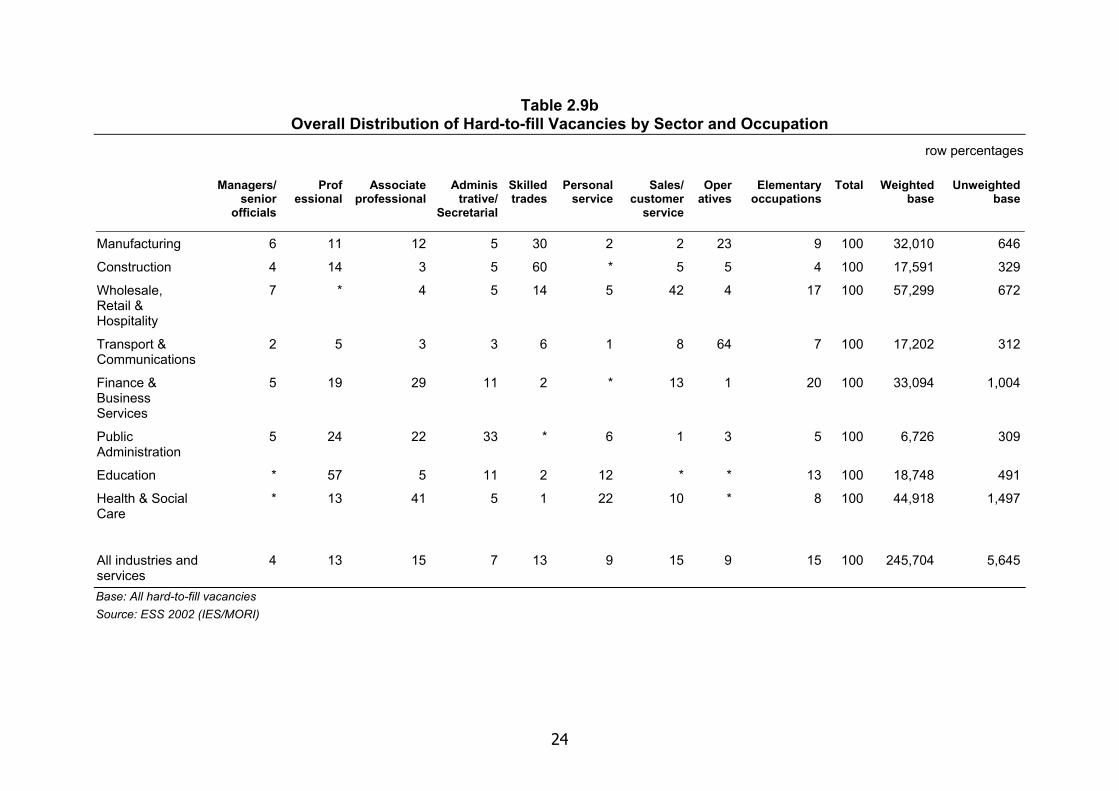
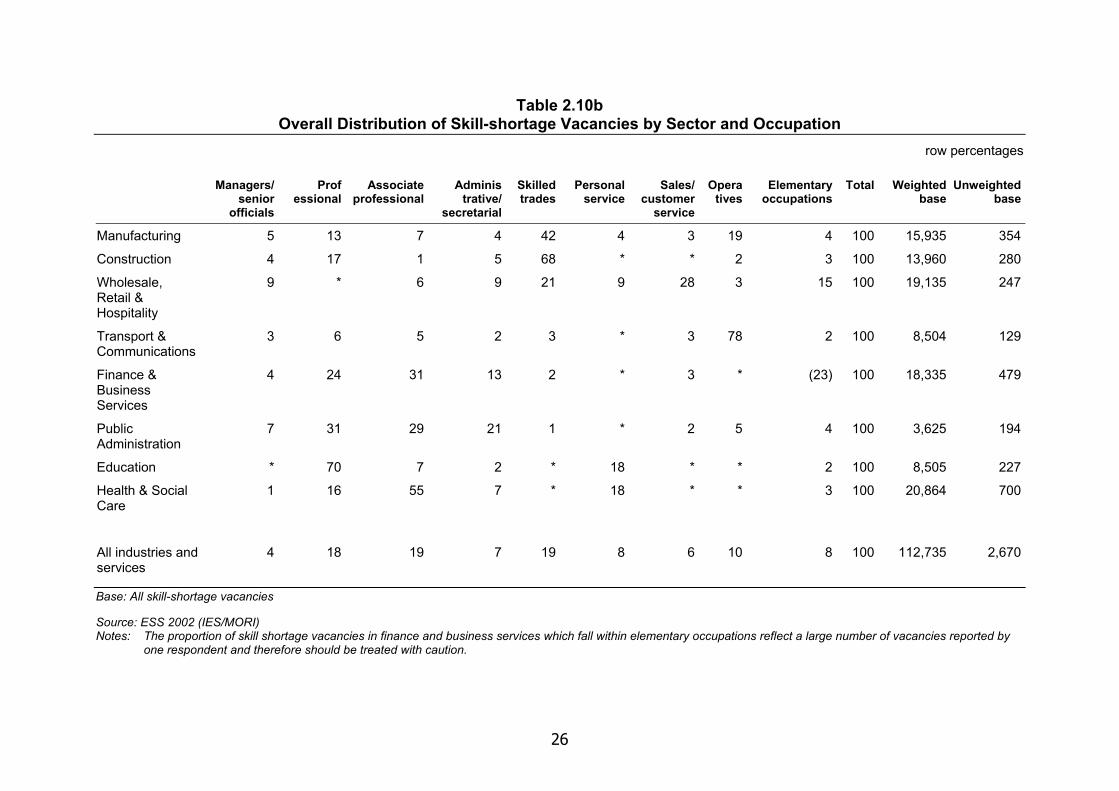
The data on vacancies have also been examined in each of the sectors by occupation (see Tables 2.8b, 2.9b and 2.10b) and the key points to highlight are that:
In manufacturing the key areas of difficulty were among skilled trades and operatives — over half of hard-to-fill and skill-shortage vacancies were for people in these two occupational groups.
Recruitment difficulties among skilled trades were even greater in construction — almost two-thirds of skill-shortage vacancies and 60 per cent of hard-to-fill vacancies were people in this occupational group. A further 17 per cent of skill-shortage vacancies in this sector involved professionals.
Among employers in wholesale, retail and hospitality, the main problem area was sales and customer service occupations — with 42 per cent of hard-to-fill vacancies although only 28 per cent of skill-shortage vacancies.
In transport and communication, difficulties centred on operatives, with over three in four of skill-shortage vacancies in the sector affecting this group.
In finance and business services recruitment difficulties centred on professional and associate professional occupations. 31 per cent of skill shortage vacancies were for associate professional occupations and a further 24 per cent were for professionals.
Skill shortage vacancies in public administration were spread among professional, associate professional and administrative personnel.
In education, the main focus of recruitment difficulties was among professionals, with 70 per cent of all skill-shortage vacancies affecting this group, and further 18 per cent concerning jobs in personal service occupations.
Over half of the skill-shortage vacancies in health and social care involved associate professional positions, with the rest mainly in personal service and professional occupations.
21
Table 2.8a Overall Distribution of Vacancies by Sector and Occupation
column percentages
Managers/ senior officials
Prof essional
Associate professional
Administrative/ secretarial
Skilled trades
Personal service
Sales/ customer
service
Operatives Elementary occupations
Total
Manufacturing 16 13 11 6 28 2 1 38 5 11
Construction 6 7 1 3 30 1 3 8 1 5
Wholesale, Retail & Hospitality
31 1 8 15 25 11 62 11 47 26
Transport & Communications
3 6 3 4 3 * 4 39 6 7
Finance & Business Services
22 23 31 23 5 1 24 2 13 18
Public Administration
8 5 4 21 2 2 1 1 2 5
Education 3 27 2 8 1 15 * * 4 6
Health & Social Care
6 16 30 13 2 48 5 * 6 14
Total 94 98 90 93 98 80 99 99 85 93
Weighted base 23,392 57,835 90,887 63,576 43,915 38,828 101,976 45,452 75,342 548,301
Unweighted base 565 1973 3,031 2,004 696 577 2,722 1,171 1,245 14,363 Base: All vacancies Source: ESS 2002 (IES/MORI)
Note: Columns do not total 100% as they exclude agriculture and other services
22
Table 2.8b Overall Distribution of Vacancies by Sector and Occupation
row percentages
Managers/ senior officials
Prof essional
Associate profession
al
Administrative/
secretarial
Skilled trades
Personal service
Sales/ customer
service
Oper atives
Elementary occupations
Total Weighted base
Unweighted base
Manufacturing 6 13 17 6 20 1 2 28 6 100 61,626 174
Construction 5 13 3 6 46 2 9 13 3 100 28,841 734
Wholesale, Retail & Hospitality
5 * 5 7 8 3 44 3 25 100 144,880 2,208
Transport & Communications
2 9 6 7 4 * 12 48 12 100 37,160 810
Finance & Business Services
5 13 29 15 2 * 24 1 10 100 101,157 3,236
Public Administration
7 10 15 51 4 3 2 1 5 100 26,391 1,416
Education 2 48 5 16 2 17 * * 10 100 33,325 801
Health & Social Care
2 12 36 11 1 25 6 * 6 100 77,783 2,580
All industries and services
4 11 17 12 8 7 19 8 14 100 548,301 14,363
Base: All vacancies Source: ESS 2002 (IES/MORI)
23
Table 2.9a Overall Distribution of Hard-to-fill Vacancies by Sector and Occupation
column percentages
Managers/ senior officials
Prof essional
Associate professional
Administrative/secretarial
Skilled trades
Personal service
Sales/ customer
service
Operatives Elementary occupations
Total
Manufacturing 20 12 10 10 31 3 1 32 8 13
Construction 7 8 1 5 34 * 2 4 2 7
Wholesale, Retail & Hospitality
43 * 7 18 25 14 67 11 27 23
Transport & Communications
3 3 1 3 3 1 4 49 4 7
Finance & Business Services
16 19 25 22 2 * 12 1 18 13
Public Administration
3 5 4 13 * 2 * 1 1 3
Education * 34 2 13 1 11 * * 7 8
Health & Social Care
2 18 47 13 1 45 12 * 9 18
Total 94 99 98 97 97 75 99 99 75 93
Weighted base 9.586 31,567 37,463 16,492 31,199 21,806 35,935 22,519 36,049 245,704
Unweighted base
194 1,032 1,260 419 433 322 716 425 680 5,645
Base: All hard-to-fill vacancies Source: ESS 2002 (IES/MORI)
Note: Columns do not total 100% as they exclude agriculture and other services
24
Table 2.9b Overall Distribution of Hard-to-fill Vacancies by Sector and Occupation
row percentages
Managers/ senior
officials
Prof essional
Associate professional
Adminis trative/
Secretarial
Skilled trades
Personal service
Sales/ customer
service
Oper atives
Elementary occupations
Total Weighted base
Unweighted base
Manufacturing 6 11 12 5 30 2 2 23 9 100 32,010 646
Construction 4 14 3 5 60 * 5 5 4 100 17,591 329
Wholesale, Retail & Hospitality
7 * 4 5 14 5 42 4 17 100 57,299 672
Transport & Communications
2 5 3 3 6 1 8 64 7 100 17,202 312
Finance & Business Services
5 19 29 11 2 * 13 1 20 100 33,094 1,004
Public Administration
5 24 22 33 * 6 1 3 5 100 6,726 309
Education * 57 5 11 2 12 * * 13 100 18,748 491
Health & Social Care
* 13 41 5 1 22 10 * 8 100 44,918 1,497
All industries and services
4 13 15 7 13 9 15 9 15 100 245,704 5,645
Base: All hard-to-fill vacancies Source: ESS 2002 (IES/MORI)
25
Table 2.10a Overall Distribution of Skill-Shortage Vacancies by Sector and Occupation
column percentages
Managers/ senior officials
Prof essional
Associate professional
Administrative/ secretarial
Skilled trades
Personal service
Sales/ customer
service
Operatives Elementary occupations
Total
Manufacturing 15 11 5 7 31 8 6 28 6 14
Construction 13 12 1 8 44 * * 3 4 12
Wholesale, Retail & Hospitality
34 * 5 21 18 20 76 5 30 17
Transport & Communications
5 2 2 2 1 * 3 61 1 8
Finance & Business Services
16 22 26 29 1 * 9 * (44) 16
Public Administration
5 6 5 9 * * 1 2 1 3
Education 1 30 3 2 * 17 * * 2 8
Health & Social Care
3 17 52 19 * 41 * * 7 18
Total 92 99 99 97 97 85 95 98 96 97
Weighted base 4,756 20,190 21,806 8,214 21,377 9,021 7,108 10,812 9,450 112,735
Unweighted base 144 687 670 250 329 68 100 199 223 2,670 Base: All skill-shortage vacancies Source: ESS 2002 (IES/MORI) Note: Columns do not total 100% as they exclude agriculture and other services
The proportion of skill shortage vacancies in finance and business services which fall within elementary occupations reflect a large number of vacancies reported by one respondent and therefore should be treated with caution.
26
Table 2.10b Overall Distribution of Skill-shortage Vacancies by Sector and Occupation
row percentages
Managers/ senior
officials
Prof essional
Associate professional
Adminis trative/
secretarial
Skilled trades
Personal service
Sales/ customer
service
Operatives
Elementary occupations
Total Weighted base
Unweighted base
Manufacturing 5 13 7 4 42 4 3 19 4 100 15,935 354
Construction 4 17 1 5 68 * * 2 3 100 13,960 280
Wholesale, Retail & Hospitality
9 * 6 9 21 9 28 3 15 100 19,135 247
Transport & Communications
3 6 5 2 3 * 3 78 2 100 8,504 129
Finance & Business Services
4 24 31 13 2 * 3 * (23) 100 18,335 479
Public Administration
7 31 29 21 1 * 2 5 4 100 3,625 194
Education * 70 7 2 * 18 * * 2 100 8,505 227
Health & Social Care
1 16 55 7 * 18 * * 3 100 20,864 700
All industries and services
4 18 19 7 19 8 6 10 8 100 112,735 2,670
Base: All skill-shortage vacancies
Source: ESS 2002 (IES/MORI) Notes: The proportion of skill shortage vacancies in finance and business services which fall within elementary occupations reflect a large number of vacancies reported by
one respondent and therefore should be treated with caution.
27
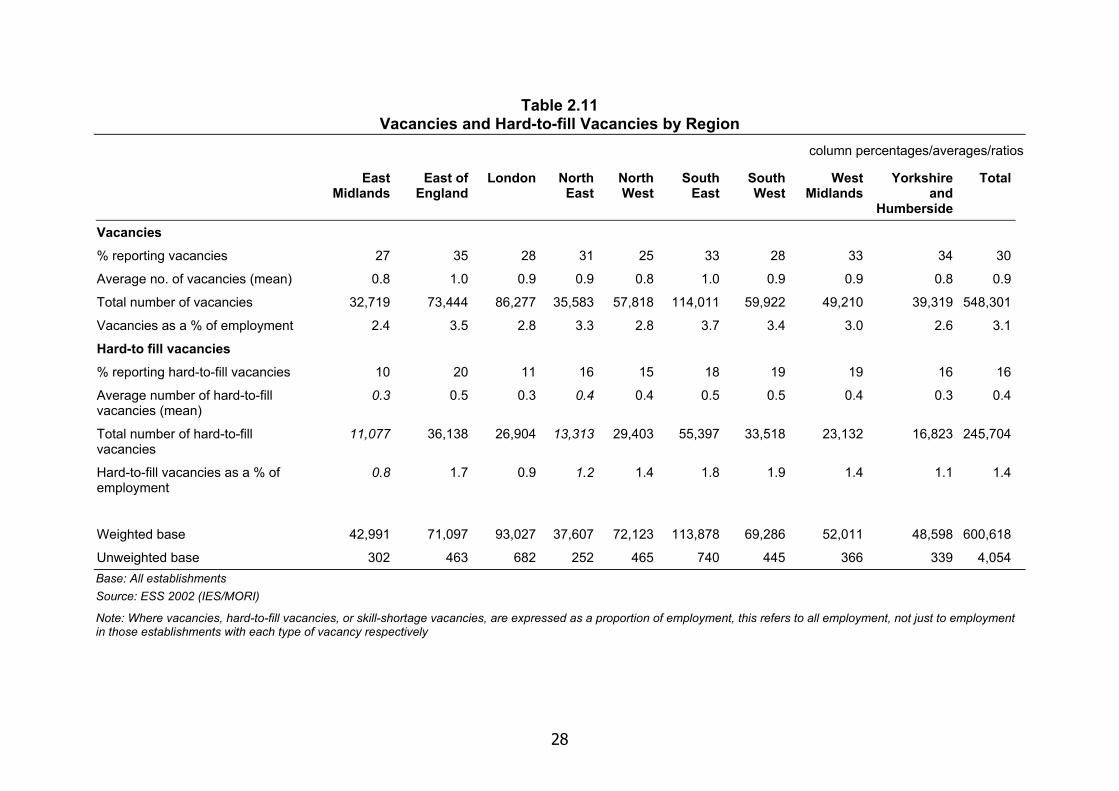
2.6 Vacancies by region The overall incidence of recruitment activity across the regions is broadly similar, ranging from 25 per cent of employers on the North West reporting vacancies, to 35 of those in the East of England looking to fill a job at the time of the survey (Tables 2.11 and 2.12).
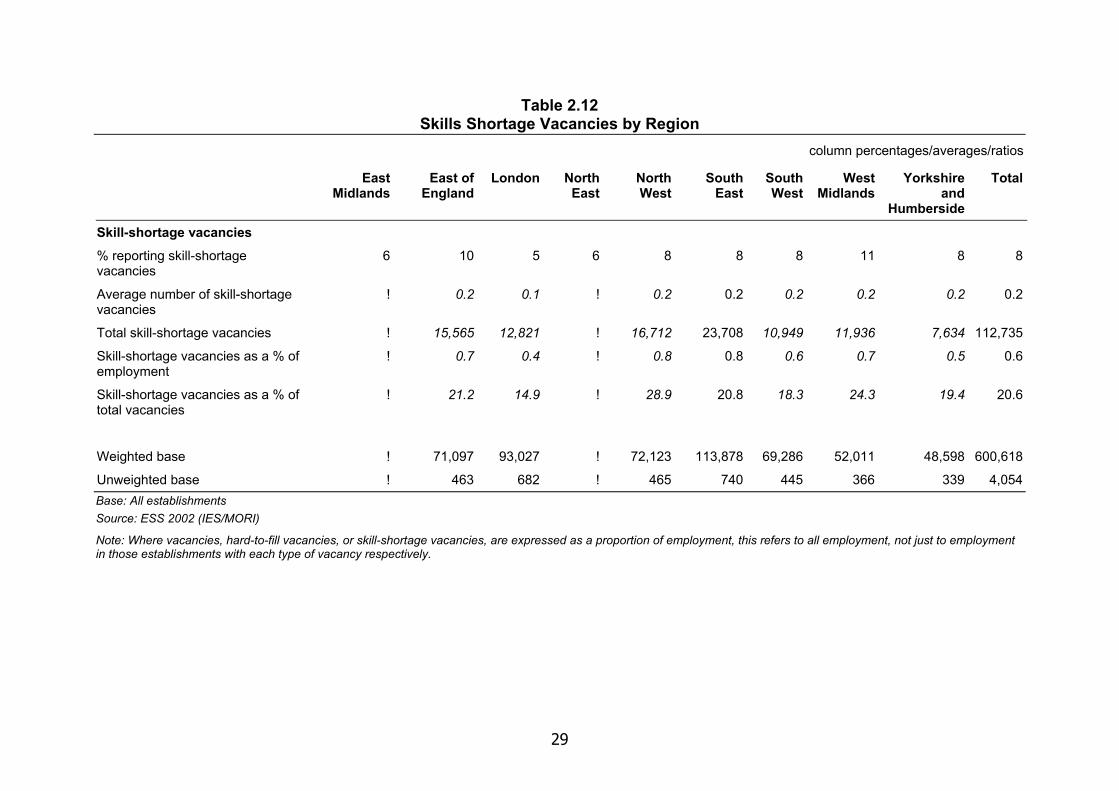
On the face of it, the data on the incidence of recruitment difficulties suggest that most problems were being faced in the West Midlands and the East of England. In each area, a third or more employers reported unfilled vacancies, almost a fifth said that some of those vacancies were hard to fill and a tenth reported that the difficulties were due to skill-related reasons. However, looking at the share of vacancies, it is the South East which had a consistently above average proportion of vacancies, hard-to-fill vacancies and skill shortage vacancies compared to the number employed in the region. London, on the other hand, has a below average incidence of vacancies and the percentage of hard-to-fill and skill shortage vacancies was also well below average.
Data on skill-shortage vacancies cannot be reported in two regions because the low number of cases make the results unreliable.
28
Table 2.11 Vacancies and Hard-to-fill Vacancies by Region
column percentages/averages/ratios
East Midlands
East of England
London North East
North West
South East
South West
West Midlands
Yorkshire and
Humberside
Total
Vacancies % reporting vacancies 27 35 28 31 25 33 28 33 34 30
Average no. of vacancies (mean) 0.8 1.0 0.9 0.9 0.8 1.0 0.9 0.9 0.8 0.9
Total number of vacancies 32,719 73,444 86,277 35,583 57,818 114,011 59,922 49,210 39,319 548,301
Vacancies as a % of employment 2.4 3.5 2.8 3.3 2.8 3.7 3.4 3.0 2.6 3.1
Hard-to fill vacancies % reporting hard-to-fill vacancies 10 20 11 16 15 18 19 19 16 16
Average number of hard-to-fill vacancies (mean)
0.3 0.5 0.3 0.4 0.4 0.5 0.5 0.4 0.3 0.4
Total number of hard-to-fill vacancies
11,077 36,138 26,904 13,313 29,403 55,397 33,518 23,132 16,823 245,704
Hard-to-fill vacancies as a % of employment
0.8 1.7 0.9 1.2 1.4 1.8 1.9 1.4 1.1 1.4
Weighted base 42,991 71,097 93,027 37,607 72,123 113,878 69,286 52,011 48,598 600,618
Unweighted base 302 463 682 252 465 740 445 366 339 4,054 Base: All establishments Source: ESS 2002 (IES/MORI)
Note: Where vacancies, hard-to-fill vacancies, or skill-shortage vacancies, are expressed as a proportion of employment, this refers to all employment, not just to employment in those establishments with each type of vacancy respectively
29
Table 2.12 Skills Shortage Vacancies by Region
column percentages/averages/ratios
East Midlands
East of England
London North East
North West
South East
South West
West Midlands
Yorkshire and
Humberside
Total
Skill-shortage vacancies
% reporting skill-shortage vacancies
6 10 5 6 8 8 8 11 8 8
Average number of skill-shortage vacancies
! 0.2 0.1 ! 0.2 0.2 0.2 0.2 0.2 0.2
Total skill-shortage vacancies ! 15,565 12,821 ! 16,712 23,708 10,949 11,936 7,634 112,735
Skill-shortage vacancies as a % of employment
! 0.7 0.4 ! 0.8 0.8 0.6 0.7 0.5 0.6
Skill-shortage vacancies as a % of total vacancies
! 21.2 14.9 ! 28.9 20.8 18.3 24.3 19.4 20.6
Weighted base ! 71,097 93,027 ! 72,123 113,878 69,286 52,011 48,598 600,618
Unweighted base ! 463 682 ! 465 740 445 366 339 4,054 Base: All establishments Source: ESS 2002 (IES/MORI)
Note: Where vacancies, hard-to-fill vacancies, or skill-shortage vacancies, are expressed as a proportion of employment, this refers to all employment, not just to employment in those establishments with each type of vacancy respectively.
30
2.7 Factors affecting skill-shortage vacancies The incidence of skill-shortage vacancies was examined against the background data collected about the workplace in the survey, eg covering its ownership, growth trend and approach to business strategy and training. The level and range of data collected were not as comprehensive as in the past surveys, but they do give further indications about the characteristics of the workplaces where skill-shortage vacancies are more likely to occur. Although the relationships reported here are statistically significant, a limited multivariate analysis indicated that these factors did not prove particularly important in explaining the incidence of skill shortage vacancies, implying that other factors, perhaps in the external labour market, could be more important.
The main points to emerge from the examination of the characteristics of the workplaces with skill-shortage vacancies are that:
Public sector workplaces had a higher than average incidence of recruitment difficulties (as measured by skill-shortage vacancies): some 16 per cent of the workplaces in the survey were from the public sector, while 19 per cent of those reporting skill-shortage vacancies were public sector establishments.
Growing firms were more likely than those in a steady or contracting state to report recruitment difficulties. Some 44 per cent of establishments reporting skill-shortage vacancies had increased employment over the previous year and 57 per cent had increased financial turnover, compared with 34 per cent and 52 per cent of all establishments respectively. Furthermore establishments with skill-shortage vacancies were more likely to expect growth in employment or sales/budgets in the future than those without recruitment problems.
A further indication of the association between recruitment difficulties and the level of activity in the business or workplace can be seen by the finding that while seven per cent of all workplaces reported that they were ‘at overload’ (which the follow-up interviewees took to mean ‘very busy’ and/or ‘turning down work’), 14 per cent of those with a skill-shortage vacancy were in such a position.
Finally, workplaces concentrating on quality in their business strategy were also more likely than average to experience skill-shortage vacancies, while involvement with Investors in People appeared to make little difference.
Some explorative analyses were done to examine if any of these indicators could explain why certain establishments were experiencing skills shortage vacancies. A regression analysis was undertaken examining all available background characteristics including region, the size of the establishment, the sector and whether the establishment was a private sector business or other. Other possible determinants included were the approximate total sales or budget in the last financial year, if there was a sales and an employment increase or decrease over the last 12 months and if the capacity of the establishment was overloaded or below capacity. Also included were some questions concerning expectations of future sales and employment levels. Given the fact that the (grossed-up) data set contains a large amount of establishments all these factors were significant determinants to explain the occurrence of skills shortage vacancies. However, all these determinants together could explain only six percent in the variance of the skills shortage
31
vacancies. In social research practice an R square under 0.1 (which means explaining less than ten per cent of the variance of the dependent variable) is considered as relatively low and therefore it was decided to conduct no further explorations.
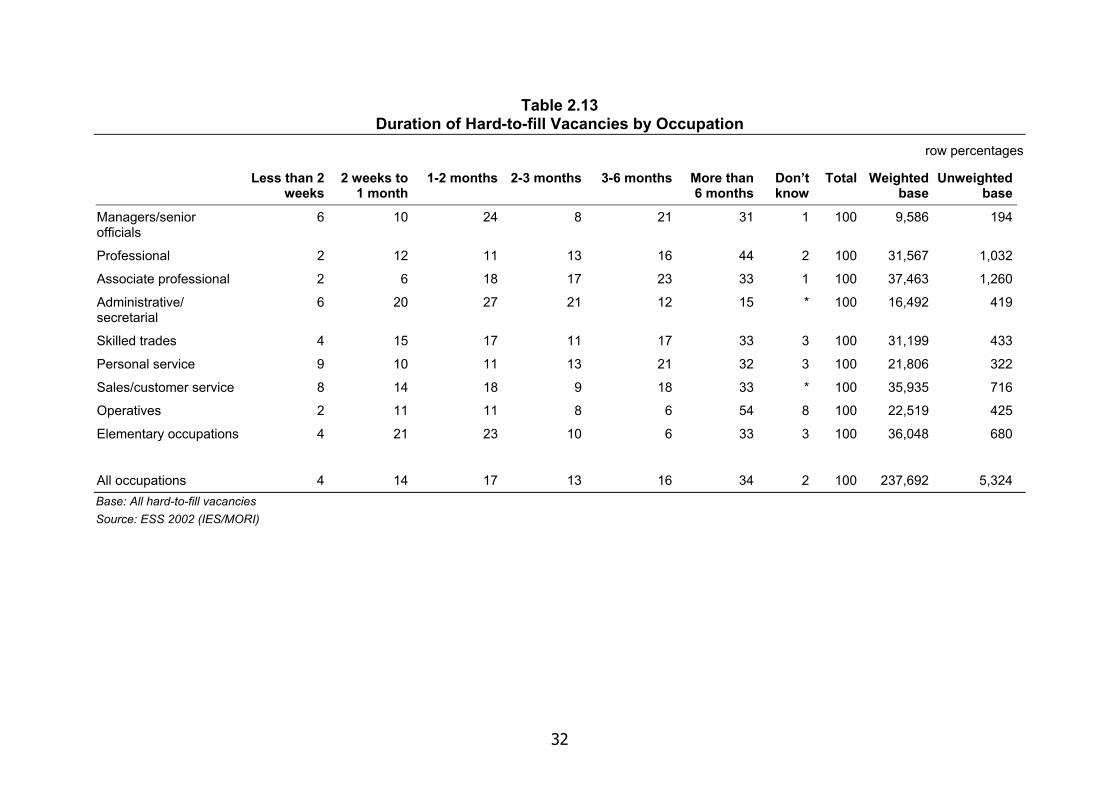
2.8 Duration of hard-to-fill vacancies As in previous Employers Skill Surveys, respondents were asked whether a vacancy they had available had proved hard to fill. As such the concept was self-defined, although the follow-up interviews give us a clearer idea of what respondents understood by the term ‘hard-to-fill’.
In the survey, we asked respondents how long their hard-to-fill vacancy had been open and the results by occupation are set out in Table 2.13. Employers had been trying to fill more than a third of these vacancies for over six months and a half for more than three months.
There is some variation by occupation, with vacancies for professional employees and operatives perhaps proving the hardest to fill in terms of being vacant the longest. In each case 60 per cent of hard-to-fill vacancies had been open for at least three months. Relatively low proportions of vacancies for administrative staff or for people in elementary occupations were open for longer than three months.
32
Table 2.13 Duration of Hard-to-fill Vacancies by Occupation
row percentages
Less than 2 weeks
2 weeks to 1 month
1-2 months 2-3 months 3-6 months More than 6 months
Don’t know
Total Weighted base
Unweighted base
Managers/senior officials
6 10 24 8 21 31 1 100 9,586 194
Professional 2 12 11 13 16 44 2 100 31,567 1,032
Associate professional 2 6 18 17 23 33 1 100 37,463 1,260
Administrative/ secretarial
6 20 27 21 12 15 * 100 16,492 419
Skilled trades 4 15 17 11 17 33 3 100 31,199 433
Personal service 9 10 11 13 21 32 3 100 21,806 322
Sales/customer service 8 14 18 9 18 33 * 100 35,935 716
Operatives 2 11 11 8 6 54 8 100 22,519 425
Elementary occupations 4 21 23 10 6 33 3 100 36,048 680
All occupations 4 14 17 13 16 34 2 100 237,692 5,324 Base: All hard-to-fill vacancies Source: ESS 2002 (IES/MORI)
33
2.9 Skills sought For each hard-to-fill and skill-shortage vacancy, respondents were asked about the specific skills or quality they found difficult to obtain from applicants and the results are reported in Tables 2.14 and 2.15. A common response (in 29 per cent of all hard-to-fill vacancies and 36 per cent of skill-shortage vacancies) referred to particular practical or technical skills (other than IT which was categorised separately) and was the most important area of skill deficiency cited for vacancies among professional, associate professional occupations and skilled trades. In the follow-up interviews it was clear that this definition covered a wide range of skills, eg from wage administration to cavity wall insulation. A few common themes emerged, eg one small manufacturer talked about the technical skills of their machine operators and stressed the importance of:
‘the ability to understand the machine they are using, how it works, the functions of it and how to get the best out of the machine.’
The follow-up interviews also suggested that respondents did not make such a clear distinction between IT-related skills and technical and practical skills as suggested by the detailed survey wording. For instance one respondent from a small construction company who had highlighted the importance of the technical and practical skills of their administrative and secretarial staff, referred to their ability to use computers, e-mailing and administering the website when questioned further.
The other skill areas commonly sought across the range of occupations where the survey identified skill-shortage vacancies included:
Communication skills — which appears in the top three ‘wanted skills’ list among skill-shortage vacancies in almost every occupational category (Table 2.15) and 29 per cent of all skill-shortage vacancies. Respondents to the follow-up interviews often (implicitly) drew a distinction between internal communications — dealing with colleagues, eg ‘explaining what needs doing clearly’, ‘letting each other know what is going on’ and external communications — dealing with the general public or suppliers. With the latter there was often a cross-over in respondents’ minds with customer handling skills (see below). Thus one small retailer defined communication skills as: ‘making sure the customer gets what they want, making sure that they spend their money as quickly as possible, without upsetting them.’ They also thought it meant being able to deal with other staff in the shop. Similar sentiments were expressed by a small restaurant owner when also asked to define communication skills, eg ‘you need to be able to talk to your customers knowledgeably without fumbling. If a customer asks you a question, you need to be able to understand it.’ Finally some respondents drew a distinction between informal communication, eg verbal communication between colleagues or clients and more formal communication, eg ‘ . . . as a charity we go out and promote the work we do, so we have to be able to do so on a one on one basis and also speaking to a group to a fairly large meeting, being able to present the case, as it were.’ When talking about managers, some interviewees linked management skills with communication skills — ‘being able to express yourself clearly and to get the best results from what you actually ask people to do.’
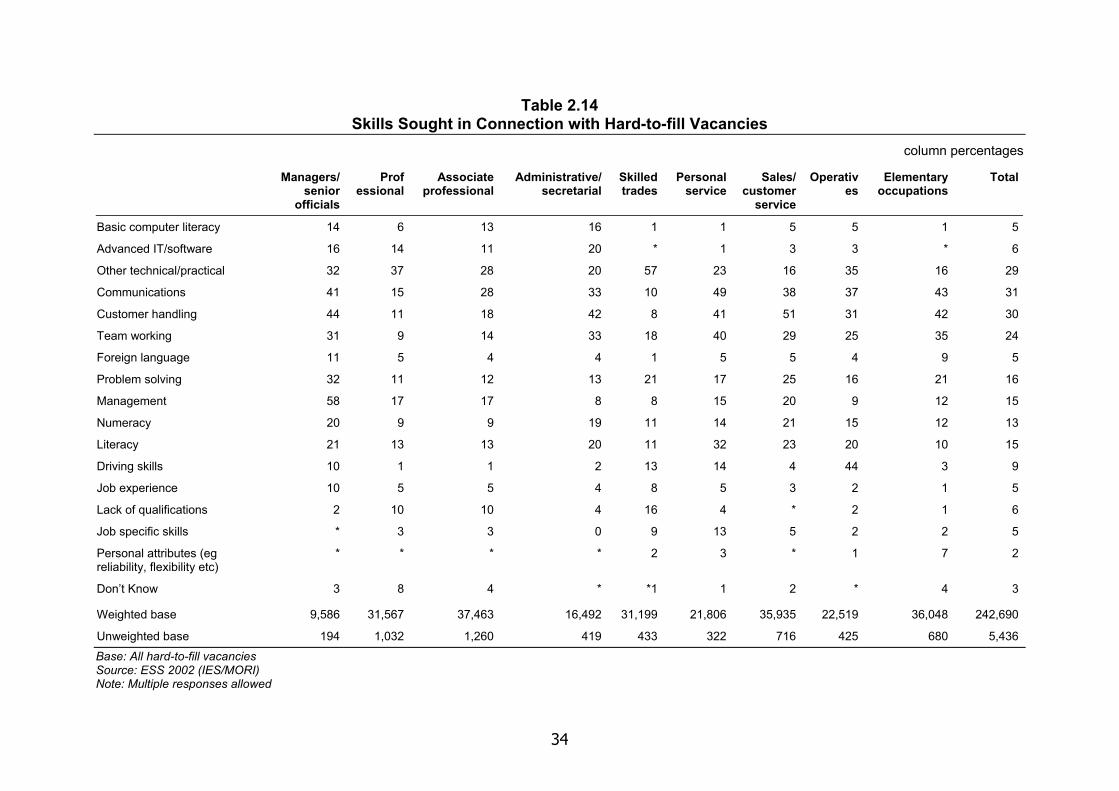
34
Table 2.14 Skills Sought in Connection with Hard-to-fill Vacancies
column percentages
Managers/ senior
officials
Prof essional
Associate professional
Administrative/ secretarial
Skilled trades
Personal service
Sales/ customer
service
Operatives
Elementary occupations
Total
Basic computer literacy 14 6 13 16 1 1 5 5 1 5
Advanced IT/software 16 14 11 20 * 1 3 3 * 6
Other technical/practical 32 37 28 20 57 23 16 35 16 29
Communications 41 15 28 33 10 49 38 37 43 31
Customer handling 44 11 18 42 8 41 51 31 42 30
Team working 31 9 14 33 18 40 29 25 35 24
Foreign language 11 5 4 4 1 5 5 4 9 5
Problem solving 32 11 12 13 21 17 25 16 21 16
Management 58 17 17 8 8 15 20 9 12 15
Numeracy 20 9 9 19 11 14 21 15 12 13
Literacy 21 13 13 20 11 32 23 20 10 15
Driving skills 10 1 1 2 13 14 4 44 3 9
Job experience 10 5 5 4 8 5 3 2 1 5
Lack of qualifications 2 10 10 4 16 4 * 2 1 6
Job specific skills * 3 3 0 9 13 5 2 2 5
Personal attributes (eg reliability, flexibility etc)
* * * * 2 3 * 1 7 2
Don’t Know 3 8 4 * *1 1 2 * 4 3
Weighted base 9,586 31,567 37,463 16,492 31,199 21,806 35,935 22,519 36,048 242,690
Unweighted base 194 1,032 1,260 419 433 322 716 425 680 5,436 Base: All hard-to-fill vacancies Source: ESS 2002 (IES/MORI) Note: Multiple responses allowed
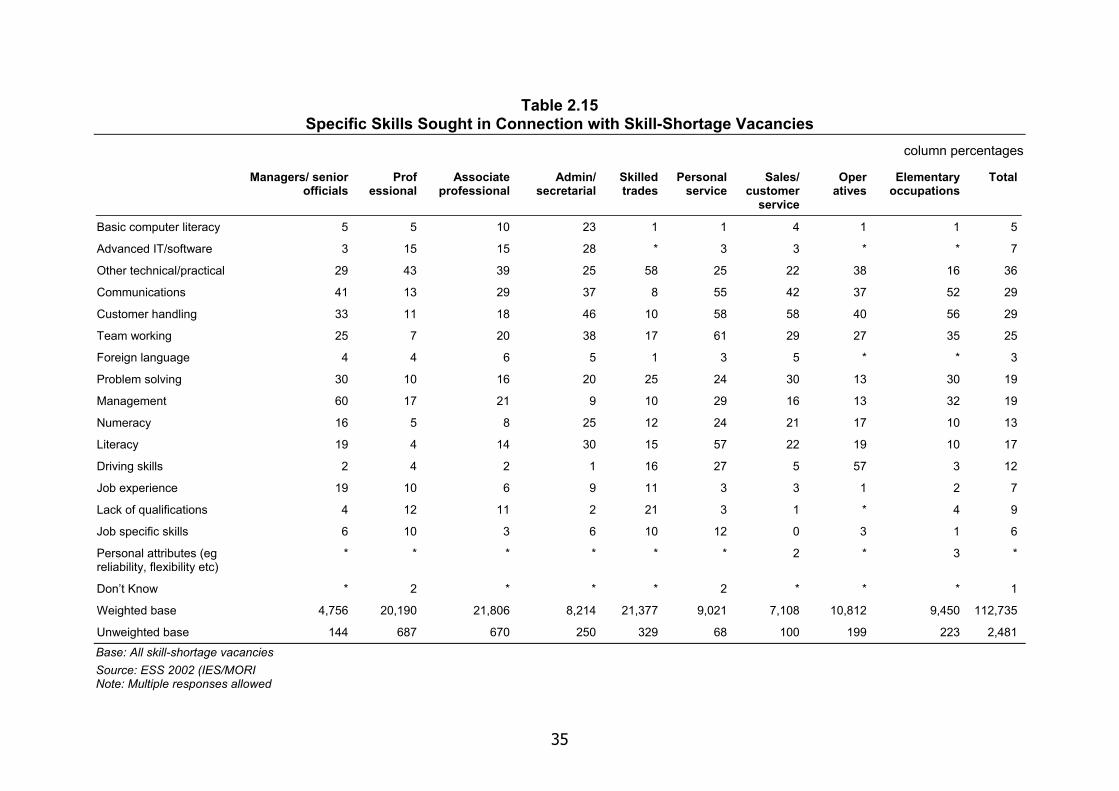
35
Table 2.15 Specific Skills Sought in Connection with Skill-Shortage Vacancies
column percentages
Managers/ senior officials
Prof essional
Associate professional
Admin/ secretarial
Skilled trades
Personal service
Sales/ customer
service
Oper atives
Elementary occupations
Total
Basic computer literacy 5 5 10 23 1 1 4 1 1 5
Advanced IT/software 3 15 15 28 * 3 3 * * 7
Other technical/practical 29 43 39 25 58 25 22 38 16 36
Communications 41 13 29 37 8 55 42 37 52 29
Customer handling 33 11 18 46 10 58 58 40 56 29
Team working 25 7 20 38 17 61 29 27 35 25
Foreign language 4 4 6 5 1 3 5 * * 3
Problem solving 30 10 16 20 25 24 30 13 30 19
Management 60 17 21 9 10 29 16 13 32 19
Numeracy 16 5 8 25 12 24 21 17 10 13
Literacy 19 4 14 30 15 57 22 19 10 17
Driving skills 2 4 2 1 16 27 5 57 3 12
Job experience 19 10 6 9 11 3 3 1 2 7
Lack of qualifications 4 12 11 2 21 3 1 * 4 9
Job specific skills 6 10 3 6 10 12 0 3 1 6
Personal attributes (eg reliability, flexibility etc)
* * * * * * 2 * 3 *
Don’t Know * 2 * * * 2 * * * 1
Weighted base 4,756 20,190 21,806 8,214 21,377 9,021 7,108 10,812 9,450 112,735
Unweighted base 144 687 670 250 329 68 100 199 223 2,481 Base: All skill-shortage vacancies Source: ESS 2002 (IES/MORI Note: Multiple responses allowed
36
Customer handling skills — again 29 per cent overall and particularly important among administrative, sales and elementary jobs. ‘Courtesy and approachability are crucial. The customer has got to feel they can approach a member of staff,’ explained one follow-up interviewee, from a small retail outlet. Another stressed the importance of being able to deal with different types of people and different needs and a third said: ‘You have to make sure they have everything that they expect or that they require. Make sure you listen and be attentive. Make sure they are satisfied.’
Team working skills — 25 per cent overall and again highlighted as a problem for people in administrative and elementary occupations as well as personal service jobs. One follow-up interviewee described teamworking skills as ‘working together to the same aim’ and most others offered similar definitions. Examples of good teamworking included a respondent from a small public sector organisation who referred to: ‘ . . getting on well with everybody, But if you do see something going wrong you have the oomph to say it and also take criticism if you think you have done something wrong.’
In respect of managers, one respondent in the follow-up interviews from a charity said:
‘You need to be able to communicate well with your other team members, which means not only being able to either write or to say what you think, but also to listen and read carefully what people are also saying in the team, so that you are hearing what everybody is saying. And then to be able with the rest of your team to work together to come to a common decision on how you are going to proceed. But also to be able to allocate work within the team and each person to take up their own responsibilities.’
The quote illustrates how inter-related many of these skills can be as the respondent talks about communication, problem-solving and management skills in the context of describing effective team-working.
Problem solving skills — were the attributes employers found difficult to find in 19 per cent of cases of skill-shortage vacancies. Typically this meant taking the initiative when we discussed problem-solving skills further in the follow-up interviews. For instance a public sector respondent defined problem-solving as: ‘taking the initiative to see something needs doing and doing it, whether or not it is directly part of their job’. Others mentioned prioritisation, work planning and dealing with complaints under this heading.
Management skills — short in 19 per cent of skill shortage vacancies, not only important for managers but also among professional and associate professional occupations. In the follow-up interviews most respondents who had identified management skills as a problem said that they mainly referred to the management of people and ‘overseeing and directing the work of others’. One respondent said that their definition would be better entitled ‘coaching skills’.
Among the other skill areas:
37
Driving skills were a key problem area among operatives — an issue in 12 per cent of all skill-shortage vacancies, but accounting for 57 per cent of those for operatives.
Basic computer literacy was only a significant shortage among applicants for some administrative and associate professional jobs and only five per cent overall.
Advanced IT skills were more of an issue again among applicants for administrative, associate professional and also some professional jobs — but still only a problem in seven per cent of all skill-shortage vacancies.
The difference between basic computer literacy and advanced IT skills
In the follow-up interviews we asked respondents who had identified computer skills as an area of difficulty to both describe in more detail the skills they were seeking and to discuss the difference between basic and advanced IT skills. A common pattern emerged across the interviews suggesting that the distinction was reasonably well understood.
Basic computer literacy — was generally thought to refer to ‘knowing your way around a keyboard’ and being able to use standard packages (typically word processing, but also spreadsheets and databases as well and including company-specific bespoke as well as standard proprietary software). In addition many respondents referred to the ability to use e-mail and the internet.
Advanced computer skills — were generally felt to be of a different, higher, order and the distinction between basic literacy and advanced IT skills was generally accepted. While a minority talked in terms of ‘the next stage’ or using ‘more complex software’, more often respondents referred to the ability to manage or maintain systems and the ability to program software in defining this skill set.
Skills such as literacy (eg ‘the construction of sentences, syntax and vocabulary’, being able to ‘write an e-mail’) and numeracy (eg being able to ‘deal with money’) were highlighted as deficient in administrative, personal sales and operative occupations.
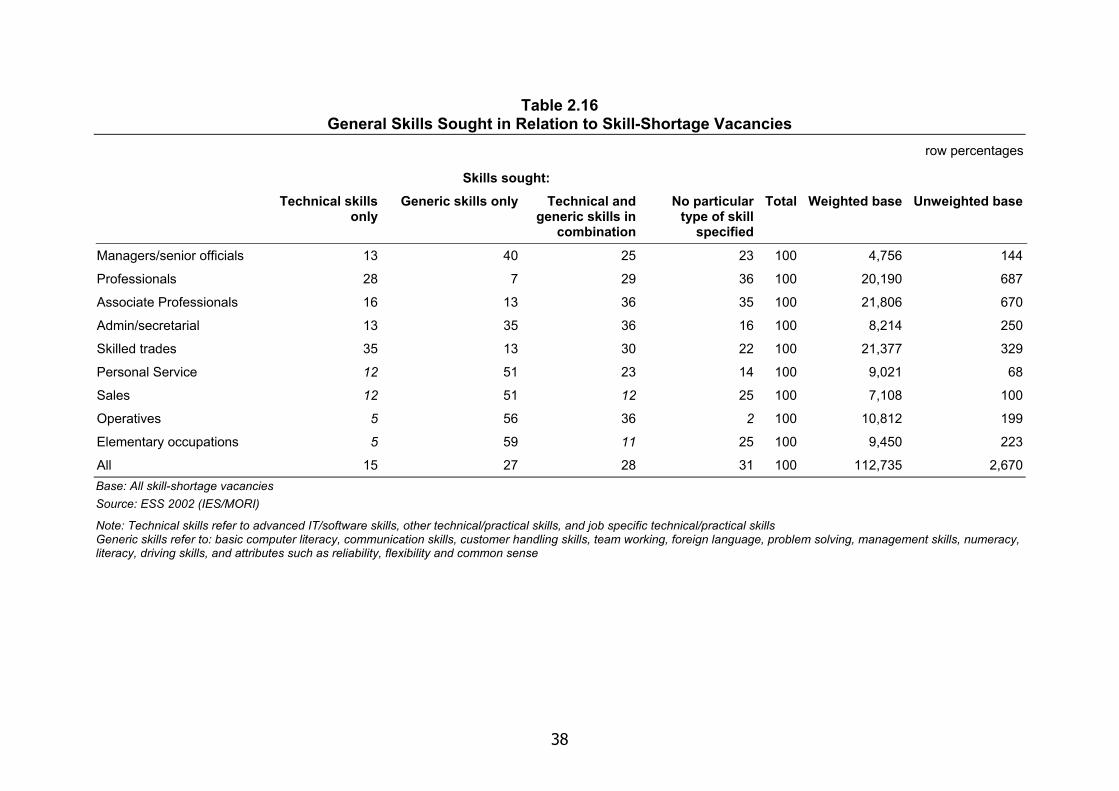
38
Table 2.16 General Skills Sought in Relation to Skill-Shortage Vacancies
row percentages
Skills sought: Technical skills
only Generic skills only Technical and
generic skills in combination
No particular type of skill
specified
Total Weighted base Unweighted base
Managers/senior officials 13 40 25 23 100 4,756 144
Professionals 28 7 29 36 100 20,190 687
Associate Professionals 16 13 36 35 100 21,806 670
Admin/secretarial 13 35 36 16 100 8,214 250
Skilled trades 35 13 30 22 100 21,377 329
Personal Service 12 51 23 14 100 9,021 68
Sales 12 51 12 25 100 7,108 100
Operatives 5 56 36 2 100 10,812 199
Elementary occupations 5 59 11 25 100 9,450 223
All 15 27 28 31 100 112,735 2,670 Base: All skill-shortage vacancies Source: ESS 2002 (IES/MORI)
Note: Technical skills refer to advanced IT/software skills, other technical/practical skills, and job specific technical/practical skills Generic skills refer to: basic computer literacy, communication skills, customer handling skills, team working, foreign language, problem solving, management skills, numeracy, literacy, driving skills, and attributes such as reliability, flexibility and common sense
39
2.9.1 Technical and generic skills
Types of skill are combined in Table 2.16 into:
Technical skills — required to work within a specific occupation; and Generic skills — which are transferable and can be used across occupations.
The definitions are slightly different to those used in the previous survey (ESS 2001) and so are not strictly comparable.
The table shows that almost a third of respondents with a skill-shortage vacancy did not identify any particular skill deficiency. Just over a quarter said that they were short of generic skills only, 15 per cent were short of technical skills only and almost a quarter identified a shortage of technical and generic skills in combination. Technical skills were particularly important in establishments finding difficulties recruiting for vacancies in skilled trades, professional and associate professional occupations, but even in these cases technical and generic skills in combination are generally almost or as important.
Technical skills alone do not seem sufficient to meet the requirements of the vacancies employers are seeking to fill. Generic skills are particularly sought among establishments with skills-shortage vacancies for operatives and elementary occupations and also for sales jobs and management occupations. This suggests that the range of generic skills required might be quite broad as, for example, the range and scope of communications or team working skills required for a manager might be substantially different from those needed to be a machinist (as suggested by some of the comments from the follow-up interviews reported above).
2.10 Causes of recruitment problems According to the survey respondents, the main reason why jobs were hard to fill was a lack of applicants. As in previous surveys for each hard-to-fill vacancy, respondents were asked what were the main causes and the results are set out in Table 2.17 and 2.18. The three most common reasons cited were:
Low number of applicants with skills — 35 per cent of all hard-to-fill vacancies were attributed to this reason and this was a particular reason why vacancies for skilled trades and professional employees were hard to fill.
Low number of applicants generally — was a reason why a third of all vacancies were hard-to-fill, and the cause of difficulties in over 40 per cent of vacancies for professionals and operatives.
Not enough people interested — a quarter of all hard-to-fill vacancies and significantly affecting nearly all occupations apart from managerial and administrative occupations.
Where follow-up interviewees had hard-to-fill vacancies we discussed why that was the case and many interviewees referred to a restriction of supply. For instance, one was looking for legal secretaries and felt ‘it is a fairly over-subscribed sector and there is a shortage of individuals who are suitably qualified’. Similarly an interviewee
40
who was looking for engineers told us that according to their research there was just too few suitably qualified people around for the jobs available ‘and we’re trying to get the best which makes the task doubly difficult.’ In some cases interviewees felt that the shortages were in relatively new areas (eg design engineers), but others were more long-standing (eg legal secretaries, paramedics and HGV drivers). Fewer respondents thought shortages were a contemporary phenomenon associated with high levels of employment.
In the survey, poor terms and conditions were also cited by 19 per cent of cases, particularly for hard-to-fill vacancies among administrative and secretarial, personal service and sales occupations. Such an explanation also came up in the follow-up interviews. In some cases interviewees felt it was a problem of pay:
One retailer argued that:
‘Pay is our biggest problem, we have lost around 24 people to pay in the last two years.’
The shop was located in the town centre, which meant staff had to travel to work. All staff were paid a standard rate and ‘bigger shops are able to offer more money and better packages.’
‘Catering staff vacancies are hard to fill because not enough people come forward for permanent positions. They can earn more money temping.’
For others the problem was the working conditions on offer, particularly hours of work. One interviewee told us of the problem the company had recruiting bus drivers because of the long working hours involved, exacerbated by low unemployment in the local area. Another told us of the problem they had hiring a full-time cleaner because applicants tended to want to work part-time.
In the survey, the answers to this question were used to define skill-shortage vacancies, ie recruitment difficulties attributed to skill-related reasons (ie lack of skills, qualifications or work experience) and the results in Table 2.18 reflect this. Over three-quarters of skill-shortage vacancies were attributed to the low number of applicants with the right skills and a quarter to either lack of work experience and/or qualifications.
While the lack of skilled applicants affected most occupations, the overall balance of the three causes of skill-shortage vacancies varied between occupations. For instance:
In just over a half of cases, skill shortage vacancies among managers were attributed to the lack of work experience and lack of experience was a more commonly cited cause than the lack of suitably qualified applicants. Respondents were less concerned about the low number of appropriately skilled applicants for management vacancies than for any other occupational group.
The lack of work experience was also much more important in the recruitment of sales and customer service staff, where hardly any respondents cited the lack of qualifications as a reason.

41
While a lack of qualifications was generally reported as a more common cause of skill-shortage vacancies, compared with a lack of experience, among the more skilled occupations, eg associate professionals, managers and professionals, it was also more important among operatives and personal service occupations.
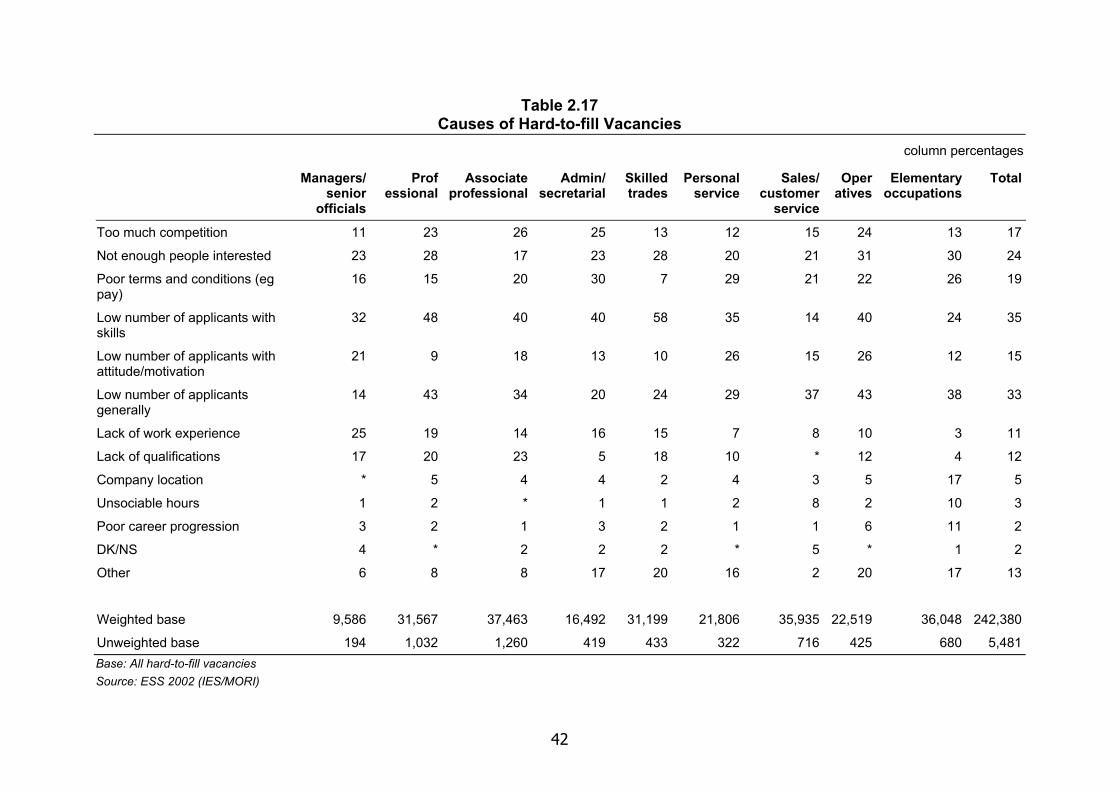
42
Table 2.17 Causes of Hard-to-fill Vacancies
column percentages
Managers/ senior
officials
Prof essional
Associate professional
Admin/ secretarial
Skilled trades
Personal service
Sales/ customer
service
Oper atives
Elementary occupations
Total
Too much competition 11 23 26 25 13 12 15 24 13 17
Not enough people interested 23 28 17 23 28 20 21 31 30 24
Poor terms and conditions (eg pay)
16 15 20 30 7 29 21 22 26 19
Low number of applicants with skills
32 48 40 40 58 35 14 40 24 35
Low number of applicants with attitude/motivation
21 9 18 13 10 26 15 26 12 15
Low number of applicants generally
14 43 34 20 24 29 37 43 38 33
Lack of work experience 25 19 14 16 15 7 8 10 3 11
Lack of qualifications 17 20 23 5 18 10 * 12 4 12
Company location * 5 4 4 2 4 3 5 17 5
Unsociable hours 1 2 * 1 1 2 8 2 10 3
Poor career progression 3 2 1 3 2 1 1 6 11 2
DK/NS 4 * 2 2 2 * 5 * 1 2
Other 6 8 8 17 20 16 2 20 17 13
Weighted base 9,586 31,567 37,463 16,492 31,199 21,806 35,935 22,519 36,048 242,380
Unweighted base 194 1,032 1,260 419 433 322 716 425 680 5,481 Base: All hard-to-fill vacancies Source: ESS 2002 (IES/MORI)
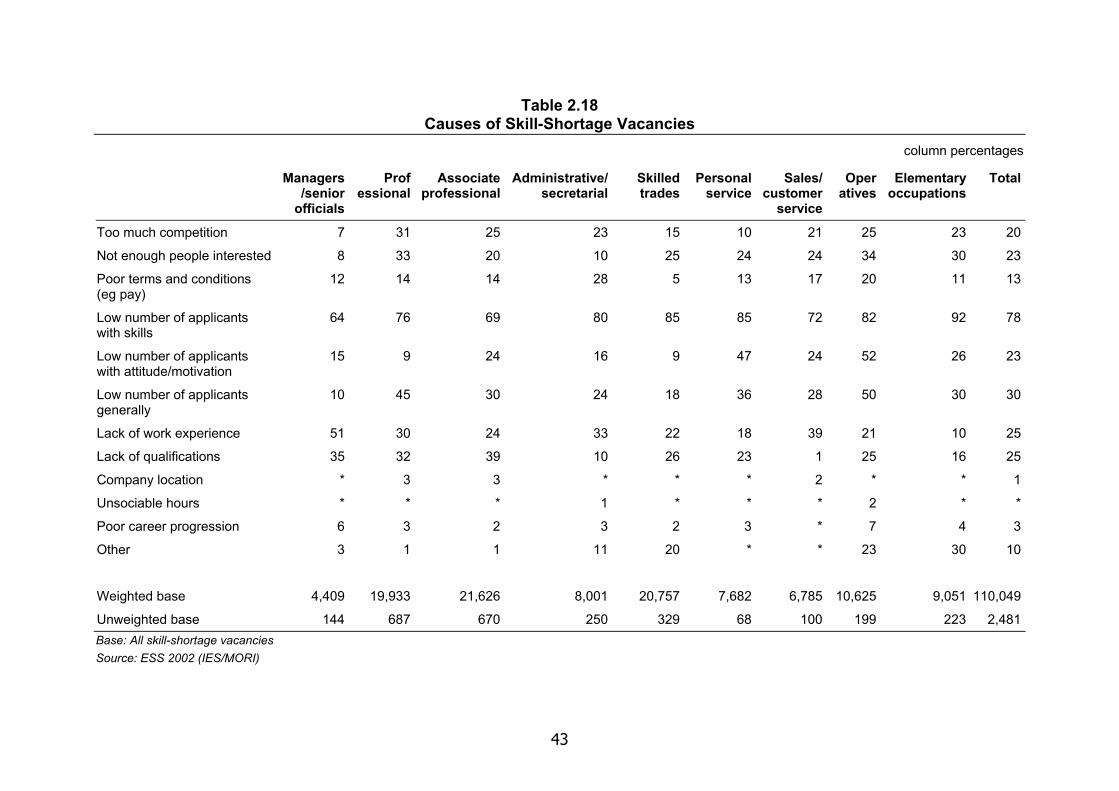
43
Table 2.18 Causes of Skill-Shortage Vacancies
column percentages
Managers/senior
officials
Prof essional
Associate professional
Administrative/ secretarial
Skilled trades
Personal service
Sales/ customer
service
Oper atives
Elementary occupations
Total
Too much competition 7 31 25 23 15 10 21 25 23 20
Not enough people interested 8 33 20 10 25 24 24 34 30 23
Poor terms and conditions (eg pay)
12 14 14 28 5 13 17 20 11 13
Low number of applicants with skills
64 76 69 80 85 85 72 82 92 78
Low number of applicants with attitude/motivation
15 9 24 16 9 47 24 52 26 23
Low number of applicants generally
10 45 30 24 18 36 28 50 30 30
Lack of work experience 51 30 24 33 22 18 39 21 10 25
Lack of qualifications 35 32 39 10 26 23 1 25 16 25
Company location * 3 3 * * * 2 * * 1
Unsociable hours * * * 1 * * * 2 * *
Poor career progression 6 3 2 3 2 3 * 7 4 3
Other 3 1 1 11 20 * * 23 30 10
Weighted base 4,409 19,933 21,626 8,001 20,757 7,682 6,785 10,625 9,051 110,049
Unweighted base 144 687 670 250 329 68 100 199 223 2,481 Base: All skill-shortage vacancies Source: ESS 2002 (IES/MORI)

44
2.11 Employers’ responses The solutions adopted by employers to circumvent their recruitment difficulties are presented in Table 2.19 and 2.20, although they vary little between hard-to-fill and skill shortage vacancies. The key points to emerge from the data on hard-to-fill vacancies are that:
The most common response, across all occupations, was to redouble recruitment efforts either by looking elsewhere (in 72 per cent of hard-to-fill vacancies employers said they had expanded recruitment channels) or by increasing the money they spend on recruitment advertising (74 per cent). This strategy was most commonly adopted for professional staff and a less likely approach to take to hard-to-fill vacancies among skilled trades.
For 51 per cent of hard-to-fill vacancies employers said they had raised salaries — particularly where there was a shortage of recruits to skilled trades. There may be an implication here that employers believe it is not just a matter of trying harder to find the right people, eg through more imaginative recruitment approaches, but the job needs to be made more lucrative to lure the right applicant.
In 47 per cent of hard-to-fill vacancies employers had redefined existing jobs, most commonly where there was a shortage of managers or recruits to elementary occupations, though only 12 per cent said they had sought to substitute people with new technology.
Increased training was adopted as a way to tackle 41 per cent of hard-to-fill vacancies.
The results for skill-shortage vacancies (Table 2.20) followed a similar pattern.
In the follow-up interviews, employers adopted a number of responses, including:
More sophisticated recruitment tactics — for instance one respondent from a large public sector organisation who was looking to fill a professional post, said. ‘We started by advertising in all the relevant trade journals and the national press. This produced very few applicants, so we started mail-shotting individuals with details of the job via the professional association. Colleagues have also used their contacts to talk to people who might be interested, and network at conferences. We have not used head-hunters yet, but this may happen’. Other tactics being adopted by those in the follow-up interviews included:
- Using recruitment agencies for the first time
- Employing personal and professional networks
- Building links with universities to directly recruit staff to professional jobs
- Monitor the patterns of other employers, eg looking to see whether they are laying off staff (large engineering company with shortages in skilled trades and associate professionals).
Change working patterns — another public sector organisation was examining the possibility of suggesting to applicants that they could work partly at home, but had not
45
yet agreed the proportion of time that needed to be spent in the office. Another, transport company, had ‘tried to make the job more attractive by reducing the span of the working day and reducing the gap between shifts, while keeping pay the same.’
Redefining the job — For example, one large manufacturing company provided an example of the problems it had faced recruiting a catering assistant. They tried a number of approaches including agencies, advertising in the local press and word of mouth among their employees, raising the wage rates (marginally), all to no avail. They have now redefined the post from a ‘catering assistant’ to a ‘kitchen porter’, changing the duties from basic food preparation to ‘washing up’ and distributing the food preparation duties around the other staff. The company hoped it would be easier to find some-one to carry out more basic tasks.
Muddling through — a common response among the follow-up interviews was to ‘get by’ and ‘struggle along’ with higher workloads and overtime and occasionally ‘cutting corners’.
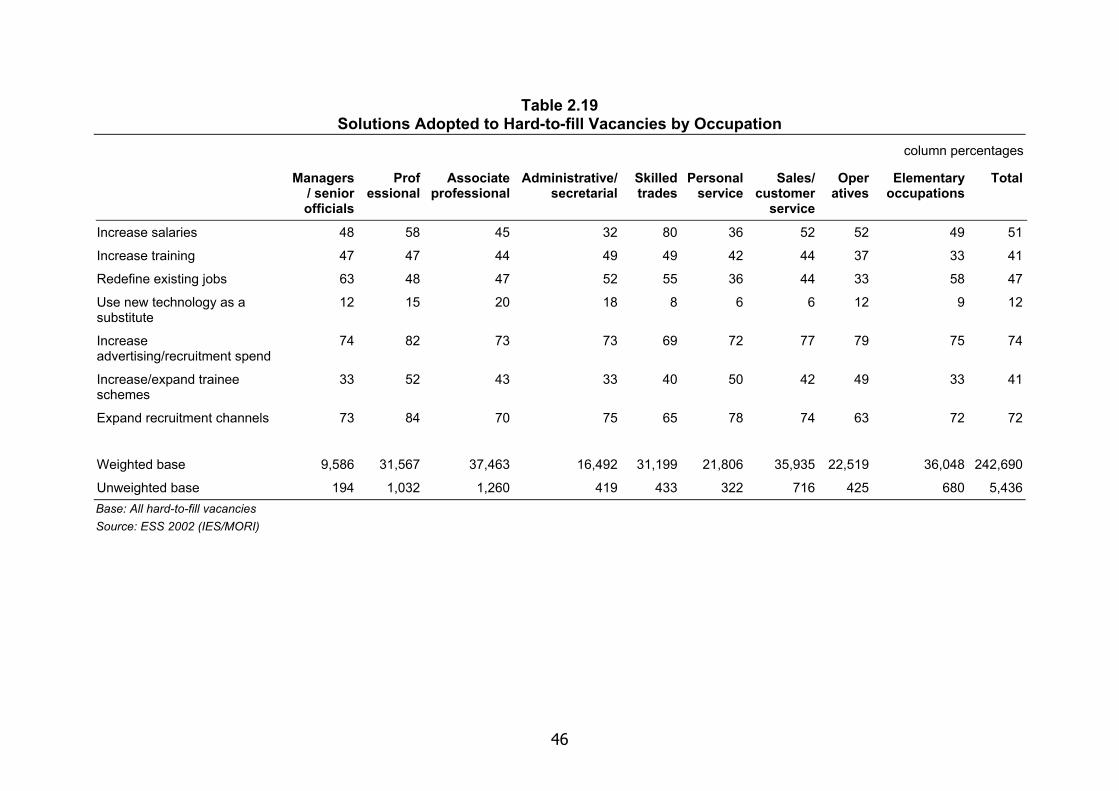
46
Table 2.19 Solutions Adopted to Hard-to-fill Vacancies by Occupation
column percentages
Managers/ senior officials
Prof essional
Associate professional
Administrative/ secretarial
Skilled trades
Personal service
Sales/ customer
service
Oper atives
Elementary occupations
Total
Increase salaries 48 58 45 32 80 36 52 52 49 51
Increase training 47 47 44 49 49 42 44 37 33 41
Redefine existing jobs 63 48 47 52 55 36 44 33 58 47
Use new technology as a substitute
12 15 20 18 8 6 6 12 9 12
Increase advertising/recruitment spend
74 82 73 73 69 72 77 79 75 74
Increase/expand trainee schemes
33 52 43 33 40 50 42 49 33 41
Expand recruitment channels 73 84 70 75 65 78 74 63 72 72
Weighted base 9,586 31,567 37,463 16,492 31,199 21,806 35,935 22,519 36,048 242,690
Unweighted base 194 1,032 1,260 419 433 322 716 425 680 5,436 Base: All hard-to-fill vacancies Source: ESS 2002 (IES/MORI)
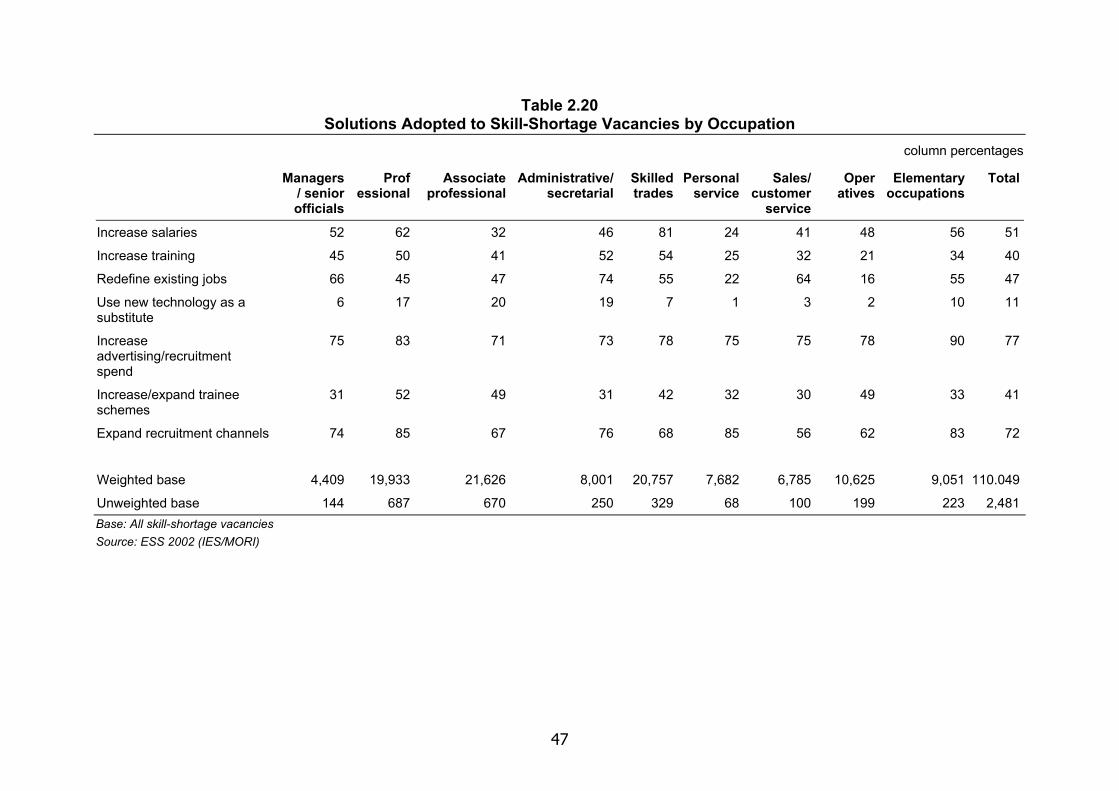
47
Table 2.20 Solutions Adopted to Skill-Shortage Vacancies by Occupation
column percentages
Managers/ senior officials
Prof essional
Associate professional
Administrative/ secretarial
Skilled trades
Personal service
Sales/ customer
service
Oper atives
Elementary occupations
Total
Increase salaries 52 62 32 46 81 24 41 48 56 51
Increase training 45 50 41 52 54 25 32 21 34 40
Redefine existing jobs 66 45 47 74 55 22 64 16 55 47
Use new technology as a substitute
6 17 20 19 7 1 3 2 10 11
Increase advertising/recruitment spend
75 83 71 73 78 75 75 78 90 77
Increase/expand trainee schemes
31 52 49 31 42 32 30 49 33 41
Expand recruitment channels 74 85 67 76 68 85 56 62 83 72
Weighted base 4,409 19,933 21,626 8,001 20,757 7,682 6,785 10,625 9,051 110.049
Unweighted base 144 687 670 250 329 68 100 199 223 2,481 Base: All skill-shortage vacancies Source: ESS 2002 (IES/MORI)
48
2.12 Impact Most employers, 85 per cent, identified a negative impact from their recruitment difficulties. The main impact of recruitment difficulties was that employers experienced difficulties with customer service, although they also resulted in delays in new product development and increased operating costs.
Table 2.21 is based on the number of skill-shortage vacancies for each of the main occupational groups. The data indicate that skill-shortage vacancies among skilled trades were most likely to have a negative impact particularly though creating difficulties with customer service, increased operating costs (perhaps linked to solutions based around raising pay rates — see Table 2.20) and delayed new product development. Difficulties with customer service were also a particular issue associated with skill-shortage vacancies among sales and customer service staff and those in professional and associate professional occupations. The most commonly reported effect of skill-shortage vacancies among managers were difficulties with quality and customer service.
Tables 2.22 and 2.23 are based on responses from establishments with skill shortages and show that:
Over half of the employers, particularly those from larger workplaces, with skill-shortage vacancies said that they had experienced difficulties meeting their customer service objectives.
Almost four in ten had experienced delays in developing new products. Some 37 per cent said their operating costs had increased. Employers from smaller workplaces generally reported fewer impacts, but were
particularly affected by loss of business and withdrawal of products: 38 per cent of respondents from workplaces with between five and 24 employees reported a loss of business, compared with 31 per cent of all employers: while 29 per cent said they had withdrawn products or services, compared with 23 per cent overall.
Difficulties with quality standards was a particular issue for the sectors delivering public services, ie public administration, education, and (to a lesser extent) health and social care.
Skill shortages in construction often led to a loss of business, in addition to — or perhaps because of — difficulties with customer service and increased operating costs.
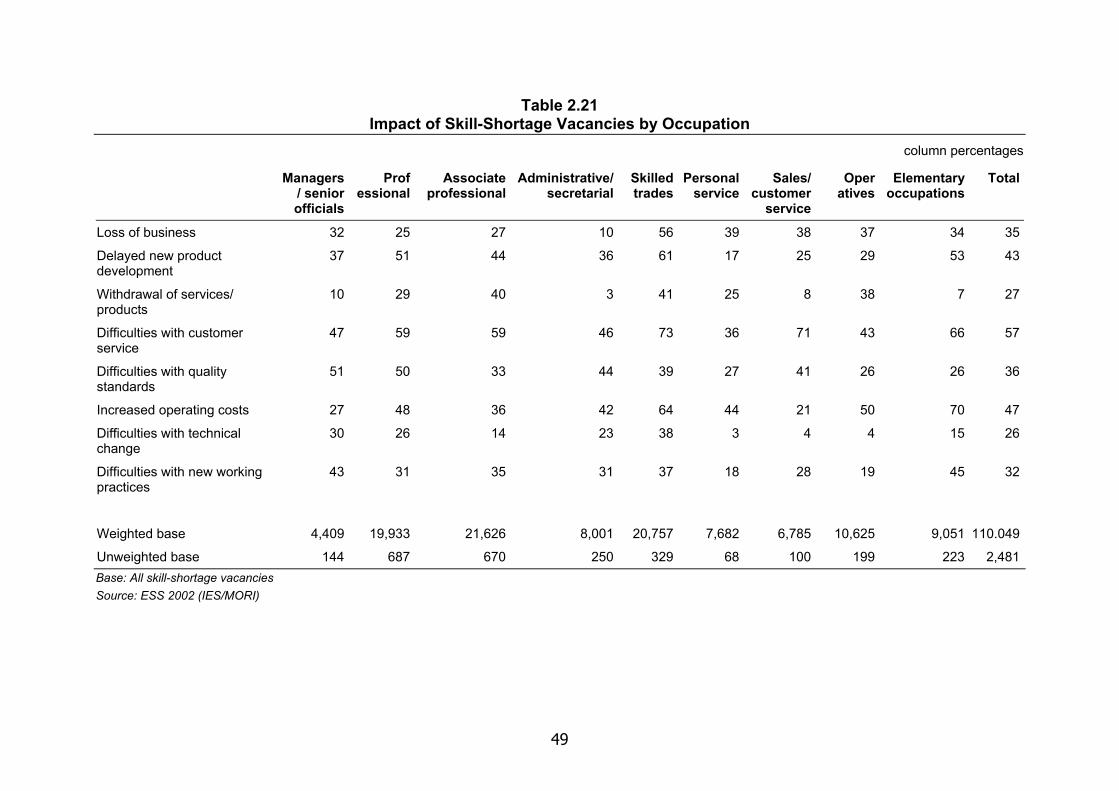
49
Table 2.21 Impact of Skill-Shortage Vacancies by Occupation
column percentages
Managers/ senior officials
Prof essional
Associate professional
Administrative/ secretarial
Skilled trades
Personal service
Sales/ customer
service
Oper atives
Elementary occupations
Total
Loss of business 32 25 27 10 56 39 38 37 34 35
Delayed new product development
37 51 44 36 61 17 25 29 53 43
Withdrawal of services/ products
10 29 40 3 41 25 8 38 7 27
Difficulties with customer service
47 59 59 46 73 36 71 43 66 57
Difficulties with quality standards
51 50 33 44 39 27 41 26 26 36
Increased operating costs 27 48 36 42 64 44 21 50 70 47
Difficulties with technical change
30 26 14 23 38 3 4 4 15 26
Difficulties with new working practices
43 31 35 31 37 18 28 19 45 32
Weighted base 4,409 19,933 21,626 8,001 20,757 7,682 6,785 10,625 9,051 110.049
Unweighted base 144 687 670 250 329 68 100 199 223 2,481 Base: All skill-shortage vacancies Source: ESS 2002 (IES/MORI)
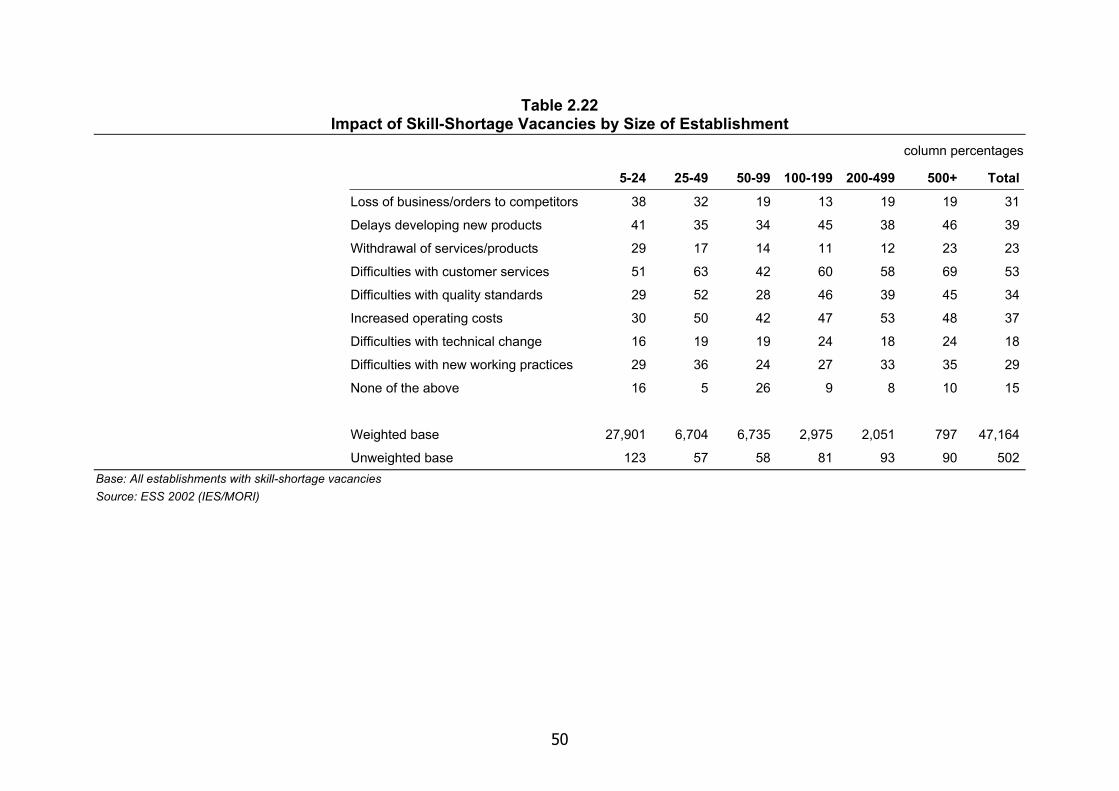
50
Table 2.22 Impact of Skill-Shortage Vacancies by Size of Establishment
column percentages
5-24 25-49 50-99 100-199 200-499 500+ Total
Loss of business/orders to competitors 38 32 19 13 19 19 31
Delays developing new products 41 35 34 45 38 46 39
Withdrawal of services/products 29 17 14 11 12 23 23
Difficulties with customer services 51 63 42 60 58 69 53
Difficulties with quality standards 29 52 28 46 39 45 34
Increased operating costs 30 50 42 47 53 48 37
Difficulties with technical change 16 19 19 24 18 24 18
Difficulties with new working practices 29 36 24 27 33 35 29
None of the above 16 5 26 9 8 10 15
Weighted base 27,901 6,704 6,735 2,975 2,051 797 47,164
Unweighted base 123 57 58 81 93 90 502 Base: All establishments with skill-shortage vacancies Source: ESS 2002 (IES/MORI)
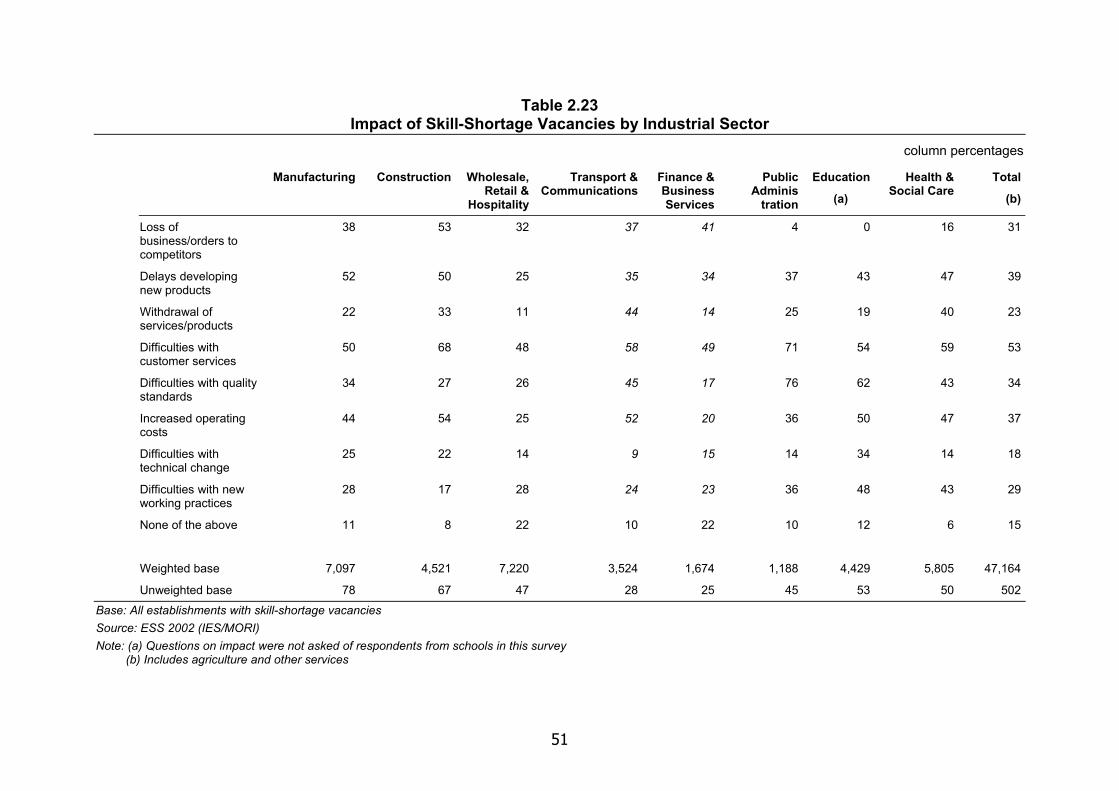
51
Table 2.23 Impact of Skill-Shortage Vacancies by Industrial Sector
column percentages
Manufacturing Construction Wholesale, Retail &
Hospitality
Transport & Communications
Finance & Business Services
Public Adminis
tration
Education
(a)
Health & Social Care
Total
(b)
Loss of business/orders to competitors
38 53 32 37 41 4 0 16 31
Delays developing new products
52 50 25 35 34 37 43 47 39
Withdrawal of services/products
22 33 11 44 14 25 19 40 23
Difficulties with customer services
50 68 48 58 49 71 54 59 53
Difficulties with quality standards
34 27 26 45 17 76 62 43 34
Increased operating costs
44 54 25 52 20 36 50 47 37
Difficulties with technical change
25 22 14 9 15 14 34 14 18
Difficulties with new working practices
28 17 28 24 23 36 48 43 29
None of the above 11 8 22 10 22 10 12 6 15
Weighted base 7,097 4,521 7,220 3,524 1,674 1,188 4,429 5,805 47,164
Unweighted base 78 67 47 28 25 45 53 50 502 Base: All establishments with skill-shortage vacancies Source: ESS 2002 (IES/MORI) Note: (a) Questions on impact were not asked of respondents from schools in this survey (b) Includes agriculture and other services
52
2.13 Key points Some 30 per cent of establishments in the 2002 survey had a vacancy. Some 16
per cent reported that at least some of those vacancies were hard to fill and eight per cent attributed their recruitment difficulty to a lack of skills, experience or qualifications (referred to as skill-shortage vacancies).
In the follow-up interviews it was clear that respondents had a clear idea of what constituted a vacancy and also understood the notion of a hard-to-fill vacancy. We can therefore be fairly confident of this measure as an indicator of recruitment difficulty.
Larger workplaces were far more likely to report hard-to-fill and skill-shortage vacancies than smaller establishments, reflecting the larger number of jobs that may need filling at any one time. Further analysis of the data, taking into account the number of people employed in a workplace, suggests that skill-shortage vacancies formed a higher proportion of all vacancies in smaller workplaces than larger ones.
Skill-shortage vacancies were most likely to occur among professional staff (most commonly in education), associate professionals (in health and social care) and skilled trades (in construction).
Recruitment difficulties were most common in the construction sector, with 15 per cent of workplaces reporting skill-shortage vacancies, compared with eight per cent overall and almost two skill-shortage vacancies for every 100 employees. Two-thirds of the skill-shortage vacancies in this sector were for skilled trades.
Recruitment difficulties were most commonly reported in the West Midlands and the East of England, although the South East had a higher than average number of hard-to-fill and skill-shortage vacancies as a proportion of the number employed.
Other factors associated with skill-shortage vacancies included the level of activity and business strategy — growing workplaces and those operating above full capacity experienced a higher than average share of skill-shortage vacancies as did those establishments with a business strategy focussed on improving quality, although regression analysis suggest such factors only explain a small part of the incidence of skill-shortage vacancies.
When asked what skills they had difficulty finding to fill their skill-shortage vacancies, employers most often cited a range of technical or practical skills, however these were often sought in combination with generic skills such as communications, customer handling and team-working. Over a quarter of employers with skill-shortage vacancies said that they only found generic skills in short supply.
In the follow-up interviews, respondents often saw communication, customer service and team working skills as inter-related and inter-changeable, perhaps suggesting that such terms are ill-defined in many labour market situations.
The main reason why employers thought vacancies were hard to fill was a lack of applicants — either a low number of applicants with the right skills (particularly affecting vacancies for skilled trades and professional occupations), a low number generally or just not enough people interested.
53
Looking at skill-shortage vacancies, while the lack of skilled applicants affected most occupations, a lack of work experience was felt to be the main problem in trying to fill managerial, customer service and sales jobs and a lack of qualifications was a particular issue for managers, associate professionals and professionals.
The main response among employers to their recruitment difficulties was to redouble their recruitment efforts by spending more money on recruitment and/or expanding their recruitment channels.
Problems recruiting employees generally meant employers suffered difficulties with customer service and also delays introducing new products and increased operating costs.
54
3. Skill Gaps
In this chapter attention turns to the internal labour market and skill deficiencies among the existing employees in the public and private sector workplaces in the survey. The chapter begins with an explanation of the concept of skill proficiency at the heart of the estimates of internal skill gaps.
3.1 Skill proficiency As in previous surveys internal skill gaps are measured by asking respondents to the survey to assess the extent their existing employees are ‘fully proficient at their current job’. Thus a workplace is deemed to have a skill gap if the survey respondent reported that fewer than all employees were fully proficient.
What is proficiency?
In the follow-up interviews survey respondents were asked to give their definition of the term ‘proficiency’ and their answers were recorded verbatim. Interviewees were also asked further questions about their understanding of the term and to contrast an employee who was less than proficient with one who was more than fully proficient at what they did (see next box on p. 68.)
A view emerges of employers setting a fairly high hurdle in terms of proficiency. A composite definition, based on the interview evidence, would involve the ability to do the job at least to the required standard of quality and efficiency. Most employers think that someone who is proficient is more than adequate at the task.
The single most common description, volunteered by around a third of the interviewees, of a proficient employee was someone who was ‘able to do the job’, explicitly or implicitly to ‘the required level’. A further quarter not only said that a proficient employee was able to do the job to do the required standard but added a particular quality to which they attached importance for example:
‘able to work on their own’
‘able to fulfil responsibility in a reasonable manner and timescale’
‘able to work without any mistakes or problems’
‘able to do job with minimal supervision and develop the job as they go’
‘able to do the job in the shortest space of time needed and to a very high standard’.
The key aspects of proficiency which were most often cited by interviewees were: quality of performance and efficiency of performance.
The other 40 per cent of interviewees tended to define proficiency in terms of:
55
• A key asset — eg ‘can adapt to change’, ‘knows exactly what to do’
• Possession of appropriate skills — eg ‘has sufficient skills and competences’, ‘properly qualified and effective’; or
• Other definitions or combinations of the above, eg: ‘performing satisfactorily’, ‘somewhere between needing to improve and excellent’, ‘having the skills and knowledge to perform at the maximum of their ability’.
Explicit in such responses, and implicit in many others, is the association of 'proficiency' with 'performance' (eg 'not making mistakes' etc.). In this way many responses were concerned less with the skills their employees possess and more with their ability (and in some cases willingness) to deploy these skills efficiently and effectively. Generally, in response to further questioning, interviewees thought that proficiency was higher than merely ‘adequate’. Two-thirds thought being proficient was better than adequate. One interviewee explained:
‘I wouldn’t tolerate just adequate. They’ve got to give one hundred per cent.’
Another said:
‘I’d like to think we are better than just adequate. We have quite high standards.’
Interviewees from larger sites (with over 100 employees) were more likely to equate proficiency with adequacy. In response to a further question just over a half or our interviewees thought proficiency meant ‘up to standard’ and the rest thought it meant higher than that. Proficiency was not felt to be a steady state. Nearly everyone felt that an employee could be proficient and still improve. ‘There’s always room for improvement’ a number of people said. Similarly almost all interviewees felt that someone could be proficient and gradually deteriorate, eg if they became demotivated or complacent about their work. Many interviewees felt that they did not measure 'proficiency' in a systematic way. While some, generally larger, employers referred to competency statements, job descriptions, appraisals or other performance management systems most, particularly those from smaller workplaces relied on 'observation' and 'watching how they get on' and other informal means.
3.1.1 Counting skill gaps
The survey also asked respondents how widespread any internal deficit was by asking them to estimate the proportion of their employees who were fully proficient. Respondents had a choice of the following options: all; nearly all; over half; some but under half; very few; none. It is important to note that the survey therefore measures the extent of any lack of full proficiency by how many employees are affected, rather than how far they are below proficiency. Research conducted for earlier surveys (ESS 1999) suggested numerical proportions that can be attached to these orders of magnitude. A similar approach has been adopted this time around and therefore:
‘Nearly all’ equates to 85 per cent ‘Over half’ — 65 per cent.
In the follow-up interviews respondents were asked what they understood by the terms ‘nearly all’ and ‘more than half’ by asking them exactly how many of their staff
56
they thought were proficient. The results (albeit from a total of only 25 cases of people who were asked and able to answer the particular questions) provide some evidence to confirm the numbers attached to the terms in previous surveys. The average response given for ‘nearly all’ was around 87.5 per cent; and for ‘more than half’ : 63 per cent. Therefore, in each case, the numerical assessment of the follow-up interviewees was reassuringly close to the 85 per cent and 65 per cent used in previous surveys.
Less reassuring were the respondents who did not have a clear idea of the proportion (four); one who on reflection decided that all his employees were in fact proficient and he had mis-answered the original question; one who thought that all his employees were less than fully proficient (on the grounds that ‘there is always room for improvement’); and two respondents from small employers who when questioned closely gave two different responses to the same question1
3.1.2 Definitions and measures
Two alternative measures of internal skills gaps can be derived from the survey. First the number of establishments with an internal skill deficiency can be estimated, by counting all those who replied that not all their employees were fully proficient. Grossing up the survey data produces an estimate of the number of workplaces affected. This is referred to in the report as the establishment-based measure.
The second measure is employee-based. Using the numerical proportions outlined above (3.1.1) and applying them to the number of employees in the establishment the number of employees who are less than fully proficient can also be estimated.
There are also two possible definitions of skills gaps:
First there is a relatively narrow definition which includes only those workplaces where a significant proportion of the workforce were reported as being less than fully proficient, (ie where an employer reported over half; some but under half; very few or no employees were fully proficient). As in previous reports this is referred to as the ‘narrow measure’ and is the general measure of internal skill gaps used throughout this report, apart from in Table 3.1.
Secondly there is a broader definition, which includes all establishments that reported that at least some of their employees were less than fully proficient (ie they replied that nearly all, over half, some but under half, very few or none of their employees in a particular occupational category were fully proficient). As in past reports this is referred to as the ‘broad measure’.
3.2 The overall extent of skill gaps Grossing up the data from the survey, it is estimated that over two million employees were less than fully proficient in their job, some 12 per cent of all employees in 1 We asked respondents to tell us the proportion of staff and then confirmed that with the actual
numbers (and made our own calculation). Thus one interviewee said that 70 per cent of his employees in elementary occupations were fully proficient and later said that two out of the three were less than proficient!

57
England (Table 3.1), in 59 per cent of workplaces. Using the narrower measure, it is estimated that some 23 per cent of workplaces had internal skills gaps, affecting some 1,076,000 employees.
Table 3.1 also presents data from ESS 2001 (excluding workplaces with under five employees and grossing up the survey using the ABI, ie on the same basis as the current survey) and from ESS 1999 (unadjusted).
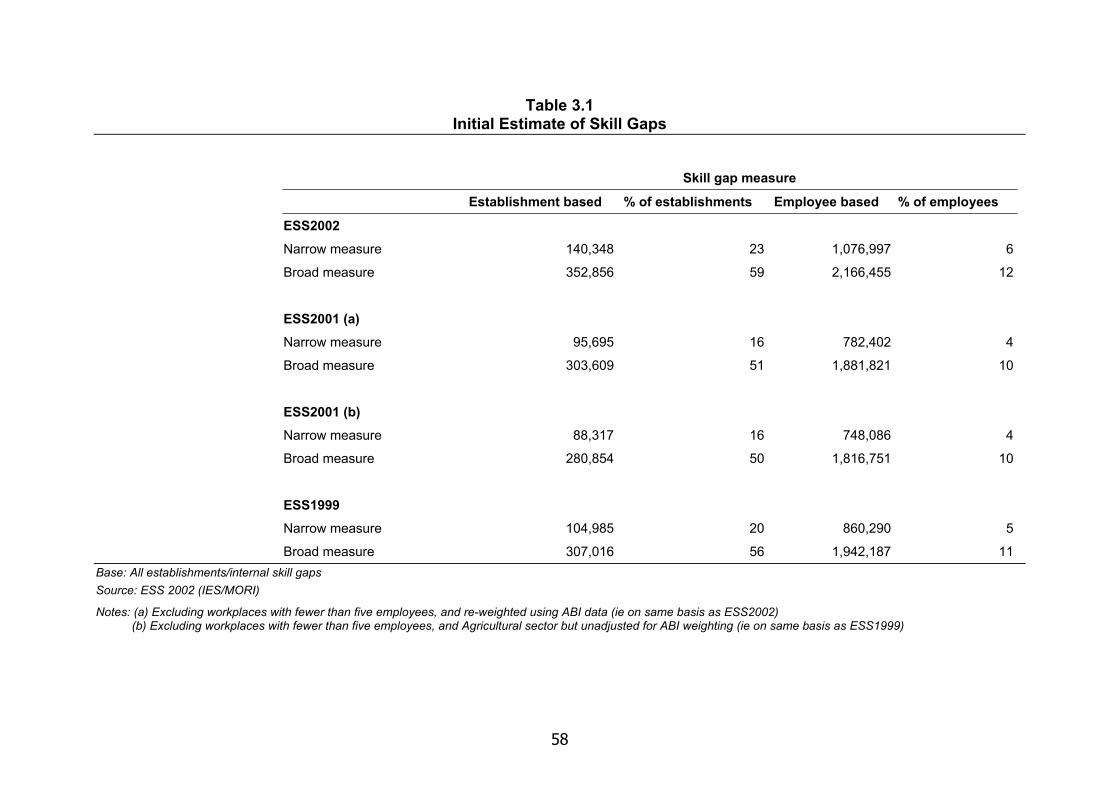
58
Table 3.1 Initial Estimate of Skill Gaps
Skill gap measure
Establishment based % of establishments Employee based % of employees
ESS2002
Narrow measure 140,348 23 1,076,997 6
Broad measure 352,856 59 2,166,455 12
ESS2001 (a) Narrow measure 95,695 16 782,402 4
Broad measure 303,609 51 1,881,821 10
ESS2001 (b) Narrow measure 88,317 16 748,086 4
Broad measure 280,854 50 1,816,751 10
ESS1999 Narrow measure 104,985 20 860,290 5
Broad measure 307,016 56 1,942,187 11 Base: All establishments/internal skill gaps Source: ESS 2002 (IES/MORI)
Notes: (a) Excluding workplaces with fewer than five employees, and re-weighted using ABI data (ie on same basis as ESS2002) (b) Excluding workplaces with fewer than five employees, and Agricultural sector but unadjusted for ABI weighting (ie on same basis as ESS1999)
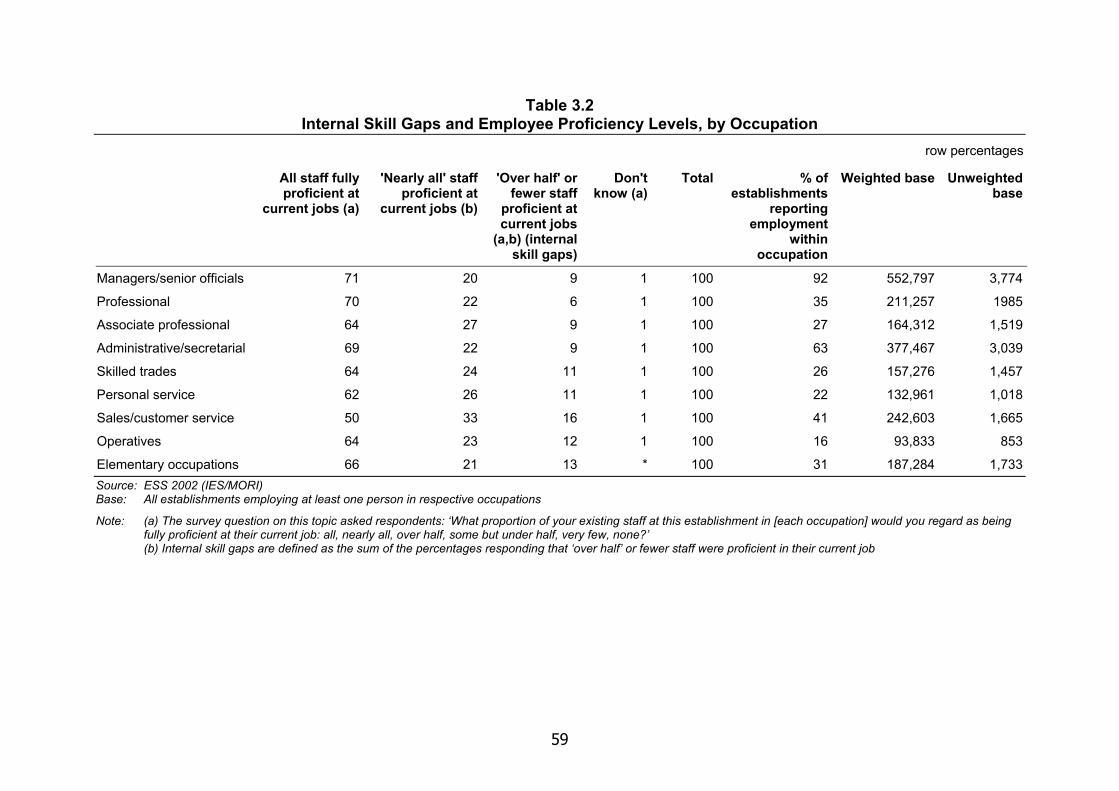
59
Table 3.2 Internal Skill Gaps and Employee Proficiency Levels, by Occupation
row percentages
All staff fully proficient at
current jobs (a)
'Nearly all' staff proficient at
current jobs (b)
'Over half' or fewer staff
proficient at current jobs
(a,b) (internal skill gaps)
Don't know (a)
Total % of establishments
reporting employment
within occupation
Weighted base Unweighted base
Managers/senior officials 71 20 9 1 100 92 552,797 3,774
Professional 70 22 6 1 100 35 211,257 1985
Associate professional 64 27 9 1 100 27 164,312 1,519
Administrative/secretarial 69 22 9 1 100 63 377,467 3,039
Skilled trades 64 24 11 1 100 26 157,276 1,457
Personal service 62 26 11 1 100 22 132,961 1,018
Sales/customer service 50 33 16 1 100 41 242,603 1,665
Operatives 64 23 12 1 100 16 93,833 853
Elementary occupations 66 21 13 * 100 31 187,284 1,733 Source: ESS 2002 (IES/MORI) Base: All establishments employing at least one person in respective occupations
Note: (a) The survey question on this topic asked respondents: ‘What proportion of your existing staff at this establishment in [each occupation] would you regard as being fully proficient at their current job: all, nearly all, over half, some but under half, very few, none?’ (b) Internal skill gaps are defined as the sum of the percentages responding that ‘over half’ or fewer staff were proficient in their current job
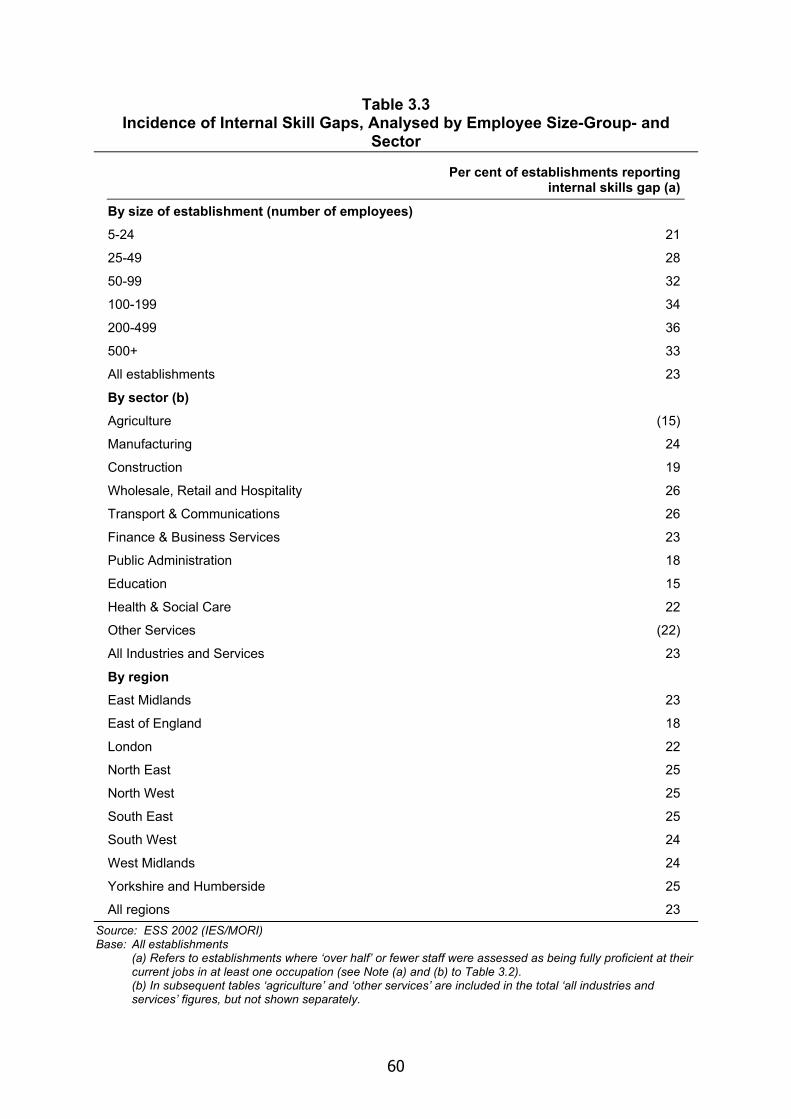
60
Table 3.3 Incidence of Internal Skill Gaps, Analysed by Employee Size-Group- and
Sector
Per cent of establishments reporting internal skills gap (a)
By size of establishment (number of employees)
5-24 21
25-49 28
50-99 32
100-199 34
200-499 36
500+ 33
All establishments 23
By sector (b)
Agriculture (15)
Manufacturing 24
Construction 19
Wholesale, Retail and Hospitality 26
Transport & Communications 26
Finance & Business Services 23
Public Administration 18
Education 15
Health & Social Care 22
Other Services (22)
All Industries and Services 23
By region East Midlands 23
East of England 18
London 22
North East 25
North West 25
South East 25
South West 24
West Midlands 24
Yorkshire and Humberside 25
All regions 23 Source: ESS 2002 (IES/MORI) Base: All establishments
(a) Refers to establishments where ‘over half’ or fewer staff were assessed as being fully proficient at their current jobs in at least one occupation (see Note (a) and (b) to Table 3.2). (b) In subsequent tables ‘agriculture’ and ‘other services’ are included in the total ‘all industries and services’ figures, but not shown separately.
61
The ESS 2002 results suggest that the proportion of workplaces reporting skill gaps (either on the basis of the narrow or broad measures) are significantly higher than the 16 per cent and 51 per cent respectively reported last year and that the numbers of employees affected has also risen. The ESS 2002 level are also higher than, though closer to, those recorded in 1999.
The incidence of skill gaps by occupation, and size and sector of workplace are set out in Tables 3.2 and 3.3 based on the number of establishments. In terms of occupation the biggest area of difficulty was sales and customer service staff. Only 50 per cent of respondents with sales staff reported that all their staff in this occupational category were fully proficient and 16 per cent said that only ‘over half’ or fewer were proficient at their jobs. At the other end of the scale over 70 per cent of employers of professional and managerial staff said that all their staff were fully proficient, i.e. only around 30 per cent reported a skills gap, and fewer than ten per cent reported an internal skills gap under the 'narrow' definition.
Smaller workplaces were least likely to report an internal skills gap (Table 3.3). This may be a function of the measure of an internal skills gap — ie looking at severity in terms of the number of people affected by a skills deficit rather than the extent to which any one individual or group is deficient. There was some evidence in the follow-up interviews to support the feeling expressed in the previous report (Hogarth et al. 2001) that smaller workplaces were more likely than others to consider all their staff proficient. They tended to make less systematic judgements about proficiency, reflecting more informal processes.
Over a third of workplaces with 100 or more employees said that in at least one occupation they had an internal skills gap (ie only over half the employees in those jobs were fully proficient), compared with only around a fifth of respondents from workplaces with between five and 24 employees.
Transport and communications and hospitality and retail were the sectors where employers were most likely to report an internal skills gap and they were least likely in education.
3.2.1 The link between skill gaps and shortages
As in previous ESS surveys there is only a limited overlap between workplaces reporting an external recruitment difficulty in terms of a skills shortage vacancy and those reporting an internal skills gap (Table 3.4). Nearly three-quarters of workplaces did not appear to have a skills supply problem at all. Of those that did, most reported an internal skills gap only. Only three per cent of survey respondents said that they both suffered from an internal skills gap and had at least one skill-shortage vacancy.
3.3 Distribution of internal skills gaps Tables 3.5a, 3.5b, 3.6a, 3.6b, 3.7 and 3.8 look at the distribution of internal skill gaps by size, sector and regional location of workplace and by occupation, based on an estimate of the total number of skills gaps reported (and not the number of establishments reporting gaps). On this basis gaps were most likely to be found in the smallest and largest workplaces in the sample, Thus a quarter of internal skills

62
gaps were in workplaces with between five and 24 employees and 22 per cent in workplaces with 500 or more employees (Table 3.5b). However, internal skill gaps constitute a larger percentage of employment in the largest workplaces (7.1 per cent) than in the smallest sites (5.5 per cent), see Table 3.5a.
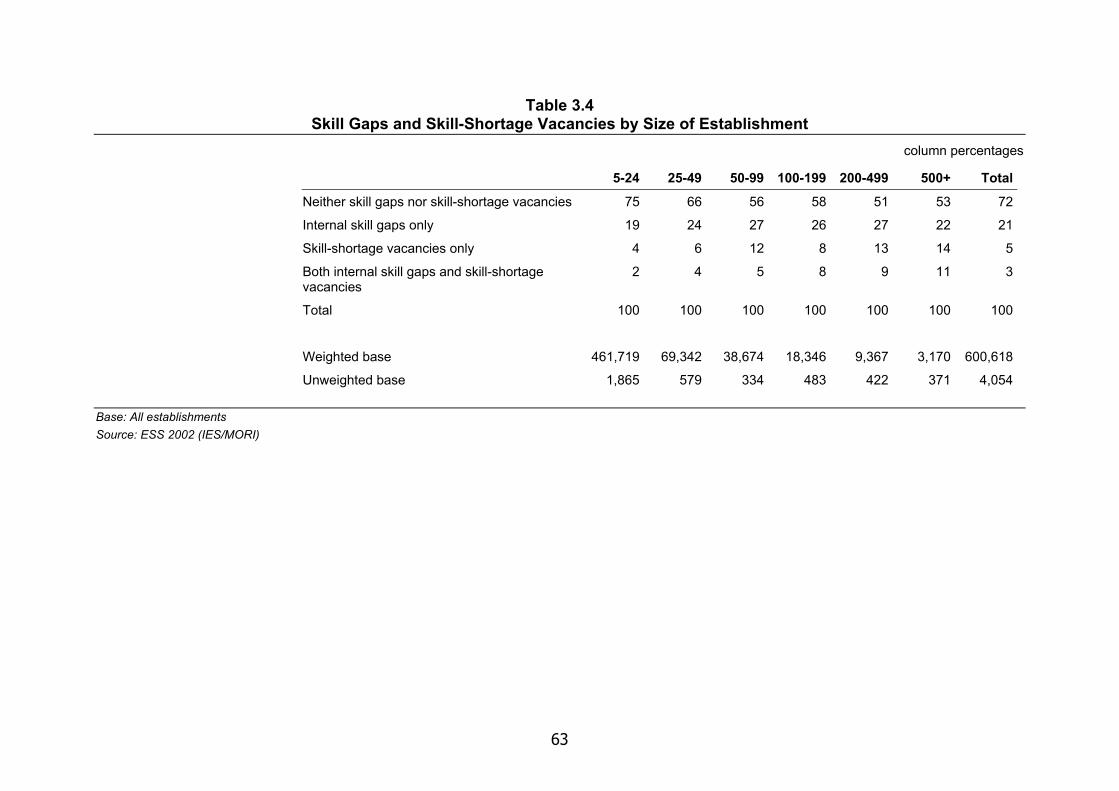
63
Table 3.4 Skill Gaps and Skill-Shortage Vacancies by Size of Establishment
column percentages
5-24 25-49 50-99 100-199 200-499 500+ Total
Neither skill gaps nor skill-shortage vacancies 75 66 56 58 51 53 72
Internal skill gaps only 19 24 27 26 27 22 21
Skill-shortage vacancies only 4 6 12 8 13 14 5
Both internal skill gaps and skill-shortage vacancies
2 4 5 8 9 11 3
Total 100 100 100 100 100 100 100
Weighted base 461,719 69,342 38,674 18,346 9,367 3,170 600,618
Unweighted base 1,865 579 334 483 422 371 4,054
Base: All establishments Source: ESS 2002 (IES/MORI)
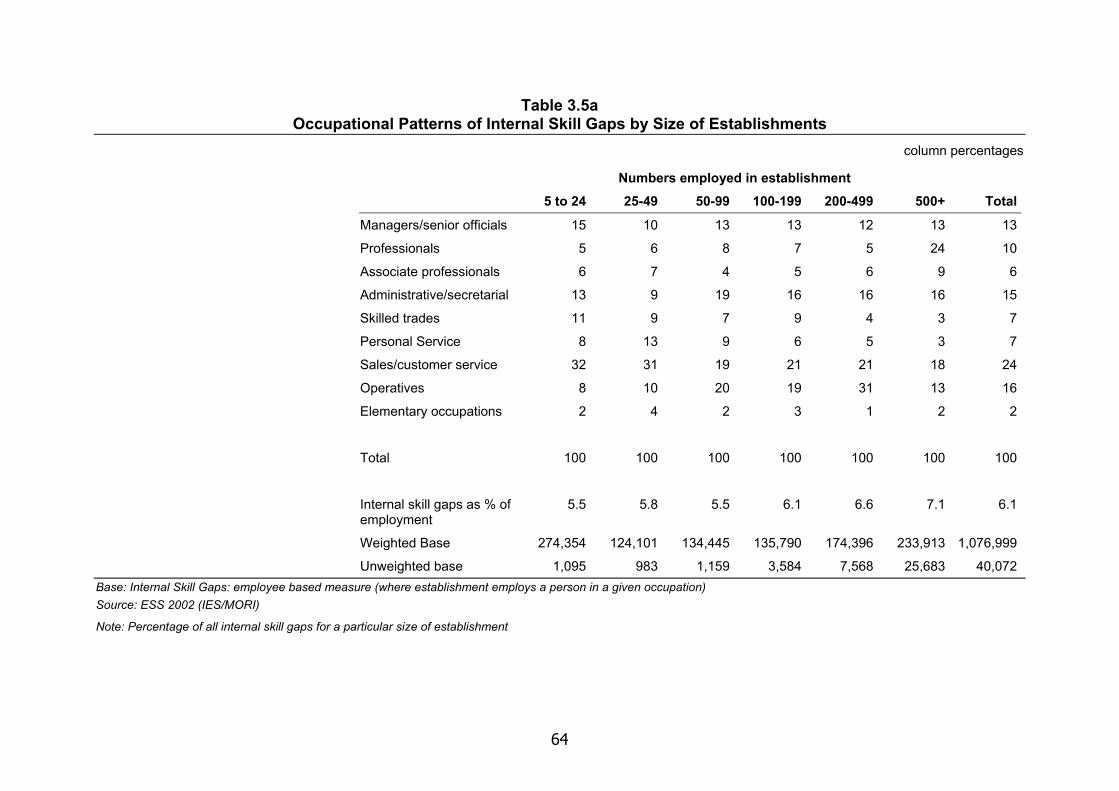
64
Table 3.5a Occupational Patterns of Internal Skill Gaps by Size of Establishments
column percentages
Numbers employed in establishment 5 to 24 25-49 50-99 100-199 200-499 500+ Total
Managers/senior officials 15 10 13 13 12 13 13
Professionals 5 6 8 7 5 24 10
Associate professionals 6 7 4 5 6 9 6
Administrative/secretarial 13 9 19 16 16 16 15
Skilled trades 11 9 7 9 4 3 7
Personal Service 8 13 9 6 5 3 7
Sales/customer service 32 31 19 21 21 18 24
Operatives 8 10 20 19 31 13 16
Elementary occupations 2 4 2 3 1 2 2
Total 100 100 100 100 100 100 100
Internal skill gaps as % of employment
5.5 5.8 5.5 6.1 6.6 7.1 6.1
Weighted Base 274,354 124,101 134,445 135,790 174,396 233,913 1,076,999
Unweighted base 1,095 983 1,159 3,584 7,568 25,683 40,072 Base: Internal Skill Gaps: employee based measure (where establishment employs a person in a given occupation) Source: ESS 2002 (IES/MORI)
Note: Percentage of all internal skill gaps for a particular size of establishment
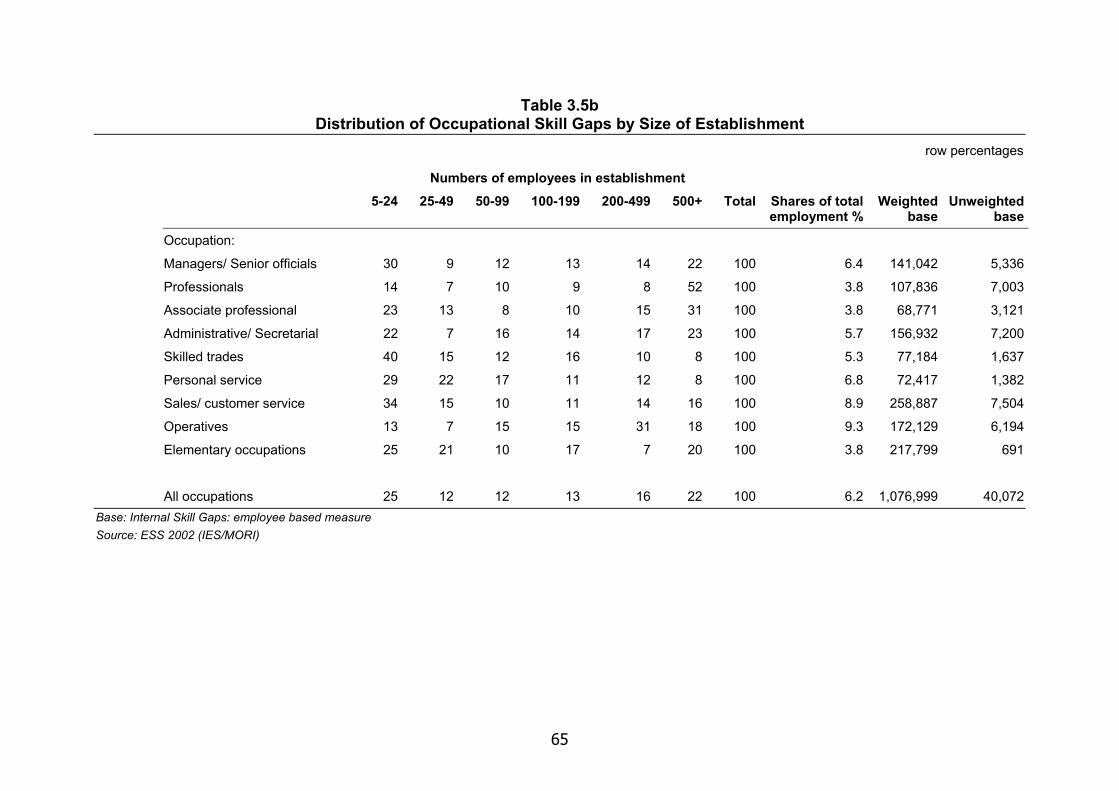
65
Table 3.5b Distribution of Occupational Skill Gaps by Size of Establishment
row percentages
Numbers of employees in establishment 5-24 25-49 50-99 100-199 200-499 500+ Total Shares of total
employment % Weighted
base Unweighted
base
Occupation:
Managers/ Senior officials 30 9 12 13 14 22 100 6.4 141,042 5,336
Professionals 14 7 10 9 8 52 100 3.8 107,836 7,003
Associate professional 23 13 8 10 15 31 100 3.8 68,771 3,121
Administrative/ Secretarial 22 7 16 14 17 23 100 5.7 156,932 7,200
Skilled trades 40 15 12 16 10 8 100 5.3 77,184 1,637
Personal service 29 22 17 11 12 8 100 6.8 72,417 1,382
Sales/ customer service 34 15 10 11 14 16 100 8.9 258,887 7,504
Operatives 13 7 15 15 31 18 100 9.3 172,129 6,194
Elementary occupations 25 21 10 17 7 20 100 3.8 217,799 691
All occupations 25 12 12 13 16 22 100 6.2 1,076,999 40,072 Base: Internal Skill Gaps: employee based measure Source: ESS 2002 (IES/MORI)
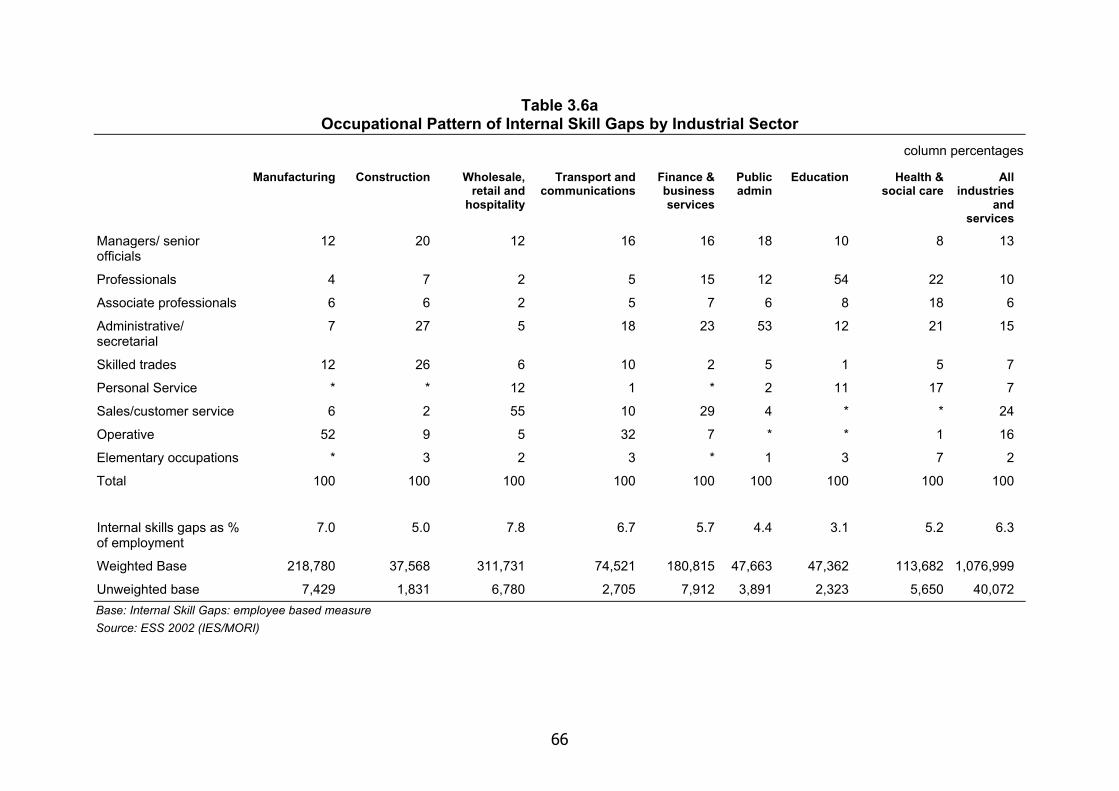
66
Table 3.6a Occupational Pattern of Internal Skill Gaps by Industrial Sector
column percentages
Manufacturing Construction Wholesale, retail and
hospitality
Transport and communications
Finance & business services
Public admin
Education Health & social care
All industries
and services
Managers/ senior officials
12 20 12 16 16 18 10 8 13
Professionals 4 7 2 5 15 12 54 22 10
Associate professionals 6 6 2 5 7 6 8 18 6
Administrative/ secretarial
7 27 5 18 23 53 12 21 15
Skilled trades 12 26 6 10 2 5 1 5 7
Personal Service * * 12 1 * 2 11 17 7
Sales/customer service 6 2 55 10 29 4 * * 24
Operative 52 9 5 32 7 * * 1 16
Elementary occupations * 3 2 3 * 1 3 7 2
Total 100 100 100 100 100 100 100 100 100
Internal skills gaps as % of employment
7.0 5.0 7.8 6.7 5.7 4.4 3.1 5.2 6.3
Weighted Base 218,780 37,568 311,731 74,521 180,815 47,663 47,362 113,682 1,076,999
Unweighted base 7,429 1,831 6,780 2,705 7,912 3,891 2,323 5,650 40,072 Base: Internal Skill Gaps: employee based measure Source: ESS 2002 (IES/MORI)
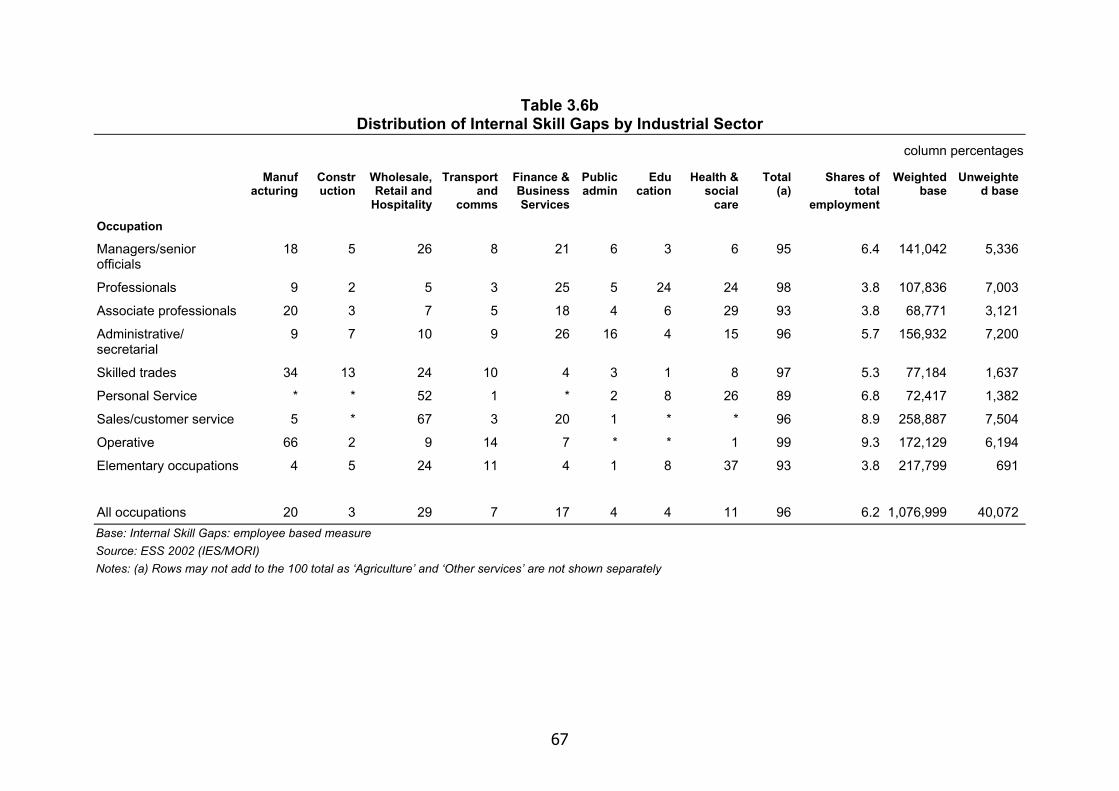
67
Table 3.6b Distribution of Internal Skill Gaps by Industrial Sector
column percentages
Manuf acturing
Constr uction
Wholesale, Retail and
Hospitality
Transport and
comms
Finance & Business Services
Public admin
Edu cation
Health & social
care
Total (a)
Shares of total
employment
Weighted base
Unweighted base
Occupation
Managers/senior officials
18 5 26 8 21 6 3 6 95 6.4 141,042 5,336
Professionals 9 2 5 3 25 5 24 24 98 3.8 107,836 7,003
Associate professionals 20 3 7 5 18 4 6 29 93 3.8 68,771 3,121
Administrative/ secretarial
9 7 10 9 26 16 4 15 96 5.7 156,932 7,200
Skilled trades 34 13 24 10 4 3 1 8 97 5.3 77,184 1,637
Personal Service * * 52 1 * 2 8 26 89 6.8 72,417 1,382
Sales/customer service 5 * 67 3 20 1 * * 96 8.9 258,887 7,504
Operative 66 2 9 14 7 * * 1 99 9.3 172,129 6,194
Elementary occupations 4 5 24 11 4 1 8 37 93 3.8 217,799 691
All occupations 20 3 29 7 17 4 4 11 96 6.2 1,076,999 40,072 Base: Internal Skill Gaps: employee based measure Source: ESS 2002 (IES/MORI) Notes: (a) Rows may not add to the 100 total as ‘Agriculture’ and ‘Other services’ are not shown separately
68
3.3.1 Occupational pattern
Table 3.5a looks at the distribution of skills gaps by size of workplace for each of the main occupational groups. Almost a third of all internal skills gaps in smaller establishments affected sales and customer service personnel, presumably in shops and other retail outlets. Other key skills gaps at this end of the scale occurred among skilled employees (40 per cent of internal skill gaps among skilled trades people were found in smaller workplaces, Table 3.5b).
In larger workplaces (with 500 or more employees), skills gaps were more evenly spread across the workforce, although a quarter of deficiencies were reported among their professional staff (and over the half of the internal skills gaps among professionals occurred in large workplaces).
Generally from Table 3.5a it is apparent that skills gaps were most prominent among sales and customer service personnel with almost a quarter of the reported skill gaps among this occupational group. Other key areas were:
Operatives (16 per cent of all internal skills gaps) - particularly in manufacturing see below — and
Administrative and secretarial staff (15 per cent) — most prominent in the finance and business services sector, with some 26 per cent of skill gaps among administrative and secretarial staff in that sector and also in public administration with 16 per cent, but affecting all sectors in some way (Table 3.6b).
What does proficiency look like?
To gain a further insight into respondents’ understanding of the notion of proficiency those who took part in the follow-up interviews were asked to compare some-one who was more than fully proficient in their role on the one hand and some-one who was less than proficient on the other and describe the key characteristics of the latter. Not all respondents were able to make the comparison, eg some had not reported that they had any staff who were less than fully proficient in the original survey and even when they had, the comparisons they were able to draw were not particularly illuminating. However the following examples do give a flavour of what (a few) respondents saw as the nature of the skill gap they were reporting. Most of the examples given referred to people in either managerial or administrative and secretarial occupations.
A manager who is less than fully proficient tends to be:
‘. . . focused on their own personal targets rather than the staff working for them. They also don’t think about how staff work in different ways and have different needs.’ - large public sector organisation
‘. . . not good at communicating, has not set up training for his staff or himself and he is not listening to what people are saying, expecting people just to come in and do the job . . . generally he is reactive and not proactive, not taking a longer term perspective of what needs doing.’ — large transport company
‘. . . some-one with a higher sickness absence due to stress from not being able to cope, industrial relations problems from not managing their people well and losing business.’ — large service sector company
69
‘ . . . some-one with less commitment to the business.’ — small service sector company
An associate professional who is less than fully proficient tends to:
(IT role) ‘ . . . lack business knowledge as well as technical ability. For example some-one may be asked to do an HR implementation, having not worked in HR previously might mean that while they understand technically what to do, they have no idea why they are doing it and so do not do such a good job. This comes with experience . . . ‘ — large service sector company
Administrative and secretarial staff who are less than fully proficient may be:
‘. . . slow, pay little attention to detail and have poor customer service skills.’ — large business services company
‘. . . a lot quieter, more prone to absence [and have] a general reluctance to accept responsibility.’ — large manufacturing company
‘. . . easily distracted, make silly mistakes, fail to check work and require a high level of supervision.’ — large public service organisation
‘. . . not as developed on the IT side, lack sufficient levels of initiative and need greater supervision.’ — large travel company
‘. . . some-one who needs pushing, who does not have the initiative, who is less than careful with the work they actually do and always need to be challenged with a deadline to get the work done.’ — small service sector company
‘. . . sits there complaining they’re bored but never ask for anything to do. They’re not interested and they lose interest and motivation.’ — small service sector company
It is interesting to note that in many of these quotes, interviewees are talking about the level of performance and aspects of performance that are less than adequate, reflecting issues around personal attributes rather than specific skills in which employees are deficient.
3.3.2 Sectoral pattern
Tables 3.6a and 3.6b look at the distribution by sector and occupation. The main sectors affected by internal skills gaps (Table 3.6b) were:
Wholesale, retail and hospitality — accounting for 29 per cent of all internal skills gaps. The main area of difficulty being among sales and customer service staff. Over half of the employers in this sector who said they had an internal skills gaps thought it affected their sales staff (Table 3.6a).
Manufacturing — 20 per cent of all internal skills gaps. The main problem area was operatives, accounting for over half of the internal skills gaps in this sector.
Finance and business services — 17 per cent of all internal skills gaps, with deficiencies concentrated on professionals and administrative staff and to a lesser extent managers and sales staff.
70
The least affected sectors appear to be construction, public administration and education.
3.3.3 Regional pattern
The occupational pattern and distribution of skill gaps by region are shown in Tables 3.7 and 3.8. The latter suggests that the main regions affected by internal skills gaps are:
London — accounting for almost a fifth of all internal skills gaps — with managers and sales as the categories most likely to be the areas of difficulty.
South East — 16 per cent overall with particular problems with sales staff. This region accounts for the bulk of the relatively few deficiencies among elementary occupations.
The least affected areas were the North East and the East Midlands, each with around five per cent of all the internal skills gaps reported.
Taking account of the distribution of employment, skills gaps represented a higher proportion of employment in Yorkshire and Humberside than in any other region, where almost a quarter of the reported internal skill gaps affect professional staff. Other regions where the density of skill gaps was relatively high were the West Midlands and the South West and was lowest in the East and North East of England (Table 3.7).
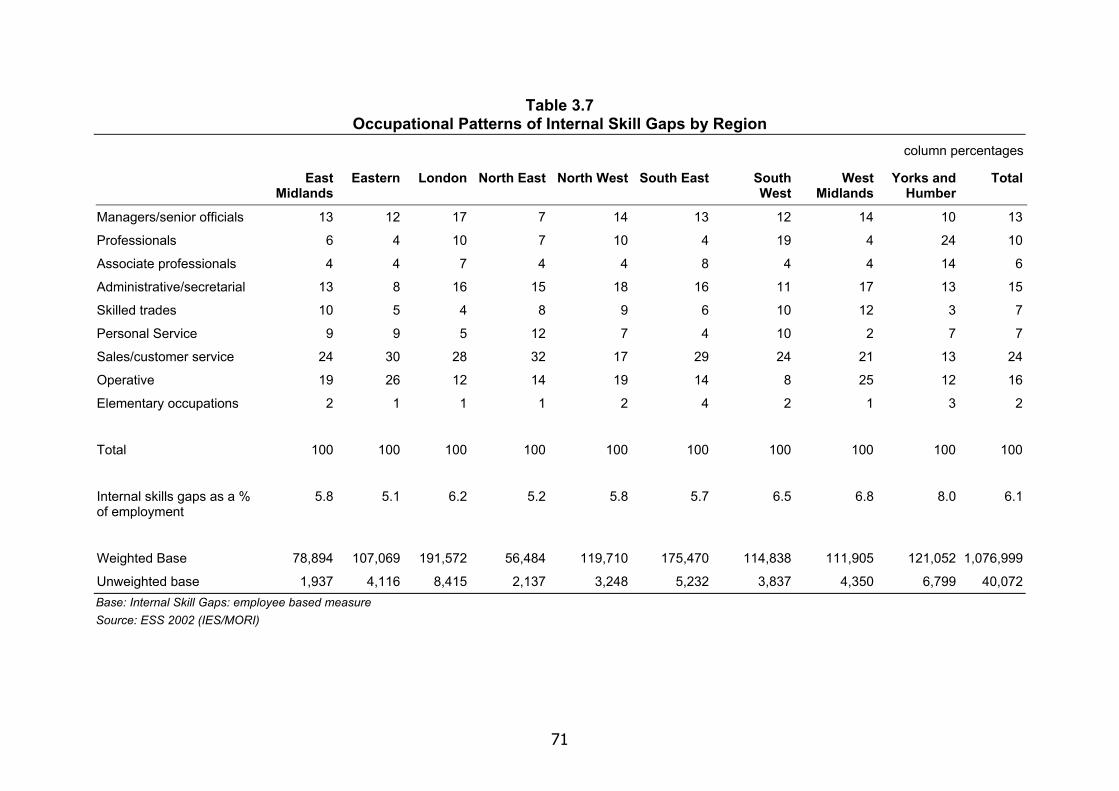
71
Table 3.7 Occupational Patterns of Internal Skill Gaps by Region
column percentages
East Midlands
Eastern London North East North West South East South West
West Midlands
Yorks and Humber
Total
Managers/senior officials 13 12 17 7 14 13 12 14 10 13
Professionals 6 4 10 7 10 4 19 4 24 10
Associate professionals 4 4 7 4 4 8 4 4 14 6
Administrative/secretarial 13 8 16 15 18 16 11 17 13 15
Skilled trades 10 5 4 8 9 6 10 12 3 7
Personal Service 9 9 5 12 7 4 10 2 7 7
Sales/customer service 24 30 28 32 17 29 24 21 13 24
Operative 19 26 12 14 19 14 8 25 12 16
Elementary occupations 2 1 1 1 2 4 2 1 3 2
Total 100 100 100 100 100 100 100 100 100 100
Internal skills gaps as a % of employment
5.8 5.1 6.2 5.2 5.8 5.7 6.5 6.8 8.0 6.1
Weighted Base 78,894 107,069 191,572 56,484 119,710 175,470 114,838 111,905 121,052 1,076,999
Unweighted base 1,937 4,116 8,415 2,137 3,248 5,232 3,837 4,350 6,799 40,072 Base: Internal Skill Gaps: employee based measure Source: ESS 2002 (IES/MORI)
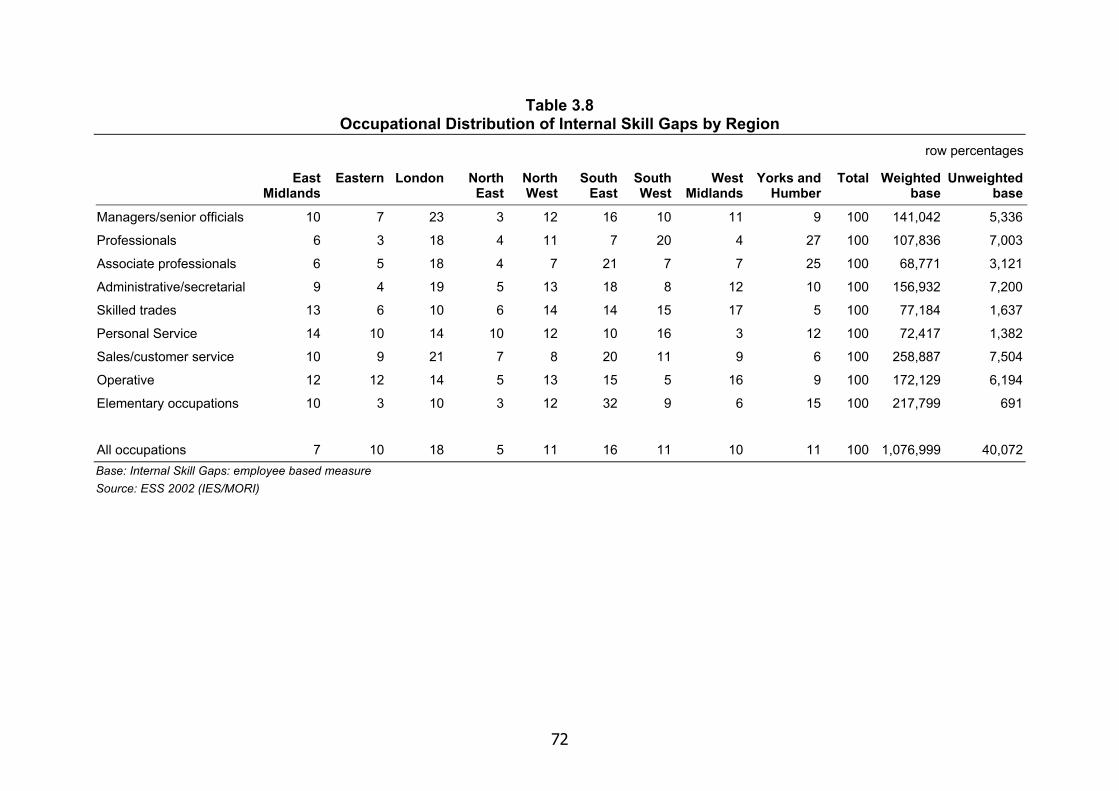
72
Table 3.8 Occupational Distribution of Internal Skill Gaps by Region
row percentages
East Midlands
Eastern London North East
North West
South East
South West
West Midlands
Yorks and Humber
Total Weighted base
Unweighted base
Managers/senior officials 10 7 23 3 12 16 10 11 9 100 141,042 5,336
Professionals 6 3 18 4 11 7 20 4 27 100 107,836 7,003
Associate professionals 6 5 18 4 7 21 7 7 25 100 68,771 3,121
Administrative/secretarial 9 4 19 5 13 18 8 12 10 100 156,932 7,200
Skilled trades 13 6 10 6 14 14 15 17 5 100 77,184 1,637
Personal Service 14 10 14 10 12 10 16 3 12 100 72,417 1,382
Sales/customer service 10 9 21 7 8 20 11 9 6 100 258,887 7,504
Operative 12 12 14 5 13 15 5 16 9 100 172,129 6,194
Elementary occupations 10 3 10 3 12 32 9 6 15 100 217,799 691
All occupations 7 10 18 5 11 16 11 10 11 100 1,076,999 40,072 Base: Internal Skill Gaps: employee based measure Source: ESS 2002 (IES/MORI)
73
3.4 What skills are missing? The survey asked more detailed questions about up to two of the occupations in which internal skill gaps were identified by respondents — thus not all skill gaps are included in the data in Tables 3.9 to 3.12 (ie missing data are excluded although over 90 per cent are covered in this part of the questionnaire). The main area of skill deficiency reported by the sample of employers among their existing employees was communication skills. Where respondents reported a significant lack of proficiency among a group of their employees they were asked what particular skills and qualities they lacked. Table 3.9 sets out the main results.
The main areas of skill deficiency reported were:
Communication skills — reported for over half of the employees who were not fully proficient (and followed up in the survey) and affecting most occupational groups, particularly in personal services.
Customer handling —affecting half of the employees with internal gaps and prominent among personal service, sales and professional staff.
Team-working — evenly spread across most occupational groups. Problem-solving — particularly in personal service and also in skilled trades and
administrative occupations.
Comparing the results in Table 3.9 with those for skill-shortage vacancies (Table 2.15) shows that:
technical and practical skills were a relatively more prominent deficit among skill-shortage vacancies than for skill gaps.
IT-related skills at basic and advanced level were more prevalent among skill gaps than skill-shortage vacancies.
The prevalence of generic skill gaps is demonstrated in Table 3.10. In only five per cent of cases was the identified skill gap centred on technical skills only while in 37 per cent of cases it concerned only generic skills. In most cases, 52 per cent, the gap involved a combination of generic and technical skills.
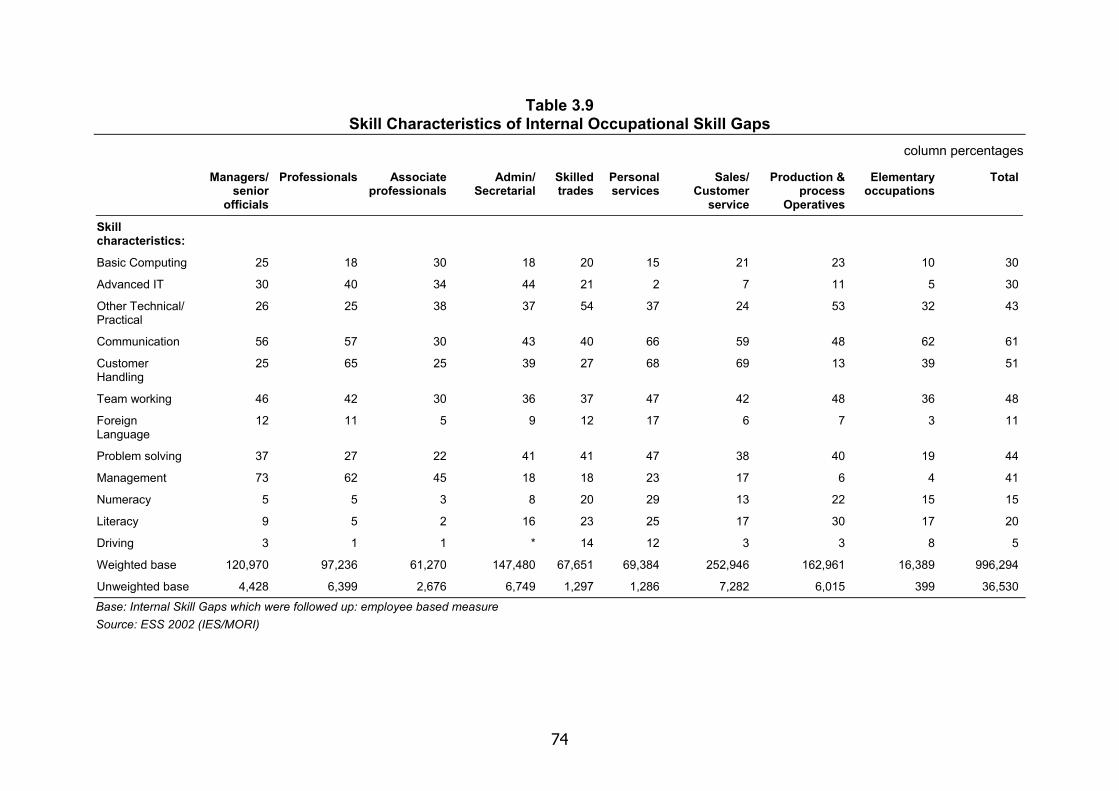
74
Table 3.9 Skill Characteristics of Internal Occupational Skill Gaps
column percentages Managers/
senior officials
Professionals Associate professionals
Admin/ Secretarial
Skilled trades
Personal services
Sales/ Customer
service
Production & process
Operatives
Elementary occupations
Total
Skill characteristics:
Basic Computing 25 18 30 18 20 15 21 23 10 30
Advanced IT 30 40 34 44 21 2 7 11 5 30
Other Technical/ Practical
26 25 38 37 54 37 24 53 32 43
Communication 56 57 30 43 40 66 59 48 62 61
Customer Handling
25 65 25 39 27 68 69 13 39 51
Team working 46 42 30 36 37 47 42 48 36 48
Foreign Language
12 11 5 9 12 17 6 7 3 11
Problem solving 37 27 22 41 41 47 38 40 19 44
Management 73 62 45 18 18 23 17 6 4 41
Numeracy 5 5 3 8 20 29 13 22 15 15
Literacy 9 5 2 16 23 25 17 30 17 20
Driving 3 1 1 * 14 12 3 3 8 5
Weighted base 120,970 97,236 61,270 147,480 67,651 69,384 252,946 162,961 16,389 996,294
Unweighted base 4,428 6,399 2,676 6,749 1,297 1,286 7,282 6,015 399 36,530 Base: Internal Skill Gaps which were followed up: employee based measure Source: ESS 2002 (IES/MORI)
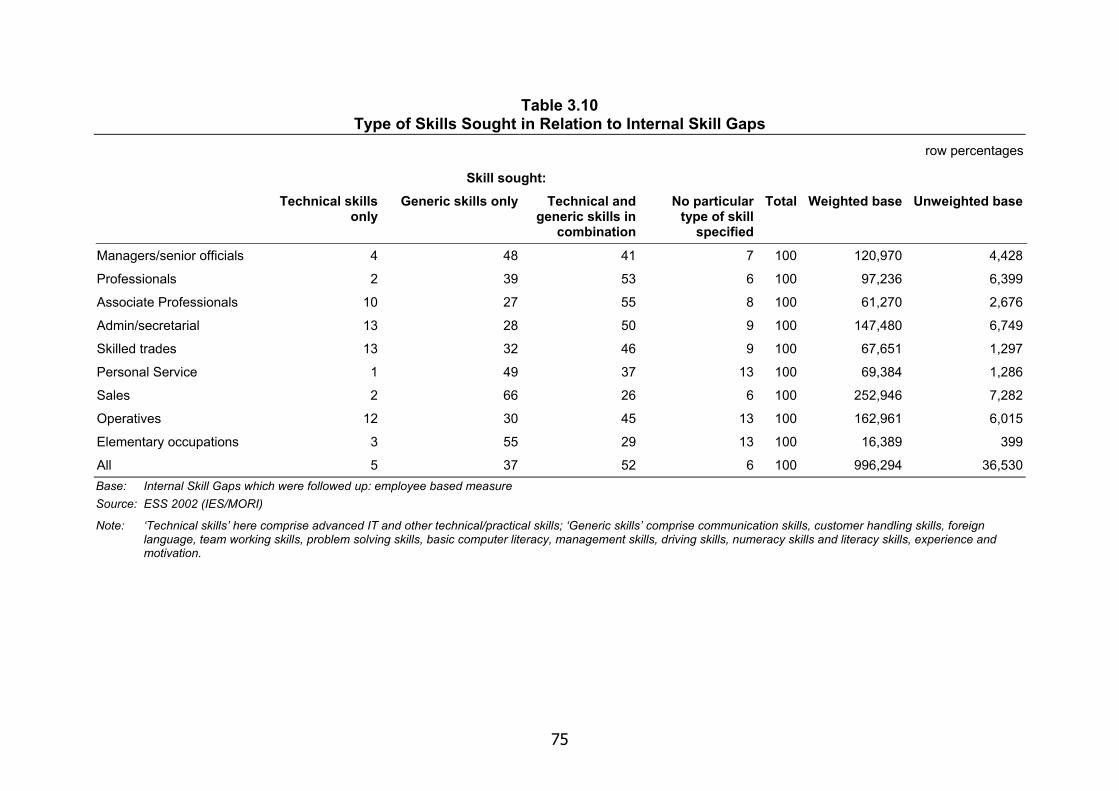
75
Table 3.10 Type of Skills Sought in Relation to Internal Skill Gaps
row percentages
Skill sought: Technical skills
only Generic skills only Technical and
generic skills in combination
No particular type of skill
specified
Total Weighted base Unweighted base
Managers/senior officials 4 48 41 7 100 120,970 4,428
Professionals 2 39 53 6 100 97,236 6,399
Associate Professionals 10 27 55 8 100 61,270 2,676
Admin/secretarial 13 28 50 9 100 147,480 6,749
Skilled trades 13 32 46 9 100 67,651 1,297
Personal Service 1 49 37 13 100 69,384 1,286
Sales 2 66 26 6 100 252,946 7,282
Operatives 12 30 45 13 100 162,961 6,015
Elementary occupations 3 55 29 13 100 16,389 399
All 5 37 52 6 100 996,294 36,530 Base: Internal Skill Gaps which were followed up: employee based measure Source: ESS 2002 (IES/MORI)
Note: ‘Technical skills’ here comprise advanced IT and other technical/practical skills; ‘Generic skills’ comprise communication skills, customer handling skills, foreign language, team working skills, problem solving skills, basic computer literacy, management skills, driving skills, numeracy skills and literacy skills, experience and motivation.
76
3.5 Reasons for skill gaps Employers who reported a lack of proficiency among their employees were asked what they thought were the main causes and the results are set out in Table 3.11 and 3.12. This year the question was slightly different to last year as two additional prompts were given: lack of experience and lack of motivation. In previous surveys both these reasons had been volunteered by a number of respondents but had not appeared as one of the spoken options for answers. Not surprisingly the responses this year for these two options are higher than in previous surveys.
In fact lack of experience among employees, for instance because they were new to the job appeared to be a key reason for being less than fully proficient, affecting nearly two-thirds of all reported skill gaps and especially those among professional and associate professional staff — a point also made by some of the follow-up interviewees.
The failure to train and motivate staff was also felt to be an important cause of internal skills deficiencies, affecting some 40 per cent of all internal skill gaps, particularly those among managers and operatives. High staff turnover was an issue in larger workplaces and among personal service occupations. Recruitment problems also particularly affected larger workplaces and professional staff.
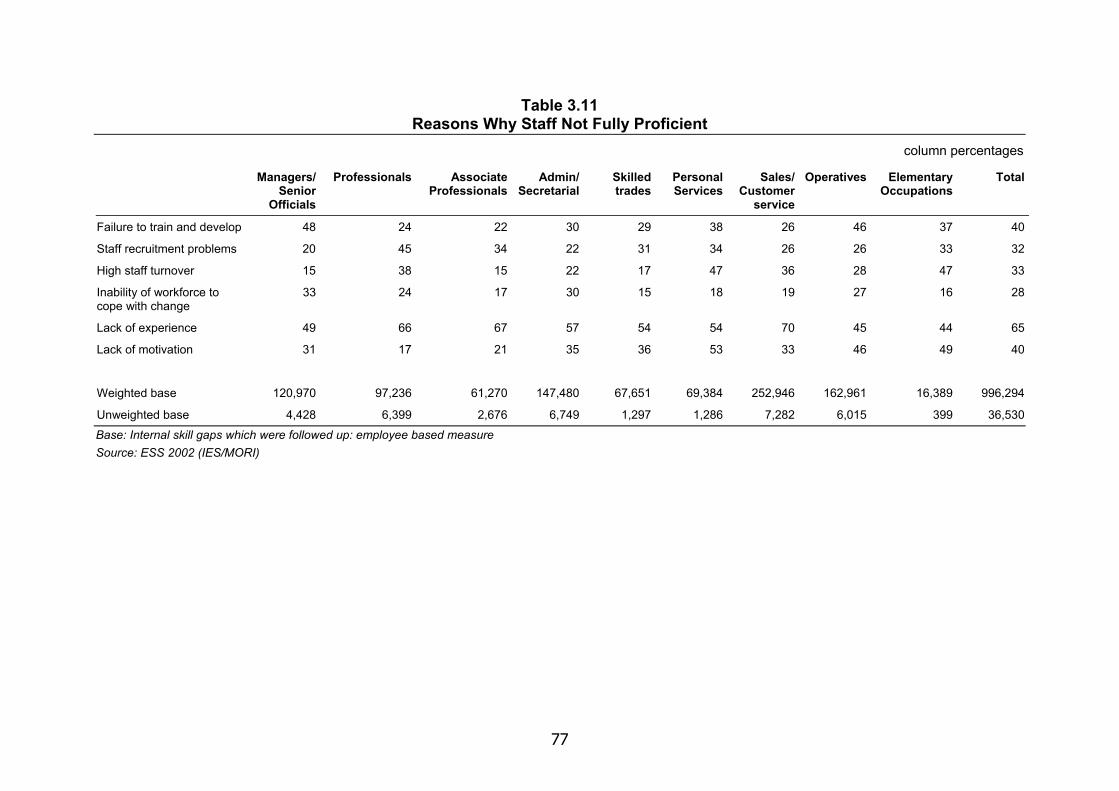
77
Table 3.11 Reasons Why Staff Not Fully Proficient
column percentages Managers/
Senior Officials
Professionals Associate Professionals
Admin/ Secretarial
Skilled trades
Personal Services
Sales/ Customer
service
Operatives Elementary Occupations
Total
Failure to train and develop 48 24 22 30 29 38 26 46 37 40
Staff recruitment problems 20 45 34 22 31 34 26 26 33 32
High staff turnover 15 38 15 22 17 47 36 28 47 33
Inability of workforce to cope with change
33 24 17 30 15 18 19 27 16 28
Lack of experience 49 66 67 57 54 54 70 45 44 65
Lack of motivation 31 17 21 35 36 53 33 46 49 40
Weighted base 120,970 97,236 61,270 147,480 67,651 69,384 252,946 162,961 16,389 996,294
Unweighted base 4,428 6,399 2,676 6,749 1,297 1,286 7,282 6,015 399 36,530 Base: Internal skill gaps which were followed up: employee based measure Source: ESS 2002 (IES/MORI)
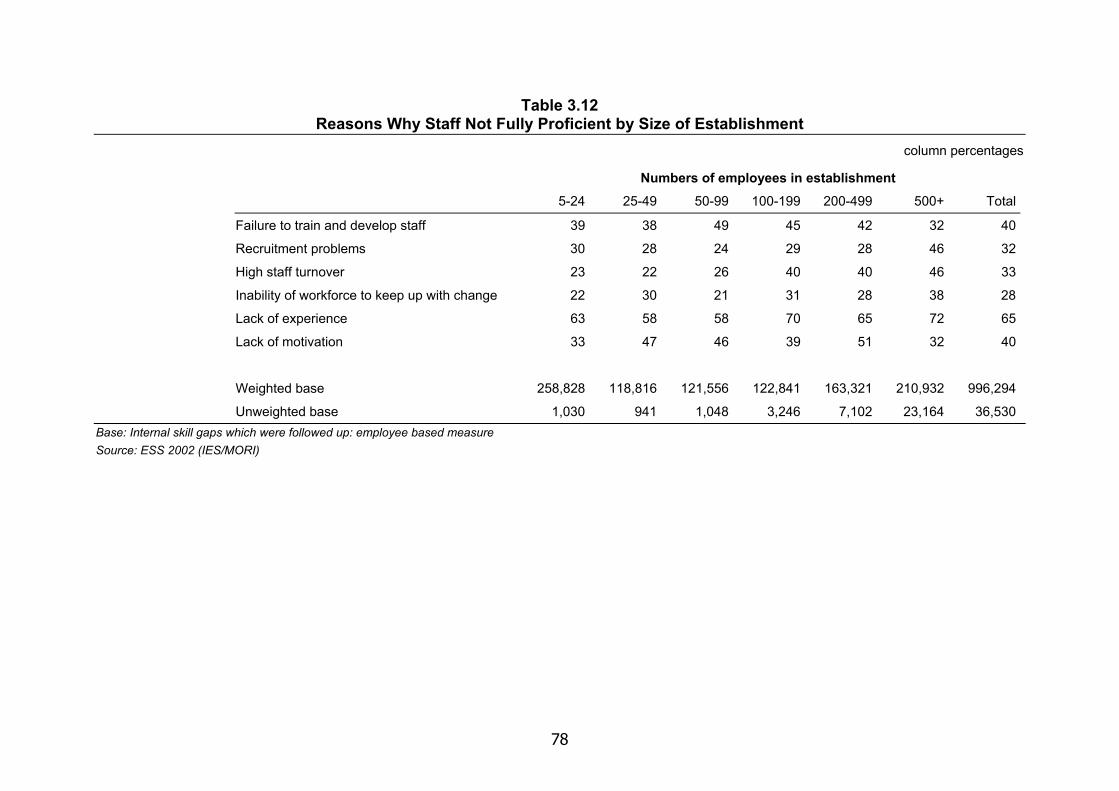
78
Table 3.12 Reasons Why Staff Not Fully Proficient by Size of Establishment
column percentages
Numbers of employees in establishment 5-24 25-49 50-99 100-199 200-499 500+ Total
Failure to train and develop staff 39 38 49 45 42 32 40
Recruitment problems 30 28 24 29 28 46 32
High staff turnover 23 22 26 40 40 46 33
Inability of workforce to keep up with change 22 30 21 31 28 38 28
Lack of experience 63 58 58 70 65 72 65
Lack of motivation 33 47 46 39 51 32 40
Weighted base 258,828 118,816 121,556 122,841 163,321 210,932 996,294
Unweighted base 1,030 941 1,048 3,246 7,102 23,164 36,530 Base: Internal skill gaps which were followed up: employee based measure Source: ESS 2002 (IES/MORI)
79
3.5.1 Determinants of skill gaps
The workplaces that reported skill gaps (using the narrow measure) were examined against the range of categorical data collected in the questionnaire. The main points to emerge were that internal skill gaps were more likely to be reported in workplaces that were:
From the private sector; Growing — for example 37 per cent of establishments reporting an internal skills
gap had increased employment over the past year and 57 per cent had seen their sales or budget rise compared with 33 per cent and 52 per cent, of all establishments respectively. Similarly workplaces that expected to grow in the future either in terms of sales or employment were also more likely to report a skills gap;
Working at less than full capacity — 45 per cent of skill gap establishments reported that they were working somewhat or considerably below full capacity, compared with 37 per cent overall.
There was little variation in the data by whether workplaces were concentrating on quality or efficiency in their business strategy or whether they were committed to or accredited as Investors in People.
A multi-variate analysis of the characteristics of workplaces with internal skill gaps (on the narrow measure) was conducted — similar to that carried out for skill-shortage vacancies (see 2.7). Once again the factors considered only explained a very small part (five per cent) of the variance of skill gaps and so the exercise was not taken any further.
3.5.2 Employers’ responses
Most employers in the survey said that they were taking some action to overcome skill shortcomings among their workforce, with the most common response being to increase the amount of training provided (Table 3.13). Overall, in 83 per cent of cases where there was an internal skills gap, respondents said that they had provided more training and in 59 per cent of cases, respondents reported that they had increased or expanded their trainee programmes. For over half, 56 per cent, of the reported internal skill gaps, employers had responded by changing the way they worked and for around a third they had either increased recruitment and/or opened up new recruitment channels.
Action was least likely to be taken where skill gaps were reported among their employees in elementary occupations and most likely where personal service, sales or professional staff were less than fully proficient.
3.5.3 Barriers
All respondents were asked what barriers may exist to developing or maintaining a fully proficient team for each of the occupational groups they employed. Most (60 per cent) felt that there were no constraints. Where barriers were reported they generally
80
referred to problems ensuring sufficient training was provided. Some 48 per cent said that lack of time for training prevented their employees becoming fully proficient and a further 39 per cent referred to lack of cover for training and 30 per cent to the lack of funding for training. In most of these cases the barriers particularly affected managerial, professional and associate professional staff (Table 3.14).
Establishments with internal skill gaps were more likely to report barriers to developing the proficiency of their staff — with the proportion reporting a lack of willingness of staff to undertake training rising the most (in percentage terms) from 20 per cent of all employers to 34 per cent of those with skill gaps (Table 3.15).
In the follow-up interviews (see box) many respondents identified issues to do with individuals themselves eg their motivation or commitment as constraining the development of their proficiency.
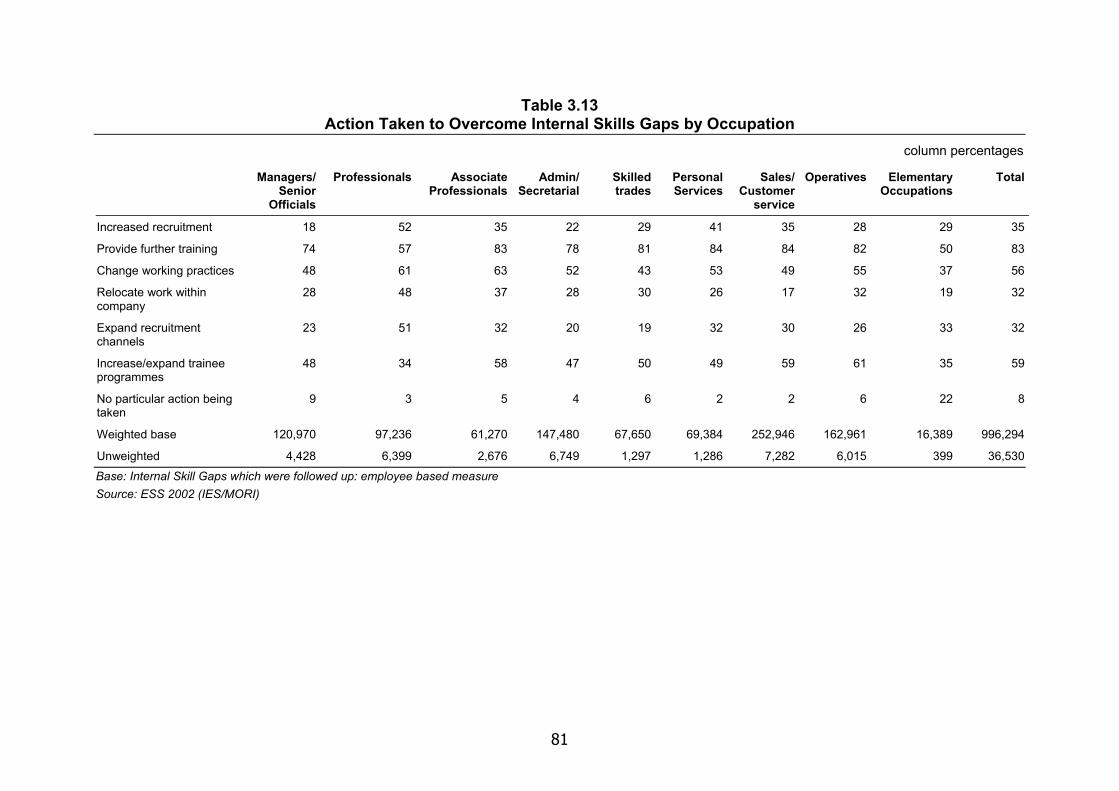
81
Table 3.13 Action Taken to Overcome Internal Skills Gaps by Occupation
column percentages Managers/
Senior Officials
Professionals Associate Professionals
Admin/ Secretarial
Skilled trades
Personal Services
Sales/ Customer
service
Operatives Elementary Occupations
Total
Increased recruitment 18 52 35 22 29 41 35 28 29 35
Provide further training 74 57 83 78 81 84 84 82 50 83
Change working practices 48 61 63 52 43 53 49 55 37 56
Relocate work within company
28 48 37 28 30 26 17 32 19 32
Expand recruitment channels
23 51 32 20 19 32 30 26 33 32
Increase/expand trainee programmes
48 34 58 47 50 49 59 61 35 59
No particular action being taken
9 3 5 4 6 2 2 6 22 8
Weighted base 120,970 97,236 61,270 147,480 67,650 69,384 252,946 162,961 16,389 996,294
Unweighted 4,428 6,399 2,676 6,749 1,297 1,286 7,282 6,015 399 36,530 Base: Internal Skill Gaps which were followed up: employee based measure Source: ESS 2002 (IES/MORI)
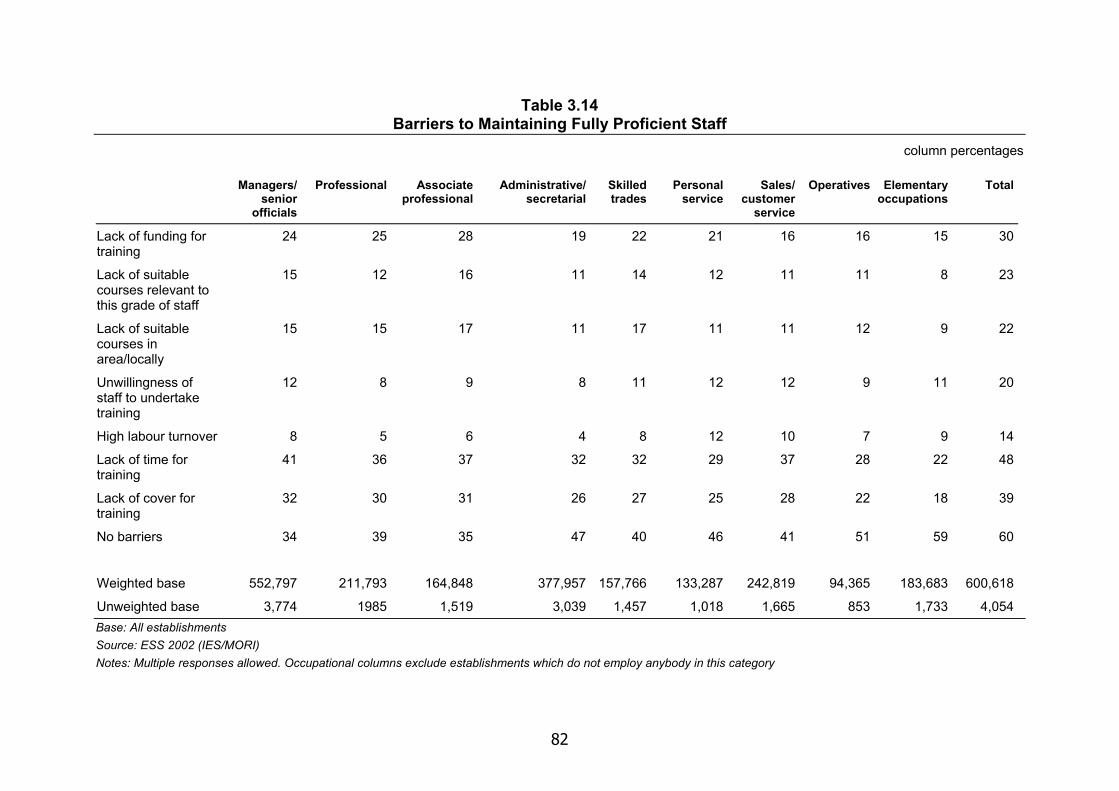
82
Table 3.14 Barriers to Maintaining Fully Proficient Staff
column percentages
Managers/ senior
officials
Professional Associate professional
Administrative/ secretarial
Skilled trades
Personal service
Sales/ customer
service
Operatives Elementary occupations
Total
Lack of funding for training
24 25 28 19 22 21 16 16 15 30
Lack of suitable courses relevant to this grade of staff
15 12 16 11 14 12 11 11 8 23
Lack of suitable courses in area/locally
15 15 17 11 17 11 11 12 9 22
Unwillingness of staff to undertake training
12 8 9 8 11 12 12 9 11 20
High labour turnover 8 5 6 4 8 12 10 7 9 14
Lack of time for training
41 36 37 32 32 29 37 28 22 48
Lack of cover for training
32 30 31 26 27 25 28 22 18 39
No barriers 34 39 35 47 40 46 41 51 59 60
Weighted base 552,797 211,793 164,848 377,957 157,766 133,287 242,819 94,365 183,683 600,618
Unweighted base 3,774 1985 1,519 3,039 1,457 1,018 1,665 853 1,733 4,054 Base: All establishments Source: ESS 2002 (IES/MORI) Notes: Multiple responses allowed. Occupational columns exclude establishments which do not employ anybody in this category
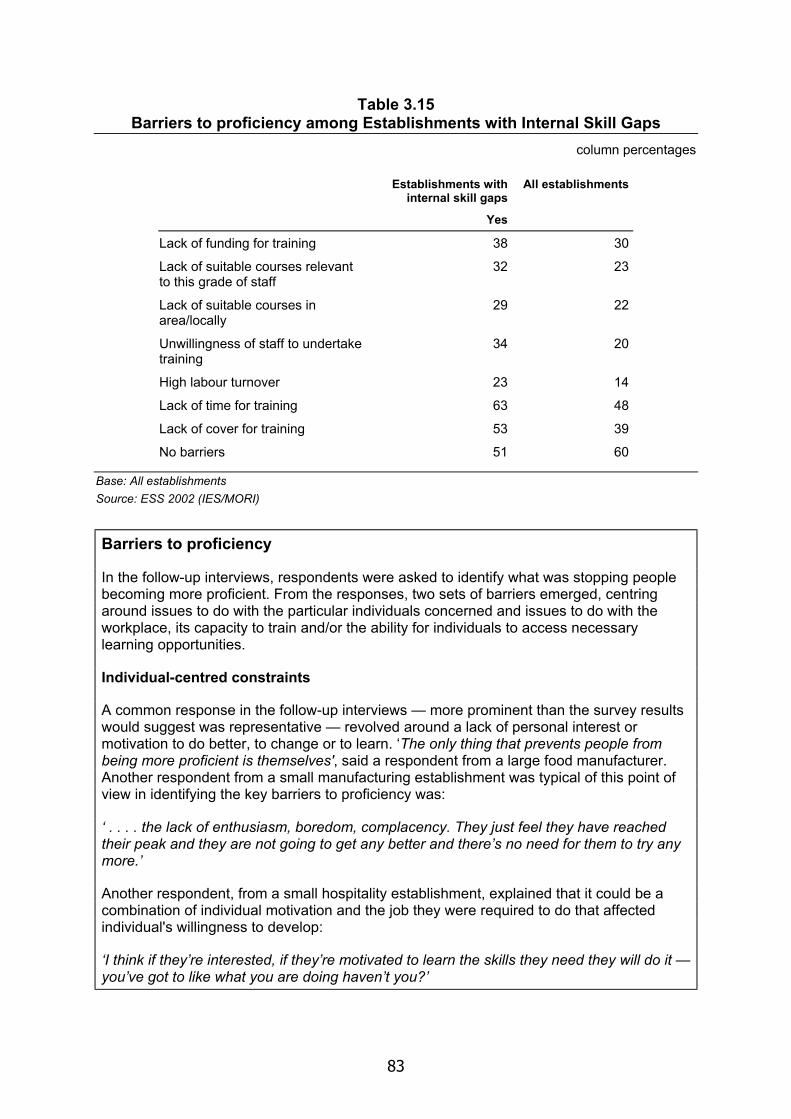
83
Table 3.15 Barriers to proficiency among Establishments with Internal Skill Gaps
column percentages
Establishments with internal skill gaps
All establishments
Yes
Lack of funding for training 38 30
Lack of suitable courses relevant to this grade of staff
32 23
Lack of suitable courses in area/locally
29 22
Unwillingness of staff to undertake training
34 20
High labour turnover 23 14
Lack of time for training 63 48
Lack of cover for training 53 39
No barriers 51 60
Base: All establishments Source: ESS 2002 (IES/MORI)
Barriers to proficiency
In the follow-up interviews, respondents were asked to identify what was stopping people becoming more proficient. From the responses, two sets of barriers emerged, centring around issues to do with the particular individuals concerned and issues to do with the workplace, its capacity to train and/or the ability for individuals to access necessary learning opportunities.
Individual-centred constraints
A common response in the follow-up interviews — more prominent than the survey results would suggest was representative — revolved around a lack of personal interest or motivation to do better, to change or to learn. ‘The only thing that prevents people from being more proficient is themselves', said a respondent from a large food manufacturer. Another respondent from a small manufacturing establishment was typical of this point of view in identifying the key barriers to proficiency was:
‘ . . . . the lack of enthusiasm, boredom, complacency. They just feel they have reached their peak and they are not going to get any better and there’s no need for them to try any more.’
Another respondent, from a small hospitality establishment, explained that it could be a combination of individual motivation and the job they were required to do that affected individual's willingness to develop:
‘I think if they’re interested, if they’re motivated to learn the skills they need they will do it — you’ve got to like what you are doing haven’t you?’
84
Workplace constraints
A second common set of constraints, involved barriers in the workplace itself. These included:
• No time to train — another commonly cited problem as illustrated by the following examples
- ‘The company is very small and for people to take time off is difficult and there never seems to be an appropriate time when people can go on courses to learn additional skills.’ — small service company
- ‘People are short staffed and they don’t have time to concentrate on training unfortunately’ — small hospitality establishment
- ‘People are so busy here that they sometimes don’t have the time to improve what they are doing’ — large production company
Another respondent talked about the lack of time that managers had to think about training and the development of their staff.
• Unavailability of suitable training — for which some blamed local provision, eg ‘there’s a well-known lack of training around here’, while others were more self-critical, eg ‘there may be a perception that there’s not enough money available for training opportunities’
• Other reasons included:
- Uncertainty — ‘the organisation is changing fast and this leads to instability, with people being moved around and so on, which means staff have less time to settle down into jobs’
- Poor performance management — with ineffective staff ‘not being told when their work is not up to scratch’.
3.6 Impact of skill gaps Respondents’ views on the impact of skill gaps on the workplace are set out in Tables 3.16 (using the employee-based measure of skill gaps) and 3.17 (using the establishment measure). The main problems caused by a lack of proficiency were in the level of customer service provided and quality standards generally. Skill gaps appear more likely to result in sub-optimal performance rather than restricting the scope or level of service or products offered. Thus on the employee-based measure (Table 3.16) in over 50 per cent of cases where an internal skills gaps was reported for a particular occupation, respondents said it had caused difficulties with customer service or quality standards, increased operating costs or difficulties introducing new working practices. Fewer than a third said it had resulted in a loss of business or delays in developing new products or the withdrawal of services or products.
Difficulties with customer service also appear as the most common adverse impact of skill gaps using the establishment measure. Some 44 per cent of workplaces with skills gaps said customer service had suffered as a result, 40 per cent had faced difficulties with quality standards and 39 per cent saw costs rise.

85
Larger workplaces were more likely to report adverse impacts of skills gaps than smaller ones. For instance 68 per cent of workplaces with 500 or more employees reported difficulties with customer services, compared with only 41 per cent of those with more than five but fewer than 25 staff.
Difficulties with customer services were strongest in manufacturing and public administration workplaces and difficulties with quality standards were a particular issue in public administration and education establishments.
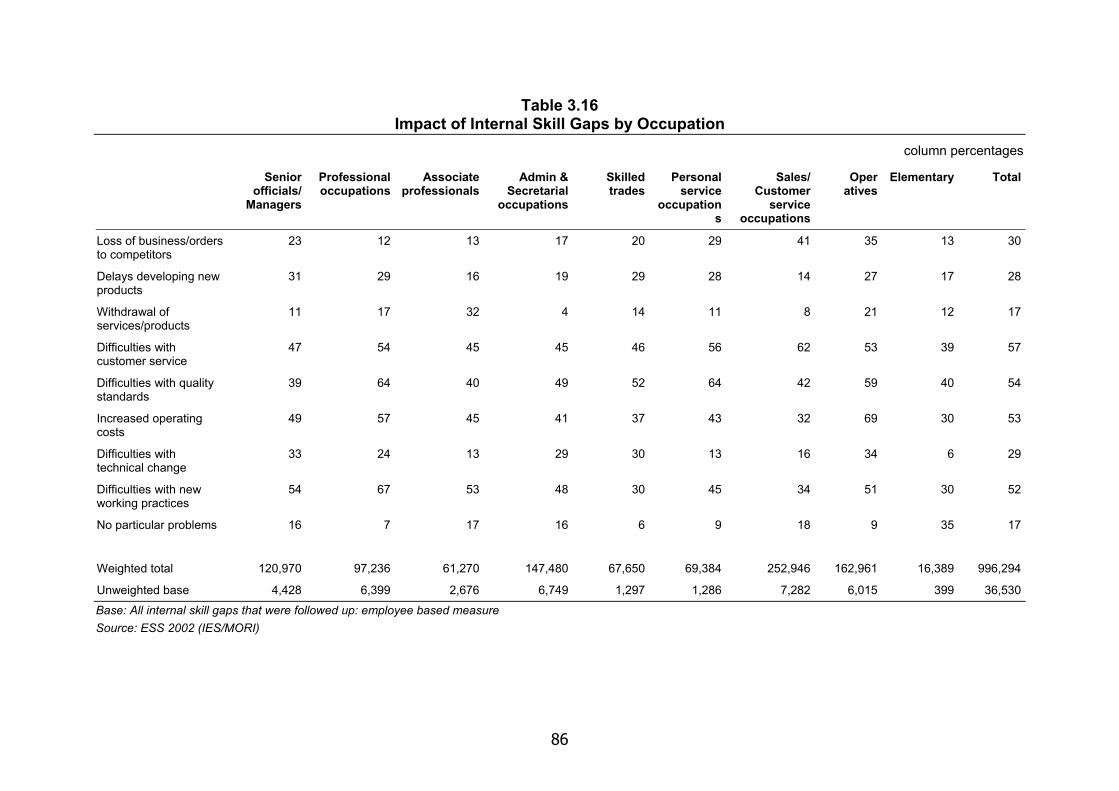
86
Table 3.16 Impact of Internal Skill Gaps by Occupation
column percentages Senior
officials/ Managers
Professional occupations
Associate professionals
Admin & Secretarial
occupations
Skilled trades
Personal service
occupations
Sales/ Customer
service occupations
Oper atives
Elementary Total
Loss of business/orders to competitors
23 12 13 17 20 29 41 35 13 30
Delays developing new products
31 29 16 19 29 28 14 27 17 28
Withdrawal of services/products
11 17 32 4 14 11 8 21 12 17
Difficulties with customer service
47 54 45 45 46 56 62 53 39 57
Difficulties with quality standards
39 64 40 49 52 64 42 59 40 54
Increased operating costs
49 57 45 41 37 43 32 69 30 53
Difficulties with technical change
33 24 13 29 30 13 16 34 6 29
Difficulties with new working practices
54 67 53 48 30 45 34 51 30 52
No particular problems 16 7 17 16 6 9 18 9 35 17
Weighted total 120,970 97,236 61,270 147,480 67,650 69,384 252,946 162,961 16,389 996,294
Unweighted base 4,428 6,399 2,676 6,749 1,297 1,286 7,282 6,015 399 36,530 Base: All internal skill gaps that were followed up: employee based measure Source: ESS 2002 (IES/MORI)
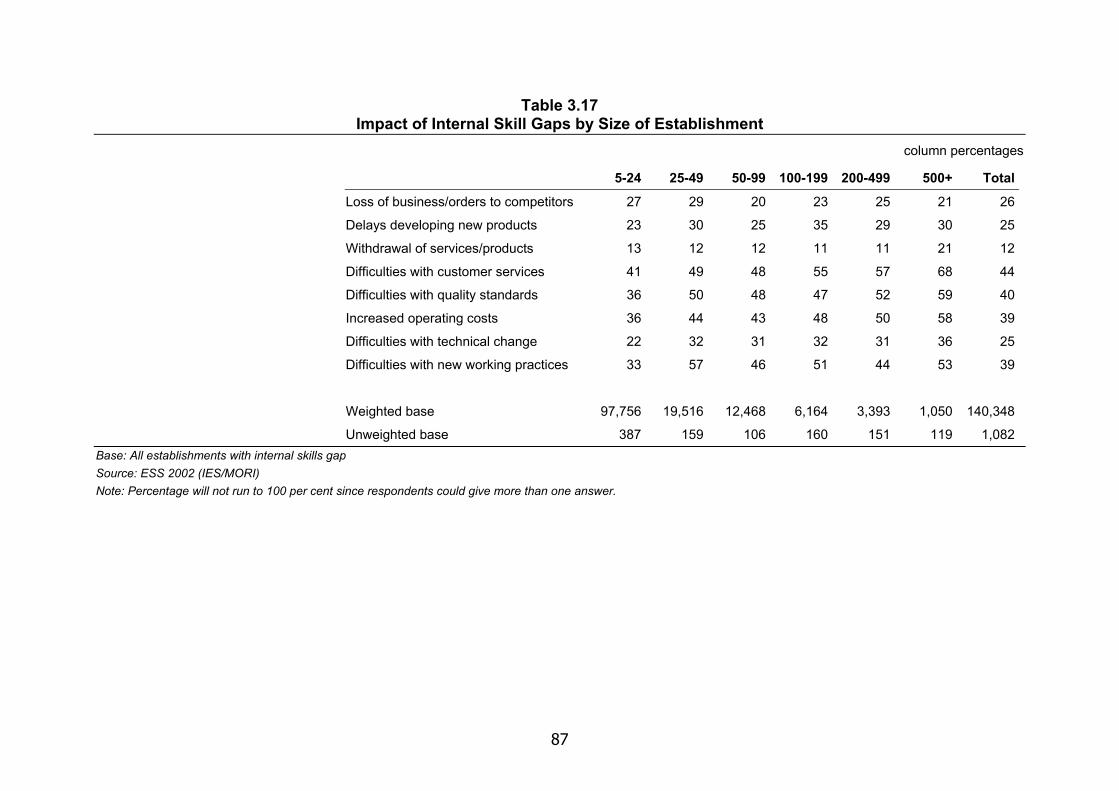
87
Table 3.17 Impact of Internal Skill Gaps by Size of Establishment
column percentages
5-24 25-49 50-99 100-199 200-499 500+ Total
Loss of business/orders to competitors 27 29 20 23 25 21 26
Delays developing new products 23 30 25 35 29 30 25
Withdrawal of services/products 13 12 12 11 11 21 12
Difficulties with customer services 41 49 48 55 57 68 44
Difficulties with quality standards 36 50 48 47 52 59 40
Increased operating costs 36 44 43 48 50 58 39
Difficulties with technical change 22 32 31 32 31 36 25
Difficulties with new working practices 33 57 46 51 44 53 39
Weighted base 97,756 19,516 12,468 6,164 3,393 1,050 140,348
Unweighted base 387 159 106 160 151 119 1,082 Base: All establishments with internal skills gap Source: ESS 2002 (IES/MORI) Note: Percentage will not run to 100 per cent since respondents could give more than one answer.
88
3.7 Future skill needs All respondents (with or without skill gaps or recruitment difficulties) were asked to identify the main reasons why skill needs were changing (Table 3.18). Nearly two-thirds of the respondents said that skills would not change for at least one occupation — though all thought at least one occupation would face changing skill demands. The main reasons were to cope with the introduction of new technology and new working practices. Workplaces with managerial, professional or associate professional employees were most likely to identify changes leading to new skill requirements.
Finally all respondents were also asked to identify which skills were likely to become more important over the next two to three years (Table 3.19). In a change to the previous survey (ESS 2001), the list was read out, rather than relying on respondents to volunteer answers. Responses are therefore not comparable with the previous survey.
The most common skill areas identified as being most important in the future — in each case cited by two-thirds of all the respondents to the survey — were:
Communication skills — explained by one follow-up interviewee as follows: ‘effective communication will become ever more important because our people have to deal with clients and their relatives, they have to deal with office staff and other members of the primary health care teams. So they have got to have reasonable communication skills. They have to be able to fill out reports and books’ — small health and social work organisation.
Customer handling skills (see box).
Meeting growing customer expectations
A number of respondents in the follow-up interviews felt that there was a growing emphasis attached to customer service with consequences for skill demand:
‘Customer expectation is so much greater than what it used to be. We are getting very Americanised. When something goes wrong, the first words of the customer are ‘what are you going to give me’. Unless we get everything right with the customer it is going to get harder and harder.’ — large engineering company
‘Customers are more aware of what they can expect these days - with the introduction of charters etc.’ — large public sector organisation
‘Customer handling skills will become more important because the market is getting more competitive, and it is easier for clients to go elsewhere’ — large production company
‘The customer knows he has the power of his rights. It’s the way society is changing and it means it is increasingly important that customers are handled in the right way.’ — large transport company
‘As the organisation opens up to the public, customer handing skills are becoming more important.’ — large public sector organisation.
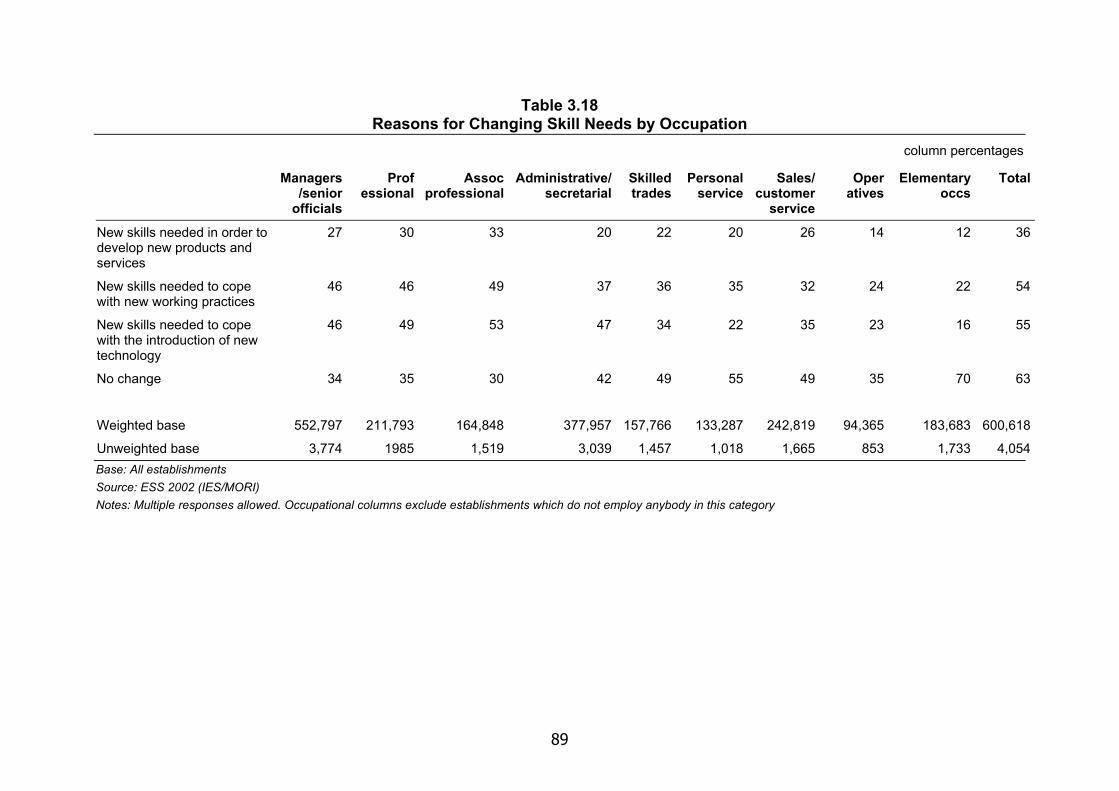
89
Table 3.18 Reasons for Changing Skill Needs by Occupation
column percentages
Managers/senior
officials
Prof essional
Assoc professional
Administrative/secretarial
Skilled trades
Personal service
Sales/ customer
service
Oper atives
Elementary occs
Total
New skills needed in order to develop new products and services
27 30 33 20 22 20 26 14 12 36
New skills needed to cope with new working practices
46 46 49 37 36 35 32 24 22 54
New skills needed to cope with the introduction of new technology
46 49 53 47 34 22 35 23 16 55
No change 34 35 30 42 49 55 49 35 70 63
Weighted base 552,797 211,793 164,848 377,957 157,766 133,287 242,819 94,365 183,683 600,618
Unweighted base 3,774 1985 1,519 3,039 1,457 1,018 1,665 853 1,733 4,054 Base: All establishments Source: ESS 2002 (IES/MORI) Notes: Multiple responses allowed. Occupational columns exclude establishments which do not employ anybody in this category
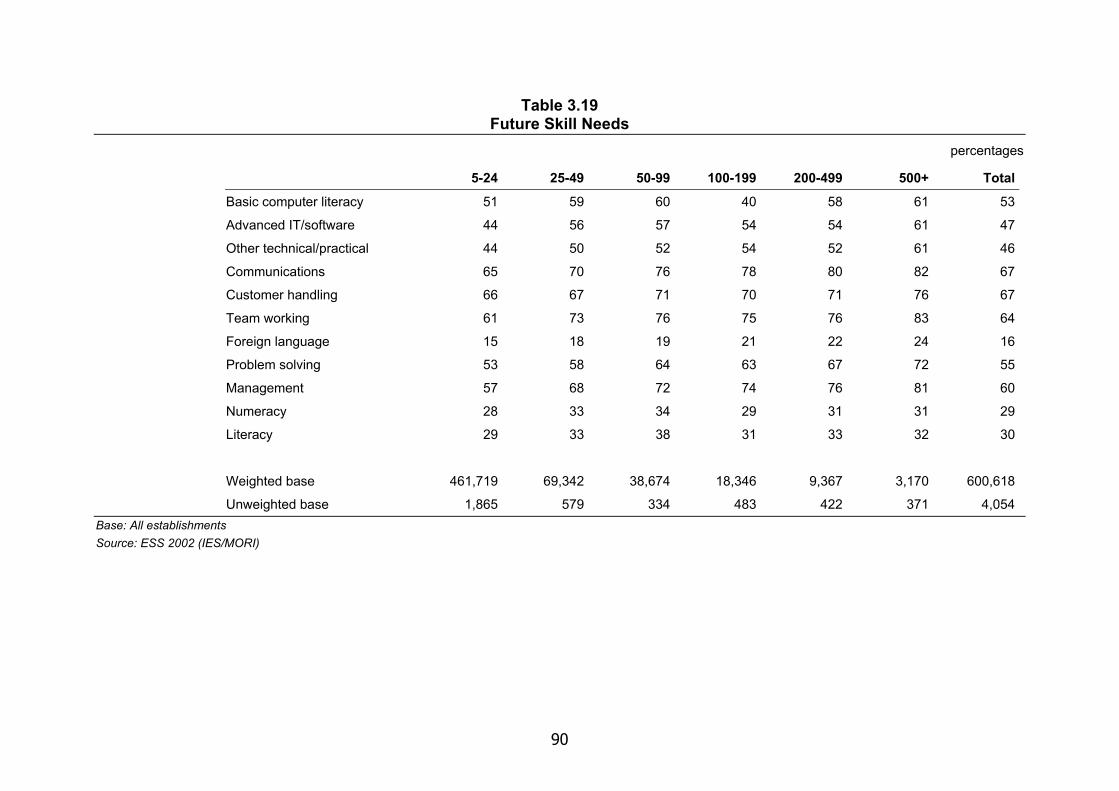
90
Table 3.19 Future Skill Needs
percentages
5-24 25-49 50-99 100-199 200-499 500+ Total
Basic computer literacy 51 59 60 40 58 61 53
Advanced IT/software 44 56 57 54 54 61 47
Other technical/practical 44 50 52 54 52 61 46
Communications 65 70 76 78 80 82 67
Customer handling 66 67 71 70 71 76 67
Team working 61 73 76 75 76 83 64
Foreign language 15 18 19 21 22 24 16
Problem solving 53 58 64 63 67 72 55
Management 57 68 72 74 76 81 60
Numeracy 28 33 34 29 31 31 29
Literacy 29 33 38 31 33 32 30
Weighted base 461,719 69,342 38,674 18,346 9,367 3,170 600,618
Unweighted base 1,865 579 334 483 422 371 4,054 Base: All establishments Source: ESS 2002 (IES/MORI)
91
Other key areas (identified in at least 60 per cent of cases) were:
Team working - in the follow-up interviews a large manufacturer argued that ‘in order to compete staff must interpret and turn around customer orders quickly, and this involves people working in groups, rather than sticking to rigid repetitive tasks. Better team working is the only way to become more efficient and responsive to customer needs.’
and
Management skills — one follow-up interviewee from a large production company explained that: ‘there are more and more laws coming out to protect people . . so it is now more important for managers to have people management skills. They can get the organisation into a lot of trouble if they don’t follow set procedures’. Another respondent from a small service company also stressed the growing importance of managing people: ‘I think we are beginning to recognise that as the company grows, motivating and developing people will become more important. We used to take it for granted, but recognised that it is a skill in itself.’
Foreign language skills and skills such as literacy and numeracy were felt to be least important skills in the future.
In the follow-up interviews, respondents were also asked how sure they were that the skills they had identified would be in demand over the next two or three years (the time period specified in the telephone survey) and whether skill needs were changing more quickly— ie over six months or a year. Nine out of ten of the interviewees said they were certain or fairly certain that the skill changes identified would occur. Most, over two-thirds, did not think that skill demand was changing more quickly than the two to three period in the question. ‘I don’t think things change that quickly’ said one follow-up interviewee.
Nearly all those who thought skills were changing at a faster pace referred to IT and other technological change, eg the introduction of e-commerce. ‘More and more business is done via the web and people are becoming aware of that and I can see it in this room that everyone of us are getting a lot more comfortable with it and will have to get more capable in the near future,’ explained a respondent to the follow-up interviews from a small construction company. However, in the survey, IT skills were not as commonly identified as a future skill need as some generic skills such as communications.
Although it is important to remember that these interviews were conducted among a small and not necessarily representative sample, the responses on the pace of skill change do bolster confidence in the survey results on future skill demand.
3.8 Key points Internal skill gaps are measured by asking employers to assess the proportion of
their employees who are fully proficient. If they respond that they have a significant number of people who are less than fully proficient in a particular job or occupation, they are classified as having an internal skills gap (using the ‘narrow’ measure).
92
On this basis, 23 per cent of establishments reported an internal skills gap and 59 per cent had at least one employee who they thought was less than fully proficient. Using a different method of calculation, the 2002 survey suggests that some six per cent of employees (just over one million) have a skills gap (using the narrow measure).
Responses in the follow-up interviews indicate employers tend to see proficiency as a high hurdle to cross. Proficient employees, according to the respondents interviewed, are at least ‘up to standard’ and most thought them ‘better than adequate’. Employers linked proficiency to performance, ie not just whether people possessed the required skills but whether they were willing and able to deploy them efficiently and effectively. Relatively few measured proficiency in any systematic way.
There is little cross-over between establishments with a skills gap and those with a skill-related vacancy. Only three per cent reported both and nearly three-quarters of establishments said they faced neither problem.
Skills gaps appeared to be most common among sales staff (particularly in wholesale, retail and hospitality) and least likely to be reported for managerial and professional staff. Other occupations where skills gaps were most prevalent included administrative and secretarial staff (particularly in finance and business services and to a lesser extent, public administration).
The incidence of skills gaps increases with size of establishment, but not uniformly. Smaller workplaces (with between five and 24 employees) were least likely to report an internal skills gap. At least a third of employers with 100 or more employees, have an internal skills gaps — compared with 23 per cent overall.
Transport and communications, and wholesale, retail and hospitality were the sectors where employers were most likely to report an internal skills gap and they were least likely in education.
The main areas of skill deficiency reported were:
• Communication skills — reported in over half of the cases with an internal skills gap and affecting most occupational groups, particularly in personal services
• Customer handling —affecting almost half of the employers with internal gaps and prominent among personal service, sales and professional staff
• Team-working — evenly spread across most occupational groups
• Problem-solving — particularly in personal service and also in associate professional and elementary occupations.
Survey respondents identified lack of experience, and to a lesser extent lack of motivation and a failure to train staff sufficiently as the main reasons for a lack of proficiency
The main response to skill deficiencies among employers was to provide training or increase or expand existing training. Many employers also responded by changing working practices.
In the survey, most employers, 60 per cent, felt there were no barriers to maintaining the proficiency of their employees. Where barriers were reported they
93
generally referred to the lack of sufficient time, cover or funding for training. In the follow-up interviews respondents also a range of individual-centred constraints concerning a lack of personal interest or motivation to improve, change or learn.
Internal skill gaps tend to result in sub-optimal standards of customer service and quality rather than restricting the scope or level of service or products offered by employers. Larger workplaces were more likely to report negative impacts from skill gaps than smaller ones.
Most employers in the survey thought skill needs were likely to change over the next few years to cope with new technology and new working practices (although follow-up interviewees felt the demand for information and communication technology related skills might change more quickly than that).
The most common areas of change expected by employers were: communication skills; customer handling skills; teamworking; and management skills.
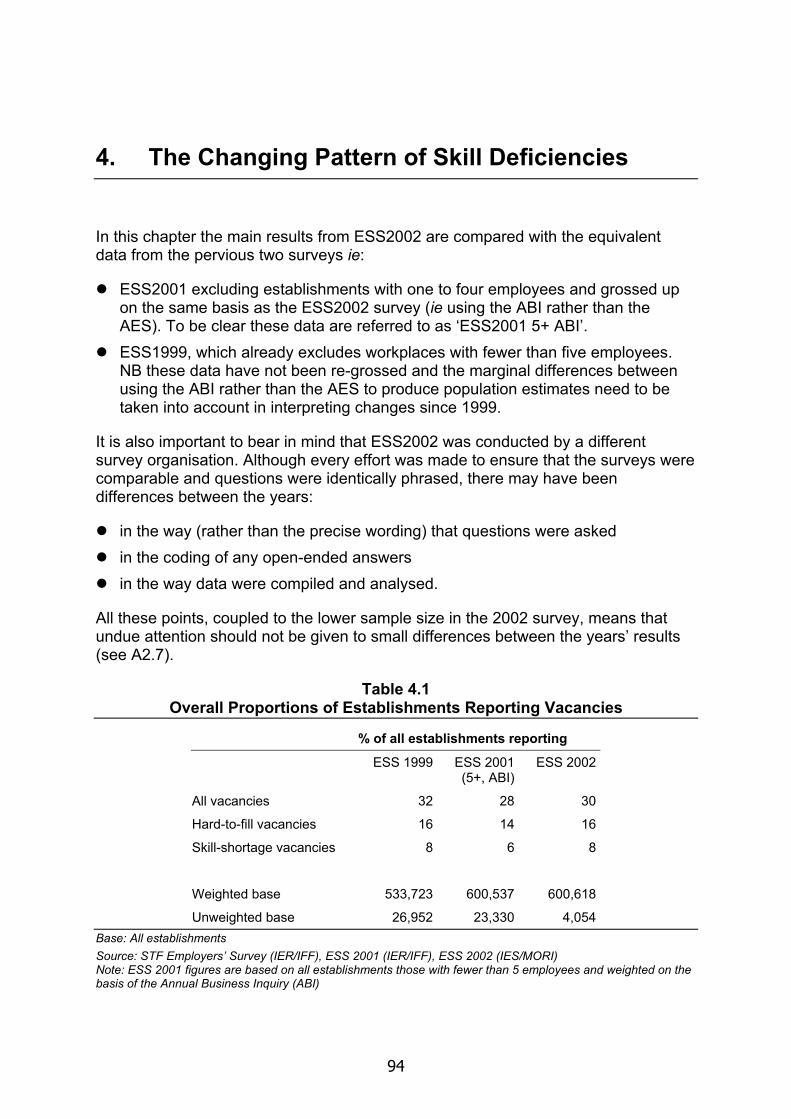
94
4. The Changing Pattern of Skill Deficiencies
In this chapter the main results from ESS2002 are compared with the equivalent data from the pervious two surveys ie:
ESS2001 excluding establishments with one to four employees and grossed up on the same basis as the ESS2002 survey (ie using the ABI rather than the AES). To be clear these data are referred to as ‘ESS2001 5+ ABI’.
ESS1999, which already excludes workplaces with fewer than five employees. NB these data have not been re-grossed and the marginal differences between using the ABI rather than the AES to produce population estimates need to be taken into account in interpreting changes since 1999.
It is also important to bear in mind that ESS2002 was conducted by a different survey organisation. Although every effort was made to ensure that the surveys were comparable and questions were identically phrased, there may have been differences between the years:
in the way (rather than the precise wording) that questions were asked in the coding of any open-ended answers in the way data were compiled and analysed.
All these points, coupled to the lower sample size in the 2002 survey, means that undue attention should not be given to small differences between the years’ results (see A2.7).
Table 4.1 Overall Proportions of Establishments Reporting Vacancies
% of all establishments reporting
ESS 1999 ESS 2001 (5+, ABI)
ESS 2002
All vacancies 32 28 30
Hard-to-fill vacancies 16 14 16
Skill-shortage vacancies 8 6 8
Weighted base 533,723 600,537 600,618
Unweighted base 26,952 23,330 4,054 Base: All establishments Source: STF Employers’ Survey (IER/IFF), ESS 2001 (IER/IFF), ESS 2002 (IES/MORI) Note: ESS 2001 figures are based on all establishments those with fewer than 5 employees and weighted on the basis of the Annual Business Inquiry (ABI)
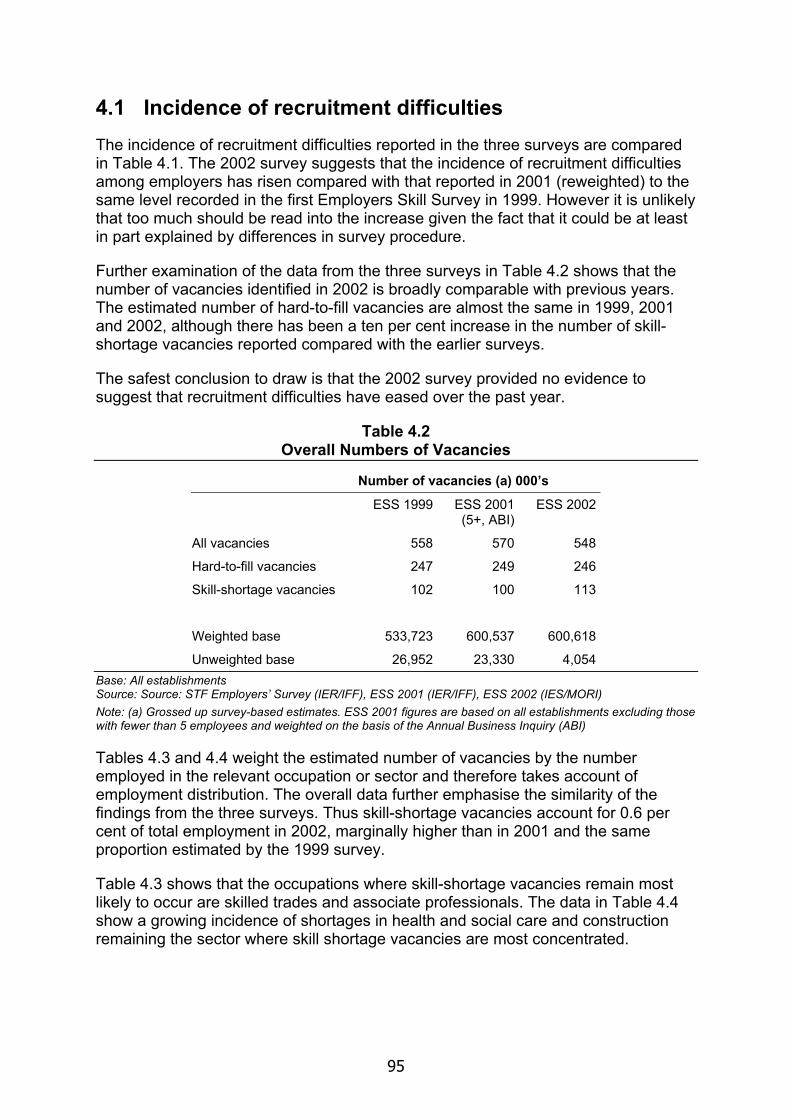
95
4.1 Incidence of recruitment difficulties The incidence of recruitment difficulties reported in the three surveys are compared in Table 4.1. The 2002 survey suggests that the incidence of recruitment difficulties among employers has risen compared with that reported in 2001 (reweighted) to the same level recorded in the first Employers Skill Survey in 1999. However it is unlikely that too much should be read into the increase given the fact that it could be at least in part explained by differences in survey procedure.
Further examination of the data from the three surveys in Table 4.2 shows that the number of vacancies identified in 2002 is broadly comparable with previous years. The estimated number of hard-to-fill vacancies are almost the same in 1999, 2001 and 2002, although there has been a ten per cent increase in the number of skill-shortage vacancies reported compared with the earlier surveys.
The safest conclusion to draw is that the 2002 survey provided no evidence to suggest that recruitment difficulties have eased over the past year.
Table 4.2 Overall Numbers of Vacancies
Number of vacancies (a) 000’s
ESS 1999 ESS 2001 (5+, ABI)
ESS 2002
All vacancies 558 570 548
Hard-to-fill vacancies 247 249 246
Skill-shortage vacancies 102 100 113
Weighted base 533,723 600,537 600,618
Unweighted base 26,952 23,330 4,054 Base: All establishments Source: Source: STF Employers’ Survey (IER/IFF), ESS 2001 (IER/IFF), ESS 2002 (IES/MORI) Note: (a) Grossed up survey-based estimates. ESS 2001 figures are based on all establishments excluding those with fewer than 5 employees and weighted on the basis of the Annual Business Inquiry (ABI)
Tables 4.3 and 4.4 weight the estimated number of vacancies by the number employed in the relevant occupation or sector and therefore takes account of employment distribution. The overall data further emphasise the similarity of the findings from the three surveys. Thus skill-shortage vacancies account for 0.6 per cent of total employment in 2002, marginally higher than in 2001 and the same proportion estimated by the 1999 survey.
Table 4.3 shows that the occupations where skill-shortage vacancies remain most likely to occur are skilled trades and associate professionals. The data in Table 4.4 show a growing incidence of shortages in health and social care and construction remaining the sector where skill shortage vacancies are most concentrated.
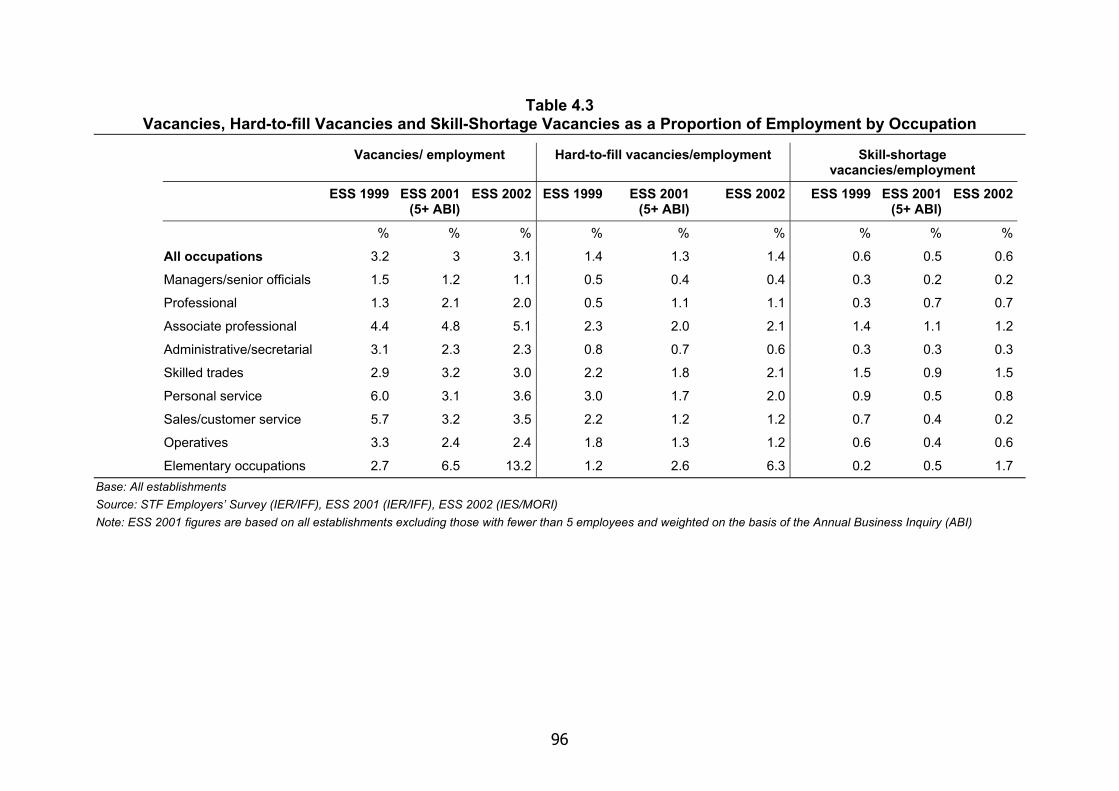
96
Table 4.3 Vacancies, Hard-to-fill Vacancies and Skill-Shortage Vacancies as a Proportion of Employment by Occupation
Vacancies/ employment Hard-to-fill vacancies/employment Skill-shortage vacancies/employment
ESS 1999 ESS 2001 (5+ ABI)
ESS 2002 ESS 1999 ESS 2001 (5+ ABI)
ESS 2002 ESS 1999 ESS 2001 (5+ ABI)
ESS 2002
% % % % % % % % %
All occupations 3.2 3 3.1 1.4 1.3 1.4 0.6 0.5 0.6
Managers/senior officials 1.5 1.2 1.1 0.5 0.4 0.4 0.3 0.2 0.2
Professional 1.3 2.1 2.0 0.5 1.1 1.1 0.3 0.7 0.7
Associate professional 4.4 4.8 5.1 2.3 2.0 2.1 1.4 1.1 1.2
Administrative/secretarial 3.1 2.3 2.3 0.8 0.7 0.6 0.3 0.3 0.3
Skilled trades 2.9 3.2 3.0 2.2 1.8 2.1 1.5 0.9 1.5
Personal service 6.0 3.1 3.6 3.0 1.7 2.0 0.9 0.5 0.8
Sales/customer service 5.7 3.2 3.5 2.2 1.2 1.2 0.7 0.4 0.2
Operatives 3.3 2.4 2.4 1.8 1.3 1.2 0.6 0.4 0.6
Elementary occupations 2.7 6.5 13.2 1.2 2.6 6.3 0.2 0.5 1.7 Base: All establishments Source: STF Employers’ Survey (IER/IFF), ESS 2001 (IER/IFF), ESS 2002 (IES/MORI) Note: ESS 2001 figures are based on all establishments excluding those with fewer than 5 employees and weighted on the basis of the Annual Business Inquiry (ABI)
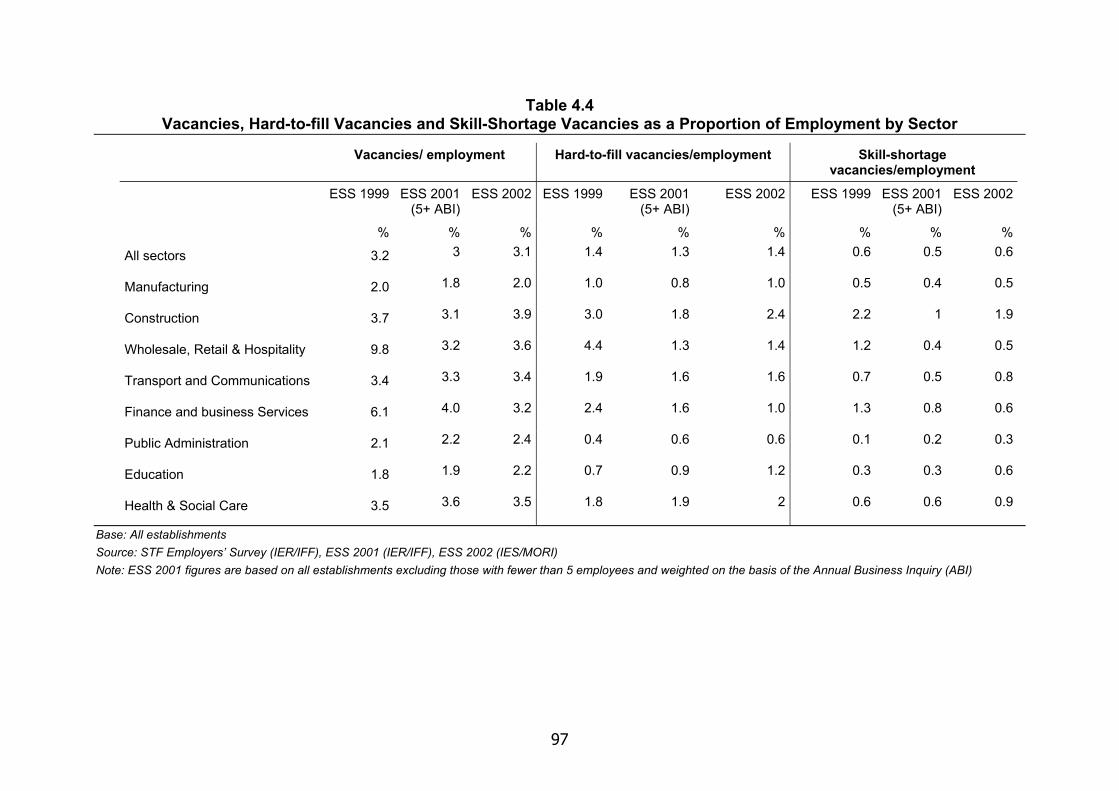
97
Table 4.4 Vacancies, Hard-to-fill Vacancies and Skill-Shortage Vacancies as a Proportion of Employment by Sector
Vacancies/ employment Hard-to-fill vacancies/employment Skill-shortage vacancies/employment
ESS 1999 ESS 2001 (5+ ABI)
ESS 2002 ESS 1999 ESS 2001 (5+ ABI)
ESS 2002 ESS 1999 ESS 2001 (5+ ABI)
ESS 2002
% % % % % % % % %
All sectors 3.2 3 3.1 1.4 1.3 1.4 0.6 0.5 0.6
Manufacturing 2.0 1.8 2.0 1.0 0.8 1.0 0.5 0.4 0.5
Construction 3.7 3.1 3.9 3.0 1.8 2.4 2.2 1 1.9
Wholesale, Retail & Hospitality 9.8 3.2 3.6 4.4 1.3 1.4 1.2 0.4 0.5
Transport and Communications 3.4 3.3 3.4 1.9 1.6 1.6 0.7 0.5 0.8
Finance and business Services 6.1 4.0 3.2 2.4 1.6 1.0 1.3 0.8 0.6
Public Administration 2.1 2.2 2.4 0.4 0.6 0.6 0.1 0.2 0.3
Education 1.8 1.9 2.2 0.7 0.9 1.2 0.3 0.3 0.6
Health & Social Care 3.5 3.6 3.5 1.8 1.9 2 0.6 0.6 0.9
Base: All establishments Source: STF Employers’ Survey (IER/IFF), ESS 2001 (IER/IFF), ESS 2002 (IES/MORI) Note: ESS 2001 figures are based on all establishments excluding those with fewer than 5 employees and weighted on the basis of the Annual Business Inquiry (ABI)
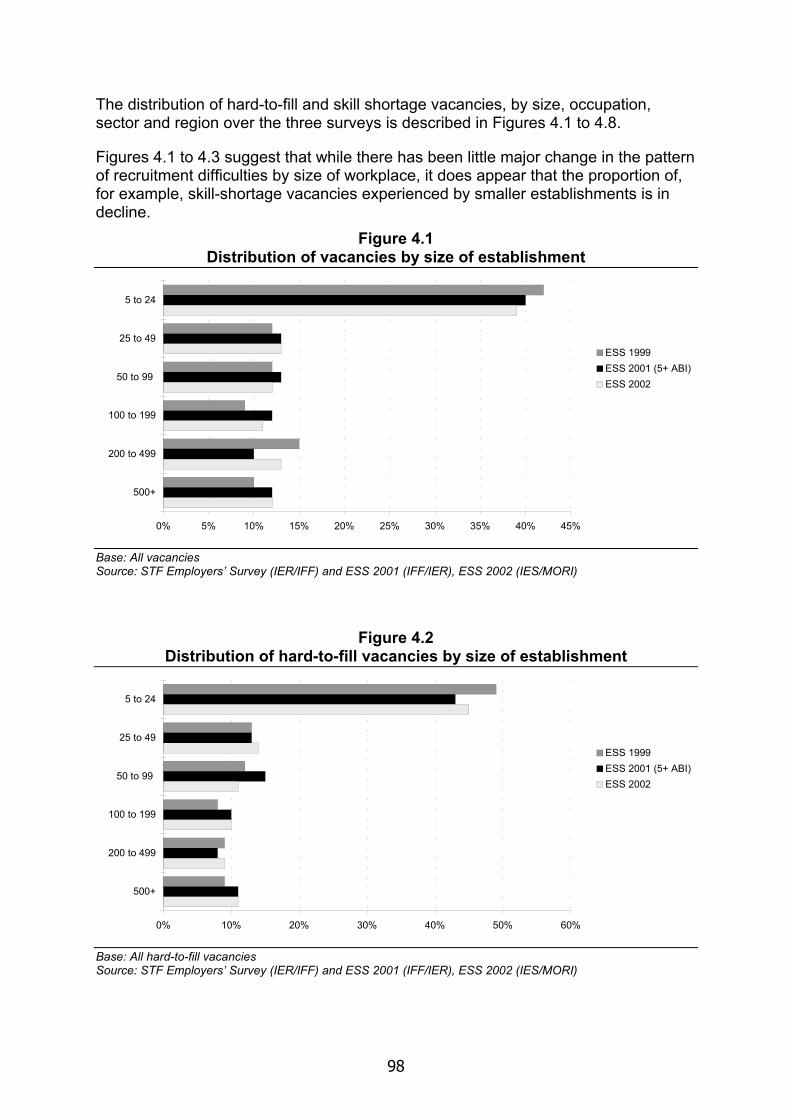
98
The distribution of hard-to-fill and skill shortage vacancies, by size, occupation, sector and region over the three surveys is described in Figures 4.1 to 4.8.
Figures 4.1 to 4.3 suggest that while there has been little major change in the pattern of recruitment difficulties by size of workplace, it does appear that the proportion of, for example, skill-shortage vacancies experienced by smaller establishments is in decline.
Figure 4.1 Distribution of vacancies by size of establishment
0% 5% 10% 15% 20% 25% 30% 35% 40% 45%
5 to 24
25 to 49
50 to 99
100 to 199
200 to 499
500+
ESS 1999ESS 2001 (5+ ABI)ESS 2002
Base: All vacancies Source: STF Employers’ Survey (IER/IFF) and ESS 2001 (IFF/IER), ESS 2002 (IES/MORI)
Figure 4.2 Distribution of hard-to-fill vacancies by size of establishment
0% 10% 20% 30% 40% 50% 60%
5 to 24
25 to 49
50 to 99
100 to 199
200 to 499
500+
ESS 1999ESS 2001 (5+ ABI)ESS 2002
Base: All hard-to-fill vacancies Source: STF Employers’ Survey (IER/IFF) and ESS 2001 (IFF/IER), ESS 2002 (IES/MORI)
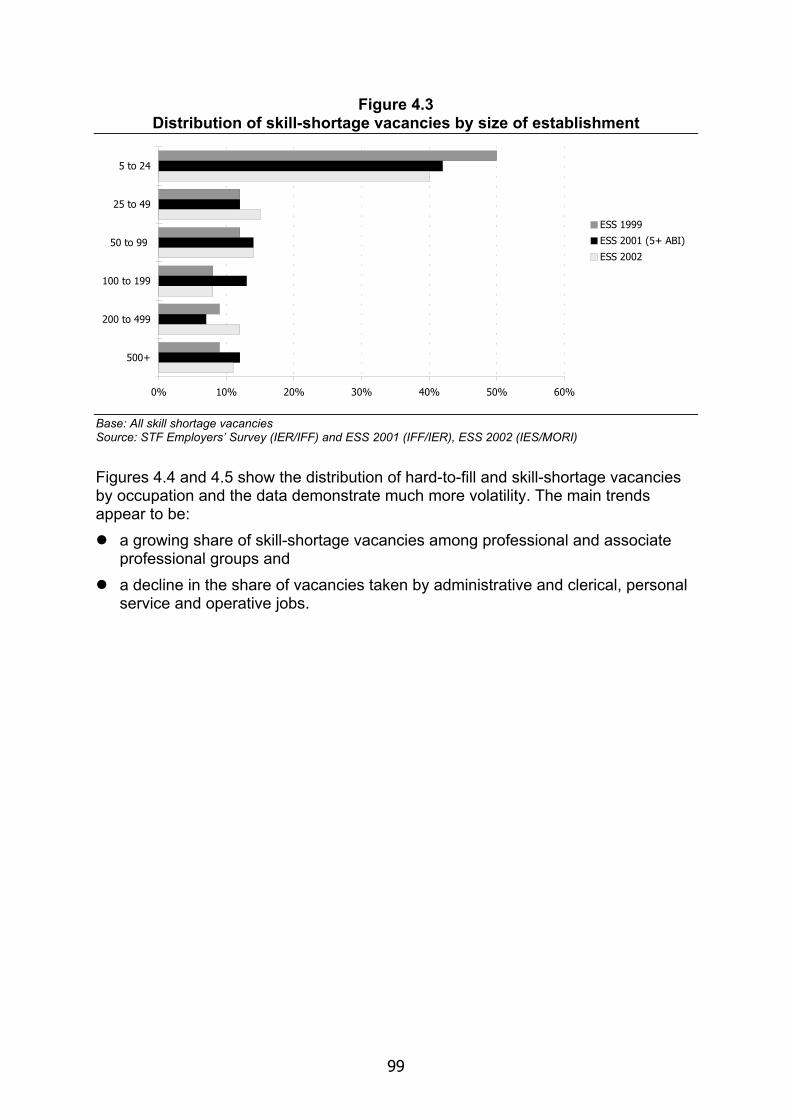
99
Figure 4.3 Distribution of skill-shortage vacancies by size of establishment
0% 10% 20% 30% 40% 50% 60%
5 to 24
25 to 49
50 to 99
100 to 199
200 to 499
500+
ESS 1999
ESS 2001 (5+ ABI)
ESS 2002
Base: All skill shortage vacancies Source: STF Employers’ Survey (IER/IFF) and ESS 2001 (IFF/IER), ESS 2002 (IES/MORI)
Figures 4.4 and 4.5 show the distribution of hard-to-fill and skill-shortage vacancies by occupation and the data demonstrate much more volatility. The main trends appear to be:
a growing share of skill-shortage vacancies among professional and associate professional groups and
a decline in the share of vacancies taken by administrative and clerical, personal service and operative jobs.
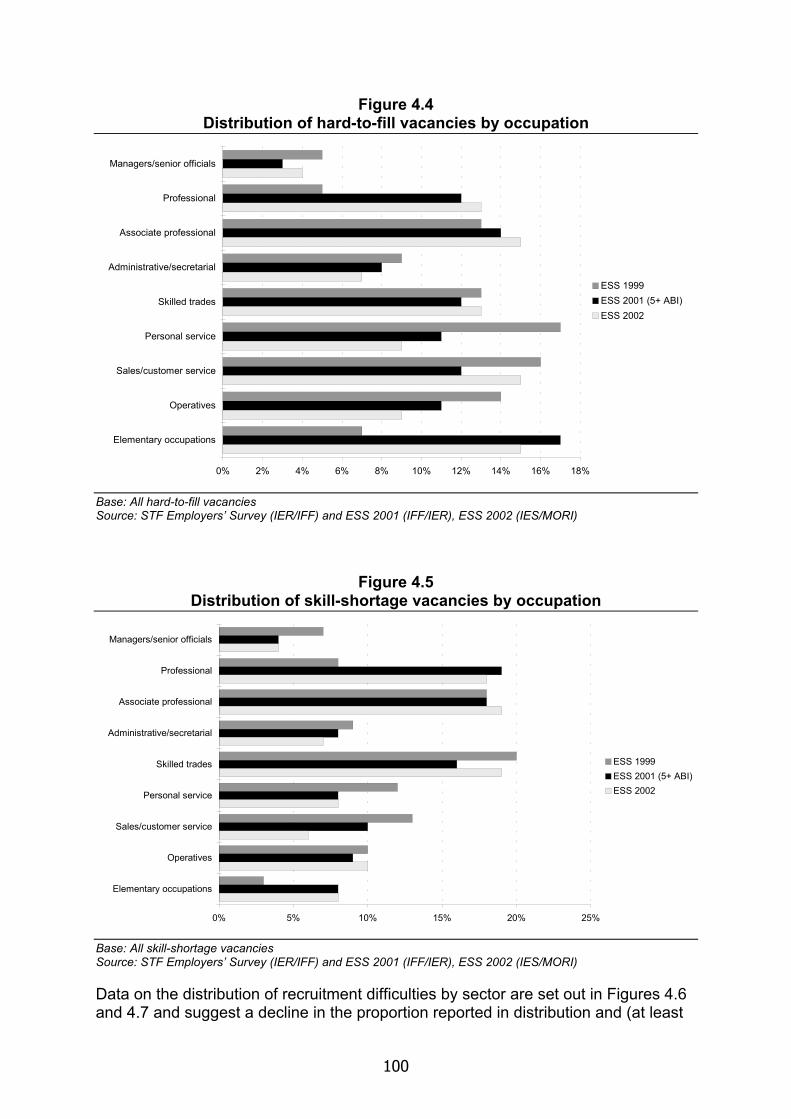
100
Figure 4.4 Distribution of hard-to-fill vacancies by occupation
0% 2% 4% 6% 8% 10% 12% 14% 16% 18%
Managers/senior officials
Professional
Associate professional
Administrative/secretarial
Skilled trades
Personal service
Sales/customer service
Operatives
Elementary occupations
ESS 1999ESS 2001 (5+ ABI)ESS 2002
Base: All hard-to-fill vacancies Source: STF Employers’ Survey (IER/IFF) and ESS 2001 (IFF/IER), ESS 2002 (IES/MORI)
Figure 4.5 Distribution of skill-shortage vacancies by occupation
0% 5% 10% 15% 20% 25%
Managers/senior officials
Professional
Associate professional
Administrative/secretarial
Skilled trades
Personal service
Sales/customer service
Operatives
Elementary occupations
ESS 1999ESS 2001 (5+ ABI)ESS 2002
Base: All skill-shortage vacancies Source: STF Employers’ Survey (IER/IFF) and ESS 2001 (IFF/IER), ESS 2002 (IES/MORI)
Data on the distribution of recruitment difficulties by sector are set out in Figures 4.6 and 4.7 and suggest a decline in the proportion reported in distribution and (at least
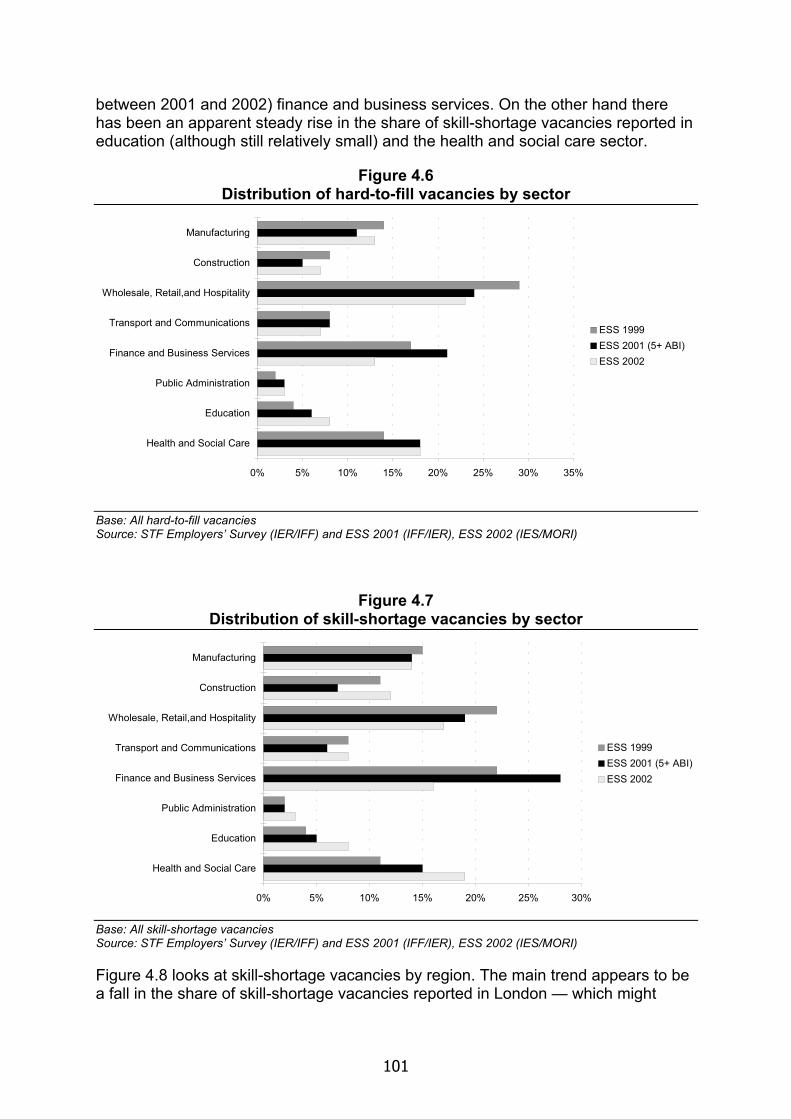
101
between 2001 and 2002) finance and business services. On the other hand there has been an apparent steady rise in the share of skill-shortage vacancies reported in education (although still relatively small) and the health and social care sector.
Figure 4.6 Distribution of hard-to-fill vacancies by sector
0% 5% 10% 15% 20% 25% 30% 35%
Manufacturing
Construction
Wholesale, Retail,and Hospitality
Transport and Communications
Finance and Business Services
Public Administration
Education
Health and Social Care
ESS 1999ESS 2001 (5+ ABI)ESS 2002
Base: All hard-to-fill vacancies Source: STF Employers’ Survey (IER/IFF) and ESS 2001 (IFF/IER), ESS 2002 (IES/MORI)
Figure 4.7 Distribution of skill-shortage vacancies by sector
0% 5% 10% 15% 20% 25% 30%
Manufacturing
Construction
Wholesale, Retail,and Hospitality
Transport and Communications
Finance and Business Services
Public Administration
Education
Health and Social Care
ESS 1999ESS 2001 (5+ ABI)ESS 2002
Base: All skill-shortage vacancies Source: STF Employers’ Survey (IER/IFF) and ESS 2001 (IFF/IER), ESS 2002 (IES/MORI)
Figure 4.8 looks at skill-shortage vacancies by region. The main trend appears to be a fall in the share of skill-shortage vacancies reported in London — which might
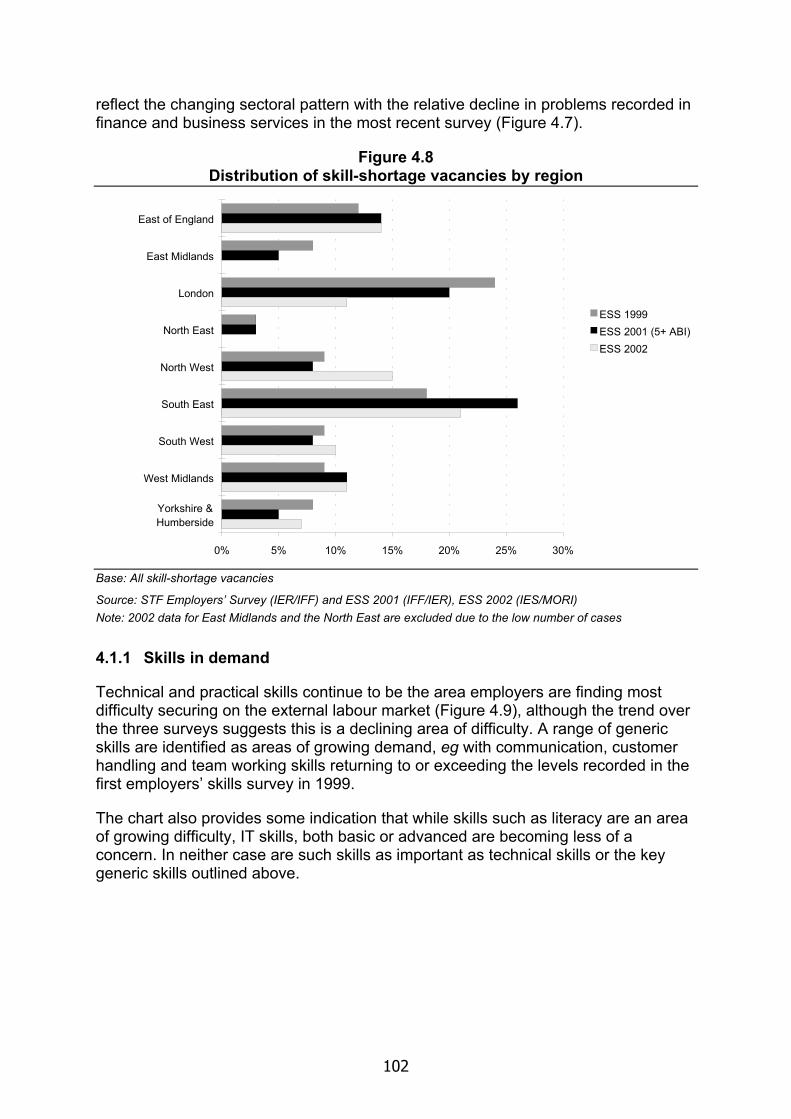
102
reflect the changing sectoral pattern with the relative decline in problems recorded in finance and business services in the most recent survey (Figure 4.7).
Figure 4.8 Distribution of skill-shortage vacancies by region
0% 5% 10% 15% 20% 25% 30%
East of England
East Midlands
London
North East
North West
South East
South West
West Midlands
Yorkshire &Humberside
ESS 1999ESS 2001 (5+ ABI)ESS 2002
Base: All skill-shortage vacancies
Source: STF Employers’ Survey (IER/IFF) and ESS 2001 (IFF/IER), ESS 2002 (IES/MORI) Note: 2002 data for East Midlands and the North East are excluded due to the low number of cases
4.1.1 Skills in demand
Technical and practical skills continue to be the area employers are finding most difficulty securing on the external labour market (Figure 4.9), although the trend over the three surveys suggests this is a declining area of difficulty. A range of generic skills are identified as areas of growing demand, eg with communication, customer handling and team working skills returning to or exceeding the levels recorded in the first employers’ skills survey in 1999.
The chart also provides some indication that while skills such as literacy are an area of growing difficulty, IT skills, both basic or advanced are becoming less of a concern. In neither case are such skills as important as technical skills or the key generic skills outlined above.
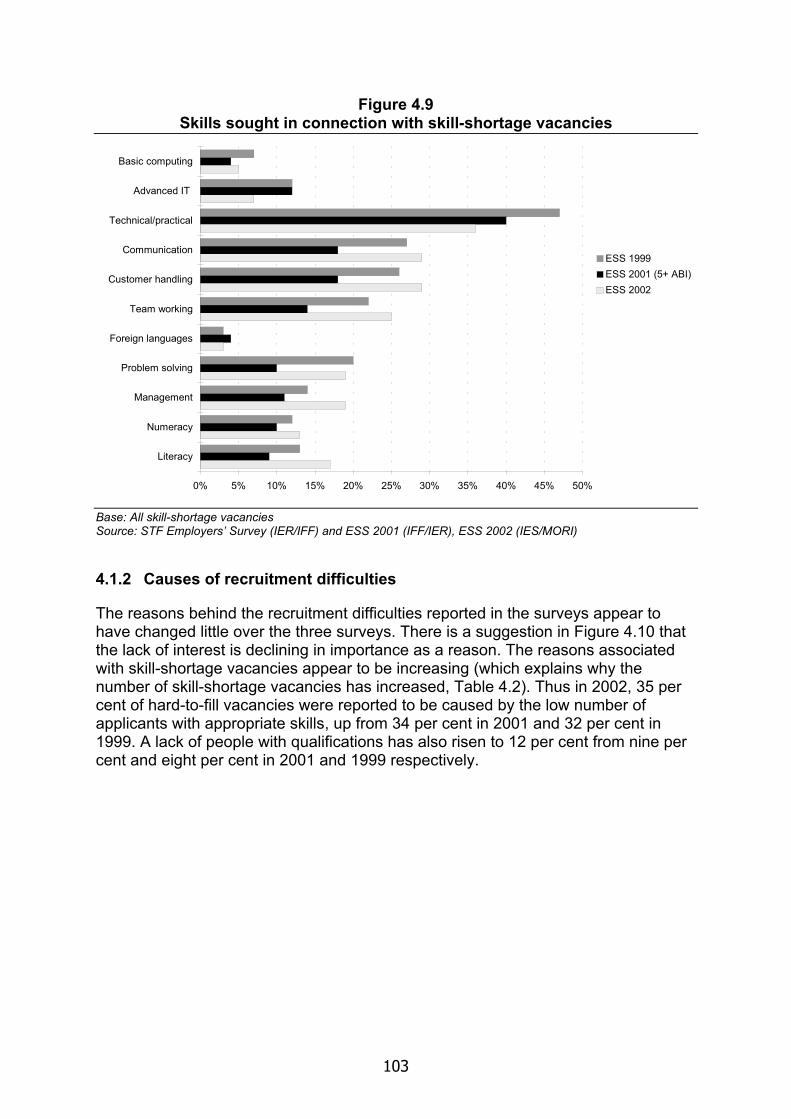
103
Figure 4.9 Skills sought in connection with skill-shortage vacancies
0% 5% 10% 15% 20% 25% 30% 35% 40% 45% 50%
Basic computing
Advanced IT
Technical/practical
Communication
Customer handling
Team working
Foreign languages
Problem solving
Management
Numeracy
Literacy
ESS 1999ESS 2001 (5+ ABI)ESS 2002
Base: All skill-shortage vacancies Source: STF Employers’ Survey (IER/IFF) and ESS 2001 (IFF/IER), ESS 2002 (IES/MORI)
4.1.2 Causes of recruitment difficulties
The reasons behind the recruitment difficulties reported in the surveys appear to have changed little over the three surveys. There is a suggestion in Figure 4.10 that the lack of interest is declining in importance as a reason. The reasons associated with skill-shortage vacancies appear to be increasing (which explains why the number of skill-shortage vacancies has increased, Table 4.2). Thus in 2002, 35 per cent of hard-to-fill vacancies were reported to be caused by the low number of applicants with appropriate skills, up from 34 per cent in 2001 and 32 per cent in 1999. A lack of people with qualifications has also risen to 12 per cent from nine per cent and eight per cent in 2001 and 1999 respectively.
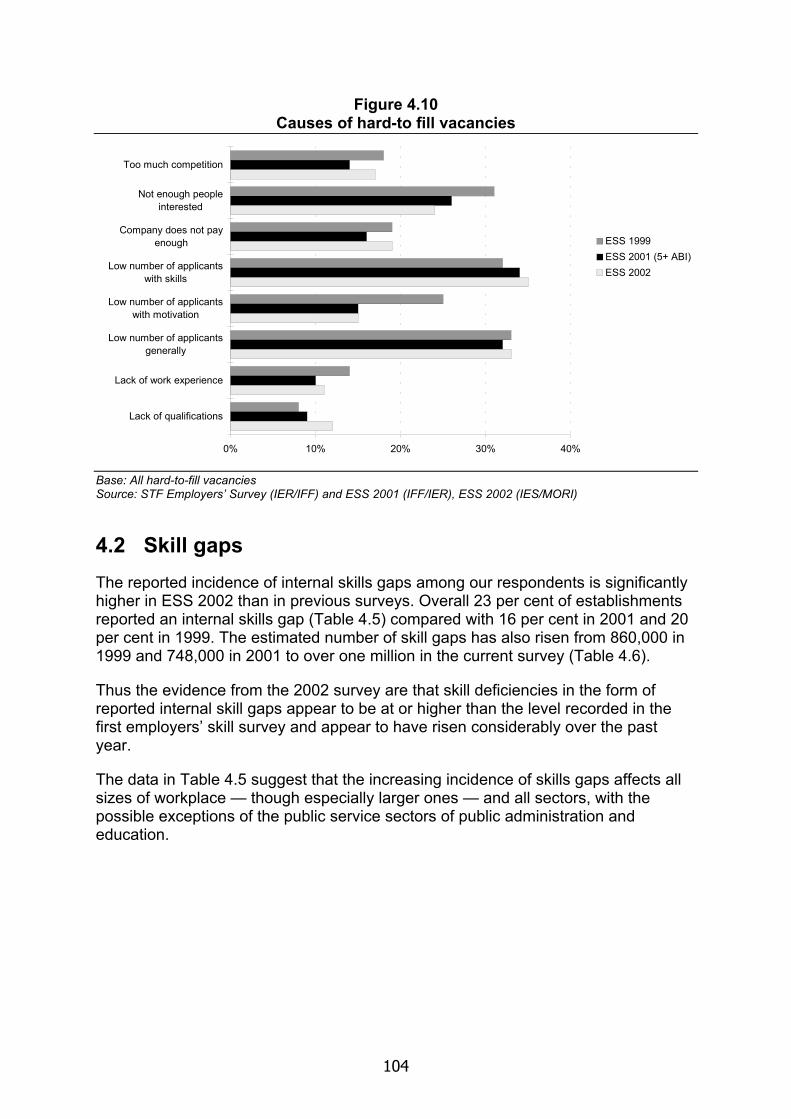
104
Figure 4.10 Causes of hard-to fill vacancies
0% 10% 20% 30% 40%
Too much competition
Not enough peopleinterested
Company does not payenough
Low number of applicantswith skills
Low number of applicantswith motivation
Low number of applicantsgenerally
Lack of work experience
Lack of qualifications
ESS 1999ESS 2001 (5+ ABI)ESS 2002
Base: All hard-to-fill vacancies Source: STF Employers’ Survey (IER/IFF) and ESS 2001 (IFF/IER), ESS 2002 (IES/MORI)
4.2 Skill gaps The reported incidence of internal skills gaps among our respondents is significantly higher in ESS 2002 than in previous surveys. Overall 23 per cent of establishments reported an internal skills gap (Table 4.5) compared with 16 per cent in 2001 and 20 per cent in 1999. The estimated number of skill gaps has also risen from 860,000 in 1999 and 748,000 in 2001 to over one million in the current survey (Table 4.6).
Thus the evidence from the 2002 survey are that skill deficiencies in the form of reported internal skill gaps appear to be at or higher than the level recorded in the first employers’ skill survey and appear to have risen considerably over the past year.
The data in Table 4.5 suggest that the increasing incidence of skills gaps affects all sizes of workplace — though especially larger ones — and all sectors, with the possible exceptions of the public service sectors of public administration and education.
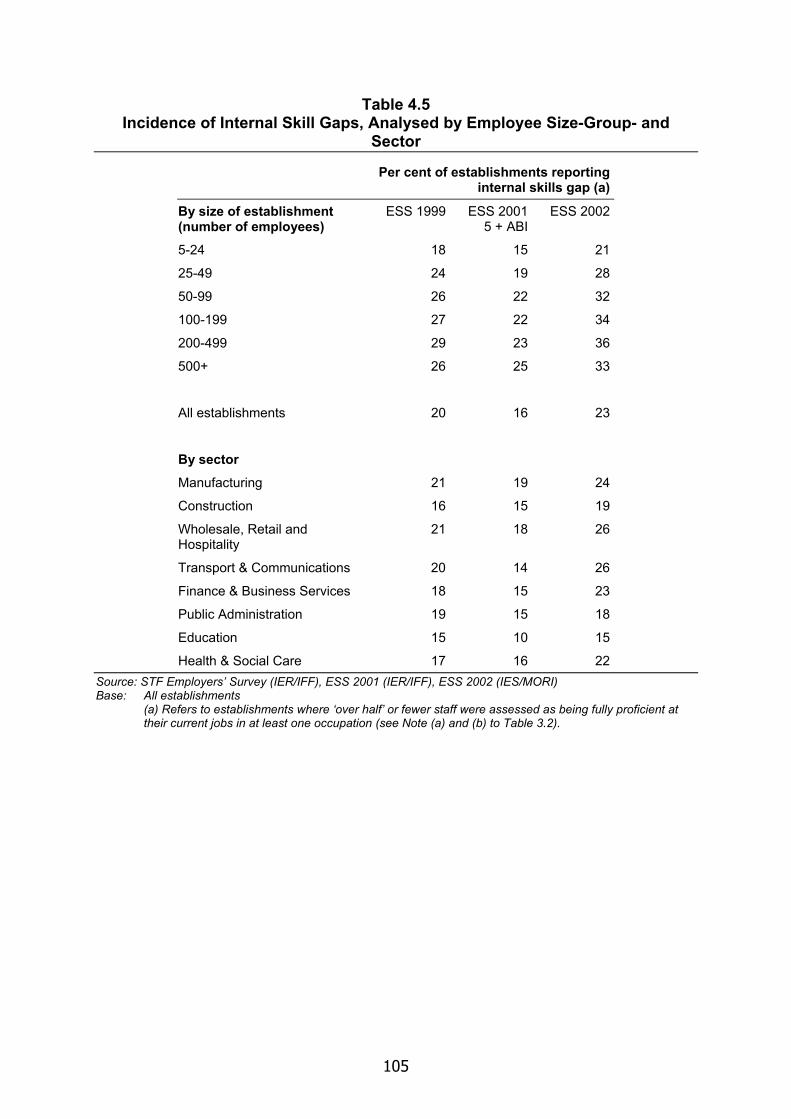
105
Table 4.5 Incidence of Internal Skill Gaps, Analysed by Employee Size-Group- and
Sector
Per cent of establishments reporting internal skills gap (a)
By size of establishment (number of employees)
ESS 1999 ESS 2001 5 + ABI
ESS 2002
5-24 18 15 21
25-49 24 19 28
50-99 26 22 32
100-199 27 22 34
200-499 29 23 36
500+ 26 25 33
All establishments 20 16 23
By sector
Manufacturing 21 19 24
Construction 16 15 19
Wholesale, Retail and Hospitality
21 18 26
Transport & Communications 20 14 26
Finance & Business Services 18 15 23
Public Administration 19 15 18
Education 15 10 15
Health & Social Care 17 16 22 Source: STF Employers’ Survey (IER/IFF), ESS 2001 (IER/IFF), ESS 2002 (IES/MORI) Base: All establishments
(a) Refers to establishments where ‘over half’ or fewer staff were assessed as being fully proficient at their current jobs in at least one occupation (see Note (a) and (b) to Table 3.2).
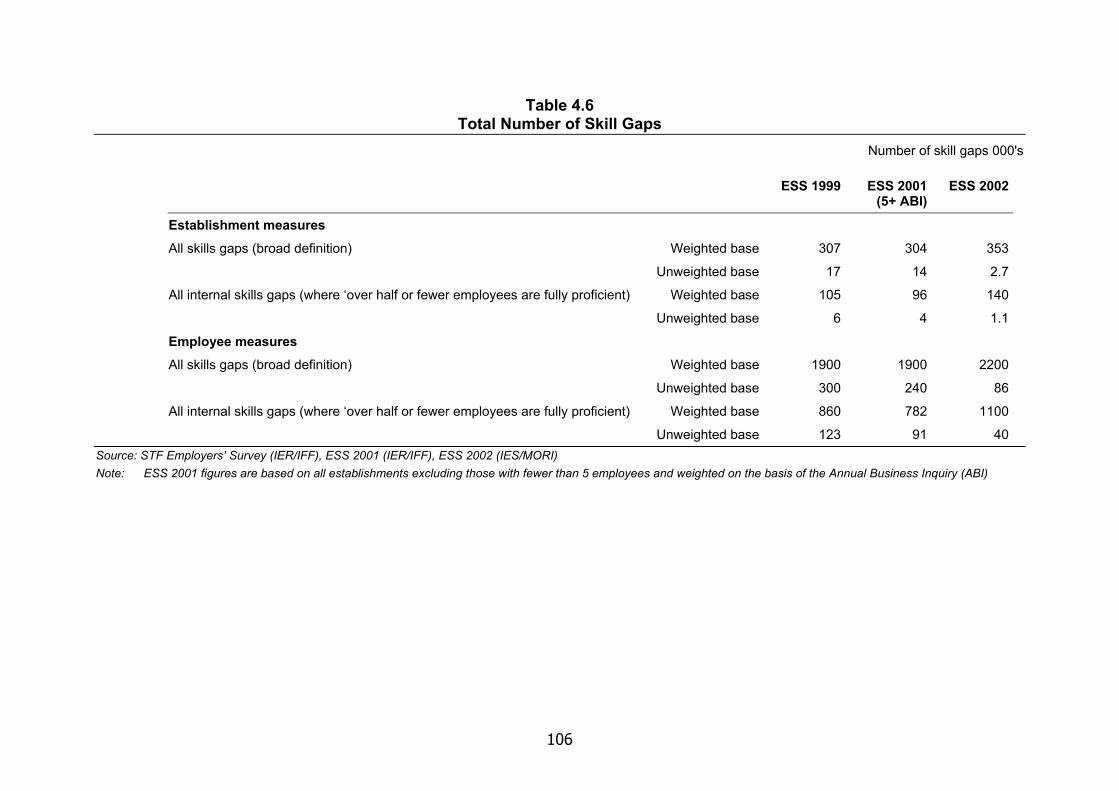
106
Table 4.6 Total Number of Skill Gaps
Number of skill gaps 000's
ESS 1999 ESS 2001 (5+ ABI)
ESS 2002
Establishment measures Weighted base 307 304 353 All skills gaps (broad definition)
Unweighted base 17 14 2.7
Weighted base 105 96 140 All internal skills gaps (where ‘over half or fewer employees are fully proficient)
Unweighted base 6 4 1.1
Employee measures Weighted base 1900 1900 2200 All skills gaps (broad definition)
Unweighted base 300 240 86
Weighted base 860 782 1100 All internal skills gaps (where ‘over half or fewer employees are fully proficient)
Unweighted base 123 91 40 Source: STF Employers’ Survey (IER/IFF), ESS 2001 (IER/IFF), ESS 2002 (IES/MORI) Note: ESS 2001 figures are based on all establishments excluding those with fewer than 5 employees and weighted on the basis of the Annual Business Inquiry (ABI)
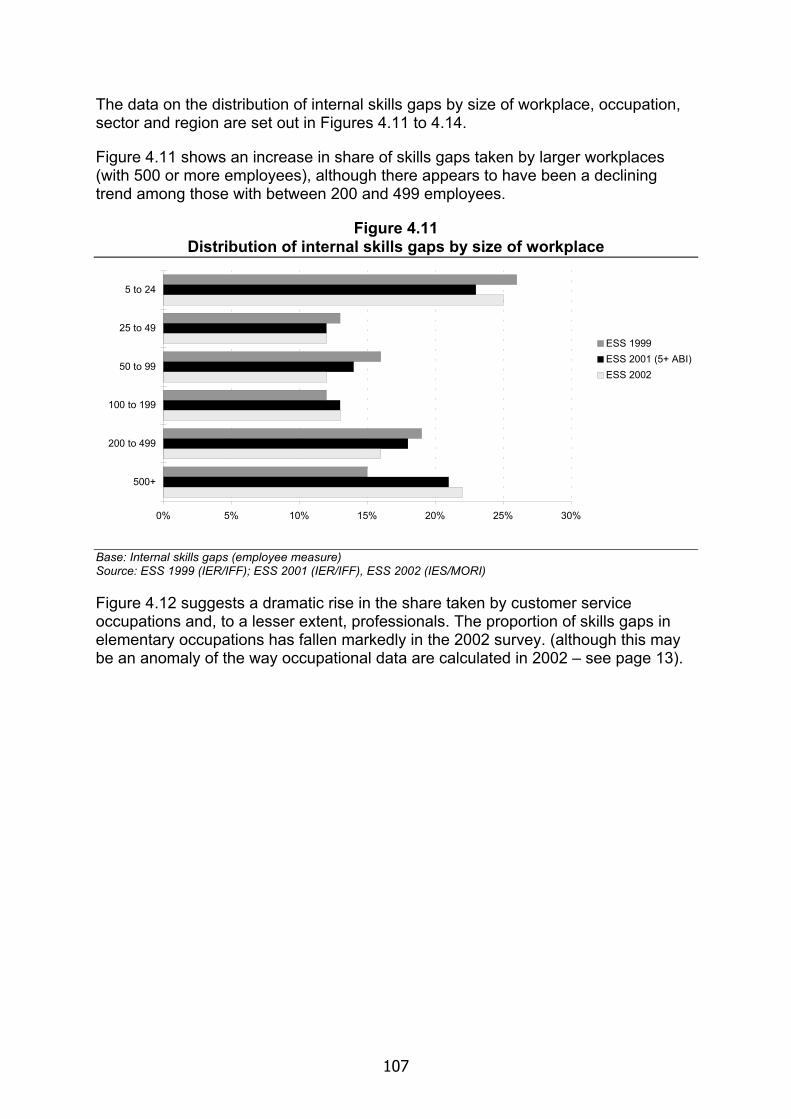
107
The data on the distribution of internal skills gaps by size of workplace, occupation, sector and region are set out in Figures 4.11 to 4.14.
Figure 4.11 shows an increase in share of skills gaps taken by larger workplaces (with 500 or more employees), although there appears to have been a declining trend among those with between 200 and 499 employees.
Figure 4.11 Distribution of internal skills gaps by size of workplace
0% 5% 10% 15% 20% 25% 30%
5 to 24
25 to 49
50 to 99
100 to 199
200 to 499
500+
ESS 1999ESS 2001 (5+ ABI)ESS 2002
Base: Internal skills gaps (employee measure) Source: ESS 1999 (IER/IFF); ESS 2001 (IER/IFF), ESS 2002 (IES/MORI)
Figure 4.12 suggests a dramatic rise in the share taken by customer service occupations and, to a lesser extent, professionals. The proportion of skills gaps in elementary occupations has fallen markedly in the 2002 survey. (although this may be an anomaly of the way occupational data are calculated in 2002 – see page 13).
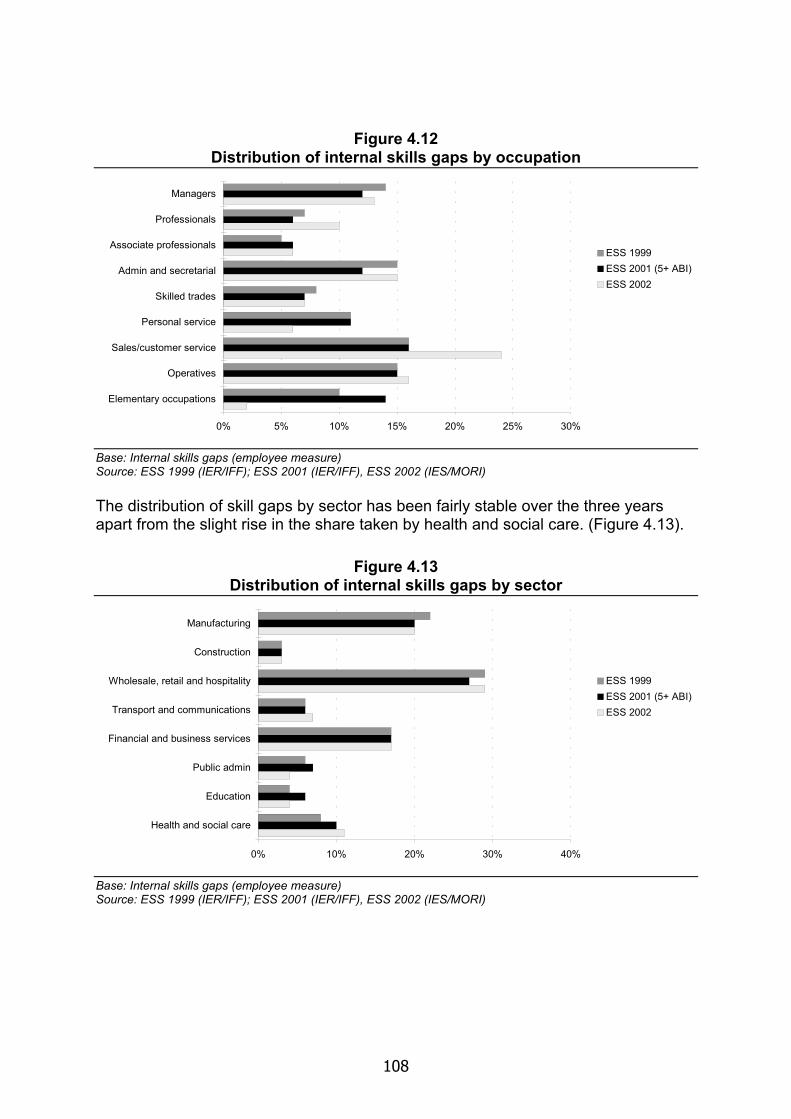
108
Figure 4.12 Distribution of internal skills gaps by occupation
0% 5% 10% 15% 20% 25% 30%
Managers
Professionals
Associate professionals
Admin and secretarial
Skilled trades
Personal service
Sales/customer service
Operatives
Elementary occupations
ESS 1999ESS 2001 (5+ ABI)ESS 2002
Base: Internal skills gaps (employee measure) Source: ESS 1999 (IER/IFF); ESS 2001 (IER/IFF), ESS 2002 (IES/MORI) The distribution of skill gaps by sector has been fairly stable over the three years apart from the slight rise in the share taken by health and social care. (Figure 4.13).
Figure 4.13 Distribution of internal skills gaps by sector
0% 10% 20% 30% 40%
Manufacturing
Construction
Wholesale, retail and hospitality
Transport and communications
Financial and business services
Public admin
Education
Health and social care
ESS 1999ESS 2001 (5+ ABI)ESS 2002
Base: Internal skills gaps (employee measure) Source: ESS 1999 (IER/IFF); ESS 2001 (IER/IFF), ESS 2002 (IES/MORI)
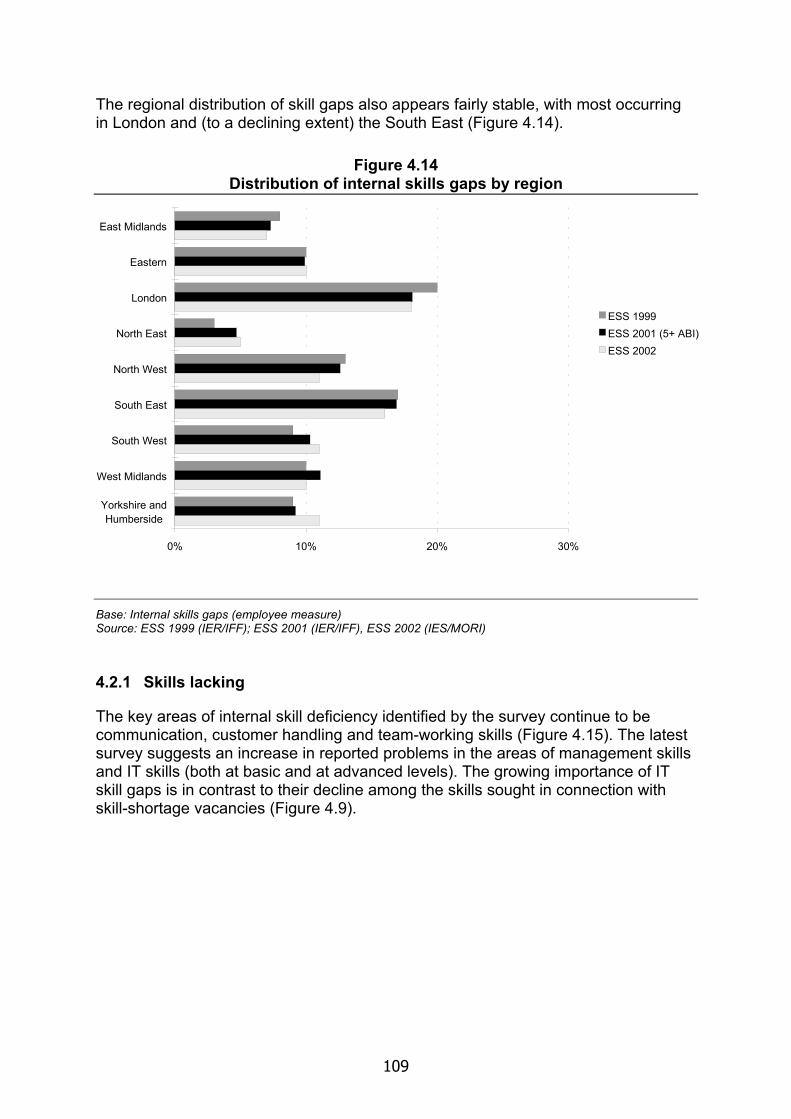
109
The regional distribution of skill gaps also appears fairly stable, with most occurring in London and (to a declining extent) the South East (Figure 4.14).
Figure 4.14 Distribution of internal skills gaps by region
0% 10% 20% 30%
East Midlands
Eastern
London
North East
North West
South East
South West
West Midlands
Yorkshire andHumberside
ESS 1999ESS 2001 (5+ ABI)ESS 2002
Base: Internal skills gaps (employee measure) Source: ESS 1999 (IER/IFF); ESS 2001 (IER/IFF), ESS 2002 (IES/MORI)
4.2.1 Skills lacking
The key areas of internal skill deficiency identified by the survey continue to be communication, customer handling and team-working skills (Figure 4.15). The latest survey suggests an increase in reported problems in the areas of management skills and IT skills (both at basic and at advanced levels). The growing importance of IT skill gaps is in contrast to their decline among the skills sought in connection with skill-shortage vacancies (Figure 4.9).
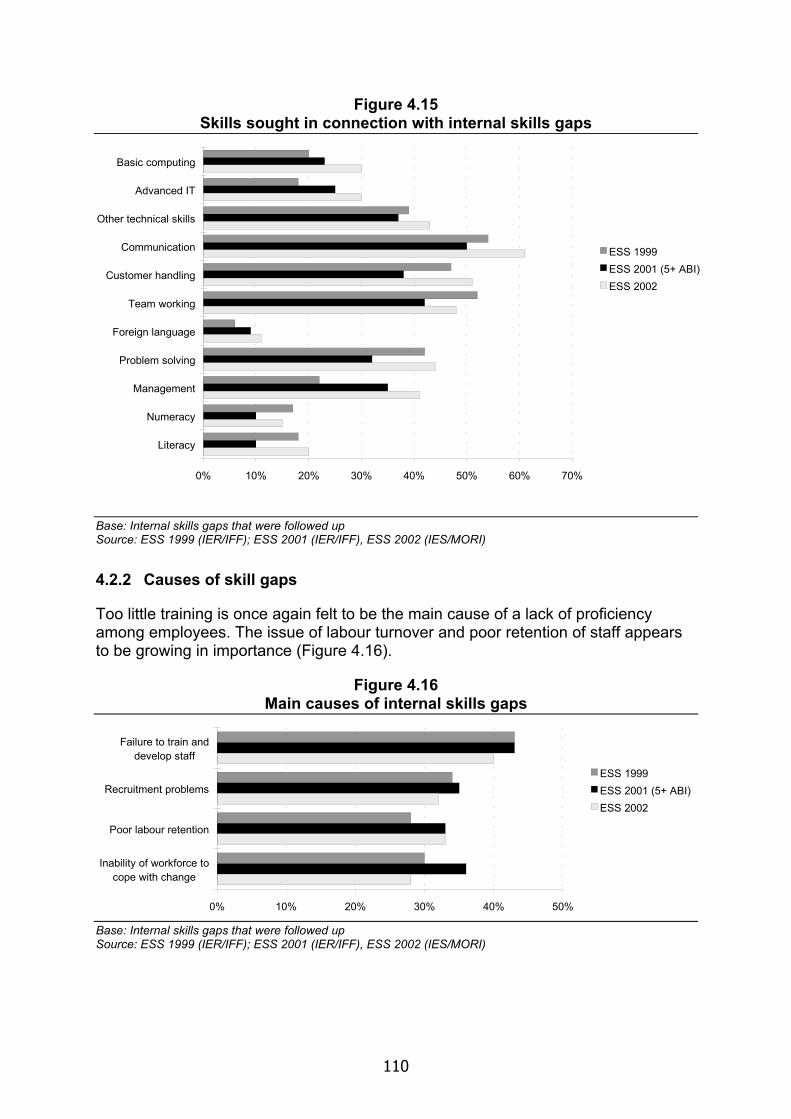
110
Figure 4.15 Skills sought in connection with internal skills gaps
0% 10% 20% 30% 40% 50% 60% 70%
Basic computing
Advanced IT
Other technical skills
Communication
Customer handling
Team working
Foreign language
Problem solving
Management
Numeracy
Literacy
ESS 1999ESS 2001 (5+ ABI)ESS 2002
Base: Internal skills gaps that were followed up Source: ESS 1999 (IER/IFF); ESS 2001 (IER/IFF), ESS 2002 (IES/MORI)
4.2.2 Causes of skill gaps
Too little training is once again felt to be the main cause of a lack of proficiency among employees. The issue of labour turnover and poor retention of staff appears to be growing in importance (Figure 4.16).
Figure 4.16 Main causes of internal skills gaps
0% 10% 20% 30% 40% 50%
Failure to train anddevelop staff
Recruitment problems
Poor labour retention
Inability of workforce tocope with change
ESS 1999ESS 2001 (5+ ABI)ESS 2002
Base: Internal skills gaps that were followed up Source: ESS 1999 (IER/IFF); ESS 2001 (IER/IFF), ESS 2002 (IES/MORI)
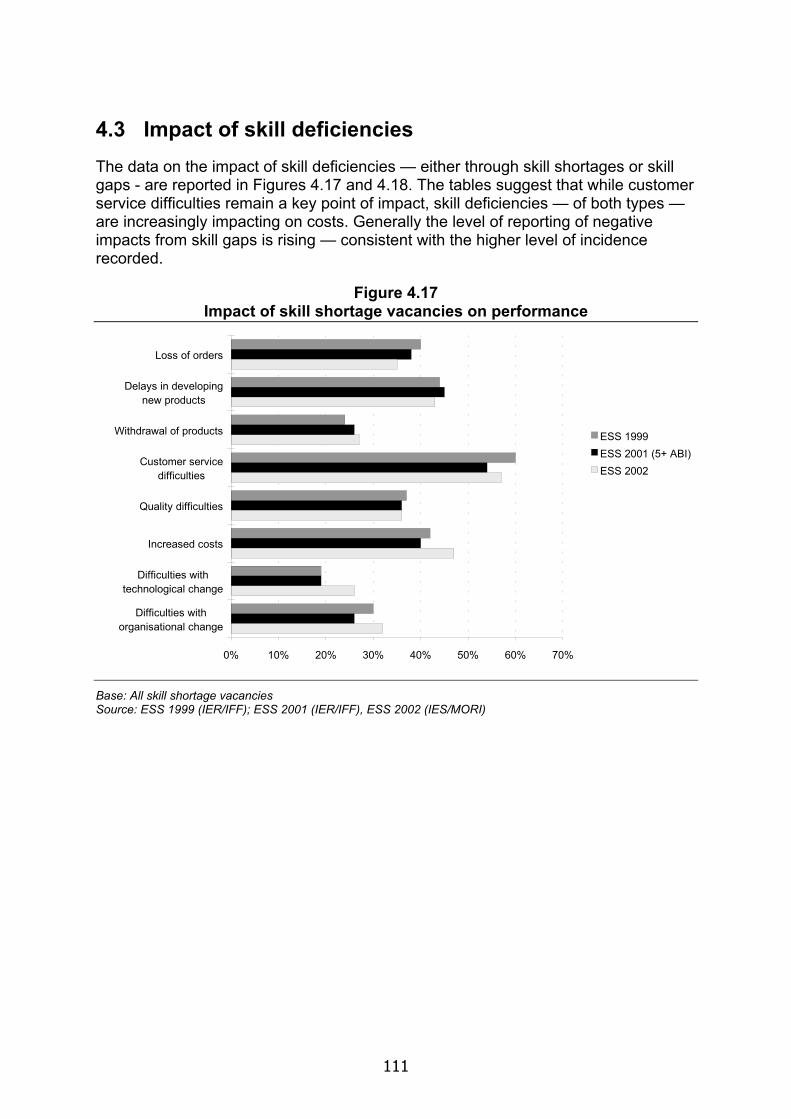
111
4.3 Impact of skill deficiencies The data on the impact of skill deficiencies — either through skill shortages or skill gaps - are reported in Figures 4.17 and 4.18. The tables suggest that while customer service difficulties remain a key point of impact, skill deficiencies — of both types — are increasingly impacting on costs. Generally the level of reporting of negative impacts from skill gaps is rising — consistent with the higher level of incidence recorded.
Figure 4.17 Impact of skill shortage vacancies on performance
0% 10% 20% 30% 40% 50% 60% 70%
Loss of orders
Delays in developingnew products
Withdrawal of products
Customer servicedifficulties
Quality difficulties
Increased costs
Difficulties withtechnological change
Difficulties withorganisational change
ESS 1999ESS 2001 (5+ ABI)ESS 2002
Base: All skill shortage vacancies Source: ESS 1999 (IER/IFF); ESS 2001 (IER/IFF), ESS 2002 (IES/MORI)

112
Figure 4.18 Impact of internal skills gaps on performance
0% 10% 20% 30% 40% 50% 60%
Loss of orders
Delays in developingnew products
Withdrawal of products
Customer servicedifficulties
Quality difficulties
Increased costs
Difficulties withtechnological change
Difficulties withorganisational change
ESS 1999ESS 2001 (5+ ABI)ESS 2002
Base: Internal skills gaps that were followed up Source: ESS 1999 (IER/IFF); ESS 2001 (IER/IFF), ESS 2002 (IES/MORI)
4.3.1 Solutions to skill deficiencies
Employers continue to adopt a range of approaches to dealing with their recruitment difficulties (Figure 4.19) and skills gaps (Figure 4.20). There are some suggestions of an increased willingness to adopt radical solutions, perhaps in the face of long-running difficulties, with a growth in the numbers saying that they had redefined existing jobs, changed working practices and/or relocated work within the organisation.
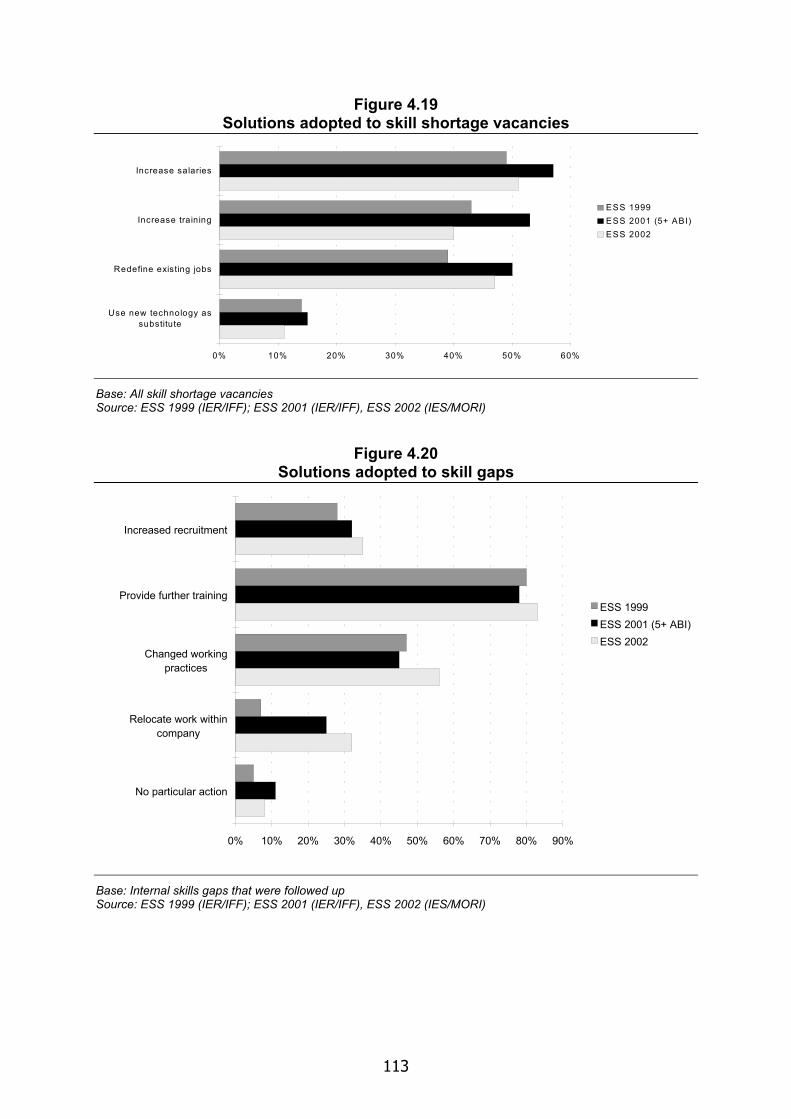
113
Figure 4.19 Solutions adopted to skill shortage vacancies
0% 10% 20% 30% 40% 50% 60%
Increase salaries
Increase training
Redefine existing jobs
Use new technology assubstitute
ESS 1999ESS 2001 (5+ ABI)ESS 2002
Base: All skill shortage vacancies Source: ESS 1999 (IER/IFF); ESS 2001 (IER/IFF), ESS 2002 (IES/MORI)
Figure 4.20 Solutions adopted to skill gaps
0% 10% 20% 30% 40% 50% 60% 70% 80% 90%
Increased recruitment
Provide further training
Changed workingpractices
Relocate work withincompany
No particular action
ESS 1999ESS 2001 (5+ ABI)ESS 2002
Base: Internal skills gaps that were followed up Source: ESS 1999 (IER/IFF); ESS 2001 (IER/IFF), ESS 2002 (IES/MORI)
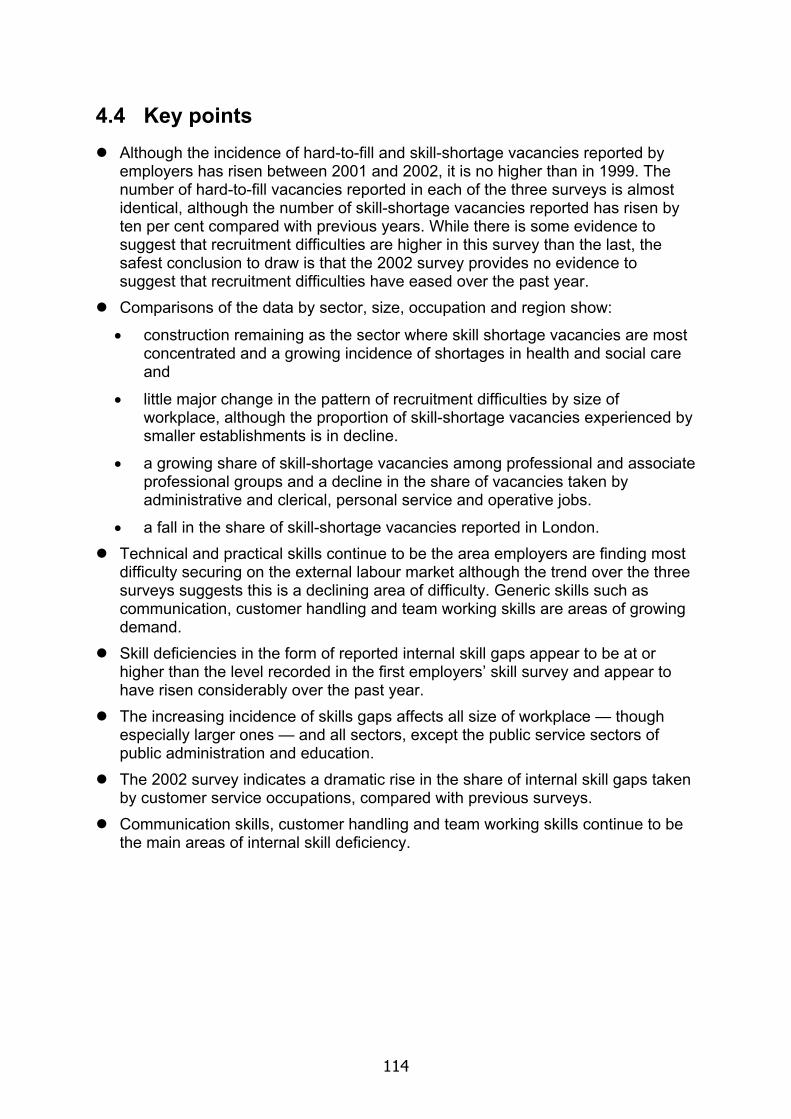
114
4.4 Key points Although the incidence of hard-to-fill and skill-shortage vacancies reported by
employers has risen between 2001 and 2002, it is no higher than in 1999. The number of hard-to-fill vacancies reported in each of the three surveys is almost identical, although the number of skill-shortage vacancies reported has risen by ten per cent compared with previous years. While there is some evidence to suggest that recruitment difficulties are higher in this survey than the last, the safest conclusion to draw is that the 2002 survey provides no evidence to suggest that recruitment difficulties have eased over the past year.
Comparisons of the data by sector, size, occupation and region show:
• construction remaining as the sector where skill shortage vacancies are most concentrated and a growing incidence of shortages in health and social care and
• little major change in the pattern of recruitment difficulties by size of workplace, although the proportion of skill-shortage vacancies experienced by smaller establishments is in decline.
• a growing share of skill-shortage vacancies among professional and associate professional groups and a decline in the share of vacancies taken by administrative and clerical, personal service and operative jobs.
• a fall in the share of skill-shortage vacancies reported in London. Technical and practical skills continue to be the area employers are finding most
difficulty securing on the external labour market although the trend over the three surveys suggests this is a declining area of difficulty. Generic skills such as communication, customer handling and team working skills are areas of growing demand.
Skill deficiencies in the form of reported internal skill gaps appear to be at or higher than the level recorded in the first employers’ skill survey and appear to have risen considerably over the past year.
The increasing incidence of skills gaps affects all size of workplace — though especially larger ones — and all sectors, except the public service sectors of public administration and education.
The 2002 survey indicates a dramatic rise in the share of internal skill gaps taken by customer service occupations, compared with previous surveys.
Communication skills, customer handling and team working skills continue to be the main areas of internal skill deficiency.
115
5. Conclusions and Future Skills Research
In this final chapter we briefly review the substantive findings of this latest Employers Skills Survey and then consider some of the implications of the study, and in particular some of the findings from the follow-up interviews, for the future of national skills research in England.
The 2002 results nominally suggest that the extent and nature of skill deficiencies in England have changed little over the four years since the Skills Task Force set in train an extensive series of research into the country’s skill problems. On the face of it, the latest survey indicates that the extent of skill deficiencies have 'bounced back' after an apparent slight decline in 2001 with recruitment difficulties at about the same level as 1999 and skill gaps if anything more widespread. Within the time and resources available we have been not been able to investigate in any depth whether 2002 results represent a significant change of direction over those reported in 2001 or that, taken as a whole, the three surveys could be seen as broadly consistent.
There could be a number of explanations for the differences in the results, particularly since 2001.
They could be merely the product of changes in the survey procedure. While we have taken every reasonable step to ensure consistency with past surveys, differences in the sample size, the weighting procedure and the survey administration could account for some of the apparent higher incidence of skill deficiencies. However we believe any such ‘survey effect’ to be marginal — and to some extent accounted for when the 2001 results are re-weighted on a similar basis to those from the latest survey.
More substantively there is some evidence from the regional analysis that skill-shortage vacancies and skill gaps are becoming more evenly spread across the country and less concentrated in the South East and especially London. They are also, to some degree, more evenly spread across sectors and size bands. It may be that, while some of the hot spots, such as London and also information technology sectors, have cooled since 1999, skill deficiencies are being felt more widespread across the economy, indicating the continuing impact of an exceptionally tight labour market.
Employment is at a record high and unemployment at an unprecedented low for modern times. In these circumstances it is not intuitively surprising that employers find it difficult to find the skills they need in the labour market. A tight labour market could also be expected to have a deleterious effect on the incidence of skill gaps, which may follow rather than lead recruitment difficulties, although a direct relationship between the two is not borne out by the survey finding that a relatively small (but increasing) proportion of employers report both skill-shortage vacancies and skills gaps. The link between the two may be the results of a number of factors such as:
116
Faced with a shortage of applicants, employers may have to rely on sub-optimal recruitment decisions and take on people with less than sufficient skills or commitment – although if this was evident we could have expected to see skill gaps concentrated on busy workplaces, but this does not appear to be the case.
High labour turnover can also result in growing skill gaps as employers lose experienced personnel and replace them with staff who inevitably take time to become fully proficient as they 'learn the ropes'.
With many firms operating at or above full capacity, time off for training comes at a premium, both for the trainees and for their managers or colleagues organising or providing in-house training or coaching – but again skill gaps if anything are concentrated among employers working below full capacity.
As the pace of change and competition continues to rise, more and more emphasis is placed by employers on employee performance. We found in the follow-up interviews that employers strongly associated the concept of proficiency — at the heart of the way skill gaps are measured — with personal performance. A lack of proficiency was often described in terms of poor performance rather than with reference to the absence of a particular skill. If performance standards rise — and we found that employers set quite high standards of proficiency for the employees — then unless employees are motivated or committed to respond by ‘raising their game’ — gaps can be expected to occur (and picked up by our survey instrument).
Previous survey reports (Bosworth et al 2001) have suggested a link between dynamic organisations — eg those looking to improve their product market position — and the existence of skills gaps. While the 2002 data do not reflect this relationship it may be that growing and or workplaces looking to grow place greater emphasis on employee performance and therefore may be most inclined to report skill gaps (as defined).
All these possible explanations, and others, warrant further investigation — beyond the scope of this current exercise. However in so doing we would counsel avoiding an over-concentration on differences between the surveys. Perhaps the clearest and safest conclusion to draw from the main results of the latest survey is that the extent of skill deficiencies has not fallen over the past four years. While they do not appear to be life-threatening to employers at the current level of employment, skill gaps and shortages represent an important constraint on employers’ ability to deliver their business objectives, particularly in respect of the quality of their goods and services and their ability to provide high levels of customer service. They also result in increased costs. Any remedial action will need to be deep-rooted and long-term to have an effect.
5.1 Future skill research Finally we briefly consider what this third exercise tell us about the reliability and validity of measuring skill deficiencies through mass surveys of employers and the implications for future national skills research.
As a result of the three surveys we know considerably more about the extent, causes and implications of skill deficiencies in England. Much credit is therefore due to the
117
researchers who worked with the Skills Task Force and on the first two surveys in devising and carrying out such extensive and valuable research. This latest, and by comparison with the previous two, much more modest exercise has hopefully succeeded in the aim of maintaining the data series. It has also thrown up some findings which need to be borne in mind when considering further such exercises or developing other studies at a national level. These lessons are discussed below.
The follow-up interviews suggested that the survey instrument is broadly reliable in most respects. When asked, interviewees from the private and public sector alike and all size bands, generally found it relevant and understandable, if a bit repetitive (which is not surprising as the same questions are asked of a range of jobs identified as having hard-to-fill vacancies or where a significant proportion of staff were less than fully proficient). Respondents appeared happy with some of the key elements of the terminology used, eg vacancies or the questions on business strategy or capacity.
However in two important respects we did discover some issues where the terminology used could warrant further consideration.
The first concerns the concept of ‘proficiency’ used to measure skill gaps. As we have reported earlier in Chapter 3, while many employers associated proficiency with ability, it was not just their ability in terms of the skills individuals possessed with which they were concerned, but also their ability to deploy those skills efficiently and effectively. Thus proficiency was equated as much with performance as the possession of skills. This provokes questions as to what precisely is being measured and therefore has implications as to what can be done about any deficiencies that are revealed. Poor performance, as some of the interviewees suggested may be the result of poor management — eg not giving clear instructions or adequate feedback, as much as a lack of specific skills. Poor performance may also be a result of a lack of motivation or commitment as indicated by a considerable number of interviewees, although this was not an option prompted of respondents in the survey. Skill gaps, as measured, may not therefore be remedied by further training of the individuals concerned alone.
We are not in a position in this study to give adequate consideration to the relationship between performance in a job and the possession of sufficient skill to do the job. It may be that the two are so inextricably linked as to make the distinction invalid. However we do think that the implications of using the concept of proficiency as the indicator of skill gaps need to be considered. In so doing we do not wish to imply any criticism of the current measure, which has enabled the distinction between skill gaps and shortages to be operationalised in research terms and so led to a considerable advancement in our knowledge of these issues. It is just that as our knowledge develops, so our thirst for more grows with it.
The second point concerns the terminology used to describe areas of skill. One of the major findings from the Employers Skill Surveys is the extent to which employers are concerned about deficits in generic skills, such as communication, customer service and team working skills. However it was clear also from the follow-up interviews that respondents had an imprecise understanding of what was meant by such skills and a number of examples of respondents merging the concepts of, say, communication and customer handling skills have been quoted in this report. This is
118
not totally surprising as the precise nature of such skills are highly contextual, ie they vary with the exact nature of the job, workplace and circumstance. It is also difficult to see how such a problem may be rectified in the confines of a simple survey, other than perhaps through using some form of skill descriptor — which may still be too general and lead to ambiguity. However it is important to bear in mind the imprecision in the respondents’ minds when interpreting the results.
There are some other, perhaps more detailed, aspects of the survey design which could also merit from a review – not that they may need to be done differently just that, three years on, there is merit in ensuring there is not a better approach that could be adopted.
One of these areas is the quantitative assessment of skills gaps. The survey asks respondents to estimate the extent to which employees in a particular role or occupation lack full proficiency by saying whether it is ‘nearly all’, ‘over half’ etc. etc Thus the estimates are fairly rough and ready — although we found that the numerical values attached to ‘nearly all’ etc. seem justified. Nevertheless there may be a case for re-examining this particular approach. Also, as in the past reports, this year the analysis concentrates only on occupations where a substantial proportion of employees are identified as lacking full proficiency (which in itself is a bit of tongue-twisting concept), ie the ‘narrow’ measure. This implies that these cases are more severe and worthy, and more readily able, of further investigation, while severity is measured quantifiably ie the number of people less than fully proficient rather than qualitatively, ie the extent to which they fall short of proficiency. Although it is not readily apparent how a qualitative measure could be easily established it may be worth exploring. While past survey piloting found that employers found it easier to talk about gaps in detail where they affected a significant group of staff, it does mean that the focus is only on these ‘severe’ cases where any occupation with at least one skill shortage vacancy is the focus of attention on the analysis of recruitment difficulties.
If the questionnaire is being reviewed a further area which may be worth revisiting is the measure of skill shortage vacancies, which is derived from a question about the reasons for hard-to-fill vacancies. Again this is an example where the current formula may be the best available. However, it would be sensible to confirm that the question as structured does adequately distinguish between vacancies that are hard to fill for reasons related to shortage of skills and those that are hard to fill for other reasons.
Turning to the future, we believe there is merit in continuing the national series to monitor the state of the national labour market, although any changes in the survey process and questionnaire would obviously cause a potential hiatus. A survey of the current size – or perhaps a little larger if recruitment difficulties ease (to allow for even fewer establishments reporting skill shortage vacancies and more detailed analysis) – would suffice to provide ‘headline’ data with some degree of disaggregation. It is not clear that increasing the sample size five or six fold increases the depth, reliability and flexibility of the data to the same extent.
It is also not clear that such an exercise needs to be carried out on an annual basis. The results of the survey suggest that the extent of skill deficiencies do not change rapidly and many of our follow-up interviewees thought that the skill demand changed over years rather than months. It may be sufficient, unless the state of the

119
labour market itself changes dramatically, to measure change in the extent to which employers experience skill gaps and shortage every two or even three years rather than annually.
ESS 2002: Final Report 120
Appendix 1: References
Bosworth D, Davies R, Hogarth T, Wilson R, Shury J (2000), Employers Skill Survey: Statistical Report, DfEE Skills Task Force SKT 31 (referred to as ESS 1999)
Bosworth D, Davies, R, Wilson, R A (2001), Skills and Performance: An Econometric Analysis of Employers Skill Survey 1999, DfES, SME1
Hogarth T, Shury J, Vivian D, Wilson, R (2001), Employers Skill Survey 2001: Statistical Report, DfES (referred to as ESS 2001)
Partington J ‘The Annual Business Inquiry: an improved way of measuring employee jobs’ Labour Market Trends Vol. 108, No. 9, September 2000, The Stationery Office
ESS 2002: Final Report 121
Appendix 2: Telephone Survey Method
A2.1 Introduction This technical report has been compiled by MORI Social Research Institute and contains the technical details for the Employer Skills Survey 2002. The research was carried out by MORI and the Institute for Employment Studies (IES), on behalf of the Department for Education and Skills (DfES).
The survey comprised:
A telephone pilot of the revised questionnaire Telephone interviews with 4,054 business establishments across England.
Fieldwork took place between 21 January and 31 March 2002.
A2.2 Sample design The sample frame from which the sample was drawn is the Business Database. This comprises all the entries in the Yellow Pages across the UK (approximately 1.7 million establishments). However, the Business Database does not cover businesses in Hull, owing to a unique telephone exchange in the city. To ensure that businesses in Hull were not excluded from the survey, a sub-sample was selected from separate local directories. The profile of businesses selected in Hull was matched to the sector and size profile of businesses sampled in the Middlesborough area (according to Audit Commission information, Middlesborough is the closest city to Hull in terms of size and demographics). Therefore, in practice, each business establishment sampled in the Middlesborough area was matched to an equivalent organisation in Hull.
The population from which the survey sample was drawn is all business establishments (rather than business enterprises) in England with five or more employees. The sample was structured to ensure that the final achieved sample enabled analysis by different size bands as well as by industry sector. The number of cases from each sector, broadly reflects the industrial structure, except that agriculture is thought to be under-represented in the ABI and construction was boosted to ensure sufficient cases for a separate sectoral analysis. To ensure sufficient numbers of cases, medium to large establishments were over-sampled and the number of small businesses reduced accordingly, but not to the same extent as in previous surveys. There was also an intention to achieve a minimum of 250 cases from each region to ensure some regional analysis, but region was not an explicit element of the sampling matrix. Table A2.1 below summarises the intended sample structure and Table A2.2 sets out the achieved sample.
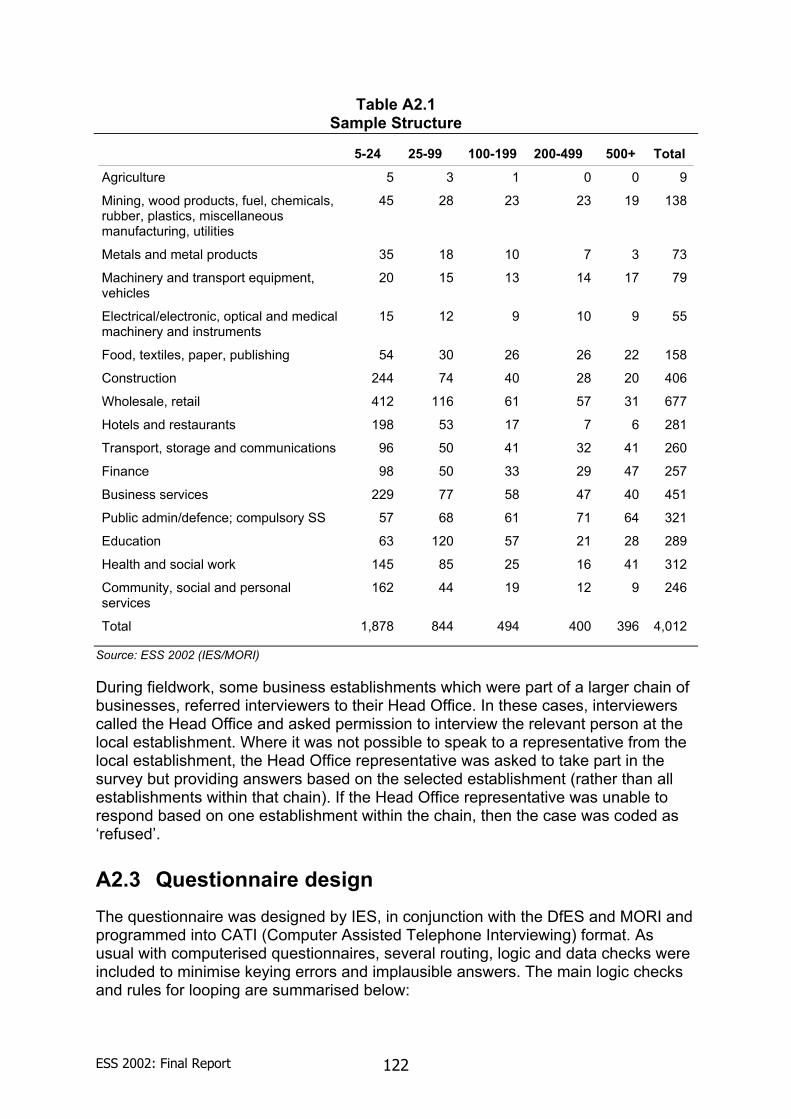
ESS 2002: Final Report 122
Table A2.1 Sample Structure
5-24 25-99 100-199 200-499 500+ Total Agriculture 5 3 1 0 0 9
Mining, wood products, fuel, chemicals, rubber, plastics, miscellaneous manufacturing, utilities
45 28 23 23 19 138
Metals and metal products 35 18 10 7 3 73
Machinery and transport equipment, vehicles
20 15 13 14 17 79
Electrical/electronic, optical and medical machinery and instruments
15 12 9 10 9 55
Food, textiles, paper, publishing 54 30 26 26 22 158
Construction 244 74 40 28 20 406
Wholesale, retail 412 116 61 57 31 677
Hotels and restaurants 198 53 17 7 6 281
Transport, storage and communications 96 50 41 32 41 260
Finance 98 50 33 29 47 257
Business services 229 77 58 47 40 451
Public admin/defence; compulsory SS 57 68 61 71 64 321
Education 63 120 57 21 28 289
Health and social work 145 85 25 16 41 312
Community, social and personal services
162 44 19 12 9 246
Total 1,878 844 494 400 396 4,012
Source: ESS 2002 (IES/MORI)
During fieldwork, some business establishments which were part of a larger chain of businesses, referred interviewers to their Head Office. In these cases, interviewers called the Head Office and asked permission to interview the relevant person at the local establishment. Where it was not possible to speak to a representative from the local establishment, the Head Office representative was asked to take part in the survey but providing answers based on the selected establishment (rather than all establishments within that chain). If the Head Office representative was unable to respond based on one establishment within the chain, then the case was coded as ‘refused’.
A2.3 Questionnaire design The questionnaire was designed by IES, in conjunction with the DfES and MORI and programmed into CATI (Computer Assisted Telephone Interviewing) format. As usual with computerised questionnaires, several routing, logic and data checks were included to minimise keying errors and implausible answers. The main logic checks and rules for looping are summarised below:
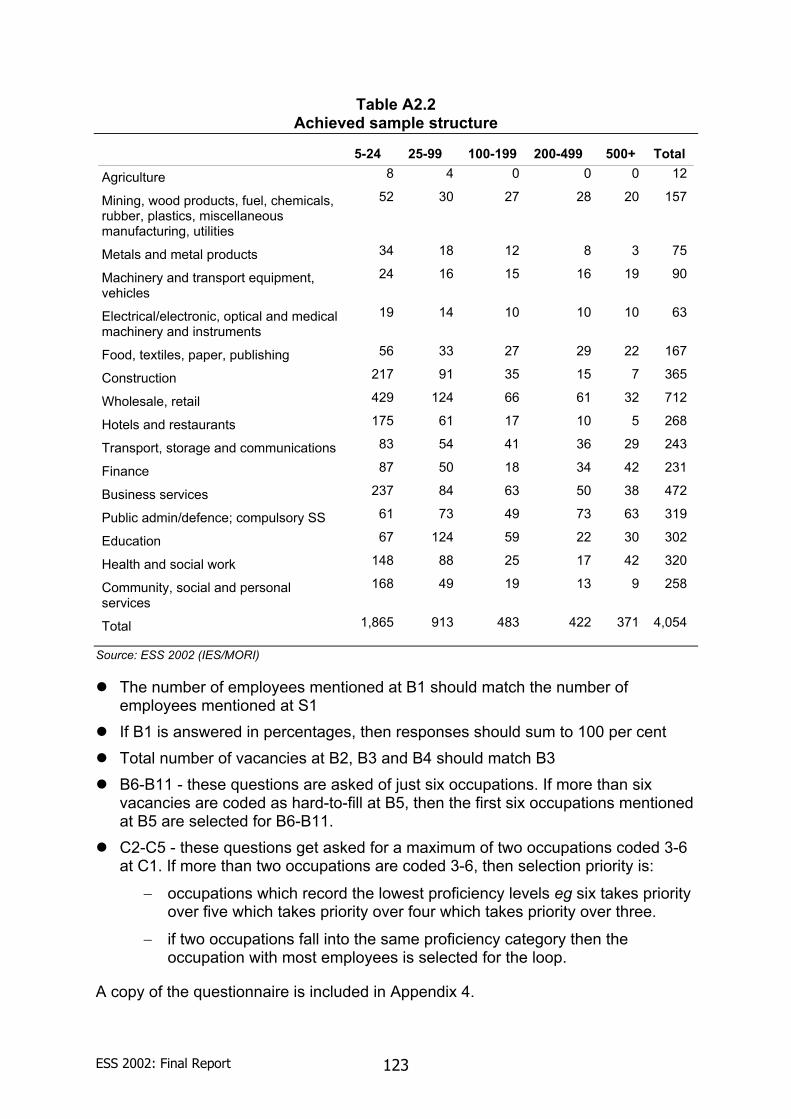
ESS 2002: Final Report 123
Table A2.2 Achieved sample structure
5-24 25-99 100-199 200-499 500+ Total Agriculture 8 4 0 0 0 12
Mining, wood products, fuel, chemicals, rubber, plastics, miscellaneous manufacturing, utilities
52 30 27 28 20 157
Metals and metal products 34 18 12 8 3 75
Machinery and transport equipment, vehicles
24 16 15 16 19 90
Electrical/electronic, optical and medical machinery and instruments
19 14 10 10 10 63
Food, textiles, paper, publishing 56 33 27 29 22 167
Construction 217 91 35 15 7 365
Wholesale, retail 429 124 66 61 32 712
Hotels and restaurants 175 61 17 10 5 268
Transport, storage and communications 83 54 41 36 29 243
Finance 87 50 18 34 42 231
Business services 237 84 63 50 38 472
Public admin/defence; compulsory SS 61 73 49 73 63 319
Education 67 124 59 22 30 302
Health and social work 148 88 25 17 42 320
Community, social and personal services
168 49 19 13 9 258
Total 1,865 913 483 422 371 4,054
Source: ESS 2002 (IES/MORI)
The number of employees mentioned at B1 should match the number of employees mentioned at S1
If B1 is answered in percentages, then responses should sum to 100 per cent Total number of vacancies at B2, B3 and B4 should match B3 B6-B11 - these questions are asked of just six occupations. If more than six
vacancies are coded as hard-to-fill at B5, then the first six occupations mentioned at B5 are selected for B6-B11.
C2-C5 - these questions get asked for a maximum of two occupations coded 3-6 at C1. If more than two occupations are coded 3-6, then selection priority is:
− occupations which record the lowest proficiency levels eg six takes priority over five which takes priority over four which takes priority over three.
− if two occupations fall into the same proficiency category then the occupation with most employees is selected for the loop.
A copy of the questionnaire is included in Appendix 4.
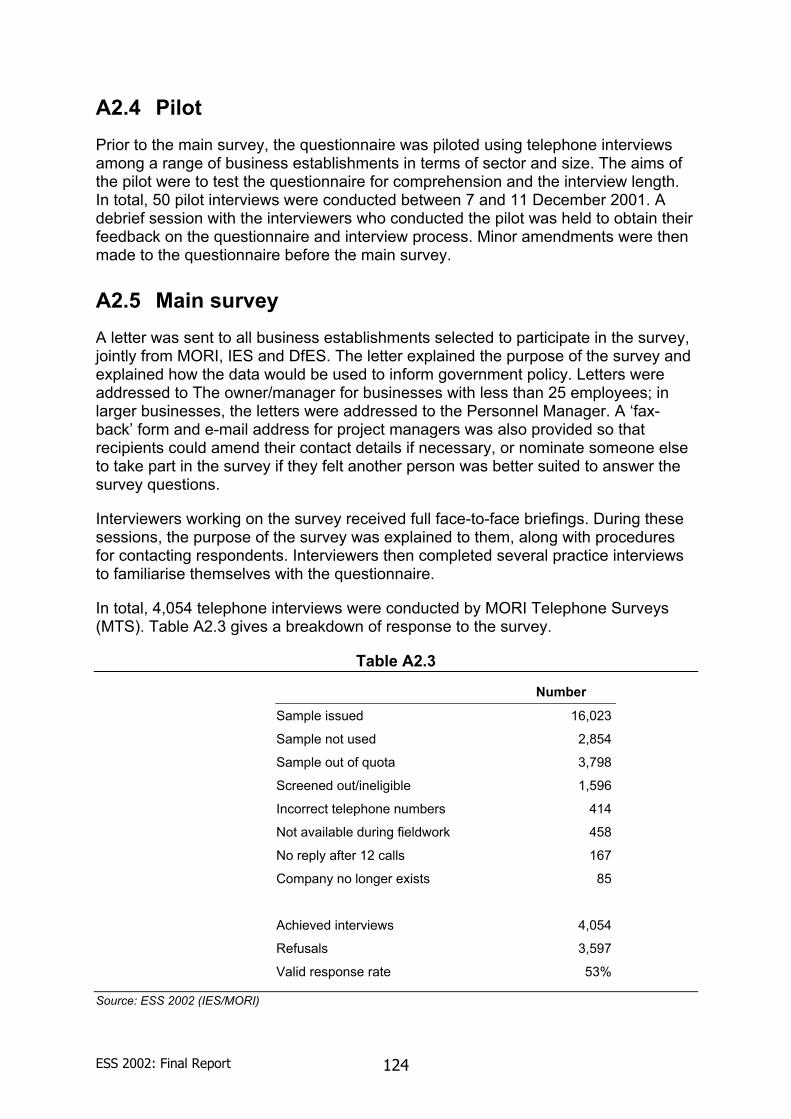
ESS 2002: Final Report 124
A2.4 Pilot Prior to the main survey, the questionnaire was piloted using telephone interviews among a range of business establishments in terms of sector and size. The aims of the pilot were to test the questionnaire for comprehension and the interview length. In total, 50 pilot interviews were conducted between 7 and 11 December 2001. A debrief session with the interviewers who conducted the pilot was held to obtain their feedback on the questionnaire and interview process. Minor amendments were then made to the questionnaire before the main survey.
A2.5 Main survey A letter was sent to all business establishments selected to participate in the survey, jointly from MORI, IES and DfES. The letter explained the purpose of the survey and explained how the data would be used to inform government policy. Letters were addressed to The owner/manager for businesses with less than 25 employees; in larger businesses, the letters were addressed to the Personnel Manager. A ‘fax-back’ form and e-mail address for project managers was also provided so that recipients could amend their contact details if necessary, or nominate someone else to take part in the survey if they felt another person was better suited to answer the survey questions.
Interviewers working on the survey received full face-to-face briefings. During these sessions, the purpose of the survey was explained to them, along with procedures for contacting respondents. Interviewers then completed several practice interviews to familiarise themselves with the questionnaire.
In total, 4,054 telephone interviews were conducted by MORI Telephone Surveys (MTS). Table A2.3 gives a breakdown of response to the survey.
Table A2.3
Number
Sample issued 16,023
Sample not used 2,854
Sample out of quota 3,798
Screened out/ineligible 1,596
Incorrect telephone numbers 414
Not available during fieldwork 458
No reply after 12 calls 167
Company no longer exists 85
Achieved interviews 4,054
Refusals 3,597
Valid response rate 53%
Source: ESS 2002 (IES/MORI)
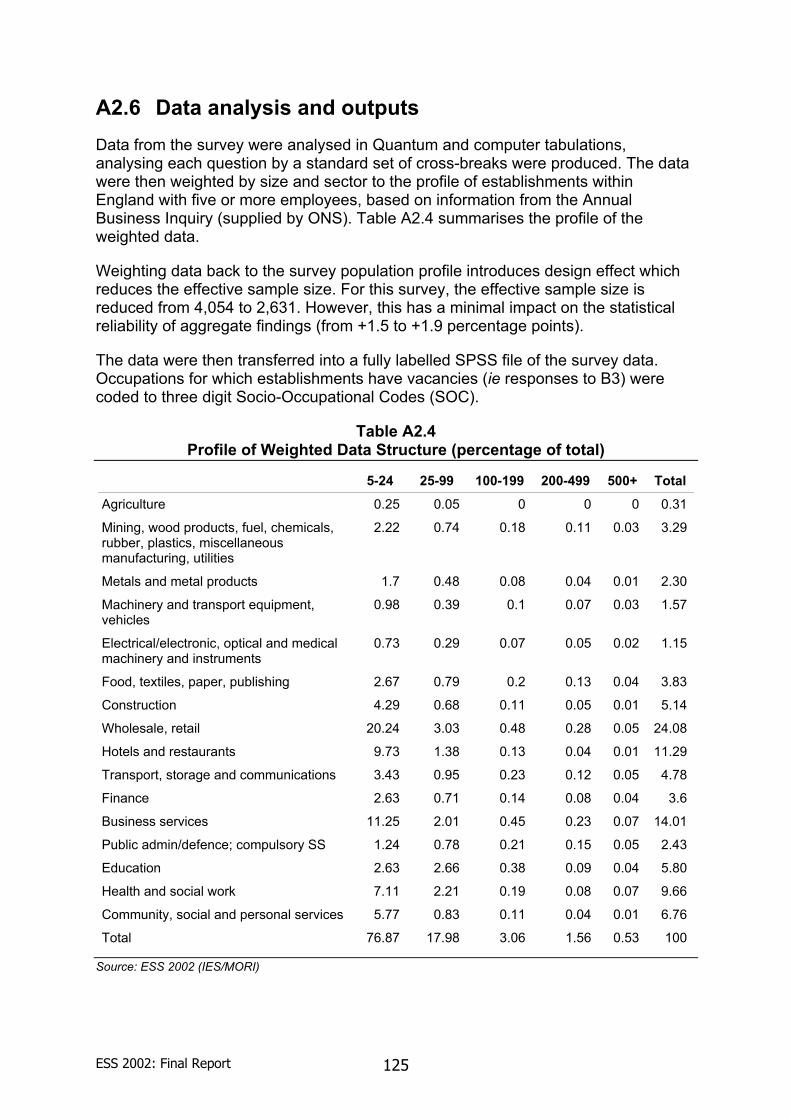
ESS 2002: Final Report 125
A2.6 Data analysis and outputs Data from the survey were analysed in Quantum and computer tabulations, analysing each question by a standard set of cross-breaks were produced. The data were then weighted by size and sector to the profile of establishments within England with five or more employees, based on information from the Annual Business Inquiry (supplied by ONS). Table A2.4 summarises the profile of the weighted data.
Weighting data back to the survey population profile introduces design effect which reduces the effective sample size. For this survey, the effective sample size is reduced from 4,054 to 2,631. However, this has a minimal impact on the statistical reliability of aggregate findings (from +1.5 to +1.9 percentage points).
The data were then transferred into a fully labelled SPSS file of the survey data. Occupations for which establishments have vacancies (ie responses to B3) were coded to three digit Socio-Occupational Codes (SOC).
Table A2.4 Profile of Weighted Data Structure (percentage of total)
5-24 25-99 100-199 200-499 500+ Total Agriculture 0.25 0.05 0 0 0 0.31
Mining, wood products, fuel, chemicals, rubber, plastics, miscellaneous manufacturing, utilities
2.22 0.74 0.18 0.11 0.03 3.29
Metals and metal products 1.7 0.48 0.08 0.04 0.01 2.30
Machinery and transport equipment, vehicles
0.98 0.39 0.1 0.07 0.03 1.57
Electrical/electronic, optical and medical machinery and instruments
0.73 0.29 0.07 0.05 0.02 1.15
Food, textiles, paper, publishing 2.67 0.79 0.2 0.13 0.04 3.83
Construction 4.29 0.68 0.11 0.05 0.01 5.14
Wholesale, retail 20.24 3.03 0.48 0.28 0.05 24.08
Hotels and restaurants 9.73 1.38 0.13 0.04 0.01 11.29
Transport, storage and communications 3.43 0.95 0.23 0.12 0.05 4.78
Finance 2.63 0.71 0.14 0.08 0.04 3.6
Business services 11.25 2.01 0.45 0.23 0.07 14.01
Public admin/defence; compulsory SS 1.24 0.78 0.21 0.15 0.05 2.43
Education 2.63 2.66 0.38 0.09 0.04 5.80
Health and social work 7.11 2.21 0.19 0.08 0.07 9.66
Community, social and personal services 5.77 0.83 0.11 0.04 0.01 6.76
Total 76.87 17.98 3.06 1.56 0.53 100
Source: ESS 2002 (IES/MORI)
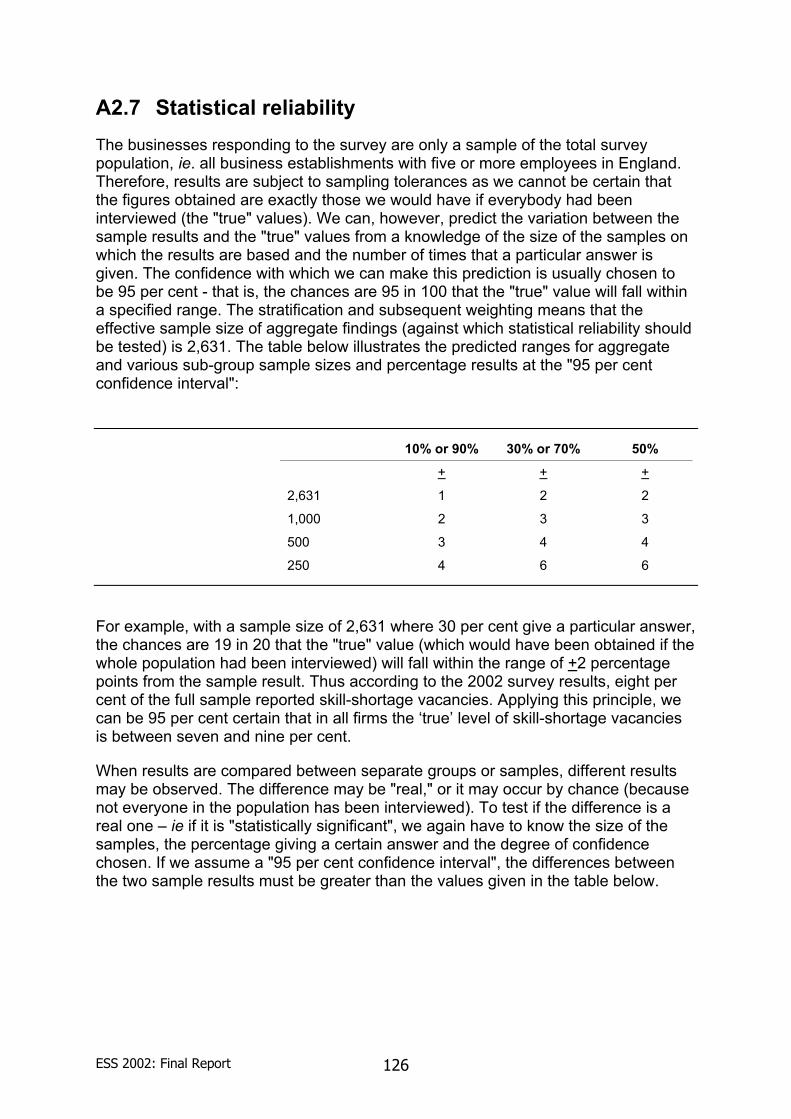
ESS 2002: Final Report 126
A2.7 Statistical reliability The businesses responding to the survey are only a sample of the total survey population, ie. all business establishments with five or more employees in England. Therefore, results are subject to sampling tolerances as we cannot be certain that the figures obtained are exactly those we would have if everybody had been interviewed (the "true" values). We can, however, predict the variation between the sample results and the "true" values from a knowledge of the size of the samples on which the results are based and the number of times that a particular answer is given. The confidence with which we can make this prediction is usually chosen to be 95 per cent - that is, the chances are 95 in 100 that the "true" value will fall within a specified range. The stratification and subsequent weighting means that the effective sample size of aggregate findings (against which statistical reliability should be tested) is 2,631. The table below illustrates the predicted ranges for aggregate and various sub-group sample sizes and percentage results at the "95 per cent confidence interval":
10% or 90% 30% or 70% 50% + + +
2,631 1 2 2
1,000 2 3 3
500 3 4 4
250 4 6 6
For example, with a sample size of 2,631 where 30 per cent give a particular answer, the chances are 19 in 20 that the "true" value (which would have been obtained if the whole population had been interviewed) will fall within the range of +2 percentage points from the sample result. Thus according to the 2002 survey results, eight per cent of the full sample reported skill-shortage vacancies. Applying this principle, we can be 95 per cent certain that in all firms the ‘true’ level of skill-shortage vacancies is between seven and nine per cent.
When results are compared between separate groups or samples, different results may be observed. The difference may be "real," or it may occur by chance (because not everyone in the population has been interviewed). To test if the difference is a real one – ie if it is "statistically significant", we again have to know the size of the samples, the percentage giving a certain answer and the degree of confidence chosen. If we assume a "95 per cent confidence interval", the differences between the two sample results must be greater than the values given in the table below.
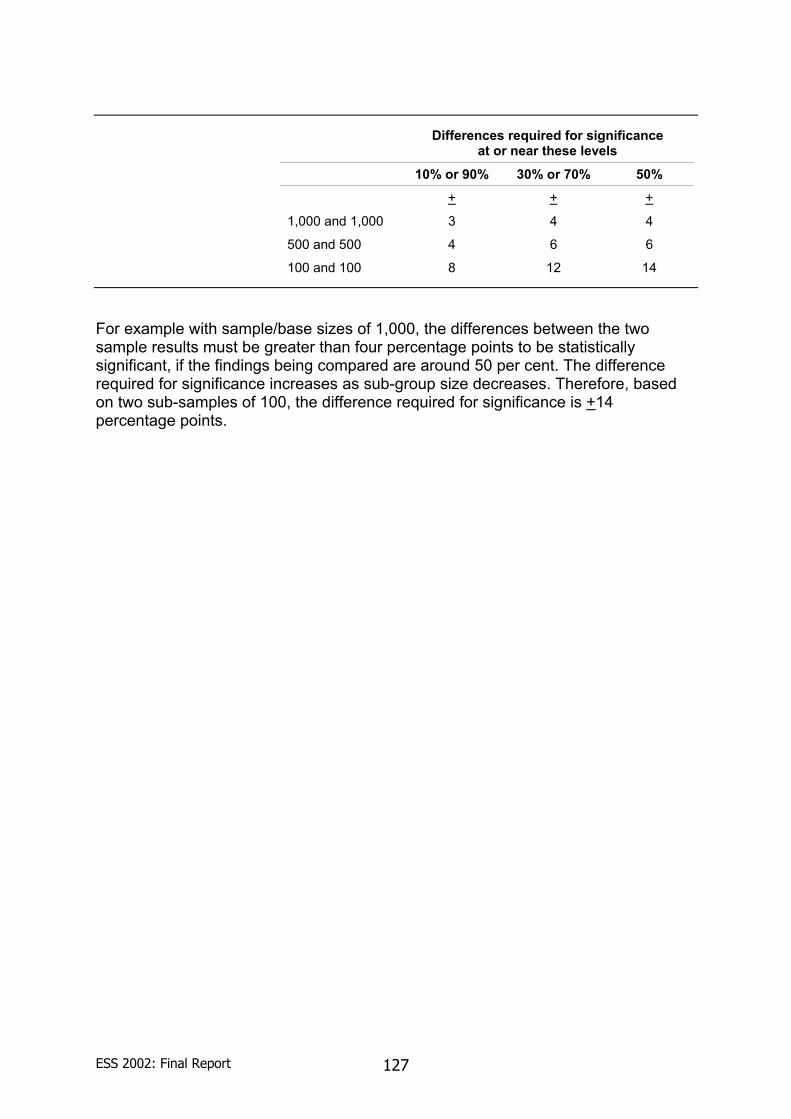
ESS 2002: Final Report 127
Differences required for significance at or near these levels
10% or 90% 30% or 70% 50% + + +
1,000 and 1,000 3 4 4
500 and 500 4 6 6
100 and 100 8 12 14
For example with sample/base sizes of 1,000, the differences between the two sample results must be greater than four percentage points to be statistically significant, if the findings being compared are around 50 per cent. The difference required for significance increases as sub-group size decreases. Therefore, based on two sub-samples of 100, the difference required for significance is +14 percentage points.
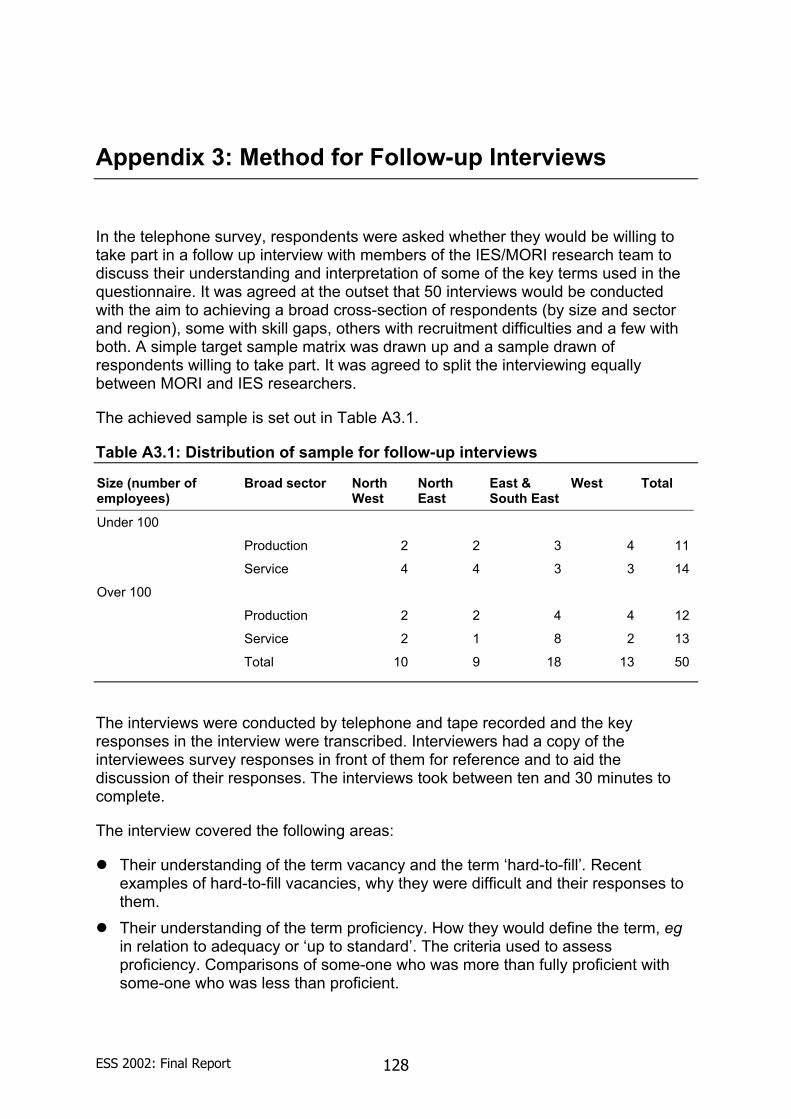
ESS 2002: Final Report 128
Appendix 3: Method for Follow-up Interviews
In the telephone survey, respondents were asked whether they would be willing to take part in a follow up interview with members of the IES/MORI research team to discuss their understanding and interpretation of some of the key terms used in the questionnaire. It was agreed at the outset that 50 interviews would be conducted with the aim to achieving a broad cross-section of respondents (by size and sector and region), some with skill gaps, others with recruitment difficulties and a few with both. A simple target sample matrix was drawn up and a sample drawn of respondents willing to take part. It was agreed to split the interviewing equally between MORI and IES researchers.
The achieved sample is set out in Table A3.1.
Table A3.1: Distribution of sample for follow-up interviews
Size (number of employees)
Broad sector North West
North East
East & South East
West Total
Under 100
Production 2 2 3 4 11
Service 4 4 3 3 14
Over 100
Production 2 2 4 4 12
Service 2 1 8 2 13
Total 10 9 18 13 50
The interviews were conducted by telephone and tape recorded and the key responses in the interview were transcribed. Interviewers had a copy of the interviewees survey responses in front of them for reference and to aid the discussion of their responses. The interviews took between ten and 30 minutes to complete.
The interview covered the following areas:
Their understanding of the term vacancy and the term ‘hard-to-fill’. Recent examples of hard-to-fill vacancies, why they were difficult and their responses to them.
Their understanding of the term proficiency. How they would define the term, eg in relation to adequacy or ‘up to standard’. The criteria used to assess proficiency. Comparisons of some-one who was more than fully proficient with some-one who was less than proficient.

ESS 2002: Final Report 129
Their understanding of what was meant by a particular skill. In what areas were people deficient in that skill. What was the difference between basic computer literacy skills/advanced IT or software skills.
Barriers to skill development. Future skill needs and the reasons behind changes in demand for skills.
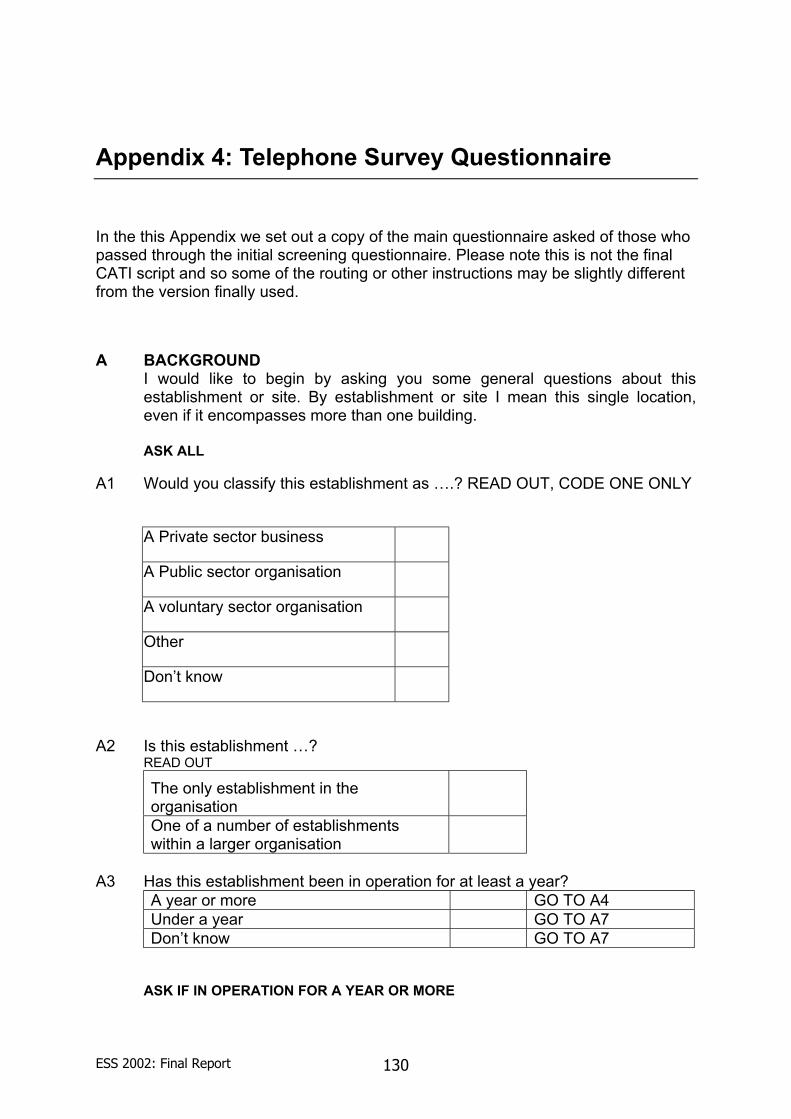
ESS 2002: Final Report 130
Appendix 4: Telephone Survey Questionnaire
In the this Appendix we set out a copy of the main questionnaire asked of those who passed through the initial screening questionnaire. Please note this is not the final CATI script and so some of the routing or other instructions may be slightly different from the version finally used.
A BACKGROUND I would like to begin by asking you some general questions about this establishment or site. By establishment or site I mean this single location, even if it encompasses more than one building.
ASK ALL
A1 Would you classify this establishment as ….? READ OUT, CODE ONE ONLY
A Private sector business
A Public sector organisation
A voluntary sector organisation
Other
Don’t know
A2 Is this establishment …? READ OUT
The only establishment in the organisation
One of a number of establishments within a larger organisation
A3 Has this establishment been in operation for at least a year?
A year or more GO TO A4 Under a year GO TO A7 Don’t know GO TO A7
ASK IF IN OPERATION FOR A YEAR OR MORE
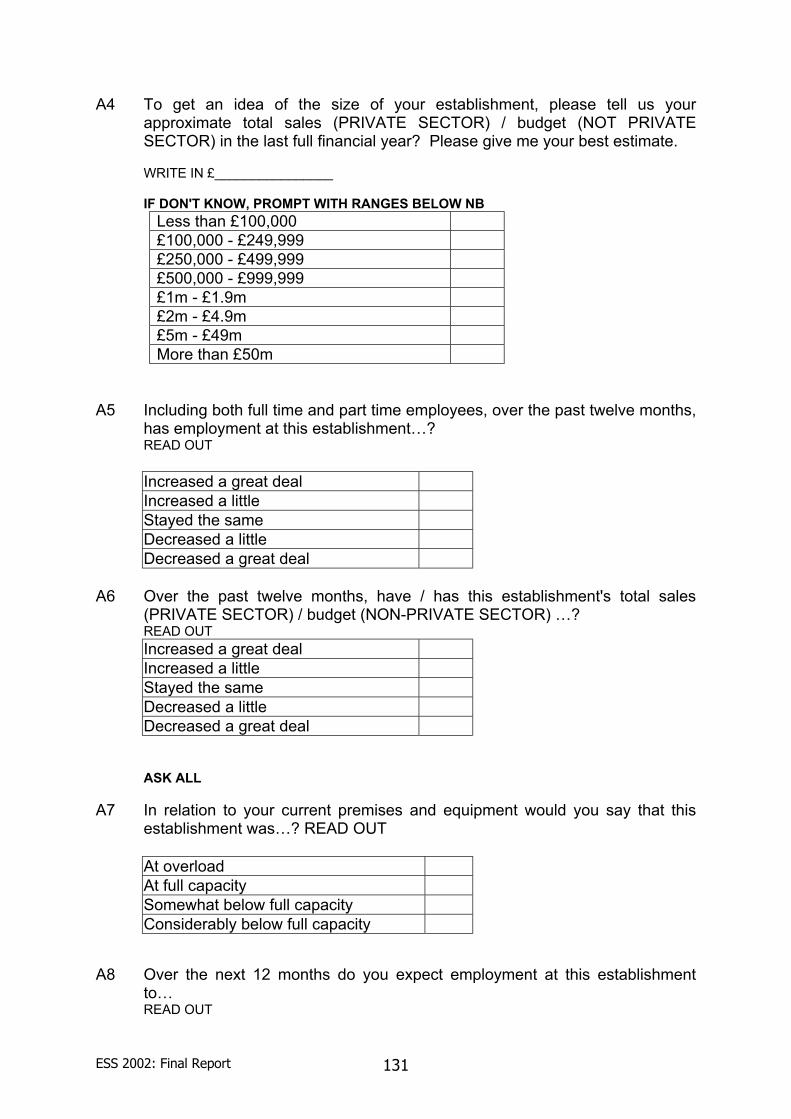
ESS 2002: Final Report 131
A4 To get an idea of the size of your establishment, please tell us your approximate total sales (PRIVATE SECTOR) / budget (NOT PRIVATE SECTOR) in the last full financial year? Please give me your best estimate. WRITE IN £________________ IF DON'T KNOW, PROMPT WITH RANGES BELOW NB
Less than £100,000 £100,000 - £249,999 £250,000 - £499,999 £500,000 - £999,999 £1m - £1.9m £2m - £4.9m £5m - £49m More than £50m
A5 Including both full time and part time employees, over the past twelve months, has employment at this establishment…? READ OUT Increased a great deal Increased a little Stayed the same Decreased a little Decreased a great deal
A6 Over the past twelve months, have / has this establishment's total sales
(PRIVATE SECTOR) / budget (NON-PRIVATE SECTOR) …? READ OUT Increased a great deal Increased a little Stayed the same Decreased a little Decreased a great deal
ASK ALL A7 In relation to your current premises and equipment would you say that this
establishment was…? READ OUT At overload At full capacity Somewhat below full capacity Considerably below full capacity
A8 Over the next 12 months do you expect employment at this establishment to… READ OUT
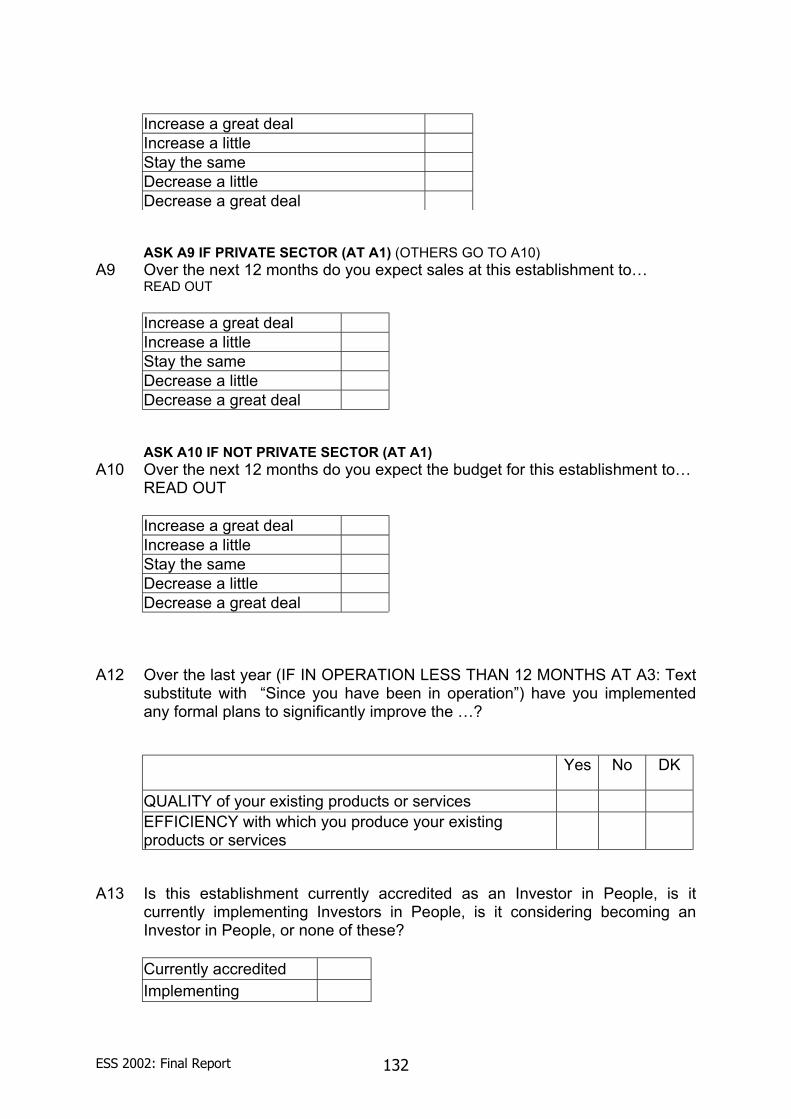
ESS 2002: Final Report 132
Increase a great deal Increase a little Stay the same Decrease a little Decrease a great deal
ASK A9 IF PRIVATE SECTOR (AT A1) (OTHERS GO TO A10) A9 Over the next 12 months do you expect sales at this establishment to…
READ OUT Increase a great deal Increase a little Stay the same Decrease a little Decrease a great deal
ASK A10 IF NOT PRIVATE SECTOR (AT A1) A10 Over the next 12 months do you expect the budget for this establishment to…
READ OUT Increase a great deal Increase a little Stay the same Decrease a little Decrease a great deal
A12 Over the last year (IF IN OPERATION LESS THAN 12 MONTHS AT A3: Text substitute with “Since you have been in operation”) have you implemented any formal plans to significantly improve the …?
Yes No DK
QUALITY of your existing products or services EFFICIENCY with which you produce your existing products or services
A13 Is this establishment currently accredited as an Investor in People, is it currently implementing Investors in People, is it considering becoming an Investor in People, or none of these? Currently accredited Implementing
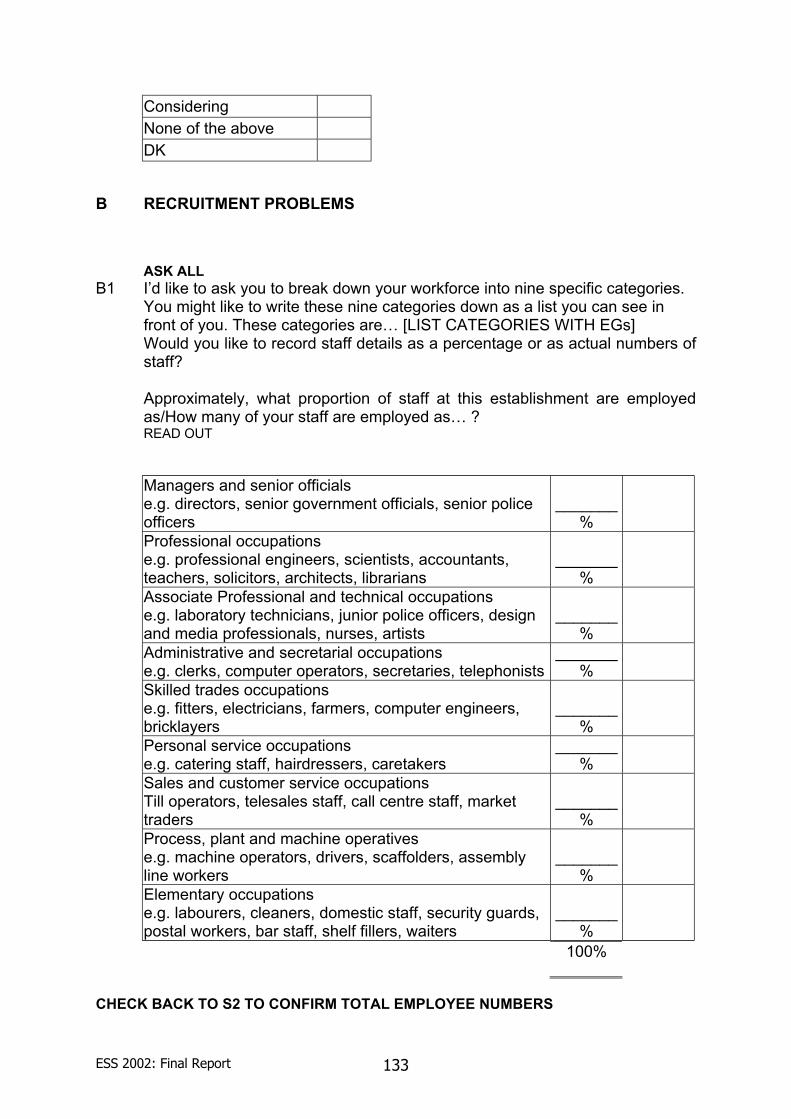
ESS 2002: Final Report 133
Considering None of the above DK
B RECRUITMENT PROBLEMS
ASK ALL B1 I’d like to ask you to break down your workforce into nine specific categories.
You might like to write these nine categories down as a list you can see in front of you. These categories are… [LIST CATEGORIES WITH EGs] Would you like to record staff details as a percentage or as actual numbers of staff? Approximately, what proportion of staff at this establishment are employed as/How many of your staff are employed as… ? READ OUT
Managers and senior officials e.g. directors, senior government officials, senior police officers
_______%
Professional occupations e.g. professional engineers, scientists, accountants, teachers, solicitors, architects, librarians
_______%
Associate Professional and technical occupations e.g. laboratory technicians, junior police officers, design and media professionals, nurses, artists
_______%
Administrative and secretarial occupations e.g. clerks, computer operators, secretaries, telephonists
_______%
Skilled trades occupations e.g. fitters, electricians, farmers, computer engineers, bricklayers
_______%
Personal service occupations e.g. catering staff, hairdressers, caretakers
_______%
Sales and customer service occupations Till operators, telesales staff, call centre staff, market traders
_______%
Process, plant and machine operatives e.g. machine operators, drivers, scaffolders, assembly line workers
_______%
Elementary occupations e.g. labourers, cleaners, domestic staff, security guards, postal workers, bar staff, shelf fillers, waiters
_______%
100%
CHECK BACK TO S2 TO CONFIRM TOTAL EMPLOYEE NUMBERS
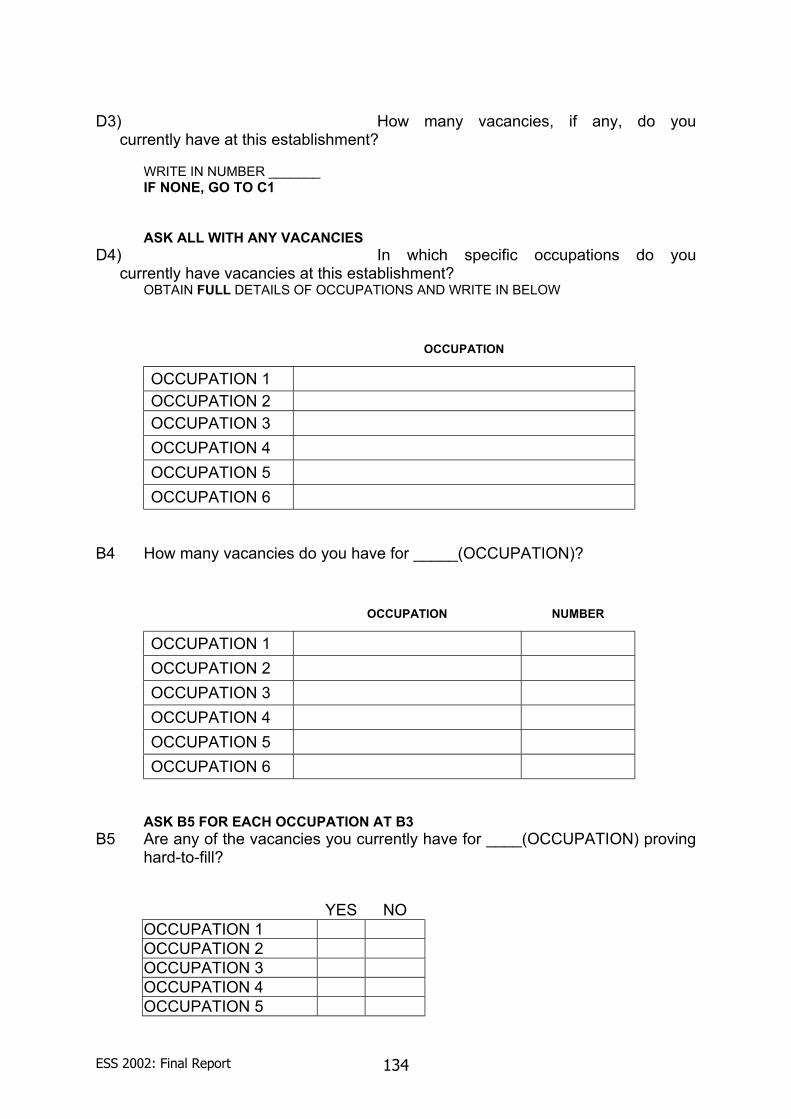
ESS 2002: Final Report 134
D3) How many vacancies, if any, do you
currently have at this establishment? WRITE IN NUMBER _______ IF NONE, GO TO C1
ASK ALL WITH ANY VACANCIES D4) In which specific occupations do you
currently have vacancies at this establishment? OBTAIN FULL DETAILS OF OCCUPATIONS AND WRITE IN BELOW
OCCUPATION
OCCUPATION 1 OCCUPATION 2 OCCUPATION 3
OCCUPATION 4
OCCUPATION 5
OCCUPATION 6
B4 How many vacancies do you have for _____(OCCUPATION)?
OCCUPATION NUMBER
OCCUPATION 1
OCCUPATION 2
OCCUPATION 3
OCCUPATION 4
OCCUPATION 5
OCCUPATION 6
ASK B5 FOR EACH OCCUPATION AT B3 B5 Are any of the vacancies you currently have for ____(OCCUPATION) proving
hard-to-fill?
YES NO OCCUPATION 1 OCCUPATION 2 OCCUPATION 3 OCCUPATION 4 OCCUPATION 5
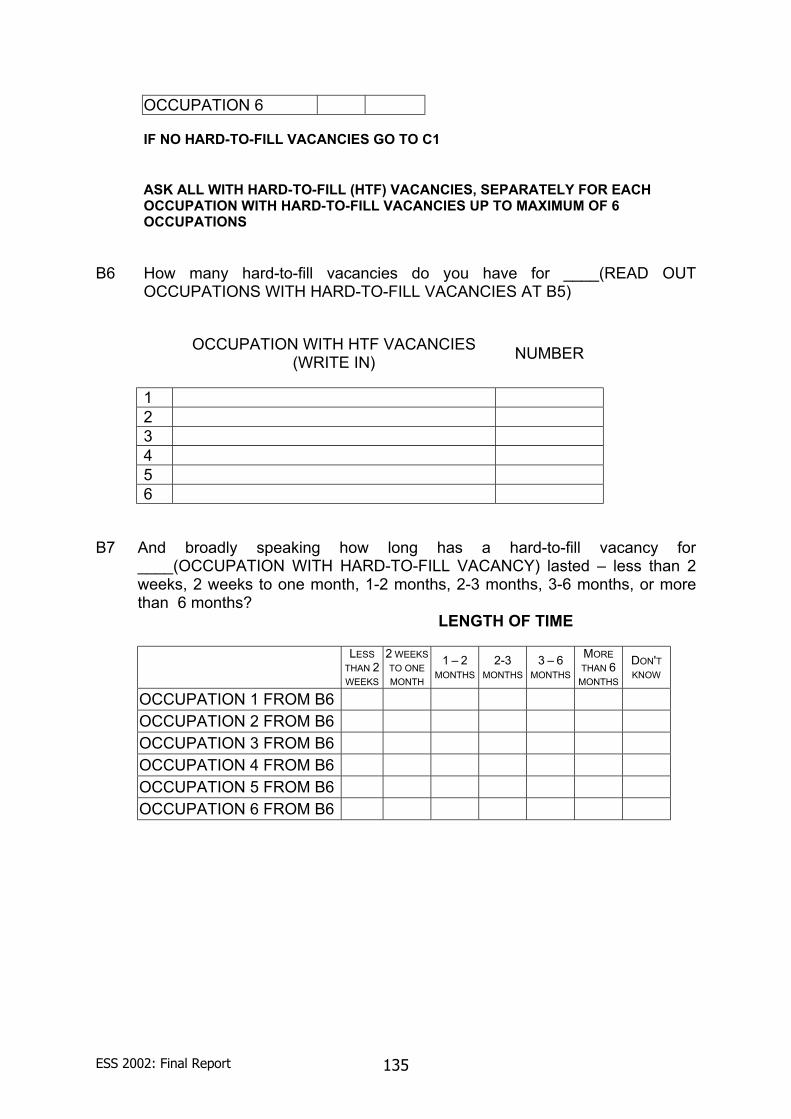
ESS 2002: Final Report 135
OCCUPATION 6
IF NO HARD-TO-FILL VACANCIES GO TO C1
ASK ALL WITH HARD-TO-FILL (HTF) VACANCIES, SEPARATELY FOR EACH OCCUPATION WITH HARD-TO-FILL VACANCIES UP TO MAXIMUM OF 6 OCCUPATIONS
B6 How many hard-to-fill vacancies do you have for ____(READ OUT OCCUPATIONS WITH HARD-TO-FILL VACANCIES AT B5)
OCCUPATION WITH HTF VACANCIES (WRITE IN) NUMBER
1 2 3 4 5 6
B7 And broadly speaking how long has a hard-to-fill vacancy for ____(OCCUPATION WITH HARD-TO-FILL VACANCY) lasted – less than 2 weeks, 2 weeks to one month, 1-2 months, 2-3 months, 3-6 months, or more than 6 months? LENGTH OF TIME
LESS
THAN 2 WEEKS
2 WEEKS TO ONE MONTH
1 – 2 MONTHS
2-3 MONTHS
3 – 6 MONTHS
MORE THAN 6
MONTHS
DON'T KNOW
OCCUPATION 1 FROM B6 OCCUPATION 2 FROM B6 OCCUPATION 3 FROM B6 OCCUPATION 4 FROM B6 OCCUPATION 5 FROM B6 OCCUPATION 6 FROM B6
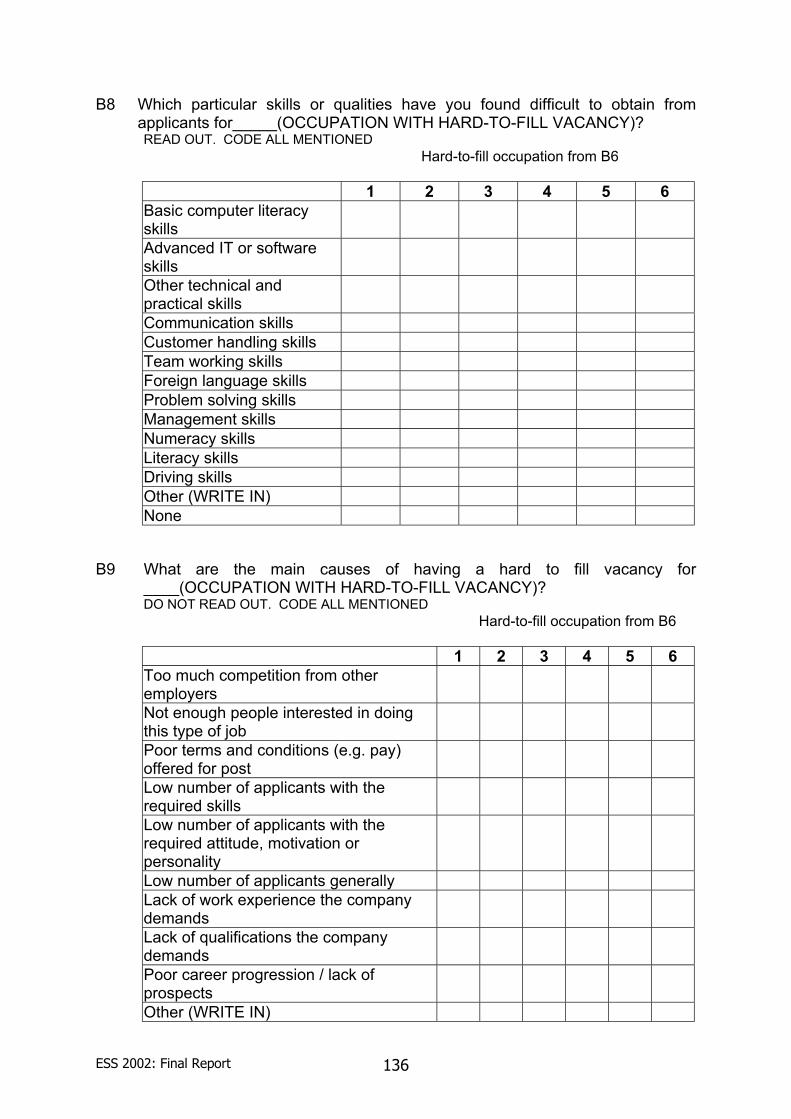
ESS 2002: Final Report 136
B8 Which particular skills or qualities have you found difficult to obtain from applicants for_____(OCCUPATION WITH HARD-TO-FILL VACANCY)? READ OUT. CODE ALL MENTIONED Hard-to-fill occupation from B6
1 2 3 4 5 6 Basic computer literacy skills
Advanced IT or software skills
Other technical and practical skills
Communication skills Customer handling skills Team working skills Foreign language skills Problem solving skills Management skills Numeracy skills Literacy skills Driving skills Other (WRITE IN) None
B9 What are the main causes of having a hard to fill vacancy for ____(OCCUPATION WITH HARD-TO-FILL VACANCY)? DO NOT READ OUT. CODE ALL MENTIONED Hard-to-fill occupation from B6
1 2 3 4 5 6 Too much competition from other employers
Not enough people interested in doing this type of job
Poor terms and conditions (e.g. pay) offered for post
Low number of applicants with the required skills
Low number of applicants with the required attitude, motivation or personality
Low number of applicants generally Lack of work experience the company demands
Lack of qualifications the company demands
Poor career progression / lack of prospects
Other (WRITE IN)
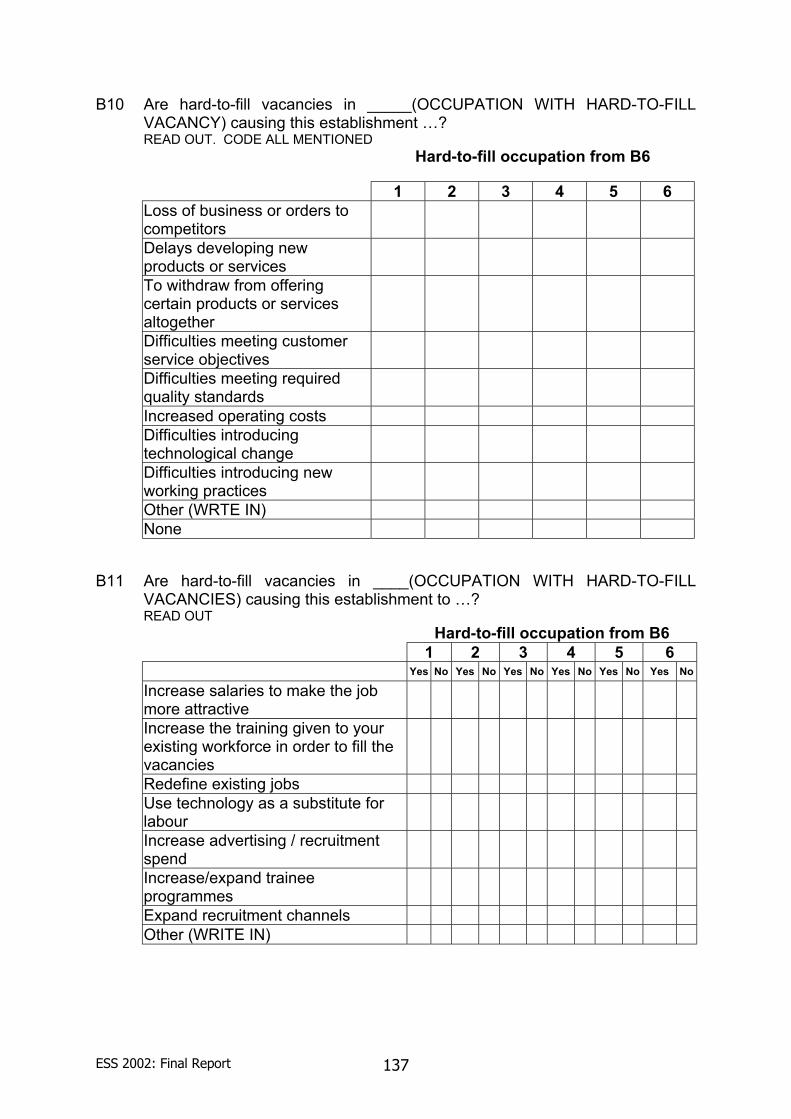
ESS 2002: Final Report 137
B10 Are hard-to-fill vacancies in _____(OCCUPATION WITH HARD-TO-FILL VACANCY) causing this establishment …? READ OUT. CODE ALL MENTIONED Hard-to-fill occupation from B6
1 2 3 4 5 6 Loss of business or orders to competitors
Delays developing new products or services
To withdraw from offering certain products or services altogether
Difficulties meeting customer service objectives
Difficulties meeting required quality standards
Increased operating costs Difficulties introducing technological change
Difficulties introducing new working practices
Other (WRTE IN) None
B11 Are hard-to-fill vacancies in ____(OCCUPATION WITH HARD-TO-FILL VACANCIES) causing this establishment to …? READ OUT Hard-to-fill occupation from B6 1 2 3 4 5 6 Yes No Yes No Yes No Yes No Yes No Yes No
Increase salaries to make the job more attractive
Increase the training given to your existing workforce in order to fill the vacancies
Redefine existing jobs Use technology as a substitute for labour
Increase advertising / recruitment spend
Increase/expand trainee programmes
Expand recruitment channels Other (WRITE IN)
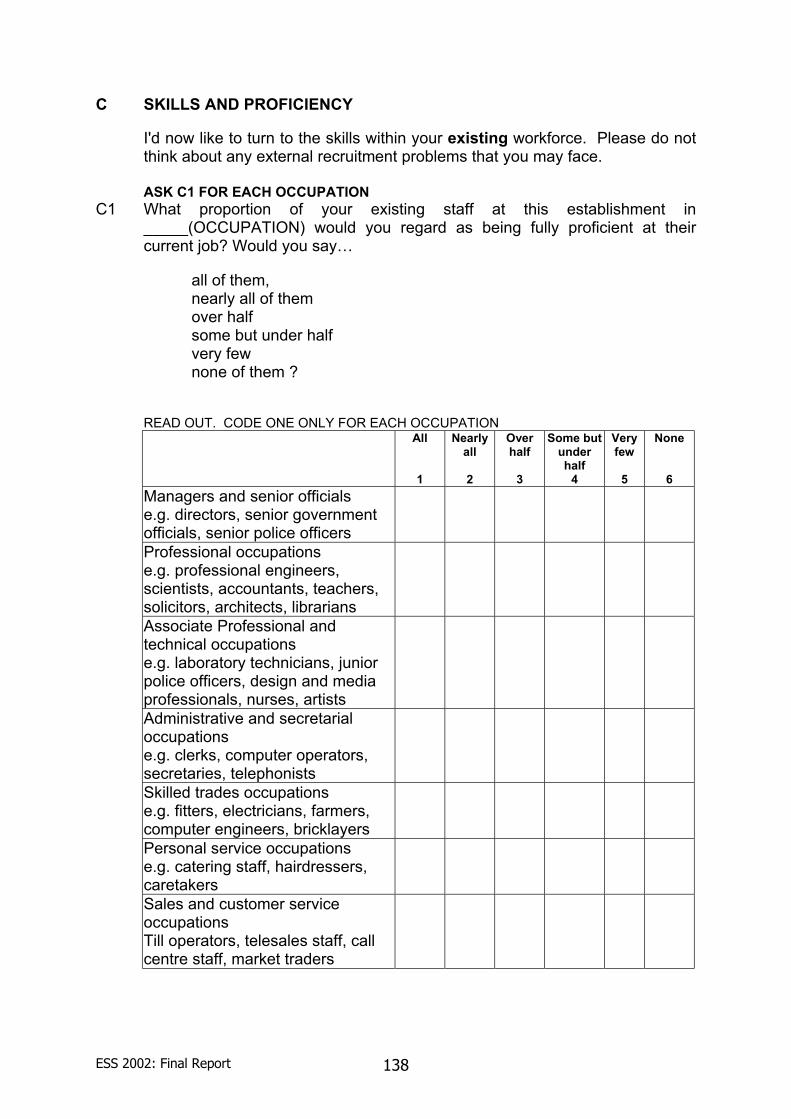
ESS 2002: Final Report 138
C SKILLS AND PROFICIENCY
I'd now like to turn to the skills within your existing workforce. Please do not think about any external recruitment problems that you may face.
E1 ASK C1 FOR EACH OCCUPATION
C1 What proportion of your existing staff at this establishment in _____(OCCUPATION) would you regard as being fully proficient at their current job? Would you say…
all of them, nearly all of them over half some but under half very few none of them ?
READ OUT. CODE ONE ONLY FOR EACH OCCUPATION
All
1
Nearly all
2
Over half
3
Some but under half
4
Very few
5
None
6 Managers and senior officials e.g. directors, senior government officials, senior police officers
Professional occupations e.g. professional engineers, scientists, accountants, teachers, solicitors, architects, librarians
Associate Professional and technical occupations e.g. laboratory technicians, junior police officers, design and media professionals, nurses, artists
Administrative and secretarial occupations e.g. clerks, computer operators, secretaries, telephonists
Skilled trades occupations e.g. fitters, electricians, farmers, computer engineers, bricklayers
Personal service occupations e.g. catering staff, hairdressers, caretakers
Sales and customer service occupations Till operators, telesales staff, call centre staff, market traders
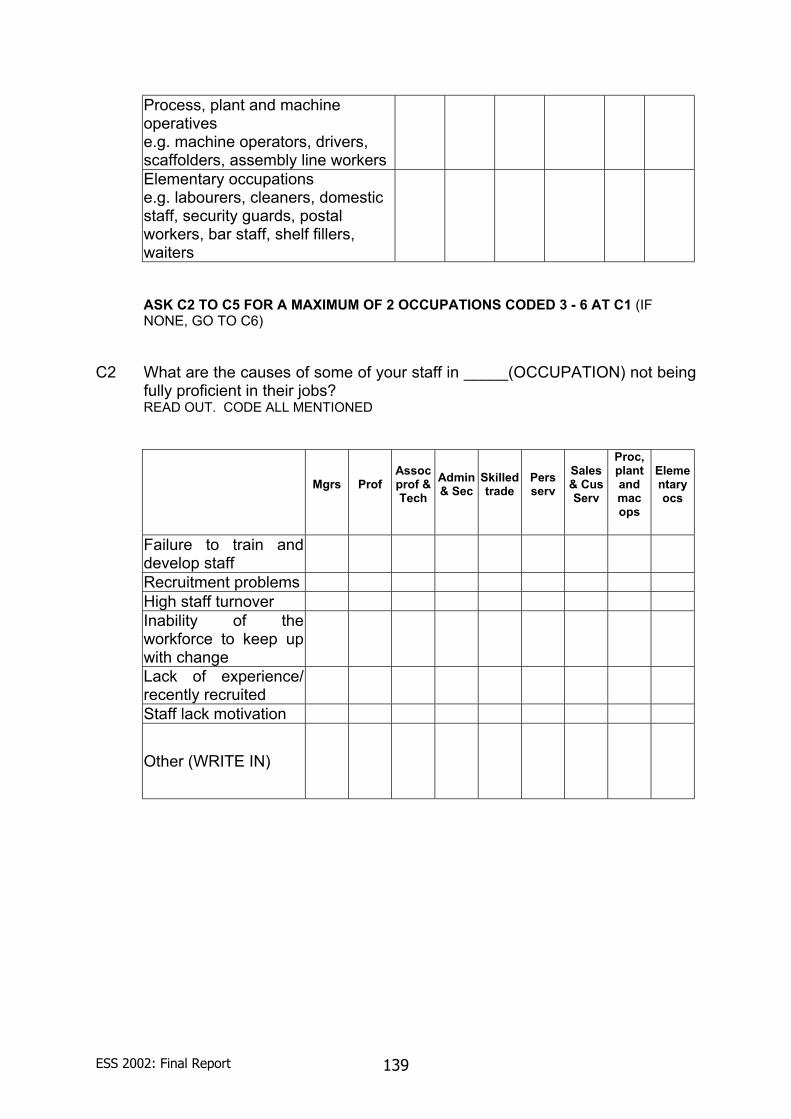
ESS 2002: Final Report 139
Process, plant and machine operatives e.g. machine operators, drivers, scaffolders, assembly line workers
Elementary occupations e.g. labourers, cleaners, domestic staff, security guards, postal workers, bar staff, shelf fillers, waiters
ASK C2 TO C5 FOR A MAXIMUM OF 2 OCCUPATIONS CODED 3 - 6 AT C1 (IF NONE, GO TO C6)
C2 What are the causes of some of your staff in _____(OCCUPATION) not being fully proficient in their jobs? READ OUT. CODE ALL MENTIONED
Mgrs Prof Assoc prof & Tech
Admin & Sec
Skilled trade
Pers serv
Sales & Cus Serv
Proc, plant and mac ops
Elementary ocs
Failure to train and develop staff
Recruitment problems High staff turnover Inability of the workforce to keep up with change
Lack of experience/ recently recruited
Staff lack motivation
Other (WRITE IN)
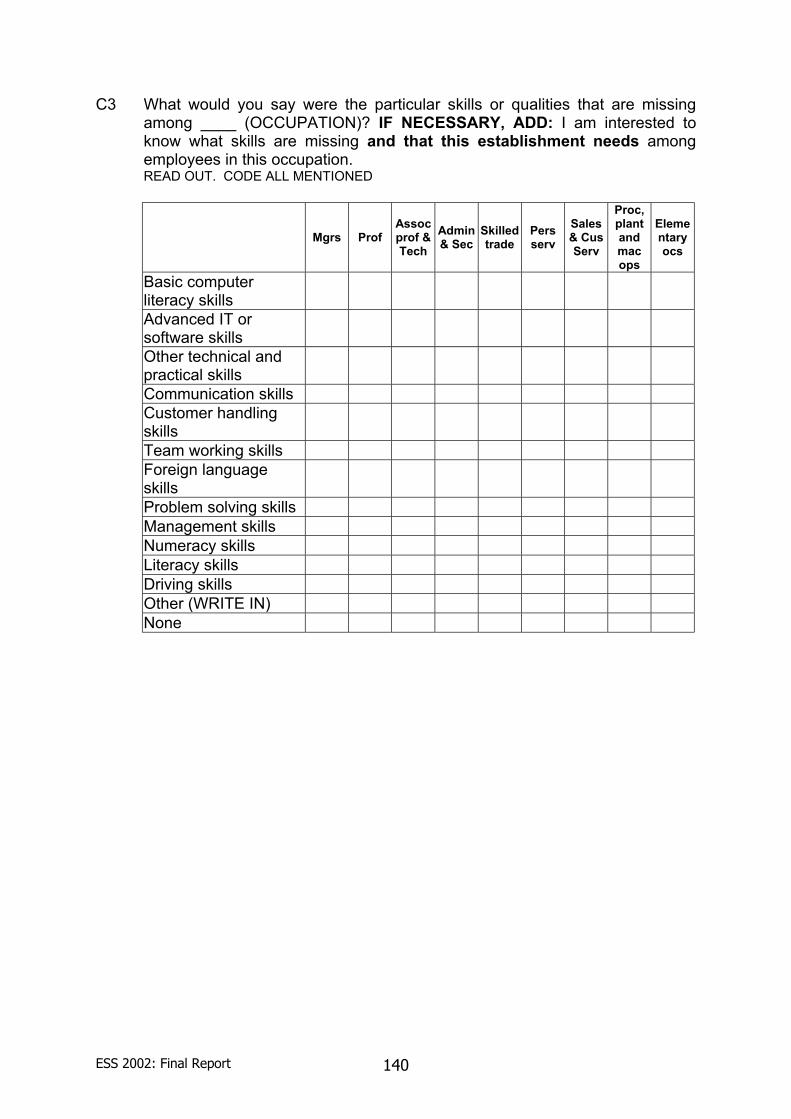
ESS 2002: Final Report 140
C3 What would you say were the particular skills or qualities that are missing among ____ (OCCUPATION)? IF NECESSARY, ADD: I am interested to know what skills are missing and that this establishment needs among employees in this occupation. READ OUT. CODE ALL MENTIONED
Mgrs Prof Assoc prof & Tech
Admin & Sec
Skilled trade
Pers serv
Sales & Cus Serv
Proc, plant and mac ops
Elementary ocs
Basic computer literacy skills
Advanced IT or software skills
Other technical and practical skills
Communication skills Customer handling skills
Team working skills Foreign language skills
Problem solving skills Management skills Numeracy skills Literacy skills Driving skills Other (WRITE IN) None
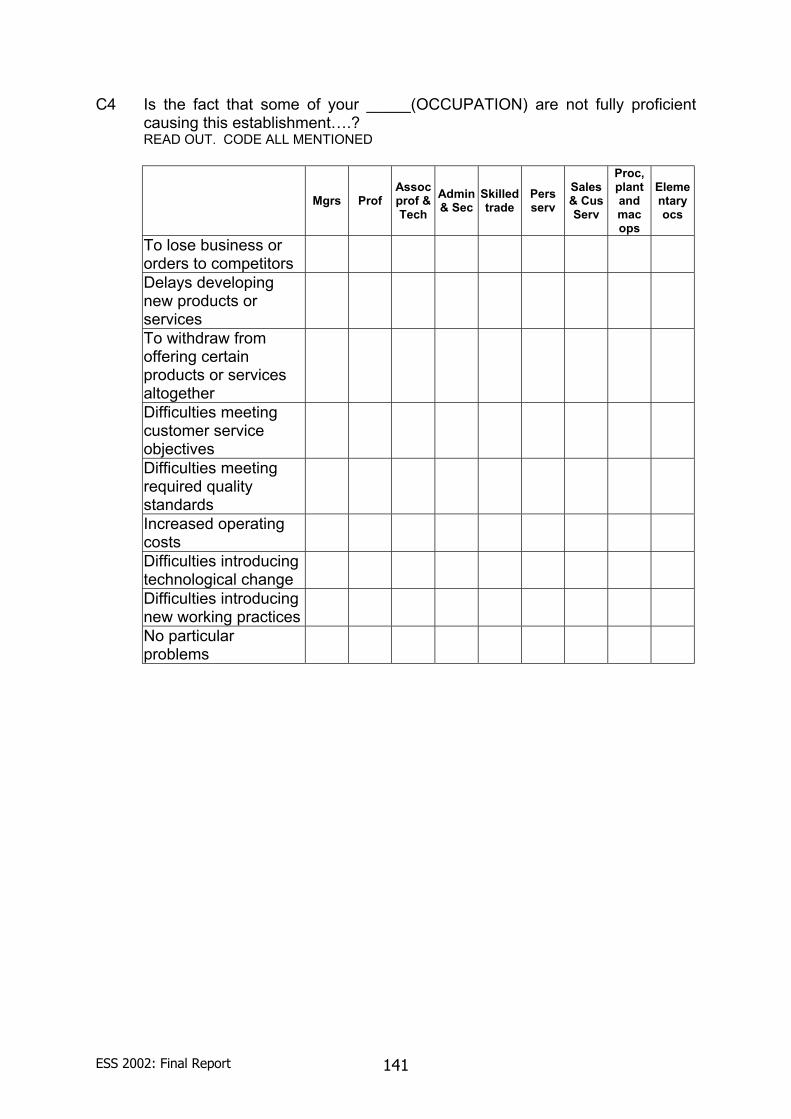
ESS 2002: Final Report 141
C4 Is the fact that some of your _____(OCCUPATION) are not fully proficient causing this establishment….? READ OUT. CODE ALL MENTIONED
Mgrs Prof Assoc prof & Tech
Admin & Sec
Skilled trade
Pers serv
Sales & Cus Serv
Proc, plant and mac ops
Elementary ocs
To lose business or orders to competitors
Delays developing new products or services
To withdraw from offering certain products or services altogether
Difficulties meeting customer service objectives
Difficulties meeting required quality standards
Increased operating costs
Difficulties introducing technological change
Difficulties introducing new working practices
No particular problems
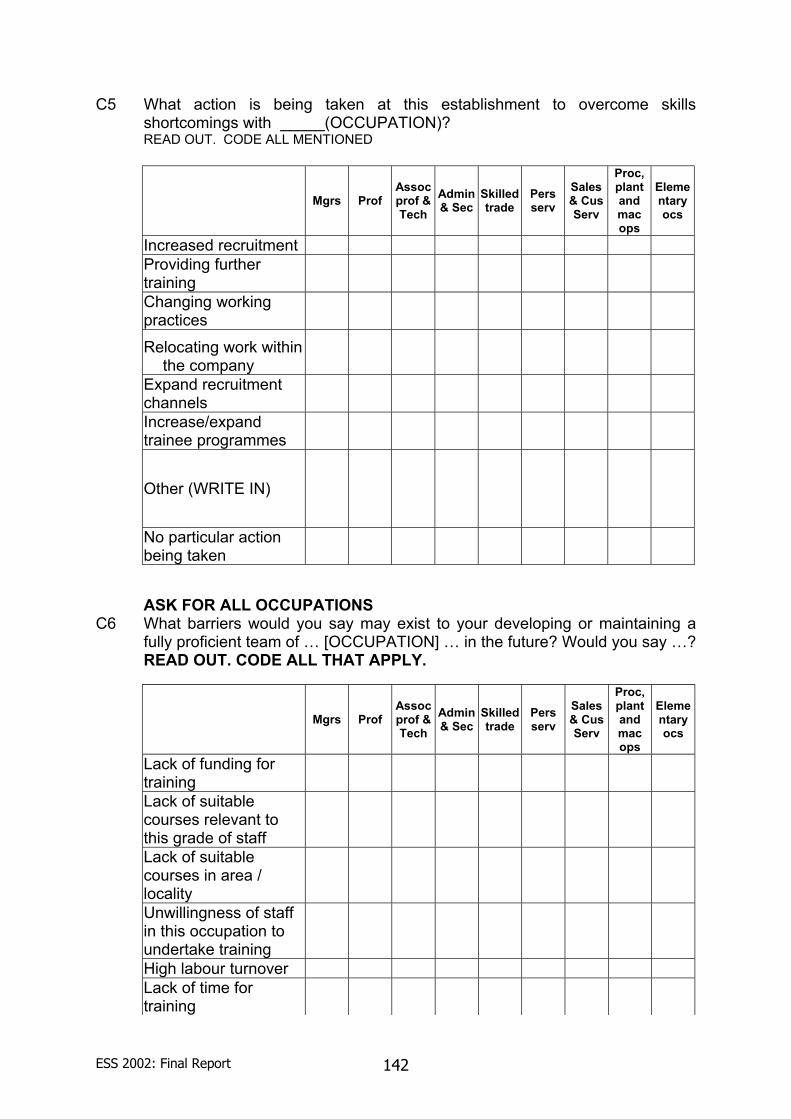
ESS 2002: Final Report 142
C5 What action is being taken at this establishment to overcome skills shortcomings with _____(OCCUPATION)? READ OUT. CODE ALL MENTIONED
Mgrs Prof Assoc prof & Tech
Admin & Sec
Skilled trade
Pers serv
Sales & Cus Serv
Proc, plant and mac ops
Elementary ocs
Increased recruitment Providing further training
Changing working practices
Relocating work within the company
Expand recruitment channels
Increase/expand trainee programmes
Other (WRITE IN)
No particular action being taken ASK FOR ALL OCCUPATIONS
C6 What barriers would you say may exist to your developing or maintaining a fully proficient team of … [OCCUPATION] … in the future? Would you say …? READ OUT. CODE ALL THAT APPLY.
Mgrs Prof Assoc prof & Tech
Admin & Sec
Skilled trade
Pers serv
Sales & Cus Serv
Proc, plant and mac ops
Elementary ocs
Lack of funding for training
Lack of suitable courses relevant to this grade of staff
Lack of suitable courses in area / locality
Unwillingness of staff in this occupation to undertake training
High labour turnover Lack of time for training
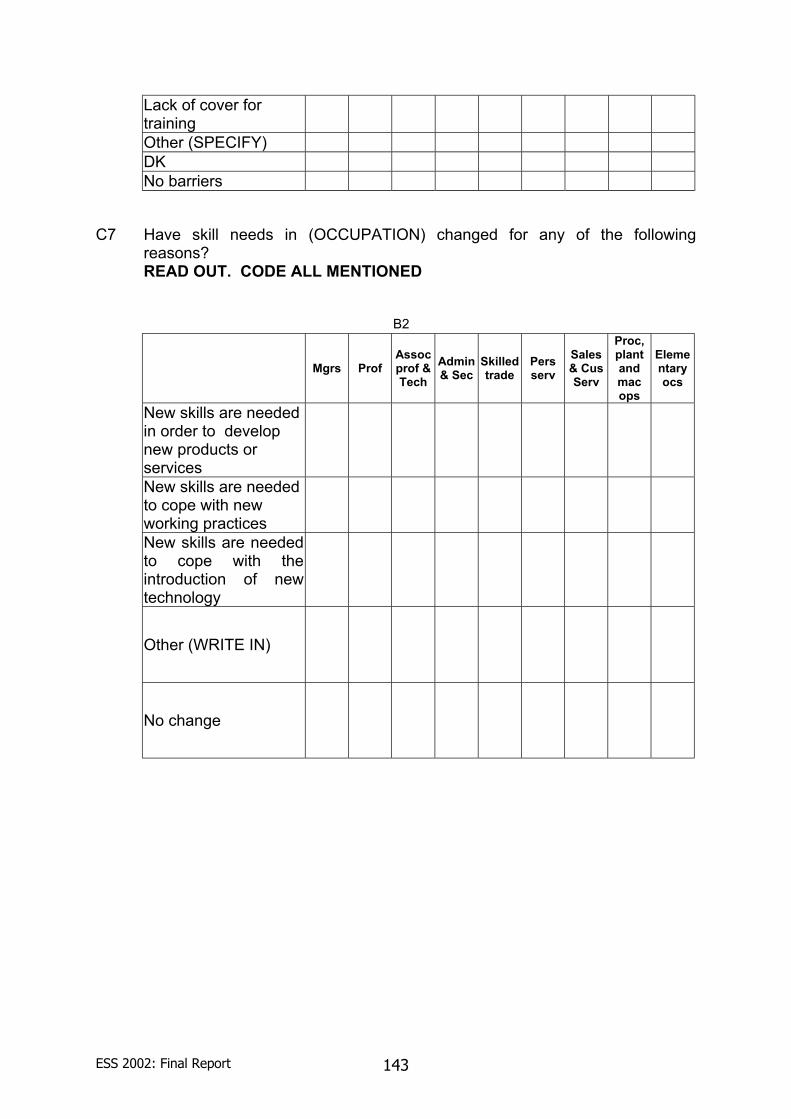
ESS 2002: Final Report 143
Lack of cover for training
Other (SPECIFY) DK No barriers
C7 Have skill needs in (OCCUPATION) changed for any of the following reasons?
READ OUT. CODE ALL MENTIONED
B2
Mgrs Prof Assoc prof & Tech
Admin & Sec
Skilled trade
Pers serv
Sales & Cus Serv
Proc, plant and mac ops
Elementary ocs
New skills are needed in order to develop new products or services
New skills are needed to cope with new working practices
New skills are needed to cope with the introduction of new technology
Other (WRITE IN)
No change
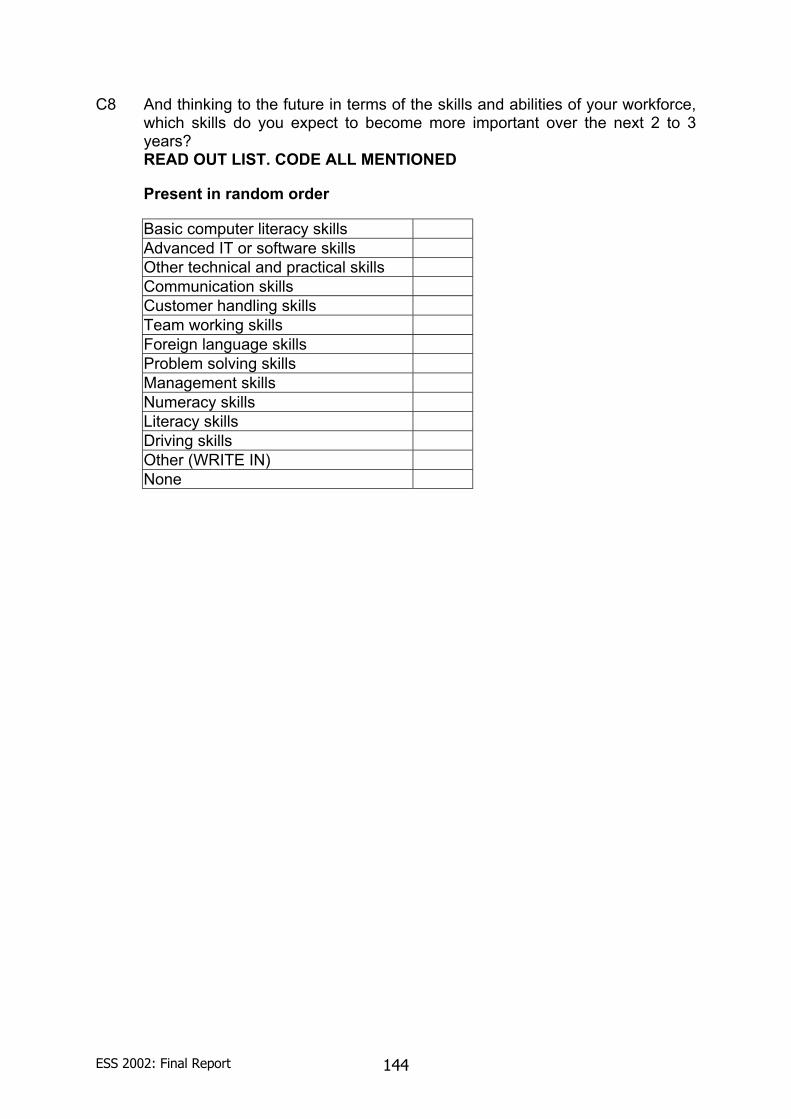
ESS 2002: Final Report 144
C8 And thinking to the future in terms of the skills and abilities of your workforce, which skills do you expect to become more important over the next 2 to 3 years?
READ OUT LIST. CODE ALL MENTIONED
Present in random order
Basic computer literacy skills Advanced IT or software skills Other technical and practical skills Communication skills Customer handling skills Team working skills Foreign language skills Problem solving skills Management skills Numeracy skills Literacy skills Driving skills Other (WRITE IN) None
ESS 2002: Final Report 145
D END OF INTERVIEW DETAILS
D1 Finally may I just confirm your name and contact details? Respondent name
-----------------------------------------------
Job title
-----------------------------------------------
Address
-----------------------------------------------
Telephone number
------------------------------------------------
D2 Could I just check, if we were to be conducting follow-up research on these or other labour market issues, would it be OK to contact you again and perhaps conduct a further interview about some of the issues we have talked about? Yes No DK
THANK RESPONDENT AND CLOSE INTERVIEW