employment and millenium development goals
TRANSCRIPT
EMPLOYMENT AND MILLENIUM DEVELOPMENT GOALS
Analytics of the Linkage in the Context of an Accelerated Effort to Achieve the MDGs
A. R. Khan
I. INTRODUCTION
With the ratification of the Millennium Development Goals at the United Nations
Millennium Summit in 2000 a question that naturally arises is how the multiple
objectives that the international development community has become committed to are
related to one another and whether they are even consistent with one another. First, there
is the goal of economic growth, a growth in per capita income and living standard. Then
there is the objective of poverty reduction which had received an overwhelming emphasis
from the donors and the developing countries alike in recent decades. This came to be
broadened by the adoption of the MDGs which set specific targets not only for poverty
reduction but also for the education of children; empowerment of women; reduction of
child and maternal mortality; combating diseases such as HIV, malaria and tuberculosis;
and promoting greater international cooperation for development. Given that they
continue to remain objectives to be simultaneously pursued by the developing countries,
it is natural to ask how they are related to one another and whether they are consistent
with one another.
The relationship between growth and poverty reduction and the possible
inconsistency between them as development objectives have long been recognized.
Growth is necessary for poverty reduction but is not sufficient: it must be accompanied
by an improvement in the living standard of the poor. If the distribution of income
changes in such a way as to reduce the income share of the poor then the contribution of
growth to poverty reduction would be weakened, offset completely or even offset more
than completely.
2
The convergence between growth and poverty reduction, given the absence of an
unfavorable change in income distribution that offsets the effect of growth on the income
of the poor, is assured when poverty is defined in the narrow sense of income poverty.1
When poverty is more broadly conceived as indicating deprivation from indicators of
wellbeing other than income – as is the case with the UNDP’s Human Poverty Index - it
is no longer assured that growth and (income) poverty reduction would necessarily bring
about a reduction in that kind of poverty. This is particularly so because the non-income
indicators of wellbeing, such as education and health attainments, entail substantial
externalities so that an improvement in personal income would not bring about a
desirable reduction in deprivation with respect to these indicators.2
This is a justification for the inclusion of the MDGs as separate and independent
development objectives. With the exception of the first and the last of its eight
components, the MDGs consist of indicators that are characterized by substantial
externalities.3 The second, the fourth and the fifth MDGs - education of children and the
reduction of child and maternal mortality – provide benefits not only to their direct
recipients but also to others thereby embodying significant externality. The remaining
three MDGs - empowering women, combating epidemic diseases and protecting the
environment – are actually public goods entailing non-rivalry and non-excludability in
their consumption. Private expenditure decisions are not adequate instruments to secure
the desirable levels of production and consumption of these elements. Growth and
1 In this paper no distinction is made between income and consumption poverty. This is done in the interest of brevity and not intended to suggest that the two would always move in the same direction. The debate about which of them is a better indicator of the lack of wellbeing on the part of the poor is by now well known. The present writer takes the view that in practice the choice between them is often dictated by the form in which data are available and it is debatable which of the two would better capture the change in wellbeing of the poor. 2 It is worth noting that even if poverty were defined with respect to multiple indicators of “purely” private goods, e.g., food intake, clothing and housing, there would be inconsistency in the rates at which poverty is reduced with respect to the different indicators of poverty. Suppose separate poverty lines are set with respect to an income threshold and average or representative consumption of clothing and housing for individuals with income at the poverty threshold. The proportions of population below the food poverty line, clothing poverty line and housing poverty line will usually not change at the same rate as the proportion of population below the poverty income threshold for the simple reason that consumption distributions of food, clothing and housing below the poverty line are unlikely to be the same, and remain the same, as the distribution of income below the poverty line. 3 The first indicator is the halving of the proportion of people living on less than PPP$1 a day and of those who suffer from hunger. Reduction of poverty, especially the reduction of hunger, may be said to have externality in the sense that less hunger on the part of an individual, besides protecting her health, might protect the heath of the others. This however would be stretching the meaning of externality.
3
(income) poverty reduction, operating through the augmentation of private income, can
not serve as adequate tools for the attainment of their appropriate levels of production and
consumption. There must be public action to supplement private expenditure on these
elements. It is in this sense that the specification of MDGs as separate and independent
objectives makes sense.
The above also suggests that policy configurations for the attainment of the
different objectives would be different. Poverty reduction is achieved by rapid and
inequality-averse economic growth filtering down to households and providing the poor
with an increase in personal income to enable them to rise above the poverty threshold
which is defined in terms of personal income. There can be plenty of scope for public
action in augmenting the income of the poor households. But the instrument for the
reduction of poverty is the augmentation of personal income.
For the attainment of the MDGs it is however not enough to augment personal
income. Households would not spend enough to purchase the socially desirable amounts
of education and health for children and healthcare for mothers. Public action would be
necessary to supplement private expenditure to attain desirable quantities of these
services. The attainment of desirable levels of public goods like gender empowerment,
control of epidemic diseases and environmental protection would be even more a matter
of public action and expenditure with at best a limited role for private expenditure.
II. EMPLOYMENT AND MDG TARGETS
How does employment feature in this nexus of growth, poverty reduction and
MDGs? As in the earlier paradigms of growth and poverty reduction, employment is not
an explicit component of the MDGs. The central role of employment in the earlier
development paradigm is however well established: in the developing countries efficient
pursuit of growth is best based on the intensive use of labor, the relatively plentiful
factor. Employment-intensive growth is the most effective method of poverty reduction
because labor is the most plentiful resource that most poor are endowed with.
4
There are however important differences between the nature of the link between
employment and (non-poverty) MDGs (i.e., MDGs 2 to 7) and the nature of the link
between employment and poverty reduction. The link between employment growth and
poverty reduction is predominantly a one-way link in which growth in productive and
remunerative employment brings about rapid poverty reduction. One might describe the
relationship as one of high employment elasticity of poverty reduction. It is possible that
poverty reduction also has effect on employment: getting out of poverty could enhance
the ability to work. But this effect is at best of much less quantitative importance than the
effect of employment growth on poverty reduction and the direction of this effect is not
unambiguous in so far as getting out of poverty may sometimes induce a person to reduce
the amount of work.
Between most of the individual MDG targets and employment there is a two-way
relationship, each having a usually positive effect on the other and it is likely that for
some MDGs the reverse effect of MDG on employment would dominate the effect of
employment on MDG. In other words, the MDG elasticity of employment would
dominate the employment elasticity of MDG. Employment elasticity of an MDG would
be weaker the greater the externality entailing the MDG and it would be lowest and/or
insignificant for those MDGs that are public goods. The reason simply is that
employment exerts influence on MDG by enhancing the income of individuals so that the
effect of employment on MDG would be high for those MDGs for which private
expenditure is the main determinant of their level. This is the case for the MDGs for
which externality is low. Some illustrations would help clarify the issues.
Consider the first MDG, the eradication of extreme poverty and hunger. As it has
been argued above, this particular MDG entails the least externality and hence the
employment elasticity of this MDG would be high. Given other things, the higher the rate
of growth in employment the faster is the reduction in poverty and hunger. With rare
exception a faster employment growth enhances the share of the poor in incremental
income because labor is the asset of which the poor as a class have the largest share of all
assets. It has also been noted that in the close association between employment growth
and poverty reduction the direction of causation may also run the other way. A more
poverty-alleviating the growth may lead to a higher rate of employment growth. It may

5
be because of increased labor supply from the households that have got out of poverty,
but, as argued above, this effect may conceivably be negative. Another possibility is that
the spending of the poor, on basic consumption and small-scale investment, is likely to be
more concentrated among labor-intensive goods and services than is the spending by the
non-poor. Of the two-way relationship between employment growth and poverty
reduction, the employment elasticity of MDG will however dominate the MDG elasticity
of employment. Poverty reduction stands out as different from the other MDGs in so far
as it entails the least degree of externality. The generation of private income, through
employment creation and other methods, would be the sufficient instrument to reduce it.
It is perhaps useful to remind that the particular indicator in question is that of income
poverty and that public policy would necessarily have a major role in determining the
extent of growth in private income of individuals resulting from a given rate of overall
GDP growth.4
Next in order of the strength of linkage between employment and MDG are the
three externality-embodying elements for which individual income is a major determinant
of absorption though the significant externality that they entail dictates that public action
is necessary to supplement private expenditure to ensure their appropriate levels. These
are universal primary education, reduction in child mortality and the reduction in
maternal mortality. The relationship between employment and universal primary
education (the second MDG) is strong both ways: access to employment and the income
that it provides enable private investment in education. Access to education improves the
productivity of employment (though with a time lag in the case of primary education) and
thus increases the (derived) demand for labor. In this case the MDG elasticity of
employment is often likely to dominate the employment elasticity of MDG.
The linkage between employment and child mortality (the fourth MDG) should be
similar to that between employment and universal primary education. Faster employment
growth, via a more egalitarian distribution of incremental income, enhances the capacity
4 Conceivably income poverty can be reduced by public programs of feeding the vulnerable and publicly housing the poor. The present argument assumes that these elements of income subsidy should be added to the estimates of personal income that are used to measure poverty in the event that such programs are used for poverty reduction. These are to be seen as public instruments to augment personal income/consumption. Note however that the thrust of the dominant contemporary development strategies is to move away from such programs.
6
of the poor to make private investment in ensuring better nutrition and health care for
children and thus contributes to a more rapid reduction in child mortality. An autonomous
decline in child mortality would reduce birth rate which would contribute both to reduced
dependency ratio and a reduction in the excess supply of labor, factors contributing to an
improvement in the ratio of employment to labor force. A priori, it is hard to say which of
the two elasticities would dominate.
Faster employment growth would help reduce maternal mortality (the fifth MDG)
by augmenting the capacity of households to invest in maternal health the nature of the
linkage being much the same as that between employment and child mortality. The
reverse causal link between a fall in maternal mortality and employment growth appears
more tenuous although one is tempted to argue that the effect must be positive in so far as
maternal mortality causes disruption in family life which is likely to create difficulty for
the members of the household in pursuing employment. Reduced maternal mortality can
also have externalities in the form of improved health and education status of children
thereby strengthening the effect of the latter on employment.
In the case of these three MDGs a combination of enhanced personal income and
increased public investment in education and health would be needed to achieve targets.
Augmenting personal income, while a sufficient instrument for the reduction of income
poverty, would not be enough for the acquisition of adequate levels of education and
health; it must be supplemented by public investment.
The three MDGs that this paper has christened public goods are gender equality
and empowering of women (the third MDG); combating HIV/AIDS, malaria and other
diseases (the sixth MDG); and environmental sustainability (the seventh MDG). If their
contents are appropriately broadly interpreted then the effect of employment growth on
them would at best be small. Employment growth would have little effect on the overall
status of women. Very rapid employment growth may tighten the labor market to the
point of improving the access of women to wage employment. But the status of women
depends on many more things - institutional, social and legal - on which employment
growth per se will have little effect. Similarly the effect of employment growth on the
reduction of HIV/AIDS and other diseases (the sixth MDG) is likely to be modest.
Employment growth may or may not promote environmental sustainability (the seventh
7
MDG): the outcome depends on the kind of employment growth that takes place.
Employment growth for survival could be at the cost of environmental degradation and
environment-hostile industrialization can promote employment growth. While in the long
run environmental sustainability need have no conflict with employment growth, in the
short run a poor society may not be able to avoid some degree of trade off between them.
Thus employment growth per se would be a weak instrument to achieve these MDG
targets.
One however needs to recognize that individual elements – partial indicators - of
each of these public goods can be defined in such a way that they strongly resemble the
externality-embodying MDGs identified above. Thus the United Nations’ Millennium
Development Goals Report 2006 identifies the elimination of “gender disparity in
primary and secondary education, preferably by 2005, and in all levels of education no
later than 2015” as the only target for gender equality and empowerment of women (the
third MDG). It also includes among the goal of environmental sustainability such targets
as halving, “by 2015, the proportion of people without sustainable access to safe drinking
water and basic sanitation” and achieve, by 2020, “a significant improvement in the lives
of at least 100 million slum-dwellers”5 Each of these targets represents a narrow aspect
of the MDGs that they set out to contribute to. Employment growth would have
somewhat stronger effect on them than on the respective MDGs broadly defined. Even so
private income generation, via employment growth, would perhaps make lesser
contributions to their achievement than to the three externality-embodying MDGs.
The reverse linkage between each of the three public-good MDGs and
employment is likely to be much stronger. In other words, for these MDGs, the MDG
elasticity of employment is likely to be far greater than the employment elasticity of
MDG. Enhanced gender equality is favorable for employment growth. Empowerment of
women leads to a reduction in birth rate and should promote better health and education
for children, thereby reducing the excess supply of labor, reducing the dependency ratio
and improving labor productivity. All these are conducive to an improved intensity of
employment. The reverse linkage between combating HIV/AIDS and other diseases on
the one hand and employment growth on the other is likely to be strong: a reduction in
5 United Nations, The Millennium Development Goals Report 2006, New York, 2006.
8
the incidence of AIDS (and other disease) should have a strongly positive effect on
employment and productivity growth since AIDS strikes workers in their prime and
disease adversely affects productivity. Better environment, especially when
encompassing improved access to sanitation, drinking water and slum improvement,
should make strong contribution to employment productivity.
Finally, the linkage between greater global partnership (the eighth MDG) and
employment growth would appear to consist largely of a unidirectional effect. The
specific targets for this MDG as identified in the Millennium Development Goals Report
2006 - larger aid inflow; a non-discriminatory trading and financial system;
comprehensively dealing with developing countries’ debt; making essential drugs
affordable; and developing and implementing strategies for youth employment - should
be of much help for employment growth in the developing countries. The effect of a
better employment performance in a developing country by itself is unlikely to have
much effect on any of these elements which are essentially beyond the scope of country
development policy and are matters for international negotiation on development
cooperation. This latter attribute rules this MDG out of the realm of policy making by
individual countries.
III. RANGE OF POLICIES
The analysis above suggests a three-way classification of the MDGs (excluding
the eighth MDG, global partnership for development):
The first group consists of poverty reduction which has been an important
development objective for the international development community and most
developing countries long before the MDGs were adopted.6 The principal instrument for
the attainment of this MDG is to increase the personal income of the poor. The best
method for this is rapid economic growth that is inequality averse, i.e., growth that
translates itself into rapid increase in income of the poor. As long as growth is rapid and
intensive in productive and remunerative employment, the poor will experience quick
6 Note however that the MDGs have broadened this component by adding to the target of halving by 2015 the 1990 rates of extreme poverty (the proportion of population below PPP$1 per person per day) the target of halving the proportion of population in hunger over the same period.
9
augmentation in their personal income that will enable them to overcome poverty. To the
extent that some poor households – in most cases a relatively small proportion of the poor
– do not have the required endowment of labor, employment-intensive growth will need
to be supplemented by public income subsidy to these households. A great deal of public
action would be required to make growth sufficiently employment intensive; but the
principal instrument for the achievement of this MDG would still be the generation of
personal income for the poor by making them productively and remuneratively
employed.
The second group consists of those externality-embodying MDGs which are not
public goods: universal primary education, reduction in child mortality and improvement
in maternal health. The achievement of these MDGs would depend on a combination of
private expenditure on and public provision of these services. Employment-intensive
growth, as the instrument for the generation of personal income for those who suffer from
a deprivation of these MDG components would thus have a major role to play. But
substantial public provision of education and health and would be necessary to
supplement private expenditure.
The third group consists of the three MDGs that this paper has put in the category
of public goods: gender equality; controlling HIV/AIDS, malaria, TB and other diseases;
and environmental sustainability. Employment and income generation for individuals and
households will by themselves have little direct effect on these MDGs. They will need to
be dealt with by a broad range of public action encompassing investment, regulation and
institutional reform. To illustrate, improving the gender balance in schooling is not
merely a matter of setting up schools and making them affordable for poor children, but
working in a broad range of areas to improve the incentive of the parents to enroll female
children; and reduce and remove social obstacles to children’s schooling. Sustaining
improved gender balance in schooling in the long run also depends on removing the
discrimination against women in the labor market which requires action on many fronts.
Most importantly, gender balance in schooling is an incomplete indicator of gender
equity which requires ending discrimination against women in many areas including
family law, inheritance law and labor market practices.
10
Notice that the second and the third group of MDGs, especially the latter, would
inevitably feature in a strategy of employment-intensive growth. This is because of the
high MDG elasticity of employment for most of these components. As argued earlier in
the paper, improvements in most of these components contribute to more and more
productive employment.
While they have plenty of positive effects on each other, employment growth and
the successful attainment of MDG targets do not quite amount to a virtuous circle. If
development policy focuses exclusively on ensuring a decent rate of employment-
intensive growth, it is likely that there would be progress in the attainment of certain
elements of MDG, e.g., universal primary education, reduction of child mortality and
reduction of maternal mortality – the MDGs with high employment elasticity. But at the
same time certain other MDGs, e.g., gender equity, disease control and environmental
sustainability – the MDGs with low employment elasticity - will lag behind the targets.
Historically one might cite the East Asian pioneers as examples of this case. Countries
like the Republic of Korea achieved extremely high rates of growth with adequately high
output elasticity of employment. This ensured an avoidance of increased inequality in the
distribution of incremental income and promoted rapid poverty reduction. But the
performance of these countries in promoting gender equality was relatively poor.
Furthermore some of the East and South-East Asian countries had a poor record in
environmental sustainability.
This does not indicate that development policy should instead focus on the direct
promotion of MDG goals thereby shifting attention away from growth with high
employment intensity. Such a strategy would defeat efficient achievement of MDG
goals, not only for poverty reduction for which rapid employment growth is an
indispensable pre-requisite but also possibly for the externality-embodying MDGs for the
attainment of which a combination of private expenditure and public investment is
essential.7 In the absence of adequate data it is hard to document examples, but it seems
that Cuba might belong to this category. Its MDG indicators appear to be very high so 7 One might argue that countries with aggressive public investment in health and education may have succeeded in attaining high levels of the externality-embodying MDGs as well. It is still arguable that this is not an efficient way of attaining these MDG targets: it would be more efficient to have a partnership between private expenditure and supplementary public investment to compensate for externality. The example of Cuba that follows perhaps illustrates this concern.

11
that it ranks extremely high in terms of human development and extremely low in terms
of “human poverty”. But it has experienced low growth and its income poverty, for which
estimates are unavailable, might be relatively high once the poverty threshold is set at an
appropriately high level.
IV. ILLUSTRATIVE COUNTRY CASES
This section illustrates the linkage among employment, growth and the MDG
goals with reference to four countries covered by the Integrated Package of Services
(IPS) to support the MDGs: Armenia, Cambodia, Ethiopia and Mongolia. Their choice
was dictated by the availability of data on employment trends from recent UNDP/ILO
studies on growth-employment-poverty nexus.8 The following are brief summaries of
main trends in growth, employment and poverty.
Armenia
Armenia’s real GDP fell by a drastic 59 per cent between 1989 and 1993 after
which it started recovering. The fall in industrial output was much sharper and continued
much longer. Services output also fell faster than GDP. For the entire decade of the 1990s
industrial and services sectors recorded annual declines of respectively 8 per cent and 4
per cent while agriculture managed to attain positive, albeit slight, growth. By 2004
industrial value added was more than a fifth lower than in 1990 and services output was
more than a tenth lower. Agricultural output was on the other hand more than a quarter
higher in 2004 than in 1990.
In the early 1990s industries and modern services shed a very high proportion of
persons employed in them. Most of these people moved to rural Armenia and were
8 The first round of these studies included 13 countries of which the above four belong to the IPS group. See A. R. Khan, Growth, Employment and Poverty: An Analysis of the Vital Nexus based on some Recent UNDP and ILO/SIDA Studies, Issues in Employment and Poverty Discussion Paper 19, ILO, Geneva, October 2005. A second round included eight countries in which some of the same four IPS countries belong. See A. R. Khan, Asian Experience on Growth, Employment and Poverty, An overview with special reference to the findings of some recent case studies, UNDP Regional Centre in Colombo, 2007.
12
absorbed in agriculture, resulting in a fairly sharp increase in agriculture’s share of total
employment. Over the decade of the 1990s total employment fell by 22 per cent:
agriculture’s share of employment increased by a staggering 155 per cent while the
shares of industry, construction and services fell respectively by 54 per cent, 69 per cent
and 7 per cent. During the period of restoration of industrial growth, its labor absorption
continued to be negative. Output elasticity of employment in services was also negative
during the restoration of its growth in the 1990s. Agriculture continued to absorb labor at
a fairly rapid rate: while it absorbed a great deal of labor prior to 1993, the output
elasticity of employment in the sector between 1993 and 2000 was approximately 0.6.
Estimates of income poverty are available for a relatively short period during the
recovery phase, between 1996 and 2001. For a very low poverty threshold, indicating
extreme poverty, there was poverty reduction in both rural and urban areas. For a higher
poverty threshold, poverty declined in urban areas but increased a little in rural areas.
But for the large-scale labor absorption in agriculture, the poverty outcome might
have been a great deal worse. Labor absorption in agriculture was in turn facilitated by
the egalitarian distribution of land that Armenia’s land reform instituted.
Cambodia
Cambodian economy has grown rapidly and steadily since the early 1990s. The
growth of the economy has however been very narrowly based, especially since 1999,
whence much of the growth has been due to the export-based garments manufacturing.
Agriculture, the sector “employing” more than 70 per cent of the labor force, had a much
slower growth.
The overall growth rate of the economy, rapid by historical and any absolute
standard, does not appear to have had a correspondingly high impact in reducing the
incidence of poverty, the estimates of which suffer from uncertainty due to the extreme
asymmetry between the results of the different rounds of household survey. The most
persuasive conclusion that emerges from these data is that the proportion of population in
poverty may at best have declined slowly for Cambodia as a whole while it may have
13
declined significantly for urban Cambodia and indeed may have increased in rural
Cambodia over certain periods.
Between 1993/4 and 1999 agriculture’s share of total workforce increased, both
for men and women, despite a fall in agriculture’s share of output. By 1999 nearly 74 per
cent of the labor force was employed in agriculture. The share of industrial employment
also increased, mainly due to the expansion of employment in garment manufacturing.
Over the period under review the share in total employment fell for most services,
including health, education, transport and public sector. Since the reported information on
employment almost entirely refers to structures at two points of time, without an estimate
of absolute sizes, it is hard to judge the impact of growth on employment. There are few
signs of robust employment growth. The increased share of agriculture in total
employment and the extremely narrow base of employment expansion in industries
nevertheless point to the failure of employment to record a growth proportionate to
overall GDP growth. The slow growth of agriculture, only marginally higher than
population growth, and the rise in agriculture’s share of the labor force almost certainly
indicate a fall in output per worker in agriculture. Combined with the fact that households
in lower deciles derive a higher proportion of income from agriculture, the picture
conveys an impression of the possibility of increased immiserization of the large parts of
rural population over significant periods of time.
Ethiopia
During the 1990s, following extensive economic reform, Ethiopia’s growth
increased to an annual average rate of 4.2 per cent, in per capita terms 2 per cent, growth
in income. That this rate of growth was inadequate for poverty reduction is evident from
the fact that between 1995/96 and 1999/2000 per capita real consumption in rural
Ethiopia actually fell by 4 per cent and per capita real urban consumption increased by
just 3 per cent. The poverty outcome was actually determined by the change in the
distribution of income and consumption: rural Gini ratios fell a little and the incidence of
rural poverty, by all the standard measures, fell a little. Urban Gini ratios increased

14
leading to an increase in urban poverty. At the national level there was no appreciable
change in the incidence of poverty.9
During 1994-99, roughly coinciding with the period over which poverty estimates
are available, employment growth for the economy as a whole was dismal, -0.6 per cent
per year. The largest sector of employment, agriculture and allied activities, is estimated
to have recorded an even faster decline in employment. Estimates based on other sources
of data also show exceedingly low output elasticities of employment in manufacturing
and agriculture. The failure to reduce poverty in the Ethiopian case was due as much to
the low rate of economic growth as to the very low employment elasticity of growth.
Mongolia
During the first half of the 1990s per capita income in Mongolia fell at an average
annual rate of 4.3 per cent. It was replaced by very slow recovery in the second half and a
little faster growth in the early 21st century. Per capita income in 2004 remained
substantially below what it was at the end of the 1980s.
By 1994, largely due to the failure on the part of many industries to survive, 8.7
per cent of the labor force constituted registered unemployment. Restoration of growth
thereafter reduced it to 4.6 per cent by 1999. While the change in these rates may be
meaningful, their levels are certainly serious underestimates of the inadequate access to
remunerative employment. Large numbers of workers left the cities in the wake of loss of
job and became pastoralists. Between 1995 and 2000 – a period of recovery -
agriculture’s share of employment went up from 46.1 per cent to 48.6 per cent while the
share of manufacturing fell from 8.8 per cent to 6.7 per cent. One of the dreariest aspects
of this movement of labor was that it resulted in a fall in output per worker in both
agriculture and manufacturing between 1995 and 2000.
Estimates of poverty are available only for 1995 and 1998, a period over which
economic recovery had started taking place, with a significant rise in per capita income.
9 The ILO/SIDA study calls the official estimate of the slight decline in rural poverty “a statistical myth” since “the growth rate of real agricultural per capita output has been negative and real per capita rural income has declined”.

15
And yet overall incidence of “extreme poverty”, defined as those below a threshold
income needed to satisfy minimum nutritional needs and the barest of other needs,
remained virtually unchanged at over a third of population, with a slight rise in urban
poverty and a slight fall in rural poverty. There seems to be little doubt that the incidence
of poverty has increased sharply over the entire period under review.
Table 1 summarizes basic facts about MDGs, growth and other related indicators
for these countries. Besides the first MDG (poverty reduction and undernourishment),
two of the externality-embodying MDGs (child mortality and primary schooling) and
certain partial indicators of the public-good MDGs (female/male enrollment ratio as a
partial proxy for gender equality; HIV incidence as a proxy for disease control; and the
proportion of population with access to sanitation and drinking water as proxy for
environmental sustainability). For a number of the indicators the change since 1990 has
been shown as measures of progress.
Consider first the levels. Income poverty, estimated for comparable poverty line,
is not rank-correlated at all well with per capita real income.10 It is indeed lowest for
Armenia, the country with the highest per capita income; but perfectly inversely rank-
correlated with per capita real income for the other three countries.
Undernourishment, the other indicator of the first MDG, has ranking that is also
implausible and asymmetrical with poverty. It is highest for Ethiopia, the country with
the lowest per capita real income; but perfectly inversely rank-correlated with per capita
real income for the other three countries. While undernourishment is in line with income
poverty for Cambodia and Mongolia, it is twice the rate of income poverty in Ethiopia
and more than 17 times the rate of income poverty in Armenia! Barring large statistical
inaccuracy, it suggests that either relative prices are high for food or consumer preference
is biased against food in Ethiopia, and massively so in Armenia, relative to the other two
countries.
10 In principle per capita incomes and the poverty thresholds, estimated at purchasing power parity dollars, should be comparable across countries. The author is however aware that numerous methodological inaccuracies must have introduced significant errors.

16
Table 1
MDG and Related Indicators for Selected Countries
Indicator Armenia Cambodia Ethiopia Mongolia PPP$ Per Capita Income (2004) 4160 2310 750 2040 GDP Growth Rate (% p.a.): 1990-2000 -1.9 7.1 4.2 -3.0 2000-2004 11.3 6.3 3.6 5.2 Population Growth Rate (% p.a.) 1990-2004 -1.1 2.5 2.2 1.3 Investment/GDP 1990 47 8 12 38 2004 20 26 21 37 Saving/GDP 1990 36 6 10 7 2004 14 19 13 18 PPP$1 Poverty <2 34.1 23.0 27.0 % Undernourished 1990 - 43 - - 2002 34 33 46 28 Child Mortality 1990 60 115 204 108 2004 32 141 166 52 Primary Completion 1990 90 - 21 - 2004 107 82 51 95 Female/Male Enrollment Ratio (2002/03) 107 84 69 116 HIV Prevalence: 2003 0.1 2.6 4.4 <0.1 % Access to Sanitation: 1990 - - 4 - 2002 84 16 6 59 % Access to Drinking Water 1990 - - 25 62 2002 92 34 22 62 Note: Female/male enrollment ratio is the ratio of gross enrollment for all levels of education. HIV prevalence rate is the proportion of population infected. The data are from World Development Indicators, 2005 and 2006 and Human Development Report 2005.
17
The levels of the other MDGs are much better correlated with per capita real
income. Armenia, the richest country, ranks first in all except gender equity (in which it
is close second to Mongolia) and HIV prevalence (in which it ranks best, with lowest
incidence, together with Mongolia); and Ethiopia, the poorest country, ranks lowest in all.
The only other deviation from perfect rank correlation is that Cambodia, with higher real
income than Mongolia, uniformly ranks lower. Mongolia very clearly outranks Cambodia
in MDGs, often by a huge margin.
Now consider change in MDGs since 1990. The paper has argued that
employment-intensive growth is the principal determinant of success in attaining the first
MDG and growth and employment elasticity is high for the second, fourth and fifth
MDGs. One problem about “testing” this hypothesis for our small sample is that there is
little variability in employment performance among the four countries: they all are
unsatisfactory, only more or less so. Even so we should be able to get some insights.
Cambodia is the only country with good overall growth performance. But its
poverty performance has been less than satisfactory. One might argue that this is due to
its poor performance in employment growth.11 Ethiopia achieved modest growth in per
capita income during the period for which poverty estimates are available and, at least in
urban areas, the growth translated itself into growth in average personal income. But
urban poverty actually increased. This seems to be due to an adverse change in the
distribution of urban personal income which in turn must have been substantially due to
the dismal employment intensity of industrial growth. Flat rates of poverty in Armenia
(but note the almost certain rise in undernourishment) and Mongolia have been associated
with poor employment performance. For the period for which poverty estimates are
reported above, the annual growth in per capita GDP was more than 7 per cent in
Armenia and just over 2 per cent in Mongolia. Had growth been translated into
comparable growth in income of the poor, poverty would have fallen substantially in
Armenia and perhaps more noticeably than was the case in Mongolia.
11 An apparent puzzle in Cambodia is the clear and significant fall in undernourishment implying a contradiction with the relatively flat income poverty. But this may easily be due to the difference in dates: income poverty estimates terminate at an earlier date than malnourishment estimates.

18
The disconnect between growth and employment on the one hand and the (non-
poverty) MDGs on the other is much greater. Despite the fact that per capita income
growth over the period was less than 1 per cent per year and employment performance
was poor in Armenia it was well above being on course for the achievement of the fourth
MDG (child mortality) and had fully achieved the second MDG (universal primary
education).12 It had also fully achieved the partial indicator of gender equality and,
although information on the partial indicators of environmental sustainability is available
for only the recent period, their high absolute levels indicate that the country is
performing well on them.
Cambodia’s performance presents a different kind of puzzle. Despite rapid growth
its performance in child mortality was highly negative; it fell back according to this
indicator by a big margin. Information on change in performance on the other MDGs is
not available although performance in the public good MDGs, as can be gauged from
their absolute levels, seems to be rather poor. On balance Cambodia looks like a country
with rapid overall growth that has performed poorly on MDGs.
Ethiopia has made significant progress in universal primary education and child
mortality despite rather poor growth and employment performance. Its performance on
both these MDGs is however significantly below course for the attainment of the MDG
targets. In the partial indicators of environmental sustainability it has performed poorly,
especially in providing access to drinking water. It also does not appear to have made
progress in controlling disease, notably HIV. Thus moderate success in externality-
embodying MDGs is associated with poor performance in public-good MDGs.
Mongolia, with a very modest growth in per capita income and poor employment
performance, has been well above course for the attainment of the child mortality target
and has actually fully achieved the partial indicator of gender equality. Although
information is available only for one recent year, the high absolute level of the primary
school enrollment suggests that the fulfillment of this target is within reach. The levels of
the partial indicators of public-good MDGs are also quite good although the access to
drinking water, for which information on change between 1990 and 2000 is available,
12 By being on course means that the millennium goal would be reached if the annual percentage-point change in the indicator between 2004 and 2015 continues to be equal to the actual annual percentage-point change in the indicator between 1990 and 2004.

19
shows a complete lack of progress. On balance Mongolia represents good progress on
MDGs, not quite warranted by its anemic growth.
A number of useful findings emerge from the above despite the incompleteness of
data and the limited number of cases. First, there is at least a weak confirmation of the
hypothesis that growth, unaccompanied by a decent employment performance, would not
benefit the poor sufficiently to help achieve poverty reduction, the first of the MDGs. In
the above examples there is at least one case (Cambodia) of fairly rapid growth; but its
record of poverty reduction does not appear to have been anything nearly as good as the
overall growth rate would warrant. One explanation for this is that Cambodia’s poor
overall employment performance was not significantly better than the employment
performance of the other cases.
While the performance in attaining the first MDG was unsatisfactory in all the
cases, the performance in attaining the other MDGs, the ones that embody externality and
are public goods, varies among the countries, ranging between good (Armenia and
perhaps Mongolia) to poor (Cambodia). The analysis above argued that a combination of
private and public effort is necessary for success in attaining the externality-embodying
MDGs while high capacity for public investment and intervention is necessary for good
performance on the public-good MDGs. High growth is necessary, though not a
guarantee, for the fulfillment of these preconditions. Unsatisfactory employment
performance, among other factors, explains the lack of the private expenditure on these
MDGs in Cambodia. It is possible that the opportunity provided by growth was not
grabbed by the government to augment public investment in these MDGs. One can
similarly explain Ethiopia’s indifferent performance in MDGs. But how does one explain
the good performance of Armenia and Mongolia?
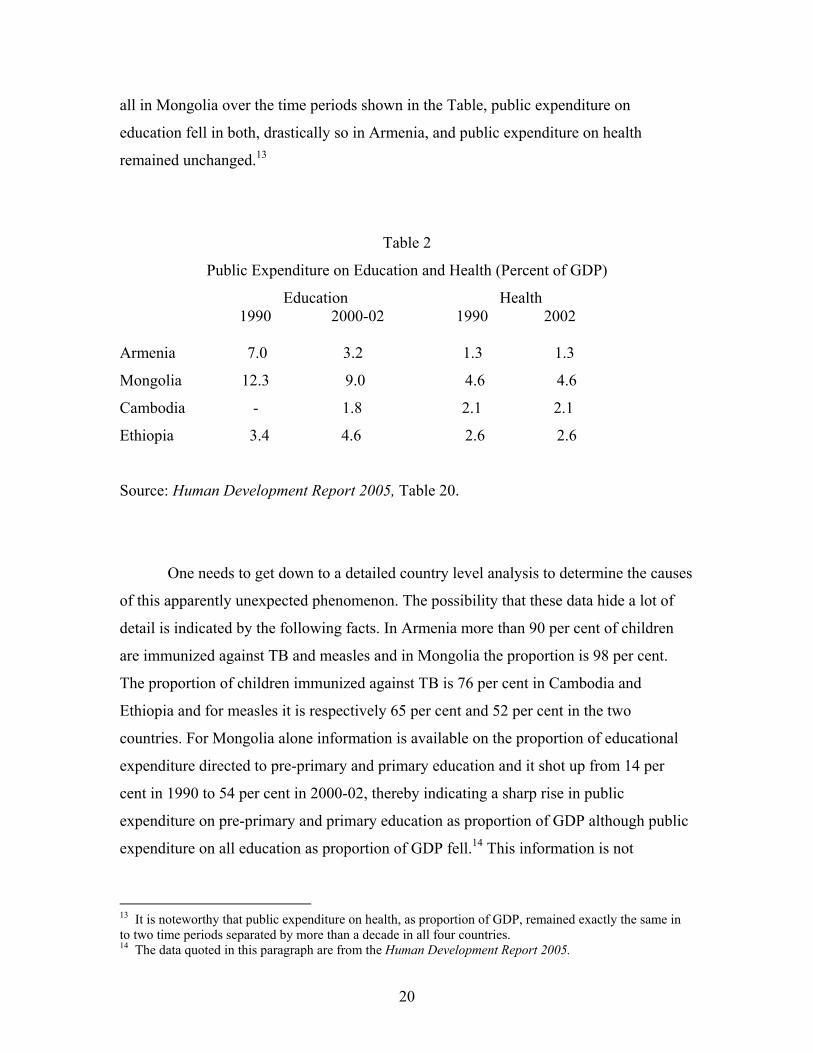
Table 2 shows public expenditure on education and health in the four countries in
1990 and 2000-2002. Cambodia’s poor performance is consistent with low (and in the
case of health also non-increasing) public expenditure. Ethiopia’s moderate success in
improving child mortality was not due to a particularly strong public support though
public expenditure on education went up as a proportion of GDP. Armenia and Mongolia
are the puzzling cases: as proportion of GDP, which grew slowly in Armenia and not at
20
all in Mongolia over the time periods shown in the Table, public expenditure on
education fell in both, drastically so in Armenia, and public expenditure on health
remained unchanged.13
Table 2
Public Expenditure on Education and Health (Percent of GDP)
Education Health 1990 2000-02 1990 2002 Armenia 7.0 3.2 1.3 1.3
Mongolia 12.3 9.0 4.6 4.6
Cambodia - 1.8 2.1 2.1
Ethiopia 3.4 4.6 2.6 2.6
Source: Human Development Report 2005, Table 20.
One needs to get down to a detailed country level analysis to determine the causes
of this apparently unexpected phenomenon. The possibility that these data hide a lot of
detail is indicated by the following facts. In Armenia more than 90 per cent of children
are immunized against TB and measles and in Mongolia the proportion is 98 per cent.
The proportion of children immunized against TB is 76 per cent in Cambodia and
Ethiopia and for measles it is respectively 65 per cent and 52 per cent in the two
countries. For Mongolia alone information is available on the proportion of educational
expenditure directed to pre-primary and primary education and it shot up from 14 per
cent in 1990 to 54 per cent in 2000-02, thereby indicating a sharp rise in public
expenditure on pre-primary and primary education as proportion of GDP although public
expenditure on all education as proportion of GDP fell.14 This information is not
13 It is noteworthy that public expenditure on health, as proportion of GDP, remained exactly the same in to two time periods separated by more than a decade in all four countries. 14 The data quoted in this paragraph are from the Human Development Report 2005.
21
available for the other countries. These details are matters to be dealt with by in-depth
country level analysis which is beyond the scope of the present paper.
Another issue relates to very uneven progress in different MDGs. For example,
Cambodia’s progress in reducing undernourishment has been reasonably good, though
still slightly below course, but its performance in child mortality has been disastrous. As
argued in this paper, the principal instrument for the reduction of malnourishment is
private expenditure and this may have gone up significantly over the period.15 Reduction
in child mortality depends both on private and public expenditure. Thus this may be due
to inadequate public effort and a clear case of externality preventing a rise in private
expenditure to the desirable level.
V. PROGRESS IN ATTAINING MDG TARGETS IN
THE OTHER IPS COUNTRIES
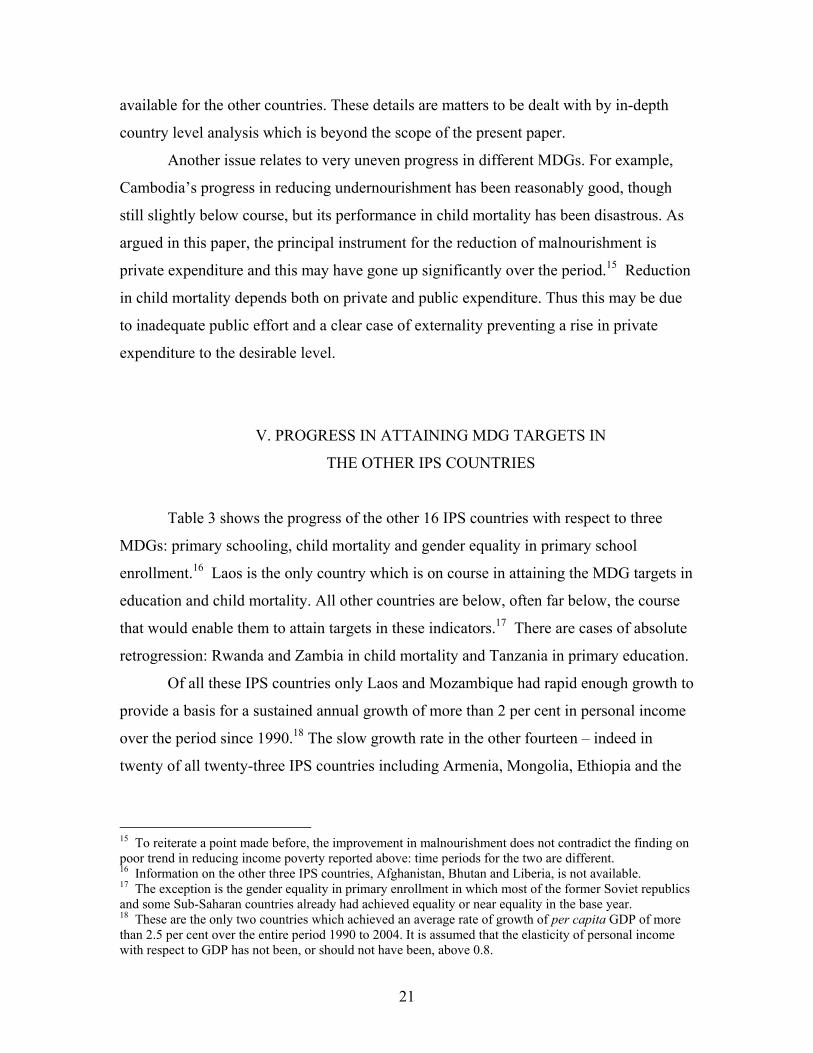
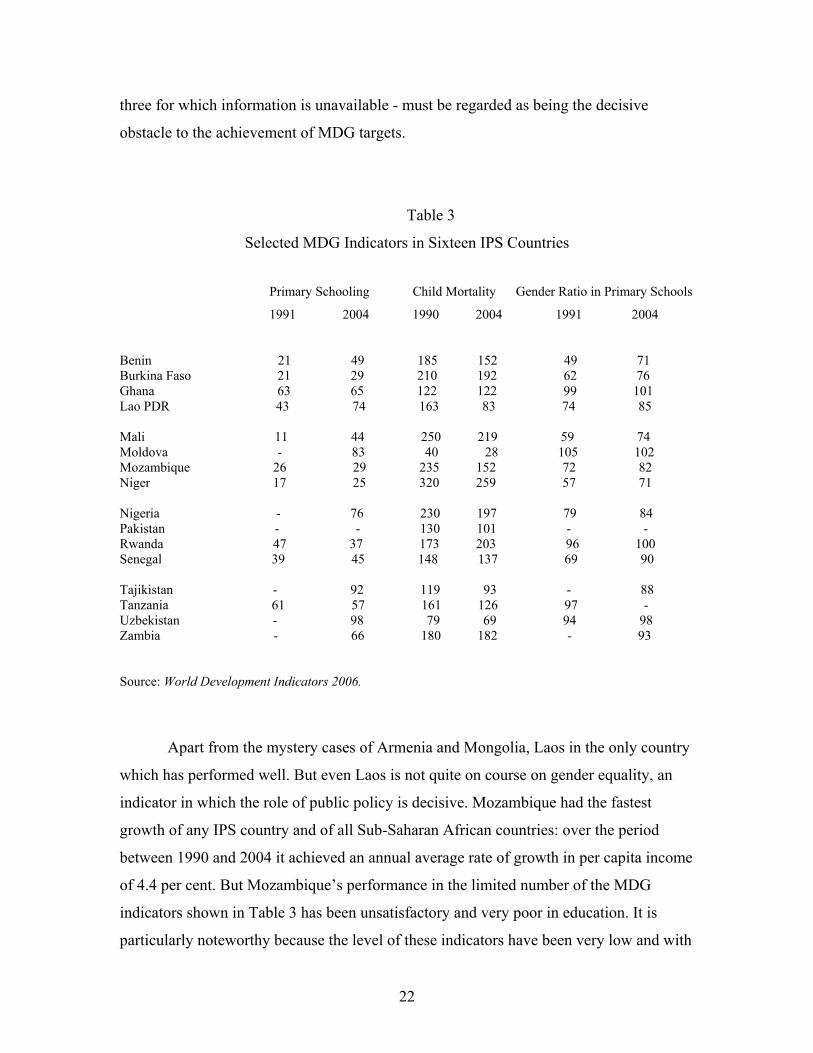
Table 3 shows the progress of the other 16 IPS countries with respect to three
MDGs: primary schooling, child mortality and gender equality in primary school
enrollment.16 Laos is the only country which is on course in attaining the MDG targets in
education and child mortality. All other countries are below, often far below, the course
that would enable them to attain targets in these indicators.17 There are cases of absolute
retrogression: Rwanda and Zambia in child mortality and Tanzania in primary education.
Of all these IPS countries only Laos and Mozambique had rapid enough growth to
provide a basis for a sustained annual growth of more than 2 per cent in personal income
over the period since 1990.18 The slow growth rate in the other fourteen – indeed in
twenty of all twenty-three IPS countries including Armenia, Mongolia, Ethiopia and the
15 To reiterate a point made before, the improvement in malnourishment does not contradict the finding on poor trend in reducing income poverty reported above: time periods for the two are different. 16 Information on the other three IPS countries, Afghanistan, Bhutan and Liberia, is not available. 17 The exception is the gender equality in primary enrollment in which most of the former Soviet republics and some Sub-Saharan countries already had achieved equality or near equality in the base year. 18 These are the only two countries which achieved an average rate of growth of per capita GDP of more than 2.5 per cent over the entire period 1990 to 2004. It is assumed that the elasticity of personal income with respect to GDP has not been, or should not have been, above 0.8.
22
three for which information is unavailable - must be regarded as being the decisive
obstacle to the achievement of MDG targets.
Table 3
Selected MDG Indicators in Sixteen IPS Countries
Primary Schooling Child Mortality Gender Ratio in Primary Schools
1991 2004 1990 2004 1991 2004
Benin 21 49 185 152 49 71 Burkina Faso 21 29 210 192 62 76 Ghana 63 65 122 122 99 101 Lao PDR 43 74 163 83 74 85 Mali 11 44 250 219 59 74 Moldova - 83 40 28 105 102 Mozambique 26 29 235 152 72 82 Niger 17 25 320 259 57 71 Nigeria - 76 230 197 79 84 Pakistan - - 130 101 - - Rwanda 47 37 173 203 96 100 Senegal 39 45 148 137 69 90 Tajikistan - 92 119 93 - 88 Tanzania 61 57 161 126 97 - Uzbekistan - 98 79 69 94 98 Zambia - 66 180 182 - 93 Source: World Development Indicators 2006.
Apart from the mystery cases of Armenia and Mongolia, Laos in the only country
which has performed well. But even Laos is not quite on course on gender equality, an
indicator in which the role of public policy is decisive. Mozambique had the fastest
growth of any IPS country and of all Sub-Saharan African countries: over the period
between 1990 and 2004 it achieved an annual average rate of growth in per capita income
of 4.4 per cent. But Mozambique’s performance in the limited number of the MDG
indicators shown in Table 3 has been unsatisfactory and very poor in education. It is
particularly noteworthy because the level of these indicators have been very low and with
23
the kind of rapid growth that the country achieved, it should have been possible to make
much faster progress. The difference between the performance of Laos and Mozambique
is something that deserves careful analysis. Unfortunately little information is readily
available to the author of this paper to undertake such an analysis. All that can be
reported is that Laos has less inequality (the Gini ratio of expenditure distribution is
0.346 and expenditure share of the bottom 40 per cent is 11.5 per cent, the corresponding
figures for Mozambique respectively being 0.396 and 9 per cent).19 There is little to go
by about the performance of these countries on employment. PPP$ 1 poverty is higher in
Mozambique (37.9 per cent) than in Laos (27 per cent) but Laos has almost 60 per cent
higher PPP$ income than Mozambique and the poverty estimate for it relates to a later
date. Poverty estimates according to the national poverty line are available for Laos for
1993 and 1997/8 and they indicate a modest decline. No such estimate is available for
Mozambique. Public expenditure as proportion of GDP is higher for health in
Mozambique (4.1 per cent) than in Laos (1.5 per cent); but lower for education in
Mozambique (2.4 per cent) than in Laos (2.8 per cent). But these details again are
inadequate: in Laos nearly half of public educational spending was for pre-primary and
primary level while for Mozambique the corresponding figure for recent years is
unavailable.
VI. CONCLUDING OBSERVATIONS
Only three of the 23 IPS countries had an overall rate pf growth that might have
been adequate for a simultaneous growth in personal income of individuals – leading to a
significant reduction in poverty and increase in private expenditure on education, health
and related components of MDGs – and growth in public revenue, leading to high enough
a rate of public investment in MDGs. In the remaining 20 countries the inadequacy of
economic growth was the decisive and sufficient obstacle to the attainment of the MDG
goals. 19 These figures are from World Development Indicators 2006 which does not report the change in distribution of income in the two countries. The source for the other data shown in this paragraph is the same.

24
Of the three countries that achieved adequate growth only Laos seems to have
made adequate progress in primary education and child mortality and is on target for the
MDGs. Neither Cambodia nor Mozambique is on target. The failure of Cambodia’s
growth to bring about a broad-based improvement in personal income of the poor was
largely a reflection of the failure to have rapid enough a growth in employment.20
Economic growth has resulted in a sharp improvement in the rate of domestic saving and
investment; but these are still not high enough in the context of the huge challenge
presented by the devastated infrastructure and other consequences of the civil war.
Deflationary policies instituted in the wake of the Asian crisis, though contributing to the
control of inflation and macroeconomic stability, may have outlived their necessity. We
do not have the necessary information on employment performance in Laos and
Mozambique to explain its effect on their relative performance.
The performance of Armenia and Mongolia appear hard to explain. But public
expenditure on education and health as proportion of GDP has been the highest in
Mongolia of all the countries cited (see Table 2) and Armenia has by far the highest level
of income (it is the only middle-income country in the IPS group). Also, as former Soviet
Republics, Armenia and Mongolia probably still have far better basic infrastructure for
education and health than the average low-income countries. Armenia’s further success in
primary schooling, despite a fall in public expenditure on education, may be due to the
demographic change, unique in the group, reducing the number of children in primary-
school age. What explains the remarkable fall in child mortality in Armenia, despite
widespread undernourishment and very low public expenditure in health, requires more
careful analysis.
One point, hopefully obvious though not explicitly highlighted above, is that
many of the apparent puzzles noted in the paper may largely reflect the poor state of
information on the MDG indicators. These indicators are often based on data that are
poorer in quality than the average economic statistics. Furthermore, the frequency of
surveys on which they are based is usually far less than the ones that provide data on
indicators like output and income. Not only are the MDG indicators subject to less
20 Another way of viewing the failure in Cambodia is to consider growth itself being inadequate in so far as it was narrowly based, bypassing the agricultural sector which provided livelihood for more than 70 per cent of the people.
25
change over time than indicators of output and income, but their changes are also
captured by the statistical system with longer time lags. For the serious pursuit of the
MDG targets it is essential to improve the quality of information on these indicators so
that the progress towards their achievement might be better monitored.
The analysis and evidence above, though limited, suggest that action for
accelerated attainment of MDGs is urgently needed. Such action needs to be
multidimensional. It should consist of the following components:
1. Rapid employment-intensive growth must be an essential element of the strategy.
It not only contributes directly to the attainment of most of the first MDG target
and good parts of the second, fourth and fifth MDG targets; it is also essential for
the generation of resources for public investment in MDGs (see 2 and 3 below).
2. But it needs to be supplemented by public investment and intervention for the
promotion of those MDG elements that embody externalities.
3. The attainment of the MDGs that are public goods must be the matter for public
investment and intervention partly because the contribution of private expenditure
to their attainment is likely to be small and partly because these MDGs would
facilitate the implementation of the employment-intensive growth strategy.
For the countries considered above, with the exception of Cambodia, Laos and
Mozambique, the acceleration of growth is of the highest priority. The experience of
Cambodia indicates the importance of such growth being sufficiently broad-based and
employment intensive. The positive outcome in Mongolia despite slow growth and the
apparently negative outcome in Mozambique despite rapid growth underline the
importance of adequate public action.
The expansion of development objective from mere growth and (income) poverty
reduction to the broader MDG targets implies a basic shift in development policy that has
been dominant in recent decent decades. The pursuit of growth with poverty reduction in
the era of reforms inspired by the international development agencies could comfortably
focus on the increase of the personal income of the poor as the principal instrument,
something that could be achieved by promoting employment-intensive growth with no
more than a modest role for public income transfer for labor-poor households. Once the
26
importance of achieving the externality-embodying and public-good MDGs is
recognized, the inadequacy of this strategy becomes obvious. A much more direct role
for the public sector in facilitating access to development targets has to become an
integral part of development policy. This requires a basic reorientation of development
policy away from the reform program that for the last several decades has constantly
hammered on the theme of a reduction of the role of the state and the curtailment of
public expenditure.
Finally, growth in many of the countries discussed above is limited by inadequate
capital formation and the paucity of domestic saving. The gross rate of capital formation
is 9 per cent in Tajikistan, 16 per cent in Niger, 17 per cent in Zambia and 19 per cent in
Burkina Faso and Tanzania as compared to the average of 23 per cent for the low-income
countries.21 For these countries the success in attaining the eighth MDG is almost a pre-
requisite for the acceleration of economic growth that is a precondition for the
achievement of the other MDGs. Unfortunately, as noted earlier, the achievement of the
eighth MDG is entirely a matter of action by the advanced industrial countries.22
- - -
Revised March 2007
Acknowledgment
The author is very grateful to Eduardo Zepeda, Terry McKinley and the participants at a seminar on 13 March 2007 at the International Poverty Centre for many helpful comments. Thanks are also due to Rizwanul Islam of the ILO who gave a number of useful suggestions.
21 These rates are for 2004 shown in World Development Indicators 2006. 22 This is notwithstanding the frequent allegation by the development partners – the advanced industrial countries and the international development agencies – that the absence of “good behavior” on the part of the developing countries is a major limiting factor.