employment of persons with disabilities * use of the ... of the economically active population...
TRANSCRIPT

19 December 2011
Employment of Persons with Disabilities * Use of the Economically Active Population Survey and the State Database of
Persons with Disabilities. Years 2010 and 2009. Provisional data
Main results
- More than one million persons aged 16 to 64 years old and resident in households havecertified disabilities in 2010, accounting for 3.8% of the population of working age.
−36.2% of persons with legally recognised disabilities are economically active in 2010. Thepercentage of economically active persons for the population without disabilities is 75.9%,that is, 39.7 percentage points higher.
−The unemployment rate for those persons with disabilities is 23.3% in 2010, more thanthree points higher than that of the population without disabilities.
− 27.7% of the persons with certified disabilities in 2010 are employed. 89.3% of them arewage earners, and 78,9% have a permanent contract.
−Nine out of 10 persons with disabilities of a working age who receive a pension in 2010 areeconomically inactive.
A total of 1,171,900 persons aged 16 to 64 years old and resident in households had certified disabilities in 2010, with an 8.3% increase, as compared with the year 2009.
This figure represented 3.8% of the total population of a working age, over the 3.5% recorded the previous year.
* This refers to those persons with certified disabilities, or with legally recognised disabilities, who have a degree of disability greater than or equal to 33%, according to the valuation procedure established by Royal Decree 1971/1999, modified by Royal Decree 1856/2009
1

Disability by sex, age, and type of impairment
Disability is a phenomenon in which the sex and age variables are of great importance. Its prevalence is greater among men of a working age (54.6% in 2010) than among women (45.4%). Moreover, it is directly related to the aging of the population. Thus, in the year 2010, a total of 61.6% of the population of persons with certified disabilities of a working age were over 44 years old, as compared with 5.8% who were under 25 years of age. This fact was even more significant among women, with 64.7% of them aged over 44 years old.
The types of disability with the greatest occurrence in the population of a working age in 2010 were those associated with osteoarticular impairments (23.3%) and mental disorders (17.6%). At the opposite end of the spectrum, the impairments of the digestive, metabolic and endocrine system (4.3%) and the auditory system (5.7%) were observed the least in said population.
Worth noting was that the impairments of the cardiovascular, respiratory and immunological system showed the greatest difference between the male and female populations. Specifically, 64.2% of the total persons who registered this type of impairment were men, and 35.8% were women.
Activity, employment and unemployment rates
In global terms, and from a labour perspective, the most significant aspect for the group of persons with legally recognised disabilities was their low degree of participation in the labour market, and not so much their level of unemployment. In fact, the corresponding economic activity rate in 2010 was 36.2%, as compared with the 75.9% recorded for the population without disabilities.
In the year 2010, the unemployment rate for those persons with certified disabilities exceeded that of the population without disabilities by 3.2 points. However, considering its evolution, in the last two years, the unemployment rate has increased to a lesser extent for those persons with disabilities. Specifically, it increased 1.5 points, from 21.8% in 2009 to 23.3% in 2010. In turn, the unemployment rate of persons without disabilities grew two points, reaching 20.1% in 2010. The most significant differences were observed among young persons, given that for the population of persons with certified disabilities aged 16 to 24 years old, the unemployment rate (51.7%) was 10.3 percentage points higher than for the persons without disabilities (41.4%).
By sex, the unemployment rate for women with certified disabilities in 2010 (24.9%) was higher than that recorded for men (22.3%).
In turn, the employment rate for men with certified disabilities was more than eight points higher than for women.
The number of economically inactive persons increased noticeably with age, exceeding 70% for those persons with disabilities aged over 44 years old in 2010. This rate stood at approximately 30% for those persons without disabilities.
According to the type of disability, that associated with auditory impairments presented the highest activity rates (58.2% in 2010). In turn, that associated with mental disorders registered the lowest rates (24.9%).
2

The intensity of the disability also affected participation in the labour market. Thus, the activity rate of those persons with a degree of disability lower than 45% stood at approximately 55% in 2010, whereas for those persons with a degree of disability greater than or equal to 75%, this rate dropped to 14.2%.
The activity rate of the population of persons with disabilities increased along with the educational level. In 2010, persons with disabilities with higher education reached an activity rate of 59.7%, that is, 23.5 points higher than average. This increase also managed to lessen the differences with the general population by more than 11 points.
Receipt of income and pensions was also an element linked to the economic activity situation of persons with disabilities. 91% of persons with certified disabilities who received a pension in 2010 were economically inactive, and only 38.2% of those who did not receive a pension were inactive.
Employment and disability
89.3% of persons with disabilities who worked in 2010 did so as wage earners, and 78.9% of them had a permanent contract (four points higher than for the general population).
The greatest stability in contracts for those persons with disabilities was registered in the male population (80.8% of permanent contracts in 2010), and at an age over 24 years old (77.2%).
86.6% of employed persons with disabilities worked full time in 2010. Although there were not significant differences between persons with and without disabilities with regard to the type of working day, those persons who claimed to have a part-time working day for reasons relating to illness or incapacity were more prevalent among the group of persons with disabilities (1.8% as compared with 0.1%).
More than three-quarters of the employed persons with disabilities carried out their work in the Services sector.
Disability by Autonomous Community
The percentage of persons with certified disabilities of a working age, over the population aged 16 to 64 years old, ranged between values greater than 5.5% in Principado de Asturias, Región de Murcia and the Autonomous Cities of Ceuta and Melilla, and values less than 3.3% in Illes Balears, Comunitat Valenciana and Comunidad de Madrid.
The Autonomous Communities with the highest economic activity rates among those persons with disabilities in 2010 were Región de Murcia (48.9%) and Comunidad de Madrid (40.9%).
In turn, those with the highest economic inactivity rates were Canarias (with 72.4% of inactive persons within the group of persons with certified disabilities) and Andalucía (68.5%).
3

Methodological note
The Employment of Persons with Disabilities (EPD) statistics are compiled using the Economically Active Population Survey (EAPS) of the National Statistics Institute (INE) and the State Database of Persons with Disabilities (SDPD) of the Institute for the Elderly and Social Services (IMSERSO), following the initiative of these two organisations and the Committee of Representatives of Persons with Disabilities (CERMI), the ONCE Foundation and the Directorate General for the Coordination of Sectoral Policy for Disabilities of the Ministry of Health, Social Policy and Equality.
For its compilation, the files of the EAPS are crossed with those of the SDPD, in such a way that it is possible to combine all of the socio-demographic and labour information of the survey with that regarding those persons with a legally recognised percentage of disability that is greater than or equal to 33%.
This is therefore a statistical operation that combines survey data with administrative data, with the advantages that this implies in terms of the decrease in the response workload for informants and the savings in budgetary resources. However, we must consider the limitations that the size of the sample of persons with disabilities introduces at the time of making detailed use of the results.
The 2008 EPD was a pilot project. Once its feasibility was confirmed, it was carried out for the 2009 and 2010 periods. In the future, it will be repeated annually, which will enable periodical monitoring the labour status of those persons with legally recognised disabilities.
The SDPD available at the time of the pilot study had reference period 31/12/2006. Beginning with reference year 2009, there is a perfected SDPD that enables carrying out of the best analysis, but which prevents making strict comparisons with previous years. In addition, the coming into force of the Promotion of Personal Independence and Service to Persons in a Situation of Dependency as of 2007 could have motivated the request of a disability valuation procedure for a greater number of persons (though a dependency valuation procedure does not require recognition of the degree of disability), thus introducing another cause of heterogeneity in the series.
For this reason, the comparative charts among the data from EPD-2009 and EPD-2008 are restricted to the structure and composition of the population (without considering the absolute figures regarding the number of persons with disabilities).
For further information see INEbase-www.ine.es/en/welcome_en.htm All press releases at: www.ine.es/en/prensa/prensa_en.htm Press Office: Telephone numbers: 91 583 93 63 / 94 08 – Fax: 91 583 90 87 - [email protected] Information Area: Telephone number: 91 583 91 00 – Fax: 91 583 91 58 – www.ine.es/infoine/?L=1
4

Employment of Persons with Disabilities Year 2010Disability(1)
(Absolute values in thousands)1. Population aged 25 to 64 years old by sex and disability(1)
Total Men Women Total Total Total
TOTAL 1,081.8 592.1 489.7AGE GROUPS 16 to 24 years old 60.2 35.5 24.625 to 44 years old 361.9 211.4 150.645 to 64 years old 659.7 345.2 314.5TYPE OF DISABILITYOsteoarticular system 254.4 135.8 118.5Neuromuscular system 130.9 74.4 56.5Intellectual 149.7 85.7 64.1Mental disorder 182.0 95.8 86.2Visual system 80.0 42.0 38.0Auditive system 61.7 31.4 30.3
100.4 64.1 36.2
45.8 24.8 21.0
Other 77.1 38.1 38.9
2. Population aged 16 to 64 years old by prevalence and presence of the disability (1)
by Autonomous Community
With disabilities With disabilities Total Percentage Total Percentage
TOTAL 30,828.1 1,171.9 3.8 14,112.6 1,072.9 7.6Andalucía 5,556.5 215.5 3.9 2,445.7 195.3 8.0Aragón 855.5 35.3 4.1 399.0 31.9 8.0Asturias, Principado de 702.7 41.4 5.9 329.8 38.5 11.7Balears, Illes 746.5 23.7 3.2 357.9 22.1 6.2Canarias 1,471.5 53.2 3.6 669.0 49.4 7.4Cantabria 389.8 17.4 4.5 178.9 15.9 8.9Castilla y León 1,606.4 62.2 3.9 748.8 55.4 7.4Castilla-La Mancha 1,347.6 57.4 4.3 593.9 51.2 8.6Cataluña 4,854.1 197.1 4.1 2,264.8 180.4 8.0Comunitat Valenciana 3,369.3 91.9 2.7 1,573.8 86.6 5.5Extremadura 707.7 32.5 4.6 312.3 28.9 9.2Galicia 1,792.5 83.1 4.6 826.1 76.3 9.2Madrid, Comunidad de 4,312.8 104.0 2.4 1,961.7 97.3 5.0Murcia, Región de 990.5 63.0 6.4 425.0 57.1 13.4Navarra, Comunidad Foral de 406.9 14.0 3.4 193.6 13.1 6.8País Vasco 1,413.5 63.1 4.5 692.2 58.5 8.5Rioja, La 207.1 8.1 3.9 99.8 7.6 7.6Ceuta and Melilla 97.3 9.1 9.3 40.3 7.3 18.2
Personsaged 16 to 64 years old
Households with some person aged 16 to 64 years old
Cardiovascular, immunological and respiratory systems
Digestive, metabolic and endocrine systems
(1) These are persons with certified disabilities, and who have a degree of disability greater than or equal to 33%, according to the assessment procedure established by RD 1971/1999, modified by RD 1856/2009
EPD Year 2010 - TABLES ANNEXE

Employment of Persons with Disabilities Year 2009
Disability(1)
(Absolute values in thousands)1. Population aged 25 to 64 years old by sex and disability (1)
Total Men Women Total Total Total
TOTAL 1,081.8 592.1 489.7AGE GROUPS 16 to 24 years old 60.2 35.5 24.625 to 44 years old 361.9 211.4 150.645 to 64 years old 659.7 345.2 314.5TYPE OF DISABILITYOsteoarticular system 254.4 135.8 118.5Neuromuscular system 130.9 74.4 56.5Intellectual 149.7 85.7 64.1Mental disorder 182.0 95.8 86.2Visual system 80.0 42.0 38.0Auditive system 61.7 31.4 30.3Cardiovascular, immunological and respiratory systems 100.4 64.1 36.2Digestive, metabolic and endocrine systems 45.8 24.8 21.0Other 77.1 38.1 38.9
2. Population aged 16 to 64 years old by prevalence and presence of the disability (1)
by Autonomous Community
With disabilities With disabilities Total Percentage Total Percentage
TOTAL 30,906.1 1,081.8 3.5 14,043.9 994.3 7.1Andalucía 5,536.2 197.7 3.6 2,426.1 181.4 7.5Aragón 863.3 33.2 3.8 401.8 30.7 7.6Asturias, Principado de 707.0 38.7 5.5 328.2 36.0 11.0Balears, Illes 745.2 21.2 2.8 353.7 19.3 5.5Canarias 1,469.9 49.4 3.4 663.2 44.9 6.8Cantabria 391.5 15.5 4.0 175.1 14.2 8.1Castilla y León 1,622.9 58.1 3.6 757.1 52.8 7.0Castilla-La Mancha 1,346.1 50.2 3.7 585.5 46.4 7.9Cataluña 4,877.7 179.4 3.7 2,271.2 164.6 7.2Comunitat Valenciana 3,401.3 90.0 2.6 1,579.9 85.7 5.4Extremadura 706.2 32.1 4.5 305.0 28.3 9.3Galicia 1,801.9 76.1 4.2 824.9 70.5 8.5Madrid, Comunidad de 4,315.6 95.2 2.2 1,939.8 86.2 4.4Murcia, Región de 985.6 56.6 5.7 415.4 50.8 12.2Navarra, Comunidad Foral de 407.3 13.7 3.4 191.3 12.9 6.7País Vasco 1,424.5 59.0 4.1 688.3 55.9 8.1Rioja, La 210.3 7.6 3.6 98.0 6.9 7.0Ceuta and Melilla 93.6 8.2 8.8 39.6 6.7 16.9
Personsaged 16 to 64 years old
Households with some person aged 16 to 64 years old
(1) These are persons with certified disabilities, and who have a degree of disability greater than or equal to 33%, according to the assessment procedure established by RD 1971/1999, modified by RD 1856/2009
EPD Year 2009 - TABLES ANNEXE

Employment of Persons with Disabilities EvolutionDisability(1)
(Absolute values in thousands)1. Population aged 25 to 64 years old by sex and disability(1)
Total Men Women
2010 2009 2008 2010 2009 2008 2010 2009 2008Percentage Percentage Percentage Percentage Percentage Percentage Percentage Percentage Percentage
TOTAL 100 100 100 100 100 100 100 100 100AGE GROUPS 16 to 24 years old 5.8 5.6 6.6 6.3 6.0 7.0 5.2 5.0 6.125 to 44 years old 32.6 33.5 35.3 34.7 35.7 37.6 30.1 30.8 32.445 to 64 years old 61.6 61.0 58.1 59.1 58.3 55.4 64.7 64.2 61.4TYPE OF DISABILITYOsteoarticular system 23.3 23.5 18.5 22.6 22.9 18.4 24.2 24.2 18.5Neuromuscular system 12.0 12.1 13.3 12.4 12.6 13.6 11.5 11.5 12.8Intellectual 13.6 13.8 17.6 14.3 14.5 17.9 12.8 13.1 17.2Mental disorder 17.6 16.8 16.6 17.0 16.2 16.4 18.3 17.6 16.9Visual system 7.2 7.4 7.8 6.9 7.1 7.2 7.5 7.8 8.4Auditive system 5.7 5.7 5.3 5.3 5.3 5.0 6.2 6.2 5.8
9.2 9.3 9.6 10.8 10.8 10.9 7.2 7.4 7.9
4.3 4.2 3.9 4.3 4.2 3.7 4.3 4.3 4.2Other 7.2 7.1 7.5 6.5 6.4 6.9 8.0 7.9 8.2
2. Population aged 16 to 64 years old by prevalence and presence of the disability (1)
by Autonomous Community
2010 2009 2008 2010 2009 2008Percentage Percentage Percentage Percentage Percentage Percentage
TOTAL 3.8 3.5 2.8 7,6 7.1 6.0Andalucía 3.9 3.6 3.0 8,0 7.5 6.5Aragón 4.1 3.8 2.8 8,0 7.6 5.9Asturias, Principado de 5.9 5.5 6.0 11,7 11.0 12.3Balears, Illes 3.2 2.8 1.6 6,2 5.5 3.3Canarias 3.6 3.4 2.0 7,4 6.8 4.4Cantabria 4.5 4.0 3.9 8,9 8.1 7.9Castilla y León 3.9 3.6 3.6 7,4 7.0 7.4Castilla-La Mancha 4.3 3.7 2.6 8,6 7.9 5.8Cataluña 4.1 3.7 2.3 8,0 7.2 4.7Comunitat Valenciana 2.7 2.6 2.9 5,5 5.4 6.1Extremadura 4.6 4.5 2.8 9,2 9.3 6.4Galicia 4.6 4.2 2.9 9,2 8.5 6.2Madrid, Comunidad de 2.4 2.2 2.1 5,0 4.4 4.6Murcia, Región de 6.4 5.7 4.4 13,4 12.2 9.6Navarra, Comunidad Foral 3.4 3.4 3.1 6,8 6.7 6.4País Vasco 4.5 4.1 3.4 8,5 8.1 6.9Rioja, La 3.9 3.6 3.4 7,6 7.0 7.3Ceuta and Melilla 9.4 8.8 7.4 18,2 16.9 15.4
Personsaged 16 to 64 years old
Households with some person aged 16 to 64 years old
Cardiovascular, immunological and respiratory systems
Digestive, metabolic and endocrine systems
(1) These are persons with certified disabilities, and who have a degree of disability greater than or equal to 33%, according to the assessment procedure established by RD 1971/1999, modified by RD 1856/2009
EPD Year 2010 - TABLES ANNEXE

Employment of Persons with DisabilitiesYear 2010
Disability(1) and activity(Absolute values in thousands)
1. Population aged 16 to 64 years old and relationship with economic activity
Total
Total Percentage Total Percentage Total Percentage
TOTAL 30,828.1 100.0 29,656.3 100.0 1,171.9 100.0Active persons 22,932.6 74.4 22,509.0 75.9 423.7 36.2- Employed persons 18,304.1 59.4 17,979.3 60.6 324.8 27.7- Unemployed persons 4,628.6 15.0 4,529.7 15.3 98.9 8.4Inactive persons 7,895.5 25.6 7,147.3 24.1 748.2 63.8Activity rate (16-64) - 74.4 - 75.9 - 36.2Unemployment rate (16-64) - 20.2 - 20.1 - 23.3Employment rate (16-64) - 59.4 - 60.6 - 27.7
2. Population aged 16 to 64 years old, by sex and relationship with economic activity
Total
Total Percentage Total Percentage Total Percentage
MEN 15,550.2 100.0 14,910.5 100.0 639.6 100.0Active persons 12,729.9 81.9 12,471.4 83.6 258.5 40.4- Employed persons 10,203.6 65.6 10,002.8 67.1 200.8 31.4- Unemployed persons 2,526.3 16.2 2,468.6 16.6 57.7 9.0Inactive persons 2,820.3 18.1 2,439.1 16.4 381.1 59.6Activity rate (16-64) - 81.9 - 83.6 - 40.4Unemployment rate (16-64) - 19.8 - 19.8 - 22.3Employment rate (16-64) - 65.6 - 67.1 - 31.4WOMEN 15,278.0 100.0 14,745.8 100.0 532.2 100.0Active persons 10,202.7 66.8 10,037.6 68.1 165.2 31.0- Employed persons 8,100.5 53.0 7,976.5 54.1 124.0 23.3- Unemployed persons 2,102.3 13.8 2,061.1 14.0 41.2 7.7Inactive persons 5,075.3 33.2 4,708.2 31.9 367.1 69.0Activity rate (16-64) - 66.8 - 68.1 - 31.0Unemployment rate (16-64) - 20.6 - 20.5 - 24.9Employment rate (16-64) - 53.0 - 54.1 - 23.3
Personswithout disabilities
Personswith disabilities(1)
Personswithout disabilities
Personswith disabilities(1)
(1) These are persons with certified disabilities, and who have a degree of disability greater than or equal to 33%, according to the assessment procedure established by RD 1971/1999, modified by RD 1856/2009
EPD Year 2010 - TABLES ANNEXE

Employment of Persons with DisabilitiesYear 2010Disability(1) and activity(Absolute values in thousands)
3. Population aged 16 to 64 years old, by age group and relationship with economic activity
Total
Total Percentage Total Percentage Total Percentage
POPULATION AGED 16 TO 24 YEARS O 4,366.6 100.0 4,299.0 100.0 67.6 100.0Active persons 2,069.9 47.4 2,046.2 47.6 23.7 35.1- Employed persons 1,211.2 27.7 1,199.8 27.9 11.4 16.9- Unemployed persons 858.6 19.7 846.4 19.7 12.3 18.1Inactive persons 2,296.7 52.6 2,252.8 52.4 43.9 64.9Activity rate (16-64) - 47.4 - 47.6 - 35.1Unemployment rate (16-64) - 41.5 - 41.4 - 51.7Employment rate (16-64) - 27.7 - 27.9 - 16.9POPULATION AGED 25 TO 44 YEARS O 14,945.1 100.0 14,563.0 100.0 382.1 100.0Active persons 13,088.0 87.6 12,896.5 88.6 191.5 50.1- Employed persons 10,476.1 70.1 10,333.4 71.0 142.8 37.4- Unemployed persons 2,611.9 17.5 2,563.1 17.6 48.7 12.8Inactive persons 1,857.1 12.4 1,666.5 11.4 190.6 49.9Activity rate (16-64) - 87.6 - 88.6 - 50.1Unemployment rate (16-64) - 20.0 - 19.9 - 25.5Employment rate (16-64) - 70.1 - 71.0 - 37.4POPULATION AGED 45 TO 64 YEARS O 11,516.4 100.0 10,794.3 100.0 722.1 100.0Active persons 7,774.8 67.5 7,566.3 70.1 208.5 28.9- Employed persons 6,616.7 57.5 6,446.1 59.7 170.6 23.6- Unemployed persons 1,158.1 10.1 1,120.2 10.4 37.9 5.2Inactive persons 3,741.6 32.5 3,228.0 29.9 513.7 71.1Activity rate (16-64) - 67.5 - 70.1 - 28.9Unemployment rate (16-64) - 14.9 - 14.8 - 18.2Employment rate (16-64) - 57.5 - 59.7 - 23.6
4. Population aged 16 to 64 years old with disabilities (1), according to whether and relationship with economic activity
Total Active persons
Inactive persons
PERSONS WITH DISABILITIES(1) (16-64) 1,171.9 423.7 748.2RECEIPT OF PENSIONS- Receive some pension 568.9 51.1 517.8- Receive no pension 603.0 372.6 230.4HOUSEHOLD INCOME - Reside in households with income 1,141.6 416.6 725.1- Reside in households without income 30.2 7.1 23.1
Personswithout disabilities
Personswith disabilities(1)
(1) These are persons with certified disabilities, and who have a degree of disability greater than or equal to 33%, according to the assessment procedure established by RD 1971/1999, modified by RD 1856/2009
EPD Year 2010 - TABLES ANNEXE

Employment of Persons with DisabilitiesYear 2010
Disability(1) and activity(Absolute values in thousands)
5. Population aged 16 to 64 years old, according to education and relationship with economic activity
Active persons Active persons Active persons
Total
Total Percentage Total Percentage Total Percentage
TOTAL 22.932,6 74,4 22.509,0 75,9 423,7 36,2- Illiterate persons 109,4 34,9 102,4 47,8 7,0 7,0- Primary education 3.223,8 58,4 3.139,0 61,2 84,8 21,8
12.028,2 73,6 11.797,1 74,5 231,1 44,9
7.571,2 87,5 7.470,5 88,1 100,8 59,7
6. Persons with disabilities(1) aged 16 to 64 years old, by Autonomous Community and relationship with economic activity
Total Active persons Inactive persons Activity Inactivity rate rate
TOTAL 1,171.9 423.7 36.2 748.2 63.8Andalucía 215.5 67.8 31.5 147.7 68.5Aragón 35.3 12.3 34.8 23.0 65.2Asturias, Principado de 41.4 13.2 31.9 28.1 67.9Balears, Illes 23.7 9.0 38.0 14.8 62.4Canarias 53.2 14.6 27.4 38.5 72.4Cantabria 17.4 6.0 34.5 11.3 64.9Castilla y León 62.2 20.4 32.8 41.8 67.2Castilla-La Mancha 57.4 23.0 40.1 34.4 59.9Cataluña 197.1 77.4 39.3 119.7 60.7Comunitat Valenciana 91.9 34.3 37.3 57.6 62.7Extremadura 32.5 10.6 32.6 21.9 67.4Galicia 83.1 26.8 32.3 56.3 67.7Madrid, Comunidad de 104.0 42.5 40.9 61.5 59.1Murcia, Región de 63.0 30.8 48.9 32.2 51.1Navarra, Comunidad Foral de 14.0 5.1 36.4 8.9 63.6País Vasco 63.1 22.7 36.0 40.4 64.0Rioja, La 8.1 3.3 40.7 4.8 59.3Ceuta and Melilla 9.1 3.7 40.7 5.4 59.3
- Secondary education and training programmes and labour insertion - Higher education, including doctorates
Personswithout disabilities
Personswith disabilities(1)
(1) These are persons with certified disabilities, and who have a degree of disability greater than or equal to 33%, according to the assessment procedure established by RD 1971/1999, modified by RD 1856/2009
EPD Year 2010 - TABLES ANNEXE

Employment of Persons with DisabilitiesYear 2009
Disability(1) and activity(Absolute values in thousands)
1. Population aged 16 to 64 years old and relationship with economic activity
Total
Total Percentage Total Percentage Total Percentage
TOTAL 30,906.1 100.0 29,824.3 100.0 1,081.8 100.0Active persons 22,881.1 74.0 22,489.2 75.4 391.9 36.2- Employed persons 18,736.0 60.6 18,429.5 61.8 306.5 28.3- Unemployed persons 4,145.1 13.4 4,059.7 13.6 85.4 7.9Inactive persons 8,025.0 26.0 7,335.1 24.6 690.0 63.8Activity rate (16-64) - 74.0 - 75.4 - 36.2Unemployment rate (16-64) - 18.1 - 18.1 - 21.8Employment rate (16-64) - 60.6 - 61.8 - 28.3
2. Population aged 16 to 64 years old, by sex and relationship with economic activity
Total
Total Percentage Total Percentage Total Percentage
MEN 15,626.4 100.0 15,034.3 100.0 592.1 100.0Active persons 12,844.2 82.2 12,601.6 83.8 242.6 41.0- Employed persons 10,554.9 67.5 10,364.7 68.9 190.2 32.1- Unemployed persons 2,289.3 14.6 2,236.9 14.9 52.3 8.8Inactive persons 2,782.3 17.8 2,432.7 16.2 349.5 59.0Activity rate (16-64) - 82.2 - 83.8 - 41.0Unemployment rate (16-64) - 17.8 - 17.8 - 21.6Employment rate (16-64) - 67.5 - 68.9 - 32.1WOMEN 15,279.7 100.0 14,790.0 100.0 489.7 100.0Active persons 10,036.9 65.7 9,887.6 66.9 149.3 30.5- Employed persons 8,181.1 53.5 8,064.8 54.5 116.2 23.7- Unemployed persons 1,855.9 12.1 1,822.8 12.3 33.1 6.8Inactive persons 5,242.8 34.3 4,902.4 33.1 340.4 69.5Activity rate (16-64) - 65.7 - 66.9 - 30.5Unemployment rate (16-64) - 18.5 - 18.4 - 22.2Employment rate (16-64) - 53.5 - 54.5 - 23.7
Personswithout disabilities
Personswith disabilities(1)
Personswithout disabilities
Personswith disabilities(1)
(1) These are persons with certified disabilities, and who have a degree of disability greater than or equal to 33%, according to the assessment procedure established by RD 1971/1999, modified by RD 1856/2009
EPD Year 2009 - TABLES ANNEXE

Employment of Persons with DisabilitiesYear 2009Disability(1) and activity(Absolute values in thousands)
3. Population aged 16 to 64 years old, by age group and relationship with economic activity
Total
Total Percentage Total Percentage Total Percentage
POPULATION AGED 16 TO 24 YEARS O 4,488.8 100.0 4,428.7 100.0 60.1 100.0Active persons 2,229.9 49.7 2,208.4 49.9 21.5 35.8- Employed persons 1,386.6 30.9 1,374.9 31.0 11.7 19.5- Unemployed persons 843.3 18.8 833.5 18.8 9.8 16.3Inactive persons 2,258.9 50.3 2,220.3 50.1 38.6 64.2Activity rate (16-64) - 49.7 - 49.9 - 35.8Unemployment rate (16-64) - 37.8 - 37.7 - 45.5Employment rate (16-64) - 30.9 - 31.0 - 19.5POPULATION AGED 25 TO 44 YEARS O 15,116.6 100.0 14,754.6 100.0 362.1 100.0Active persons 13,130.2 86.9 12,952.1 87.8 178.1 49.2- Employed persons 10,799.1 71.4 10,664.9 72.3 134.1 37.0- Unemployed persons 2,331.1 15.4 2,287.1 15.5 44.0 12.1Inactive persons 1,986.4 13.1 1,802.5 12.2 184.0 50.8Activity rate (16-64) - 86.9 - 87.8 - 49.2Unemployment rate (16-64) - 17.8 - 17.7 - 24.7Employment rate (16-64) - 71.4 - 72.3 - 37.0POPULATION AGED 45 TO 64 YEARS O 11,300.7 100.0 10,641.0 100.0 659.7 100.0Active persons 7,521.0 66.6 7,328.7 68.9 192.3 29.1- Employed persons 6,550.2 58.0 6,389.6 60.0 160.6 24.3- Unemployed persons 970.7 8.6 939.1 8.8 31.7 4.8Inactive persons 3,779.8 33.4 3,312.4 31.1 467.4 70.9Activity rate (16-64) - 66.6 - 68.9 - 29.1Unemployment rate (16-64) - 12.9 - 12.8 - 16.5Employment rate (16-64) - 58.0 - 60.0 - 24.3
4. Population aged 16 to 64 years old with disabilities (1), according to whether and relationship with economic activity
Total Active persons
Inactive persons
PERSONS WITH DISABILITIES(1) (16-64) 1,081.8 391.9 690.0RECEIPT OF PENSIONS- Receive some pension 520.2 47.4 472.8- Receive no pension 561.7 344.5 217.2HOUSEHOLD INCOME - Reside in households with income 1,053.2 385.1 668.1- Reside in households without income 28.6 6.8 21.9
Personswithout disabilities
Personswith disabilities(1)
(1) These are persons with certified disabilities, and who have a degree of disability greater than or equal to 33%, according to the assessment procedure established by RD 1971/1999, modified by RD 1856/2009
EPD Year 2009 - TABLES ANNEXE

Employment of Persons with DisabilitiesYear 2009
Disability(1) and activity(Absolute values in thousands)
5. Population aged 16 to 64 years old, according to education and relationship with economic activity
Active persons Active persons Active persons
Total
Total Percentage Total Percentage Total Percentage
TOTAL 22,881.1 74.0 22,489.2 75.4 423,7 36.2- Illiterate persons 107.2 33.8 100.8 44.1 7,0 7.2- Primary education 3,348.7 57.9 3,263.3 60.4 84,8 22.2
12,096.5 73.6 11,886.3 74.4 231,1 45.5
7,328.7 87.6 7,238.8 88.1 100,8 61.4
6. Persons with disabilities(1) aged 16 to 64 years old, by Autonomous Community and relationship with economic activity
Total Active persons Inactive persons Activity Inactivity rate rate
TOTAL 1,081.8 391.9 36.2 690.0 63.8Andalucía 197.7 59.0 29.8 138.8 70.2Aragón 33.2 15.2 45.8 18.0 54.2Asturias, Principado de 38.7 9.4 24.3 29.2 75.5Balears, Illes 21.2 8.2 38.7 13.0 61.3Canarias 49.4 11.8 23.9 37.6 76.1Cantabria 15.5 5.7 36.8 9.8 63.2Castilla y León 58.1 20.6 35.5 37.5 64.5Castilla-La Mancha 50.2 18.9 37.6 31.4 62.5Cataluña 179.4 71.6 39.9 107.8 60.1Comunitat Valenciana 90.0 33.5 37.2 56.5 62.8Extremadura 32.1 10.9 34.0 21.2 66.0Galicia 76.1 25.7 33.8 50.3 66.1Madrid, Comunidad de 95.2 40.4 42.4 54.8 57.6Murcia, Región de 56.6 27.3 48.2 29.2 51.6Navarra, Comunidad Foral de 13.7 5.5 40.1 8.3 60.6País Vasco 59.0 21.7 36.8 37.3 63.2Rioja, La 7.6 3.3 43.4 4.3 56.6Ceuta and Melilla 8.2 3.3 40.2 4.9 59.8
- Secondary education and training programmes and labour insertion - Higher education, including doctorates
Personswithout disabilities
Personswith disabilities(1)
(1) These are persons with certified disabilities, and who have a degree of disability greater than or equal to 33%, according to the assessment procedure established by RD 1971/1999, modified by RD 1856/2009
EPD Year 2009 - TABLES ANNEXE

Employment of Persons with DisabilitiesEvolutionDisability(1) and activity(Absolute values in thousands)
3. Population aged 16 to 64 years old, by age group and relationship with economic activity
Total
2010 2009 2008 2010 2009 2008 2010 2009 2008Percentage Percentage Percentage Percentage Percentage Percentage Percentage Percentage Percentage
100 100 100 100 100 100 100 100 100
Active persons 47.4 49.7 52.8 47.6 49.9 53.1 35.1 35.8 34.2- Employed persons 27.7 30.9 39.8 27.9 31.0 40.1 16.9 19.5 19.6- Unemployed persons 19.7 18.8 13.0 19.7 18.8 13.0 18.1 16.3 14.6Inactive persons 52.6 50.3 47.2 52.4 50.1 46.9 64.9 64.2 65.8Activity rate (16-64) 47.4 49.7 52.8 47.6 49.9 53.1 35.1 35.8 34.2
41.5 37.8 24.6 41.4 37.7 24.4 51.7 45.5 42.8Employment rate (16-64) 27.7 30.9 39.8 27.9 31.0 40.1 16.9 19.5 19.6
100.0 100.0 100.0 100.0 100.0 100.0 100.0 100.0 100.0Active persons 87.6 86.9 86.1 88.6 87.8 87.0 50.1 49.2 42.5- Employed persons 70.1 71.4 76.8 71.0 72.3 77.7 37.4 37.0 35.0- Unemployed persons 17.5 15.4 9.3 17.6 15.5 9.3 12.8 12.1 7.6Inactive persons 12.4 13.1 13.9 11.4 12.2 13.0 49.9 50.8 57.5Activity rate (16-64) 87.6 86.9 86.1 88.6 87.8 87.0 50.1 49.2 42.5
20.0 17.8 10.8 19.9 17.7 10.7 25.5 24.7 17.8Employment rate (16-64) 70.1 71.4 76.8 71.0 72.3 77.7 37.4 37.0 35.0
100.0 100.0 100.0 100.0 100.0 100.0 100.0 100.0 100.0Active persons 67.5 66.6 65.3 70.1 68.9 67.1 28.9 29.1 27.9- Employed persons 57.5 58.0 60.1 59.7 60.0 61.8 23.6 24.3 24.7- Unemployed persons 10.1 8.6 5.2 10.4 8.8 5.3 5.2 4.8 3.1Inactive persons 32.5 33.4 34.7 29.9 31.1 32.9 71.1 70.9 72.1Activity rate (16-64) 67.5 66.6 65.3 70.1 68.9 67.1 28.9 29.1 27.9
14.9 12.9 8.0 14.8 12.8 8.0 18.2 16.5 11.3Employment rate (16-64) 57.5 58.0 60.1 59.7 60.0 61.8 23.6 24.3 24.7
4. Population aged 16 to 64 years old with disabilities(1), according to whether and relationship with economic activity
Total 2010 2009 2008 2010 2009 2008 2010 2009 2008Percentage Percentage Percentage Percentage Percentage Percentage Percentage Percentage Percentage
100 100 100 100 100 100 100 100 100RECEIPT OF PENSIONS- Receive some pension 48.5 48.1 51.0 12.1 12.1 14.4 69.2 68.5 69.4- Receive no pension 51.5 51.9 49.0 87.9 87.9 85.6 30.8 31.5 30.6HOUSEHOLD INCOME
97.4 97.4 97.6 98.3 98.3 98.7 96.9 96.8 97.1
2.6 2.6 2.4 1.7 1.7 1.3 3.1 3.2 2.9
Persons without disabilities
Personswith disabilities(1)
POPULATION AGED 16 TO 24 YEARS OLD
Unemployment rate (16-64)
POPULATION AGED 25 TO 44 YEARS OLD
Unemployment rate (16-64)
Unemployment rate (16-64)
POPULATION AGED 45 TO 64 YEARS OLD
PERSONS WITH DISABILITIES(1) (16-64)
Active persons Inactive persons
- Reside in households with income - Reside in households without income
(1) These are persons with certified disabilities, and who have a degree of disability greater than or equal to 33%, according to the assessment procedure established by RD 1971/1999, modified by RD 1856/2009
EPD Evolution - TABLES ANNEXE

Employment of Persons with DisabilitiesEvolutionDisability(1) and activity(Absolute values in thousands)
5. Population aged 16 to 64 years old, according to education and relationship with economic activity
Total
2010 2009 2008 2010 2009 2008 2010 2009 2008
Percentage Percentage Percentage Percentage Percentage Percentage Percentage Percentage PercentageTOTAL 74,4 74.0 73.7 75,9 75.4 74.9 36,2 36.2 33.5- Illiterate persons 34,9 33.8 32.3 47,8 44.1 41.1 7,0 7.2 7.0- Primary education 58,4 57.9 57.4 61,2 60.4 59.5 21,8 22.2 22.4
73,6 73.6 73.6 74,5 74.4 74.3 44,9 45.5 44.1
87,5 87.6 87.4 88,1 88.1 87.8 59,7 61.4 56.1
6. Persons with disabilities(1) aged 16 to 64 years old, by Autonomous Community and relationship with economic activity
Activity rate Inactive rate2010 2009 2008 2010 2009 2008
TOTAL 36.2 36.2 33.5 63.8 63.8 66.5Andalucía 31.5 29.8 29.6 68.5 70.2 70.4Aragón 34.8 45.8 34.3 65.2 54.2 65.7Asturias, Principado de 31.9 24.3 26.8 67.9 75.5 73.2Balears, Illes 38.0 38.7 35.5 62.4 61.3 64.5Canarias 27.4 23.9 20.2 72.4 76.1 79.8Cantabria 34.5 36.8 41.8 64.9 63.2 58.2Castilla y León 32.8 35.5 34.2 67.2 64.5 65.8Castilla-La Mancha 40.1 37.6 32.1 59.9 62.5 67.9Cataluña 39.3 39.9 33.2 60.7 60.1 66.8Comunitat Valenciana 37.3 37.2 37.0 62.7 62.8 63.0Extremadura 32.6 34.0 31.0 67.4 66.0 69.0Galicia 32.3 33.8 31.1 67.7 66.1 68.9Madrid, Comunidad de 40.9 42.4 36.8 59.1 57.6 63.2Murcia, Región de 48.9 48.2 40.9 51.1 51.6 59.1Navarra, Comunidad Foral 36.4 40.1 41.1 63.6 60.6 58.9País Vasco 36.0 36.8 36.1 64.0 63.2 63.9Rioja, La 40.7 43.4 44.1 59.3 56.6 55.9Ceuta and Melilla 40.7 40.2 43.4 59.3 59.8 56.6
yand training programmes and labour insertion - Higher education, including doctorates
Persons without disabilities
Personswith disabilities(1)
(1) These are persons with certified disabilities, and who have a degree of disability greater than or equal to 33%, according to the assessment procedure established by RD 1971/1999, modified by RD 1856/2009
EPD Evolution - TABLES ANNEXE

Employment of Persons with DisabilitiesEvolution
Disability(1) and occupation (Absolute values in thousands)1. *Population aged 16 to 64 years old, by characteristics of their occupation and disability (1)
Total
2010 2009 2008 2010 2009 2008 2010 2009 2008Percentage Percentage Percentage Percentage Percentage Percentage Percentage Percentage Percentage
TOTALEmployed persons 100 100 100 100 100 100 100 100 100PROFESSIONAL SITUATION - Wage earners 83.5 83.4 82.7 83.4 83.3 82.7 89.3 88.9 86.8- Self-employed workers 16.5 16.6 17,2 16.6 16.7 17,3 10.6 11.0 13,0
- With permanent contracts 75.0 74.5 70.6 74.9 74.5 70.6 78.9 77.8 75.3- With temporary contracts 25.0 25.5 29.4 25.1 25.5 29.4 21.1 22.2 24.7
- Full-time 86.8 87.3 88.1 86.8 87.4 88.2 86.6 86.5 86.2- Part-time (and reasons) 13.2 12.7 11.9 13.2 12.6 11.8 13.4 13.5 13.8 - Due to illness or incapacity 0.2 0.2 0.2 0.1 0.1 0.2 1.8 3.1 3.3 - For other reasons 13.0 12.5 11.7 13.0 12.5 11.7 11.6 10.3 10.5ACTIVITY SECTOR- Agriculture 4.3 4.1 4.0 4.3 4.1 4.0 2.8 2.6 2.9- Industry 14.2 14.7 15.8 14.2 14.7 15.8 14.0 14.9 16.5- Construction 9.0 10.0 12.1 9.1 10.1 12.2 4.7 4.9 6.1- Services 72.6 71.1 68.1 72.5 71.0 68.0 78.5 77.6 74.5EDUCATIONAL LEVEL - Illiterate 0.3 0.3 0.4 0.3 0.3 0.3 1.3 1.6 2.2- Primary 12.3 13.2 14.2 12.2 13.0 14.1 18.9 21.3 24.0
50.7 51.2 52.0 50.7 51.2 52.0 52.8 51.3 52.8- Higher education, including doctorat 36.7 35.3 33.4 36.9 35.5 33.6 27.0 25.8 21.0DURATION OF THE CONTRACT - Less than 6 months 10.0 9.9 12.0 10.0 9.9 12.0 8.0 9.1 8.9- From 6 months to 1 year 5.6 6.1 7.9 5.6 6.1 7.9 5.6 4.6 6.0- From 1 to 3 years 15.8 18.3 18.7 15.8 18.3 18.7 13.4 14.7 15.7- More than 3 years 68.7 65.7 61.4 68.6 65.6 61.3 72.9 71.5 69.5HAVING MORE THAN ONE JOB - Has one or more other jobs 2.2 2.3 2.5 2.2 2.3 2.6 1.6 1.8 2.0- Does not have another job 97.8 97.7 97.5 97.8 97.7 97.4 98.4 98.2 98.0
- Secondary and labour training and insertion programmes
WAGE EARNERS BY TYPE OF CONTRACT
TYPE OF WORKING DAY AND REASONS FOR WORKING PART-TIME
Persons without disabilities
Personswith disabilities(1)
(1) These are persons with certified disabilities, and who have a degree of disability greater than or equal to 33%, according to the assessment procedure established by RD 1971/1999, modified by RD 1856/2009
EPD Year 2010 - TABLES ANNEXE

Employment of Persons with DisabilitiesEvolution
Type and degree of disability(1)
1. Population aged 16 to 64 years old, according to disability (1)
and relationship with economic activity Activity rate Employment rate2010 2009 2008 2010 2009 2008
TOTAL 36.2 36.2 33.5 27.7 28.3 28.0TYPE OF DISABILITYOsteoarticular system 45.8 43.2 39.9 36.6 35.3 35.0Neuromuscular system 30.6 32.3 34.4 23.9 25.6 29.3Intellectual 27.5 28.0 26.9 18.2 19.3 20.1Mental disorder 24.9 26.3 19.9 16.3 16.0 14.5Visual system 45.0 42.4 45.3 37.8 36.7 40.8Auditory system 58.2 55.8 56.9 47.5 47.8 47.3Cardiovascular, immunological and respiratory systems 31.0 35.9 31.5 24.8 29.2 26.2Digestive, metabolic and endocrine systems 45.4 44.6 36.8 32.4 35.2 32.5Other 32.8 32.6 33.3 26.3 27.0 29.9DEGREE OF DISABILITY 33% to 44% 55.4 54.9 56.6 44.0 44.2 50.245% to 64% 38.2 38.4 39.4 27.7 28.3 31.765% to 74% 19.6 19.7 19.3 13.2 14.4 14.475% and over 14.2 16.3 17.8 12.3 13.8 15.3
(1) These are persons with certified disabilities, and who have a degree of disability greater than or equal to 33%, according to the assessment procedure established by RD 1971/1999, modified by RD 1856/2009
EPD Year 2010 - TABLES ANNEXE

Employment of Persons with DisabilitiesYear 2010
Disability(1) and occupation (Absolute values in thousands)1. *Population aged 16 to 64 years old, by characteristics of their occupation and disability(1)
Total
Total Percentage Total Percentage Total Percentage
TOTALEmployed persons 18,304.1 100.0 17,979.3 100.0 324.8 100.0PROFESSIONAL SITUATION - Wage earners 15,280.0 83.5 14,989.8 83.4 290.2 89.3- Self-employed workers 3,016.0 16.5 2,981.5 16.6 34.5 10.6WAGE EARNERS BY TYPE OF CONTRACT- With permanent contracts 11,463.3 75.0 11,234.3 74.9 229.0 78.9- With temporary contracts 3,816.7 25.0 3,755.5 25.1 61.2 21.1TYPE OF WORKING DAY AND REASONS FOR WORKING PART-TIME - Full-time 15,891.6 86.8 15,610.5 86.8 281.2 86.6- Part-time (and reasons) 2,412.4 13.2 2,368.8 13.2 43.6 13.4 - Due to illness or incapacity 30.3 0.2 24.5 0.1 5.9 1.8 - For other reasons 2,382.1 13.0 2,344.4 13.0 37.7 11.6ACTIVITY SECTOR- Agriculture 778.1 4.3 769.2 4.3 9.0 2.8- Industry 2,601.4 14.2 2,555.8 14.2 45.6 14.0- Construction 1,642.6 9.0 1,627.5 9.1 15.1 4.7- Services 13,281.9 72.6 13,026.9 72.5 255.1 78.5EDUCATIONAL LEVEL - Illiterate 59.8 0.3 55.5 0.3 4.4 1.3- Primary 2,247.5 12.3 2,186.1 12.2 61.4 18.9
9,282.6 50.7 9,111.2 50.7 171.5 52.8- Higher education, including doctorates 6,714.1 36.7 6,626.5 36.9 87.6 27.0DURATION OF THE CONTRACT - Less than 6 months 1,821.5 10.0 1,795.5 10.0 26.0 8.0- From 6 months to 1 year 1,016.7 5.6 998.4 5.6 18.2 5.6- From 1 to 3 years 2,893.3 15.8 2,849.7 15.8 43.6 13.4- More than 3 years 12,572.6 68.7 12,335.7 68.6 236.9 72.9HAVING MORE THAN ONE JOB - Has one or more other jobs 398.9 2.2 393.7 2.2 5.2 1.6- Does not have another job 17,905.1 97.8 17,585.5 97.8 319.6 98.4
- Secondary and labour training and insertion programmes
Personswithout disabilities
Personswith disabilities(1)
(1) These are persons with certified disabilities, and who have a degree of disability greater than or equal to 33%, according to the assessment procedure established by RD 1971/1999, modified by RD 1856/2009
EPD Year 2010 - TABLES ANNEXE
Employment of Persons with DisabilitiesYear 2009
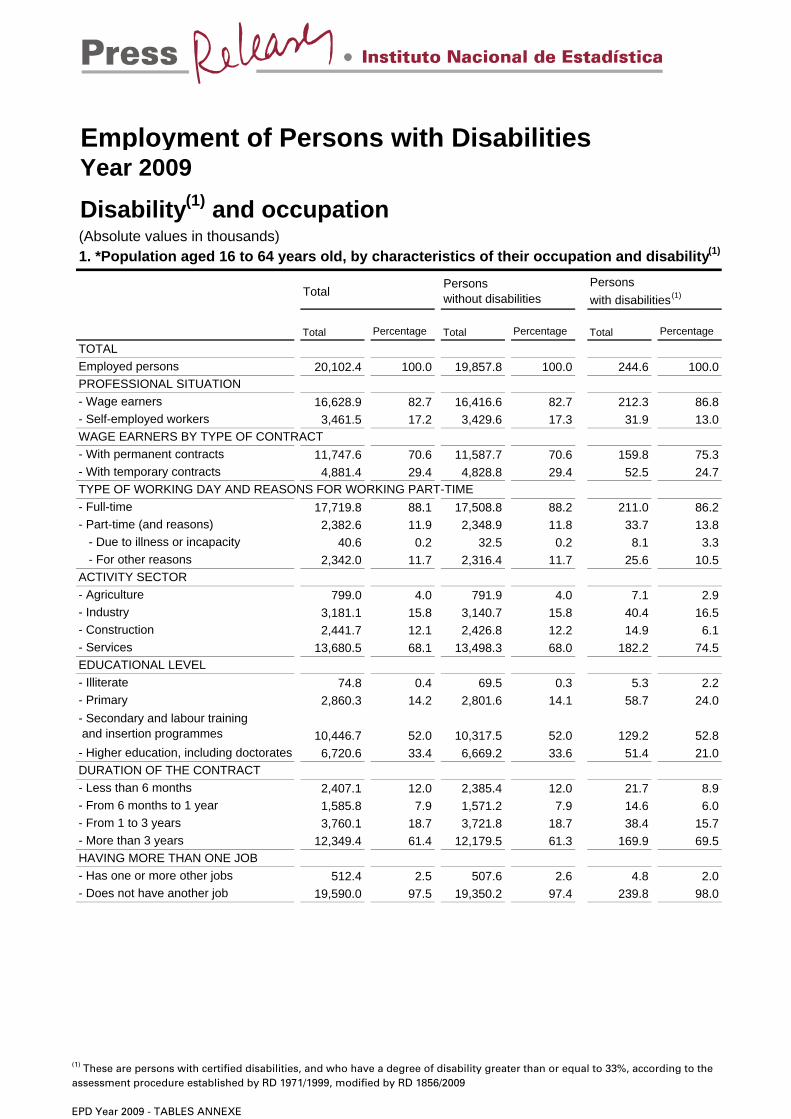
Disability(1) and occupation (Absolute values in thousands)1. *Population aged 16 to 64 years old, by characteristics of their occupation and disability(1)
Total
Total Percentage Total Percentage Total Percentage
TOTALEmployed persons 20,102.4 100.0 19,857.8 100.0 244.6 100.0PROFESSIONAL SITUATION - Wage earners 16,628.9 82.7 16,416.6 82.7 212.3 86.8- Self-employed workers 3,461.5 17.2 3,429.6 17.3 31.9 13.0WAGE EARNERS BY TYPE OF CONTRACT- With permanent contracts 11,747.6 70.6 11,587.7 70.6 159.8 75.3- With temporary contracts 4,881.4 29.4 4,828.8 29.4 52.5 24.7TYPE OF WORKING DAY AND REASONS FOR WORKING PART-TIME - Full-time 17,719.8 88.1 17,508.8 88.2 211.0 86.2- Part-time (and reasons) 2,382.6 11.9 2,348.9 11.8 33.7 13.8 - Due to illness or incapacity 40.6 0.2 32.5 0.2 8.1 3.3 - For other reasons 2,342.0 11.7 2,316.4 11.7 25.6 10.5ACTIVITY SECTOR- Agriculture 799.0 4.0 791.9 4.0 7.1 2.9- Industry 3,181.1 15.8 3,140.7 15.8 40.4 16.5- Construction 2,441.7 12.1 2,426.8 12.2 14.9 6.1- Services 13,680.5 68.1 13,498.3 68.0 182.2 74.5EDUCATIONAL LEVEL - Illiterate 74.8 0.4 69.5 0.3 5.3 2.2- Primary 2,860.3 14.2 2,801.6 14.1 58.7 24.0
10,446.7 52.0 10,317.5 52.0 129.2 52.8- Higher education, including doctorates 6,720.6 33.4 6,669.2 33.6 51.4 21.0DURATION OF THE CONTRACT - Less than 6 months 2,407.1 12.0 2,385.4 12.0 21.7 8.9- From 6 months to 1 year 1,585.8 7.9 1,571.2 7.9 14.6 6.0- From 1 to 3 years 3,760.1 18.7 3,721.8 18.7 38.4 15.7- More than 3 years 12,349.4 61.4 12,179.5 61.3 169.9 69.5HAVING MORE THAN ONE JOB - Has one or more other jobs 512.4 2.5 507.6 2.6 4.8 2.0- Does not have another job 19,590.0 97.5 19,350.2 97.4 239.8 98.0
- Secondary and labour training and insertion programmes
Personswithout disabilities
Personswith disabilities(1)
(1) These are persons with certified disabilities, and who have a degree of disability greater than or equal to 33%, according to the assessment procedure established by RD 1971/1999, modified by RD 1856/2009
EPD Year 2009 - TABLES ANNEXE

Employment of Persons with DisabilitiesEvolution
Disability(1) and occupation (Absolute values in thousands)1. *Population aged 16 to 64 years old, by characteristics of their occupation and disability (1)
Total
2010 2009 2008 2010 2009 2008 2010 2009 2008Percentage Percentage Percentage Percentage Percentage Percentage Percentage Percentage Percentage
TOTALEmployed persons 100 100 100 100 100 100 100 100 100PROFESSIONAL SITUATION - Wage earners 83.5 83.4 82.7 83.4 83.3 82.7 89.3 88.9 86.8- Self-employed workers 16.5 16.6 17,2 16.6 16.7 17,3 10.6 11.0 13,0
- With permanent contracts 75.0 74.5 70.6 74.9 74.5 70.6 78.9 77.8 75.3- With temporary contracts 25.0 25.5 29.4 25.1 25.5 29.4 21.1 22.2 24.7
- Full-time 86.8 87.3 88.1 86.8 87.4 88.2 86.6 86.5 86.2- Part-time (and reasons) 13.2 12.7 11.9 13.2 12.6 11.8 13.4 13.5 13.8 - Due to illness or incapacity 0.2 0.2 0.2 0.1 0.1 0.2 1.8 3.1 3.3 - For other reasons 13.0 12.5 11.7 13.0 12.5 11.7 11.6 10.3 10.5ACTIVITY SECTOR- Agriculture 4.3 4.1 4.0 4.3 4.1 4.0 2.8 2.6 2.9- Industry 14.2 14.7 15.8 14.2 14.7 15.8 14.0 14.9 16.5- Construction 9.0 10.0 12.1 9.1 10.1 12.2 4.7 4.9 6.1- Services 72.6 71.1 68.1 72.5 71.0 68.0 78.5 77.6 74.5EDUCATIONAL LEVEL - Illiterate 0.3 0.3 0.4 0.3 0.3 0.3 1.3 1.6 2.2- Primary 12.3 13.2 14.2 12.2 13.0 14.1 18.9 21.3 24.0
50.7 51.2 52.0 50.7 51.2 52.0 52.8 51.3 52.8- Higher education, including doctorat 36.7 35.3 33.4 36.9 35.5 33.6 27.0 25.8 21.0DURATION OF THE CONTRACT - Less than 6 months 10.0 9.9 12.0 10.0 9.9 12.0 8.0 9.1 8.9- From 6 months to 1 year 5.6 6.1 7.9 5.6 6.1 7.9 5.6 4.6 6.0- From 1 to 3 years 15.8 18.3 18.7 15.8 18.3 18.7 13.4 14.7 15.7- More than 3 years 68.7 65.7 61.4 68.6 65.6 61.3 72.9 71.5 69.5HAVING MORE THAN ONE JOB - Has one or more other jobs 2.2 2.3 2.5 2.2 2.3 2.6 1.6 1.8 2.0- Does not have another job 97.8 97.7 97.5 97.8 97.7 97.4 98.4 98.2 98.0
Persons without disabilities
Personswith disabilities(1)
- Secondary and labour training and insertion programmes
WAGE EARNERS BY TYPE OF CONTRACT
TYPE OF WORKING DAY AND REASONS FOR WORKING PART-TIME
(1) These are persons with certified disabilities, and who have a degree of disability greater than or equal to 33%, according to the assessment procedure established by RD 1971/1999, modified by RD 1856/2009
EPD Year 2010 - TABLES ANNEXE

Employment of Persons with DisabilitiesYear 2010
Type and degree of disability(1)
1. Population aged 16 to 64 years old, according to disability (1)
and relationship with economic activity Activity Employmen
tTotal rate rate TOTAL 100.0 36.2 27.7TYPE OF DISABILITYOsteoarticular system 100.0 45.8 36.6Neuromuscular system 100.0 30.6 23.9Intellectual 100.0 27.5 18.2Mental disorder 100.0 24.9 16.3Visual system 100.0 45.0 37.8Auditory system 100.0 58.2 47.5Cardiovascular, immunological and respiratory systems 100.0 31.0 24.8Digestive, metabolic and endocrine systems 100.0 45.4 32.4Other 100.0 32.8 26.3DEGREE OF DISABILITY 33% to 44% 100.0 55.4 44.045% to 64% 100.0 38.2 27.765% to 74% 100.0 19.6 13.275% and over 100.0 14.2 12.3
(1) These are persons with certified disabilities, and who have a degree of disability greater than or equal to 33%, according to the assessment procedure established by RD 1971/1999, modified by RD 1856/2009
EPD Year 2010 - TABLES ANNEXE

Employment of Persons with DisabilitiesYear 2009
Type and degree of disability(1)
1. Population aged 16 to 64 years old, according to disability (1)
and relationship with economic activity Activity Employmen
tTotal rate rate TOTAL 100.0 33.5 28.0TYPE OF DISABILITYOsteoarticular system 100.0 39.9 35.0Neuromuscular system 100.0 34.4 29.3Intellectual 100.0 26.9 20.1Mental disorder 100.0 19.9 14.5Visual system 100.0 45.3 40.8Auditory system 100.0 56.9 47.3Cardiovascular, immunological and respiratory systems 100.0 31.5 26.2Digestive, metabolic and endocrine systems 100.0 36.8 32.5Other 100.0 33.3 29.9DEGREE OF DISABILITY 33% to 44% 100.0 56.6 50.245% to 64% 100.0 39.4 31.765% to 74% 100.0 19.3 14.475% and over 100.0 17.8 15.3
(1) These are persons with certified disabilities, and who have a degree of disability greater than or equal to 33%, according to the assessment procedure established by RD 1971/1999, modified by RD 1856/2009
EPD Year 2009 - TABLES ANNEXE

Employment of Persons with DisabilitiesEvolution
Type and degree of disability(1)
1. Population aged 16 to 64 years old, according to disability (1)
and relationship with economic activity Activity rate Employment rate2010 2009 2008 2010 2009 2008
TOTAL 36.2 36.2 33.5 27.7 28.3 28.0TYPE OF DISABILITYOsteoarticular system 45.8 43.2 39.9 36.6 35.3 35.0Neuromuscular system 30.6 32.3 34.4 23.9 25.6 29.3Intellectual 27.5 28.0 26.9 18.2 19.3 20.1Mental disorder 24.9 26.3 19.9 16.3 16.0 14.5Visual system 45.0 42.4 45.3 37.8 36.7 40.8Auditory system 58.2 55.8 56.9 47.5 47.8 47.3Cardiovascular, immunological and respiratory systems 31.0 35.9 31.5 24.8 29.2 26.2Digestive, metabolic and endocrine systems 45.4 44.6 36.8 32.4 35.2 32.5Other 32.8 32.6 33.3 26.3 27.0 29.9DEGREE OF DISABILITY 33% to 44% 55.4 54.9 56.6 44.0 44.2 50.245% to 64% 38.2 38.4 39.4 27.7 28.3 31.765% to 74% 19.6 19.7 19.3 13.2 14.4 14.475% and over 14.2 16.3 17.8 12.3 13.8 15.3
(1) These are persons with certified disabilities, and who have a degree of disability greater than or equal to 33%, according to the assessment procedure established by RD 1971/1999, modified by RD 1856/2009
EPD Year 2010 - TABLES ANNEXE