employment patterns of somali immigrants - maine.gov · profoundly impact our labor ... individuals...
TRANSCRIPT

Center for Workforce Research and Information
A Publication of:Center for Workforce
Research and InformationMaine Department of Labor
Maine State Planning Office
Amanda K. RectorEconomist, Maine State Planning Office
Employment Patterns of Somali Immigrants
An Analysis of the
to Lewiston from 2001 through 2006
Executive Summary
In 2001, large numbers of Somali immigrants began moving to the Lewiston/Auburn area. While some came directly
to Lewiston from Somalia, many others came from large cities in the United States. They came to Maine for the same
reasons that many people move here: the quality of life and strong family values that make the state a good place to
raise a family. The Lewiston/Auburn community has experienced some growing pains while taking in this new popu-
lation. Employment has been one of the key issues.
The Maine Department of Labor (MDOL) made arrangements with the City of Lewiston General Assistance (GA)
program to analyze the employment outcomes of the immigrants who received general assistance. This is an initial
descriptive analysis that does not purport to answer all of the questions pertaining to the employment of this popula-
tion but will outline areas for further study and recommend some first steps.
A total of 1,963 immigrants from Somalia registered for General Assistance in Lewiston through the end of 2006,
with most arriving after 2001. Most of the immigrants appear to be members of young families.
Of the 1,118 working-age Somali immigrants, 552 had employment at some point during their time in Maine.
This is an overall employment rate of 49 percent.
On average, it took two years for Somali immigrants to find employment after their arrival in Maine. Following
their first occurrence of employment, immigrants were employed approximately 78 percent of the time.
When immigrants receive employment counseling, one of the suggestions often given is to work for one
employer for at least a year before changing jobs. Consistent, stable employment is said to lead to higher earn-
ings. On average, immigrants with consistent employment earned annual wages that were approximately $2,240
higher and immigrants with stable employment earned nearly $5,700 more each year.
A quarter-by-quarter examination of employment rates shows that overall, employment increased from the
beginning of 2001 through mid-2002 and then declined from mid-2003 through the end of 2006. In addition,
there is a very strong seasonal trend, with higher employment in the summer and lower employment in the
winter.
Very little was known about the educational attainment, language skills, and literacy of the immigrants. The lack
of this data presents a challenge for developing training and employment strategies. Knowledge of the written
and spoken English-language capabilities as well as the native-language literacy of an individual is important
when determining whether and what type of training are necessary. Similarly, knowledge of an individual’s level
of formal education can help determine what type of training and employment strategies to use.
Only six percent of the Somali immigrants received training and services from the CareerCenters. While the
exact reasons are unknown, it is likely that language and cultural barriers contributed to the low participation
rate.

An Analysis of the Employment Patterns of Somali Immigrants
to Lewiston from 2001 through 2006
A Publication of:
Center for Workforce Research and InformationMaine Department of Labor
and
Maine State Planning Office
Amanda K. RectorEconomist, Maine State Planning Office
Issued April 2008 Augusta, Maine
Preface
The Maine economy is undergoing constant change. The forces of foreign competition, technology innovation and busi-
ness restructuring contribute to dynamic work environments and changing labor markets. Some industries are declining
and shedding jobs while new industries are emerging and creating new employment opportunities. The impacts of these
shifts have challenged individuals, families and entire communities. Across the spectrum of Maine workplaces, more is
being demanded of workers in terms of knowledge, skills, and abilities required for job performance. Increasingly,
Maine’s competitiveness is determined by the quality and availability of human capital.
Maine’s demographics are also in flux. An aging population and the impending retirements of baby boomers will
profoundly impact our labor markets and reshape long standing patterns of demand for goods and services.
Understanding these dynamics is fundamental to making effective public policies and developing sound public and
private investment strategies. Business, education and training systems and workers must consult economic, demo-
graphic and labor market information in making critical choices with limited resources. These choices will have enormous
implications for Maine’s prospects in the years ahead. The Maine Department of Labor, Center for Workforce Research
and Information, is committed to examining the dynamics of Maine’s economy and the associated impacts on the work-
force and labor markets in helping to chart a more prosperous future for all Maine citizens.
John Dorrer, DirectorCenter for Workforce Research and InformationMaine Department of Labor

Contents
Page
Introduction and Project Overview ...................................................................................................................................................... 1
Economic Context and Cultural Background ................................................................................................................................... 1
Methodology ................................................................................................................................................................................................ 2
Characteristics of the Study Population ............................................................................................................................................. 3
Employment Patterns ................................................................................................................................................................................ 6
Average Wages and Patterns of Employment Attachment ....................................................................................................... 11
Training and Services Received from CareerCenters ................................................................................................................. 14
Summary and Recommendations ..................................................................................................................................................... 16
References ................................................................................................................................................................................................. 18

An Analysis of the Employment Patterns of Somali Immigrants to Lewiston from 2001 through 20061
Introduction and Project Overview
In 2001, large numbers of Somali immigrants began moving to the Lewiston/Auburn area. While some came directly
to Lewiston from Somalia, many others came from large cities in the U.S. They came to Maine for the same reasons
that many people move here: the quality of life and strong family values that make the state a good place to raise a
family. However, these Somali immigrants have experienced intense scrutiny, because they come from a culture that
is unfamiliar to most Maine natives and their language, race, and style of dress make them a highly visible minority
population.
The Lewiston/Auburn community has experienced some growing pains while taking in this new population.
Employment has been one of the key issues. Many claims have been made about the unemployment rate of the
Somali immigrants, but, to date, no analysis has been completed. The Maine Department of Labor (MDOL) made
arrangements with the City of Lewiston General Assistance (GA) Program to analyze the employment outcomes of
the immigrants who received general assistance. In addition, the recently completed report, Employment and Earnings
Outcomes for Recently Arrived Refugees in Portland, Maine,i was used as a reference.
The goal of this analysis is to clarify an understanding of the employment patterns of the Somali immigrants. This is
an initial descriptive analysis that does not purport to answer all of the questions pertaining to their employment but
will outline areas for further study and recommend some first steps.
Economic Context and Cultural Background
Maine’s demographics are changing as its population ages. The baby boomers, those born between 1946 and 1964,
are beginning to retire and create a large gap in the labor force. Since the generations following the baby boomers
are smaller and cannot fill the gap, growth in the labor force must come from other sources. One of the most likely
sources is immigrants to the state.
The large number of Somali immigrants in Lewiston provides an excellent opportunity to analyze the employment
challenges and outcomes of a population that will likely be a future source of labor. These immigrants face some
barriers to entering the workforce. First and foremost, there is a significant language barrier. Most Somali immigrants
do not speak English, and the jobs open to non-English speakers are limited. Additionally, there are cultural barriers.
Most Somali immigrants have religious prohibitions that limit their employment in certain occupations, many of
which are entry-level. And, for immigrants with professional degrees, the process of becoming certified in the U.S. can
be daunting.
It is in the state’s best interest to make the transition for these immigrants as smooth as possible. These immigrants,
particularly those who are young and have years of productive employment ahead of them, will be able to help fill the
gap in the labor force.

An Analysis of the Employment Patterns of Somali Immigrants to Lewiston from 2001 through 20062
Methodology
The methodology for this report is very similar to that for several previous reports issued by the former Division of
Labor Market Information Services, now the Center for Workforce Research and Information (CWRI). MDOL wage
records are combined with various other administrative records to provide a rich source of information for analysis.
For this report, MDOL wage records were combined with administrative records from the Lewiston GA program and
administrative data from the Bureau of Employment Services’ CareerCenters. In order to combine these data, indi-
viduals from the GA program were matched separately to both the MDOL wage records and the CareerCenters’
records for Workforce Investment Act services.
MDOL wage records provide one of the most effective means for tracking employment and earnings of most workers
in Maine. The records include earnings reported (in accordance with Maine Employment Security Lawii) by employers
for each quarter of the year. They also indicate employment tenure and industry affiliation. Monitoring of wage
records over time permits the analysis of employment and earnings dynamics. Increasingly, more use is being made
of these records, especially when they are combined with other administrative data that provide additional character-
istics of individual wage earners.
There are some limitations to the data used in the analysis. The wage records are limited to Maine Covered Employ-
ment, and, therefore, exclude those who were working out of state, in the federal government or military, or self-
employed. The wages have not been adjusted for inflation. The data from the GA program were carried over from a
previous database in late 2002; intake dates prior to this time are missing. Some information, particularly relating to
educational attainment, simply is not known or collected for each individual. However, the combination of these data
sources still can greatly benefit the understanding of these populations.
Since this analysis focuses primarily on Somali immigrants, it was necessary to undertake a multi-step process to
identify these individuals in the GA records. Individuals with a status of “immigrant” or “refugee,” along with those
whose country of origin was not the U.S., were identified as immigrants. Their family members also were identified as
immigrants. The immigrants were then grouped into those with Somalia as their country of origin and those with
other countries as their country of origin. Family members of Somali immigrants also were grouped with Somali
immigrants.
An Analysis of the Employment Patterns of Somali Immigrants to Lewiston from 2001 through 20063
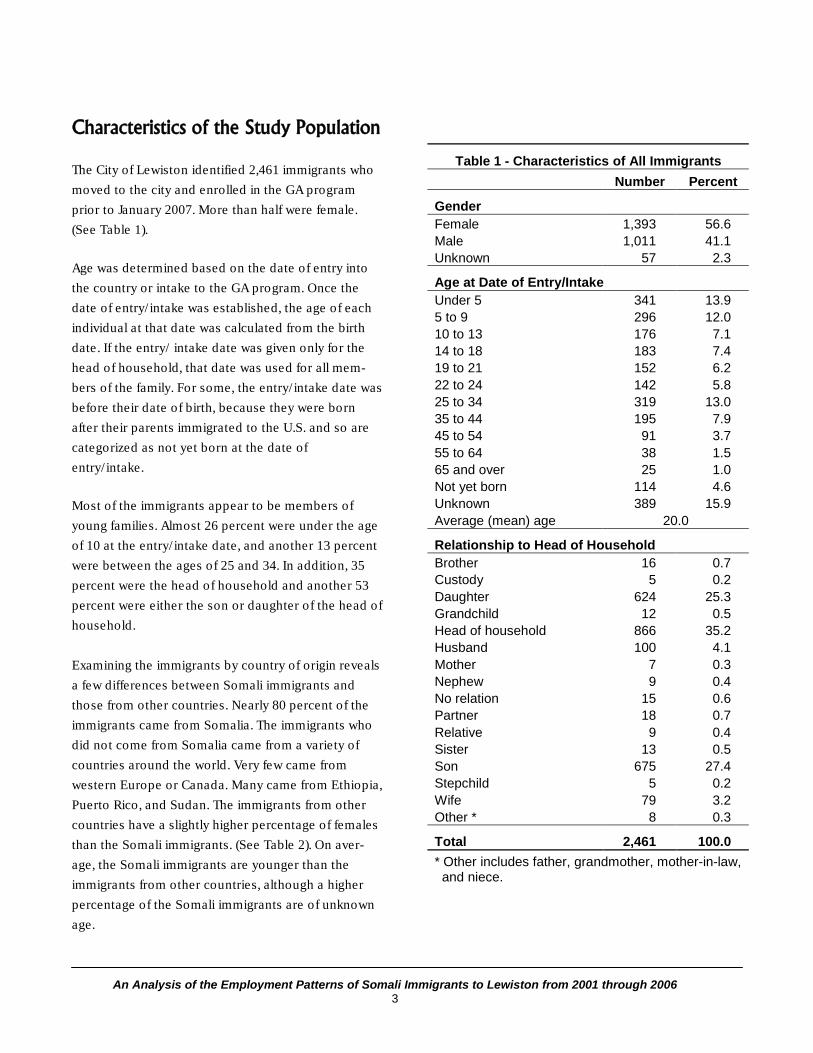
Characteristics of the Study Population
The City of Lewiston identified 2,461 immigrants who
moved to the city and enrolled in the GA program
prior to January 2007. More than half were female.
(See Table 1).
Age was determined based on the date of entry into
the country or intake to the GA program. Once the
date of entry/intake was established, the age of each
individual at that date was calculated from the birth
date. If the entry/ intake date was given only for the
head of household, that date was used for all mem-
bers of the family. For some, the entry/intake date was
before their date of birth, because they were born
after their parents immigrated to the U.S. and so are
categorized as not yet born at the date of
entry/intake.
Most of the immigrants appear to be members of
young families. Almost 26 percent were under the age
of 10 at the entry/intake date, and another 13 percent
were between the ages of 25 and 34. In addition, 35
percent were the head of household and another 53
percent were either the son or daughter of the head of
household.
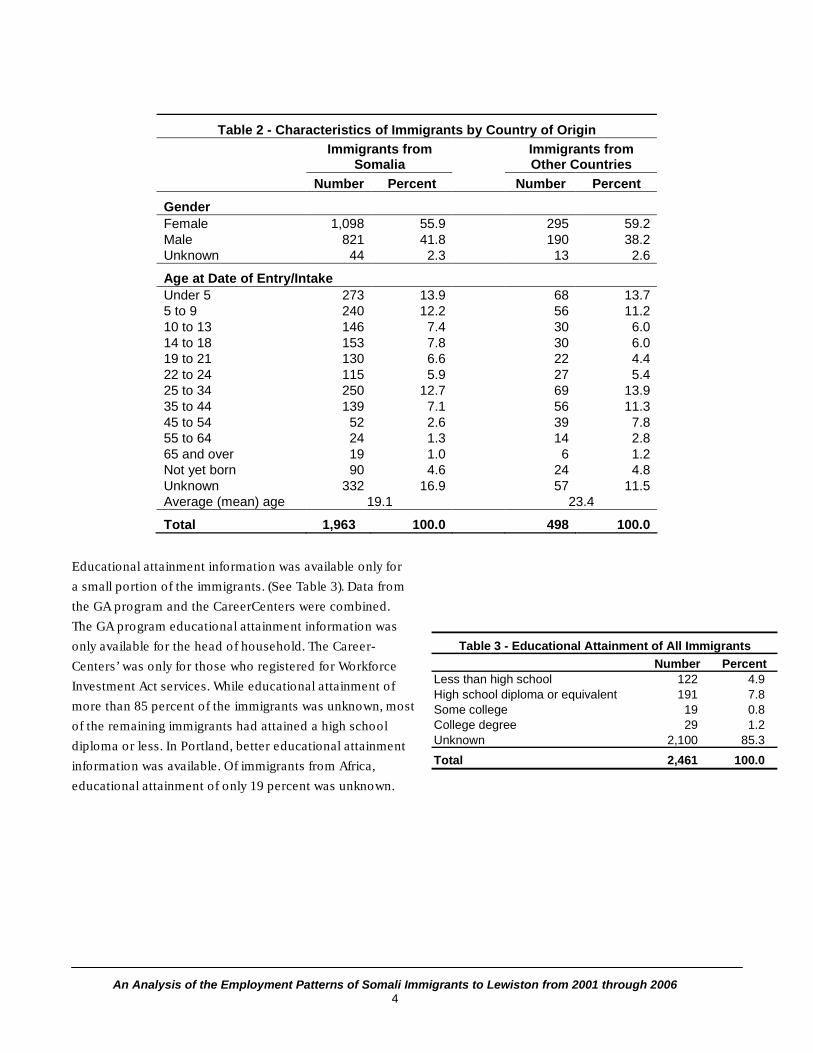
Examining the immigrants by country of origin reveals
a few differences between Somali immigrants and
those from other countries. Nearly 80 percent of the
immigrants came from Somalia. The immigrants who
did not come from Somalia came from a variety of
countries around the world. Very few came from
western Europe or Canada. Many came from Ethiopia,
Puerto Rico, and Sudan. The immigrants from other
countries have a slightly higher percentage of females
than the Somali immigrants. (See Table 2). On aver-
age, the Somali immigrants are younger than the
immigrants from other countries, although a higher
percentage of the Somali immigrants are of unknown
age.
Table 1 - Characteristics of All Immigrants
Number Percent
Gender
Female 1,393 56.6
Male 1,011 41.1
Unknown 57 2.3
Age at Date of Entry/Intake
Under 5 341 13.9
5 to 9 296 12.0
10 to 13 176 7.1
14 to 18 183 7.4
19 to 21 152 6.2
22 to 24 142 5.8
25 to 34 319 13.0
35 to 44 195 7.9
45 to 54 91 3.7
55 to 64 38 1.5
65 and over 25 1.0
Not yet born 114 4.6
Unknown 389 15.9
Average (mean) age 20.0
Relationship to Head of Household
Brother 16 0.7
Custody 5 0.2
Daughter 624 25.3
Grandchild 12 0.5
Head of household 866 35.2
Husband 100 4.1
Mother 7 0.3
Nephew 9 0.4
No relation 15 0.6
Partner 18 0.7
Relative 9 0.4
Sister 13 0.5
Son 675 27.4
Stepchild 5 0.2
Wife 79 3.2
Other * 8 0.3
Total 2,461 100.0
* Other includes father, grandmother, mother-in-law,and niece.
An Analysis of the Employment Patterns of Somali Immigrants to Lewiston from 2001 through 20064
Table 2 - Characteristics of Immigrants by Country of Origin
Immigrants fromSomalia
Immigrants fromOther Countries
Number Percent Number Percent
Gender
Female 1,098 55.9 295 59.2Male 821 41.8 190 38.2Unknown 44 2.3 13 2.6
Age at Date of Entry/Intake
Under 5 273 13.9 68 13.75 to 9 240 12.2 56 11.210 to 13 146 7.4 30 6.014 to 18 153 7.8 30 6.019 to 21 130 6.6 22 4.422 to 24 115 5.9 27 5.425 to 34 250 12.7 69 13.935 to 44 139 7.1 56 11.345 to 54 52 2.6 39 7.855 to 64 24 1.3 14 2.865 and over 19 1.0 6 1.2Not yet born 90 4.6 24 4.8Unknown 332 16.9 57 11.5Average (mean) age 19.1 23.4
Total 1,963 100.0 498 100.0
Educational attainment information was available only for
a small portion of the immigrants. (See Table 3). Data from
the GA program and the CareerCenters were combined.
The GA program educational attainment information was
only available for the head of household. The Career-
Centers’ was only for those who registered for Workforce
Investment Act services. While educational attainment of
more than 85 percent of the immigrants was unknown, most
of the remaining immigrants had attained a high school
diploma or less. In Portland, better educational attainment
information was available. Of immigrants from Africa,
educational attainment of only 19 percent was unknown.
Number Percent
Less than high school 122 4.9
High school diploma or equivalent 191 7.8Some college 19 0.8College degree 29 1.2
Unknown 2,100 85.3
Total 2,461 100.0
Table 3 - Educational Attainment of All Immigrants

An Analysis of the Employment Patterns of Somali Immigrants to Lewiston from 2001 through 20065
A higher percentage of immigrants from other coun-
tries had a known educational attainment, with
approximately 15 percent having a high school
diploma or equivalent. (See Table 4).
In additional to limited educational attainment data, a
key piece of information unavailable for this analysis
was reliable literacy and language data. The GA data
did contain some information on whether a translator
was necessary and whether immigrants had been
assigned to ESL classes, and the data from the
CareerCenters included information on limited Eng-
lish proficiency. However, there was enough inconsis-
tency and subjectivity to the information to keep it
from being used in this analysis.
Inclusion of literacy and language data, whether
through improved collection efforts by current
sources or identification of additional sources, would
improve future analysis.
The lack of educational attainment, language, and
literacy data presents a challenge for developing train-
ing and employment strategies. In order to create an
effective training program, it is important to know the
overall literacy level of a population. Knowledge of the
written and spoken English-language capabilities as
well as the native-language literacy of an individual is
important when determining whether and what type
of training are necessary. Similarly, knowledge of an
individual’s level of formal education can help deter-
mine what type of training and employment strategies
to use.
Number Percent Number Percent
Less than high school 96 4.9 26 5.2
High school diploma or equivalent 115 5.8 76 15.3
Some college 11 0.6 8 1.6
College degree 14 0.7 15 3.0
Unknown 1,727 88.0 373 74.9
Total 1,963 100.0 498 100.0
Table 4 - Educational Attainment of Immigrants by Country of Origin
Immigrants from Somalia
Immigrants from Other
Countries

An Analysis of the Employment Patterns of Somali Immigrants to Lewiston from 2001 through 20066
Employment Patterns
Of the total immigrants identified, 1,963 were
from Somalia and 498 were from other
countries. Immigrants were determined to be
of working age if they were between the ages
of 16 and 64 at any point between the date of
entry/ intake and the end of 2006. During this
period, of those of working age, 1,118 were
Somali immigrants and 309 were immigrants
from other countries. (See Table 5).
A slightly larger percentage of both the
working-age immigrants from Somalia and
the working-age immigrants from other
countries were female. As is expected with
such a large percentage of children in the
entire population of immigrants identified,
the working-age immigrants were about eight
years older on average than the total
immigrant population.
As with the entire population of immigrants
identified, most working-age immigrants were
the heads of household. More of the working-
age immigrants had a known level of educa-
tional attainment. (See Table 6). Nearly all of
the immigrants from the total population with
known educational attainment were of work-
ing age.
Number Percent Number Percent
Female 662 59.2 211 68.3Male 425 38.0 85 27.5Unknown 31 2.8 13 4.2
Under 5 3 0.3 * *5 to 9 25 2.2 * *10 to 13 38 3.5 10 3.214 to 18 150 13.4 30 9.719 to 21 130 11.6 22 7.122 to 24 116 10.4 27 8.725 to 34 250 22.3 69 22.335 to 44 139 12.4 56 18.145 to 54 52 4.6 39 12.655 to 64 24 2.2 14 4.565 and over 0 0.0 0 0.0Not yet born 0 0.0 7 2.3Unknown 191 17.1 32 10.4Average (mean) age
Total 1,118 100.0 309 100.0
Table 5 - Characteristics of Working-age Immigrants
by Country of Origin
Immigrants from
Somalia
Immigrants from
Other Countries
Gender
Age at Date of Entry/Intake
26.9 31.8
* Data do not meet federal or state disclosure criteria but are included in the total.
Number Percent Number PercentLess than high school 95 8.5 24 7.8High school diplomaor equivalent 115 10.3 67 21.7
Some college 11 1.0 7 2.3College degree 14 1.2 15 4.8Unknown 883 79.0 196 63.4
Total 1,118 100.0 309 100.0
Table 6 - Educational Attainment of Working-age Immigrants
by Country of Origin
Immigrants from
Somalia
Immigrants from
Other Countries

An Analysis of the Employment Patterns of Somali Immigrants to Lewiston from 2001 through 20067
The immigrants were matched to
MDOL wage records1 to determine
how many of the immigrants had
wages. Of the working-age Somali
immigrants, 553 had wages at some
point in time prior to October 2006, as
did 182 of the working-age immigrants
from other countries. Dividing the
number of working-age immigrants
with wages by the total number of
working-age immigrants gives an
overall employment rate of just less
than 50 percent for those from Somalia
and just less than 59 percent for those
from other countries. In other words,
half of the Somali immigrants had
wages at some point between the date
of entry/intake and October 2006.
However, while we know the number of
working-age immigrants and the num-
ber of immigrants with wages, it is
highly improbable that all of the
working-age immigrants were in the labor force (where the labor force is the total number of employed persons and
persons with no employment who were available for work and had made specific efforts to find employment). It is
likely some of the working-age immigrants were parents who stayed at home with children or were newly arrived
immigrants who had not yet started looking for work. Therefore, the use of working-age immigrants as a proxy for the
labor force likely causes the employment rate to appear lower that it really is. The closest comparison for employ-
ment is the Census 2000 employment/population ratio2 for Lewiston, which gives the best comparable estimate of
employment at just under 70 percent. In Portland, around 83 percent of the refugees were found to have at least one
employment occurrence.
The gender distribution for the immigrants from other countries is nearly the same for those with wages as for those
of working age. (See Table 7). The percentage of males from Somalia is slightly higher for those with wages than for
those of working age. The average ages are very similar for Somali working-age immigrants and immigrants with
wages while for immigrants from other countries, the average age was 1.5 years older for those with wages.
1 MDOL wage records are currently the best source for employment data, but they do have some limitations. Employers report
wages paid to their employees on a quarterly basis as required by the Maine Employment Security Act. While most workers are
covered, there are some not included in the wage records, such as individuals who are working out of state, in the federal gov-
ernment or military, or self-employed.2 The U.S. Census Bureau defines the employment/population ratio as: A measure derived by dividing the civilian noninstitutional
population 16 to 64 years who are employed by the total civilian noninstitutional population 16 to 64 years and multiplying by 100.
Number Percent Number Percent
Female 303 55.0 125 68.7Male 240 43.4 49 26.9Unknown 9 1.6 8 4.4
Under 5 * * * *5 to 9 13 2.4 0 0.010 to 13 13 2.4 0 0.014 to 18 60 10.9 12 6.619 to 21 71 12.8 14 7.722 to 24 67 12.1 20 11.025 to 34 124 22.4 39 21.435 to 44 62 11.2 35 19.245 to 54 15 2.7 27 14.855 to 64 8 1.5 7 3.8Not yet born 0 0.0 3 1.6Unknown 118 21.3 24 13.2Average (mean) age
Total 552 100.0 182 100.0
Table 7 - Characteristics of Immigrants with Wages
by Country of Origin
Immigrants from
Somalia
Immigrants from
Other Countries
Gender
Age at Date of Entry/Intake
26.3 33.3
* Data do not meet federal or state disclosure criteria but are included in the total.
An Analysis of the Employment Patterns of Somali Immigrants to Lewiston from 2001 through 20068
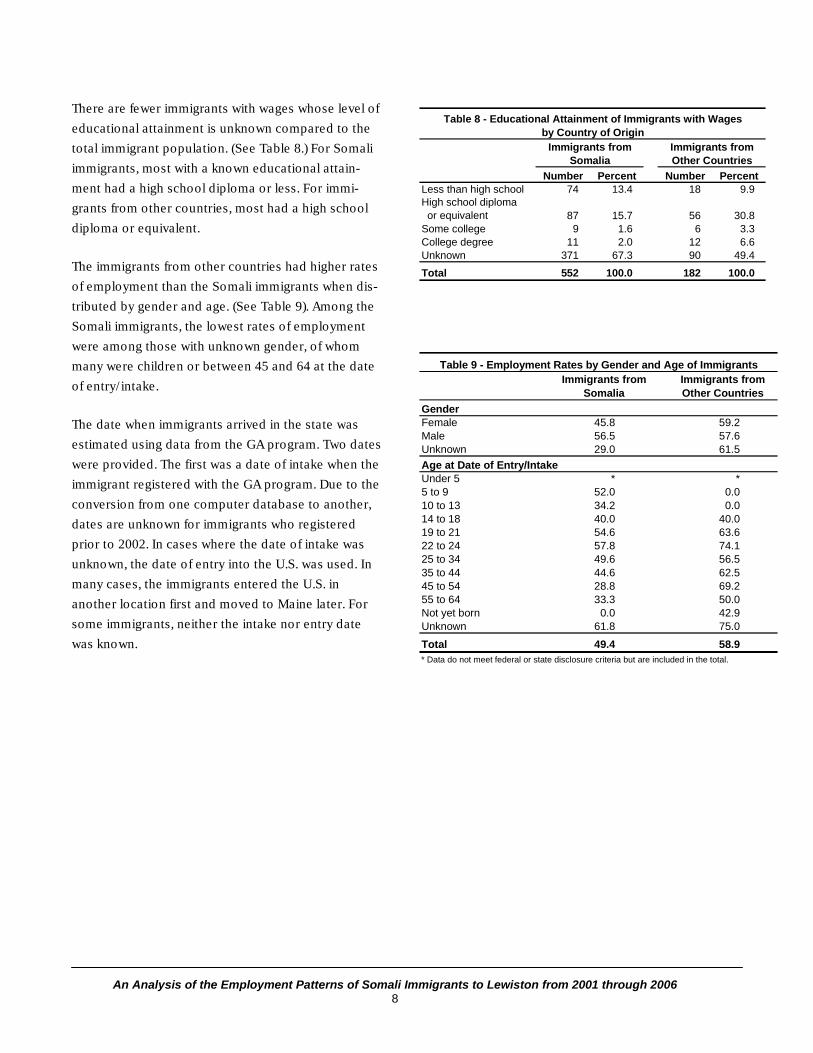
There are fewer immigrants with wages whose level of
educational attainment is unknown compared to the
total immigrant population. (See Table 8.) For Somali
immigrants, most with a known educational attain-
ment had a high school diploma or less. For immi-
grants from other countries, most had a high school
diploma or equivalent.
The immigrants from other countries had higher rates
of employment than the Somali immigrants when dis-
tributed by gender and age. (See Table 9). Among the
Somali immigrants, the lowest rates of employment
were among those with unknown gender, of whom
many were children or between 45 and 64 at the date
of entry/intake.
The date when immigrants arrived in the state was
estimated using data from the GA program. Two dates
were provided. The first was a date of intake when the
immigrant registered with the GA program. Due to the
conversion from one computer database to another,
dates are unknown for immigrants who registered
prior to 2002. In cases where the date of intake was
unknown, the date of entry into the U.S. was used. In
many cases, the immigrants entered the U.S. in
another location first and moved to Maine later. For
some immigrants, neither the intake nor entry date
was known.
Number Percent Number PercentLess than high school 74 13.4 18 9.9High school diplomaor equivalent 87 15.7 56 30.8
Some college 9 1.6 6 3.3College degree 11 2.0 12 6.6Unknown 371 67.3 90 49.4
Total 552 100.0 182 100.0
Table 8 - Educational Attainment of Immigrants with Wages
by Country of Origin
Immigrants from
Somalia
Immigrants from
Other Countries
Immigrants from
Somalia
Immigrants from
Other Countries
Female 45.8 59.2Male 56.5 57.6Unknown 29.0 61.5
Under 5 * *5 to 9 52.0 0.0
10 to 13 34.2 0.014 to 18 40.0 40.019 to 21 54.6 63.622 to 24 57.8 74.125 to 34 49.6 56.5
35 to 44 44.6 62.545 to 54 28.8 69.255 to 64 33.3 50.0Not yet born 0.0 42.9Unknown 61.8 75.0
Total 49.4 58.9
Age at Date of Entry/Intake
Table 9 - Employment Rates by Gender and Age of Immigrants
Gender
* Data do not meet federal or state disclosure criteria but are included in the total.

An Analysis of the Employment Patterns of Somali Immigrants to Lewiston from 2001 through 20069
The date of intake and date of entry data fields were
combined in order to determine the year of
entry/intake. Most of the immigrants arrived in the
past four years, even though there are a large number
of immigrants whose year of entry/intake is unknown.
(See Figure A.) Included in the unknown category are
years with only one or two immigrants and anyone
arriving during the first part of 2007. Because the
influx of Somali immigrants began in 2001, it is likely
that most of the immigrants whose date of en-
try/intake is unknown arrived between 2001 and 2002.
Number of Immigrants by Year of Entry/Intake
10 3 7 143
15 21
31
70
48 43
7885
33
187
355
575
466
417
1984 1985 1987 1991 1993 1994 1995 1996 1997 1998 1999 2000 2001 2002 2003 2004 2005 2006 Unknown
Figure A
Since the focus of this analysis is on the Somali immi-
grants, the remainder looks solely at this group. A pic-
ture of the employment patterns of the Somali immi-
grants can be constructed by calculating a few figures.
First, it is important to know how long it took the
immigrants to find employment after moving to the
area. The estimated date of entry/intake was used in
combination with the wage records to determine the
length of time prior to employment. In situations
where the immigrant arrived in the U.S. first and
moved to Maine at a later date, the time between en-
try and employment is inflated, because the wage re-
cords show Maine Covered Employment only. Addi-
tionally, there were some immigrants who had neither
an intake nor an entry date. These immigrants were
excluded from the calculations for the length of time
prior to employment.

An Analysis of the Employment Patterns of Somali Immigrants to Lewiston from 2001 through 200610
Number of Quarters Prior to Employment: 7.9
On average, there were 7.9 quarters, or nearly two
years, between the time of entry to the country or
intake to the program and the first occurrence of wage
records. An immigrant may not have been in the labor
force and searching for work during this entire time
period. This time may have been spent in training or
taking English as a Second Language (ESL) classes.
Families with small children may have had only one
parent looking for work while the other cared for the
children. In Portland, the number of quarters prior to
employment was only 2.4 on average. This may be
attributable to better information in Portland regard-
ing the date of entry.
Number of Quarters in Employability Period: 8.5
The period of employability for an immigrant begins
with the first employment occurrence. Once an immi-
grant obtains a job, there is an indication that this
immigrant is employable. The employability period
ends at the last employment occurrence. In some
cases, this may be simply the most recent quarter of
wages available. In other cases, the immigrant may
have moved out of state or otherwise left the labor
force. It is also possible that some of the immigrants
whose employability periods end are unemployed and
searching for employment, but it is not possible to
identify these individuals with the data available.
There were about 8.5 quarters on average between
the first employment occurrence and the most recent.
Since the majority of the Somali immigrants arrived
starting in 2001, and the wage records contain data
through 2006, this average seems about right, taking
into consideration the nearly two years it takes before
an immigrant finds a job. Those immigrants not arriv-
ing until 2004 are likely to have very short or no
employability periods. In Portland, immigrants began
arriving earlier and had more time in the workforce.
The average time in the employability period for Port-
land was 12.5 quarters.
Number of Quarters with Wages: 6.6Average Percentage of Time Employed: 78.0Average Quarters without Wages: 1.2
On average, there were 6.6 quarters with at least one
employment occurrence during the employability
period. Given that the employability period was 8.5
quarters, the average time employed was just under
78 percent. The number of quarters with at least one
employment occurrence is lower than the average
time of employability because some immigrants may
not have worked during every quarter of their
employability period. The average length of the peri-
ods without wages during employability was around
1.2 quarters. The average length of unemployment
was just over three months. In Portland, the average
number of quarters with wages was 11.1, leading to an
average time employed of around 87 percent.
Average Number of Employers: 3.4Average Number of Employers per Quarter: 1.2
Overall, each immigrant had an average of 3.4
employers. While some of these employers were con-
secutive, others were concurrent. Some immigrants
worked for multiple employers during a quarter. The
average number of employers during any quarter was
1.2. It is highly likely that immigrants who changed
employers did so sometime during the course of a
quarter rather than on the first or last day of the quar-
ter. This appears in the wage records as two employ-
ers during the quarter with no way of distinguishing
consecutive from concurrent employment. In Port-
land, the average number of employers was 4.7,
possibly due to the longer employability period.

An Analysis of the Employment Patterns of Somali Immigrants to Lewiston from 2001 through 200611
Average Wages and Patterns ofEmployment Attachment
The overall mean average quarterly wage for Somali
immigrants was $2,199.35, equating to just under
$8,800 per year. The median average quarterly wage is
even lower, at just $1,562.58, indicating that the mean
overstates the typical average wages. In order to bet-
ter examine the average wages and employment pat-
terns, a subset of Somali immigrants was identified.
These immigrants had at least four quarters of wages,
not necessarily consecutive, during their eligibility
period. The average wages for this group were slightly
higher, with a mean of $2,281.16 and a median of
$1,868.93.
When immigrants receive employment counseling,
one of the suggestions often given is to work for one
employer for at least a year before changing jobs.
Consistent, stable employment is said to lead to
higher earnings.
Consistent employment means that an immigrant was
employed during each quarter of the employability
period. There were no gaps in employment lasting a
quarter or longer. Due to the nature of the wage
records, there could be periods of unemployment
lasting less than a quarter which would not be
observed. Inconsistent employment had periods
without wages during the time of employability. Again,
any immigrants with fewer than four quarters of wages
have been excluded from this analysis.
Percent with Consistent Employment: 39.7
More immigrants had inconsistent employment than
consistent employment. Only two of every five Somali
immigrants with at least one full year of wages were
found to have consistent employment. However, the
average wage for immigrants with consistent
employment was higher by around $560 a quarter.
Percent with Stable Employment: 9.9
Stable employment means that an immigrant had at
least four quarters of wages from each employer dur-
ing the employability period. Only 9.9 percent of the
immigrants had stable employment. This seems to
indicate that immigrants are “job-hopping” or moving
quickly from one job to the next. Without more
detailed records, it is impossible to know the reasons
for the pattern of job-hopping. However, the small
percentage of immigrants who stayed at least a year
with each employer had significantly higher earnings
than those immigrants with unstable employment. On
average, those immigrants with stable employment
earned $1,423 more each quarter. These results are
consistent with the advice generally given to workers
to stay with an employer for at least a year.
There are four possible employment patterns that
emerge based on the consistency and stability
employment definitions. The first pattern, consistent-
stable employment, is most often recommended for
higher wages. Slightly more than seven percent of the
immigrants had consistent-stable employment and,
while their wages were quite a bit higher than the
wages for immigrants with unstable employment, the
immigrants with inconsistent-stable employment
actually had the highest wages of $4,371 a quarter.
(See Table 10.) However, only 2.5 percent of the immi-
grants fell into this category, so it is difficult to draw
conclusions. Most of the inconsistent-stable immi-
grants were employed in the education and health
services industry sector or the retail trade industry.
Retail especially can be very seasonal while paying
high wages during the peak seasons.
The immigrants with inconsistent-unstable employ-
ment made up the largest group of workers, with over
half falling into this category. The average wages were
the lowest overall, at just under $2,000 a quarter and
less than half the average quarterly earnings for the
inconsistent-stable workers. Those with consistent-
unstable employment also made up a large percent-
age of the immigrants, with average earnings: lower

An Analysis of the Employment Patterns of Somali Immigrants to Lewiston from 2001 through 200612
Percent of
Im m igrants
Average
Q uarterly
W age ($)
Average # of
Em ployers
(per Q uarter)
Average # of
Em ployers
(Total)
Consistent-Stable 7.3 3,296.30 1.02 1.15Consistent-Unstable 32.4 2,326.20 1.42 3.77Inconsistent-S table 2.6 4,371.05 1.02 1.22Inconsistent-Unstable 57.7 1,993.77 1.27 5.58
than for either of the categories with stable employ-
ment. This seems to indicate that jumping from one
employer to another with brief stints at each and hav-
ing gaps in employment leads to lower wages.
As a whole, the wages for Somali immigrants were
low. Even the immigrants with the highest average
quarterly wages, those with inconsistent-stable
employment, only had annualized average wages of
around $17,500. For comparison, the average earnings
for new hires in the Lewiston-Auburn metropolitan
area in 2006 were around $22,000.iii
The immigrants with inconsistent-unstable employ-
ment had the highest average number of employers
overall, at 5.58, while those with consistent-unstable
employment had the highest average number of em-
ployers per quarter, at 1.42. Those immigrants with
the fewest employers per quarter were the stable
workers who had higher average quarterly earnings. In
order to look at the employment rate over time, the
number of immigrants in the subset with wages for
each quarter was divided by the number of immi-
grants considered to be eligible at that time. (See Fig-
ure B.) Eligibility was determined based on date of
entry/intake, age, and/or receipt of wages.

An Analysis of the Employment Patterns of Somali Immigrants to Lewiston from 2001 through 200613
Percentages of Eligible Somali Immigrants with At Least OneYear of Wages by Quarter
62.4 61.6
26.9
34.3
40.6
32.534.0
41.5
36.838.9
45.9
49.748.1
51.1
60.4
54.1
50.4
55.855.7
32.0
24.6
19.4
11.6
2001,1 2002,1 2003,1 2004,1 2005,1 2006,1
Figure B
The change in the employment rate over time exhibits
two traits: a seasonal cycle and a longer-term trend.
The seasonal shift is observed as increasing rates of
employment from the second to third quarters (April
through September) and decreasing rates of employ-
ment from the third and fourth quarters to the first
quarter of the following year (October through March).
The longer term trend is observed as an initial sharp
increase, followed by a gradual decline. The employ-
ment rate of Somali immigrants increased from the
first quarter of 2001, when the influx began, through
the third quarter of 2002, with only a slight seasonal
dip in the fourth quarter of 2001. However, beginning
with the seasonal decline in 2002, the employment
rates generally decreased, with only small seasonal
increases.
While only anecdotal evidence exists, a story can be
told that explains the possible reason behind this
longer-term trend. Beginning in 2001, large numbers
of Somalis moved to Lewiston. Upon their arrival,
many of these immigrants plunged into the labor
force, peaking at an employment rate of 62.4 percent
in the third quarter of 2002. However, many of these
immigrants found it difficult to stay in the labor force.
There were barriers caused by cultural and language
differences. The jobs they had found were seasonal or
temporary. With each seasonal cycle, a few more
workers became discouraged, bringing the employ-
ment rate down to slightly more than half its 2002
high.

An Analysis of the Employment Patterns of Somali Immigrants to Lewiston from 2001 through 200614
Training and Services Received fromCareerCenters
The lack of stable, consistent work patterns among
immigrants seems to indicate that additional training
and skills would result in improved employment pat-
terns. In some cases, individuals may have needed
basic skills or English language training. In other
cases, rudimentary job skills training may have helped
immigrants understand the basics of employment in
the U.S.. Other immigrants may have benefitted from
occupational or on-the-job training pertaining to a
specific job. The CareerCenters are commonly used
for these types of training. Administrative records for
Workforce Investment Act services from the Career-
Centers were matched to the GA program’s adminis-
trative records to examine the Somali immigrants’ use
of the CareerCenters. There are CareerCenters located
throughout the state, including one in Lewiston.
Between 2001 and 2006, 120 Somali immigrants
received services from the CareerCenters. This is a
small percentage of the total Somali immigrants
identified only about six percent. It is likely that the
language barrier is one of the causes for the low par-
ticipation rate. Without better information on the
language skills of these immigrants, it is difficult to say
for sure.
The immigrants who did receive services participated
in a variety of types including educational achieve-
ment services, supportive services, training, and more.
(See Table 11.) Each immigrant may have received
multiple services. In general, most of the services
received were not specified. The average length of
time in the unspecified services exceeded nine
months, which was longer than the time in any of the
other services.
Immigrants spent the least amount of time participat-
ing in occupational skills training that in combination
with other services.
Most of the immigrants received some type of train-
ing, whether basic skills, occupational skills, or on-the-
job training. (See Table 12.) More than half of the im-
migrants participated in occupational skills training,
whether on its own or in combination with other train-
ing.
Number
Average Length
(months)
Adult education, basic skills, and/or literacy activities 78 6.4
Educational achievement services 12 7.0Leadership development opportunities 24 5.5
Supportive services received 4 6.5Established individual training account and
occupational skills training 36 4.8
On-the-job training and occupational skills training 9 4.7Other services besides those listed above 195 9.4
Table 11 - Services Received by Somali Immigrants and Average Length of Time Spent
in Services

An Analysis of the Employment Patterns of Somali Immigrants to Lewiston from 2001 through 200615
Of those receiving occupational skills training, the
largest percentage trained for occupations in office
and administrative support followed closely by service
occupations. (See Table 13).
Just less than 20 percent of the immigrants actually
found employment in the occupation for which they
trained. Overall, only 35 percent of the immigrants
who received services had employment.
Number PercentOffice and administrative support 24 20.0Production 19 15.8Professional and related 5 4.2Sales and related 9 7.5Service occupations 21 17.5Transportation and material moving 8 6.7Unknown 34 28.3
Total 120 100.0
Table 13 - Somali Immigrants by Training Occupation
Number PercentBasic skills and occupational skills training 37 30.9On-the-job and occupational skills training 9 7.5Occupational skills training 19 15.8Basic skills training 19 15.8None 36 30.0
Total 120 100.0
Table 12 - Training Services Received by Somali Immigrants

An Analysis of the Employment Patterns of Somali Immigrants to Lewiston from 2001 through 200616
Summary and Recommendations
Many benefits come from better understanding the workforce experiences of immigrants. In the coming years Maine
will be facing a shortage of workers. Immigrants from Somalia provide potential workers for the labor force and have
been moving to Maine since 2001. Understanding their labor force experiences will help policy-makers, administra-
tors, and service providers improve the outcomes for these workers and for the state.
This report has begun to describe the experiences of these immigrants in the Lewiston/Auburn area. 2,461 individu-
als were identified as immigrants to the area, with 1,963 from Somalia and 498 from other countries. Most of the
immigrants appeared to be families with young children. The greatest influx of immigrants came during the four years
from 2002 to 2006. The Somali immigrants had an overall employment rate of 49 percent, with 552 of the 1,118 work-
ing-age Somali immigrants having wages at some point before September 2006. The immigrant from other countries
had an employment rate of 59 percent, with 182 of the 309 working-age immigrants having wages.
The employment rate for males from Somalia was much higher than that for females, while the rates were much
closer for immigrants from other countries. Several employment patterns were identified:
Average number of quarters prior to employment: 7.9
Average number of quarters in employability period: 8.5
Average number of quarters with wages: 6.6
Average percentage of time employed: 78.0
Average number of quarters without wages: 1.2
Average number of employers: 3.4
Average number of employers per quarter: 1.2
Percent with consistent employment: 39.7
Percent with stable employment: 9.9
These patterns indicate that immigrants from Somalia were taking nearly two years to find employment and had just
over two years between their first and most recent employment experiences. This matches the approximately four-
year span between the time when most immigrants arrived and the latest available wage records. Somali immigrants
were generally employed during 78 percent of their employability period, with periods of unemployment generally
lasting just over one quarter. Each immigrant worked for 3.4 employers on average with just over one employer each
quarter. Around 40 percent of the immigrants worked in each quarter they were employable, but only 9.9 percent had
at least four quarters of employment with each employer. This is indicative of job-hopping: immigrants moving
quickly from one employer to the next. While it is likely that the job-hopping trend is exacerbated by a lack of skills,
English language competency, and support services, it is impossible to determine the reasons behind this trend with
the data currently available.
This study has identified several areas for further investigation. In particular, data on language abilities would
enlighten much of the results. It is likely that a language barrier is causing the low number of immigrants participating
in CareerCenter services, stable employment, and the workforce in general. Further study should also examine the
industries in which immigrants were employed and the workforce needs of firms in the area. Additional data on edu-
cational attainment and date of entry/intake also would help to round out the picture. This descriptive report is sim-
ply the first step in examining the characteristics, employment patterns, and education and training needs of the im-
migrant population in the Lewiston/Auburn area.
An Analysis of the Employment Patterns of Somali Immigrants to Lewiston from 2001 through 200617
References
i Allen, Ryan. Employment and Earnings Outcomes for Recently Arrived Refugees in Portland, Maine. Maine Department of La-bor, Labor Market Information Services: Augusta, Maine; September 2006.
ii Maine Employment Security Law, MRSA, Title 26, Chapter 13.
iii Local Employment Dynamics, U.S. Census Bureau; http://lehd.did.census.gov, accessed 1/23/2008.