employment protection legislation, capital investment and ... · employment protection legislation,...
TRANSCRIPT

Working Papers
N° 4 - June 2014
Ministry of Economy and Finance
Department of the Treasury
Employment Protection Legislation,
Capital Investment and Access to Credit:
Evidence from Italy
Federico Cingano, Marco Leonardi, Julián Messina, Giovanni Pica
ISSN 1972-411X

Working Papers
The working paper series promotes the dissemination of economic research produced in the Department of the Treasury (DT) of the Italian Ministry of Economy and Finance (MEF) or presented by external economists on the occasion of seminars organized by MEF on topics of institutional interest to the DT, with the aim of stimulating comments and suggestions. The views expressed in the working papers are those of the authors and do not necessarily reflect those of the MEF and the DT.
Copyright: ©
2014, Federico Cingano, Marco Leonardi, Julián Messina, Giovanni Pica. The document can be downloaded from the Website www.dt.tesoro.it and freely used, providing that its source and author(s) are quoted.
Editorial Board: Lorenzo Codogno, Mauro Marè, Libero Monteforte, Francesco Nucci, Franco Peracchi
Organizational coordination: Marina Sabatini

Employment Protection Legislation, Capital Investment and Access to Credit:
Evidence from Italy1
Federico Cingano (*), Marco Leonardi (**), Julián Messina (***), Giovanni Pica (****)
Abstract
This paper estimates the causal impact of dismissal costs on capital deepening and
productivity exploiting a reform that introduced unjust-dismissal costs in Italy for firms
below 15 employees, leaving firing costs unchanged for larger firms. We show that the
increase in firing costs induces an increase in the capital-labour ratio and a decline in
total factor productivity in small firms relative to larger firms after the reform. Our results
indicate that capital deepening is more pronounced at the low-end of the capital
distribution - where the reform hit arguably harder - and among firms endowed with a
larger amount of liquid resources. We also find that stricter EPL raises the share of
high-tenure workers, which suggests a complementarity between firm-specific human
capital and physical capital in moderate EPL environments.
JEL: J65, G31, D24 Keywords: Capital Deepening, Severance Payments, Regression Discontinuity Design,
Financial Market Imperfections, Credit Constraints.
(*) Bank of Italy and OECD. E-mail: [email protected]
(**) University of Milan and IZA. E-mail: [email protected]
(***) World Bank, University of Girona and CSEF. E-mail: [email protected]
(****) University of Salerno, CSEF, Paolo Baffi Centre and Centro Luca D'Agliano. E-mail: [email protected]
1 We are grateful to seminar participants at the University of Milan, the University of Naples Federico II, the 2012 EALE
conference, 2013 EEA conference, 2013 SIE congress, and the XII Brucchi Luchino workshop for useful suggestions. Giovanni Pica gratefully acknowledges support from the Europlace Institut of Finance (Project: Finance and Labour, 2011). The views expressed in this paper are those of the authors and do not necessarily reflect those of the OECD and its member countries, or of the Bank of Italy.

CONTENTS
1 INTRODUCTION ................................................................................................................. 1
2 THE INSTITUTIONAL BACKGROUND .............................................................................. 4
3 DATA, SAMPLE SELECTION AND DESCRIPTIVE EVIDENCE ....................................... 5
4 IDENTIFICATION STRATEGY AND REGRESSION MODEL ........................................... 9
4.1 QUANTILE REGRESSION MODEL ......................................................................................... 12
5 IDENTIFICATION STRATEGY AND REGRESSION MODEL ......................................... 13
5.1 THE EFFECTS OF EPL ON CAPITAL, PRODUCTIVITY AND EMPLOYMENT ................................. 13 5.2 QUANTILE REGRESSION MODEL ......................................................................................... 15
6 THE EFFECT OF EPL ON SENIORITY ............................................................................ 19
7 CONCLUSION ................................................................................................................... 21
REFERENCES .......................................................................................................................... 22
APPENDIX ................................................................................................................................. 27
1 Introduction
If dismissal protections cannot be undone by Coasean bargaining, theory predicts that Employment
Protection Legislation (EPL) acts as a tax on both hiring and firing, reducing accessions and separa-
tions with an ambiguous final effect on the employment level. The reason is that firing costs provide
incentives to retain workers whose wage exceeds their productivity during bad times and not to hire
workers whose wage lies below their productivity during good times (Bentolila and Bertola, 1990).
While there is a large body of evidence confirming this theoretical prediction (see the recent review
by Skedinger, 2011), less is known about the impact of dismissal costs on other firm level outcomes,
as capital deepening and productivity.
The theoretical predictions of the impact of EPL on capital deepening are in fact ambiguous. In
competitive models with no financial and labour market frictions, an increase in EPL is expected
to raise the cost of labour and induce capital-labour substitution, distorting production choices and
reducing allocative efficiency (Autor, 2007); in the long-run firms can change their production tech-
niques and adopt more capital-intensive technologies (Caballero and Hammour, 1998; Alesina and
Zeira, 2006; Koeniger and Leonardi, 2007). On the contrary, in models with labour market frictions
and wage bargaining, stricter EPL exacerbates the “hold-up” problem typical of investment decisions
and reduces the stock of capital per worker (Bentolila and Dolado, 1994; Garibaldi and Violante,
2005). However, the relationship between EPL and capital intensity can turn positive if physical cap-
ital and firm-specific human capital are complements. In this case, stricter EPL does not only induce
capital deepening, but it also raises the employment share of senior workers with high firm-specific
human capital (Janiak and Wasmer, 2013). From a theoretical standpoint, the impact of EPL on
productivity is also ambiguous.1
The scarcity of studies on the effects of EPL on capital deepening and productivity is partly
explained by the challenging identification issues faced when using aggregate country- or sector-level
data, and by the lack of accurate data on capital in firm level data sets. The best prior evidence to
date is the contribution by Autor, Kerr and Kugler (2007), who exploit U.S. cross-state variation in
the adoption of wrongful-discharge protection norms and find evidence of a mild positive effect on
1On the one hand, dismissal protections reduce workers’ effort and induce firms to retain unproductive workers and/orto reduce the innovation rate (Ichino and Riphahn, 2005; Bartelsman and Hinloopen, 2005; Wasmer, 2006). On the otherhand, stricter EPL may raise aggregate productivity by driving inefficient firms out of the market and by promotingfirms’ and workers’ willingness to engage in training activities because of increased job stability; it may also lead toa favourable compositional shift in the productivity of the employed workforce as firms may screen new hires morestringently (Lagos, 2006; Belot et al., 2007).
1

capital deepening and a moderate negative impact on TFP. Cingano et al. (2010) use a large panel of
European firms and find instead a negative effect of EPL on capital per worker.2
We contribute to this literature by estimating the impact of EPL on capital intensity and pro-
ductivity. To this purpose, we exploit a change in the Italian size contingent employment legislation
using detailed firm-level balance sheet data for firms around the size threshold. The reform, en-
acted in July 1990, introduced severance payments for firms with fewer than 15 employees, who were
previously exempted, while leaving unchanged those for larger firms. This allows us estimating the
impact of EPL contrasting changes in the outcomes of interest for firms below the threshold (treat-
ment group) with those for firms above the threshold (control group). Our identification strategy
combines a Regression Discontinuity Design with a difference-in-difference approach, accounting for
unobserved time-invariant factors that influence firms’ size (e.g. their choice to stay above or below
the 15 employees threshold), and for time-varying industry-specific shocks.
The availability of accurate balance-sheet data for a large sample of firms around 1990 allows us
to focus on capital intensity as well as productivity and employment. Moreover, the data provide
measures of firms’ financial conditions which enable us studying how firms’ response to changes in
EPL is affected by their liquidity endowment. The theoretical literature is virtually silent on the effects
of the interaction between EPL and financial market imperfections and there are very few empirical
studies (limited to cross-country variation) on the effects of EPL on investment and productivity
depending on the ability of the firm to access the credit market.
Our core results (largely confirmed by an extensive set of robustness checks) suggest that the raise
of firing costs associated with the 1990 Italian EPL reform increased capital intensity, reduced Total
Factor Productivity (TFP) and had nearly no impact on the skill composition of the workforce and
year-to-year job flows. Moreover, we also find that the substitution between capital and labour did
not happen across the board: it was more pronounced in firms with lower capital-labour ratios prior to
the reform and, among those, in firms with higher liquid resources. The latter findings are consistent
with the idea that firms with few collateralizable assets have limited access to the credit market, and
are therefore constrained by the amount of own liquidity when adjusting the capital stock.3
2The empirical literature on EPL has mostly concentrated on the effects on employment flows. See among othersAutor et al. (2004) and (2006), Gomez-Salvador et al. (2004); Kugler and Saint-Paul (2004); Boeri and Jimeno (2005);Messina and Vallanti (2007); Kugler and Pica (2008); Bauer et al. (2007); Marinescu (2009). A neighbouring literatureprovides mixed results on the impact of EPL on wages and labour costs: Martins (2009), Bird and Knopf (2009), CerviniPla et al. (2010), Leonardi and Pica (2013) find a negative relationship; Van der Wiel (2010) finds a positive relationshipwhile Autor et al. (2006) finds mainly insignificant results.
3The result is consistent with Claessens and Ueda (2008), who find that the positive effect of EPL on output growth
2
Our baseline results are in line with Autor et al. (2007), whose evidence suggests that the adoption
of wrongful-discharge protection norms in U.S. states induced capital deepening and a decline in total
factor productivity. Conversely, they are in contrast with studies on European countries (Calcagnini et
al., 2009; Cingano et al., 2010) who tend to find a negative relationship between EPL and, respectively,
investment and capital-labour ratios. These differences may be reconciled adopting the view proposed
by Janiak and Wasmer (2013) of an inverse U-shaped relationship between EPL and the capital-labour
ratio, positive at low levels of EPL and negative at high levels of EPL.4
The present study arguably focuses on the range of EPL where the relationship between EPL
and capital-labour ratios is positive (very much as Autor et al., 2007, and Claessens and Ueda, 2008,
who study the low-EPL U.S. labour market). The 1990 Italian reform, in fact, mandated a moderate
increase in the cost of unfair dismissals for previously exempted small firms, plausibly on the increas-
ing side of the capital-EPL relationship. Differently, the cross-country studies by Calcagnini et al.
(2009) and Cingano et al. (2010) exploit variation in EPL across relatively highly regulated European
countries, and thus plausibly capture the decreasing side of the capital-EPL relationship.
To investigate further the consistency of our results with the theory of Janiak and Wasmer (2013),
we exploit Social Security worker-firm matched data to test the predicted positive relationship between
EPL and firm seniority (a proxy for the amount of firm-specific human capital). The data allow
computing alternative measures of firm seniority over time for a comparable sample of firms (i.e.
those around the 15 employees threshold) located in two Italian provinces. We find that the reform
increased the share of senior workers (namely, those with more than 2, 3 and 4 years of tenure) as
well as average seniority in small relative to large firms. These results are suggestive that the increase
in physical capital may be due to its complementarity with firm-specific human capital, as in Janiak
and Wasmer (2013).
The rest of the paper is organized as follows. Section 2 describes how firing restrictions evolved
in Italy. Section 3 describes the data set and the sample selection rules. Section 4 explains the
in knowledge intensive industries is weaker in US states with more stringent bank branches regulation, and with Cinganoet al. (2010) and Calcagnini et al. (2009) who find that better functioning financial markets mitigate the consequencesof changes in EPL on firms’ capital intensity and productivity level.
4Janiak and Wasmer (2013) obtain this result studying a matching model combining intra firm bargaining a laStole and Zwiebel (1996a, 1996b), endogenous firm-specific human capital accumulation and complementarity betweenphysical and (firm-specific) human capital. On the one side, job protection raises the expected returns in firm-specifichuman capital because of longer (expected) tenure; this raises workers’ investment in human capital, firms’ marginalproductivity of capital and demand for capital. On the other side, job protection induces firms to retain relativelyunproductive workers, thus reducing both the marginal productivity of capital and the demand for capital. When EPLis relatively low, a small increase in employment protection raises capital intensity, but for sufficiently high values ofEPL the second effect prevails and the overall effect of employment protection on capital turns negative.
3

identification strategy used to evaluate the impact of EPL on capital deepening and productivity.
Section 5 presents estimates of the impact of increased strictness of employment protection in small
firms in Italy after 1990 and analyses the role of financial markets imperfections. Section 6 extends
the analysis to the effects of EPL on workers’ seniority within the firm and Section 7 concludes.
2 The institutional background
Over the years the Italian legislation ruling unfair dismissals has changed several times. Both the
magnitude of the firing cost and the coverage of the firms subject to the restrictions have gone through
extensive changes.
Individual dismissals were first regulated in Italy in 1966 through Law 604, which established that,
in case of unfair dismissal, employers had the choice to either reinstate workers or pay severance,
which depended on tenure and firm size. Severance pay for unfair dismissals ranged between 5 and 8
months for workers with less than two and a half years of tenure, between 5 and 12 months for those
between two and a half and 20 years of tenure, and between 5 and 14 months for workers with more
than 20 years of tenure in firms with more than 60 employees. Firms with fewer than 60 employees
had to pay half the severance paid by firms with more than 60 employees, and firms with fewer than
35 workers were completely exempt.
In 1970, the Statuto dei Lavoratori (Law 300) established that all firms with more than 15 em-
ployees had to reinstate workers and pay their foregone wages in case of unfair dismissals. Firms
with fewer than 15 employees remained exempt.5 The law prescribes that the 15 employees threshold
should refer to establishments rather than to firms. In the data we only have information at the firm
level. However, this is not likely to be a concern as in the empirical analysis we focus on firms between
10 and 20 employees, that are plausibly single-plant firms.
Finally, Law 108 was introduced in July 1990 restricting dismissals for permanent contracts. In
particular, this law introduced severance payments of between 2.5 and 6 months pay for unfair dis-
missals in firms with fewer than 15 employees. Firms with more than 15 employees still had to
reinstate workers and pay foregone wages in case of unfair dismissals. This means that the cost of
unfair dismissals for firms with fewer than 15 employees increased relative to the cost for firms with
5See Boeri and Jimeno (2003) for a theoretical explanation of why these exemptions may be in place. In this paperwe focus only on individual dismissals. An equivalent threshold applies in Italy for collective dismissals, i.e. dismissalsof more than five employees within 120 days. Leonardi and Pica (2013) show that the reform on collective dismissalsdoes not interfere with the results on the individual dismissal reform under consideration.
4

more than 15 employees after 1990.
For our purposes, this reform has two attractive features. First, it was largely unexpected: the
first published news of the intention to change the EPL rules for small firms appeared in the main
Italian financial newspaper Il Sole 24 Ore at the end of January 1990. Second, it imposed substantial
costs on small firms: Kugler and Pica (2008) look at the effect of this reform on job and workers flows
and find that job flows were not affected, but workers’ accessions and separations decreased by about
13% and 15% in small relative to large firms after the reform.
3 Data, sample selection and descriptive evidence
Data for firms are obtained from the Company Accounts Data Service (Centrale dei Bilanci, or CB
for brevity). The data provide detailed information on a large number of balance-sheet items since
the early 1980s together with a full description of firm characteristics (as location, year of foundation,
sector, ownership structure), plus other variables of economic interest usually not included in balance
sheets, such as employment and flow of funds. Company accounts are collected for approximately
30,000 firms per year by the Service, which was established jointly by the Bank of Italy, the Italian
Banking Association and a pool of leading banks to gather and share information on borrowers. Since
banks rely heavily on these data when granting and pricing loans, they are subject to extensive quality
controls by a pool of professionals.
Firms enter the data set when first granted a loan.6 While accounting for a very large fraction
of manufacturing employment and value added, the focus on the level of borrowing skews the sample
towards larger firms. Moreover, the employment figures are not always reported accurately, as this
piece of information is not a mandatory balance sheet item. To address both issues we integrated the
CB data set with information recovered from the firms’ file of the National Social Security (INPS)
Archives. This administrative source covers the universe of private non agricultural firms, and contains
accurate figures on their annual employment, an explicit requirement for firms when paying social
security contributions. Merging these data with CB therefore allows us to improve on the initial
information on firm-level employment; as they cover the universe of firms, the INPS data also allow
6More specifically, banks associated with the Centrale dei Bilanci agreed to include in the data set those clients fromthe Credit Register (a database of both individuals and firms who have been approved of for a loan) who have actuallyused the loan. Hence, CB firms are a subset of those included in the Credit Register.
5

computing post-stratification weights that can be used to re-balance the firm size distribution.7 In
Section 5 we present results with and without weights, which do not differ significantly. This is
because within the narrow size window we focus on (10-20 employees) CB representativeness is fairly
homogeneous, as inspection of the weights indicates.
Standard treatment of the data lead us to our final variables and sample. We rely on CB for data
on value added and investment and on INPS data for employment-related variables. Firm-level capital
stocks are constructed applying the perpetual inventory method, using industry-specific deflators and
depreciation rates and book capital as a proxy for the capital stock in the first year. Total Factor
Productivity is obtained applying the multi-step estimation algorithm devised by Olley and Pakes
(1996).8 We delete as outliers 2,246 out of 99,391 initial firm-year observations whose capital-output
ratio is two inter-quartile ranges away from the median. With regards to the sample period, we restrict
the sample around the reform years (1986-1994), and remove year 1990 because the reform occurred
in the month of July. To preserve comparability between treatment and control groups, we further
restrict the sample to firms within the interval 10–20 employees, yielding a sample size of slightly more
than 20,000 observations (6,656 firms). Tables 1 and 2 show the descriptive statistics.9
Figure 1 plots the size distribution of firms in our data, showing no evidence of firms lumping
at 15 employees either before or after the reform. The absence of a dip in the firm size distribution
right above the 15 employees threshold suggests that firms were not reluctant to pass the threshold
before the reform, and that the reform itself did not change 15-employee firms’ propensity to expand.
This visual impression is confirmed by the results from employment growth regressions (reported in
Appendix A.1) indicating that the probability of expansion of firms just below 15 employees is not
significantly different from that of larger firms, and this probability is not significantly affected by the
reform (even controlling for firms fixed effects).
These results might seem surprising as standard models of labour demand would predict that size-
contingent employment regulation hamper the expansion of firms and generate sizeable discontinuities
in their size distribution (Garicano et al., 2012). However, they are in line with a substantial body of
7For each cell i = 1..I the weights are constructed as follows:
weighti = (#firmsi/#firms)INPS/(#firmsi/#firms)CEBIL
We experimented re-balancing both for size only and for multiple characteristics (size, industry and geographical location).8The procedure allows for direct estimates of production coefficients, accounting for both endogeneity in the choice of
inputs (by approximating unobserved productivity shocks with a non-parametric function of observable variables) andfor selection in firms continuation decision (introducing a Heckman-type correction term).
9Table A.2 in Appendix A.2 tests the robustness of our results both to different time periods and to the inclusion of1990; Table A.3 shows that the results are invariant to different size ranges.
6

Table 1. Descriptive statistics
(1) (2) (3) (4) (5) (6)
MeanStandard Percentiles
Ndeviation 10 50 90
Employment 14.962 3.104 11 15 19 20235Log capital 6.603 0.922 5.342 6.670 7.735 20235Log (capital/value added) 0.273 0.806 -0.853 0.340 1.279 20235Log value added 6.330 0.526 5.702 6.327 6.974 20235Fraction of white collars 0.299 0.222 0.083 0.235 0.600 19943TFP 2.316 0.519 1.646 2.341 2.951 20235Job reallocation 0.139 0.269 0.000 0.074 0.267 16145Cash-flow / Fixed Assets 0.182 0.217 0.039 0.131 0.389 17055
Notes: Job reallocation is the Absolute Value of Labour Reallocation calculated as2(ejt−ejt−1)ejt+ejt−1
; Total
Factor Productivity is obtained applying the multi-step estimation algorithm devised by Olley andPakes (1996). The ratio Cash-flow/Fixed Assets is measured in the pre-reform period.
Table 2. Descriptive statistics by treatment and control before and after the reform
(1) (2) (3) (4)
Pre-reform Post-reformSmall firms Large firms Small firms Large firms
Employment 12.591 17.983 12.588 17.983(1.664) (1.418) (1.692) (1.424)
Log capital 6.402 6.773 6.491 6.823(0.958) (0.849) (0.916) (0.878)
Log (capital/value added) 0.298 0.364 0.225 0.228(0.827) (0.747) (0.837) (0.784)
Log value added 6.104 6.410 6.266 6.595(0.510) (0.470) (0.512) (0.475)
Fraction of white collars 0.299 0.269 0.320 0.297(0.232) (0.198) (0.235) (0.212)
TFP 2.258 2.218 2.384 2.379(0.519) (0.499) (0.532) (0.500)
Job reallocation 0.169 0.153 0.131 0.118(0.320) (0.319) (0.237) (0.224)
Cash-flow/Fixed Assets 0.181 0.164 0.197 0.189(0.237) (0.196) (0.218) (0.210)
Notes: Job reallocation is the Absolute Value of Labour Reallocation calculated as2(ejt−ejt−1)ejt+ejt−1
; Total
Factor Productivity is obtained applying the multi-step estimation algorithm devised by Olley andPakes (1996). The ratio Cash-flow/Fixed Assets is measured in the pre-reform period. Standarddeviations in parentheses.
7

Figure 1. Firm size distribution in 1989 and 1991
empirical work focusing on the consequences of the discontinuity in dismissal costs in Italy (see e.g.
Borgarello, Garibaldi and Pacelli, 2004; Boeri and Jimeno 2005; Schivardi and Torrini 2008; Leonardi
and Pica, 2013). None of these papers found compelling evidence that the firm size distribution is
discontinuous around the 15 employees threshold, nor that firms just below the threshold are less
likely to expand.10
These findings do not imply that EPL has no consequences for Italian firms’ employment decisions,
however. Exploiting detailed matched employer-employee data and the same reform episode we use
here, Kugler and Pica (2008) showed that, while the stringency of regulation has little or no effect
on job flows (the change in firm level employment), it has a large impact on worker flows, decreasing
accessions and separations for workers in small relative to large firms. Similarly, Boeri and Jimeno
(2005) showed that more stringent regulation lowers both hiring and firing probabilities of individual
workers, but not the net job dynamics of individual firms.11
This discussion is informative to our analysis in at least two dimensions. On the one hand, if
EPL does not affect the growth probability of firms, we might expect to find little or no significant
effects of the 1990 reform on standard measures of job reallocation. On the other hand, by reducing
10Bauer et al. (2007) find similar results for the case of Germany.11Other potential adjustment mechanisms may also be at work: Schivardi and Torrini (2008) and Hijzen et al. (2013)
emphasize firms’ adjustment through fixed-term contracts; Leonardi and Pica (2013) show that part of the adjustmenttakes place through lower wages.
8

Figure 2. Firm size and capital stock in the pre-reform period
Notes: the solid line is a fitted regression of log capital on a polynomial on firm size 1989, performed separately on eitherside of the threshold.
workers’ turnover stricter EPL would tend to raise the average tenure of the workforce (an issue we
will explore in Section 5). Under the assumption of complementarity between physical capital and
firm-specific human capital, tighter job security provisions should therefore induce firms to raise their
capital intensity (as in Janiak and Wasmer, 2013). Preliminary evidence supporting this mechanism
is provided in Figure 2, which shows the distribution of the (log) capital stock by firm size just before
the reform (in 1989). The presence of a visible upward jump at 15 employees indicates that firms
above the threshold react to stricter EPL with higher capital intensity. The following sections explain
our approach to more rigorously identify this effect.
4 Identification strategy and regression model
Our estimand of interest is the average treatment effect of EPL on firms’ capital intensity, their
productivity as well as on their employment decisions. We exploit both the discontinuity in EPL at
the 15 employees threshold and its 1990 reform, which affected only small firms, to build an RDD
combined with a DID strategy to estimate the causal effect of EPL on various outcomes.
More specifically, we compare the change in the dependent variable – say capital – just below
9

15 employees before and after the 1990 reform to the change in the same variable among firms just
above 15 employees. The assumption required to interpret the effect of EPL on capital as causal is
that any variable that affects capital is either continuous at the threshold (as in standard RDD) or
its discontinuity is constant over time (as in standard DID). In this case, the average trend of capital
among firms marginally above the 15 employees threshold (16–20) represents a good counterfactual
for the trend of those just below the threshold (10 – 15), which seems a reasonable assumption in
such a narrow neighbourhood of the threshold. In other words, capital in firms below the threshold is
expected to diverge from capital in firms just above the threshold for no other reason than the change
in the legislation.
We estimate the following model:
xjt = β′Xjt + δ1D
Sjt + δ2
(DSjt × Post
)+ vj + ujt (1)
DSjt = 1 [firm size ≤ 15 in year t]
Post = 1 [year ≥ 1991]
The dependent variable x takes the values of alternative measures of capital deepening (log of the
capital stock and of the capital-value added ratio), productivity (the Olley-Pakes measure of TFP and
log of value added) and employment (fraction of white collars and job reallocation rate, calculated
as2(ejt−ejt−1)ejt+ejt−1
). The variable Post is a dummy that takes the value of 1 starting in 1991 and zero
otherwise (its main effect is not included because it is absorbed by the year dummies, see below); DSjt
is a dummy that takes the value of 1 if the firm lies below the 15 employees in year t and 0 if above.
The interaction term DSjt×Post between the small firm dummy and the post-reform dummy captures
the effect of the EPL reform on the variable of interest.12
The matrix Xjt contains a polynomial of third degree in firm size. Notice that since identification
comes from firm size as measured by the number of employees, we cannot use dependent variables
in per-worker terms. Nevertheless, given that we control for firm size with a flexible third degree
polynomial, all effects can be read as holding labour constant. Hence, for example, the coefficients
12Other papers have exploited the discontinuities in firing costs regimes that apply to firms of different sizes withincountries. Boeri and Jimeno (2005) assess the effect of EPL on lay-off probabilities by comparing firms below and above15 employees in Italy. Kugler and Pica (2006) examine the joint impact of EPL and product market regulation on jobflows in Italy using both the firm size threshold and a law change. Using a difference-in-differences approach, Baueret al. (2007) investigate the impact of granting employees the right to claim unfair dismissal on employment in smallGerman firms. Leonardi and Pica (2013) look at the effects on wages.
10
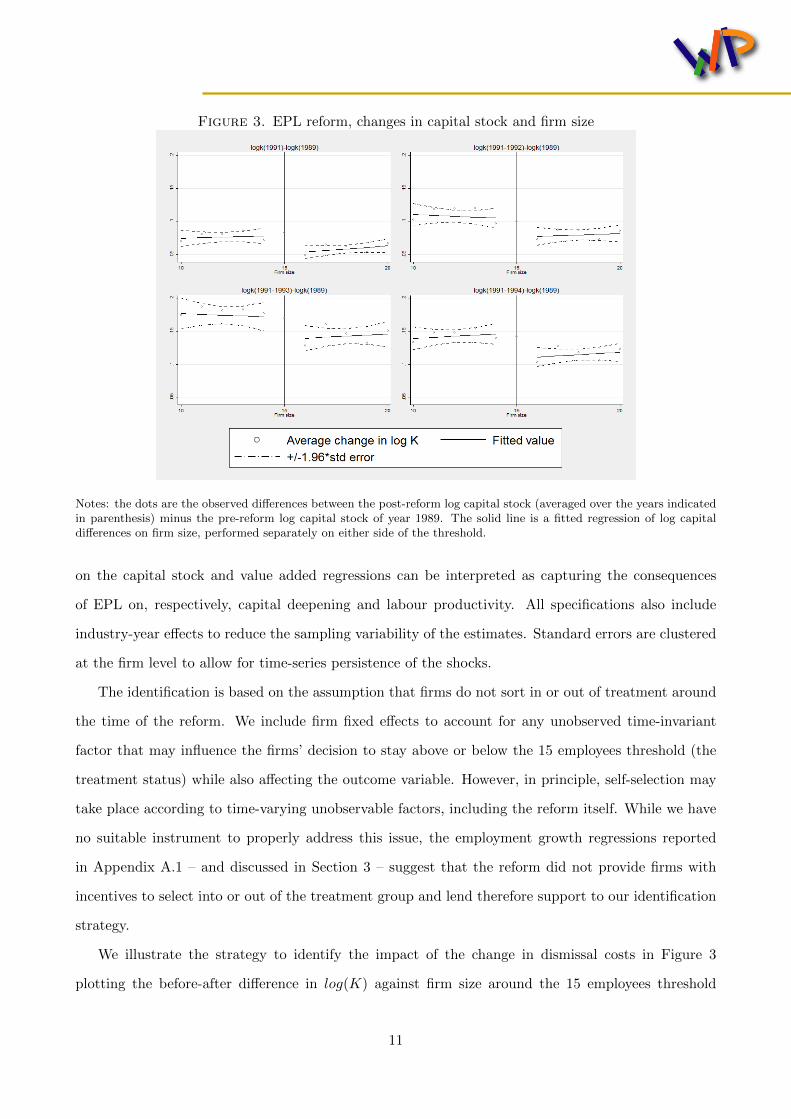
Figure 3. EPL reform, changes in capital stock and firm size
Notes: the dots are the observed differences between the post-reform log capital stock (averaged over the years indicatedin parenthesis) minus the pre-reform log capital stock of year 1989. The solid line is a fitted regression of log capitaldifferences on firm size, performed separately on either side of the threshold.
on the capital stock and value added regressions can be interpreted as capturing the consequences
of EPL on, respectively, capital deepening and labour productivity. All specifications also include
industry-year effects to reduce the sampling variability of the estimates. Standard errors are clustered
at the firm level to allow for time-series persistence of the shocks.
The identification is based on the assumption that firms do not sort in or out of treatment around
the time of the reform. We include firm fixed effects to account for any unobserved time-invariant
factor that may influence the firms’ decision to stay above or below the 15 employees threshold (the
treatment status) while also affecting the outcome variable. However, in principle, self-selection may
take place according to time-varying unobservable factors, including the reform itself. While we have
no suitable instrument to properly address this issue, the employment growth regressions reported
in Appendix A.1 – and discussed in Section 3 – suggest that the reform did not provide firms with
incentives to select into or out of the treatment group and lend therefore support to our identification
strategy.
We illustrate the strategy to identify the impact of the change in dismissal costs in Figure 3
plotting the before-after difference in log(K) against firm size around the 15 employees threshold
11

(each panel focuses on a different time horizon). The mean of the dependent variable is estimated non
parametrically separately for each side of the threshold. The four charts suggest that smaller firms
reacted to the reform increasing their capital stock at a faster rate than unaffected, larger firms. At
the same time Figure A.1 in Appendix A.1 plots the difference in log employment log(e) against firm
size confirming that there is no discontinuity at the 15 employees threshold in the growth rate of firms
before and after the reform.
4.1 Quantile regression model
Theory suggests that the reform should have a larger impact on firms with lower capital-labour ratios,
those with a relatively higher share of labor costs. To investigate this hypothesis, we run a quantile
regression at different points of the distribution using the log of capital as a dependent variable. Let
Qθ(log(kjt)|Xjt) for θ ∈ (0, 1) denote the θth quantile of the distribution of log(kjt) conditional on
firm characteristics included in the matrix Xjt (same controls as in equation (1)). The model of the
conditional quantile is:
Qθ(log(kjt)|Xjt) = β′θXjt + δ1θDSjt + δ2θ
(DSjt × Post
)+ vj (2)
Notice that equation (2) also includes firm fixed effects. The estimation of a quantile model
with fixed effects is not trivial, because its intrinsic non-linearity implies that standard demeaning
techniques are not feasible. We follow the approach of Canay (2011) who introduces a simple two-step
estimator under the assumption that the firm fixed effects are pure location shifters, i.e. they affect
all quantiles in the same way. This estimator is consistent and asymptotically normal when both
the number of firms (N) and the number of periods (T ) approach infinity.13 Inference is based on
bootstrapped standard errors obtained from individual resampling. The identification of equation (2)
is also based on the assumption of the absence of sorting.
13Using Monte-carlo simulations Canay (2011) shows that already with T = 10, the bias is fairly low irrespective ofthe value of N .
12

Table 3. Effects of the 1990 reform(1) (2) (3) (4) (5) (6)
VARIABLES Log(Capital) Log(Capital/ TFP Log(Value Fraction of JobValue added) added) white collars reallocation
Small firm × Post 1990 0.047∗∗∗ 0.059∗∗∗ -0.029∗ -0.013 -0.002 0.010(0.012) (0.015) (0.011) (0.011) (0.003) (0.012)
Small firm -0.045∗∗∗ -0.077∗∗∗ 0.055∗∗∗ 0.032∗ 0.005 -0.015(0.013) (0.017) (0.014) (0.013) (0.003) (0.014)
Observations 20,235 20,235 20,235 19,943 20,235 16,145R-squared 0.164 0.049 0.070 0.241 0.044 0.030
Notes: Robust standard errors clustered by firm in parentheses. All specifications include a thirddegree polynomial in the size of the firm, firm fixed effects, and sector-year dummies. One asteriskdenotes significance at 5%; two asterisks denote significance at 1%; three asterisks denotes significanceat 0.1%.
5 The effects of the 1990 reform
5.1 The effects of EPL on capital, productivity and employment
Table 3 reports our core results from estimating equation 1 with alternative measures of firms’ capital
deepening, productivity and employment.
We find a positive and significant impact of the reform on both the log capital stock (column 1) and
the log capital-value added ratio (column 2), indicating that higher EPL induced capital deepening.
Based on the coefficient estimated in the first column, firms just below the threshold increased their
capital stock by nearly 5% relative to larger firms as a consequence of the change in legislation. As
we will discuss below, this core result is robust to a battery of checks and empirical extensions. We
also find a three percent negative effect on total factor productivity (column 3), and a negative but
not statistically significant effect on the log of value added (column 4). Hence, while the implications
of existing theories are not clear cut, our findings provide evidence (albeit weaker than in the case of
capital) that EPL has a negative impact on firms’ productivity.14
Both sets of results are in line with the impact of the introduction of the good faith exception
on investments by US firms as estimated by Autor et al. (2007) who find mixed – albeit generally
positive – effects on capital-labour ratios (4.5% when controlling for plant fixed effects), and negative
effects on TFP (between −2% and −1.4% with plant fixed effects). Interestingly, the magnitude of
14As outlined in the introduction, the literature predicts a negative effect of EPL on productivity if dismissal protectionsreduce workers’ effort or induce firms to retain unproductive workers and/or to reduce the innovation rate. Positive effectson productivity are instead predicted if firms do more training or hire better workers because of higher EPL.
13

the estimated effects of the EPL reform on capital deepening is fairly large, if compared for example
with the estimated impacts of standard investment tax credit programmes explicitly targeting capital
accumulation. Empirical studies in this area show mixed results and often find that firms have little
or no reaction to investment tax breaks.15 Net of the large differences between the two policies, one
possible explanation is that, while changes in EPL are perceived as permanent, investment tax credits
are usually temporary.
Finally, the last two columns of Table 3 show no detectable impact of stricter EPL on the skill
composition of the workforce (the fraction of white collars, column 5) or on job reallocation ( calculated
as2(ejt−ejt−1)ejt+ejt−1
, column 6). The latter finding is consistent with Kugler and Pica (2008), who studied
the employment consequences of the same reform with matched employer-employee data finding it
had sizeable negative effects on worker flows but little or no effects on job flows (see Kugler and Pica,
2008, Table 4).16 In Section 6 we will quantify the consequences of the reduction of workers’ turnover
for the average seniority of workers.
The positive impact of EPL on capital deepening does not seem to derive from the capital stock of
small firms mechanically converging to that of large firms. Figure 4 shows that the pre-reform trends
of log capital are reasonably parallel. Additionally, were this result mechanical, it should pop up also
in years different from the reform year. Table A.4 in Appendix A.2 shows instead that the effect
vanishes when considering 1988 or 1992 as fake reform years. In the same Appendix we perform a
wide range of robustness checks to show that our results on log capital (the main variable of interest)
are robust to changes in the time period considered (Table A.2) and in the firms’ size range (Table
A.3).
We next investigate the hypothesis that firms with low capital-labour ratios react more to the
15Goolsbee (1998) shows that most of the benefits of an investment tax credit programme implemented in the U.S. weretranslated onto capital suppliers with little effects on real investment. Cohen and Cummis (2006) find that temporarypartial expensing in the U.S. was largely ineffective in boosting investment, while House and Shapiro (2008), exploitingthe same measure, estimate an elasticity of investment supply between 6 and 14%. Results for Italy are also mixed.Bronzini et al. (2008) examine the impact of a large investment tax credit programme aimed at lagging areas andestimate that investment by eligible firms increased by around 9% relative to non-eligible firms. The same authors foundthat other Italian investment subsidies programmes (e.g. Law 488, started in 1996) yield no significant impact on capitalaccumulation, once intertemporal substitution in investment decisions is accounted for (Bronzini and De Blasio, 2006).Notice, however, that those magnitudes are not strictly comparable with ours, as they refer to the investment effect ofITC, whereas our results refer to the impact of EPL on the stock of capital.
16The insignificant effect on job flows is robust to defining employment growth asejt−ejt−1
ejt−1with the small firm dummy
defined as the average pre-reform employment. In this case, the coefficient of interest equals 0.014 with a standard error of0.008. These results might be driven by measurement issues, that is, the use of annual- as opposed to shorter-frequencydata. Previous studies looking at annual rates of job reallocation also found that EPL has little effect on job flows(see Bertola and Rogerson, 1997; Blanchard and Portugal, 2001; Martins, 2009). Contrasting results obtained usingquarterly and yearly rates of reallocation, Blanchard and Portugal (2001) conjecture that employment protection onlyimpairs high-frequency flows.
14

Figure 4. Evolution of log capital
reform. Table 4, Panel A, shows results from a quantile regression at different points of the distribution
using log capital as a dependent variable. The estimates indicate that the effect of the reform on capital
is highest at the 10th percentile and decreases along the capital distribution reaching non significance
at the 90th percentile. A similar, slightly more nuanced, decreasing pattern shows up also for the
capital-output ratio in Panel B, in line with the idea that firms with a high share of labour costs were
hit harder by the reform. Finally, there is no clear pattern in the impact of the reform along the
distribution of TFP (Panel C).
5.2 The role of financial market imperfections
In this section we further investigate the implications of stricter EPL on capital investment and look
at whether the effect of the reform on capital deepening varies with credit availability. As already
mentioned in the introduction, the joint influence of financial and labour markets imperfections on
firm behaviour is the subject of a very limited number of theoretical and empirical studies.17
The basic idea is that credit constrained firms belonging to the treatment group may not be able
17The theoretical impact of imperfect credit and labour markets has been analysed only by Wasmer and Weil (2004)and Rendon (2004), who show that job creation is limited by financing constraints even in the presence of a flexible labourmarket. Empirically, the issue has been tackled by Claessens and Ueda (2008), Calcagnini et al. (2009) and Cingano etal. (2010). Relatedly, Caggese and Cunat (2008) document that, in the presence of costly EPL, financially constrainedItalian SMEs have more volatile employment and rely more heavily on temporary workers than unconstrained ones.
15

Table 4. Effect of the reform at different quantiles of the log capital distribution
(1) (2) (3) (4) (5)
Quantile regressions10 25 50 75 90
Panel A: capital stockSmall firm × Post 1990 0.087∗∗∗ 0.030∗∗∗ 0.037∗∗∗ 0.022∗∗ 0.016
(0.015) (0.007) (0.004) (0.007) (0.013)
Observations 20,235 20,235 20,235 20,235 20,235
Panel B: capital-output ratioSmall firm × Post 1990 0.079∗∗∗ 0.050∗∗∗ 0.059∗∗∗ 0.054∗∗∗ 0.044∗∗∗
(0.016) (0.008) (0.001) (0.010) (0.016)
Observations 20,235 20,235 20,235 20,235 20,235
Panel C: productivitySmall firm × Post 1990 -0.040∗∗∗ -0.017∗ -0.029∗∗∗ -0.033∗∗∗ -0.030∗
(0.012) (0.008) (0.000) (0.007) (0.012)
Observations 20,235 20,235 20,235 20,235 20,235
Notes: Bootstrapped standard errors clustered by firm in parentheses (100 replications). All speci-fications include a third degree polynomial in the size of the firm, firm fixed effects, and sector-yeardummies. One asterisk denotes significance at 5%; two asterisks denote significance at 1%; threeasterisks denotes significance at 0.1%
16

to react to the change in EPL and engage in capital deepening as much as unconstrained firms. This
hypothesis can be tested in our framework considering a triple interaction model. To this purpose, we
draw on the empirical literature on the consequences of financing constraints for investment, started
by Fazzari, Hubbard and Petersen (1988). This literature typically regresses firm investment on a
measure of its investment opportunities (Tobin’s q) and a measure of cash flow, i.e. estimating the
sensitivity of investment to cash flow conditional on expected future profits.
Following that literature, we measure internal funds using cash-flow normalized by fixed assets
(CFjpre =cashflowjpre
FixedAssetsjpre). In order to minimize endogeneity issues both variables are measured in the
pre-reform period, thus considering the availability of internal resources as a firm fixed characteristic.
Measurement of Tobin’s q requires knowledge of the market value of the firm. This piece of information
is not available in our data, as the vast majority of the firms included in our sample is unlisted. For this
reason, in some of our empirical specifications we include Return On Assets (ROAjpre) as a measure
of investment opportunities.
We then focus on the following specification:
log(kjt) = β′Xjt + δ0Post+ δ1D
Sjt + δ2
(DSjt × Post
)+ δ3 (CFjpre) + (3)
+δ4(DSjt × CFjpre
)+ δ5 (CFjpre × Post) + δ6
(CFjpre ×DS
jt × Post)
+ vj + ujt
where the triple interaction term CFjpre ×DSjt × Post pins down the effect of the change in EPL
in firms with different levels of internal resources. In this framework, a positive value of δ6 would
indicate that firms with higher levels of internal resources are better able to increase capital intensity.
We also run quantile regressions to check whether the impact of internal resources is different for
firms at different points of the log capital distribution. Liquidity may indeed be more important for
low-capital intensity firms, which are possibly subject to stricter financial constraints due to the scarce
availability of collateralizable assets.
Let Qθ(log(kjt)|Xjt) for θ ∈ (0, 1) denote the θth quantile of the distribution of log(kjt) conditional
17

on firm characteristics included in the matrix Xjt.18 The model of the conditional quantile is:
Qθ(log(kjt)|Xjt) = β′θXjt + γROAjpre + δ1θDSjt + δ2θ
(DSjt × Post
)+ δ3θCFjpre + (4)
+δ4θ(DSjt × CFjpre
)+ δ5θ (CFjpre × Post) + δ6θ
(CFjpre ×DS
jt × Post)
+ vj
As for equation (2), we assume that the firm fixed effects are pure location shifters (i.e. they are
not quantile-specific), and estimate the above quantile model using the two-step procedure suggested
by Canay (2011).
Table 5 shows results from the estimation of equation (3) in the first column and of equation (4)
in the remaining columns. In all specifications the ratio of Cash-flow to Fixed Assets is normalized
to have zero mean and unit standard deviation. The estimates indicate that, on average, the reform
induces capital deepening in small compared to large firms (consistently with the results in Table
3), with no significant differential effects of cash-flow (column 1). The remaining columns display a
pattern similar to the one in Table 4: the effect of the reform on capital deepening is highest at the 10th
percentile and then decreases along the distribution of log capital reaching zero at the 90th percentile.
Moreover, capital deepening is stronger among firms with more liquid resources up to the percentile
75th of the capital distribution (although the estimated triple interactions are only significant at the
10% level at the 25th and 75th percentiles). Quantitatively, a one standard deviation increase in the
ratio of Cash-flow to Fixed Assets (equal to 0.22, see Table 1) raises the capital stock by 3.5% at the
tenth percentile of the log capital distribution, in small relative to large firms after the reform.
This result suggests that large amounts of liquidity ease the response of firms with a relatively
low capital stock to the change in EPL. The reason may be that firms with little collateralizable
capital may find it difficult to borrow and therefore need to rely on internal liquid resources to raise
the capital stock in response to the increase in EPL. The general implication is that financial market
imperfections hinder firms’ reaction to the increase in firing costs, and therefore amplify the allocative
inefficiencies due to stricter EPL.
18Equation (4) includes the same controls as equation (3), plus firm ROA (measured in the pre-reform period) toaccount for firm profitability. Notice that in equation (3) pre-reform firm ROA is absorbed by the firm fixed effect. Thisis not the case here, despite pre-reform ROA being a time-invariant firm characteristic, because of the non-linear natureof the quantile regression model.
18

Table 5. Differential impact of the reform on log capital stock depending on pre-reform cash-flow
(1) (2) (3) (4) (5) (6)Mean Quantile regressions
Regression 10 25 50 75 90
Small firm × Post 90 0.043∗∗∗ 0.076∗∗∗ 0.027∗∗∗ 0.030∗∗∗ 0.018∗∗ 0.009(0.012) (0.013) (0.007) (0.005) (0.007) (0.015)
Cash-Flow / FA × Small firm × 0.017 0.035∗∗ 0.017 0.020∗∗ 0.021 -0.000Post 90 dummy (0.018) (0.012) (0.009) (0.007) (0.012) (0.023)
Observations 17,055 17,055 17,055 17,055 17,055 17,055
Notes: Robust standard errors clustered by firm in parentheses in column 1. Bootstrapped standarderrors clustered by firm in columns 2-6 (100 replications). All specifications include a third degreepolynomial in the size of the firm, firm fixed effects, sector-year dummies, a full set of interaction termsbetween the ratio of cash-flow to fixed assets (both measured in the pre-reform period), the Post 1990dummy and the small firm dummy. Columns 2-6 add firm ROA measured in the pre-reform period tothe set of controls. One asterisk denotes significance at 5%; two asterisks denote significance at 1%;three asterisks denotes significance at 0.1%.
6 The effect of EPL on seniority
So far, the results on capital deepening and TFP are consistent with any model where dismissal pro-
tection unambiguously reduces allocative efficiency and provides firms with an incentive to substitute
away from labour to other factors of production. In this section we specifically focus on the theoret-
ical predictions of Janiak and Wasmer (2013) and provide additional evidence on the impact of the
reform on the share of high-tenure workers. Janiak and Wasmer (2013) is the first theoretical paper
which explicitly focuses on the link between capital and EPL. Studying a model with matching fric-
tions and bargaining, they show that EPL should generally be expected to decrease the capital-labour
ratio. A positive relationship between EPL and capital intensity can emerge, however, when there
is a complementarity between physical capital and high-tenure workers (who have high firm-specific
human capital): higher EPL reduces turnover and increases the share of senior workers in the firm
thus generating an incentive to invest in complementary physical capital.
In light of these insights, in the following we test whether the 1990 reform also raised workers’
seniority, on average. Because it requires measuring firm-specific tenure for all workers in a firm,
exploring this issue requires a long panel of worker-firm matched data. In Italy, such data is available
from Social Security (INPS) archives covering the universe of firms located in two northern provinces
together with all their employees. Each record in the matched data set describes an employment
19

Table 6. Effect of the reform on the share of workers with high tenure.
(1) (2) (3) (4)Share of Share of Share of Log
Dependent variable workers with workers with workers with averageTen>2yrs Ten>3yrs Ten>4yrs tenure
Small firm × Post 1990 0.021* 0.023* 0.027** 0.032*(0.009) (0.010) (0.010) (0.014)
Small firm -0.008 -0.005 -0.006 -0.007(0.010) (0.010) (0.010) (0.015)
Observations 25,156 25,156 25,156 25,156R-squared 0.662 0.717 0.758 0.879
Notes: Standard errors clustered by firm in parentheses. All specifications include a third degreepolynomial in the size of the firm, firm fixed effects, sector and year dummies. One asterisk denotessignificance at 5%; two asterisks denote significance at 1%; three asterisks denotes significance at 0.1%
relationship, providing information on the number of weeks covered in the position, individual de-
mographics and employer information.19 We use the same selection rules as in the previous sample,
restricting to the period around the reform years (1986-1994, excluding 1990), and to firms with 10-20
employees. The final sample size amounts to around 25,000 observations (6,680 firms).
We estimate the benchmark equation 1 using as dependent variable the share of high seniority
workers within each firm, defined as those with more than 2 years of tenure (here, 2 years is taken to
be the minimal amount of time needed to accumulate significant firm-specific human capital). The
first column of Table 6 indicates that the reform raised this share by around two percentage points
in small relative to large firms. For comparison, the large-small firms share differential before the
reform was of around 4 percentage points. Similar results are obtained changing the threshold used to
identify high seniority workers to 3 and 4 years (columns 2 and 3, respectively).20 We also find that
the increase in EPL raised average firm tenure of around 3% (column 4). Together with the results
on the positive relationship between EPL and capital intensity, the estimated effects on the share of
high-tenured workers are, overall, consistent with the predictions of Janiak and Wasmer (2013).
19The original data cover over 10 million employment relationships and 116,000 firms located in two northern Italianprovinces (Treviso and Vicenza) during more than 20 years (1975-97). Unfortunately, however, they do not includeinformation on firms’ capital stock. For a more detailed data description see Leonardi and Pica (2013) and Cingano andRosolia (2012).
20It is not surprising that the effect on the composition of the workforce appears soon after the reform, at least in firmswith relatively few employees as those under scrutiny, where a reduction in workers’ turnover immediately translates intoa higher share of high-tenured workers.
20
7 Conclusion
Exploiting a law change that raised firing costs for Italian firms below 15 employees, we find a 5%
positive effect of EPL on capital deepening, thus suggesting that stricter job protection induces capital-
labour substitution. We find capital-labour substitution to be mostly concentrated among labour-
intensive firms, possibly because firms with a high share of labour costs are hit harder by changes in
EPL. We inspect the potential explanations of these results along two dimensions.
First, we explore the heterogeneity of the effect of EPL depending on firms’ liquid financial en-
dowments. Among the firms with low capital-labour ratios, we find that the effect is less pronounced
for firms with low internal liquid resources, plausibly because these firms have little capital to pledge
as collateral against lenders and no internal liquid resources to rely upon.
Second, we investigate whether these findings are consistent with Janiak and Wasmer (2013) who
claim that the positive impact of EPL on capital is due to the complementarity between capital and
the amount of labour endowed with firm-specific human capital. Indeed, we find that the reform
positively affects the share of high-tenured workers with high firm-specific human capital who are
likely to be complements with capital investment, thus supporting the Janiak and Wasmer (2013)
channel.
Overall, our evidence points to a mechanism whereby EPL reduces workers’ turnover and increases
the share of high-tenure workers. As a consequence, both the higher relative cost of labour and the
complementarity of high-tenure workers with capital may contribute to induce firms to raise capital
intensity. These results show that capital investment can be an important margin of adjustment in
the face of EPL changes, provided that financial markets imperfections do not hinder firms’ responses.
21

References
[1] Alesina, A. and Zeira, J. (2006). ‘Technology and Labor Regulations’, Harvard Institute of Eco-
nomic Research DP 2123.
[2] Autor, D. H., Donohue, J. J. and Schwab, S. J. (2004). ‘The Employment Consequences of
Wrongful-Discharge Laws: Large, Small, or None at All?’, American Economic Review Papers
and Proceedings, 93(2), May, 440–446.
[3] Autor, D. H., Donohue, J. J. and Schwab, S. J. (2006). ‘The Costs of Wrongful-Discharge Laws’,
Review of Economics and Statistics, 88(2), May, 211–231.
[4] Autor, D. H., Kerr, W. and Kugler, A. (2007). ‘Do Employment Protections Reduce Productivity?
Evidence from U.S. States’, The Economic Journal, 117, F189–F271.
[5] Bartelsman, E. J. and Hinloopen, J. (2005), ‘Unleashing animal spirits: ICT and economic
growth’, in L. Soete and B. ter Weel (eds.), The Economics of the Digital Economy, Edward
Elgar Publishing.
[6] Bauer, T. K., Bender, S. and Bonin, H. (2007). ‘Dismissal Protection and Worker Flows in Small
Establishments’, Economica, 296(74): 804–821.
[7] Belot, M., Boone, J. and van Ours, J. (2007). ‘Welfare effects of employment protection’, Eco-
nomica, 74(295), 381-96
[8] Bentolila, S. and Bertola, G. (1990). ‘Firing Costs and Labour Demand: How Bad Is Eurosclero-
sis?’, Review of Economic Studies, vol. 57(3), pages 381–402.
[9] Bentolila, S. and Dolado, J. J. (1994). ‘Labour flexibility and wages: lessons from Spain’, Eco-
nomic Policy, 18, 53–100.
[10] Bertola, G. (2004). ‘A Pure Theory of Job Security and Labor Income Risk’, Review of Economic
Studies, 71(1), 43–61.
[11] Bertola, G. and Rogerson, R. (1997). ‘Institutions and Labour Reallocation’, European Economic
Review, 41(6), June, 1147–1171.
22

[12] Bird, R. C. and Knopf, J. D. (2009). ‘Do Wrongful Discharge Laws Impair Firm Performance?’,
Journal of Law and Economics, 52(2), 197–222.
[13] Blanchard, O. and Portugal, P. (2001). ‘What Hides Behind an Unemployment Rate: Comparing
Portuguese and U.S. Labor Markets’, American Economic Review, 91(1): 187-207.
[14] Boeri, T. and Jimeno, J. F. (2005). ‘The Effects of Employment Protection: Learning from
Variable Enforcement’, European Economic Review, 49(8), 2057–2077
[15] Borgarello, A., Garibaldi, P. and Pacelli, L. (2004). ‘Employment Protection Legislation and the
Size of Firms’, Il Giornale degli Economisti, 63(1), 33–66.
[16] Bronzini, R. and De Blasio, G. (2006). ‘Evaluating the impact of investment incentives: The case
of Italy’s Law 488/1992’, Journal of Urban Economics, 60, 327–349
[17] Bronzini, R., De Blasio, G., Pellegrini, G. and Scognamiglio, A. (2008). ‘The effect of investment
tax credit: Evidence from an atypical programme in Italy’, Temi di discussione 661, Bank of
Italy.
[18] Caballero, R. J. and Hammour, M. (1998). ‘Jobless Growth: Appropriability, Factor Substitution
and Unemployment’, Carnegie-Rochester Conference Proceedings, 48, pp. 51–94.
[19] Caggese, A. and Cunat, V. (2008). ‘Financing Constraints and Fixed-Term Employment Con-
tracts’, Economic Journal, 118(533), 2013–2046.
[20] Calcagnini, G., Giombini G. and Saltari, E. (2009). ‘Financial and labour market imperfections
and investment’, Economics Letters, 102(1), 22–26.
[21] Canay, I. A. (2011). ‘A simple approach to quantile regression for panel data’, Econometrics
Journal, 14, 368–386
[22] Cervini Pla, M., Ramos, X. and Silva, J. I. (2010). ‘Wage Effects of Non-Wage Labour Costs’,
IZA DP. 4882.
[23] Cingano, F. and Rosolia, A. (2012). ‘People I Know: Job Search and Social Networks’, Journal
of Labor Economics, 30(2), pages 291–332.
23

[24] Cingano, F., Leonardi, M., Messina, J. and Pica, G. (2010). ‘The Effect of Employment Protection
Legislation and Financial Market Imperfections on Investment: Evidence from a Firm-Level Panel
of EU Countries’, Economic Policy, Volume 25, Issue 61, 117–163.
[25] Claessens, S. and Ueda, K. (2008). ‘Banks and Labor as Stakeholders: Impact on Economic
Performance’, IMF Working Papers 08/229, International Monetary Fund.
[26] Cohen, D. and Cummins, J. (2006). ‘A Retrospective Evaluation of the Effects of Temporary
Partial Expensing’, Finance and Economics Discussion Series 2006-19, Federal Reserve Board,
Washington D. C.
[27] Fazzari, S., Hubbard, G. and Petersen, B. (1988). ‘Financing Constraints and Corporate Invest-
ment’, Brookings Papers on Economic Activity, 141–195.
[28] Garibaldi, P. and Violante, G. (2005). ‘The Employment Effects of Severance Payments with
Wage Rigidities’, Economic Journal, 115 (October), 799–832.
[29] Garicano, L., Lelarge, C. and Van Reenen, J. (2012). ‘Firm Size Distortions and the Productivity
Distribution: Evidence from France’, IZA Discussion Paper No. 7241.
[30] Gomez-Salvador, R., Messina, J. and Vallanti, G. (2004). ‘Gross job flows and institutions in
Europe’, Labour Economics, Volume 11, Issue 4, 469–485.
[31] Goolsbee, A. (1998). ‘Investment Tax Incentives, Prices, and the Supply of Capital Goods’,
Quarterly Journal of Economics, 113(1),121–148.
[32] Hijzen, A., Mondauto, L. and Scarpetta, S. (2013). ‘The Perverse Effects of Job-Security Provi-
sions on Job Security in Italy: Results from a Regression Discontinuity Design’, IZA Discussion
Paper No. 7594.
[33] House, C. L. and Shapiro, M. (2008). ‘Temporary Investment Tax Incentives: Theory with Evi-
dence from Bonus Depreciation’, American Economic Review, 98(3): 737–68.
[34] Ichino, A. and Riphahn, R. (2005). ‘The effect of employment protection on worker effort: absen-
teeism during and after probation’, Journal of the European Economic Association, 1, 120–143.
[35] Janiak, A. and Etienne Wasmer (2012). EPL and capital-labour ratios’, Universidad de Chile,
Documentos de Trabajo 288.
24

[36] Koeniger, W. and Leonardi, M. (2007). ‘Capital Deepening and Wage Differentials: Germany vs.
US.’, Economic Policy, 22(49), 71–116.
[37] Kugler, A. and Pica, G. (2008). ‘Effects of Employment Protection on Worker and Job Flows:
Evidence from the 1990 Italian Reform’, Labour Economics, Volume 15, Issue 1, pp. 78–95.
[38] Kugler, A. and Saint-Paul, G. (2004). ‘How Do Firing Costs Affect Worker Flows in a World with
Adverse Selection?’, Journal of Labor Economics, 22(3), 553–584.
[39] Lagos, R. (2006). ‘A model of TFP’, Review of Economic Studies, 73(4), 983-1007.
[40] Lazear, E. (1990). ‘Job Security Provisions and Employment’, Quarterly Journal of Economics,
105(3), 699–726.
[41] Leonardi, M. and Pica, M. (2013). ‘Who Pays for it? The Heterogeneous Wage Effects of Em-
ployment Protection Legislation’, Economic Journal, Volume 123, Issue 573, 1236–1278.
[42] Marinescu, I. (2009). ‘Job Security Legislation and Job Duration: Evidence from the U.K.’,
Journal of Labor Economics, vol. 27, no. 3, 475–486.
[43] Martins, P. (2009). ‘Dismissals for Cause: The Difference That Just Eight Paragraphs Can Make’,
Journal of Labor Economics, 27(2), 257–279.
[44] Messina, J and Vallanti, J. (2007). ‘Job Flow Dynamics and Firing Restrictions: Evidence from
Europe’, Economic Journal, Volume 117, Issue 521, 279–301.
[45] Rendon, S. (2004). ‘Job Creation and Investment in Imperfect Capital and Labor Markets’, Eco-
nomic Working Papers at Centro de Estudios Andaluces E2004/35, Centro de Estudios Andaluces.
[46] Schivardi, F. and Torrini, R. (2008). ‘Identifying the effects of firing restrictions through size-
contingent differences in regulation’, Labour Economics, 15(3), 482–511.
[47] Skedinger, P. (2011). ‘Employment Consequences of Employment Protection Legislation’, Nordic
Economic Policy Review, 1, 45–83.
[48] Stole, L. A. and Zwiebel, J. (1996a). ‘Intra-Firm Bargaining under Non-Binding Contracts’, The
Review of Economic Studies, 63, 375–410.
25

[49] Stole, L. A. and Zwiebel, J. (1996b). ‘Organizational Design and Technology Choice under In-
trafirm Bargaining’, The American Economic Review, 86(1), 195–222.
[50] Van der Wiel, K. (2010). ‘Better Protected, Better Paid: Evidence on how Employment Protection
Affects Wages’, Labour Economics, 7(1), 829–849.
[51] Wasmer, E. (2006). ‘Interpreting Europe–US labour market differences: the specificity of human
capital investments’, American Economic Review, 96(3), 811–31.
[52] Wasmer, E. and Weil, P. (2004). ‘The Macroeconomics of Labor and Credit Market Imperfections’,
American Economic Review, 94(4), 944–963.
26

A Appendix
This appendix contains evidence on the sorting behaviour of firms around the 15-employee threshold
(Section A.1) and a battery of robustness checks (Section A.2).
A.1 Firm sorting
This section investigates whether firms tend to sort above and below the 15-employee threshold,
according to pre-existing observable and unobservable characteristics, before and after the 1990 reform.
To do so, we first compute for each firm the average capital stock before 1990 (the reform year)
and use this time-invariant firm characteristic as one of the determinants of the firm probability of
growing. We exploit the unique opportunity of observing firms’ capital stock to build a variable which
should capture hitherto unobserved firms’ characteristics within the following linear probability model:
djt = β′Xjt + δ0Post+ δ1Sizedummyjt−1 + δ2kpre,j + α0 (Sizedummyjt−1 × Post) (5)
+α1
(kpre,j × Post
)+ α2
(Sizedummyjt−1 × Post× kpre,j
)+ ηj + εjt,
where djt = 1 if firm j in year t has a larger size than in t − 1. The term Sizedummyjt−1 denotes a
set of firm size dummies while the variable Post takes the value of one from 1991. The term kpre,j
denotes the estimated time-invariant average pre-reform capital stock. The matrix Xjt includes year
dummies, sector dummies and a polynomial in lagged firm size. Finally, we also include firm fixed
effects to account for firm-specific time-invariant factors that affect firms’ propensity to grow.
The first two columns in Table A.1 show that the probability of expansion of firms just below
15 employees is not significantly different from that of other firms (col. 1), and that such transition
probability is not significantly affected by the reform (col. 2). Both results are important to our
analysis as they suggest that firms are not reluctant to pass the threshold before the reform, and that
the reform itself does not change 15-employee firms’ propensity to grow. In other words, they suggest
that the reform did not provide firms with incentives to select into or out of treatment. However,
what ultimately matters for our estimates is that the reform did not induce changes in the underlying
composition of firms around the threshold in terms of unobserved characteristics that are correlated
with the outcome of interest. In columns 3 and 4 we provide further supporting evidence that this
is not the case, focusing on the case of capital intensity. Evidence that high capital intensity firms
27

Table A.1. Firm Sorting
(1) (2) (3) (4)
Dummy 13 -0.016 -0.033 -0.129 -0.119(0.016) (0.024) (0.118) (0.186)
Dummy 14 -0.002 -0.012 -0.131 -0.147(0.016) (0.026) (0.128) (0.185)
Dummy 15 -0.014 -0.054 -0.020 -0.113(0.017) (0.028) (0.132) (0.225)
Post 1990 ×kpre,j 0.006(0.014)
kpre,j× Dummy 13 0.018 0.014(0.018) (0.028)
kpre,j× Dummy 14 0.019 0.021(0.020) (0.028)
kpre,j× Dummy 15 0.000 0.009(0.020) (0.034)
Post 1990 × Dummy 13 0.028 -0.032(0.031) (0.240)
Post 1990 × Dummy 14 0.017 0.027(0.032) (0.229)
Post 1990 × Dummy 15 0.063 0.129(0.034) (0.268)
kpre,j× Post 1990 × Dummy 13 0.010(0.036)
kpre,j× Post 1990 × Dummy 14 -0.003(0.035)
kpre,j× Post 1990 × Dummy 15 -0.011(0.040)
Observations 15,262 15,262 13,303 13,303R-squared 0.160 0.160 0.162 0.163Number of firms 5,272 5,272 4,198 4,198
Notes: The dependent variable is a dummy that takes the value of 1 if in firm j employment at timet is larger than employment at time t − 1, and 0 otherwise. Firms between 10 and 20 workers areincluded. All specifications include a third degree polynomial in lagged firm size, sector dummies andyear dummies. One asterisk denotes significance at 5%; two asterisks denote significance at 1%; threeasterisks denotes significance at 0.1%.
28

Figure A.1. EPL reform, changes in employment and firm size
Notes: the dots are the observed differences between the post-reform log employment (averaged over the years indicatedin parenthesis) minus the pre-reform log employment of year 1989. The solid line is a fitted regression of log employmentdifferences on firm size, performed separately on either side of the threshold.
(as measured by their pre-reform average capital stock) are disproportionately more likely to pass the
threshold as a consequence of the reform would cast doubts on the reliability of our exercise. However,
we do not find evidence that the growth probability depends on pre-reform capital intensity (either
before or after the reform).
As a final check, Figure A.1 plots the difference in log employment log(e) against firm size con-
firming that there is no discontinuity at the 15 employees threshold in the growth rate of firms before
and after the reform.
A.2 Robustness checks
This section contains a battery of robustness checks briefly discussed in the main text. For brevity,
we focus on our main variable of interest, log capital.
First, we relax the time period (Table A.2) and the size range (Table A.3) of the analysis. The
results are qualitatively similar to those in Table 3, confirming the positive effect of the reform on
capital intensity.
In Table A.4 we implement placebo tests by estimating the treatment effect at fake firm size
29

Table A.2. Robustness to different time periods: dependent variable log(kjt)
(1) (2) (3) (4) (5) (6) (7)Time period 1986-94 1987-92 1988-92 1989-93 1988-93 1987-94 1988-94
Small firm × Post 1990 0.047∗∗∗ 0.041∗∗∗ 0.041∗∗∗ 0.046∗∗∗ 0.043∗∗∗ 0.043∗∗∗ 0.047∗∗∗
(0.012) (0.012) (0.012) (0.013) (0.013) (0.012) (0.013)Small firm -0.045∗∗∗ -0.045∗∗ -0.049∗∗ -0.048∗∗ -0.045∗∗ -0.043∗∗ -0.048∗∗
(0.013) (0.015) (0.017) (0.018) (0.016) (0.014) (0.016)
Observations 20,235 12,855 10,608 10,952 13,243 18,069 15,822R-squared 0.164 0.136 0.134 0.120 0.137 0.157 0.155
Notes: Robust standard errors clustered by firm in parentheses. The first column includes 1990. Allspecifications include a third degree polynomial in the size of the firm, firm fixed effects, and sector-year dummies. One asterisk denotes significance at 5%; two asterisks denote significance at 1%; threeasterisks denotes significance at 0.1%.
thresholds and fake reform years, where there should be no effect. We estimate the treatment effect
below and above the fake 12 and 18 employees thresholds. In Columns 1 and 2 we estimate the
treatment effect before and after the fake reform years 1988 and 1992 (excluding in turn the fake
year of the reform as we did with 1990 in Table 3). The interaction between the small firm and the
post-reform dummy is not significant. This implies that the effect on capital is not a mechanical a
convergence effect, due to firms with less capital accumulating it faster. Columns 3 and 4 show that
the fake firm size threshold is still positive and slightly significant when considering the 12-employee
threshold, but it is no longer significant at 18 employees.
Finally, Table A.5 shows results from weighted regressions to account for the possibility that the
Company Accounts Data Service undersamples small firms, which are more likely to be financially
constrained and less likely to show up in the data set. Regression weights by firm size are given by
the ratio between the total number of firms in the economy (from Social Security Records) and the
number of firms in the Company Accounts Data Service. Results are qualitatively similar to those
shown in Table 3 suggesting that the undersampling of smaller firms is not a major issue within our
narrow 10-20 firm-size window.
30

Table A.3. Robustness to different size ranges: dependent variable log(kjt)
(1) (2) (3) (4) (5)Size range 5-20 5-30 5-25 10-25 10-35
Small firm × Post 1990 0.049∗∗∗ 0.052∗∗∗ 0.054∗∗∗ 0.051∗∗∗ 0.043∗∗∗
(0.012) (0.010) (0.011) (0.012) (0.011)Small firm -0.040∗∗∗ -0.040∗∗∗ -0.043∗∗∗ -0.040∗∗∗ -0.038∗∗∗
(0.012) (0.011) (0.011) (0.011) (0.011)
Observations 26,477 42,541 34,663 28,421 44,403R-squared 0.190 0.200 0.194 0.173 0.199
Notes: Robust standard errors clustered by firm in parentheses. All specifications include a thirddegree polynomial in the size of the firm, firm fixed effects, and sector-year dummies. One asteriskdenotes significance at 10%; two asterisks denote significance at 5%; three asterisks denotes significanceat 1%.
Table A.4. Falsification: fake firm size threshold and fake reform years. Dependent variable log(kjt)
(1) (2) (3) (4)
Fake reform year Fake firm size threshold1988 1992 12 employees 18 employees
Small firm × post 1988 -0.012(0.011)
Small firm × post 1992 0.0250.014)
Small firm 12 × post 1990 0.034∗
(0.017)Small firm 18 × post 1990 0.016
(0.014)
Observations 20,764 20,291 20,235 20,235R-squared 0.155 0.163 0.154 0.162
Notes: Robust standard errors clustered by firm in parentheses. All specifications include a thirddegree polynomial in the size of the firm, firm fixed effects, and sector-year dummies. One asteriskdenotes significance at 5%; two asterisks denote significance at 1%; three asterisks denotes significanceat 0.1%.
31
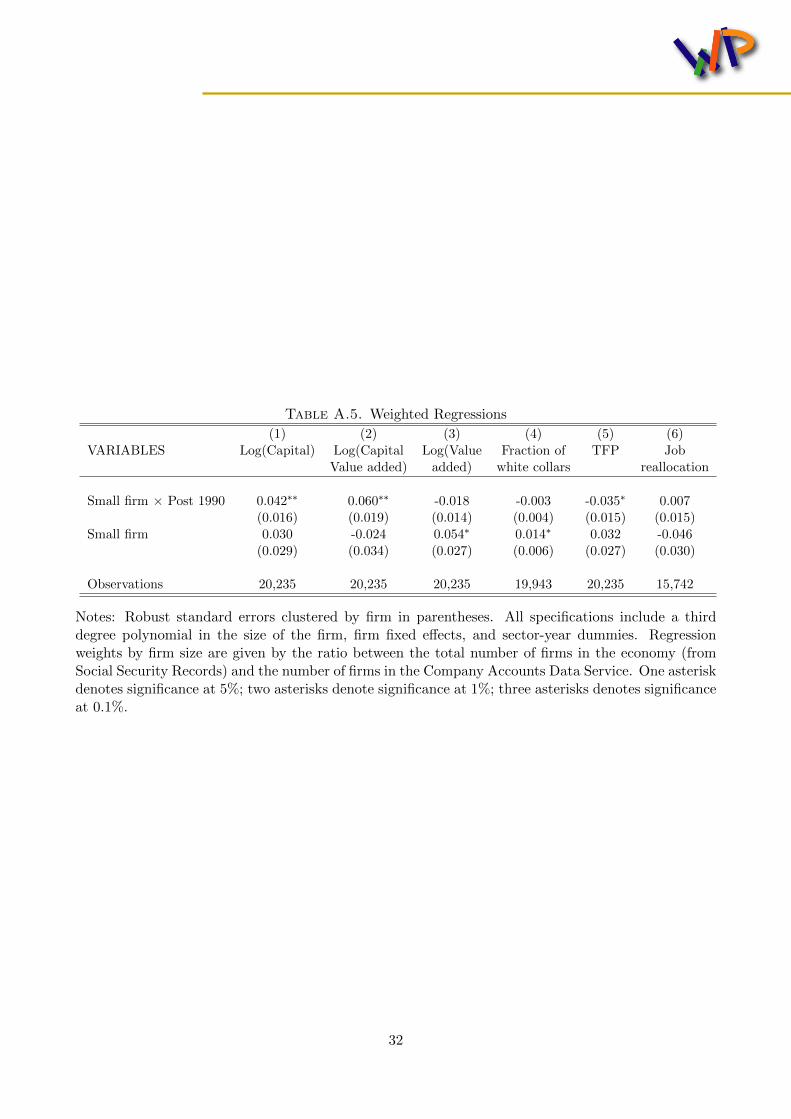
Table A.5. Weighted Regressions
(1) (2) (3) (4) (5) (6)VARIABLES Log(Capital) Log(Capital Log(Value Fraction of TFP Job
Value added) added) white collars reallocation
Small firm × Post 1990 0.042∗∗ 0.060∗∗ -0.018 -0.003 -0.035∗ 0.007(0.016) (0.019) (0.014) (0.004) (0.015) (0.015)
Small firm 0.030 -0.024 0.054∗ 0.014∗ 0.032 -0.046(0.029) (0.034) (0.027) (0.006) (0.027) (0.030)
Observations 20,235 20,235 20,235 19,943 20,235 15,742
Notes: Robust standard errors clustered by firm in parentheses. All specifications include a thirddegree polynomial in the size of the firm, firm fixed effects, and sector-year dummies. Regressionweights by firm size are given by the ratio between the total number of firms in the economy (fromSocial Security Records) and the number of firms in the Company Accounts Data Service. One asteriskdenotes significance at 5%; two asterisks denote significance at 1%; three asterisks denotes significanceat 0.1%.
32


Ministry of Economy and Finance
Department of the Treasury
Directorate I: Economic and Financial Analysis
Address: Via XX Settembre, 97 00187 - Rome Websites: www.mef.gov.it www.dt.tesoro.it e-mail: [email protected] Telephone: +39 06 47614202 +39 06 47614197 Fax:
+39 06 47821886