empowered investment tracker
TRANSCRIPT

Regd. Office: 112 J.C. Road, Bangalore - 560002
For enquiry, please call - 1800-103-0003 / 1800-180-0003 or visit us at: www.canarahsbclife.com
Disclosures:
The various funds offered are the names of the funds and do not, in any way indicate the quality of these funds, their future prospects and returns.
Unit Linked Life Insurance products are different from traditional insurance products and are subject to risk factors.
Unit Linked Funds are subject to market risks and there is no assurance or guarantee that the objective of the investment fund will be achieved.
Past performance of the investment funds do not indicate the future performance of the same. Investors in the Scheme are not being offered any guaranteed / assured results.
The premiums paid in Unit-Linked Life Insurance policies are subject to investment risk associated with capital markets. The NAVs of the units may go up or down based on the performance of the fund and factors influencing the capital market and the insured is responsible for his/her decisions.
The investment risk in Investment Portfolio is borne by the policyholder.
For more details on risk factors, terms and conditions please read sales brochure carefully before concluding a sale.
Insurance is the subject matter of the solicitation.
The SFIN (Segregated Fund Index Number) for Equity Fund is ULIF00116/06/08EQUITYFUND136, Equity II Fund is ULIF00607/01/10EQUTYIIFND136, Growth Fund is ULIF00216/06/08GROWTHFUND136, Growth II Fund is ULIF00707/01/10GROWTIIFND136, Growth Plus Fund is ULIF00913/09/10GROWTPLFND136, Balanced Fund is ULIF00316/06/08BLNCEDFUND136, Balanced II Fund is ULIF00807/01/10BLNCDIIFND136, Balanced Plus Fund is ULIF01013/09/10BLNCDPLFND136, Debt Fund is ULIF00409/07/08INDEBTFUND136, Debt Plus Fund is ULIF01115/09/10DEBTPLFUND136, Liquid Fund is ULIF00514/07/08LIQUIDFUND136 and NAV Guarantee Fund Series 1 is ULIF01215/04/11NAVGFUNDSI136.
Disclaimer:
Benchmark indices provided by CRISIL - CRISIL indices are the sole property of CRISIL Limited (CRISIL). CRISIL indices shall not be copied, retransmitted or redistributed in any manner for any commercial use. CRISIL has taken due care and caution in computation of indices based on data obtained from sources, which it considers reliable. However, CRISIL does not guarantee the accuracy, adequacy or completeness of the indices and is not responsible for any errors or for the results obtained from the use of the indices. CRISIL especially states that it has no financial liability whatsoever to the users of CRISIL indices.
MSCNJINVSEP11 ENG
Canara HSBC Oriental Bank Of Commerce Life Insurance Company Limited (Regn. No. 136)Unitech Trade Centre, 2nd Floor, Sushant Lok, Phase-1, Sector-43, Gurgaon - 122009 Haryana, India.
C O N T E N T S
Unit Linked Equity & Equity II Funds
Unit Linked Debt & Debt Plus Funds
Unit Linked Growth Fund
From the CIO’s Desk
01 04 06
11 Unit Linked Liquid Fund& NAV Guarantee FundSeries 1
10
Insurance Update
Planning for your children's education
03 05 Unit Linked Balanced, Balanced II & Balanced Plus Funds
07 12 Life Insurance Simulator
(LIS)
Unit Linked Growth II, & Growth Plus Funds
Ritu AroraChief Investment Officer,Canara HSBC Oriental Bank of Commerce Life Insurance Company Limited
low leverage, it is better placed to not just cater to the current requirement
of supply-enhancing investments but to carry out large investments in the
future too. However, there is increasing evidence that investment
expenditure in the economy is slowing down. Corporates across the
board are reporting slowdown in investments as existing projects get
stranded while new project announcements are deferred. It seems while
demand remains strong, corporates are increasingly challenged by the
lack of approvals and activism for the environment, the retrospective
application of which is causing severe problems for those whose
projects are already underway or nearing completion.
The slew of scams hitting India during the past few months is perhaps
leading to a shift in the way new project approvals are granted and the
corporate sector seems to be waiting on the sidelines. However, coming
as it does at a time where demand has already galloped well ahead of
supply and stretched infrastructure to its limits, it is leading to a delayed
response by the supply side causing further inflation. These circumstances
leave the Reserve Bank of India with little choice than to raise interest
rates in order to reign in demand and consequently inflation.
The key point to note in all this though is that unlike the developed
economies, in India's case it is the supply side inability to match up to
demand which is creating problems. Therefore, despite all problems
mentioned above I believe India's fundamental story remains intact. For a
long term investor the current situation provides an opportunity to enter
the Indian markets at relatively benign valuations as markets have started
factoring in most of the negatives already. It is important to remember that
India offers a structural growth story and while equity markets may move
up or down in the interim, in the long run they should reward investors by
delivering higher returns than most other asset classes.
Equity Way Forward
The Q2FY12 result season is around the corner. We believe pressure on
corporate results would continue and results could come in below the market's
expectations. The Corporate result performance of Q2FY12 would be crucial to
decide further course of the market. Equity market is trading at 14.0x FY12 and
12.0x FY13 expected earnings, which is attractive vis-à-vis history.
Dear Policyholder,
The volatility in global markets continued during the last 6
months. It has been a somber period for the global
economy with a long string of negative news flow. While
Sovereign Debt default has come to the forefront once
again in Europe, a faltering economic growth in the US has
ignited worries of a double dip recession. Murmurs out of
China of rising Non-Performing Assets (NPAs) in the
banking system have put to challenge the often repeated
view that China is heading for a soft landing. India has not
been spared either, but its problems are caused more by
inflation and the perception of Governance Deficit at the
Centre. The steady flow of scams and the perception of
Government’s inability to take and carry through with its
reforms have created a crisis of confidence in the markets
and business in general.
Structurally, India is a dream economy relative to the
developed world. In a scenario where the developed
world is struggling for growth with high debt and an ageing
population, India's young population has taken demand to
a level where supply has fallen far behind. With its relative
SEPTEMBER 2011
Investmenttracker
empowered

% Change
Source: Bloomberg
Mar 31, 2011 Sep 30, 2011
Sensex
Dow Jones
Nasdaq
Nikkei
Hang Seng
Kospi
Shanghai
Nifty 5,833.8
19,445.2
12,319.7
2,781.1
9,755.1
23,527.5
2,106.7
2,928.1
4,943.3
16,453.8
10,913.4
24,15.4
8,700.3
17,592.4
1,769.7
2,359.2
-15.3%
-15.4%
-11.4%
-13.1%
-10.8%
-25.2%
-16.0%
-19.4%
empowered
02
The slowdown in investment and GDP could lead to some more pain
in the near term. However, in the medium to long term a stalling US
economy, faltering Euro growth rates and most importantly a slowing
Chinese economy offers perhaps the best macro environment for India
to ride through its inflation problem. Crude oil and all other commodities
are off their peaks. This is very positive for commodity intensive Indian
economy and could bring down inflation and fiscal deficit. It may also
provide RBI with a reason to put brakes on further rate increases.
Compared to developed world growth of sub 2% growth, India's 7%
plus growth will lead to it being favored by investors.
Equity Markets: Our Strategy
Beyond the heightened volatility being witnessed in the equity market in
the short term due to both global uncertainty and domestic growth
pressure, select pockets are presenting interesting opportunities. Post
the RBI rate hikes, domestic growth oriented stocks have corrected
substantially and valuations there are reasonably attractive. This move
gives us opportunity to gradually nibble into these stocks, which have
potential to generate superior returns from a medium term perspective.
We continue to remain invested mostly in large cap, blue chip, stable
companies with good earnings visibility, and have select exposure to high
quality midcap companies.
Currently we're underweight financials with preference for private
sector names, overweight pharmaceuticals, remaining neutral to
underweight IT and automobiles, engineering and construction sectors
and underweight metals. We continue to maintain a disciplined approach
towards our investments.
Fixed Income: Market Update
RBI announced the borrowing calendar for the second half of the fiscal FY
2011-12 with an increased borrowing of Rs. 53,000 crores. Domestic
fixed income markets had already been struggling with the high inflationary
expectations and RBI's Monetary Policy stance. With the increased
borrowing having been announced in the calendar year itself, the yields in
the market have already moved up.
The Financial Year 2011-12 had started with RBI's strict stance on inflation
but with a comfortable fiscal deficit scenario due to the 3G auction inflows
last year. The new 10 year benchmark Government of India Security
(GSec) which was issued in the month of April 2011 had the same cut off
as was last year in 2010 at 7.80%. The financial year started with the 10
year Gsec at 7.98% and since the yield has been moving upwards only
with short term volatile movements. The 10 year Gsec ended the fiscal
half year at 8.44% as the Government announced its intention to borrow
higher than indicated earlier.
Global growth has been faltering with both US and the Eurozone
witnessing faltering growth rates. Yields on US Government treasury
bonds have witnessed a sharp fall, despite a downgrade in the sovereign
rating by Standards and Poor as investors flocked to safety. India's growth
in the first quarter of FY12 at 7.7% was one of the lowest in recent years.
Despite the softening in the growth, RBI has continued to maintain its
aggressive stance on the monetary policy. RBI has continued to emphasize
on the importance of controlling inflationary expectations even at the cost
of short term growth.
Fixed Income: Way Forward
With the increased borrowing numbers and the high inflationary
expectations, we can expect the government securities to be under
supply pressure and hence yields could go up higher from here. Banks
are already maintaining excess Statutory Liquidity ratio, which requires
them to invest in Government securities and therefore Government
security demand from banks is likely to be limited.
The incoming softer numbers on the domestic economy are unlikely to
have any effect on the RBI's stance of raising rates to control inflationary
expectations. The yields could see some further upward bias from the
current levels before any retracements.
Fixed Income: Our Strategy
We stand committed to investing in high credit quality papers. The funds
will primarily invest in a portfolio of high quality bonds and other fixed and
floating rate securities issued by the Government, Government agencies
and corporate issuers. To maintain liquidity the funds will also invest in
cash and money market instruments.
Ritu AroraChief Investment Officer,Canara HSBC Oriental Bank of Commerce Life Insurance Company Limited
Source: Bloomberg
49.0
25,951.0
8.4
104.3
-9.0%
25.0%
5.5%
-11.1%
Mar 31, 2011 % Change
US$ Vs. INR`Gold (`/10 gms)
10 Yr G-sec Yield (%)
Oil $/bbl
Sep 30, 2011
44.6
20,760.0
8.0
117.3
Source: Bloomberg
India 10 Yr Govt Bond Yield
7.5
7.7
7.9
8.1
8.3
8.5
8.7
Oct
-10
Nov-
10
Dec-
10
Jan-1
1
Feb-1
1
Mar-
11
Apr-
11
May-
11
Jun-1
1
Jul-11
Aug-1
1
Sep-1
1
Source: Bloomberg
NIFTY Index
SENSEX Index (RHS)
14000
15000
16000
17000
18000
19000
20000
21000
22000
4000
4500
5000
5500
6000
6500
Oct
-10
Nov-
10
Dec-
10
Jan-1
1
Feb-1
1
Mar-
11
Apr-
11
May-
11
Jun-1
1
Jul-11
Aug-1
1
Sep-1
1
empowered
03
INSURANCE UPDATEPlanning for your children's education
Age of your child when you start investing (yrs)
Annual Investment (`)
Total investment (`)
Wealth built when your child is of 20 yrs (`)
0 15,000
3,00,000 9,45,037
10 30,000 3,00,000 5,25,935
(Assuming a 10% rate of return)
Right from the time of birth, parents begin contemplating which nursery,
school, or college their child would go to, or what profession she would
assume. It is only crucial to start investing well in time for your child's
education as life's uncertainties like your unfortunate death or loss of
income can seriously disrupt your child's dreams. Ensuring adequate
funds at critical stages of your child's life will put him/her on a safe track to
a secured future. Besides, with inflation eating up your savings, realizing
your child's dreams is getting more expensive with each passing day.
Spiralling costs of education
Recent ASSOCHAM findings suggest that parents spend an average
60% of their income on their children's education. The report highlights
that cost of school education on a single child has doubled during
2005-2011 with parents spending an average 20-25 lakh on their child
by the time she passes out the high school. Not only school, but also
professional courses are likely to cost much more in the future.
A professional course costing, say ` 3 lakh today would cost close to
`13 lakh in the next 25 years.
When to begin?
Start investing early - it will let your investments grow through the magic
of compounding. As you earn interest on your investments, it gets added
to your original investment, thus letting you earn interest on your interest
earned. The longer your investment period, the more interest you earn,
which helps you in creating a larger corpus for your child's education.
Furthermore, as your child grows, so would the expenses, leaving you
with lesser amount to invest, which makes it sensible to start investing
right away.
If you invest ` 15,000 every year in an investment with 10% rate of
return per annum, right at the time of your child's birth, you would be
able to garner more funds than if you started investing at a later stage.
Building a strategy
Goal posts - Chart out your child's educational span into various stages
and estimate the amount of funds you would require at each stage and
the time horizon to the goal.
Recently, Canara HSBC Oriental Bank of Commerce Life Insurance
Company Limited introduced unique user-friendly software to help its
customers in their financial planning. Life Insurance Simulator (LIS), is an
interactive, voice-activated financial need assessment software
specifically designed to communicate with the customers and guide
them through their financial planning process in following steps:
(a) Understanding various financial needs - Family Protection, Child's
Future, Wealth Creation & Retirement (b) Assessing the amount of
savings one has planned to secure a particular financial need (c) Assessing
the amount, one would actually require to secure that need
(d) Educating customers the need for adequate services by highlighting
the importance of planning early and the deficiencies between his
current plan and actual need
Empowered to communicate in English, Hindi, Punjabi and Kannada, LIS
would be able to connect with a wide spectrum of customers, helping
them understand their investment needs, thus offering them more
focused insurance-need based analysis solution. You can access LIS at
www.canarahsbclife.com
Get real - Factor in the effects of inflation on your investments. Even if
your investments are yielding decent returns, it would be in vain if the
inflation rate is higher than your returns. Real return is the actual payback
on the investment after adjusting for inflation.
Get going - Access your financial health and arrive at the amount you
would be comfortable investing every month. Now, based on the
required funds and monthly investments, estimate the kind of returns
you would need to reach the desired amount in the expected period of
time. Next, choose the investment options available based on your
individual risk appetite and the desired returns.
Investment Options
You can choose to invest in equities, debt instruments, mutual funds,
gold, etc. However, each of these has a different risk-return profile.
Assess your own risk taking capability before investing.
Planning through child plans - Child insurance plans are life-insurance
policies specially designed to meet your child's future needs, even in your
absence. There are also money-back plans that let you withdraw funds at
critical milestones of your child's life besides, being tax-efficient. You can
invest in Canara HSBC Oriental Bank of Commerce Life Insurance
Company Ltd.’s Future Smart Plan, which is a unit-linked child plan that
provides long-term investment opportunity to build a corpus for your
child's future. In case of your unfortunate demise or disability, your child
would be paid a sum assured to ensure that his future is secured.
Besides, the plan also pays the outstanding premiums payable on the
policy, thus providing your child with a comprehensive insurance cover.
Importance of Term Insurance - Term plans can also be a cost-efficient
way to provide enhanced coverage to your young ones. The plan covers
the risk of your untimely death during a specific period, at low costs.
Checklist:
Plan ahead in time for your child's future
Enlist your child's educational goals in monetary terms along with
the time horizon
Do not forget to factor in the effect of inflation on your savings
Assess your risk appetite and the risk profile of various assets available
Invest regularly, even if it is in small doses. Investing regularly, albeit
in small proportions, over long-term can help build higher corpus
Review your portfolio regularly for your desired returns; make
appropriate changes accordingly
Contributed by Dun & Bradstreet IndiaThe views expressed above are those of Dun & Bradstreet. This communication does not constitute insurance/investment advice or an offer to sell, or a solicitation or an offer to purchase or subscribe to any product. Opinions expressed herein do not have regard to specific investment objectives, financial situation and the particular needs of any specific person who may receive this publication.
300,000
537,254
718,967
962,141
1,287,561
-
200,000
400,000
600,000
800,000
1,000,000
1,200,000
1,400,000
Today In 10 years 15 years 20 years 25 years
Cost of Education
(Assuming an annual inflation rate of 6%)

Money Market 0% - 40%
Equity and Equity Related Instruments 60% - 100%
Asset Allocation Pattern
empowered
04
UNIT LINKED EQUITY AND EQUITY II FUNDS
Inception Date: 16-Jun-08
The Fund’s primary objective is to have high capital appreciation through investment in equities. To maintain liquidity the fund will invest in cash and money market instruments. Risk Profile - High
Unit Linked Equity and Equity II Funds
UNIT LINKED EQUITY II FUND Inception Date: 07-Jan-10
All rated fixed income instruments are AAA/P1+ or equivalent.Past performance is not indicative of future performance.
Fund Performance as on 30-Sep-2011
Last One Year CAGR (since Inception)
-21.8% -19.6% -3.9%
Fund Benchmark Fund Benchmark
Benchmark return has been computed by applying benchmark weightages of 100% S&P CNX Nifty Index
-3.6%
EQUITY
4
6
8
10
12
14
16
16Jun08
16Sep08
16Dec08
16Mar09
16Jun09
16Sep09
16Dec09
16Mar10
16Jun10
16Sep10
16Dec10
16Mar11
16Jun11
16Sep11
30Sep11
11.602
NAV Movement
EQUITY II
NAV Movement
4
6
8
10
12
14
07Jan10
07Mar10
07May10
07Jul10
07Sep10
07Nov10
07Jan11
07Mar11
07May11
07Jul11
07Sep11
30Sep11
9.34
Portfolio as on September 30, 2011 %EQUITY
TOTAL
RELIANCE INDUSTRIES LTD
I T C LTD
HDFC BANK LTD
INFOSYS TECHNOLOGIES LTD
ICICI BANK LTD
OIL & NATURAL GAS CORPORATION LTD
LARSEN & TOUBRO LTD
HOUSING DEVELOPMENT FINANCE CORPORATION LTD
TATA CONSULTANCY SERVICES LTD
BHARTI AIRTEL LIMITED
MAHINDRA AND MAHINDRA LTD
STATE BANK OF INDIA
BHARAT PETROLEUM CORP LTD
LUPIN LTD
UNITED SPIRITS LTD
OTHERS
OTHER NET CURRENT ASSETS
93.08
100.00
7.49
6.94
6.46
6.13
4.90
4.28
4.14
3.85
3.48
2.68
2.50
2.36
2.13
1.91
1.77
32.05
6.92
Portfolio as on September 30, 2011 %
EQUITY
TOTAL
RELIANCE INDUSTRIES LTD
I T C LTD
HDFC BANK LTD
INFOSYS TECHNOLOGIES LTD
ICICI BANK LTD
OIL & NATURAL GAS CORPORATION LTD
LARSEN & TOUBRO LTD
HOUSING DEVELOPMENT FINANCE CORPORATION LTD
TATA CONSULTANCY SERVICES LTD
BHARTI AIRTEL LIMITED
MAHINDRA AND MAHINDRA LTD
STATE BANK OF INDIA
BHARAT PETROLEUM CORP LTD
LUPIN LTD
UNITED SPIRITS LTD
DR. REDDYS LABORATORIES LTD
GAIL INDIA LTD
PTC INDIA LTD
EXIDE INDUSTRIES LTD
TATA STEEL LTD
TATA MOTORS LTD
SUN PHARMACEUTICAL INDS. LTD
BAJAJ AUTO LTD
CUMMINS INDIA LTD
ENGINEERS INDIA LTD
UNITED PHOSPHORUS LTD
UNITED BANK OF INDIA
STERLITE INDUSTRIES LTD
RANBAXY LABORATORIES LTD
KOTAK MAHINDRA BANK
OTHERS
DEPOSITS WITH BANKS
BANK OF BARODA CD 2012
OTHER NET CURRENT ASSETS
92.91
100.00
7.58
6.98
6.48
6.15
4.91
4.27
4.17
3.93
3.51
2.71
2.58
2.39
2.16
1.92
1.79
1.79
1.59
1.58
1.50
1.50
1.47
1.45
1.44
1.37
1.37
1.37
1.23
1.08
1.08
1.06
10.49
0.03
0.03
7.06
EQUITY SECTOR EXPOSURE
02468101214161820
TELECOM MACHINERY & ENGINEERING ELECTRICAL ENERGY CHEMICALS
CONSTRUCTION GAS PRODUCTION & TRANSPORTATION METALS
AUTO & ANCILLARIES PHARMA & HOSPITALS FINANCIAL SERVICES
BANKING IT OIL & OTHER PETROLEUM PRODUCTS CONSUMABLES
18.28
11.1
7
9.7
4
8.7
7
7.4
5
6.8
7
6.4
1
6.0
6
5.8
6
3.9
4
2.7
1
2.2
4
2.0
3
1.3
7
11.1
0
10.5
1
9.3
0
7.2
8
6.8
0
6.2
7
5.8
5
5.7
7
3.9
1
2.6
8
2.2
1
2.0
0
1.3
6
18.05
EQUITY SECTOR EXPOSURE
TELECOM MACHINERY & ENGINEERING ELECTRICAL ENERGY CHEMICALS
CONSTRUCTION GAS PRODUCTION & TRANSPORTATION METALS
AUTO & ANCILLARIES PHARMA & HOSPITALS FINANCIAL SERVICES
BANKING IT OIL & OTHER PETROLEUM PRODUCTS CONSUMABLES
02468101214161820
Benchmark return has been computed by applying benchmark weightages of 100% S&P CNX Nifty Index
0.0%-19.6%
Fund Performance as on 30-Sep-2011 (%)
Last One Year
Fund Benchmark
CAGR (last 2 years)
Fund Benchmark
CAGR (since Inception)
Fund Benchmark
-22.3% 0.7% 4.6% 2.4%14.2%
CAGR (last 3 years)
Fund Benchmark
19.4%
All rated fixed income instruments are AAA/P1+ or equivalent.Past performance is not indicative of future performance.
UNIT LINKED EQUITY FUND
Equity and Equity Related Instruments 50% - 90%
Money Market 0% - 40%
Debt Securities 10% - 50%
Asset Allocation Pattern
Inception Date: 16-Jun-08
empowered
UNIT LINKED GROWTH FUND
05
All rated fixed income instruments are AAA/P1+ or equivalent.Past performance is not indicative of future performance.
Portfolio as on September 30, 2011 %EQUITY
TOTAL
RELIANCE INDUSTRIES LTD
I T C LTD
INFOSYS TECHNOLOGIES LTD
HDFC BANK LTD
ICICI BANK LTD
OIL & NATURAL GAS CORPORATION LTD
LARSEN & TOUBRO LTD
HOUSING DEVELOPMENT FINANCE CORPORATION LTD
TATA CONSULTANCY SERVICES LTD
BHARTI AIRTEL LIMITED
MAHINDRA AND MAHINDRA LTD
STATE BANK OF INDIA
BHARAT PETROLEUM CORP LTD
LUPIN LTD
UNITED SPIRITS LTD
DR. REDDYS LABORATORIES LTD
GAIL INDIA LTD
PTC INDIA LTD
EXIDE INDUSTRIES LTD
TATA STEEL LTD
OTHERS
GOVERNMENT SECURITIES
8.13% GOI 2022
7.80% GOI OIL 2021
8.26% GOI 2027
7.83% GOI OIL 2018
8.53% SDL 2020
OTHERS
CORPORATE BONDS/DEBENTURES
9.40% NABARD 2014
7% IOC LTD 2012
9.38% REC LTD 2016
9.39% HDFC LTD 2016
7.45% LIC HOUSING FINANCE LTD 2012
10.10% RELIANCE INDUSTRIES LTD 2011
EXPORT IMPORT BANK 2016
6.55% NHB 2012
9.18% TATA SONS LTD 2020
8.68% NCRPB 2013
OTHERS
DEPOSITS WITH BANKS
STATE BANK OF MYSORE CD 2011
AXIS BANK LTD CD 2012
STATE BANK OF PATIALA CD 2011
BANK OF BARODA CD 2012
CANARA BANK CD 2012
PUNJAB NATIONAL BANK CD 2012
INDIAN OVERSEAS BANK CD 2012
COMMERCIAL PAPERS
MANAPPURAM GENERAL FINANCE & LEASING LTD CP 2012
MUTHOOT FINANCE LTD CP 2012
OTHER NET CURRENT ASSETS
75.89
100.00
6.06
5.59
5.41
5.18
3.93
3.42
3.34
3.14
2.80
2.16
2.06
1.90
1.72
1.54
1.43
1.43
1.27
1.27
1.20
1.20
19.85
4.21
0.86
0.83
0.82
0.79
0.31
0.60
8.42
0.70
0.69
0.63
0.51
0.44
0.38
0.38
0.38
0.37
0.37
3.58
1.51
0.38
0.31
0.31
0.18
0.18
0.09
0.06
0.30
0.24
0.06
9.67
This fund invests in listed equities and high quality fixed income and money market instruments. The fund intends to adopt a relatively aggressive approach towards bonds and equities with the objective of achieving capital appreciation. Risk Profile - Medium to High
UNIT LINKED GROWTH FUND
NAV Movement
GROWTH
16Jun08
11.744
16Sep08
16Dec08
16Mar09
16Jun09
16Sep09
16Dec09
16Mar10
16Jun10
16Sep10
16Dec10
16Mar11
16Jun11
5
6
7
8
9
10
11
12
13
14
15
16Sep11
30Sep11
14.59
9.4
2
8.5
2
7.4
6
5.9
4
5.4
9
5.1
2
4.8
4
4.6
9
3.1
5
2.1
6
1.7
8
1.6
3
1.1
0
0
2
4
6
8
10
12
14
16
EQUITY SECTOR EXPOSURE
TELECOM MACHINERY & ENGINEERING ELECTRICAL ENERGY CHEMICALS
CONSTRUCTION GAS PRODUCTION & TRANSPORTATION METALS
AUTO & ANCILLARIES PHARMA & HOSPITALS FINANCIAL SERVICES
BANKING IT OIL & OTHER PETROLEUM PRODUCTS CONSUMABLES
Benchmark return has been computed by applying benchmark weightages of 80% S&P CNX Nifty Index and 20% CRISIL Composite Bond Index
Modified Duration (in years):1.9
1.1%-14.5%
Fund Performance as on 30-Sep-2011 (%)
Last One Year
Fund Benchmark
CAGR (last 2 years)
Fund Benchmark
CAGR (since Inception)
Fund Benchmark
-17.4% 1.6% 5.0% 3.2%12.8%
CAGR (last 3 years)
Fund Benchmark
17.8%

Money Market 0% - 40%
Equity and Equity Related Instruments 60% - 100%
Asset Allocation Pattern
empowered
04
UNIT LINKED EQUITY AND EQUITY II FUNDS
Inception Date: 16-Jun-08
The Fund’s primary objective is to have high capital appreciation through investment in equities. To maintain liquidity the fund will invest in cash and money market instruments. Risk Profile - High
Unit Linked Equity and Equity II Funds
UNIT LINKED EQUITY II FUND Inception Date: 07-Jan-10
All rated fixed income instruments are AAA/P1+ or equivalent.Past performance is not indicative of future performance.
Fund Performance as on 30-Sep-2011
Last One Year CAGR (since Inception)
-21.8% -19.6% -3.9%
Fund Benchmark Fund Benchmark
Benchmark return has been computed by applying benchmark weightages of 100% S&P CNX Nifty Index
-3.6%
EQUITY
4
6
8
10
12
14
16
16Jun08
16Sep08
16Dec08
16Mar09
16Jun09
16Sep09
16Dec09
16Mar10
16Jun10
16Sep10
16Dec10
16Mar11
16Jun11
16Sep11
30Sep11
11.602
NAV Movement
EQUITY II
NAV Movement
4
6
8
10
12
14
07Jan10
07Mar10
07May10
07Jul10
07Sep10
07Nov10
07Jan11
07Mar11
07May11
07Jul11
07Sep11
30Sep11
9.34
Portfolio as on September 30, 2011 %EQUITY
TOTAL
RELIANCE INDUSTRIES LTD
I T C LTD
HDFC BANK LTD
INFOSYS TECHNOLOGIES LTD
ICICI BANK LTD
OIL & NATURAL GAS CORPORATION LTD
LARSEN & TOUBRO LTD
HOUSING DEVELOPMENT FINANCE CORPORATION LTD
TATA CONSULTANCY SERVICES LTD
BHARTI AIRTEL LIMITED
MAHINDRA AND MAHINDRA LTD
STATE BANK OF INDIA
BHARAT PETROLEUM CORP LTD
LUPIN LTD
UNITED SPIRITS LTD
OTHERS
OTHER NET CURRENT ASSETS
93.08
100.00
7.49
6.94
6.46
6.13
4.90
4.28
4.14
3.85
3.48
2.68
2.50
2.36
2.13
1.91
1.77
32.05
6.92
Portfolio as on September 30, 2011 %
EQUITY
TOTAL
RELIANCE INDUSTRIES LTD
I T C LTD
HDFC BANK LTD
INFOSYS TECHNOLOGIES LTD
ICICI BANK LTD
OIL & NATURAL GAS CORPORATION LTD
LARSEN & TOUBRO LTD
HOUSING DEVELOPMENT FINANCE CORPORATION LTD
TATA CONSULTANCY SERVICES LTD
BHARTI AIRTEL LIMITED
MAHINDRA AND MAHINDRA LTD
STATE BANK OF INDIA
BHARAT PETROLEUM CORP LTD
LUPIN LTD
UNITED SPIRITS LTD
DR. REDDYS LABORATORIES LTD
GAIL INDIA LTD
PTC INDIA LTD
EXIDE INDUSTRIES LTD
TATA STEEL LTD
TATA MOTORS LTD
SUN PHARMACEUTICAL INDS. LTD
BAJAJ AUTO LTD
CUMMINS INDIA LTD
ENGINEERS INDIA LTD
UNITED PHOSPHORUS LTD
UNITED BANK OF INDIA
STERLITE INDUSTRIES LTD
RANBAXY LABORATORIES LTD
KOTAK MAHINDRA BANK
OTHERS
DEPOSITS WITH BANKS
BANK OF BARODA CD 2012
OTHER NET CURRENT ASSETS
92.91
100.00
7.58
6.98
6.48
6.15
4.91
4.27
4.17
3.93
3.51
2.71
2.58
2.39
2.16
1.92
1.79
1.79
1.59
1.58
1.50
1.50
1.47
1.45
1.44
1.37
1.37
1.37
1.23
1.08
1.08
1.06
10.49
0.03
0.03
7.06
EQUITY SECTOR EXPOSURE
02468101214161820
TELECOM MACHINERY & ENGINEERING ELECTRICAL ENERGY CHEMICALS
CONSTRUCTION GAS PRODUCTION & TRANSPORTATION METALS
AUTO & ANCILLARIES PHARMA & HOSPITALS FINANCIAL SERVICES
BANKING IT OIL & OTHER PETROLEUM PRODUCTS CONSUMABLES
18.28
11.1
7
9.7
4
8.7
7
7.4
5
6.8
7
6.4
1
6.0
6
5.8
6
3.9
4
2.7
1
2.2
4
2.0
3
1.3
7
11.1
0
10.5
1
9.3
0
7.2
8
6.8
0
6.2
7
5.8
5
5.7
7
3.9
1
2.6
8
2.2
1
2.0
0
1.3
6
18.05
EQUITY SECTOR EXPOSURE
TELECOM MACHINERY & ENGINEERING ELECTRICAL ENERGY CHEMICALS
CONSTRUCTION GAS PRODUCTION & TRANSPORTATION METALS
AUTO & ANCILLARIES PHARMA & HOSPITALS FINANCIAL SERVICES
BANKING IT OIL & OTHER PETROLEUM PRODUCTS CONSUMABLES
02468101214161820
Benchmark return has been computed by applying benchmark weightages of 100% S&P CNX Nifty Index
0.0%-19.6%
Fund Performance as on 30-Sep-2011 (%)
Last One Year
Fund Benchmark
CAGR (last 2 years)
Fund Benchmark
CAGR (since Inception)
Fund Benchmark
-22.3% 0.7% 4.6% 2.4%14.2%
CAGR (last 3 years)
Fund Benchmark
19.4%
All rated fixed income instruments are AAA/P1+ or equivalent.Past performance is not indicative of future performance.
UNIT LINKED EQUITY FUND
Equity and Equity Related Instruments 50% - 90%
Money Market 0% - 40%
Debt Securities 10% - 50%
Asset Allocation Pattern
Inception Date: 16-Jun-08
empowered
UNIT LINKED GROWTH FUND
05
All rated fixed income instruments are AAA/P1+ or equivalent.Past performance is not indicative of future performance.
Portfolio as on September 30, 2011 %EQUITY
TOTAL
RELIANCE INDUSTRIES LTD
I T C LTD
INFOSYS TECHNOLOGIES LTD
HDFC BANK LTD
ICICI BANK LTD
OIL & NATURAL GAS CORPORATION LTD
LARSEN & TOUBRO LTD
HOUSING DEVELOPMENT FINANCE CORPORATION LTD
TATA CONSULTANCY SERVICES LTD
BHARTI AIRTEL LIMITED
MAHINDRA AND MAHINDRA LTD
STATE BANK OF INDIA
BHARAT PETROLEUM CORP LTD
LUPIN LTD
UNITED SPIRITS LTD
DR. REDDYS LABORATORIES LTD
GAIL INDIA LTD
PTC INDIA LTD
EXIDE INDUSTRIES LTD
TATA STEEL LTD
OTHERS
GOVERNMENT SECURITIES
8.13% GOI 2022
7.80% GOI OIL 2021
8.26% GOI 2027
7.83% GOI OIL 2018
8.53% SDL 2020
OTHERS
CORPORATE BONDS/DEBENTURES
9.40% NABARD 2014
7% IOC LTD 2012
9.38% REC LTD 2016
9.39% HDFC LTD 2016
7.45% LIC HOUSING FINANCE LTD 2012
10.10% RELIANCE INDUSTRIES LTD 2011
EXPORT IMPORT BANK 2016
6.55% NHB 2012
9.18% TATA SONS LTD 2020
8.68% NCRPB 2013
OTHERS
DEPOSITS WITH BANKS
STATE BANK OF MYSORE CD 2011
AXIS BANK LTD CD 2012
STATE BANK OF PATIALA CD 2011
BANK OF BARODA CD 2012
CANARA BANK CD 2012
PUNJAB NATIONAL BANK CD 2012
INDIAN OVERSEAS BANK CD 2012
COMMERCIAL PAPERS
MANAPPURAM GENERAL FINANCE & LEASING LTD CP 2012
MUTHOOT FINANCE LTD CP 2012
OTHER NET CURRENT ASSETS
75.89
100.00
6.06
5.59
5.41
5.18
3.93
3.42
3.34
3.14
2.80
2.16
2.06
1.90
1.72
1.54
1.43
1.43
1.27
1.27
1.20
1.20
19.85
4.21
0.86
0.83
0.82
0.79
0.31
0.60
8.42
0.70
0.69
0.63
0.51
0.44
0.38
0.38
0.38
0.37
0.37
3.58
1.51
0.38
0.31
0.31
0.18
0.18
0.09
0.06
0.30
0.24
0.06
9.67
This fund invests in listed equities and high quality fixed income and money market instruments. The fund intends to adopt a relatively aggressive approach towards bonds and equities with the objective of achieving capital appreciation. Risk Profile - Medium to High
UNIT LINKED GROWTH FUND
NAV Movement
GROWTH
16Jun08
11.744
16Sep08
16Dec08
16Mar09
16Jun09
16Sep09
16Dec09
16Mar10
16Jun10
16Sep10
16Dec10
16Mar11
16Jun11
5
6
7
8
9
10
11
12
13
14
15
16Sep11
30Sep11
14.59
9.4
2
8.5
2
7.4
6
5.9
4
5.4
9
5.1
2
4.8
4
4.6
9
3.1
5
2.1
6
1.7
8
1.6
3
1.1
0
0
2
4
6
8
10
12
14
16
EQUITY SECTOR EXPOSURE
TELECOM MACHINERY & ENGINEERING ELECTRICAL ENERGY CHEMICALS
CONSTRUCTION GAS PRODUCTION & TRANSPORTATION METALS
AUTO & ANCILLARIES PHARMA & HOSPITALS FINANCIAL SERVICES
BANKING IT OIL & OTHER PETROLEUM PRODUCTS CONSUMABLES
Benchmark return has been computed by applying benchmark weightages of 80% S&P CNX Nifty Index and 20% CRISIL Composite Bond Index
Modified Duration (in years):1.9
1.1%-14.5%
Fund Performance as on 30-Sep-2011 (%)
Last One Year
Fund Benchmark
CAGR (last 2 years)
Fund Benchmark
CAGR (since Inception)
Fund Benchmark
-17.4% 1.6% 5.0% 3.2%12.8%
CAGR (last 3 years)
Fund Benchmark
17.8%

Equity and Equity Related Instruments 50% - 90%
Money Market 0% - 40%
Debt Securities 10% - 50%
Asset Allocation Pattern
This fund invests in listed equities and high quality fixed income and money market instruments. The fund intends to adopt a relatively aggressive approach towards bonds and equities with the objective of achieving capital appreciation. Risk Profile - Medium to High
Unit Linked Growth II and Growth Plus Funds
UNIT LINKED GROWTH PLUS FUND Inception Date:13-Sep-10
empowered
UNIT LINKED GROWTH II AND GROWTH PLUS FUNDS
06
UNIT LINKED GROWTH II FUND
GROWTH PLUS
6
7
8
9
10
11
13Sep10
13Oct10
13Nov10
13Dec10
13Jan11
13Feb11
13Mar11
13Apr11
13May11
13Jun11
13Jul11
13Aug11
13Sep11
30Sep11
8.437
NAV Movement
14.44
9.3
4
8.3
9
7.4
3
5.8
1
5.4
3
5.0
1
4.6
7
4.6
4
3.1
2
2.1
4
1.7
6
1.5
9
1.0
8
0
2
4
6
8
10
12
14
16
EQUITY SECTOR EXPOSURE
Portfolio as on September 30, 2011 %74.83
100.00
5.98
5.57
5.38
5.16
3.91
48.83
4.44
1.47
0.88
0.73
1.36
7.58
1.60
0.63
0.62
4.74
1.09
0.50
0.35
0.12
0.12
0.35
0.24
0.12
11.70
Inception Date: 07-Jan-10
Portfolio as on September 30, 2011 %EQUITY
TOTAL
RELIANCE INDUSTRIES LTD
I T C LTD
INFOSYS TECHNOLOGIES LTD
HDFC BANK LTD
OTHERS
GOVERNMENT SECURITIES
7.17% GOI 2015
7.80% GOI OIL 2021
8.26% GOI 2027
OTHERS
CORPORATE BONDS/DEBENTURES
10.35% RELIANCE CAPITAL LTD 2014
9.90% TATA SONS LTD 2016
9.70% HDFC LTD 2016
OTHERS
DEPOSITS WITH BANKS
STATE BANK OF MYSORE CD 2011
AXIS BANK LTD CD 2012
CANARA BANK CD 2012
OTHERS
COMMERCIAL PAPERS
RELIGARE FINVEST LTD CP 2012
MUTHOOT FINANCE LTD CP 2012
MANAPPURAM GENERAL FINANCE & LEASING LTD CP 2012
OTHER NET CURRENT ASSETS
74.85
100.00
5.98
5.54
5.38
5.16
52.79
4.77
1.56
1.27
1.07
0.87
8.76
1.04
0.82
0.82
6.08
3.05
0.81
0.72
0.57
0.95
2.03
1.27
0.19
0.58
6.53
All rated fixed income instruments are AAA/P1+ or equivalent. Past performance is not indicative of future performance.
Last One Year CAGR (since Inception)
-16.8% -14.5% -1.6%
Fund Benchmark Fund Benchmark
-1.7%
Fund Performance as on 30-Sep-2011
Benchmark return has been computed by applying benchmark weightages of 80% S&P CNX Nifty Index and 20% CRISIL Composite Bond Index
Modified Duration (in years):2.1
GROWTH II
07Jan10
07Mar10
07May10
07Jul10
07Sep10
07Nov10
07Jan11
07Mar11
07May11
07Jul11
07Sep11
30Sep11
6
8
10
12
14
NAV Movement
9.732
EQUITY
TOTAL
RELIANCE INDUSTRIES LTD
I T C LTD
INFOSYS TECHNOLOGIES LTD
HDFC BANK LTD
ICICI BANK LTD
OTHERS
GOVERNMENT SECURITIES
8.51% SDL 2021
7.80% GOI OIL 2021
8.39% SDL 2020
OTHERS
CORPORATE BONDS/DEBENTURES
9.18% POWER FINANCE CORPORATION LTD 2021
9.40% NABARD 2014
7.90% REC LTD 2012
OTHERS
DEPOSITS WITH BANKS
STATE BANK OF MYSORE CD 2011
CANARA BANK CD 2012
INDIAN OVERSEAS BANK CD 2012
PUNJAB NATIONAL BANK CD 2012
COMMERCIAL PAPERS
MANAPPURAM GENERAL FINANCE & LEASING LTD CP 2012
MUTHOOT FINANCE LTD CP 2012
OTHER NET CURRENT ASSETS
EQUITY SECTOR EXPOSURE14.40
9.3
4
8.3
9
7.4
5
5.8
1
5.4
3
5.0
1
4.6
7
4.6
1
3.1
2
2.1
4
1.7
6
1.6
1
1.0
8
0
2
4
6
8
10
12
14
16
TELECOM MACHINERY & ENGINEERING ELECTRICAL ENERGY CHEMICALS
CONSTRUCTION GAS PRODUCTION & TRANSPORTATION METALS
AUTO & ANCILLARIES PHARMA & HOSPITALS FINANCIAL SERVICES
BANKING IT OIL & OTHER PETROLEUM PRODUCTS CONSUMABLES
TELECOM MACHINERY & ENGINEERING ELECTRICAL ENERGY CHEMICALS
CONSTRUCTION GAS PRODUCTION & TRANSPORTATION METALS
AUTO & ANCILLARIES PHARMA & HOSPITALS FINANCIAL SERVICES
BANKING IT OIL & OTHER PETROLEUM PRODUCTS CONSUMABLES
Last One Year CAGR (since Inception)
-17.5% -14.5% -15.0%
Fund Benchmark Fund Benchmark
-9.7%
Fund Performance as on 30-Sep-2011
Benchmark return has been computed by applying benchmark weightages of 80% S&P CNX Nifty Index and 20% CRISIL Composite Bond Index
Modified Duration (in years):2.1
07
empowered
UNIT LINKED BALANCED FUND
All rated fixed income instruments are AAA/P1+ or equivalent except *8.30% Bajaj Auto Finance Ltd 2013 and 8.90% Sundaram Finance Ltd 2013 which are AA+. Past performance is not indicative of future performance.
Portfolio as on September 30, 2011 %EQUITY
TOTAL
RELIANCE INDUSTRIES LTD
I T C LTD
INFOSYS TECHNOLOGIES LTD
HDFC BANK LTD
ICICI BANK LTD
OIL & NATURAL GAS CORPORATION LTD
LARSEN & TOUBRO LTD
HOUSING DEVELOPMENT FINANCE CORPORATION LTD
TATA CONSULTANCY SERVICES LTD
BHARTI AIRTEL LIMITED
MAHINDRA AND MAHINDRA LTD
STATE BANK OF INDIA
BHARAT PETROLEUM CORP LTD
LUPIN LTD
UNITED SPIRITS LTD
OTHERS
GOVERNMENT SECURITIES
8.13% GOI 2022
7.83% GOI OIL 2018
7.80% GOI OIL 2021
7.17% GOI 2015
8.26% GOI 2027
OTHERS
CORPORATE BONDS/DEBENTURES
9.39% HDFC LTD 2016
7% IOC LTD 2012
9.38% REC LTD 2016
9.40% NABARD 2014
9.18% TATA SONS LTD 2020
7.45% LIC HOUSING FINANCE LTD 2012
8.68% NCRPB 2013
7.50% LIC HOUSING FINANCE LTD 2013
7.90% REC LTD 2012
8.30% BAJAJ AUTO FINANCE LTD 2013*
9.70% ICICI HOME FINANCE CO LTD 2014
6.55% NHB 2012
9.40% POWER FINANCE CORPORATION LTD 2013
8.25% RELIANCE CAPITAL LTD 2013
9.47% POWER GRID CORPORATION 2013
OTHERS
DEPOSITS WITH BANKS
STATE BANK OF MYSORE CD 2011
HDFC BANK LTD FD 2012
AXIS BANK LTD CD 2012
STATE BANK OF PATIALA CD 2011
CANARA BANK CD 2012
PUNJAB NATIONAL BANK CD 2012
INDIAN OVERSEAS BANK CD 2012
BANK OF BARODA CD 2012
COMMERCIAL PAPERS
RELIGARE FINVEST LTD CP 2012
MANAPPURAM GENERAL FINANCE & LEASING LTD CP 2012
MUTHOOT FINANCE LTD CP 2012
OTHER NET CURRENT ASSETS
47.58
100.00
3.81
3.50
3.38
3.26
2.47
2.15
2.10
1.97
1.76
1.36
1.29
1.20
1.08
0.97
0.90
16.37
8.58
2.26
1.67
1.56
0.71
0.67
1.71
21.80
1.60
1.44
1.06
1.04
0.91
0.89
0.82
0.80
0.79
0.78
0.67
0.67
0.61
0.60
0.60
8.50
6.99
2.53
1.20
1.19
1.10
0.38
0.25
0.20
0.13
1.21
0.51
0.50
0.20
13.84
EQUITY SECTOR EXPOSURE
9.15
5.9
0
5.3
2
4.6
5
3.7
4
3.4
5
3.2
1
3.0
3
2.9
5
1.9
8
1.3
6
1.1
2
1.0
2
0.6
9
0
2
4
6
8
10
TELECOM MACHINERY & ENGINEERING ELECTRICAL ENERGY CHEMICALS
CONSTRUCTION GAS PRODUCTION & TRANSPORTATION METALS
AUTO & ANCILLARIES PHARMA & HOSPITALS FINANCIAL SERVICES
BANKING IT OIL & OTHER PETROLEUM PRODUCTS CONSUMABLES
This fund adopts a relatively balanced approach towards bonds and equities exposure with the objective of achieving capital appreciation with minimal short-term performance volatility.Risk Profile - Medium
Equity and Equity Related Instruments 30% - 70%
Money Market 0% - 40%
Debt Securities 30% - 70%
Inception Date: 16-Jun-08
Asset Allocation Pattern
UNIT LINKED BALANCED FUND
NAV Movement
BALANCED
7
8
9
10
11
12
13
14
15
12.813
16Jun08
16Sep08
16Dec08
16Mar09
16Jun09
16Sep09
16Dec09
16Mar10
16Jun10
16Sep10
16Dec10
16Mar11
16Jun11
16Sep11
30Sep11
Benchmark return has been computed by applying benchmark weightages of 50% S&P CNX Nifty Index and 50% CRISIL Composite Bond Index
Modified Duration (in years): 2.0
2.8%-7.0%
Fund Performance as on 30-Sep-2011 (%)
Last One Year
Fund Benchmark
CAGR (last 2 years)
Fund Benchmark
CAGR (since Inception)
Fund Benchmark
-9.1% 3.2% 7.8% 4.4%10.8%
CAGR (last 3 years)
Fund Benchmark
15.4%
All rated fixed income instruments are AAA/P1+ or equivalent. Past performance is not indicative of future performance.

This fund adopts a relatively balanced approach towards bonds and equities exposure with the objective of achieving capital appreciation with minimal short-term performance volatility. Risk Profile - Medium
Last One Year CAGR (since Inception)
-8.9% -7.0% 0.9%
Fund Benchmark Fund Benchmark
1.0%
Fund Performance as on 30-Sep-2011
Benchmark return has been computed by applying benchmark weightages of 50% S&P CNX Nifty Index and 50% CRISIL Composite Bond Index
Modified Duration (in years): 1.9
BALANCED II
07Jan10
07Mar10
07May10
07Jul10
07Sep10
07Nov10
07Jan11
07Mar11
07May11
07Jul11
07Sep11
30Sep11
10.164
9
9.5
10
10.5
11
11.5
NAV Movement
EQUITY SECTOR EXPOSURE
9.03
5.8
7
5.2
8
4.6
7
3.6
5
3.4
1
3.1
4
2.9
4
2.8
9
1.9
6
1.3
4
1.1
1
1.0
1
0.6
8
0
1
2
3
4
5
6
7
8
9
10
TELECOM MACHINERY & ENGINEERING ELECTRICAL ENERGY CHEMICALS
CONSTRUCTION GAS PRODUCTION & TRANSPORTATION METALS
AUTO & ANCILLARIES PHARMA & HOSPITALS FINANCIAL SERVICES
BANKING IT OIL & OTHER PETROLEUM PRODUCTS CONSUMABLES
UNIT LINKED BALANCED II FUND
Equity and Equity Related Instruments 30% - 70%
Money Market 0% - 40%
Debt Securities 30% - 70%
Asset Allocation Pattern
Inception Date: 07-Jan-10
08
empowered
UNIT LINKED BALANCED II FUND
09
empowered
UNIT LINKED BALANCED PLUS FUND
All rated fixed income instruments are AAA/P1+ or equivalent except *8.30% Bajaj Auto Finance Ltd 2013 and **8.90% Sundaram Finance Ltd 2013 which are AA+. Past performance is not indicative of future performance.
Inception Date:13-Sep-10
BALANCED PLUS
8
8.5
9
9.5
10
10.5
13Sep10
13Oct10
13Nov10
13Dec10
13Jan11
13Feb11
13Mar11
13Apr11
13May11
13Jun11
13Jul11
13Aug11
13Sep11
30Sep11
9.249
NAV Movement
Last One Year CAGR (since Inception)
-9.1% -7.0% -7.2%
Fund Benchmark Fund Benchmark
-3.9%
Fund Performance as on 30-Sep-2011
Benchmark return has been computed by applying benchmark weightages of 50% S&P CNX Nifty Index and 50% CRISIL Composite Bond Index
Modified Duration (in years): 2.1
This fund adopts a relatively balanced approach towards bonds and equities exposure with the objective of achieving capital appreciation with minimal short-term performance volatility. Risk Profile - Medium
UNIT LINKED BALANCED PLUS FUND
Equity and Equity Related Instruments 30% - 70%
Money Market 0% - 40%
Debt Securities 30% - 70%
Asset Allocation Pattern
9.03
5.8
6
5.2
6
4.6
5
3.6
4
3.4
1
3.1
3
2.9
3
2.9
0
1.9
6
1.3
4
1.1
0
1.0
0
0.6
8
0
1
2
3
4
5
6
7
8
9
10
EQUITY SECTOR EXPOSURE
TELECOM MACHINERY & ENGINEERING ELECTRICAL ENERGY CHEMICALS
CONSTRUCTION GAS PRODUCTION & TRANSPORTATION METALS
AUTO & ANCILLARIES PHARMA & HOSPITALS FINANCIAL SERVICES
BANKING IT OIL & OTHER PETROLEUM PRODUCTS CONSUMABLES
Portfolio as on September 30, 2011 %EQUITY
TOTAL
RELIANCE INDUSTRIES LTDI T C LTDINFOSYS TECHNOLOGIES LTD HDFC BANK LTDICICI BANK LTDOIL & NATURAL GAS CORPORATION LTDLARSEN & TOUBRO LTD HOUSING DEVELOPMENT FINANCE CORPORATION LTDTATA CONSULTANCY SERVICES LTDBHARTI AIRTEL LIMITEDMAHINDRA AND MAHINDRA LTDSTATE BANK OF INDIABHARAT PETROLEUM CORP LTDLUPIN LTDUNITED SPIRITS LTDDR. REDDYS LABORATORIES LTDGAIL INDIA LTDPTC INDIA LTDTATA STEEL LTDTATA MOTORS LTDEXIDE INDUSTRIES LTDSUN PHARMACEUTICAL INDS. LTDBAJAJ AUTO LTDCUMMINS INDIA LTD UNITED PHOSPHORUS LTD ENGINEERS INDIA LTDSTERLITE INDUSTRIES LTDRANBAXY LABORATORIES LTDKOTAK MAHINDRA BANK LTDUNITED BANK OF INDIA LTDHCL TECHNOLOGIES LTDFEDERAL BANK LTDDEWAN HOUSING FINANCE COPORATION LTDCHENNAI PETROLEUM CORPORATION LTDBHARAT HEAVY ELECTRICALS LTDAXIS BANK LTDJINDAL STEEL & POWER LTDMANAPPURAM GENERAL FINANCE & LEASING LTDHINDALCO INDUSTRIES LTDGLENMARK PHARMACEUTICALS LTDOTHERSGOVERNMENT SECURITIES7.80% GOI OIL 20217.83% GOI OIL 20188.13% GOI 20228.51% SDL 20218.26% GOI 20278.08% GOI 20227.59% GOI 20168.53% SDL 20207.40% GOI 20127.17% GOI 20156.90% GOI OIL 20268.30% GOI 20407.02% GOI 2016CORPORATE BONDS/DEBENTURES9.40% NABARD 20149.47% POWER GRID CORPORATION 201210.00% NABARD 20129.40% POWER FINANCE CORPORATION LTD 20139.18% POWER FINANCE CORPORATION LTD 2021LIC HOUSING FINANCE LTD ZCB 20118.90% SUNDARAM FINANCE LTD 2013**8.30% BAJAJ AUTO FINANCE LTD 2013*7.50% LIC HOUSING FINANCE LTD 201310.35% RELIANCE CAPITAL LTD 20149.90% HDFC LTD 20119.61% POWER FINANCE CORPORATION LTD 20218.68% NCRPB 2013EXPORT IMPORT BANK 20168.25% RELIANCE CAPITAL LTD 20139.39% HDFC LTD 20167.80% NABARD 20129.36% POWER FINANCE CORPORATION LTD 20217.00% REC LTD 20128.70% POWER FINANCE CORPORATION LTD 201510.35% RELIANCE CAPITAL LTD 2014.9.65% NABARD 20137.45% LIC HOUSING FINANCE LTD 20127.90% REC LTD 20127.75% REC LTD 20127% IOC LTD 20126.95% NHB 20128.20% NHB 20139.18% TATA SONS LTD 20208.70% POWER FINANCE CORPORATION LTD 2020OTHERSDEPOSITS WITH BANKSHDFC BANK LTD FD 2012STATE BANK OF MYSORE CD 2011CANARA BANK CD 2012AXIS BANK LTD CD 2012STATE BANK OF PATIALA CD 2011INDIAN OVERSEAS BANK CD 2012BANK OF BARODA CD 2012PUNJAB NATIONAL BANK CD 2012ANDHRA BANK CD 2012COMMERCIAL PAPERSMANAPPURAM GENERAL FINANCE & LEASING LTD CP 2012MUTHOOT FINANCE LTD CP 2012RELIGARE FINVEST LTD CP 2012OTHER NET CURRENT ASSETS
46.98
100.00
3.763.483.383.242.462.152.081.931.751.341.261.181.070.960.890.890.790.780.740.730.730.720.710.690.680.560.540.540.530.530.500.480.450.450.420.410.360.340.320.311.888.222.301.191.070.980.750.660.340.300.230.200.160.040.00
20.951.611.341.241.241.210.990.820.810.800.760.740.740.710.700.610.540.490.490.490.480.420.410.370.290.280.280.280.280.280.270.955.721.781.620.580.400.330.310.260.240.201.160.660.300.20
16.97
All rated fixed income instruments are AAA/P1+ or equivalent except *8.30% Bajaj Auto Finance Ltd 2013 and **8.90% Sundaram Finance Ltd 2013 which are AA+. Past performance is not indicative of future performance.
Portfolio as on September 30, 2011 %EQUITY
TOTAL
RELIANCE INDUSTRIES LTDI T C LTDINFOSYS TECHNOLOGIES LTD HDFC BANK LTDICICI BANK LTDOIL & NATURAL GAS CORPORATION LTDLARSEN & TOUBRO LTD HOUSING DEVELOPMENT FINANCE CORPORATION LTDTATA CONSULTANCY SERVICES LTDBHARTI AIRTEL LIMITEDMAHINDRA AND MAHINDRA LTDSTATE BANK OF INDIABHARAT PETROLEUM CORP LTDLUPIN LTDUNITED SPIRITS LTDDR. REDDYS LABORATORIES LTDGAIL INDIA LTDPTC INDIA LTDTATA STEEL LTDTATA MOTORS LTDEXIDE INDUSTRIES LTDSUN PHARMACEUTICAL INDS. LTDBAJAJ AUTO LTDCUMMINS INDIA LTD UNITED PHOSPHORUS LTD ENGINEERS INDIA LTDUNITED BANK OF INDIA LTDSTERLITE INDUSTRIES LTDRANBAXY LABORATORIES LTDKOTAK MAHINDRA BANK LTDHCL TECHNOLOGIES LTDFEDERAL BANK LTDCHENNAI PETROLEUM CORPORATION LTDDEWAN HOUSING FINANCE COPORATION LTDBHARAT HEAVY ELECTRICALS LTDAXIS BANK LTDJINDAL STEEL & POWER LTDMANAPPURAM GENERAL FINANCE & LEASING LTDHINDALCO INDUSTRIES LTDOTHERSGOVERNMENT SECURITIES7.17% GOI 20158.51% SDL 20218.39% SDL 20207.80% GOI OIL 20217.83% GOI OIL 20188.26% GOI 20278.13% GOI 2022OTHERSCORPORATE BONDS/DEBENTURES9.90% TATA SONS LTD 20167.90% REC LTD 20128.75% IRFC LTD 201310.35% RELIANCE CAPITAL LTD 2014LIC HOUSING FINANCE LTD ZCB 201110.35% RELIANCE CAPITAL LTD 20149.40% NABARD 20149.18% TATA SONS LTD 202010.90% REC LTD 20139.70% HDFC LTD 20168.20% NHB 20139.40% POWER FINANCE CORPORATION LTD 20137.80% NABARD 20129.18% POWER FINANCE CORPORATION LTD 20218.70% POWER FINANCE CORPORATION LTD 201510.00% NABARD 20127.50% LIC HOUSING FINANCE LTD 20139.80% POWER FINANCE CORPORATION LTD 20129.39% HDFC LTD 20169.61% POWER FINANCE CORPORATION LTD 20218.25% RELIANCE CAPITAL LTD 20137.45% LIC HOUSING FINANCE LTD 20129.70% ICICI HOME FINANCE CO LTD 20149.90% HDFC LTD 20119.47% POWER GRID CORPORATION 2013OTHERSDEPOSITS WITH BANKSHDFC BANK LTD FD 2012CANARA BANK CD 2012STATE BANK OF PATIALA CD 2011STATE BANK OF MYSORE CD 2011BANK OF BARODA CD 2012ORIENTAL BANK OF COMMERCE FD 2013ANDHRA BANK CD 2012INDIAN OVERSEAS BANK CD 2012PUNJAB NATIONAL BANK CD 2012AXIS BANK LTD CD 2012OTHERSCOMMERCIAL PAPERSMANAPPURAM GENERAL FINANCE & LEASING LTD CP 2012RELIGARE FINVEST LTD CP 2012MUTHOOT FINANCE LTD CP 2012OTHER NET CURRENT ASSETS
46.90
100.00
3.753.473.383.242.452.142.071.931.741.341.251.181.060.960.890.880.790.780.740.730.720.720.710.680.680.560.550.540.540.530.500.480.450.440.420.410.360.330.322.18
10.423.051.831.551.380.920.720.620.36
20.982.421.971.591.221.201.141.111.090.980.960.780.720.550.540.540.480.460.400.400.400.390.310.240.240.200.648.321.201.121.061.020.880.800.690.520.260.230.522.401.280.610.51
10.97

This fund adopts a relatively balanced approach towards bonds and equities exposure with the objective of achieving capital appreciation with minimal short-term performance volatility. Risk Profile - Medium
Last One Year CAGR (since Inception)
-8.9% -7.0% 0.9%
Fund Benchmark Fund Benchmark
1.0%
Fund Performance as on 30-Sep-2011
Benchmark return has been computed by applying benchmark weightages of 50% S&P CNX Nifty Index and 50% CRISIL Composite Bond Index
Modified Duration (in years): 1.9
BALANCED II
07Jan10
07Mar10
07May10
07Jul10
07Sep10
07Nov10
07Jan11
07Mar11
07May11
07Jul11
07Sep11
30Sep11
10.164
9
9.5
10
10.5
11
11.5
NAV Movement
EQUITY SECTOR EXPOSURE
9.03
5.8
7
5.2
8
4.6
7
3.6
5
3.4
1
3.1
4
2.9
4
2.8
9
1.9
6
1.3
4
1.1
1
1.0
1
0.6
8
0
1
2
3
4
5
6
7
8
9
10
TELECOM MACHINERY & ENGINEERING ELECTRICAL ENERGY CHEMICALS
CONSTRUCTION GAS PRODUCTION & TRANSPORTATION METALS
AUTO & ANCILLARIES PHARMA & HOSPITALS FINANCIAL SERVICES
BANKING IT OIL & OTHER PETROLEUM PRODUCTS CONSUMABLES
UNIT LINKED BALANCED II FUND
Equity and Equity Related Instruments 30% - 70%
Money Market 0% - 40%
Debt Securities 30% - 70%
Asset Allocation Pattern
Inception Date: 07-Jan-10
08
empowered
UNIT LINKED BALANCED II FUND
09
empowered
UNIT LINKED BALANCED PLUS FUND
All rated fixed income instruments are AAA/P1+ or equivalent except *8.30% Bajaj Auto Finance Ltd 2013 and **8.90% Sundaram Finance Ltd 2013 which are AA+. Past performance is not indicative of future performance.
Inception Date:13-Sep-10
BALANCED PLUS
8
8.5
9
9.5
10
10.5
13Sep10
13Oct10
13Nov10
13Dec10
13Jan11
13Feb11
13Mar11
13Apr11
13May11
13Jun11
13Jul11
13Aug11
13Sep11
30Sep11
9.249
NAV Movement
Last One Year CAGR (since Inception)
-9.1% -7.0% -7.2%
Fund Benchmark Fund Benchmark
-3.9%
Fund Performance as on 30-Sep-2011
Benchmark return has been computed by applying benchmark weightages of 50% S&P CNX Nifty Index and 50% CRISIL Composite Bond Index
Modified Duration (in years): 2.1
This fund adopts a relatively balanced approach towards bonds and equities exposure with the objective of achieving capital appreciation with minimal short-term performance volatility. Risk Profile - Medium
UNIT LINKED BALANCED PLUS FUND
Equity and Equity Related Instruments 30% - 70%
Money Market 0% - 40%
Debt Securities 30% - 70%
Asset Allocation Pattern
9.03
5.8
6
5.2
6
4.6
5
3.6
4
3.4
1
3.1
3
2.9
3
2.9
0
1.9
6
1.3
4
1.1
0
1.0
0
0.6
8
0
1
2
3
4
5
6
7
8
9
10
EQUITY SECTOR EXPOSURE
TELECOM MACHINERY & ENGINEERING ELECTRICAL ENERGY CHEMICALS
CONSTRUCTION GAS PRODUCTION & TRANSPORTATION METALS
AUTO & ANCILLARIES PHARMA & HOSPITALS FINANCIAL SERVICES
BANKING IT OIL & OTHER PETROLEUM PRODUCTS CONSUMABLES
Portfolio as on September 30, 2011 %EQUITY
TOTAL
RELIANCE INDUSTRIES LTDI T C LTDINFOSYS TECHNOLOGIES LTD HDFC BANK LTDICICI BANK LTDOIL & NATURAL GAS CORPORATION LTDLARSEN & TOUBRO LTD HOUSING DEVELOPMENT FINANCE CORPORATION LTDTATA CONSULTANCY SERVICES LTDBHARTI AIRTEL LIMITEDMAHINDRA AND MAHINDRA LTDSTATE BANK OF INDIABHARAT PETROLEUM CORP LTDLUPIN LTDUNITED SPIRITS LTDDR. REDDYS LABORATORIES LTDGAIL INDIA LTDPTC INDIA LTDTATA STEEL LTDTATA MOTORS LTDEXIDE INDUSTRIES LTDSUN PHARMACEUTICAL INDS. LTDBAJAJ AUTO LTDCUMMINS INDIA LTD UNITED PHOSPHORUS LTD ENGINEERS INDIA LTDSTERLITE INDUSTRIES LTDRANBAXY LABORATORIES LTDKOTAK MAHINDRA BANK LTDUNITED BANK OF INDIA LTDHCL TECHNOLOGIES LTDFEDERAL BANK LTDDEWAN HOUSING FINANCE COPORATION LTDCHENNAI PETROLEUM CORPORATION LTDBHARAT HEAVY ELECTRICALS LTDAXIS BANK LTDJINDAL STEEL & POWER LTDMANAPPURAM GENERAL FINANCE & LEASING LTDHINDALCO INDUSTRIES LTDGLENMARK PHARMACEUTICALS LTDOTHERSGOVERNMENT SECURITIES7.80% GOI OIL 20217.83% GOI OIL 20188.13% GOI 20228.51% SDL 20218.26% GOI 20278.08% GOI 20227.59% GOI 20168.53% SDL 20207.40% GOI 20127.17% GOI 20156.90% GOI OIL 20268.30% GOI 20407.02% GOI 2016CORPORATE BONDS/DEBENTURES9.40% NABARD 20149.47% POWER GRID CORPORATION 201210.00% NABARD 20129.40% POWER FINANCE CORPORATION LTD 20139.18% POWER FINANCE CORPORATION LTD 2021LIC HOUSING FINANCE LTD ZCB 20118.90% SUNDARAM FINANCE LTD 2013**8.30% BAJAJ AUTO FINANCE LTD 2013*7.50% LIC HOUSING FINANCE LTD 201310.35% RELIANCE CAPITAL LTD 20149.90% HDFC LTD 20119.61% POWER FINANCE CORPORATION LTD 20218.68% NCRPB 2013EXPORT IMPORT BANK 20168.25% RELIANCE CAPITAL LTD 20139.39% HDFC LTD 20167.80% NABARD 20129.36% POWER FINANCE CORPORATION LTD 20217.00% REC LTD 20128.70% POWER FINANCE CORPORATION LTD 201510.35% RELIANCE CAPITAL LTD 2014.9.65% NABARD 20137.45% LIC HOUSING FINANCE LTD 20127.90% REC LTD 20127.75% REC LTD 20127% IOC LTD 20126.95% NHB 20128.20% NHB 20139.18% TATA SONS LTD 20208.70% POWER FINANCE CORPORATION LTD 2020OTHERSDEPOSITS WITH BANKSHDFC BANK LTD FD 2012STATE BANK OF MYSORE CD 2011CANARA BANK CD 2012AXIS BANK LTD CD 2012STATE BANK OF PATIALA CD 2011INDIAN OVERSEAS BANK CD 2012BANK OF BARODA CD 2012PUNJAB NATIONAL BANK CD 2012ANDHRA BANK CD 2012COMMERCIAL PAPERSMANAPPURAM GENERAL FINANCE & LEASING LTD CP 2012MUTHOOT FINANCE LTD CP 2012RELIGARE FINVEST LTD CP 2012OTHER NET CURRENT ASSETS
46.98
100.00
3.763.483.383.242.462.152.081.931.751.341.261.181.070.960.890.890.790.780.740.730.730.720.710.690.680.560.540.540.530.530.500.480.450.450.420.410.360.340.320.311.888.222.301.191.070.980.750.660.340.300.230.200.160.040.00
20.951.611.341.241.241.210.990.820.810.800.760.740.740.710.700.610.540.490.490.490.480.420.410.370.290.280.280.280.280.280.270.955.721.781.620.580.400.330.310.260.240.201.160.660.300.20
16.97
All rated fixed income instruments are AAA/P1+ or equivalent except *8.30% Bajaj Auto Finance Ltd 2013 and **8.90% Sundaram Finance Ltd 2013 which are AA+. Past performance is not indicative of future performance.
Portfolio as on September 30, 2011 %EQUITY
TOTAL
RELIANCE INDUSTRIES LTDI T C LTDINFOSYS TECHNOLOGIES LTD HDFC BANK LTDICICI BANK LTDOIL & NATURAL GAS CORPORATION LTDLARSEN & TOUBRO LTD HOUSING DEVELOPMENT FINANCE CORPORATION LTDTATA CONSULTANCY SERVICES LTDBHARTI AIRTEL LIMITEDMAHINDRA AND MAHINDRA LTDSTATE BANK OF INDIABHARAT PETROLEUM CORP LTDLUPIN LTDUNITED SPIRITS LTDDR. REDDYS LABORATORIES LTDGAIL INDIA LTDPTC INDIA LTDTATA STEEL LTDTATA MOTORS LTDEXIDE INDUSTRIES LTDSUN PHARMACEUTICAL INDS. LTDBAJAJ AUTO LTDCUMMINS INDIA LTD UNITED PHOSPHORUS LTD ENGINEERS INDIA LTDUNITED BANK OF INDIA LTDSTERLITE INDUSTRIES LTDRANBAXY LABORATORIES LTDKOTAK MAHINDRA BANK LTDHCL TECHNOLOGIES LTDFEDERAL BANK LTDCHENNAI PETROLEUM CORPORATION LTDDEWAN HOUSING FINANCE COPORATION LTDBHARAT HEAVY ELECTRICALS LTDAXIS BANK LTDJINDAL STEEL & POWER LTDMANAPPURAM GENERAL FINANCE & LEASING LTDHINDALCO INDUSTRIES LTDOTHERSGOVERNMENT SECURITIES7.17% GOI 20158.51% SDL 20218.39% SDL 20207.80% GOI OIL 20217.83% GOI OIL 20188.26% GOI 20278.13% GOI 2022OTHERSCORPORATE BONDS/DEBENTURES9.90% TATA SONS LTD 20167.90% REC LTD 20128.75% IRFC LTD 201310.35% RELIANCE CAPITAL LTD 2014LIC HOUSING FINANCE LTD ZCB 201110.35% RELIANCE CAPITAL LTD 20149.40% NABARD 20149.18% TATA SONS LTD 202010.90% REC LTD 20139.70% HDFC LTD 20168.20% NHB 20139.40% POWER FINANCE CORPORATION LTD 20137.80% NABARD 20129.18% POWER FINANCE CORPORATION LTD 20218.70% POWER FINANCE CORPORATION LTD 201510.00% NABARD 20127.50% LIC HOUSING FINANCE LTD 20139.80% POWER FINANCE CORPORATION LTD 20129.39% HDFC LTD 20169.61% POWER FINANCE CORPORATION LTD 20218.25% RELIANCE CAPITAL LTD 20137.45% LIC HOUSING FINANCE LTD 20129.70% ICICI HOME FINANCE CO LTD 20149.90% HDFC LTD 20119.47% POWER GRID CORPORATION 2013OTHERSDEPOSITS WITH BANKSHDFC BANK LTD FD 2012CANARA BANK CD 2012STATE BANK OF PATIALA CD 2011STATE BANK OF MYSORE CD 2011BANK OF BARODA CD 2012ORIENTAL BANK OF COMMERCE FD 2013ANDHRA BANK CD 2012INDIAN OVERSEAS BANK CD 2012PUNJAB NATIONAL BANK CD 2012AXIS BANK LTD CD 2012OTHERSCOMMERCIAL PAPERSMANAPPURAM GENERAL FINANCE & LEASING LTD CP 2012RELIGARE FINVEST LTD CP 2012MUTHOOT FINANCE LTD CP 2012OTHER NET CURRENT ASSETS
46.90
100.00
3.753.473.383.242.452.142.071.931.741.341.251.181.060.960.890.880.790.780.740.730.720.720.710.680.680.560.550.540.540.530.500.480.450.440.420.410.360.330.322.18
10.423.051.831.551.380.920.720.620.36
20.982.421.971.591.221.201.141.111.090.980.960.780.720.550.540.540.480.460.400.400.400.390.310.240.240.200.648.321.201.121.061.020.880.800.690.520.260.230.522.401.280.610.51
10.97

Inception Date: 09-Jul-08
Other Net Current AssetsDeposits With Banks Commercial Papers
Corporate Bonds/DebenturesGovernment Securities
Asset Mix
16.47%
49.41%
19.01%
3.29%11.83%
UNIT LINKED DEBT FUND
Money Market 0% - 40%
Debt Securities 60% - 100%
Asset Allocation Pattern
Modified Duration (in years):4.7
11
empowered
UNIT LINKED LIQUID FUND
10
empowered
UNIT LINKED DEBT AND DEBT PLUS FUNDS
9.00
9.20
9.40
9.60
9.80
10.00
10.20
9.57
19Sep11
30Sep11
05Sep11
22Aug11
NAV G
08Aug11
25Jul11
11Jul11
27Jun11
13Jun11
30May11
16May11
02May11
18Apr11
NAV Movement
Portfolio as on September 30, 2011 %EQUITY
TOTAL
RELIANCE INDUSTRIES LTD
I T C LTD
INFOSYS TECHNOLOGIES LTD
ICICI BANK LTD
HDFC BANK LTD
LARSEN & TOUBRO LTD
OIL & NATURAL GAS CORPORATION LTD
HOUSING DEVELOPMENT FINANCE CORPORATION LTD
TATA CONSULTANCY SERVICES LTD
STATE BANK OF INDIA
BHARTI AIRTEL LIMITED
MAHINDRA AND MAHINDRA LTD
BHARAT PETROLEUM CORP LTD
UNITED SPIRITS LTD
LUPIN LTD
DR. REDDYS LABORATORIES LTD
EXIDE INDUSTRIES LTD
TATA STEEL LTD
SUN PHARMACEUTICAL INDS. LTD
ENGINEERS INDIA LTD
HCL TECHNOLOGIES LTD
CUMMINS INDIA LTD
BAJAJ AUTO LTD
UNITED PHOSPHORUS LTD
TATA MOTORS LTD
AXIS BANK LTD
UNITED BANK OF INDIA LTD
GAIL INDIA LTD
RANBAXY LABORATORIES LTD
STERLITE INDUSTRIES LTD
POWER GRID CORPORATION OF INDIA LTD
KOTAK MAHINDRA BANK LTD
FEDERAL BANK LTD
BHARAT HEAVY ELECTRICALS LTD
DEWAN HOUSING FINANCE COPORATION LTD
HINDALCO INDUSTRIES LTD
JINDAL STEEL & POWER LTD
GLENMARK PHARMACEUTICALS LTD
BRITANNIA INDUSTRIES LTD
RURAL ELECTRIFICATION CORPORATION LTD
CMC LTD
I R B INFRASTRUCTURE DEVELOPERS LTD
INFRASTRUCTURE DEVELOPMENT FINANCE COMPANY LTD
MARUTI SUZUKI INDIA LTD
PUNJAB NATIONAL BANK
YES BANK LTD
PTC INDIA LTD
GOVERNMENT SECURITIES
7.80% GOI OIL 2021
OTHER NET CURRENT ASSETS
60.28
100
4.66
4.26
4.16
3.90
3.53
3.08
2.63
2.48
2.30
2.07
1.61
1.47
1.40
1.31
1.16
1.09
1.08
0.99
0.96
0.95
0.94
0.90
0.90
0.90
0.88
0.88
0.81
0.81
0.79
0.74
0.65
0.62
0.58
0.57
0.55
0.50
0.44
0.40
0.33
0.33
0.32
0.32
0.30
0.30
0.24
0.18
0.00
29.31
29.31
10.41
All rated fixed income instruments are AAA/P1+ or equivalent.Past performance is not indicative of future performance.
Portfolio as on September 30, 2011 %
This fund primarily invests in portfolio constituted of money market and high quality debt securities.Risk Profile - Low
Money Market 40% - 100%
Debt Securities 0% - 60%
Asset Allocation Pattern
Inception Date: 14-Jul-08
UNIT LINKED LIQUID FUNDThis fund invests in a portfolio of high quality bonds and other fixed and floating rate securities issued by the Government, Government agencies and corporate issuers. To maintain liquidity, the fund invests in the money market instruments. Risk Profile - Low to Medium
Unit Linked Debt and Debt Plus Funds
All rated fixed income instruments are AAA/P1+ or equivalent except *8.30% Bajaj Auto Finance Ltd 2013 and 8.90% Sundaram Finance Ltd 2013 which are AA+. Past performance is not indicative of future performance.
UNIT LINKED DEBT PLUS FUND Inception Date:15-Sep-10
Other Net Current AssetsDeposits With Banks Commercial Papers
Corporate Bonds/DebenturesGovernment Securities
Asset Mix
21.95%
40.53%
16.25%
10.48%10.80%
NAV Movement
DEBT
10Jul08
10Oct08
10Jan09
10Apr09
10Jul09
10Oct09
10Jan10
10Apr10
10Jul10
10Oct10
10Jan11
10Apr11
10Jul11
7
8
9
10
11
12
13
14
13.37
30Sep11
NAV Movement
DEBT PLUS10.612
15Sep10
15Oct10
15Nov10
15Dec10
15Jan11
15Feb11
15Mar11
15Apr11
9
9.5
10
10.5
15May11
15Jun11
15Jul11
15Aug11
15Sep11
30Sep11
Portfolio as on September 30, 2011 %GOVERNMENT SECURITIES
7.80% GOI OIL 2021
8.26% GOI 2027
8.51% SDL 2021
7.83% GOI OIL 2018
8.13% GOI 2022
OTHERS
CORPORATE BONDS/DEBENTURES
9.40% NABARD 2014
9.47% POWER GRID CORPORATION 2012
8.46% IRFC LTD 2014
10.90% REC LTD 2013
9.80% LIC HOUSING FINANCE LTD 2017
9.80% POWER FINANCE CORPORATION LTD 2012
10.35% RELIANCE CAPITAL LTD 2014
9.70% HDFC LTD 2016
8.75% IRFC LTD 2013
7.90% REC LTD 2012
8.70% POWER FINANCE CORPORATION LTD 2015
10.35% RELIANCE CAPITAL LTD 2014
9.90% TATA SONS LTD 2016
10.00% NABARD 2012
9.90% HDFC LTD 2011
OTHERS
DEPOSITS WITH BANKS
BANK OF BARODA CD 2012
STATE BANK OF TRAVANCORE FD 2013
CORPORATION BANK FD 2011
AXIS BANK LTD CD 2012
STATE BANK OF MYSORE CD 2011
OTHERS
COMMERCIAL PAPERS
RELIGARE FINVEST LTD CP 2012
MANAPPURAM GENERAL FINANCE & LEASING LTD CP 2012
MUTHOOT FINANCE LTD CP 2012
OTHER NET CURRENT ASSETS
TOTAL
21.95
16.93
1.62
1.31
0.94
0.59
0.56
40.53
5.27
4.41
4.34
3.61
3.56
2.65
1.79
1.77
1.75
1.74
1.72
0.90
0.89
0.88
0.88
4.36
16.25
6.42
2.21
1.77
1.38
1.14
3.35
10.48
8.01
1.66
0.81
10.80
100.00
Asset Mix
Other Net Current AssetsCommercial PapersDeposits With Banks
71.71%
23.29%
5.00%
NAV Movement
LIQUID
14Jul08
14Oct08
12.538
14Jan09
14Apr09
14Jul09
14Oct09
14Jan10
14Apr10
14Jul10
14Oct10
14Jan11
14Apr11
14Jul11
9
9.510
10.5
11
11.5
1212.5
13
13.514
30Sep11
NAV GUARANTEE FUND SERIES 1
This fund aims to generate long-term capital appreciation from active management of a portfolio of equity and fixed income securities. The allocation between equity and debt is dynamically managed depending on the prevalent market conditions to safeguard capital appreciation. The use of derivatives is as per approval by IRDA. Risk Profile - Medium
0% - 100%
0% - 100%
0% - 100%
Equity
Asset Allocation Pattern
Inception Date: 15-Apr-11
Money Market
Debt Securities
DEPOSITS WITH BANKS
CANARA BANK CD 2012
BANK OF BARODA CD 2012
ANDHRA BANK FD 2011
AXIS BANK LTD CD 2012
CORPORATION BANK FD 2011
INDIAN OVERSEAS BANK CD 2012
STATE BANK OF PATIALA FD 2012
STATE BANK OF PATIALA CD 2011
BANK OF BARODA FD 2012
HDFC BANK LTD FD 2011
HSBC BANK FD 2011
INDIAN BANK FD 2011
IDBI BANK FD 2011
STATE BANK OF MYSORE CD 2011
PUNJAB NATIONAL BANK CD 2012
ANDHRA BANK CD 2012
PUNJAB & SIND BANK FD 2012
STATE BANK OF TRAVANCORE FD 2013
STATE BANK OF TRAVANCORE FD 2012
STATE BANK OF TRAVANCORE FD 2011
COMMERCIAL PAPERS
RELIGARE FINVEST LTD CP 2012
MANAPPURAM GENERAL FINANCE & LEASING LTD CP 2012
MUTHOOT FINANCE LTD CP 2012
OTHER NET CURRENT ASSETS
TOTAL
71.71
1.03
3.26
4.96
5.10
2.20
6.88
3.31
2.83
5.24
0.55
1.60
2.48
0.66
4.66
5.63
4.78
7.28
1.21
7.16
0.88
23.29
8.42
8.28
6.59
5.00
100.00
TELECOM MACHINERY & ENGINEERING ELECTRICAL ENERGY CHEMICALSCONSTRUCTION GAS PRODUCTION & TRANSPORTATION METALS AUTO & ANCILLARIES PHARMA & HOSPITALS FINANCIAL SERVICES
BANKING IT OIL & OTHER PETROLEUM PRODUCTS CONSUMABLES
EQUITY SECTOR EXPOSURE12.81
7.7
2
6.0
6
5.9
0
4.6
3
4.4
1
4.3
5
3.6
5
3.4
4
2.6
8
1.6
1
1.4
8
0.9
0
0.6
5
0
2
4
6
8
10
12
14
5.6%5.6%
Fund Performance as on 30-Sep-2011 (%)
Last One Year
Fund Benchmark
CAGR (last 2 years)
Fund Benchmark
CAGR (since Inception)
Fund Benchmark
5.9% 5.6% 9.4% 7.0%7.1%
CAGR (last 3 years)
Fund Benchmark
9.1%
Benchmark is CRISIL Composite Bond Fund IndexModified Duration (in years): 2.3
5.9%7.7%
Fund Performance as on 30-Sep-2011 (%)
Last One Year
Fund Benchmark
CAGR (last 2 years)
Fund Benchmark
CAGR (since Inception)
Fund Benchmark
7.4% 6.7% 7.3% 6.4%6.2%
CAGR (last 3 years)
Fund Benchmark
7.2%
Benchmark is CRISIL Liquid Fund IndexModified Duration (in years): 0.5
Last One Year CAGR (since Inception)
5.7% 5.6% 5.9%
Fund Benchmark Fund Benchmark
5.7%
Fund Performance as on 30-Sep-2011
Benchmark return has been computed by applying benchmark weightages of 80% S&P CNX Nifty Index and 20% CRISIL Composite Bond Index
Modified Duration (in years):2.6
All rated fixed income instruments are AAA/P1+ or equivalent except *8.30% Bajaj Auto Finance Ltd 2013 and 8.90% Sundaram Finance Ltd 2013 which are AA+. Past performance is not indicative of future performance.
Portfolio as on September 30, 2011 %GOVERNMENT SECURITIES
7.80% GOI OIL 2021
7.83% GOI OIL 2018
8.13% GOI 2022
8.26% GOI 2027
8.51% SDL 2021
OTHERS
CORPORATE BONDS/DEBENTURES
9.40% NABARD 2014
9.90% TATA SONS LTD 2016
9.38% REC LTD 2016
8.30% BAJAJ AUTO FINANCE LTD 2013*
7.45% LIC HOUSING FINANCE LTD 2012
LIC HOUSING FINANCE LTD ZCB 2011
9.40% POWER FINANCE CORPORATION LTD 2013
8.68% NCRPB 2013
6.90% NHB 2012
7.50% LIC HOUSING FINANCE LTD 2013
10.00% NABARD 2012
11.50% REC LTD 2013
9.18% TATA SONS LTD 2020
9.18% POWER FINANCE CORPORATION LTD 2021
8.25% RELIANCE CAPITAL LTD 2013
OTHERS
DEPOSITS WITH BANKS
HDFC BANK LTD FD 2012
STATE BANK OF TRAVANCORE FD 2013
STATE BANK OF PATIALA FD 2012
STATE BANK OF MYSORE CD 2011
ORIENTAL BANK OF COMMERCE FD 2013
OTHERS
COMMERCIAL PAPERS
MANAPPURAM GENERAL FINANCE & LEASING LTD CP 2012
RELIGARE FINVEST LTD CP 2012
MUTHOOT FINANCE LTD CP 2012
OTHER NET CURRENT ASSETS
TOTAL
16.47
4.40
3.42
2.61
1.46
1.40
3.18
49.41
3.62
2.47
2.20
2.17
2.01
1.82
1.77
1.75
1.55
1.51
1.42
1.38
1.30
1.30
1.22
21.93
19.01
7.33
2.64
1.76
1.19
1.11
4.98
3.29
1.63
1.25
0.41
11.83
100.00
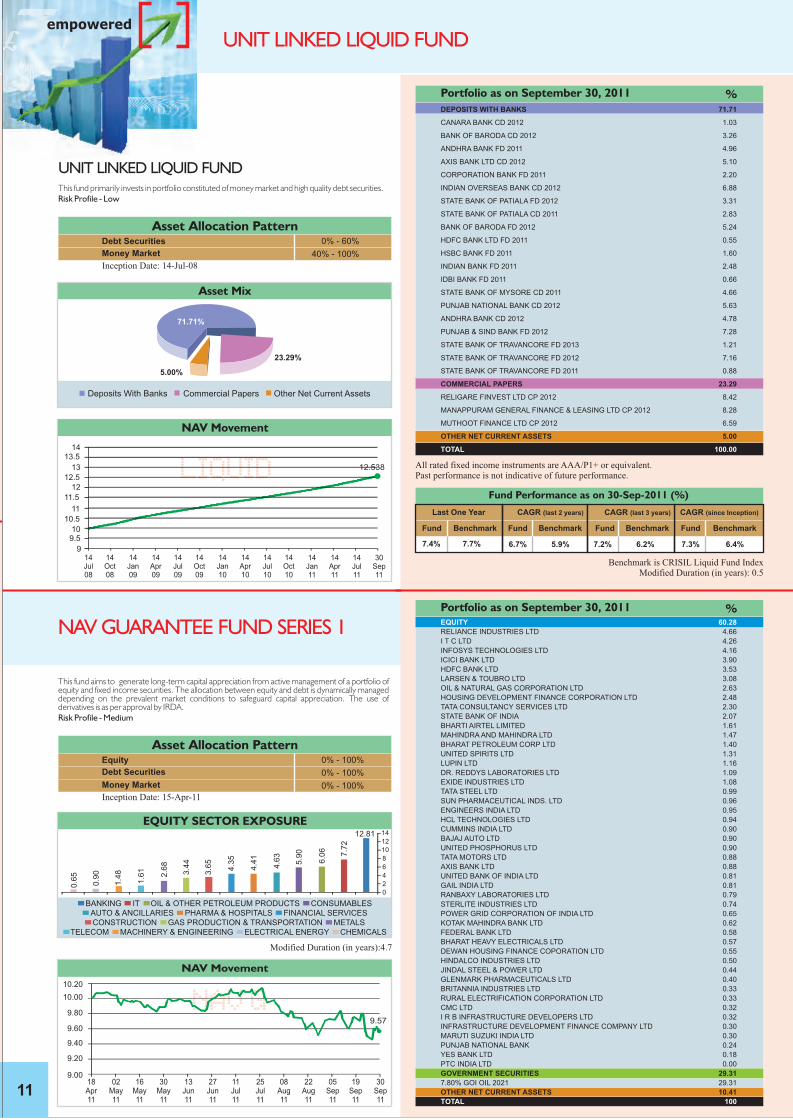

Regd. Office: 112 J.C. Road, Bangalore - 560002
For enquiry, please call - 1800-103-0003 / 1800-180-0003 or visit us at: www.canarahsbclife.com
Disclosures:
The various funds offered are the names of the funds and do not, in any way indicate the quality of these funds, their future prospects and returns.
Unit Linked Life Insurance products are different from traditional insurance products and are subject to risk factors.
Unit Linked Funds are subject to market risks and there is no assurance or guarantee that the objective of the investment fund will be achieved.
Past performance of the investment funds do not indicate the future performance of the same. Investors in the Scheme are not being offered any guaranteed / assured results.
The premiums paid in Unit-Linked Life Insurance policies are subject to investment risk associated with capital markets. The NAVs of the units may go up or down based on the performance of the fund and factors influencing the capital market and the insured is responsible for his/her decisions.
The investment risk in Investment Portfolio is borne by the policyholder.
For more details on risk factors, terms and conditions please read sales brochure carefully before concluding a sale.
Insurance is the subject matter of the solicitation.
The SFIN (Segregated Fund Index Number) for Equity Fund is ULIF00116/06/08EQUITYFUND136, Equity II Fund is ULIF00607/01/10EQUTYIIFND136, Growth Fund is ULIF00216/06/08GROWTHFUND136, Growth II Fund is ULIF00707/01/10GROWTIIFND136, Growth Plus Fund is ULIF00913/09/10GROWTPLFND136, Balanced Fund is ULIF00316/06/08BLNCEDFUND136, Balanced II Fund is ULIF00807/01/10BLNCDIIFND136, Balanced Plus Fund is ULIF01013/09/10BLNCDPLFND136, Debt Fund is ULIF00409/07/08INDEBTFUND136, Debt Plus Fund is ULIF01115/09/10DEBTPLFUND136, Liquid Fund is ULIF00514/07/08LIQUIDFUND136 and NAV Guarantee Fund Series 1 is ULIF01215/04/11NAVGFUNDSI136.
Disclaimer:
Benchmark indices provided by CRISIL - CRISIL indices are the sole property of CRISIL Limited (CRISIL). CRISIL indices shall not be copied, retransmitted or redistributed in any manner for any commercial use. CRISIL has taken due care and caution in computation of indices based on data obtained from sources, which it considers reliable. However, CRISIL does not guarantee the accuracy, adequacy or completeness of the indices and is not responsible for any errors or for the results obtained from the use of the indices. CRISIL especially states that it has no financial liability whatsoever to the users of CRISIL indices.
MSCNJINVSEP11 ENG
Canara HSBC Oriental Bank Of Commerce Life Insurance Company Limited (Regn. No. 136)Unitech Trade Centre, 2nd Floor, Sushant Lok, Phase-1, Sector-43, Gurgaon - 122009 Haryana, India.
C O N T E N T S
Unit Linked Equity & Equity II Funds
Unit Linked Debt & Debt Plus Funds
Unit Linked Growth Fund
From the CIO’s Desk
01 04 06
11 Unit Linked Liquid Fund& NAV Guarantee FundSeries 1
10
Insurance Update
Planning for your children's education
03 05 Unit Linked Balanced, Balanced II & Balanced Plus Funds
07 12 Life Insurance Simulator
(LIS)
Unit Linked Growth II, & Growth Plus Funds
Ritu AroraChief Investment Officer,Canara HSBC Oriental Bank of Commerce Life Insurance Company Limited
low leverage, it is better placed to not just cater to the current requirement
of supply-enhancing investments but to carry out large investments in the
future too. However, there is increasing evidence that investment
expenditure in the economy is slowing down. Corporates across the
board are reporting slowdown in investments as existing projects get
stranded while new project announcements are deferred. It seems while
demand remains strong, corporates are increasingly challenged by the
lack of approvals and activism for the environment, the retrospective
application of which is causing severe problems for those whose
projects are already underway or nearing completion.
The slew of scams hitting India during the past few months is perhaps
leading to a shift in the way new project approvals are granted and the
corporate sector seems to be waiting on the sidelines. However, coming
as it does at a time where demand has already galloped well ahead of
supply and stretched infrastructure to its limits, it is leading to a delayed
response by the supply side causing further inflation. These circumstances
leave the Reserve Bank of India with little choice than to raise interest
rates in order to reign in demand and consequently inflation.
The key point to note in all this though is that unlike the developed
economies, in India's case it is the supply side inability to match up to
demand which is creating problems. Therefore, despite all problems
mentioned above I believe India's fundamental story remains intact. For a
long term investor the current situation provides an opportunity to enter
the Indian markets at relatively benign valuations as markets have started
factoring in most of the negatives already. It is important to remember that
India offers a structural growth story and while equity markets may move
up or down in the interim, in the long run they should reward investors by
delivering higher returns than most other asset classes.
Equity Way Forward
The Q2FY12 result season is around the corner. We believe pressure on
corporate results would continue and results could come in below the market's
expectations. The Corporate result performance of Q2FY12 would be crucial to
decide further course of the market. Equity market is trading at 14.0x FY12 and
12.0x FY13 expected earnings, which is attractive vis-à-vis history.
Dear Policyholder,
The volatility in global markets continued during the last 6
months. It has been a somber period for the global
economy with a long string of negative news flow. While
Sovereign Debt default has come to the forefront once
again in Europe, a faltering economic growth in the US has
ignited worries of a double dip recession. Murmurs out of
China of rising Non-Performing Assets (NPAs) in the
banking system have put to challenge the often repeated
view that China is heading for a soft landing. India has not
been spared either, but its problems are caused more by
inflation and the perception of Governance Deficit at the
Centre. The steady flow of scams and the perception of
Government’s inability to take and carry through with its
reforms have created a crisis of confidence in the markets
and business in general.
Structurally, India is a dream economy relative to the
developed world. In a scenario where the developed
world is struggling for growth with high debt and an ageing
population, India's young population has taken demand to
a level where supply has fallen far behind. With its relative
SEPTEMBER 2011
Investmenttracker
empowered