empowering people, extraordinary...
TRANSCRIPT
IAMGOLD Q1 2017 Results
May 10, 2017
Empowering People, Extraordinary Performance
l TSX: IMG l NYSE: IAG l
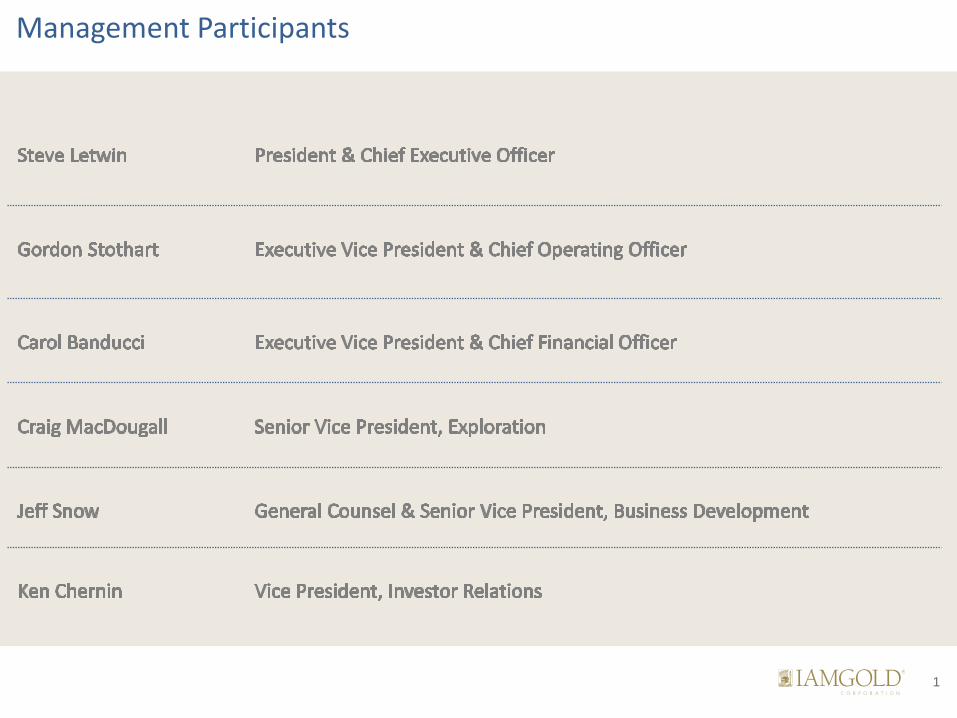
Management Participants
1
Cautionary Statement
All information included in this presentation, including any information as to the Company’s future financial or operating performance, and other statements that express management’s expectations or estimates of future performance, other than statements of historical fact, constitute forward looking information or forward-looking statements and are based on expectations, estimates and projections as of the date of this presentation. Forward-looking statements contained in this presentation include, without limitation, statements with respect to: the Company’s guidance for production, cash costs, all-in sustaining costs, depreciation expense, effective tax rate, and operating margin, capital expenditures, operations outlook, cost management initiatives, development and expansion projects, exploration, the future price of gold, the estimation of mineral reserves and mineral resources, the realization of mineral reserve and mineral resource estimates, the timing and amount of estimated future production, costs of production, permitting timelines, currency fluctuations, requirements for additional capital, government regulation of mining operations, environmental risks, unanticipated reclamation expenses, title disputes or claims and limitations on insurance coverage. Forward-looking statements are provided for the purpose of providing information about management’s current expectations and plans relating to the future. Forward-looking statements are generally identifiable by, but are not limited to the, use of the words “may”, “will”, “should”, “continue”, “expect”, “anticipate”, “estimate”, “believe”, “opportunities”, “intend”, “plan”, ”possible”, “suggest”, “guidance”, “outlook”, “potential”, “prospects”, “seek”, “targets”, “strategy” or “project” or the negative of these words or other variations on these words or comparable terminology. Forward-looking statements are necessarily based upon a number of estimates and assumptions that, while considered reasonable by management, are inherently subject to significant business, economic and competitive uncertainties and contingencies. The Company cautions the reader that reliance on such forward-looking statements involve risks, uncertainties and other factors that may cause the actual financial results, performance or achievements of IAMGOLD to be materially different from the Company’s estimated future results, performance or achievements expressed or implied by those forward-looking statements, and the forward-looking statements are not guarantees of future performance. These risks, uncertainties and other factors include, but are not limited to, changes in the global prices for gold, copper, silver or certain other commodities (such as diesel and electricity); changes in U.S. dollar and other currency exchange rates, interest rates or gold lease rates; risks arising from holding derivative instruments; the level of liquidity and capital resources; access to capital markets, and financing; mining tax regimes; ability to successfully integrate acquired assets; legislative, political or economic developments in the jurisdictions in which the Company carries on business; operating or technical difficulties in connection with mining or development activities; laws and regulations governing the protection of the environment; employee relations; availability and increasing costs associated with mining inputs and labour; the speculative nature of exploration and development, including the risks of diminishing quantities or grades of reserves; adverse changes in the Company’s credit rating; contests over title to properties, particularly title to undeveloped properties; and the risks involved in the exploration, development and mining business. With respect to development projects, IAMGOLD’s ability to sustain or increase its present levels of gold production is dependent in part on the success of its projects. Risks and unknowns inherent in all projects include the inaccuracy of estimated reserves and resources, metallurgical recoveries, capital and operating costs of such projects, and the future prices for the relevant minerals. Development projects have no operating history upon which to base estimates of future cash flows. The capital expenditures and time required to develop new mines or other projects are considerable, and changes in costs or construction schedules can affect project economics. Actual costs and economic returns may differ materially from IAMGOLD’s estimates or IAMGOLD could fail to obtain the governmental approvals necessary for the operation of a project; in either case, the project may not proceed, either on its original timing or at all.
For a more comprehensive discussion of the risks faced by the Company, and which may cause the actual financial results, performance or achievements of IAMGOLD to be materially different from the company’s estimated future results, performance or achievements expressed or implied by forward-looking information or forward-looking statements, please refer to the Company’s latest Annual Information Form, filed with Canadian securities regulatory authorities at www.sedar.com, and filed under Form 40-F with the United States Securities Exchange Commission at www.sec.gov/edgar.shtml. The risks described in the Annual Information Form (filed and viewable on www.sedar.com and www.sec.gov/edgar.shtml, and available upon request from the Company) are hereby incorporated by reference into this presentation.
The Company disclaims any intention or obligation to update or revise any forward-looking statements whether as a result of new information, future events or otherwise except as required by applicable law.
2
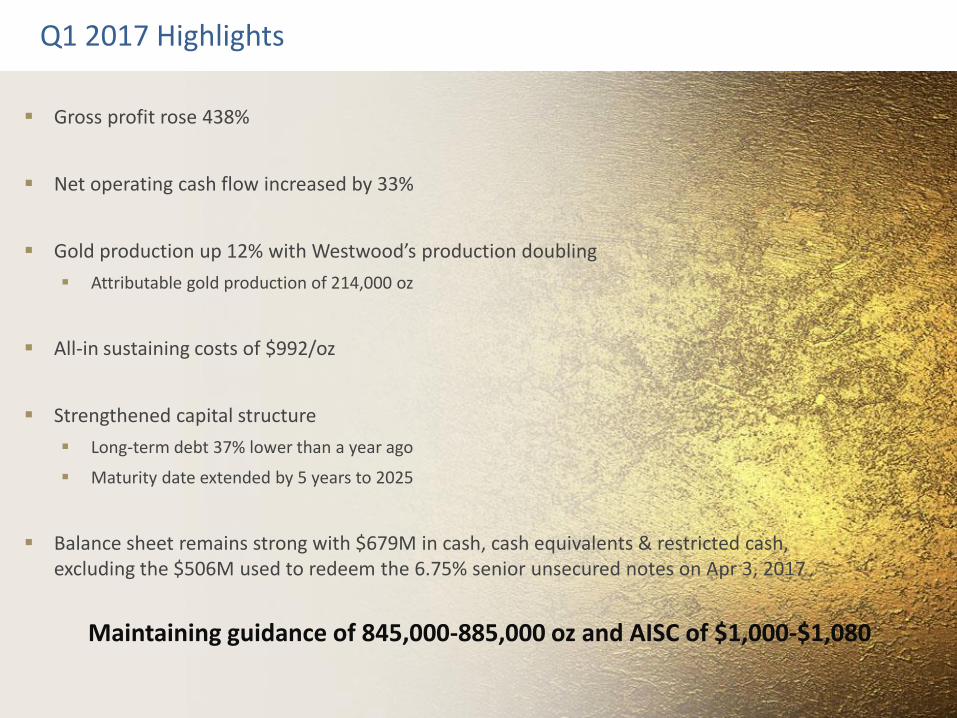
Q1 2017 Highlights
Gross profit rose 438%
Net operating cash flow increased by 33%
Gold production up 12% with Westwood’s production doubling
Attributable gold production of 214,000 oz
All-in sustaining costs of $992/oz
Strengthened capital structure
Long-term debt 37% lower than a year ago
Maturity date extended by 5 years to 2025
Balance sheet remains strong with $679M in cash, cash equivalents & restricted cash, excluding the $506M used to redeem the 6.75% senior unsecured notes on Apr 3, 2017
Maintaining guidance of 845,000-885,000 oz and AISC of $1,000-$1,080
4

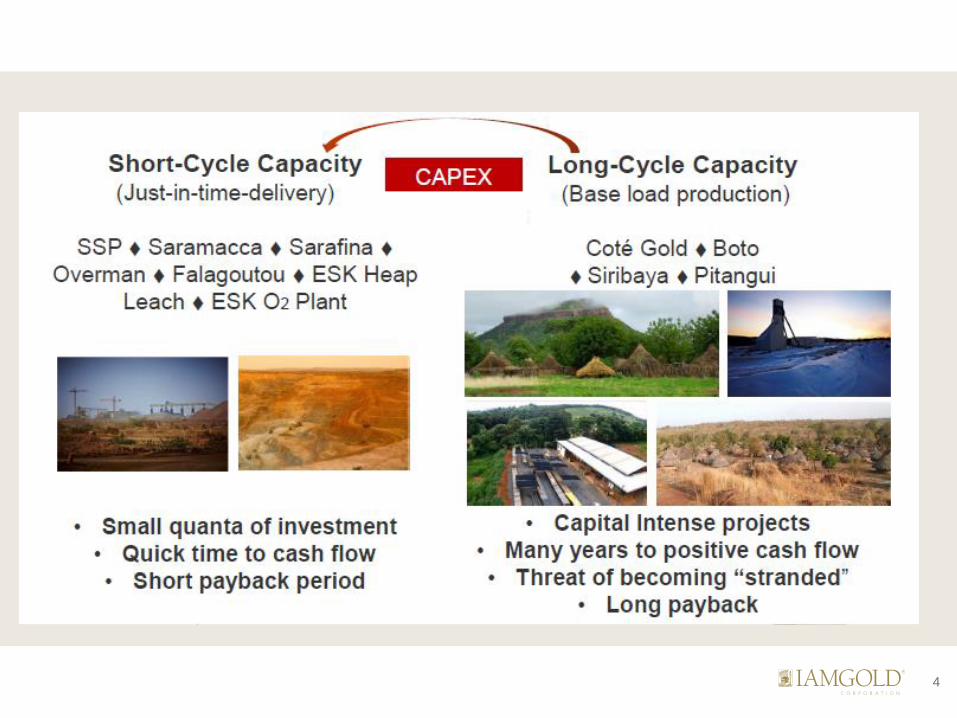
Executing on Growth Strategy
Saramacca
Initial resource expected Q3’17
*Further drilling results show continued high-
grade intercepts
Sadiola Sulphide Expansion Project
Construction to commence when
agreements with Govt of Mali finalized
Westwood Ramp-up
Targeting 180-200k oz by 2019
*Regulators approve re-opening of 104 mining
block
Essakane Exploration
Prospective targets around mine site and at
Falagountou
*Signed PPA to build 15MW solar power plant
Future Growth Options
Cote Gold and other advanced exploration projects in the pipeline
Targeting 25% growth in production by 2020
through organic growth opportunities
5

Financial Review
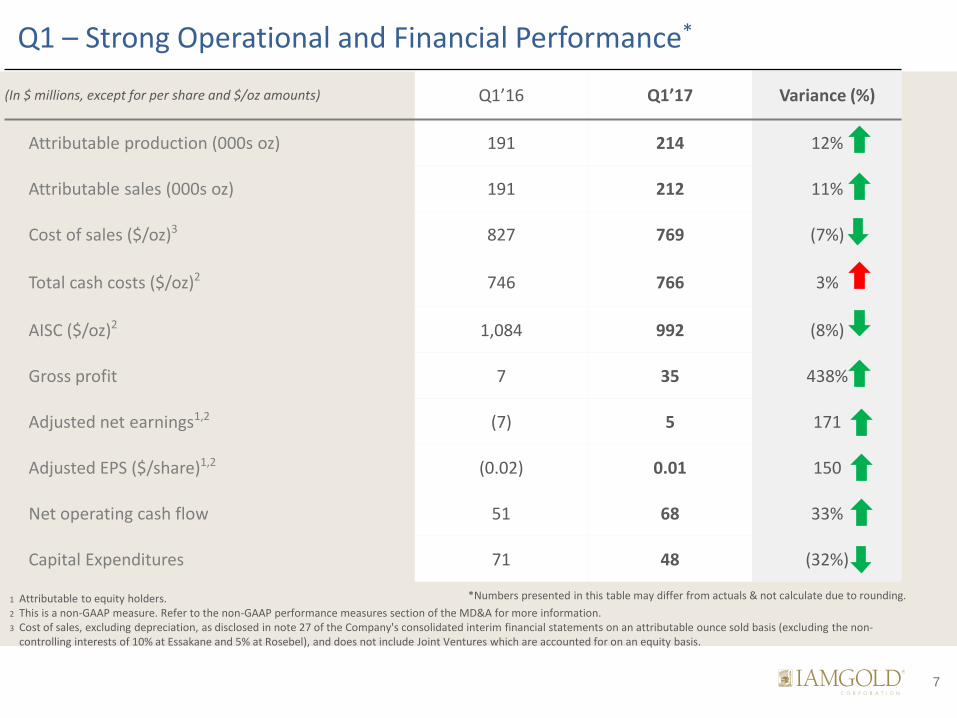
Q1 – Strong Operational and Financial Performance*
(In $ millions, except for per share and $/oz amounts) Q1’16 Q1’17 Variance (%)
Attributable production (000s oz) 191 214 12%
Attributable sales (000s oz) 191 212 11%
Cost of sales ($/oz)3 827 769 (7%)
Total cash costs ($/oz)2 746 766 3%
AISC ($/oz)2 1,084 992 (8%)
Gross profit 7 35 438%
Adjusted net earnings1,2 (7) 5 171
Adjusted EPS ($/share)1,2 (0.02) 0.01 150
Net operating cash flow 51 68 33%
Capital Expenditures 71 48 (32%)
1 Attributable to equity holders. 2 This is a non-GAAP measure. Refer to the non-GAAP performance measures section of the MD&A for more information. 3 Cost of sales, excluding depreciation, as disclosed in note 27 of the Company's consolidated interim financial statements on an attributable ounce sold basis (excluding the non-
controlling interests of 10% at Essakane and 5% at Rosebel), and does not include Joint Ventures which are accounted for on an equity basis.
7
*Numbers presented in this table may differ from actuals & not calculate due to rounding.
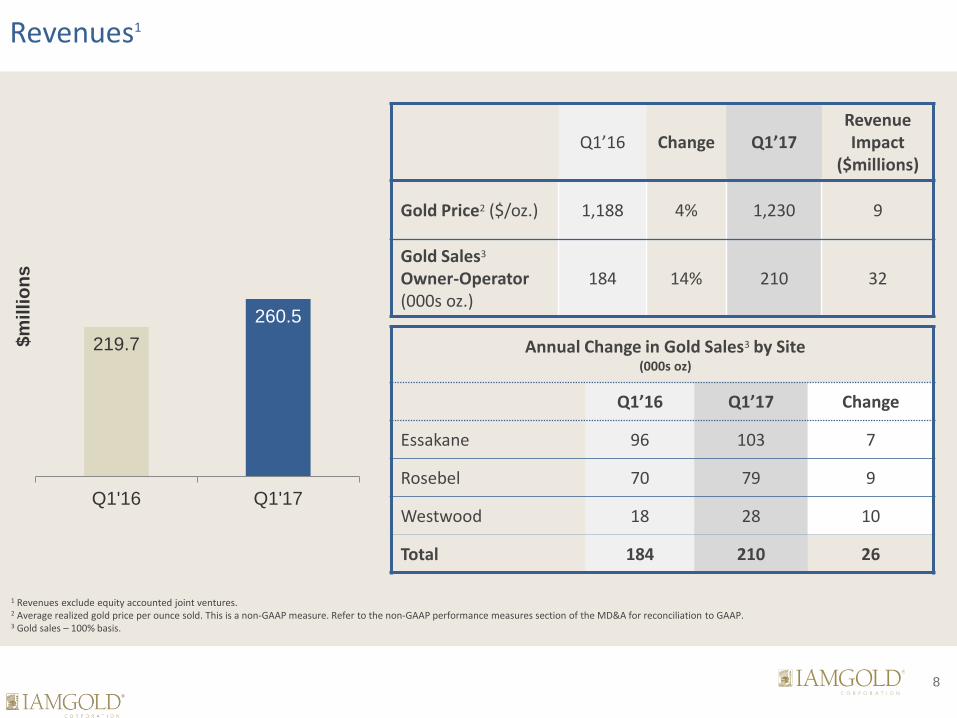
Revenues1
219.7
260.5
Q1'16 Q1'17
$m
illi
on
s
Q1’16 Change Q1’17 Revenue Impact
($millions)
Gold Price2 ($/oz.) 1,188 4% 1,230 9
Gold Sales3
Owner-Operator (000s oz.)
184 14% 210 32
Annual Change in Gold Sales3 by Site (000s oz)
Q1’16 Q1’17 Change
Essakane 96 103 7
Rosebel 70 79 9
Westwood 18 28 10
Total 184 210 26
1 Revenues exclude equity accounted joint ventures. 2 Average realized gold price per ounce sold. This is a non-GAAP measure. Refer to the non-GAAP performance measures section of the MD&A for reconciliation to GAAP. 3 Gold sales – 100% basis.
8
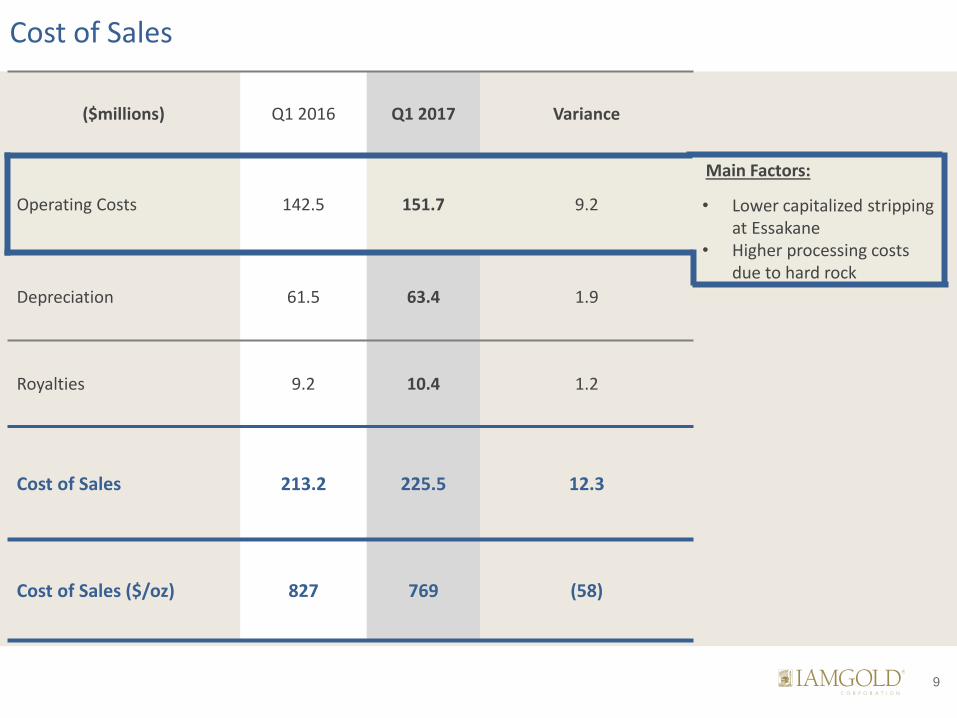
Cost of Sales
($millions) Q1 2016 Q1 2017 Variance
Operating Costs 142.5 151.7 9.2
Depreciation 61.5 63.4 1.9
Royalties 9.2 10.4 1.2
Cost of Sales 213.2 225.5 12.3
Cost of Sales ($/oz) 827 769 (58)
Main Factors:
• Lower capitalized stripping at Essakane
• Higher processing costs due to hard rock
9
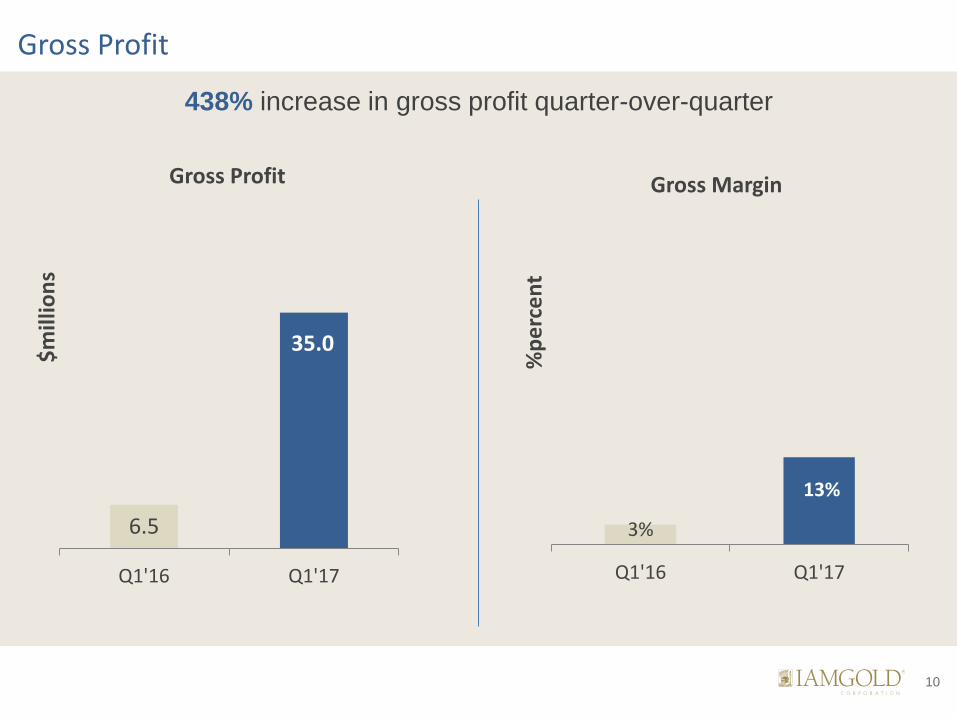
Gross Profit
6.5
35.0
Q1'16 Q1'17
$m
illio
ns
Gross Profit
3%
13%
Q1'16 Q1'17
%p
erc
en
t
Gross Margin
438% increase in gross profit quarter-over-quarter
10
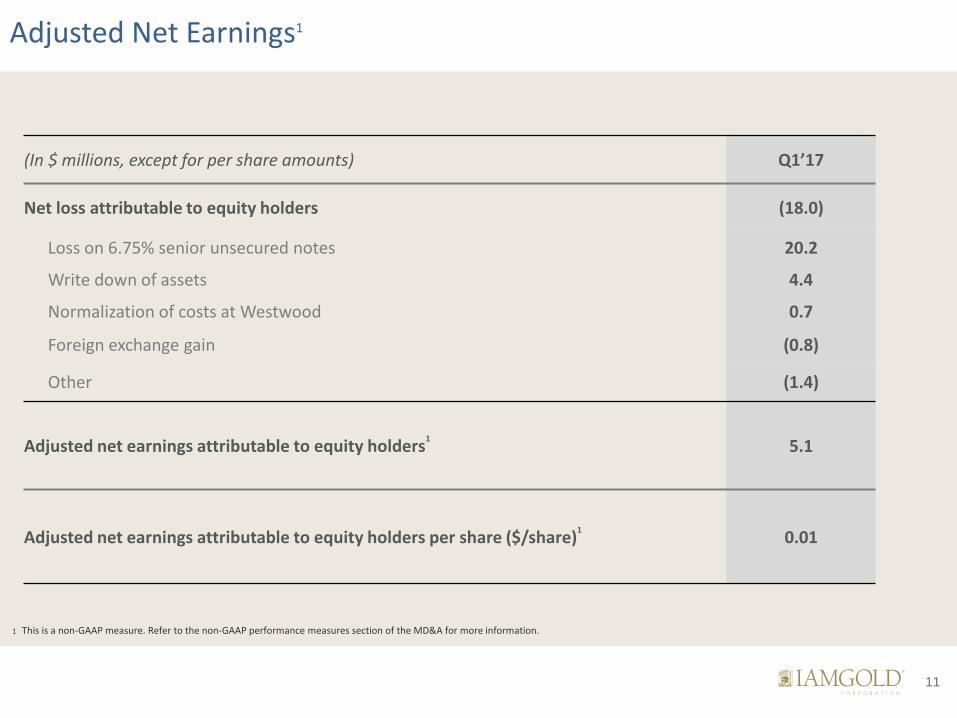
Adjusted Net Earnings1
(In $ millions, except for per share amounts) Q1’17
Net loss attributable to equity holders (18.0)
Loss on 6.75% senior unsecured notes 20.2
Write down of assets 4.4
Normalization of costs at Westwood 0.7
Foreign exchange gain (0.8)
Other (1.4)
Adjusted net earnings attributable to equity holders1 5.1
Adjusted net earnings attributable to equity holders per share ($/share)1 0.01
1 This is a non-GAAP measure. Refer to the non-GAAP performance measures section of the MD&A for more information.
11

Gold Margins1,2
$442 $464
Q1'16 Q1'17
Go
ld M
argi
n (
$U
S/o
z)
Due to 4% increase in gold price
1 Consists of Essakane, Rosebel, Westwood and the JVs on an attributable basis. 2 This is a non-GAAP measure. Refer to the non-GAAP performance measures section of the MD&A for more information.
12
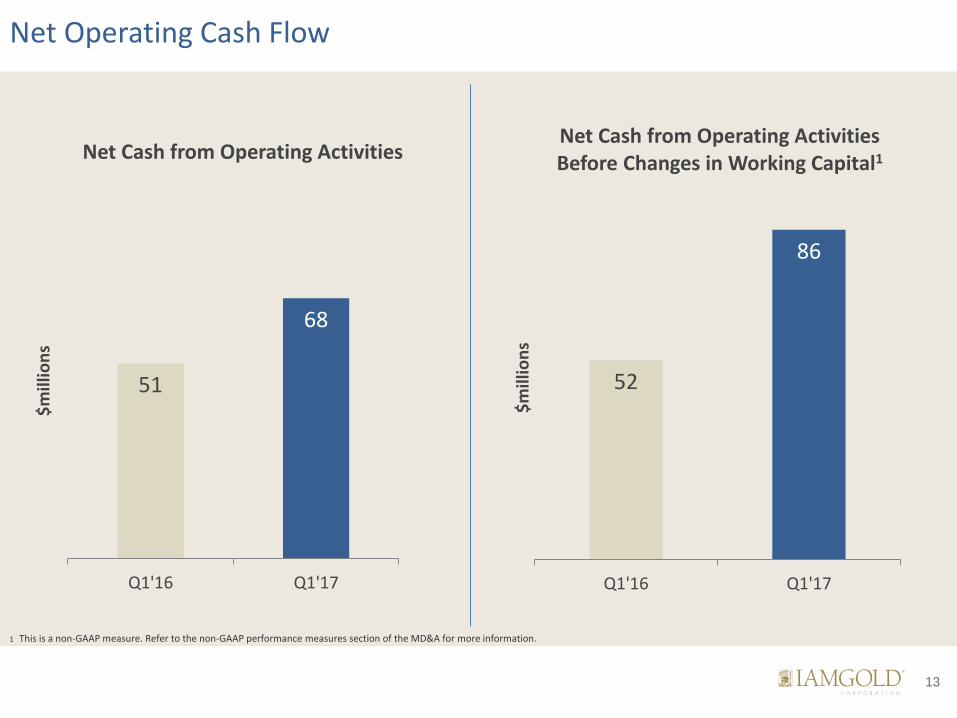
Net Operating Cash Flow
51
68
Q1'16 Q1'17
$m
illio
ns
Net Cash from Operating Activities
52
86
Q1'16 Q1'17
$m
illio
ns
Net Cash from Operating Activities Before Changes in Working Capital1
1 This is a non-GAAP measure. Refer to the non-GAAP performance measures section of the MD&A for more information.
13

Liquidity
Cash, cash equivalents & restricted cash1 $1,185
Redemption of 6.75% senior unsecured notes (April 3, 2017) -$506
Cash, cash equivalents & restricted cash1 $679
Available credit facility1 $247
Total Liquidity* $814
1 As at March 31, 2017.
*Excludes restricted cash of $112M (as at March 31, 2017).
14

Operations

Q1’17 Production & Costs Summary
Attributable Production
(oz)
Cost of Sales1,2
($/oz produced)
Total Cash Costs1
($/oz produced)
AISC1
($/oz sold)
Essakane 93,000 $793 $766 $973
Rosebel 74,000 $737 $727 $886
Westwood 30,000 $7923 $759 $965
Sadiola 16,000 -- $957 $1,016
Total 214,000* $769 $766 $992
1 This is a non-GAAP measure. Refer to the non-GAAP performance measures section of the MD&A for more information. 2 Cost of sales, excluding depreciation, as disclosed in note 27 of the Company's consolidated interim financial statements on an attributable ounce sold basis (excluding the non-controlling
interests of 10% at Essakane and 5% at Rosebel), and does not include Joint Ventures which are accounted for on an equity basis. 3 Does not consider the impacetof normalization of costs and revised ramp-up for the three months ended Mar 31, 2017 of $25/oz sold
*Includes 1,000 oz from Yatela, which is in closure mode.
16

Q1’17 Actuals
Attributable gold production 93,000
TCC1 $766
AISC1 $973
Head grade (g/t) 1.07
2017 Guidance
Attributable gold production 370,000 to 380,000
LOM 2023+
Essakane – Burkina Faso (90%)
Q1 Highlights
• Attributable production up 6%
• 27% increase in throughput despite hard rock
• Reduced maintenance downtime and increased grinding capacity
as a result of new SAG mill liner design
• Grades and recoveries impacted by mine sequencing and higher graphitic ore content
• AISC down 13% due to lower sustaining CAPEX
Focused on Performance Optimization
• Improve recoveries
- Commissioned intensive leach reactor
- Completing geometallurgical study
- Moving ahead with oxygen plant
• Improving mining efficiency
- Commissioning additional loaders and production drills
• Reduce energy costs
- Signed power purchase agreement to develop 15 MW solar plant
1. This is a non-GAAP measure. Refer to the non-GAAP performance measures section of this MD&A.
Following up on heap leach studies based on results from
preliminary testwork
17
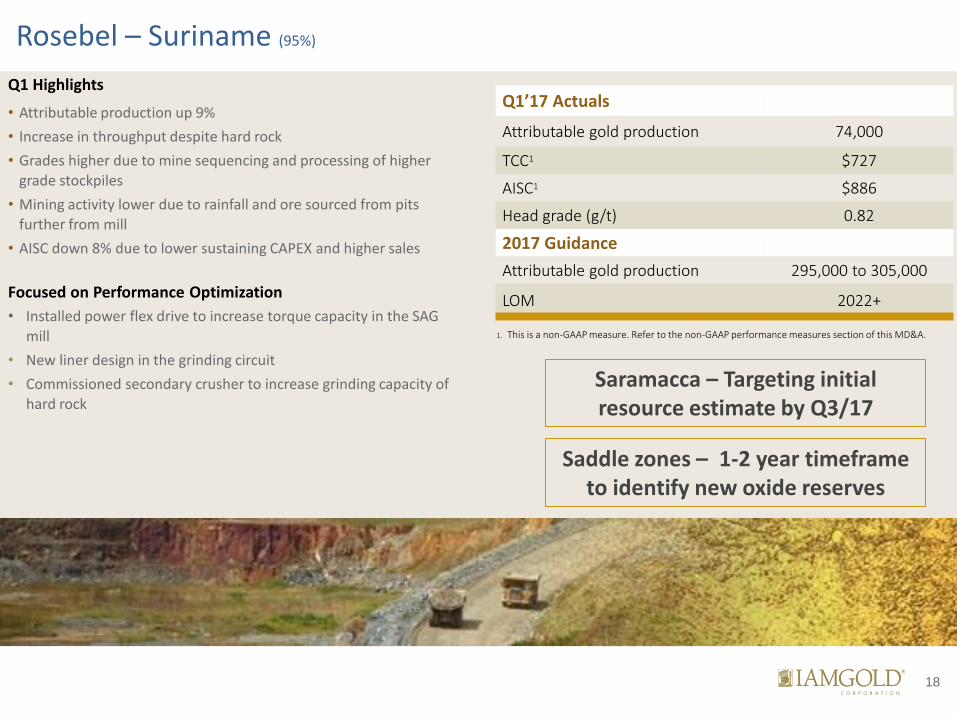
Rosebel – Suriname (95%)
Q1’17 Actuals
Attributable gold production 74,000
TCC1 $727
AISC1 $886
Head grade (g/t) 0.82
2017 Guidance
Attributable gold production 295,000 to 305,000
LOM 2022+
1. This is a non-GAAP measure. Refer to the non-GAAP performance measures section of this MD&A.
Q1 Highlights
• Attributable production up 9%
• Increase in throughput despite hard rock
• Grades higher due to mine sequencing and processing of higher
grade stockpiles
• Mining activity lower due to rainfall and ore sourced from pits further from mill
• AISC down 8% due to lower sustaining CAPEX and higher sales
Focused on Performance Optimization
• Installed power flex drive to increase torque capacity in the SAG
mill
• New liner design in the grinding circuit
• Commissioned secondary crusher to increase grinding capacity of hard rock
Saramacca – Targeting initial resource estimate by Q3/17
Saddle zones – 1-2 year timeframe to identify new oxide reserves
18

Westwood – Quebec (100%)
Q1’17 Actuals
Attributable gold production 30,000
TCC1 $759
AISC1 $965
Head grade (g/t) 6.50
2017 Guidance
Attributable gold production 115,000 to 125,000
LOM 2033+
1. This is a non-GAAP measure. Refer to the non-GAAP performance measures section of this MD&A.
Q1 Highlights
• Attributable production doubled
• 80% increase in throughput and higher grades
• Approval from Quebec regulators to resume mining in the block
(104) affected by the fall of ground in 2015
• All five bypass drifts providing access to 104 block open
• Lower unit costs due to higher rate of production with normalization of costs to be discontinued
• 6 km of underground development completed
Ramp-up on Track
• Completed 25km of underground development in 2016
• Targeting 17 km of lateral development and 3 km of vertical development in 2017
• Expect to be operating at commercial levels in 2017 from 3 of 5 planned mining blocks, including zone where remedial work was completed in 2016
On track for ramp-up to full production by 2019
19

Sadiola – Mali (41%)
Q1’17 Actuals
Attributable gold production 16,000
TCC1 $957
AISC1 $1,016
Head grade (g/t) 0.95
2017 Guidance
Attributable gold production 65,000 to 75,0003
LOM (Oxides only) 2019
LOM (with SSP) 2028
1. This is a non-GAAP measure. Refer to the non-GAAP performance measures section of this MD&A. 2. Includes nominal amount from Yatela which is in closure mode.
Q1 Highlights
• Attributable production down 6%
• Decline in production due to lower grades
• Expect to continue mining oxides into early 2018 and
processing oxides into early 2019
SSP
• Aligned with partner AGA to move Sulphide Project forward
• Project economics refined and optimization study completed
• Intend to commence construction of SSP expansion, pending Malian government renewing construction and operating permits; power agreement and fiscal terms
20

Exploration
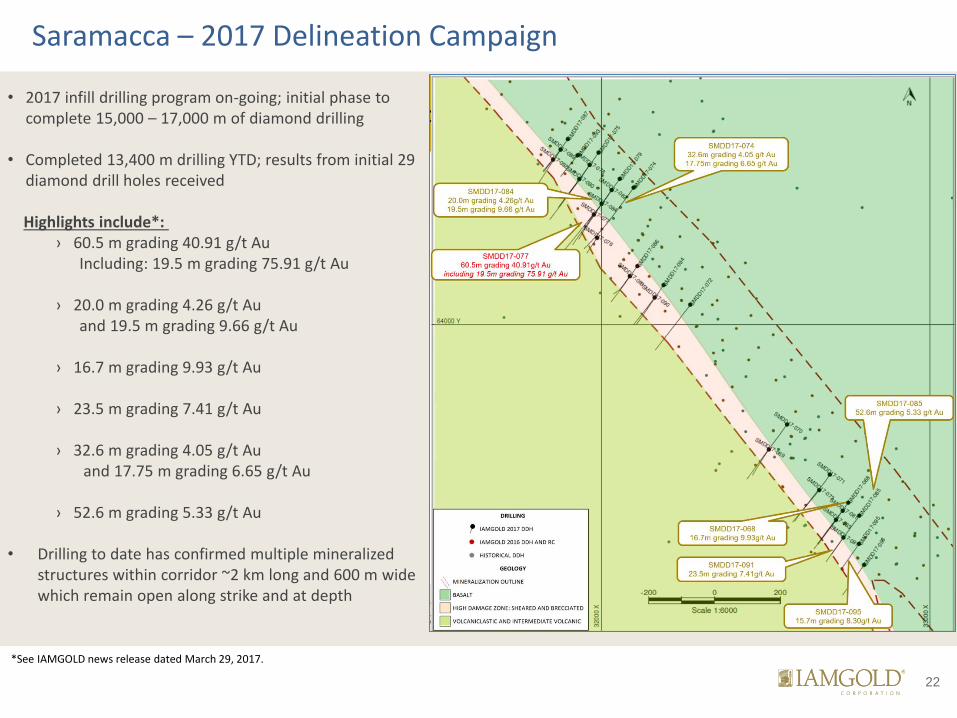
Saramacca – 2017 Delineation Campaign
• 2017 infill drilling program on-going; initial phase to complete 15,000 – 17,000 m of diamond drilling
• Completed 13,400 m drilling YTD; results from initial 29 diamond drill holes received
Highlights include*:
› 60.5 m grading 40.91 g/t Au Including: 19.5 m grading 75.91 g/t Au
› 20.0 m grading 4.26 g/t Au and 19.5 m grading 9.66 g/t Au
› 16.7 m grading 9.93 g/t Au
› 23.5 m grading 7.41 g/t Au
› 32.6 m grading 4.05 g/t Au and 17.75 m grading 6.65 g/t Au
› 52.6 m grading 5.33 g/t Au
• Drilling to date has confirmed multiple mineralized structures within corridor ~2 km long and 600 m wide which remain open along strike and at depth
*See IAMGOLD news release dated March 29, 2017.
22
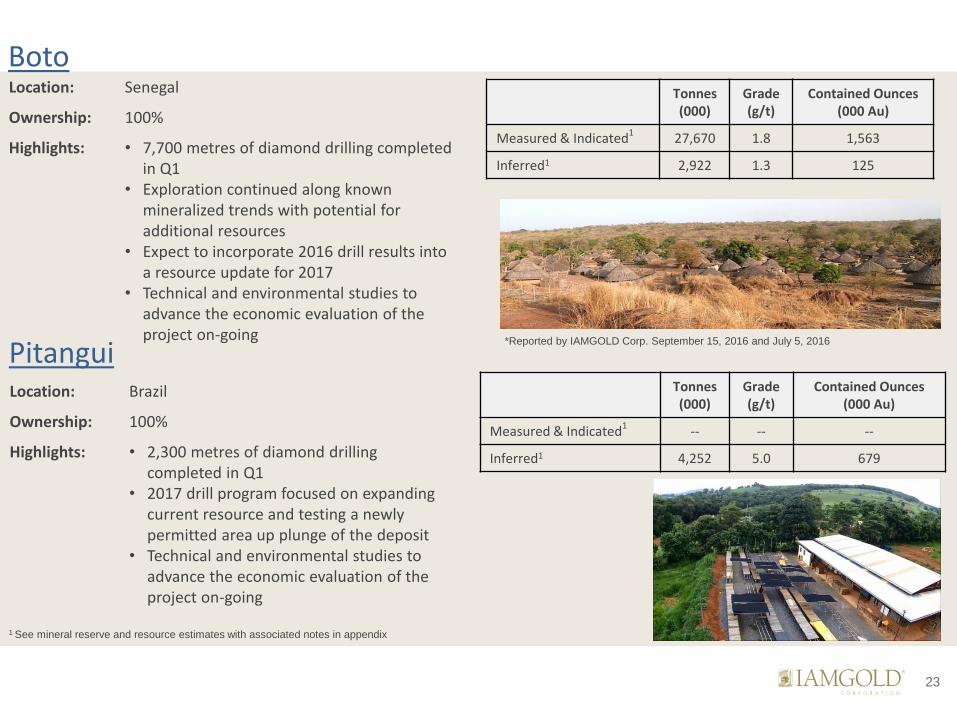
Location: Brazil
Ownership: 100%
Highlights: • 2,300 metres of diamond drilling completed in Q1
• 2017 drill program focused on expanding current resource and testing a newly permitted area up plunge of the deposit
• Technical and environmental studies to advance the economic evaluation of the project on-going
Location: Senegal
Ownership: 100%
Highlights: • 7,700 metres of diamond drilling completed in Q1
• Exploration continued along known mineralized trends with potential for additional resources
• Expect to incorporate 2016 drill results into a resource update for 2017
• Technical and environmental studies to advance the economic evaluation of the project on-going
Tonnes (000)
Grade (g/t)
Contained Ounces (000 Au)
Measured & Indicated1
27,670 1.8 1,563
Inferred1 2,922 1.3 125
Pitangui
Tonnes (000)
Grade (g/t)
Contained Ounces (000 Au)
Measured & Indicated1 -- -- --
Inferred1 4,252 5.0 679
1 See mineral reserve and resource estimates with associated notes in appendix
Boto
*Reported by IAMGOLD Corp. September 15, 2016 and July 5, 2016
23

Eastern Borosi
Diakha-Siribaya
Location: Mali
Ownership: 100%
Highlights: • 6,300 metres of diamond and RC drilling completed in Q1
• Focused on increasing confidence of the Diakha resource, extending deposit north and southward along strike
• Updated resource estimate expected in 2017
Location: Nicaragua
Ownership: Option Agreement with Calibre Mining
Highlights: • 3,100 metres of diamond drilling completed in Q1 • 2017 drill program focused on resource potential
of Guapinol, Riscos de Oro and East Dome veins • If results merit, will be used to complete an initial
resource estimate • Expect to vest an initial 51% interest in 2017 with
option to earn up to a 70% interest
Tonnes (000)
Grade (g/t)
Contained Ounces (000 Au)
Measured & Indicated1,2 2,102 1.9 129
Inferred1.2 19,816 1.7 1,092
1 On a 100% Basis 2 See mineral reserve and resource estimates with associated notes in appendix
24
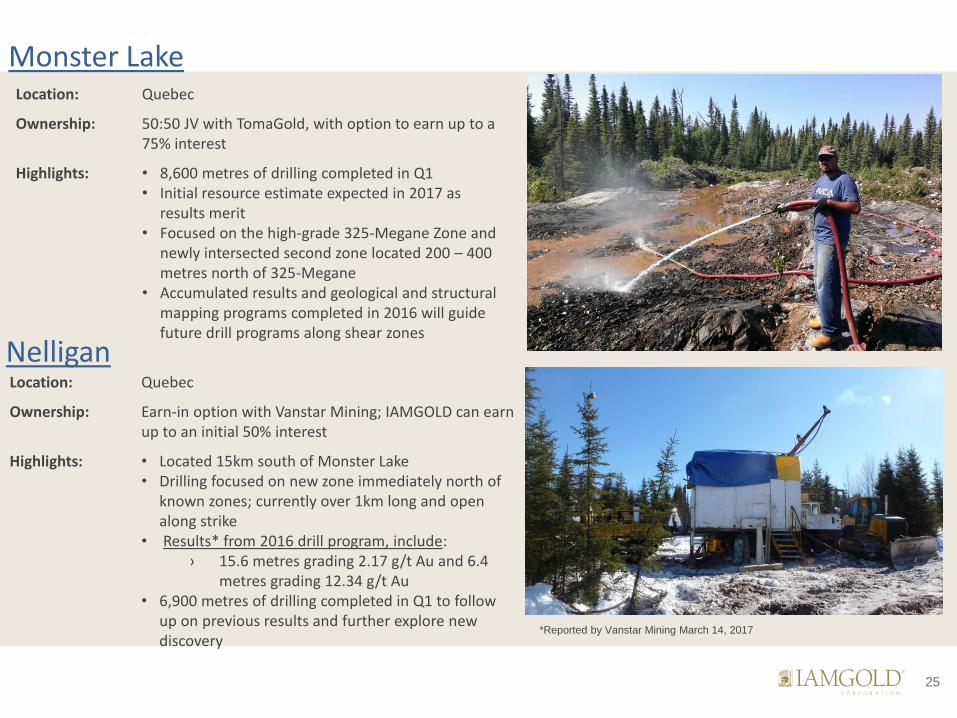
Location: Quebec
Ownership: Earn-in option with Vanstar Mining; IAMGOLD can earn up to an initial 50% interest
Highlights: • Located 15km south of Monster Lake • Drilling focused on new zone immediately north of
known zones; currently over 1km long and open along strike
• Results* from 2016 drill program, include: › 15.6 metres grading 2.17 g/t Au and 6.4
metres grading 12.34 g/t Au • 6,900 metres of drilling completed in Q1 to follow
up on previous results and further explore new discovery
Location: Quebec
Ownership: 50:50 JV with TomaGold, with option to earn up to a 75% interest
Highlights: • 8,600 metres of drilling completed in Q1 • Initial resource estimate expected in 2017 as
results merit • Focused on the high-grade 325-Megane Zone and
newly intersected second zone located 200 – 400 metres north of 325-Megane
• Accumulated results and geological and structural mapping programs completed in 2016 will guide future drill programs along shear zones
Monster Lake
*Reported by Vanstar Mining March 14, 2017
Nelligan
25

Timeline For Growth Catalysts – 2017 to 2020
2018 – 2020
2017
Westwood
• Full ramp-up by 2019
Sadiola Sulphide Expansion
• Production 2019/2020
Boto
• FS in 2017, potential start up in 2019
Loma Larga
• Longer term potential
Sadiola
• Sulphide Expansion Project construction start
Côté Gold
• PFS to be released summer 2017 and initiate FS
Rosebel
• Initial resource estimate at Saramacca deposit in Q3
Pitangui
• Advance evaluation studies and revise mineral resource estimate in Q4
Boto Gold
• Resource update in Q4 and evaluation studies to continue
Essakane
• Updated resources at Falagountou satellite deposit
Diakha-Siribaya • Resource update by
year end
26

Appendix

1. Expansionary capital expenditures exclude the construction costs for the Sadiola sulphide project. 2. Capitalized borrowing costs are not included. 3. Includes $20 million of capitalized exploration expenditures.
$millions Sustaining Non-Sustaining Total3
Essakane $85 $5 $90
Rosebel $65 $5 $70
Westwood $20 $45 $65
Owner-operator $170 $55 $225
Corporate and Development Projects – $10 $10
Total owner-operator $170 $65 $235
Sadiola (Joint Venture)1 $5 $10 $15
Total2 $175 $75 $250 (±5%)
2017 Capex Outlook
28
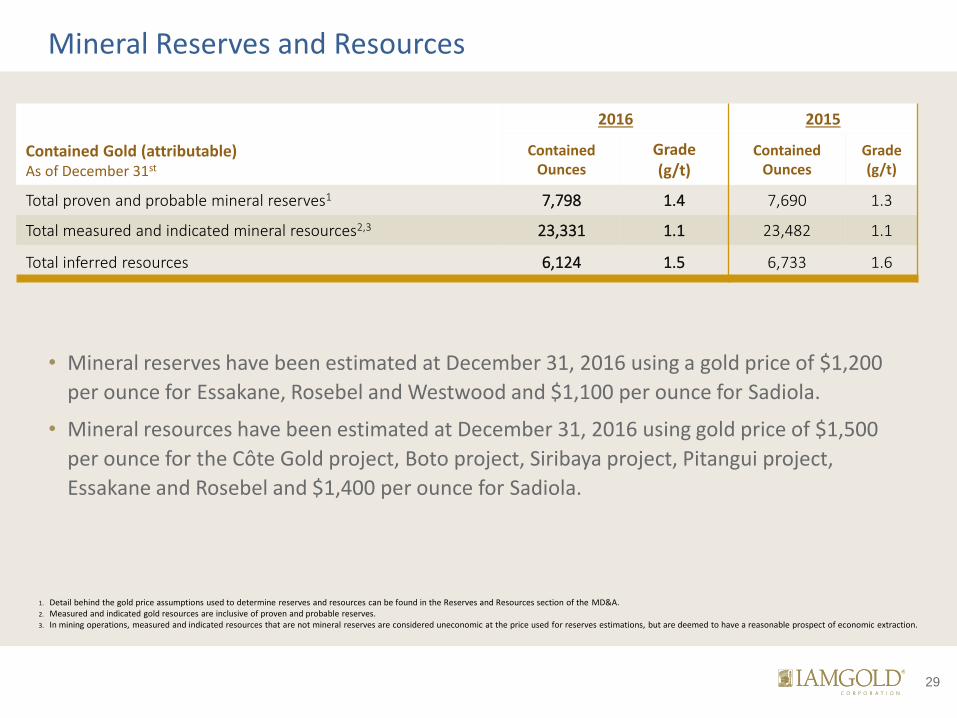
Mineral Reserves and Resources
1. Detail behind the gold price assumptions used to determine reserves and resources can be found in the Reserves and Resources section of the MD&A.
2. Measured and indicated gold resources are inclusive of proven and probable reserves. 3. In mining operations, measured and indicated resources that are not mineral reserves are considered uneconomic at the price used for reserves estimations, but are deemed to have a reasonable prospect of economic extraction.
Contained Gold (attributable) As of December 31st
2016 2015
Contained Ounces
Grade (g/t)
Contained Ounces
Grade (g/t)
Total proven and probable mineral reserves1 7,798 1.4 7,690 1.3
Total measured and indicated mineral resources2,3 23,331 1.1 23,482 1.1
Total inferred resources 6,124 1.5 6,733 1.6
• Mineral reserves have been estimated at December 31, 2016 using a gold price of $1,200
per ounce for Essakane, Rosebel and Westwood and $1,100 per ounce for Sadiola.
• Mineral resources have been estimated at December 31, 2016 using gold price of $1,500
per ounce for the Côte Gold project, Boto project, Siribaya project, Pitangui project,
Essakane and Rosebel and $1,400 per ounce for Sadiola.
29

Longer-Term Growth with Côté Gold
Project Highlights
• One of Canada’s largest undeveloped gold deposits
• Located in a prolific mining region six hours north of Toronto
• Positive PEA indicates potential for low-cost mine with a 21 year mine life
• Provincial and Federal Government have approved Environmental Assessment
• Exploration continuing on 500 sq. km. land package to develop and assess targets
• Pre-feasibility study expected in summer 2017
8.4M oz Indicated &
1.2M oz Inferred 230kV Transmission Option
115kV Transmission Option
30
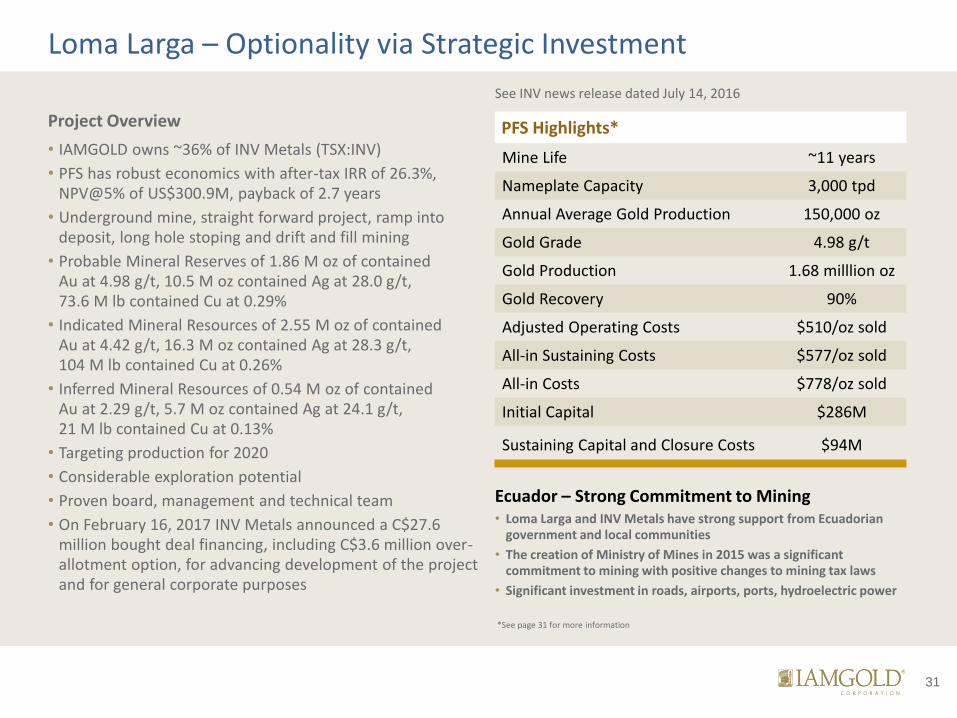
Loma Larga – Optionality via Strategic Investment
Project Overview
• IAMGOLD owns ~36% of INV Metals (TSX:INV)
• PFS has robust economics with after-tax IRR of 26.3%, NPV@5% of US$300.9M, payback of 2.7 years
• Underground mine, straight forward project, ramp into deposit, long hole stoping and drift and fill mining
• Probable Mineral Reserves of 1.86 M oz of contained Au at 4.98 g/t, 10.5 M oz contained Ag at 28.0 g/t, 73.6 M lb contained Cu at 0.29%
• Indicated Mineral Resources of 2.55 M oz of contained Au at 4.42 g/t, 16.3 M oz contained Ag at 28.3 g/t, 104 M lb contained Cu at 0.26%
• Inferred Mineral Resources of 0.54 M oz of contained Au at 2.29 g/t, 5.7 M oz contained Ag at 24.1 g/t, 21 M lb contained Cu at 0.13%
• Targeting production for 2020
• Considerable exploration potential
• Proven board, management and technical team
• On February 16, 2017 INV Metals announced a C$27.6 million bought deal financing, including C$3.6 million over-allotment option, for advancing development of the project and for general corporate purposes
Ecuador – Strong Commitment to Mining • Loma Larga and INV Metals have strong support from Ecuadorian
government and local communities
• The creation of Ministry of Mines in 2015 was a significant commitment to mining with positive changes to mining tax laws
• Significant investment in roads, airports, ports, hydroelectric power
PFS Highlights*
Mine Life ~11 years
Nameplate Capacity 3,000 tpd
Annual Average Gold Production 150,000 oz
Gold Grade 4.98 g/t
Gold Production 1.68 milllion oz
Gold Recovery 90%
Adjusted Operating Costs $510/oz sold
All-in Sustaining Costs $577/oz sold
All-in Costs $778/oz sold
Initial Capital $286M
Sustaining Capital and Closure Costs $94M
See INV news release dated July 14, 2016
*See page 31 for more information
31

Technical Information and Qualified Person/Quality Control Notes The mineral resource estimates contained in this presentation have been prepared in accordance with National Instrument 43-101 Standards of Disclosure for Mineral Projects
(“NI 43-101”). The “Qualified Person” responsible for the supervision of the preparation and review of all resource and reserve estimates for IAMGOLD is Lise Chenard, Eng.,
Director, Mining Geology. Lise has worked in the mining industry for more than 30 years, mainly in operations, project development and consulting. She joined IAMGOLD in
April 2013 and acquired her knowledge of the Company’s operations and projects through site visits, information reviews and ongoing communication and oversight of mine
site technical service teams or consultants responsible for resource and reserve modeling and estimation. She is considered a “Qualified Person” for the purposes of NI 43-101
with respect to the mineralization being reported on. The technical information has been included herein with the consent and prior review of the above noted Qualified
Person. The Qualified person has verified the data disclosed, and data underlying the information or opinions contained herein.
The technical information for Sadiola contained in this presentation has been prepared in accordance with National Instrument 43-101 Standards of Disclosure for Mineral
Projects (“NI 43-101”). The “Qualified Person” responsible for the supervision of the preparation and review of all technical information for IAMGOLD is Philippe Gaulthier, BSc.
Mechanical Engineering and MASc Mechanical Engineering, the Director Development Projects for IAMGOLD. Philippe has worked as mechanical engineer for 28 years, mainly
in mining and project development. He joined IAMGOLD in 2008 and acquired his knowledge of Sadiola through his work on the Infrastructure and Plant Engineering for an
internal feasibility report in 2010, his work to update the documentation and engineering subsequent to that report and his most recent site visit on August 28, 2015. He is
considered a “Qualified Person” for the purposes of NI 43-101 with respect to the technical information being reported on. The technical information has been included herein
with the consent and prior review of the above noted Qualified Person. The Qualified person has read and verified the data disclosed, and data underlying the information or
opinions contained herein.
Drilling results in this presentation have been prepared in accordance with National Instrument 43-101 Standards of Disclosure for Mineral Projects. The sampling of, and assay
data from, drill core is monitored through the implementation of a quality assurance - quality control (QA-QC) program designed to follow industry best practice. The
“Qualified Person” responsible for the supervision of the preparation, verification, and review of these results is Craig MacDougall, P.Geo., Senior Vice President, Exploration
for IAMGOLD. Mr. MacDougall is a Qualified Person as defined by National Instrument 43-101.
Loma Larga, Slide 30, PEA footnote: Qualified Persons and NI 43‐101 Disclosure The technical information in this presentation has been prepared by independent Qualified Persons employed by Roscoe Postle Associates Inc. (“RPA”), including Katharine Masun, P.Geo. (Mineral Resources), Jason Cox, P.Eng. (Mineral Reserves and economics), and Kathleen Altman, Ph.D., P.E. (metallurgy and processing). By virtue of education and relevant experience, the aforementioned are "Qualified Persons" for the purpose of NI 43‐101.
For readers to fully understand the information in this presentation, they should read the Technical Report in its entirety, including all qualifications, assumptions and exclusions that relate to the information set out in the Technical Report which qualifies the technical information contained in the Technical Report. The Technical Report is intended to be read as a whole, and sections should not be read or relied upon out of context. The Technical Report describes the Mineral Resource and Mineral Reserve estimation methodologies and the assumptions used, and to which those estimates are subject. INV Metals’ AIF includes details of certain risk factors that could materially affect the potential development of the Mineral Resources and Mineral Reserves and should be considered carefully. A discussion of these and other factors is contained in “Risk Factors” and elsewhere in the Company’s AIF, which was filed on SEDAR on March 1, 2016.
32

Empowering People, Extraordinary Performance
Ken Chernin VP, Investor Relations T: 416-360-4743
Laura Young Director, Investor Relations T: 416-933-4952
Shae Frosst Associate, Investor Relations T: 416-933-4738
l TSX: IMG l NYSE: IAG l