empowhr: section 18 - data warehouse - nfc.usda.gov · the data warehouse allows users with a...
TRANSCRIPT

National Finance Center Office of the Chief Financial Officer U.S. Department of Agriculture May 2010
EmpowHR: Section 18 - Data Warehouse
PUBLICATION CATEGORY HR and Payroll Processing
PROCEDURE MANUAL EmpowHR
SECTION 18 Data Warehouse

Title 1, Chapter 17EmpowHR Version 9.0
i
Table Of Contents
Business Intelligence (BI) and Data Warehouse Overview 1. . . . . . . . . . . . . . . .
Security 2. . . . . . . . . . . . . . . . . . . . . . . . . . . . . . . . . . . . . . . . . . . . . . . . . . . . . . . . . . . . . . .
Answers Web Catalog 3. . . . . . . . . . . . . . . . . . . . . . . . . . . . . . . . . . . . . . . . . . . . . . . . . .
Exporting 4. . . . . . . . . . . . . . . . . . . . . . . . . . . . . . . . . . . . . . . . . . . . . . . . . . . . . . . . . . . . .
Dashboards 5. . . . . . . . . . . . . . . . . . . . . . . . . . . . . . . . . . . . . . . . . . . . . . . . . . . . . . . . . . . Navigating in BI Interactive Dashboards 6. . . . . . . . . . . . . . . . . . . . . . . . . . . . . . . . . . .
Interactive Dashboards 6. . . . . . . . . . . . . . . . . . . . . . . . . . . . . . . . . . . . . . . . . . . . . . Common Terms 6. . . . . . . . . . . . . . . . . . . . . . . . . . . . . . . . . . . . . . . . . . . . . . Edit a Dashboard 7. . . . . . . . . . . . . . . . . . . . . . . . . . . . . . . . . . . . . . . . . . . . .
Add a New Page to a Dashboard 8. . . . . . . . . . . . . . . . . . . . . . . . . . . . . Add a Column to a Dashboard 11. . . . . . . . . . . . . . . . . . . . . . . . . . . . . . . Dashboard Properties 12. . . . . . . . . . . . . . . . . . . . . . . . . . . . . . . . . . . . . . PDF and Print Control 28. . . . . . . . . . . . . . . . . . . . . . . . . . . . . . . . . . . . .
Page Options 33. . . . . . . . . . . . . . . . . . . . . . . . . . . . . . . . . . . . . . . . . . . . . . . . View a Dashboard 35. . . . . . . . . . . . . . . . . . . . . . . . . . . . . . . . . . . . . . . . . . . . . . . . . . Navigate to a Dashboard Page 35. . . . . . . . . . . . . . . . . . . . . . . . . . . . . . . . . . . . . . . . Keyboard Shortcuts 35. . . . . . . . . . . . . . . . . . . . . . . . . . . . . . . . . . . . . . . . . . . . . . . .
My Dashboard 37. . . . . . . . . . . . . . . . . . . . . . . . . . . . . . . . . . . . . . . . . . . . . . . . . . . . . . . . . BI Publisher 37. . . . . . . . . . . . . . . . . . . . . . . . . . . . . . . . . . . . . . . . . . . . . . . . . . . . . . . . . BI Delivers 38. . . . . . . . . . . . . . . . . . . . . . . . . . . . . . . . . . . . . . . . . . . . . . . . . . . . . . . . . .
Manage Catalog 39. . . . . . . . . . . . . . . . . . . . . . . . . . . . . . . . . . . . . . . . . . . . . . . . . . . Create New iBot 48. . . . . . . . . . . . . . . . . . . . . . . . . . . . . . . . . . . . . . . . . . . . . . . . . . . Edit My Account 66. . . . . . . . . . . . . . . . . . . . . . . . . . . . . . . . . . . . . . . . . . . . . . . . . . Show iBots Acting on My Behalf 69. . . . . . . . . . . . . . . . . . . . . . . . . . . . . . . . . . . . .
Marketing 69. . . . . . . . . . . . . . . . . . . . . . . . . . . . . . . . . . . . . . . . . . . . . . . . . . . . . . . . . . . Disconnect Analytics 70. . . . . . . . . . . . . . . . . . . . . . . . . . . . . . . . . . . . . . . . . . . . . . . . . .
Business Intelligence Publisher Engine 71. . . . . . . . . . . . . . . . . . . . . . . . . . . . . . . . .
Reports 72. . . . . . . . . . . . . . . . . . . . . . . . . . . . . . . . . . . . . . . . . . . . . . . . . . . . . . . . . . . . . . .
Getting Started 74. . . . . . . . . . . . . . . . . . . . . . . . . . . . . . . . . . . . . . . . . . . . . . . . . . . . . . . . Accessing BI 74. . . . . . . . . . . . . . . . . . . . . . . . . . . . . . . . . . . . . . . . . . . . . . . . . . . . . . . . Changing Your Password 75. . . . . . . . . . . . . . . . . . . . . . . . . . . . . . . . . . . . . . . . . . . . . . . Exiting from BI 77. . . . . . . . . . . . . . . . . . . . . . . . . . . . . . . . . . . . . . . . . . . . . . . . . . . . . . Performing Common Tasks 78. . . . . . . . . . . . . . . . . . . . . . . . . . . . . . . . . . . . . . . . . . . . .
Viewing a Descriptions on a Dashboard 78. . . . . . . . . . . . . . . . . . . . . . . . . . . . . . . . . Viewing a Saved Request 78. . . . . . . . . . . . . . . . . . . . . . . . . . . . . . . . . . . . . . . . . . . . Printing a Dashboard or Saved Request 79. . . . . . . . . . . . . . . . . . . . . . . . . . . . . . . . . Emailing a Dashboard or Saved Request 79. . . . . . . . . . . . . . . . . . . . . . . . . . . . . . . .

Title 1, Chapter 17EmpowHR Version 9.0
ii
Downloading Results from Answers 80. . . . . . . . . . . . . . . . . . . . . . . . . . . . . . . . . . . Download to Excel 80. . . . . . . . . . . . . . . . . . . . . . . . . . . . . . . . . . . . . . . . . . . . Download Data 80. . . . . . . . . . . . . . . . . . . . . . . . . . . . . . . . . . . . . . . . . . . . . . . Download Web Page (MHTML) 81. . . . . . . . . . . . . . . . . . . . . . . . . . . . . . . . .
Refreshing a BI Interactive Dashboard or BI Request 81. . . . . . . . . . . . . . . . . . . . . . Refreshing Information in the BI Selection Pane 81. . . . . . . . . . . . . . . . . . . . . . . . . . Navigating in BI (Data Warehouse) 81. . . . . . . . . . . . . . . . . . . . . . . . . . . . . . . . . . . .
Links 82. . . . . . . . . . . . . . . . . . . . . . . . . . . . . . . . . . . . . . . . . . . . . . . . . . . . . . . Pages 83. . . . . . . . . . . . . . . . . . . . . . . . . . . . . . . . . . . . . . . . . . . . . . . . . . . . . . Drill Down (Interactive) 83. . . . . . . . . . . . . . . . . . . . . . . . . . . . . . . . . . . . . . . . Sorting 84. . . . . . . . . . . . . . . . . . . . . . . . . . . . . . . . . . . . . . . . . . . . . . . . . . . . . Preferences 84. . . . . . . . . . . . . . . . . . . . . . . . . . . . . . . . . . . . . . . . . . . . . . . . . . Briefing Books 84. . . . . . . . . . . . . . . . . . . . . . . . . . . . . . . . . . . . . . . . . . . . . . . Tabs 87. . . . . . . . . . . . . . . . . . . . . . . . . . . . . . . . . . . . . . . . . . . . . . . . . . . . . . .
Demography 87. . . . . . . . . . . . . . . . . . . . . . . . . . . . . . . . . . . . . . . . . . . . . Grade Distribution 88. . . . . . . . . . . . . . . . . . . . . . . . . . . . . . . . . . . . . . . . Headcount Distribution 89. . . . . . . . . . . . . . . . . . . . . . . . . . . . . . . . . . . . Headcount Trend by Department 90. . . . . . . . . . . . . . . . . . . . . . . . . . . . . Employment Change 91. . . . . . . . . . . . . . . . . . . . . . . . . . . . . . . . . . . . . . Activities by Period Summary 92. . . . . . . . . . . . . . . . . . . . . . . . . . . . . . . Activities by Period Details 93. . . . . . . . . . . . . . . . . . . . . . . . . . . . . . . . . Activities Trend by Department 94. . . . . . . . . . . . . . . . . . . . . . . . . . . . . . Minority Report 95. . . . . . . . . . . . . . . . . . . . . . . . . . . . . . . . . . . . . . . . . . Department Employee Details 96. . . . . . . . . . . . . . . . . . . . . . . . . . . . . . .
Heading Index Index − 1. . . . . . . . . . . . . . . . . . . . . . . . . . . . . . . . . . . . . . .

Title 1, Chapter 17EmpowHR Version 9.0
Data W
areho
use
1
Business Intelligence (BI) and DataWarehouse Overview
Business Intelligence Delivers is the interface used to create alerts based on analytical results. Specificresults can be detected within reports and the appropriate people notified immediately through the Web,or any other type of communication channels. Users with the appropriate permissions can use Oracle BIDelivers to set up the conditions to trigger an alert.
BI application consists of prebuilt interactive dashboards and reports that are built using best practicesand addresses key functional areas within an organization. Dashboards and reports are tailored for eachuser role in an organization.
BI Delivers uses intelligence bots called iBots to detect specific results. iBots are software agents, drivenby schedules or events that can access, filter, and perform analytics on data based on specified criteria.
The BI applications include Extract-Transform-Load (ETL) routines to extract, transform, and load datainto the Data Warehouse. The Data Warehouse allows users with a source of reporting. Data Warehouseintelligently consolidates and enriches data from any source, providing insight into human resourceoperations to identify trends and discover opportunities.
The Data Warehouse offers several Oracle Business Intelligence Enterprise Edition (OBIEE)components which include the following:
Security
Answers Web Catalog
Exporting
Dashboards
My Dashboard
Business Intelligence Publisher Engine
Getting Started
Reports

Title 1, Chapter 17EmpowHR Version 9.0
2
Security
Security controls the access to objects, such as subject areas, tables, and columns. Security is amechanism that provides security for objects stored, such as dashboards, dashboard pages, folders, andreports. A user can view only the objects for which they are authorized.
Security also controls the type and amount of data that is available in a report. Multiple users can run thesame report. The results returned to each user depend on their access rights and roles in the organization.
The Department Tree (Organizational Structure) and the EPM Security Tables (User ID and Roles) areused to retrieve data that the user can access in the Workforce Data Mart (where the data is stored).Proper Permissions and Roles must be given to run reports using the Data Warehouse functionality.

Title 1, Chapter 17EmpowHR Version 9.0
Data W
areho
use
3
Answers Web Catalog
BI Answers provides the answers to business questions. This interface allows users with the appropriatepermissions to build and modify reports, which is also called requests, that allows end users to exploreand interact with information, and present and visualize information using charts, pivot tables, andreports. The results can be formatted, saved, organized and shared with others.
Reports created can be saved in the Catalog and integrated into any dashboard. Results are viewedthrough charts and calculations. The user can use drop-downs to view the results in further detail.
Many features in Answers are self-explanatory, and definitions and summary information appear on eachpage. When more information is available then can fit on one page, a Help button appears. Click thebutton to see more detailed information.
BI Answers is currently available to NFC Administrators and will be availble to agency administrastorsin a future release.

Title 1, Chapter 17EmpowHR Version 9.0
4
Exporting
The results from Answers can be shared with other users. They can be exported to a PDF, HTML byclicking an icon at the bottom of each tab. Answers can also be printed or downloaded in Excel and CSVformat by clicking an icon at the bottom of each tab. Once downloaded, the user can attach and email thefiles as you would any other file.
Title 1, Chapter 17EmpowHR Version 9.0
Data W
areho
use
5
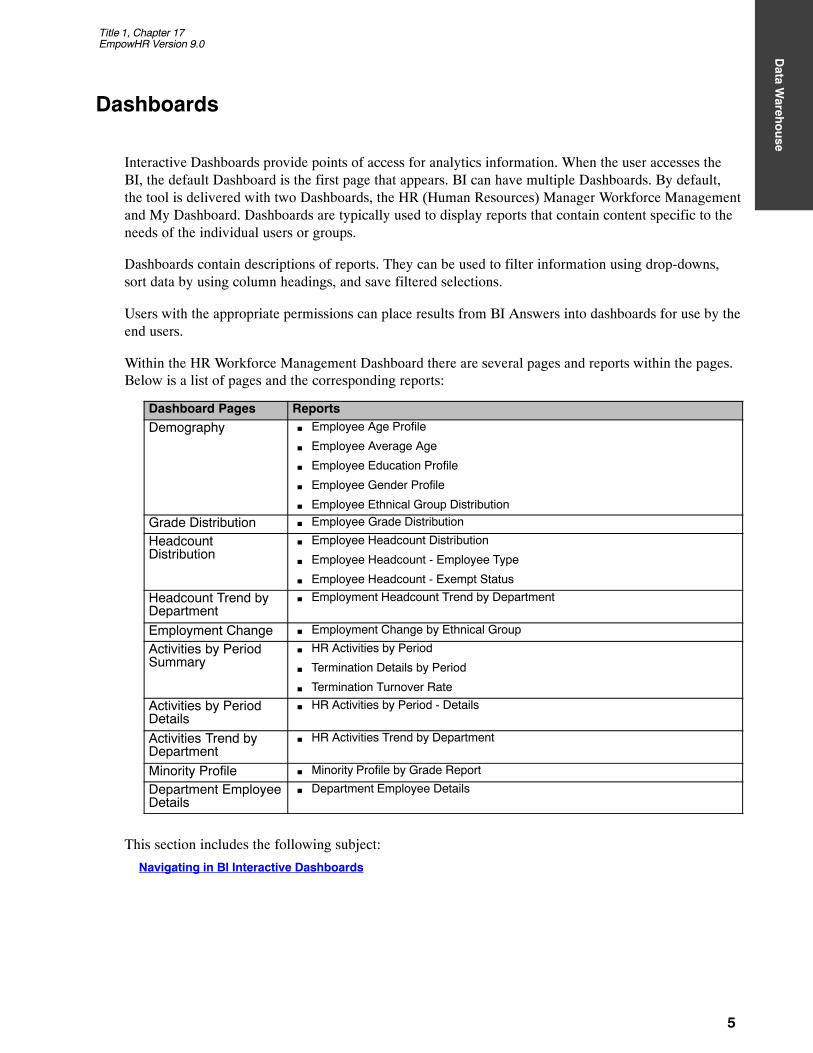
Dashboards
Interactive Dashboards provide points of access for analytics information. When the user accesses theBI, the default Dashboard is the first page that appears. BI can have multiple Dashboards. By default,the tool is delivered with two Dashboards, the HR (Human Resources) Manager Workforce Managementand My Dashboard. Dashboards are typically used to display reports that contain content specific to theneeds of the individual users or groups.
Dashboards contain descriptions of reports. They can be used to filter information using drop-downs,sort data by using column headings, and save filtered selections.
Users with the appropriate permissions can place results from BI Answers into dashboards for use by theend users.
Within the HR Workforce Management Dashboard there are several pages and reports within the pages.Below is a list of pages and the corresponding reports:
Dashboard Pages Reports
Demography � Employee Age Profile
� Employee Average Age
� Employee Education Profile
� Employee Gender Profile
� Employee Ethnical Group Distribution
Grade Distribution � Employee Grade Distribution
HeadcountDistribution
� Employee Headcount Distribution
� Employee Headcount - Employee Type
� Employee Headcount - Exempt Status
Headcount Trend byDepartment
� Employment Headcount Trend by Department
Employment Change � Employment Change by Ethnical Group
Activities by PeriodSummary
� HR Activities by Period
� Termination Details by Period
� Termination Turnover Rate
Activities by PeriodDetails
� HR Activities by Period - Details
Activities Trend byDepartment
� HR Activities Trend by Department
Minority Profile � Minority Profile by Grade Report
Department EmployeeDetails
� Department Employee Details
This section includes the following subject:
Navigating in BI Interactive Dashboards

Title 1, Chapter 17EmpowHR Version 9.0
6
Navigating in BI Interactive Dashboards
This section contains the following topics:
Interactive Dashboards
View a Dashboard
Navigate to a Dashboard Page
Keyboard Shortcuts
Interactive Dashboards
A BI Interactive Dashboard provides personalized views of external information. A Dashboard consistsof one or more pages, which appear on the dashboard. Pages can display anything that can be accessedor opened with a Web Browser, such as saved BI requests, alerts from BI Delivers, images, charts,tables, text, and links to Web sites and documents.
The kinds of content that a dashboard can contain are dashboard objects, content that is saved in the BIPresentation Catalog, and views of folders in the Presentation Catalog. Users with appropriatepermissions can use the Dashboard Editor to add content to a dashboard by dragging and dropping itfrom a selection pane onto the Dashboard Layout page, which consists of columns to align content, andsections inside of columns to hold content. The look of a dashboard, such as background colors and thesize of the text, is controlled by styles and skins, and can also be change through the use of a cosmeticformatting dialog box.
This section contains the following topics:
Common Terms
Edit a Dashboard
Page Options
Common Terms
Many of the features in the BI Dashboards are self explanatory, and definitions and how-to informationappear on each page. When more information is available than will fit on the page, a Help button appearsnear the upper right corner
Dashboard creation is reserved for users with administrative responsibilities. Permission to modifydashboards (personal or shared) is granted to a broader range of users, as determined by theadministrator. Users with the appropriate permissions and responsibilities can modify a dashboard.
The table below provides definitions for common terms in BI Interactive Dashboards.
Term Definition
Columns Columns are used to align content on a dashboard. (Sections within columns holdthe actual content.) Many columns can be created on a dashboard page as needed.Every new dashboard page automatically contains one empty column with oneempty section in it. The columns used in BI Interactive Dashboards are not relatedto the columns used in BI Answers.
Dashboard Objects Dashboard objects are items that are used only in a dashboard. Examples ofdashboard objects are, sections to hold content, navigation links, and embeddedcontent appearing within a frame in a dashboard.
Folders Folders are organizational constructs that hold content saved in the PresentationCatalog, such as requests created with BI Answers. A folder is similar to a MicrosoftWindows folder.

Title 1, Chapter 17EmpowHR Version 9.0
Data W
areho
use
7
DefinitionTerm
Pages Pages contain the columns and sections that hold the content of a dashboard.Every dashboard has at least one page. In BI Interactive Dashboards, pages areidentified by tabs across the top of the dashboard. Multiple pages are used toorganize content.
Results Results, also called reports, are the output returned from the BI Server that matchthe request criteria specified in BI Answers. The default format for viewing results ina dashboard is to show them in a table. (This could be different for each agency)Results can also be shown in other formats, such as charts. Results can beexamined and analyzed, saved or printed or downloaded to a spreadsheet.
Sections Sections appear in columns in the dashboard layout. They hold the content draggedand dropped from the selection pane, and are used to organize content within acolumn.
Skins Skins control the way the BI Presentation Service Interface appears, such asbackground colors, logos, and the style sheets to use. Skins can be automaticallyassigned to users when they log in. The BI Administrator can customize skin andcreate new skins.
Styles Styles control how dashboards and results are formatted for display, such as thecolor of the text and links, the font size of text, the boarders in tables, the color andattributes of charts, and so on. Styles are organized into folders that containCascading Style Sheets (files with a .css extension), images, and chart templates.The BI Administrator can customize some style sheets and create new style sheets.Users can override some elements in type sheets, such as table boarders and textsize, when formatting results in BI Answers.
Presentation Catalog The BI Presentation Catalog stores content created with BI Answers and BIInteractive Dashboards. Content organized into folders that are either shared orpersonal. Types of content that can be stored in the Presentation Catalog includerequests created with BI Answers, filters that are applied to results, settings for BIDelivers, and information about dashboards.
Edit a Dashboard
This Edit Dashboard option describes the procedures for creating and managing the content ondashboards.
Add a New Page to a Dashboard
Add a Column to a Dashboard
Dashboard Properties
PDF and Print Control
To edit a dashboard:
1. Click the Page Options button (Figure 1) on the top right hand corner of My Dashboardpage (Figure 34).
Figure 1. Page Options button on My Dashboard
2. Select Edit Dashboard. The Page Options - Edit Dashboard - Dashboard Editor page (Figure 2) isdisplayed.

Title 1, Chapter 17EmpowHR Version 9.0
8
Figure 2. Page Options − Edit Dashboard - Dashboard Editor page
Add a New Page to a Dashboard
Adding a new page to a dashboard:
3. Click the Add a Page icon to add a page.
The Add Dashboard Page page (Figure 3) is displayed.

Title 1, Chapter 17EmpowHR Version 9.0
Data W
areho
use
9
Figure 3. Add Dashboard Page page
4. Complete the fields as follows:
Page Name Enter a name for the dashboard page.
Page Description Enter a description for the dashboard page.
5. Click OK to add the page. An Empty Dashboard page (Figure 4) is displayed.
OR
Click Cancel.

Title 1, Chapter 17EmpowHR Version 9.0
10
Figure 4. Empty Dashboard page
6. Click Save or Cancel. The Empty Dashboard - Enter Content page (Figure 5) is displayed. Thispage contain 2 tabs at the top Page 1 and Test.(Test is the name of the page that was entered onthe Add A Dashboard page (Figure 3) .
Figure 5. Empty Dashboard - Enter Content page
7. Click here. The Empty Dashboard page (Figure 4) is displayed.

Title 1, Chapter 17EmpowHR Version 9.0
Data W
areho
use
11
8. Click the Properties button and drag and drop the applicable information from the left to theright. This adds content to the page (Figure 6).
Figure 6. Added Content for the Dashboard page
9. Click the Delete button to delete content from the page.
Add a Column to a Dashboard
Columns are used to align content on a dashboard. (Sections within columns hold the actual content).Columns can be added and removed. The width can be set in pixels or as a percentage of the dashboardpage, and break column.
When there are more than one column on a dashboard page, columns can be broken to arrange them on apage. (Drag and drop does not reposition columns.)
To add a column to the dashboard page:
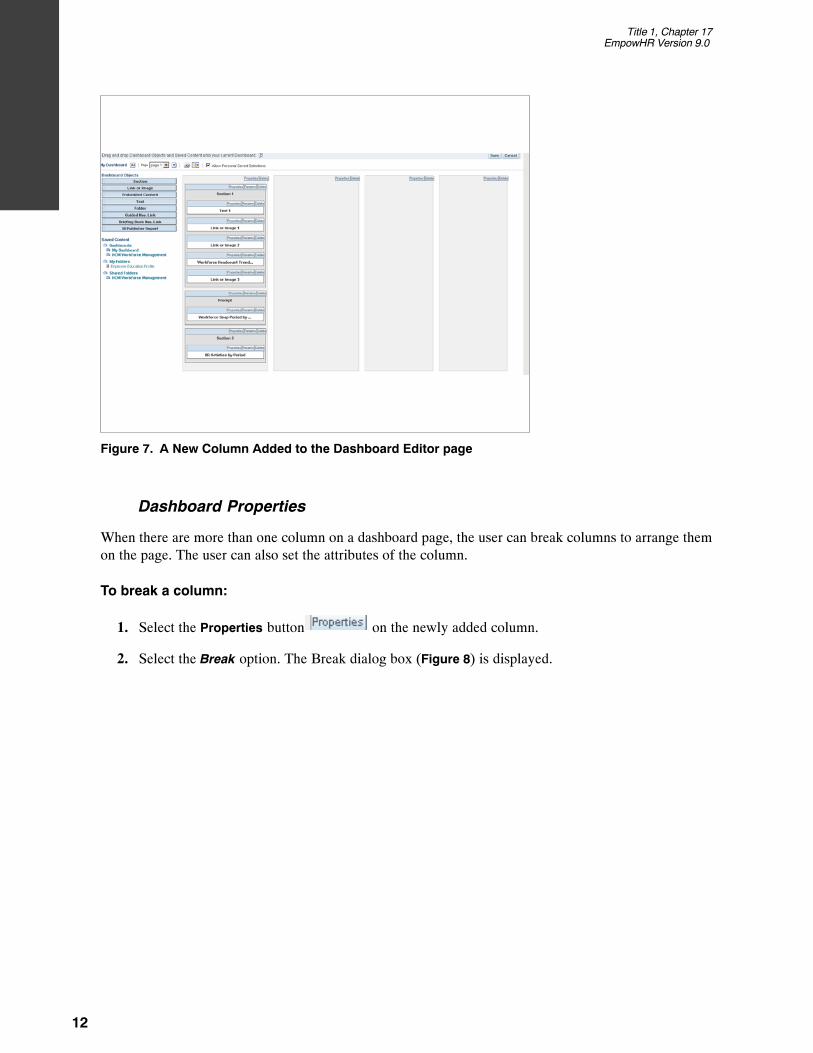
1. Click the Add Column button near the top of the Dashboard Editor page (Figure 2). To addadditional columns, continue to click the Add Column button.
A new column is added to the dashboard (Figure 7).
Title 1, Chapter 17EmpowHR Version 9.0
12
Figure 7. A New Column Added to the Dashboard Editor page
Dashboard Properties
When there are more than one column on a dashboard page, the user can break columns to arrange themon the page. The user can also set the attributes of the column.
To break a column:
1. Select the Properties button on the newly added column.
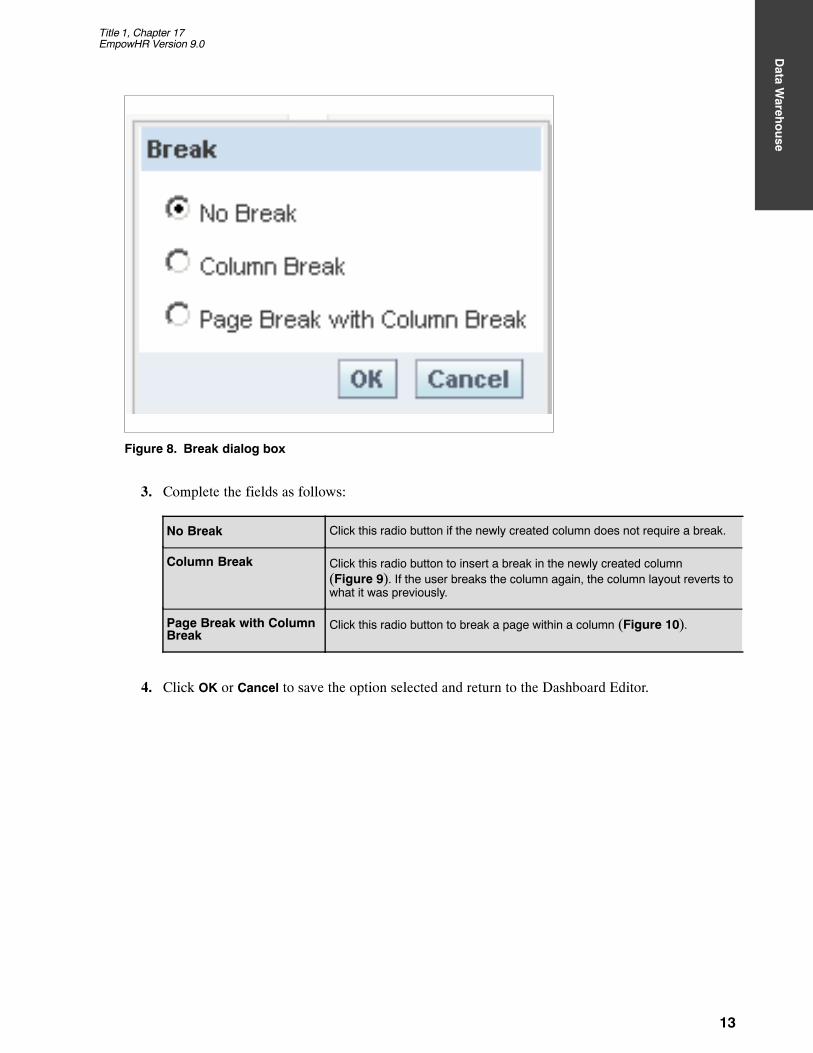
2. Select the Break option. The Break dialog box (Figure 8) is displayed.
Title 1, Chapter 17EmpowHR Version 9.0
Data W
areho
use
13
Figure 8. Break dialog box
3. Complete the fields as follows:
No Break Click this radio button if the newly created column does not require a break.
Column Break Click this radio button to insert a break in the newly created column(Figure 9). If the user breaks the column again, the column layout reverts towhat it was previously.
Page Break with ColumnBreak
Click this radio button to break a page within a column (Figure 10).
4. Click OK or Cancel to save the option selected and return to the Dashboard Editor.

Title 1, Chapter 17EmpowHR Version 9.0
14
Figure 9. Column Break option results
Figure 10. Page Break with Column Break option results
5. Click the Delete button to revert back to the option selected.
To set column properties:
1. Select the Properties button on the newly added column.

Title 1, Chapter 17EmpowHR Version 9.0
Data W
areho
use
15
2. Select Column Properties. The Column Properties dialog box (Figure 11) is displayed.
Figure 11. Column Properties dialog box
3. Complete the fields as follows:
Cell
Horizontal Alignment This option defaults to Default. To change the horizontal alignment of thecolumn, select data from the drop-down list. The valid values are Left,Center, and Right.
Verticle Alignment This option defaults to Default. To change the verticle alignment of thecolumn, select data from the drop-down list. The valid values are Top,Center, and Bottom.
Background Color This option changes the color of the column. Click in the block and the colorselection is displayed. Select the applicable color from the chart.
Border
Position This option defaults to Default. To change the border position in thecolumn, select data from the drop-down list. The valid values are None, All,and Custom. This option is interactive with the Border Style is selected.
Border Style This option defaults to Default. To change the border position in thecolumn, select data from the drop-down list. The valid values are Single,Double, and Thick. As these options are selected the Border Stylebecomes interactive.
Border Color This option changes the color of the border. Click in the block and the colorselection is displayed. Select the applicable color from the chart.
Title 1, Chapter 17EmpowHR Version 9.0
16
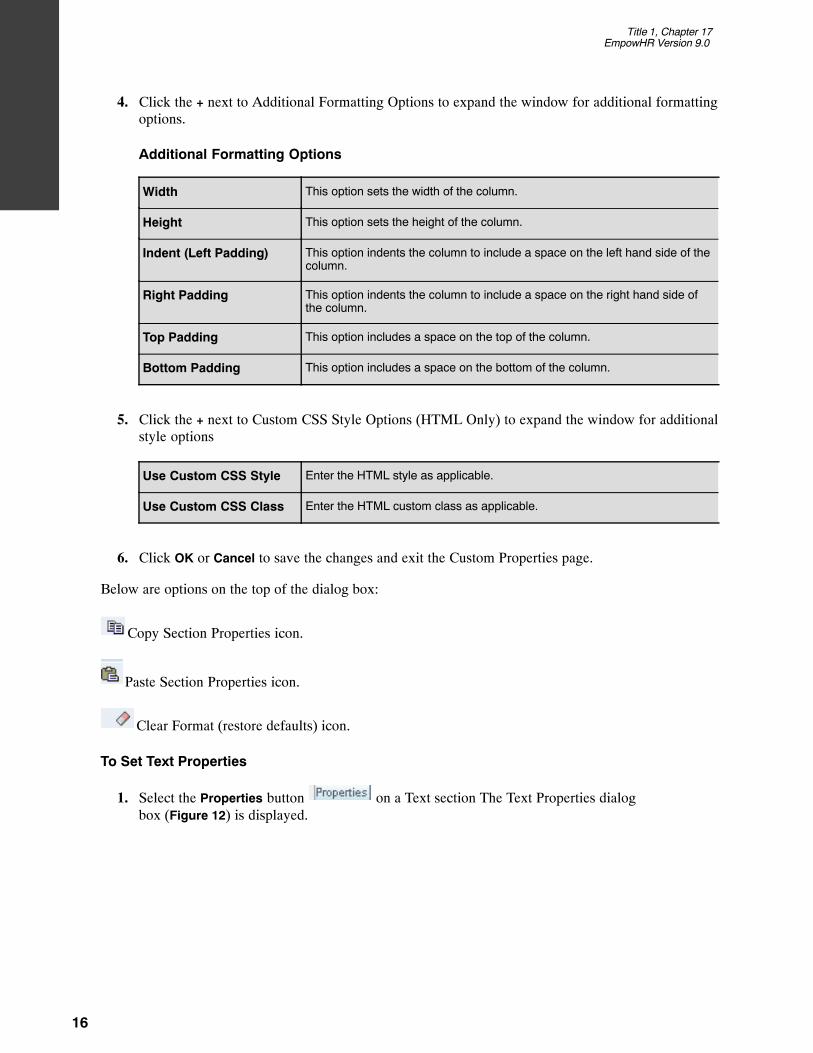
4. Click the + next to Additional Formatting Options to expand the window for additional formattingoptions.
Additional Formatting Options
Width This option sets the width of the column.
Height This option sets the height of the column.
Indent (Left Padding) This option indents the column to include a space on the left hand side of thecolumn.
Right Padding This option indents the column to include a space on the right hand side ofthe column.
Top Padding This option includes a space on the top of the column.
Bottom Padding This option includes a space on the bottom of the column.
5. Click the + next to Custom CSS Style Options (HTML Only) to expand the window for additionalstyle options
Use Custom CSS Style Enter the HTML style as applicable.
Use Custom CSS Class Enter the HTML custom class as applicable.
6. Click OK or Cancel to save the changes and exit the Custom Properties page.
Below are options on the top of the dialog box:
Copy Section Properties icon.
Paste Section Properties icon.
Clear Format (restore defaults) icon.
To Set Text Properties
1. Select the Properties button on a Text section The Text Properties dialogbox (Figure 12) is displayed.

Title 1, Chapter 17EmpowHR Version 9.0
Data W
areho
use
17
Figure 12. Text Properties dialog box
The options below change the appearance of the Text box on the dashboard.
Click the B to bold the information in the box.
Click the I to initialize the information in the box .
Click the U to underline the information in the box.
Click the Line Break to create a line space before the information in the box.
Click Preview to view the results of the option selected.
2. Click OK to save the changes.OR
Click Cancel to exit the window with no changes.
To Set Link Properties:
The guided navigation links can be static or conditional.
1. Select the Properties button on the Link 1 or Image 1 section (Figure 13). The Link or ImageProperties dialog box (Figure 14) is displayed.
Figure 13. Properties button on a Link or Image section
The steps below can be used for any link that is selected from the pane into the section in the dashboardpage.
Title 1, Chapter 17EmpowHR Version 9.0
18
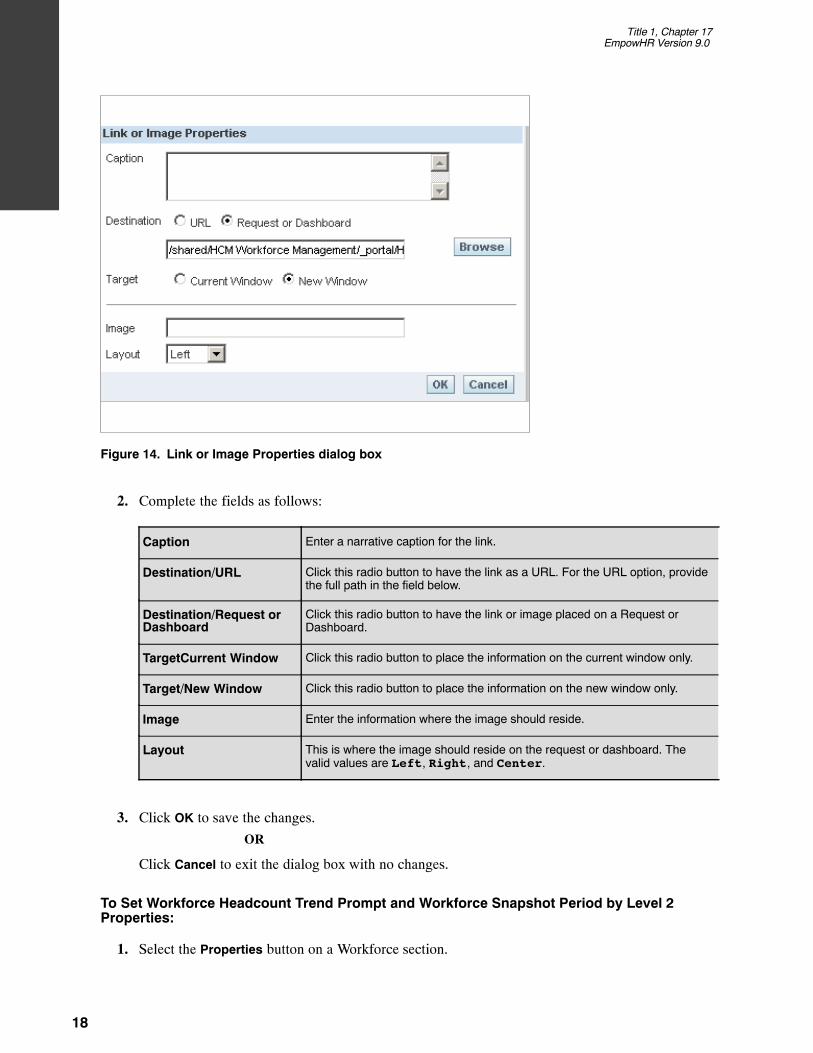
Figure 14. Link or Image Properties dialog box
2. Complete the fields as follows:
Caption Enter a narrative caption for the link.
Destination/URL Click this radio button to have the link as a URL. For the URL option, providethe full path in the field below.
Destination/Request orDashboard
Click this radio button to have the link or image placed on a Request orDashboard.
TargetCurrent Window Click this radio button to place the information on the current window only.
Target/New Window Click this radio button to place the information on the new window only.
Image Enter the information where the image should reside.
Layout This is where the image should reside on the request or dashboard. Thevalid values are Left, Right, and Center.
3. Click OK to save the changes.
OR
Click Cancel to exit the dialog box with no changes.
To Set Workforce Headcount Trend Prompt and Workforce Snapshot Period by Level 2Properties:
1. Select the Properties button on a Workforce section.

Title 1, Chapter 17EmpowHR Version 9.0
Data W
areho
use
19
1. Select Modify from the drop-down list .
2. Modify the section.
To Set HR Activities Properties:
1. Select the Properties button on a HR Activities section. The HR Activities drop-down list(Figure 15) options below are displayed.
Figure 15. HR Activities drop-down lists
2. Select the applicable option to change the display on a request or dashboard. The options selectedwill not change the look on the Dashboard Editor; however, the look will change on a request ordashboard.
To Set Section Properties:
Guided navigation can aid users’ insight into business issues and appropriate actions to take by guidingtheir exploration of results obtained from BI Answers. When based on common scenarios and bestpractices for your organization, guided navigation allows users to see and analyze related issues bynavigating to a related set of results, another dashboard, or a URL. Guided navigation is specified usingthe Dashboard Editor.
There are three types of guided navigation:

Title 1, Chapter 17EmpowHR Version 9.0
20
Type of Navigation Description
Guided NavigationUsing Static Links
When specified for a request, the results on the dashboard always include a link toanother request, a dashboard, or URL.
Guided NavigationUsing ConditionalLinks
When specified for a request, a link to another request, dashboard, or URL appearsonly if the results met certain criteria.
Guided NavigationUsing ConditionalActions
Entire dashboard sections can appear based upon the results returned by BIAnswers for a particular request.
The user can make an entire section of a dashboard and its content appear conditionally based upon theresults returned by BI Answers for a particular request.
1. Select the Properties button on a Section or Prompt. The Section or Promptdrop-down list (Figure 16) options is displayed.
Figure 16. Section or Prompt drop-down list
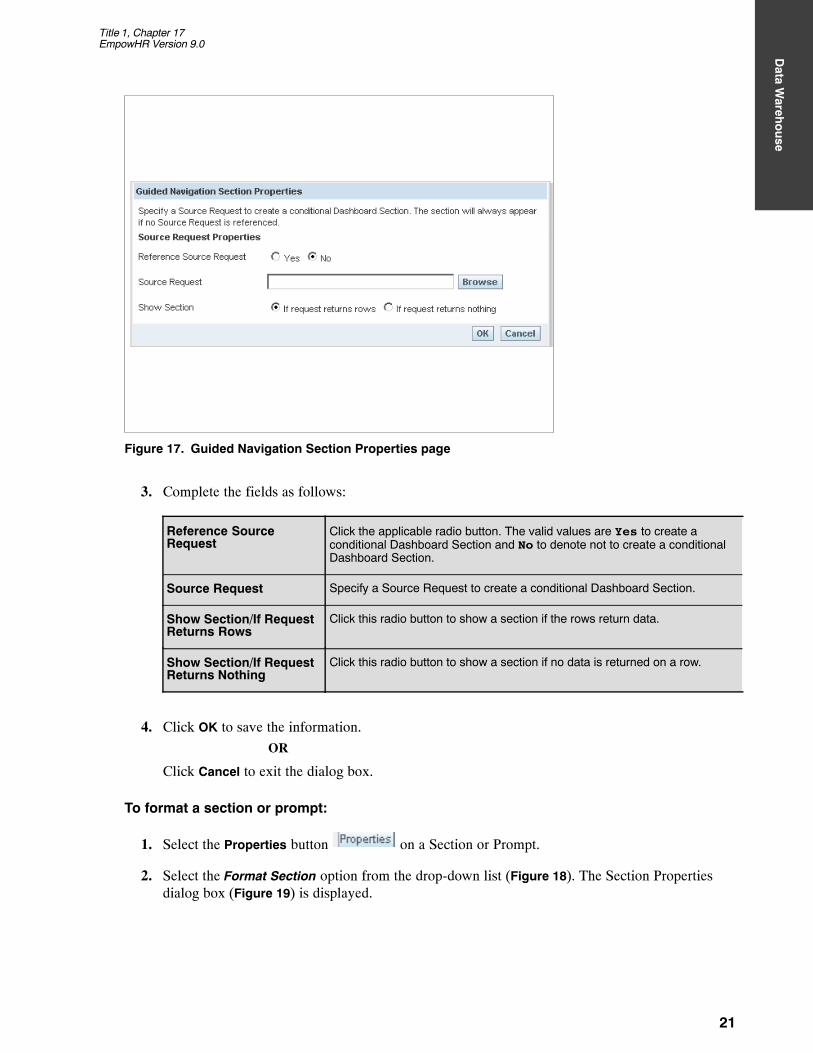
2. Select the Guided Navigation option. The Guided Navigation Section Properties page (Figure 17)is displayed.
Title 1, Chapter 17EmpowHR Version 9.0
Data W
areho
use
21
Figure 17. Guided Navigation Section Properties page
3. Complete the fields as follows:
Reference SourceRequest
Click the applicable radio button. The valid values are Yes to create aconditional Dashboard Section and No to denote not to create a conditionalDashboard Section.
Source Request Specify a Source Request to create a conditional Dashboard Section.
Show Section/If RequestReturns Rows
Click this radio button to show a section if the rows return data.
Show Section/If RequestReturns Nothing
Click this radio button to show a section if no data is returned on a row.
4. Click OK to save the information.
OR
Click Cancel to exit the dialog box.
To format a section or prompt:
1. Select the Properties button on a Section or Prompt.
2. Select the Format Section option from the drop-down list (Figure 18). The Section Propertiesdialog box (Figure 19) is displayed.

Title 1, Chapter 17EmpowHR Version 9.0
22
Figure 18. Section or Prompt drop-down list
Figure 19. Section Properties dialog box
3. Complete the Section Properties as follows:
Cell
Horizontal Alignment This option defaults to Default. To change the horizontal alignment of thesection, select data from the drop-down list. The valid values are Left,Center, and Right.
Verticle Alignment This option defaults to Default. To change the verticle alignment of thesection, select data from the drop-down list. The valid values are Top,Center, and Bottom.
Background Color This option changes the color of the section. Click in the block and the colorselection is displayed. Select the applicable color from the chart.
Title 1, Chapter 17EmpowHR Version 9.0
Data W
areho
use
23
Border
Position This option defaults to Default. To change the border position in thesection, select data from the drop-down list. The valid values are None, All,and Custom. This option is interactive with the Border Style selected.
Border Style This option defaults to Default. To change the border position in thesection, select data from the drop-down list. The valid values are Single,Double, and Thick. As these options are selected the Border Stylebecomes interactive.
Border Color This option changes the color of the border. Click in the block and the colorselection is displayed. Select the applicable color from the chart.
4. Click the + next to Additional Formatting Options to expand the window for additional formattingoptions.
Additional Formatting Options
Width This option sets the width of the section.
Height This option sets the height of the section.
Indent (Left Padding) This option indents the column to include a space on the left hand side of thesection.
Right Padding This option indents the column to include a space on the right hand side ofthe section.
Top Padding This option adds a space on the top of the section.
Bottom Padding This option adds a space on the bottom of the section.
5. Click the + next to Custom CSS Style Options (HTML Only) to expand the window for additionalstyle options.
Use Custom CSS Style Enter the HTML style as applicable.
Use Custom CSS Class Enter the HTML custom class as applicable.
6. Click OK or Cancel to save the changes.
Below are options on the top of the dialog box:
Copy Section Properties icon.
Paste Section Properties icon.
Clear Format (restore defaults) icon.

Title 1, Chapter 17EmpowHR Version 9.0
24
To make a section appear horizontal:
1. Select the Properties button on a Section or Prompt. The Section or Promptdrop-down list (Figure 20) options is displayed.
Figure 20. Section or Prompt drop-down list
2. Select the Arrange Horizontally option. The Section or Prompt result (Figure 21) displayshorizontally.
Figure 21. Horizontial Section result
To rename the information selected from the left hand pane:
On the Dashboard Editor, items can be selected from the pane on the left. These item can be renamed.
1. Click the Rename button on the item to be renamed. The rename dialog box (Figure 22) isdisplayed.

Title 1, Chapter 17EmpowHR Version 9.0
Data W
areho
use
25
Figure 22. Rename dialog box
2. Rename the section.
3. Select the Display Section Heading to display the renamed section as a heading.
4. Click OK to save the information.
OR
Click Cancel to exit the dialog box.
To access the Dashboard Properties from the Dashboard Editor:
1. Click the Dashboard Properties button on the top of the Dashboard Editor page. TheDashboard Properties dialog box (Figure 23) is displayed.

Title 1, Chapter 17EmpowHR Version 9.0
26
Figure 23. Dashboard Properties dialog box
2. Complete the fields on the Dashboard Properties as follows:
General Properties
Style Styles control how dashboard and results are formatted for display. If a styleis not selected, results are formatted using a default style. Select theapplicable data from the drop-down list. The valid values are Oracle 10,Sliebel 77, and the Default (oracle1c).
Description Enter a description for the dashboard.
Dashboard Pages
This section of the page is used to rename, delete, reorder, and hide dashboard pages. DashboardPages area of the Dashboard Properties page shows the pages for the dashboard. The pages arelisted in the same order as their tabs.
Hide Page Check this box to hide the page.
Reorder Select the down arrow to change the order of the pages listed. To move adashboard page up in the list, click the Move Up button. This moves the tabfor the page to the left on the dashboard page.
To move a page down in the list, click the Move Down button. This movesthe tab for the page to the right on the dashboard page.
3. Click the Rename icon . The Edit Item Name and Description page (Figure 24) is displayed.When renaming a dashboard, the users’ references to the dashboard with the previous name can be

Title 1, Chapter 17EmpowHR Version 9.0
Data W
areho
use
27
preserved. This creates a shortcut with the old name that points to the renamed dashboard in thePresentation Catalog.
Figure 24. Edit Item Name and Description dialog page
4. Complete the fields as follows:
Name Rename the dashboard if applicable.
Description Rename the description of the dashboard if applicable.
5. Click Update to confirm changes.
A Dashboard Page can be deleted from the Edit Dashboard dialog box (Figure 23).
6. Click the Delete icon to delete the dashboard name. The Confirm Delete pop-up (Figure 25)is displayed.

Title 1, Chapter 17EmpowHR Version 9.0
28
Figure 25. Confirm Deletion pop-up
7. Click the Yes link to delete and No link to keep the original information and return to theDashboard Properties dialog page (Figure 23).
8. Click Finished on the Dashboard Properties dialog box (Figure 23).to save the information.
OR
Click Cancel on the Dashboard Properties dialog box (Figure 23) to exit the page. The cancelbutton does not undo the actions performed on the Dashboard Properties dialog box (Figure 23)page.
PDF and Print Control
When printing a dashboard in BI Interactive Dashboards or to view in BI Answers, the user can specifypage settings and header and footer content for the PDF output. Dashboards and views are printed inAdobe Acrobat PDF format. Adobe Reader 6.0 or greater is required to print using Adobe PDF.
Header and footer formatting will appear in HTML and PDF output.
Note: The print selections that is specified apply to PDF output only. If printed the PDF on a local ornetwork printer, the print selections specified in the browser are in effect, such as the selection of papersize.
1. Click the PDF and Print Control Properties button near the top of the workspace. The PDFand Print Control dialog box (Figure 26) is displayed.

Title 1, Chapter 17EmpowHR Version 9.0
Data W
areho
use
29
Figure 26. PDF and Print Control dialog box
2. Complete the fields on the PDF and Print Control dialog box as follows:
Page Settings
Paper Size Select the applicable size paper for the print. The valid values are as follows:
Paper Size Valid Values
DefaultU.S. Letter (8.5 X11)A4 (210mm X 297mm)A3 (297mm X 420mm)A5 (148mm X 120mm)Folio (8.5” X 13”)Legal (8.5” X 14”)
Orientation Select the view for the output. The valid values are Portrait andLandscape.
Print Rows Select the applicable option for printing rows. The valid values are Visibleand All.
Header Footer
Use the options in the dialog box to construct the header and footer. Headers and footers may eachcontain up to three lines.

Title 1, Chapter 17EmpowHR Version 9.0
30
3. Complete the fields as follows:
Include Header Select this option to include a header.
Include Footer Select this option to include a footer.
4. Click the Edit button next to the Header or the Footer. The Edit Header (Figure 27) and EditFooter (Figure 29) dialog box is displayed. These dialog boxes are used to cosmetically format theheader and footer.
Figure 27. Edit Header dialog box
5. In the Edit Font Area, (Figure 28) make a selection if applicable. The selections include B forbold, I to initialize, U to underline, Line Break to insert a blank line. The Insert field is availablewith values Saved Name, Author Name, Date, Time, Page No, and Image
Figure 28. Font Area
Title 1, Chapter 17EmpowHR Version 9.0
Data W
areho
use
31
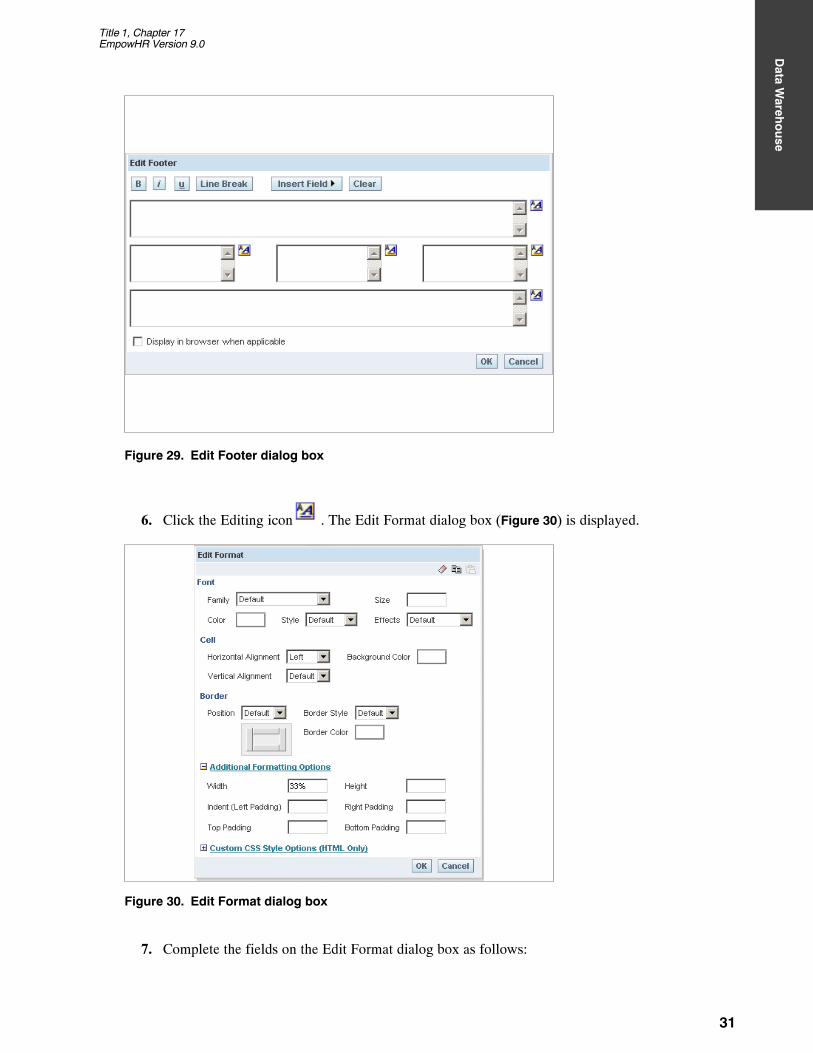
Figure 29. Edit Footer dialog box
6. Click the Editing icon . The Edit Format dialog box (Figure 30) is displayed.
Figure 30. Edit Format dialog box
7. Complete the fields on the Edit Format dialog box as follows:

Title 1, Chapter 17EmpowHR Version 9.0
32
Cell
Horizontal Alignment To change the horizontal alignment of the section, select data from thedrop-down list. The valid values are as follows:
Horizontal AlignmentValid Values
Usage Notes
Left Left justifies the data. This is the most common justification for text data.
Right Right justifies the data. The is the most common justification for number data.
Center Centers the data.
Default Retains the default data alignment.
Verticle Alignment This option defaults to Default. To change the verticle alignment of thesection, select data from the drop-down list. The valid values are as follows:
Vertical Alignment ValidValues
Usage Notes
Top Aligns the data to the top.
Bottom Aligns the data to the bottom.
Center Aligns the data to the center.
Default Retains the default data alignment.
Background Color This option changes the color of the section. Click in the block and the colorselection is displayed. Select the applicable color from the chart.
Border
Position This option defaults to Default. To change the border position in thesection, select data from the drop-down list. The valid values are None, All,and Custom. This option is interactive with the Border Style is selected.
Border Style This option defaults to Default. To change the border position in thesection, select data from the drop-down list. The valid values are Single,Double, and Thick. As these options are selected, the Border Stylebecomes interactive. Select or deselect a custom boarder by clicking the top,bottom, left , and right boarder near the Position drop-down list.
Border Color This option changes the color of the border. Click in the block and the colorselection is displayed. Select the applicable color from the chart.
8. Click the + next to Additional Formatting Options to expand the window for additional formattingoptions.
Additional Formatting Options
Width This option sets the width of the section.
Height This option sets the height of the section.
Indent (Left Padding) This option indents to include a space on the left hand side of the section.

Title 1, Chapter 17EmpowHR Version 9.0
Data W
areho
use
33
Right Padding This option indents to include a space on the right hand side of the section.
Top Padding This option includes a space on the top of the section.
Bottom Padding This option includes a space on the bottom of the section.
9. Click the + next to Custom CSS Style Options (HTML Only) to expand the window for additionalstyle options. The advance style formatting options are for use by users who know how to workwith cascading style sheet.
Use Custom CSS Style Enter the HTML style as applicable.
Use Custom CSS Class Enter the HTML custom class as applicable.
10. Click OK to save the information.OR
Click Cancel to clear the options selected and exit the page.
To use the page option on the Dashboard Editor:
This option allows the user to view a page from the Dashboard Editor page (Figure 2).
1. Click the Page drop-down list to view pages created.
2. Select a page name to display that page in the Dashboard Editor.
Page Options
Saved selections allow users to view dashboard pages with their most frequently used or favorite choicesfor filters and prompts selected, without the need to make choices manually for prompts and filters thatappear on the dashboard. Users can save multiple view selections with different combinations of promptand filter choices, and switch between them.
Multiple customized versions of a reusable dashboard can also be created using Saved Selections, andassigned to appropriate user groups. Users with the appropriate permissions can perform the followingtasks to create, save, and assign view selections:
Save various combinations of choices for filters, and prompts as view selections, for theirpersonal use or use by others.
Specify which saved selection is the default, view, for their personal use or use by others.
For users with the appropriate permissions, a Page Options button appears on the dashboard thatreplaces the Dashboard Editor link. (Access to the Dashboard Editor is one of the selections availablefrom the Page Options menu.) For additional information on Edit Dashboard refer to Edit a Dashboard.

Title 1, Chapter 17EmpowHR Version 9.0
34
1. Click the Page Options button. The choices available depend on the users permissions. The EditDashboard options is discussed in Edit a Dashboard.
Figure 31. Page Options menu drop-down list
To save a selections for your personal use or for use by others:
2. Choose Save Current Selections option For Me to save the selection for your personal use. TheSave Current Selections page (Figure 32) is displayed.
Figure 32. Save Current Selections - For Me page
3. Complete the fields as follows:
Name Specify a name for the Saved Selection.
Make this my default forthis page
Check this box to set the name as a default page.
4. Click OK to save the information or click Cancel to return to the Page Options menu (Figure 31).
OR
Title 1, Chapter 17EmpowHR Version 9.0
Data W
areho
use
35
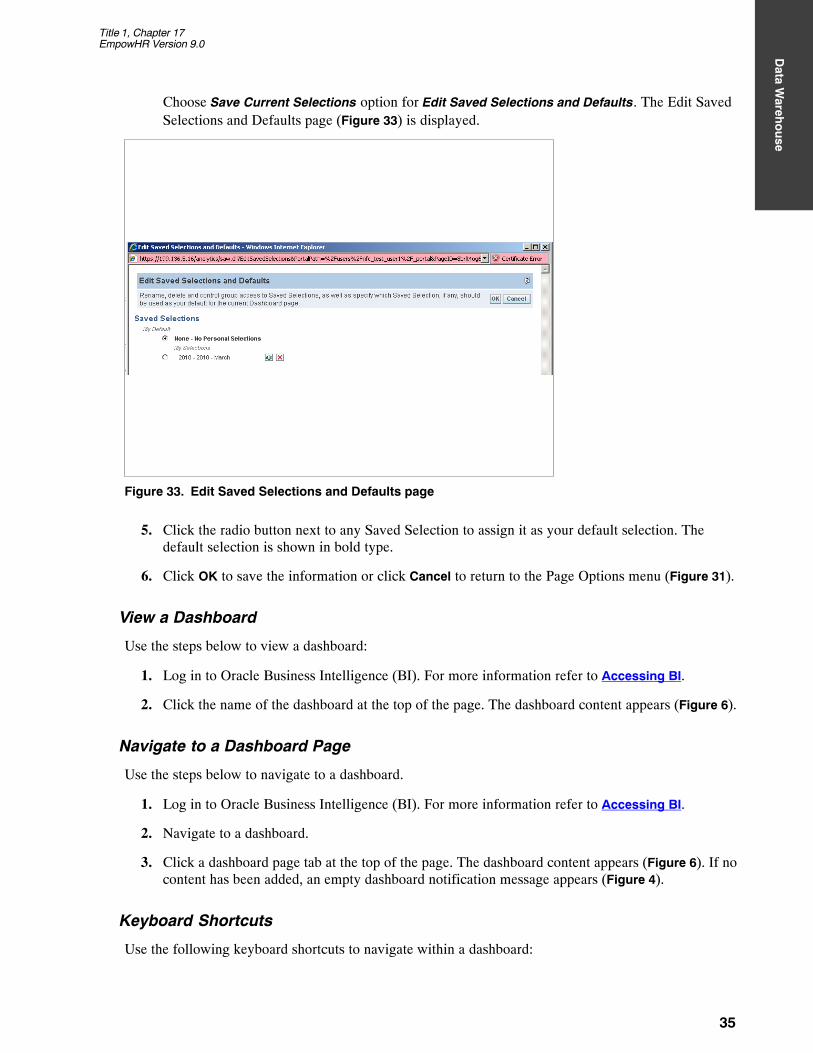
Choose Save Current Selections option for Edit Saved Selections and Defaults. The Edit SavedSelections and Defaults page (Figure 33) is displayed.
Figure 33. Edit Saved Selections and Defaults page
5. Click the radio button next to any Saved Selection to assign it as your default selection. Thedefault selection is shown in bold type.
6. Click OK to save the information or click Cancel to return to the Page Options menu (Figure 31).
View a Dashboard
Use the steps below to view a dashboard:
1. Log in to Oracle Business Intelligence (BI). For more information refer to Accessing BI.
2. Click the name of the dashboard at the top of the page. The dashboard content appears (Figure 6).
Navigate to a Dashboard Page
Use the steps below to navigate to a dashboard.
1. Log in to Oracle Business Intelligence (BI). For more information refer to Accessing BI.
2. Navigate to a dashboard.
3. Click a dashboard page tab at the top of the page. The dashboard content appears (Figure 6). If nocontent has been added, an empty dashboard notification message appears (Figure 4).
Keyboard Shortcuts
Use the following keyboard shortcuts to navigate within a dashboard:
Title 1, Chapter 17EmpowHR Version 9.0
36
1. Log in to Oracle Business Intelligence (BI). For more information refer to Accessing BI.
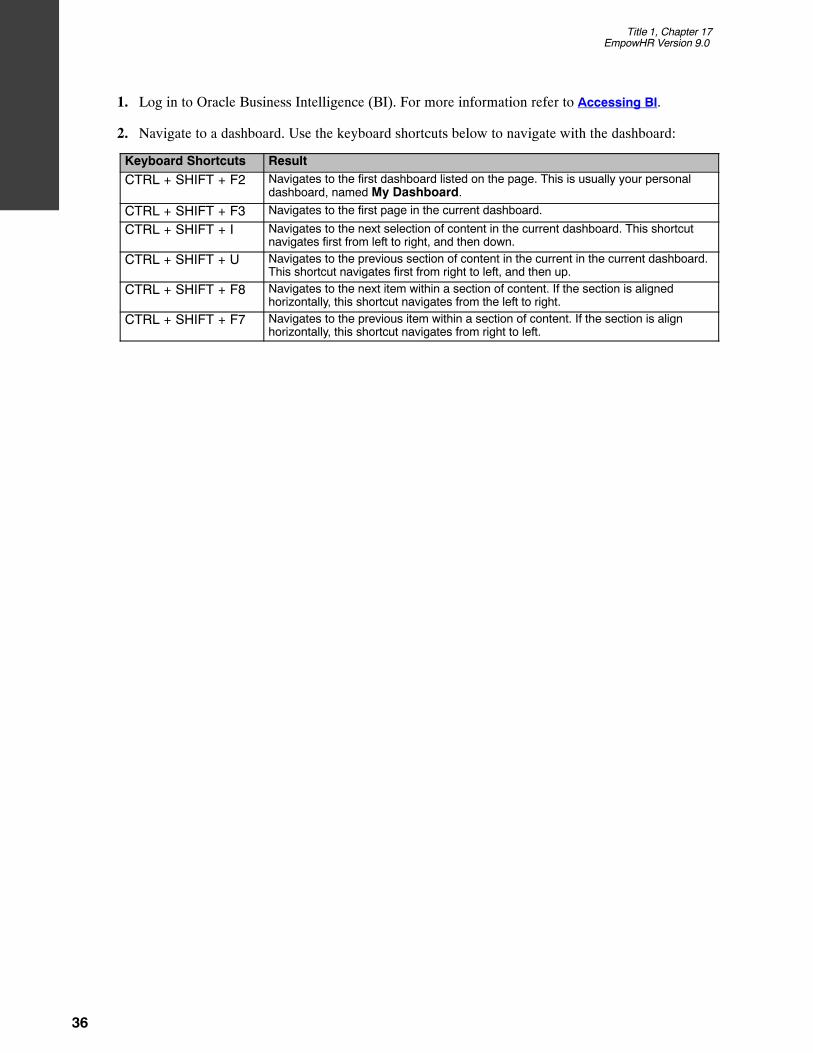
2. Navigate to a dashboard. Use the keyboard shortcuts below to navigate with the dashboard:
Keyboard Shortcuts Result
CTRL + SHIFT + F2 Navigates to the first dashboard listed on the page. This is usually your personaldashboard, named My Dashboard.
CTRL + SHIFT + F3 Navigates to the first page in the current dashboard.
CTRL + SHIFT + I Navigates to the next selection of content in the current dashboard. This shortcutnavigates first from left to right, and then down.
CTRL + SHIFT + U Navigates to the previous section of content in the current in the current dashboard.This shortcut navigates first from right to left, and then up.
CTRL + SHIFT + F8 Navigates to the next item within a section of content. If the section is alignedhorizontally, this shortcut navigates from the left to right.
CTRL + SHIFT + F7 Navigates to the previous item within a section of content. If the section is alignhorizontally, this shortcut navigates from right to left.

Title 1, Chapter 17EmpowHR Version 9.0
Data W
areho
use
37
My Dashboard
My Dashboard allows authorized users to view/create/edit dashboards, access and utilize More Products,and view My Account. This section will discuss options on My Dashboard.
To view and edit More Products.
Figure 34. My Dashboard page
1. Click More Products link at the top of the page. The following are 4 options that are availablewhen More Products is selected:
BI Publisher
BI Delivers
Marketing
Disconnect Analytics
BI Publisher
Oracle BI Publisher creates highly formatted, printable reports. BI Publisher is integrated with BI , andthe user accesses BI Publisher from the Oracle BI Answers, Delivers, and Interactive Dashboardsapplications. BI Publisher reports are built directly against a subject area available through the BI Server,or reports can be based on an Answers request. BI Publisher reports can be added to Dashboard pages.BI Publisher and BI integration also provides single sign-on capability so that when users log into theBI, they are also simultaneously logged into the BI Publisher application.
If using BI Publisher, the user can run, view, and interact with an BI Publisher report in a dashboardpage. When included in a dashboard page, BI publisher toolbar offers the option to select a layout
Title 1, Chapter 17EmpowHR Version 9.0
38
template, change the BI Publisher report’s output format, export the BI report, send the BI Publisherreport to an available destination (printer, fax, email, or FTP), schedule the BI Publisher report, andanalyze the data.
A dashboard page can only contain on BI Publisher report and cannot be created or modified inAnswers, used in BI Delivers, or saved in BI Briefing Books. The Add to Briefing Books and printerbuttons are disabled for a dashboard page that displays an BI Publisher report.
1. Select BI Publisher. The More Products - BI Publisher application appears in a new browserwindow. This option must be configured before an agency can take advantage of this option.
BI Delivers
Oracle BI Delivers is the interface used to create alerts based on analytics results; however, theAgency/Department must be licensed. The Delivers option is used to detect specific results, andimmediately notify the appropriate person or group through the Web, wireless, and mobilecommunication channels.
This section describes Oracle BI Delivers, provides information about how it works, and explains howto control access to Oracle BI Delivers.
Oracle BI Delivers allows the user to create unique form of information insurance, where anyinformation-based problem or opportunity can be detected, and the appropriate person immediatelynotified. iBots are software-based agents driven by schedule or events that can access, filter, andperforms analytics on data based upon defined criteria. iBots provide proactive delivery of real-time,personalized, and actionable intelligence throughout the business network.
The users can create their own iBot if they have the appropriate permissions and responsibilities.
The user can specify account information and preferences using the My Account link (available form BIAnswers, from BI Delivers, and from BI Interactive Dashboards).
The following procedures explain how to access Oracle BI Delivers.
2. Select Delivers. The More Products - Delivers- Start page (Figure 35) is displayed. The Start pagehas two main areas:
Selection pane - The selection pane is located on the left side of the page. It displays Deliverscontent saved in the Presentation Catalog, such as personal and share iBots.
Workspace - The workspace is located to the right of the selection pane. It initially displaysthe iBot links to create and manage iBots.
When a selection is made from the selection pane, such as clicking a saved iBot, the selection appears inthe workspace. When the iBot is clicked in the workspace, the workspace displays tabs for working withthe iBot. The tabs will not appear for iBots selected from the Shared iBots folder, unless the user is aWeb Administrator and has the proper permissions.

Title 1, Chapter 17EmpowHR Version 9.0
Data W
areho
use
39
Figure 35. More Products − Delivers Start page
BI Delivers contains various features to be accomplished. The following are the features located in theBI Delivers option:
Manage Catalog
Create New iBot
Edit My Account
Show iBots Acting on My Behalf
Manage Catalog
The Manage Catalog feature is used to edit, rename, set permissions for, and delete folders and items.
The Presentation Catalog holds the content created with BI Answers, BI Delivers, BI InteractiveDashboards, and other Analytics-based applications. The content is organized into folders that are eithershared or personal. The types of content that can be stored in the catalog include:
Requests and Results from BI Answers
Items created using the BI Interactive Dashboard Editor
HTML content
Plain text
Links to other images
Documents
Sites
Depending on the security settings specified by the site’s administrator or the user and the Analyticproducts, is what the user can see in the Manage Catalog feature.
Title 1, Chapter 17EmpowHR Version 9.0
40
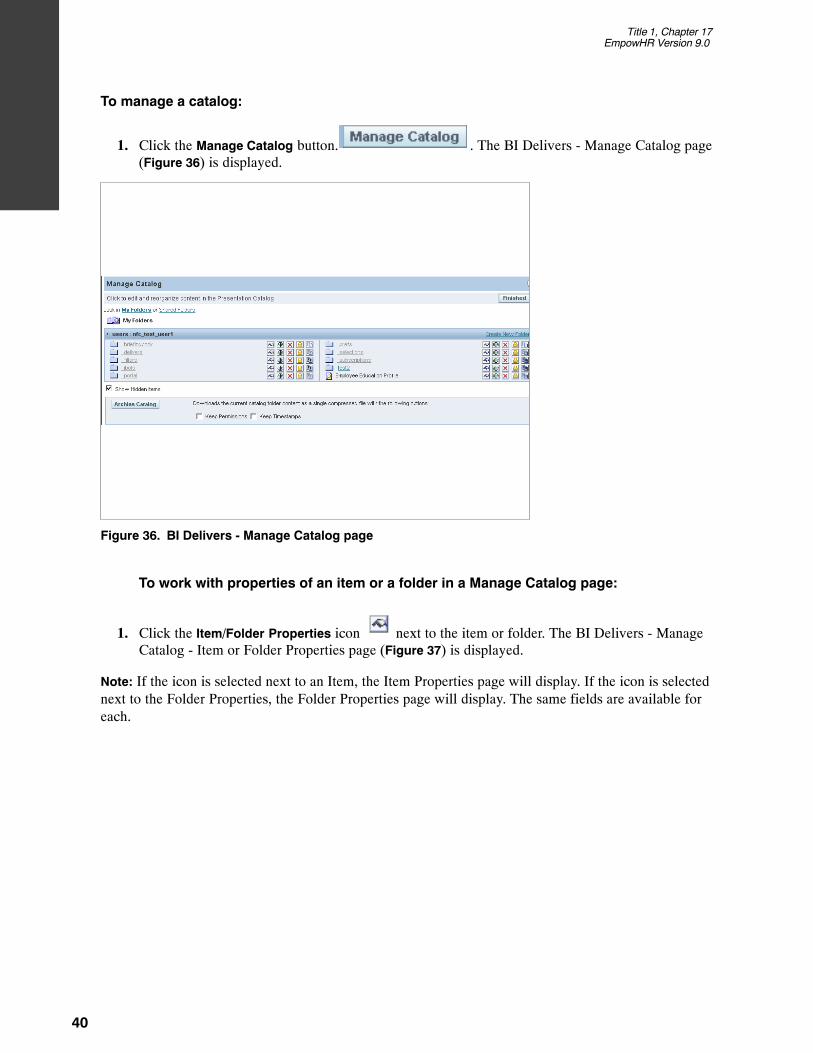
To manage a catalog:
1. Click the Manage Catalog button. . The BI Delivers - Manage Catalog page(Figure 36) is displayed.
Figure 36. BI Delivers - Manage Catalog page
To work with properties of an item or a folder in a Manage Catalog page:
1. Click the Item/Folder Properties icon next to the item or folder. The BI Delivers - ManageCatalog - Item or Folder Properties page (Figure 37) is displayed.
Note: If the icon is selected next to an Item, the Item Properties page will display. If the icon is selectednext to the Folder Properties, the Folder Properties page will display. The same fields are available foreach.

Title 1, Chapter 17EmpowHR Version 9.0
Data W
areho
use
41
Figure 37. BI Delivers - Manage Catalog - Item Properties page
The Item Properties page allows the user to view general information about the folder or item, such asits type, location and path, as well as historical usage information, ownership, other attributes, and anXML button and URL that are used to build an feed to the folder.
If the user has the appropriate authority:
2. Click the Take Ownership of this Item link to take ownership of the item or folder.
OR
Click the Take Ownership of this Item or Subitem link to take ownership of an item or subitem.
To assign or change permissions to an item:
Users with the appropriate permissions can delete existing permissions or assign new permissions to anitem or a folder. Before permissions can be assigned, they must be set up in the BI Presentation Server.
1. Click the Manage Catalog button. The BI Delivers - Manage Catalogpage (Figure 36) is displayed.

Title 1, Chapter 17EmpowHR Version 9.0
42
Figure 38. BI Delivers - Manage Catalog page
1. Click the Change Permissions icon next to the item or folder. The BI Delivers - ManageCatalog - Change Item Permissions page (Figure 39) is displayed.
Figure 39. BI Delivers - Manage Catalog - Change Item Permissions page
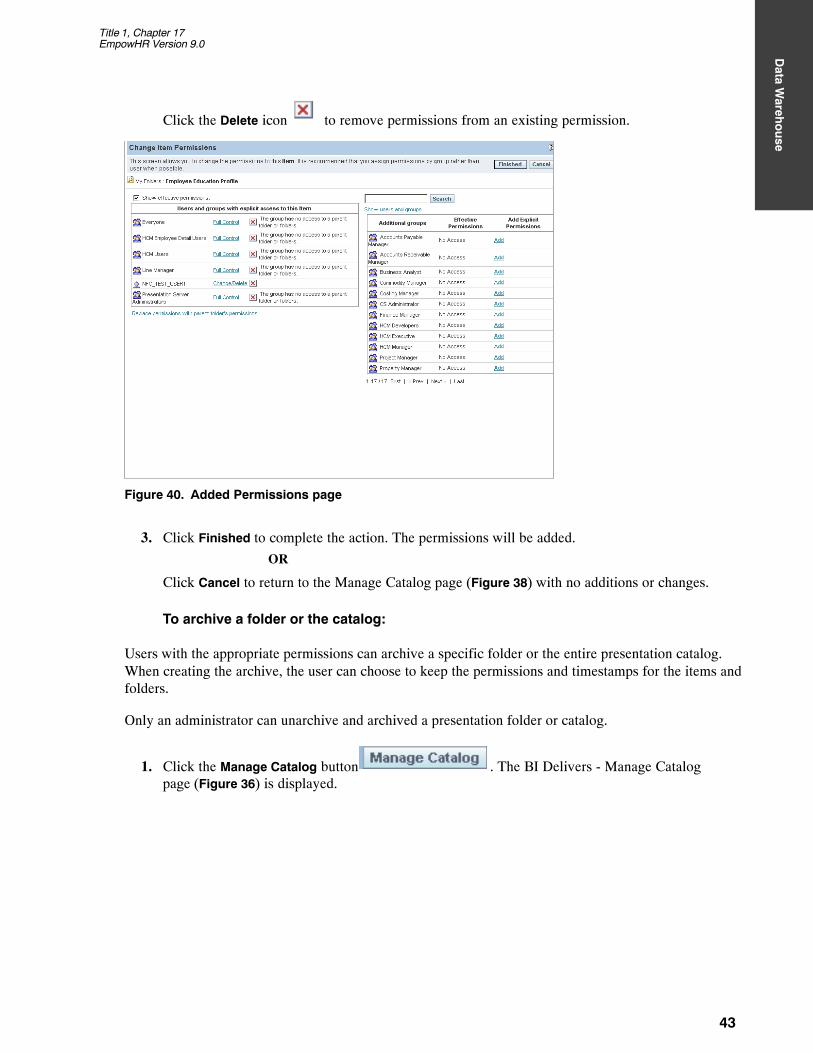
2. Click the Add link next to the permission to be added. The added values will be added to the leftside of the page (Figure 40).
OR
Title 1, Chapter 17EmpowHR Version 9.0
Data W
areho
use
43
Click the Delete icon to remove permissions from an existing permission.
Figure 40. Added Permissions page
3. Click Finished to complete the action. The permissions will be added.
OR
Click Cancel to return to the Manage Catalog page (Figure 38) with no additions or changes.
To archive a folder or the catalog:
Users with the appropriate permissions can archive a specific folder or the entire presentation catalog.When creating the archive, the user can choose to keep the permissions and timestamps for the items andfolders.
Only an administrator can unarchive and archived a presentation folder or catalog.
1. Click the Manage Catalog button . The BI Delivers - Manage Catalogpage (Figure 36) is displayed.

Title 1, Chapter 17EmpowHR Version 9.0
44
Figure 41. BI Delivers - Manage Catalog page
To archive the whole presentation catalog, locate the archive catalog section of the page. To archive aspecific folder, browse to the folder that should be archived.
2. Complete the fields on the Manage Catalog page:
Keep Permissions Check this box to archive the permissions that are assigned to each itemwithin the presentation catalog or folder. If this option is not selected, thearchiving process will not include any permissions. Upon unarchivng, thesystem will assign the parent folder’s permissions to all of the items andfolders.
Keep Timestamp Check this box to archive the timestamps that are assigned to the item andfolder that are being archived. If this options is not selected, the archivingprocess will not include timestamp information. Upon unarchiving, the systemwill apply a timestamp indicating the time at which the item or folder wasunarchived.
3. Click the Archive Catalog. The File Download page appears. For more information refer toDownloading Results .
4. Click Save. The Save As page appears.
5. Specify the location to archive the file.
6. Click Save.
To edit the name and description of an object in the Presentation Catalog:
Users with the appropriate permissions can use the Manage Catalog feature to edit the names anddescriptions of objects in the BI Presentation Catalog. If the user renames and object, they can maintainreferences to the previous name to prevent possible broken links. This creates a shortcut to the renamedobject using the previous name.

Title 1, Chapter 17EmpowHR Version 9.0
Data W
areho
use
45
1. Click the Manage Catalog button . The BI Delivers - Manage Catalogpage (Figure 42) is displayed.
Figure 42. BI Delivers - Manage Catalog page
1. Click the Edit Name and Description icon next to the item or folder. The BI Delivers -Manage Catalog -Edit Item Name and Description page (Figure 43) is displayed.

Title 1, Chapter 17EmpowHR Version 9.0
46
Figure 43. BI Delivers - Manage Catalog - Edit Item Name and Description page
2. Complete the fields as follows:
Name Type a new name for the object.
Preserve Reference toOld Name of this Item
Check this box to maintain references to the object that use the previousname. This option creates a shortcut with the old name, pointing to therenamed object.
Description Type and optional description
3. Click the Update button to rename.
OR
Click the Cancel button to return to the Manage Catalog page (Figure 42) with no changes.
To copy or move a folder or item:
Users with the appropriate permissions can choose to copy and item to a new location.
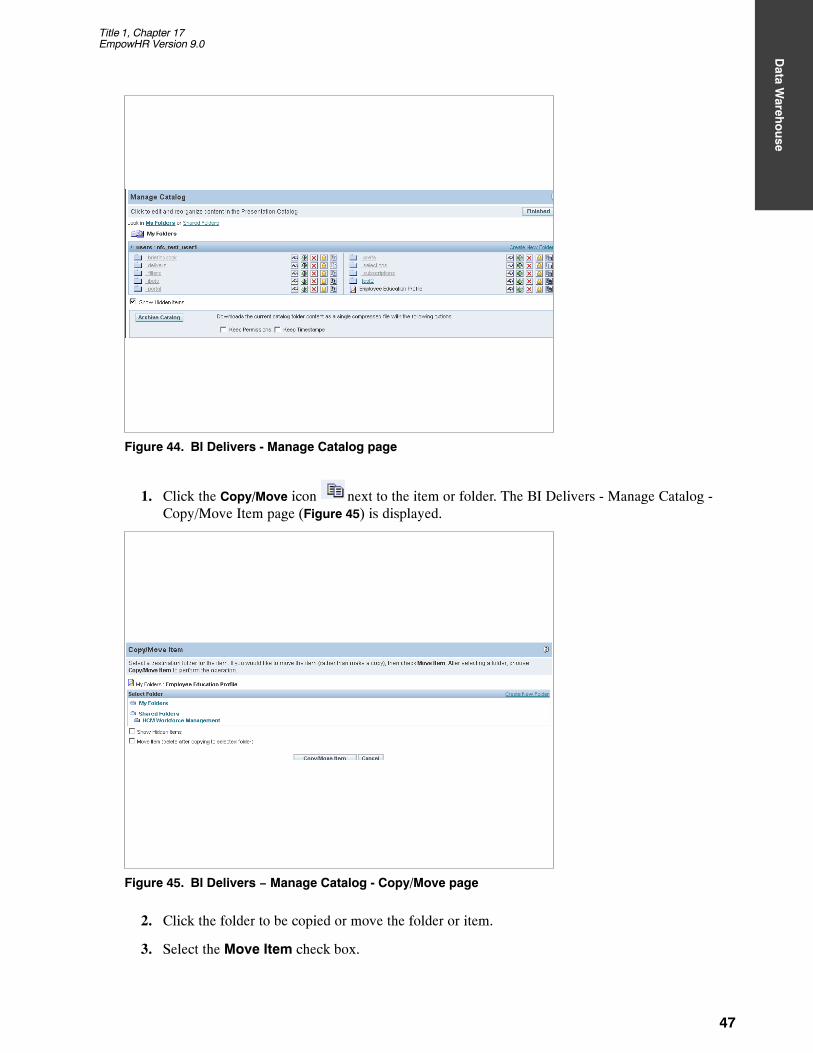
1. Click the Manage Catalog button . The BI Delivers - Manage Catalogpage (Figure 44) is displayed.
Title 1, Chapter 17EmpowHR Version 9.0
Data W
areho
use
47
Figure 44. BI Delivers - Manage Catalog page
1. Click the Copy/Move icon next to the item or folder. The BI Delivers - Manage Catalog -Copy/Move Item page (Figure 45) is displayed.
Figure 45. BI Delivers − Manage Catalog - Copy/Move page
2. Click the folder to be copied or move the folder or item.
3. Select the Move Item check box.
Title 1, Chapter 17EmpowHR Version 9.0
48
Note: When a folder or item is copied to a new location, it also remains in the original location.Modifying one instance of the folder or item does not modify both instances of the folder or item.
4. Click the Copy/Move Item button to move the selected item.
OR
Click Cancel to return to the Manage Catalog page (Figure 46) with no changes.
Create New iBot
Note: This function will be implemented in a later phase.
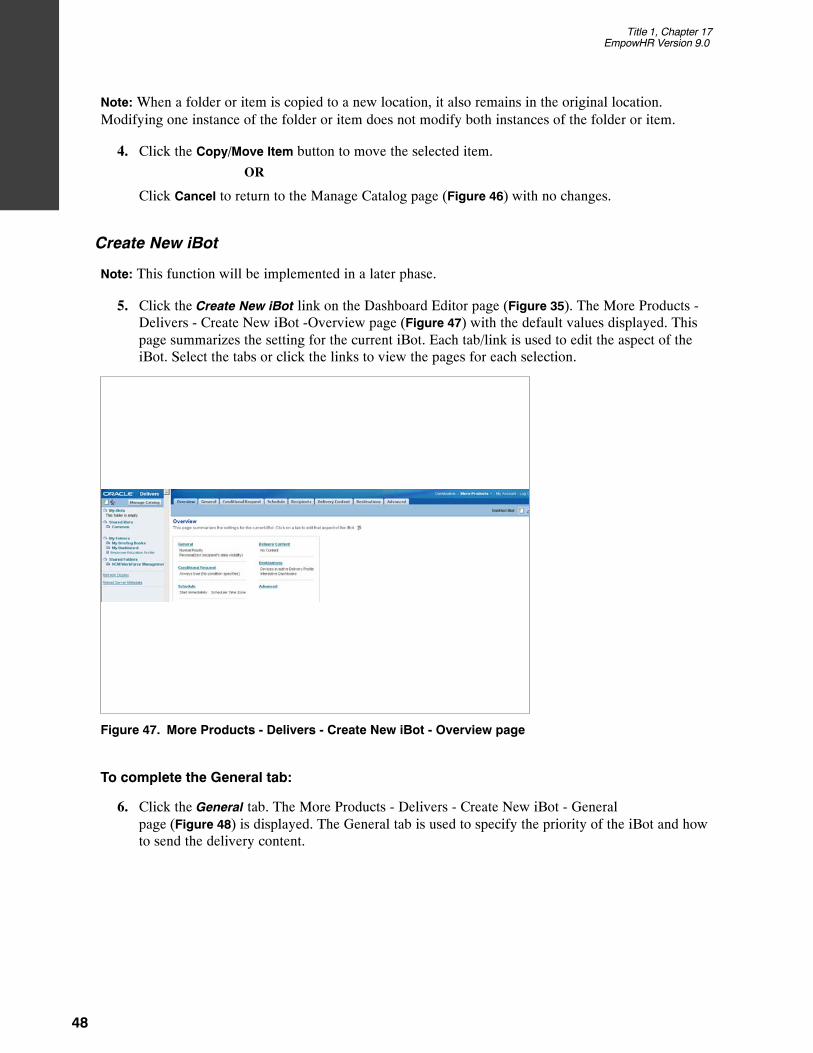
5. Click the Create New iBot link on the Dashboard Editor page (Figure 35). The More Products -Delivers - Create New iBot -Overview page (Figure 47) with the default values displayed. Thispage summarizes the setting for the current iBot. Each tab/link is used to edit the aspect of theiBot. Select the tabs or click the links to view the pages for each selection.
Figure 47. More Products - Delivers - Create New iBot - Overview page
To complete the General tab:
6. Click the General tab. The More Products - Delivers - Create New iBot - Generalpage (Figure 48) is displayed. The General tab is used to specify the priority of the iBot and howto send the delivery content.

Title 1, Chapter 17EmpowHR Version 9.0
Data W
areho
use
49
Figure 48. More Products - Delivers - Create New iBot - General page
7. Complete the fields as follows:
Priority Select the importance of the iBot. The valid values are High, Normal andLow.
Data Visibility This field is used to impersonating a different user at runtime. The data visibilityoption allows a range of customized iBot results. Select the applicable choice fromthe drop-down list. The valid values are as follows:
Data Visibility Definition
Personalized(individual datavisibility)
This option uses the data visibility of each recipient to customize iBot deliverycontent for each recipient. This setting does not use the Run As field.
Not Personalized (usethe Run As user’sdata visibility)
This option sends the iBot delivery content to the specified recipients. All usersreceive the same content as if they were the user specified in the Run As field. Thisoption is available only to users defined as Web Administrators with at least one ofthe following privileges set in BI Web Administrator.
� Publish iBot for subscription
� Deliver iBots to specific or dynamically determined users
Not Personalized (useiBot owner’s datavisibility)
This option sends the iBots delivery content to the specified recipient using the datavisibility of the user who created the iBot. All users receive the same content as theiBot owner. This option is available to users that have at least one of the privilegeslisted previously, but is not required to be defined as a BI Web Administrator.
To complete the Conditional Request tab:
8. Select the Conditional Request tab. The More Products - Delivers - Create New iBot -Conditional Request page (Figure 49) is displayed. Select a request which will trigger the currentiBot. The request may be refined further by creating subquery filters. The iBot is consideredtriggered if the conditional request returns one or more rows.

Title 1, Chapter 17EmpowHR Version 9.0
50
Figure 49. More Products - Delivers - Create New iBot - Conditional Request page
9. Click Select Condition. The Choose Request page (Figure 50) is displayed.
Figure 50. Choose Request page
10. Complete the fields as follows:

Title 1, Chapter 17EmpowHR Version 9.0
Data W
areho
use
51
Request The user can chain requests together to create complex conditional logic.Complete the dialog box.
11. Click OK to complete the page.
OR
Click Cancel to select another tab.
To complete the Schedule tab:
12. Select the Schedule tab. The More Products - Delivers - Create New iBot - Schedulepage (Figure 51) is displayed. Use the Schedule tab to determine when the iBot runs, how often itruns, and when to discontinue running it.
iBots can execute based on a specified schedule, defined start date and time, a recurrenceschedule, and an ending date.
A nonscheduled iBot can also be created. This is useful when the user wants to create and iBotthat runs only as part of an iBot chain, or an iBot that is initiated by an external process.
Figure 51. More Products - Delivers - Create New iBot - Schedule page
To create an iBot with no schedule:
Set Schedule Remove the check mark to create an iBot with no schedule.
13. Click Save.

Title 1, Chapter 17EmpowHR Version 9.0
52
To start the iBot now:
Set Schedule Check this radio button.
Start Immediately Check this radio button.
Start Date Enter the start date to start the iBot at a specified date or select a date fromthe calendar icon. The date specified is determined by the Time Zoneselected. The location (time zone) of the machine where the BI Scheduler islocated is not relevant.
Time of Day Enter a starting time of the day, if applicable.
Time Zone Select the time zone from the drop-down list to determine when the iBotstarts. The times specified are determined by the time zone selected. Thelocation (time zone) of the machine where the BI Scheduler is located is notrelevant.
Recurrence Check the applicable radio button. This field works together with the RepeatEvery field.
� Once - Run once (or on 1 day if repeating). This is the default option.
� Daily - Specify the daily interval, such as every 3 days.
� Weekly - Specify the weekly interval, such as 1 week. Select the days ofthe week when the iBot should run, such as Monday through Friday.
� Monthly - Specify either the day of the month or the day occurrence, suchas the first Tuesday. Select the desired months.
Repeat Every Check this box and enter the applicable information based on theRecurrence selected.
Minutes until When the Repeat Every field is checked, enter the minutes if applicable.
End Date None is the default option. Uncheck if applicable.
End by Enter a date or select a date from the calendar icon. Enter information in thisfield only if the End Date is unchecked.
To complete the Recipients tab:
14. Select the Recipients tab. The More Products - Delivers - Create New iBot - Recipientspage (Figure 52) is displayed. The Recipients tab is used to select the users and group to receivethe deliver content of the iBot.
Note: If the user selects the option to allow the recipients to be determined from the results of aconditional request and choose to show only relevant rows to each user, BI Delivers assumes the resultsof the conditional request set as the delivery content in the Delivery Content tab. If the content has beenset to something else in the Delivery Content tab (through clicking the Clear or Select Content buttons),a message appears. The message asks if the request is to update the delivery content, or No to retain thecurrent delivery content. If No, the recipients will still be determined from the conditional request, butusers will receive all content, and not just the content that pertains to them.

Title 1, Chapter 17EmpowHR Version 9.0
Data W
areho
use
53
Figure 52. More Products - Delivers - Create New iBot - Recipients page
15. Complete the fields on the Recipients page as follows:
Recipients
Me This box is checked as the default. The Me option sends the delivery contentto the creator of the iBot.
Subscription Options
Publish for Subscription Check this box to allow users to subscribe to the iBot. When this box ischecked, the All Subscribers to customize iBot option is enabled.
To disallow users from subscribing to the iBot, remove the check in the box.When this option is uncheck, any selected subscribers are disabled and theAllow Subscribers to Customers iBot is cleared and disabled.
16. Click the Select button to open the Select Subscribers dialog box (Figure 53) and specify theeligible users and groups. The user can only publish iBots that have content that can be shared.

Title 1, Chapter 17EmpowHR Version 9.0
54
Figure 53. Select Subscribers dialog box
To use the Select Subscribers dialog box:
Show Available Select the available subscribers from the drop-down list. The valid values areGroups, Groups/Users, and Users.
17. Select an Available Subscriber, and click the >> to move the selected subscriber into the list ofSelected Subscribers (Figure 54). To select multiple Subscribers, hold down the Shift or CTRLkeys and select an adjacent or non adjacent recipient.
18. To remove a recipient, click a user or group, and then click the << button. Use the Shift or CTRLkeys to select multiple groups or users.

Title 1, Chapter 17EmpowHR Version 9.0
Data W
areho
use
55
Figure 54. List of Selected Subscibers page
19. Click OK. This closes the Recipients Dialog box and returns to the Recipients page. The SelectedSubscriber are shown on the Recipients page (Figure 55). When more than one subscriber isselected, move the cursor over the people icon to view the list of subscribers selected.
Figure 55. Recipients page with Selected Subscibers
20. Continue to complete the Recipients page:
Title 1, Chapter 17EmpowHR Version 9.0
56
Allow Subscribers toCustomize iBot
This option enables subscribers to supply filter values for prompted filters forcolumns in an iBot and allows the subscriber to customize the iBot. Thisoption is only available when the Publish for Subscription option is selected.
To complete the Delivery Content tab:
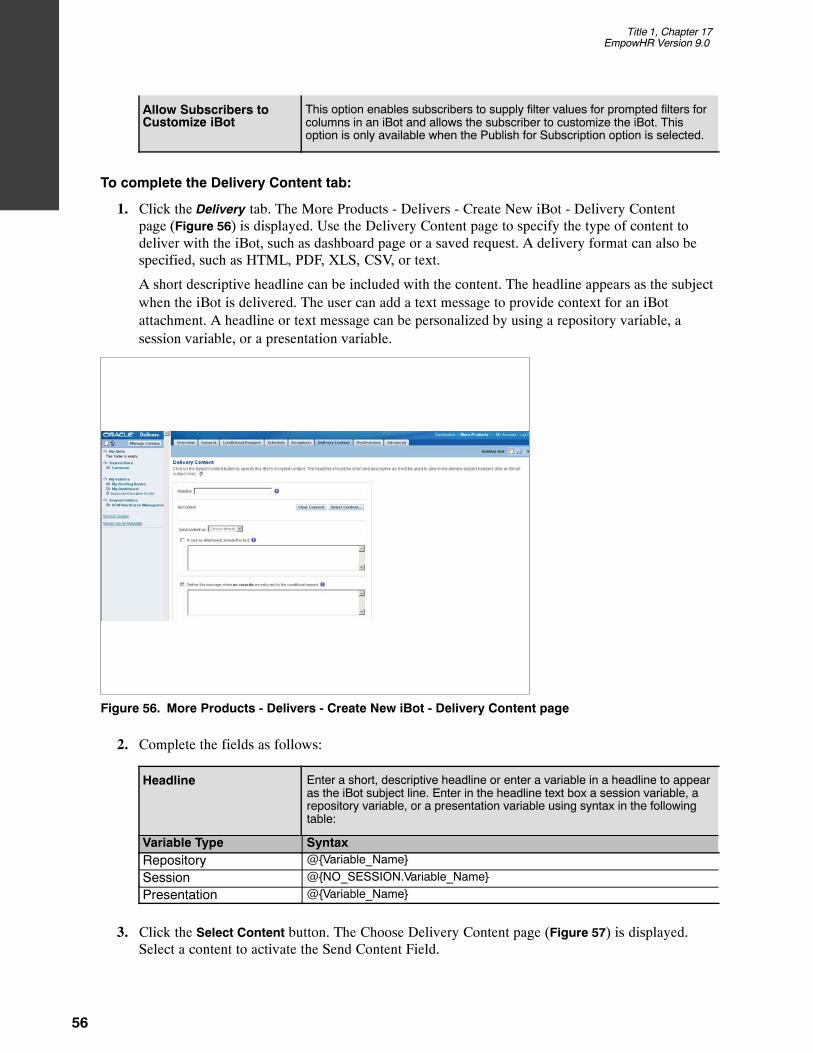
1. Click the Delivery tab. The More Products - Delivers - Create New iBot - Delivery Contentpage (Figure 56) is displayed. Use the Delivery Content page to specify the type of content todeliver with the iBot, such as dashboard page or a saved request. A delivery format can also bespecified, such as HTML, PDF, XLS, CSV, or text.
A short descriptive headline can be included with the content. The headline appears as the subjectwhen the iBot is delivered. The user can add a text message to provide context for an iBotattachment. A headline or text message can be personalized by using a repository variable, asession variable, or a presentation variable.
Figure 56. More Products - Delivers - Create New iBot - Delivery Content page
2. Complete the fields as follows:
Headline Enter a short, descriptive headline or enter a variable in a headline to appearas the iBot subject line. Enter in the headline text box a session variable, arepository variable, or a presentation variable using syntax in the followingtable:
Variable Type SyntaxRepository @{Variable_Name}
Session @{NO_SESSION.Variable_Name}
Presentation @{Variable_Name}
3. Click the Select Content button. The Choose Delivery Content page (Figure 57) is displayed.Select a content to activate the Send Content Field.

Title 1, Chapter 17EmpowHR Version 9.0
Data W
areho
use
57
Figure 57. Choose Delivery Content page
4. Complete the field as follows:
Delivery Content Specify the deliver content and double click to add the information. Thefollowing can be specified:
� The results of the condition request.
� A narrative text description of the conditional request (only displays whena condition request exists).
� Dashboard pages from My Dashboard.
� Dashboard pages from public (shared ) dashboards.
� Briefing Books.
� Saved requests (shared and private).
� Disconnected Application Dataset.
5. Click OK to add the Delivery Content information to the Delivery Content page (Figure 56).
OR
Click Cancel. No information will be added to the Delivery Content page (Figure 56).
6. Continue to complete the Delivery Content page.
Send Content as This field is activated when information on the Choose Delivery Contentpage is completed. The format option for included content depend upon thetype of delivery content selected. Select a format from the drop-down list (notevery type of content has all format options). The valid values are as follows:
Delivery Format Options Definition(Device default) BI Delivers will use the device default to determine the content
format.

Title 1, Chapter 17EmpowHR Version 9.0
58
DefinitionDelivery Format OptionsHTML Delivery content will be send in line as HTML.
Attachment (HTML) Delivery content will be sent as an HTML attachment.
Attachment (PDF) Delivery content will be sent as a PDF attachment.
Excel Delivery content will be sent as an XLS attachment.
Excel 2000 Delivery content will be sent as an XLS attachment.
Attachment (CSV data) Delivery content will be sent as a Comma Separated Value (CSV)attachment.
Plain Text Delivery content will be sent in plain text format.
If sent as attachment,include this text
Check this box to add a variable in a text message to provide context to theiBot attachment.
Deliver this messagewhen no records arereturned by theconditional request
Enter the text into the text box. or enter a variable in the text message for noiBot content.
Note: Enter text to be delivered to recipient when there is noiBot to deliver to them. This might be all recipients, if the iBotis configured to run all requests as a specific user on theGeneral page (Figure 48).
To complete the Destinations tab:
7. Click the Destinations tab. The More Products - Delivers - Create New iBot - Destinations page(Figure 58) is displayed. Use the Destinations tab to specify a range of desired devices anddestinations for iBots.
Figure 58. More Products - Delivers - Create New iBot - Destinations page
8. Complete the fields on the Destinations page as follows:
Title 1, Chapter 17EmpowHR Version 9.0
Data W
areho
use
59
User Destinations
Interative Dashboard Check this box. The Active iBot will appear in a Dashboard Alerts section aswell as the on the Alerts! A link to this summary appears together with theapplication navigation links when new iBots are delivered. After these arecleared on the Alerts page, the alert link is removed.
Active Deliver Profile Check this box to send and iBot to a specified device in the active deliveryprofile. The active delivery profile is configured through My Account page.
Specified Devices (will override a user’s Active Delivery Profile)
If a specified devices is selected, the default device selected on the My Account page will override thedevices set in the activity delivery profile for a user. Devices specified on this page act as additions tothe active delivery profile.
Email Check this box if applicable.
Pager Check this box if applicable.
Digital Phone Check this box if applicable.
Handheld Device Check this box if applicable.
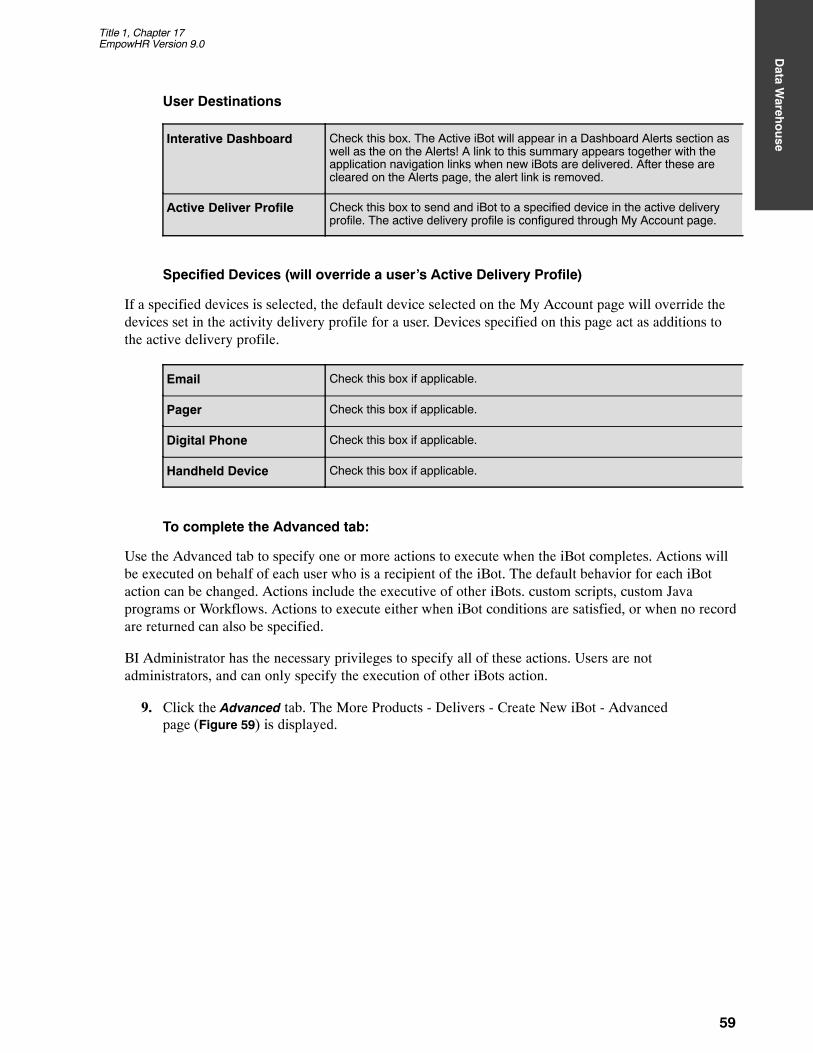
To complete the Advanced tab:
Use the Advanced tab to specify one or more actions to execute when the iBot completes. Actions willbe executed on behalf of each user who is a recipient of the iBot. The default behavior for each iBotaction can be changed. Actions include the executive of other iBots. custom scripts, custom Javaprograms or Workflows. Actions to execute either when iBot conditions are satisfied, or when no recordare returned can also be specified.
BI Administrator has the necessary privileges to specify all of these actions. Users are notadministrators, and can only specify the execution of other iBots action.
9. Click the Advanced tab. The More Products - Delivers - Create New iBot - Advancedpage (Figure 59) is displayed.
Title 1, Chapter 17EmpowHR Version 9.0
60
Figure 59. Advanced page
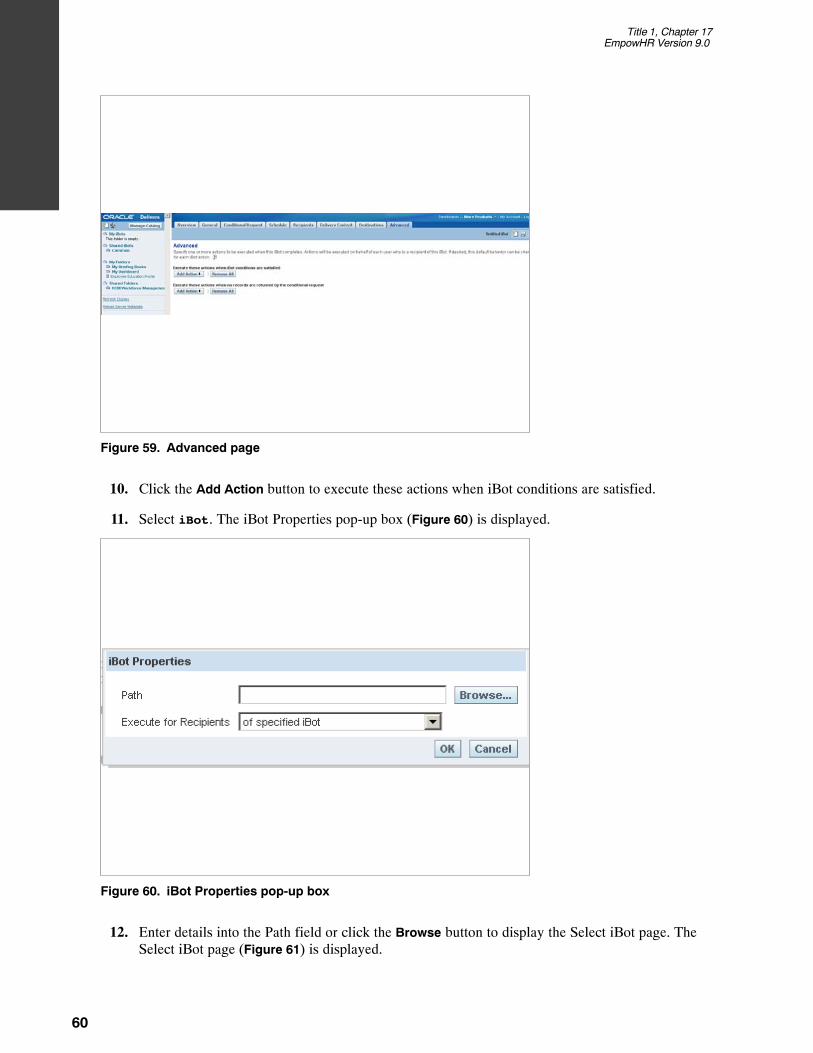
10. Click the Add Action button to execute these actions when iBot conditions are satisfied.
11. Select iBot. The iBot Properties pop-up box (Figure 60) is displayed.
Figure 60. iBot Properties pop-up box
12. Enter details into the Path field or click the Browse button to display the Select iBot page. TheSelect iBot page (Figure 61) is displayed.

Title 1, Chapter 17EmpowHR Version 9.0
Data W
areho
use
61
Figure 61. Select iBot page
13. Select the iBot to run.
14. Click OK to add the information to the iBot Properties (Figure 60) pop-up box.
OR
Click Cancel to return to the iBot Properties (Figure 60) .
Execute for Recipients The field is the scope of recipients. Select data from the drop-down list. Thevalid values are as follows:
Note: When there are filters from originating iBots applied to subsequent iBots, filter values aregenerated by the conditional request specified at the Conditional Request tab (Figure 49)
15. Click OK to add the information to the Advanced page (Figure 59).
OR
Click Cancel to return to the Advanced page (Figure 59).
16. Click Remove to remove the Add Action information.
To continue completing the Advanced page:
17. Click Add Action to execute on completion of an iBot.
18. Select iBot. The iBot Properties pop-up box (Figure 62) is displayed.

Title 1, Chapter 17EmpowHR Version 9.0
62
Figure 62. iBot Properties pop-up box
19. Enter details into the Path field or click the Browse button to display the Select iBot page. TheSelect iBot page (Figure 63) is displayed.
Figure 63. Select iBot page
20. Select the iBot to execute.
21. Click OK to add the information to the iBot Properties pop-up box (Figure 62 ).OR

Title 1, Chapter 17EmpowHR Version 9.0
Data W
areho
use
63
Click Cancel to return to the iBot Properties (Figure 62) .
Execute for Recipients The field is the scope of recipients. Select data from the drop-down list. Thevalid values are as follows:
Execute for RecipientsValid Values
Description
Of Specified iBot Select this option to use the iBot referenced in this dialog.
Of Current iBot Select this option to use the current iBot containing subsequent actions.
Of Both Specified andCurrent iBot
Select this option to use the union of both iBots.
Common to Specified andCurrent iBot
Select this option to use the intersection of both iBots.
Of Specified iBot, but notCurrent iBot
Select this option to use the referenced iBot and exclude recipients from thecurrent iBot.
Note: When there are filters from originating iBots applied to subsequent iBots, filter values aregenerated by the conditional request specified at the Conditional Request tab (Figure 49)
22. Click OK to add the information to the Advanced page (Figure 59).
OR
Click Cancel to return to the Advanced page (Figure 59).
23. Click Remove to remove the Add Action information.
Using the Save iBot Dialog Box to organize iBots:
The Save iBot dialog box enables the user to organize their iBots by saving them in an existing folder, orin new folders that the user creates. The user can Save the iBot dialog box to create a folder hierarchy inwhich to save their iBots. Use the Save icon on the top right hand corner of the Recipients page.
To save an iBot in a new folder that you create:
1. Click on of the following options to display the Save iBot dialog box:
For a new iBot, click the Save This iBot icon. The Save iBot page (Figure 64) is displayed.

Title 1, Chapter 17EmpowHR Version 9.0
64
Figure 64. Save iBot page
To complete the fields on the Save iBot page:
Folder Enter the folder where the iBot information will be saved.
Name Enter a folder name.
Description Enter the description of the folder if applicable.
2. Click the Create Folder button. The Create Folder in Shared iBots page (Figure 65) is displayed.

Title 1, Chapter 17EmpowHR Version 9.0
Data W
areho
use
65
Figure 65. Create Folder in Shared iBots page
3. Enter the new folder name.
4. Click OK to save the information. The Create Folder in Shared iBots page will displayed.
5. Click OK to save the information. Continue to click OK to return to the previous page.
OR
Click Clear to remove the information entered.
6. Click OK to save the information on the Save iBot page (Figure 64) and return to the Recipientspage (Figure 52)
OR
Click Clear to remove the information entered.
For an existing iBot, click the Save This iBot As icon.
Note: The same pages (Figure 64) and (Figure 65) appear when the Save This iBot icon is selected.
Note: When the user clicks the Save this iBot button (for an existing iBot), the iBot is saved but theSave iBot dialog box is not displayed. However, the Save iBot dialog box is displayed if thesubscription status is change, and the iBot has not been saved.
Note: To remove the information on a page, click the corner reverse arrow in the top right hand ofthe page.
7. Continue completing the Recipients page.

Title 1, Chapter 17EmpowHR Version 9.0
66
Edit My Account
8. Select Delivers. The More Products - Delivers- Start page (Figure 66) is displayed. The Start pagehas two main areas:
Selection pane - the selection pane is located on the left side of the page. It show Delivers contentsaved in the Presentation Catalog, such as personal and share iBots.
Workspace - The workspace is located to the right of the selection pane. It initially shows the iBotlinks to create and manage iBots.
When a selection is made from the selection pane, such as clicking a saved iBot, the selection appears inthe workspace. When the iBot is clicked in the workspace, the workspace displays tabs for working withthe iBot. The tabs will not appear for iBots selected from the Shared iBots folder, unless the user is aWeb Administrator and has the proper permissions.
Figure 66. More Products − Delivers Start page
9. Select the Edit My Account link. The More Products - Delivers - Edit My Accountpage (Figure 67) is displayed.

Title 1, Chapter 17EmpowHR Version 9.0
Data W
areho
use
67
Figure 67. More Products - Delivers - Edit My Account page
10. Complete the fields on the Edit Account page as follows:
General
Display Name This field is the user ID of individual to which My Account belongs.
User ID This field is the user ID of individual to which My Account belongs.
Preferences
Default Dashboard This field defaults to My Dashboard. To change, select data from thedrop-down list. The valid values are dependent on how the agencyconfigures the naming convention of their dashboards.
Local Select the locale for this session.
User Interface Language This field defaults to English. To change, select data from the drop-downlist. This is the language in which BI is to appear.
Time Zone This field is the BI accounts’ preferred time zone. This option allows systemusers who do not reside in the same physical location to override the defaulttime zone that was set by the system administrator. The time zone selectedwill apply to any items that are created, modified, run, received, and printed.
11. Click the Change Password link to change the login password. For more information refer toChange Password.
Delivery Options
Delivery Options allow the user to add or modify the devices to receive notifications from BI Delivers.
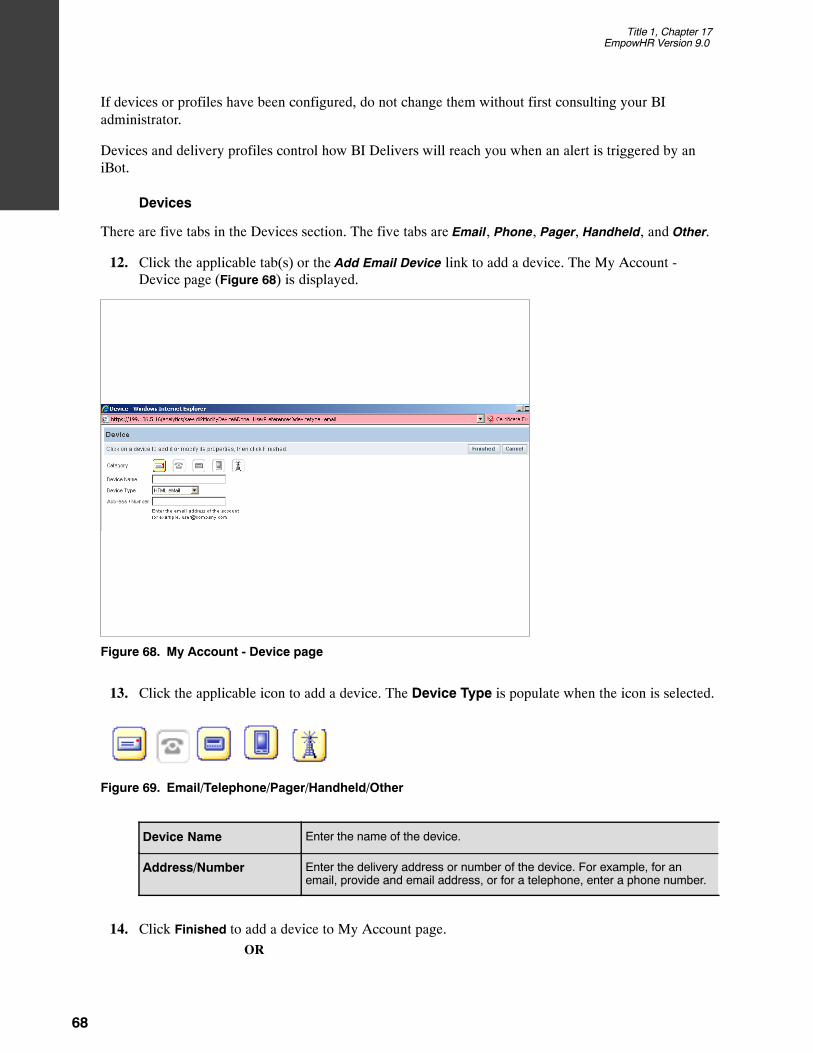
Title 1, Chapter 17EmpowHR Version 9.0
68
If devices or profiles have been configured, do not change them without first consulting your BIadministrator.
Devices and delivery profiles control how BI Delivers will reach you when an alert is triggered by aniBot.
Devices
There are five tabs in the Devices section. The five tabs are Email, Phone, Pager, Handheld, and Other.
12. Click the applicable tab(s) or the Add Email Device link to add a device. The My Account -Device page (Figure 68) is displayed.
Figure 68. My Account - Device page
13. Click the applicable icon to add a device. The Device Type is populate when the icon is selected.
Figure 69. Email/Telephone/Pager/Handheld/Other
Device Name Enter the name of the device.
Address/Number Enter the delivery address or number of the device. For example, for anemail, provide and email address, or for a telephone, enter a phone number.
14. Click Finished to add a device to My Account page.
OR

Title 1, Chapter 17EmpowHR Version 9.0
Data W
areho
use
69
Click Cancel to exit the with selections and return to My Account page.
Delivery Profiles
15. Click the Add Delivery Profile link. The My Account - Delivery Profile page (Figure 70) isdisplayed. A delivery profile determines how content is delivered to you. Multiple profiles can becreated − For example, In Office and Away from Office.
Figure 70. My Account - Delivery Profile page
Specify the devices to use when this is the active profile. Content priority (as specified in a DeliversiBot) determines the delivery device the profile will use. Content delivery notifications (Alerts) will alsoappear in the Alerts section of your Dashboard.
16. Click Finished to add a profile to My Account page.OR
Click Cancel to exit the without adding a profile and return to My Account page.
Group Membership
This is the list of groups to which you belong. This list will be different for each user depending on youragency’s configuration.
Show iBots Acting on My Behalf
Note: This function will not be used at this time.
Marketing
Marketing is an option from More Products that is accesses through the Dashboard (Figure 71).

Title 1, Chapter 17EmpowHR Version 9.0
70
Note: Marketing is not available at this time.
Figure 71. More Products − Marketing page
Disconnect Analytics
Disconnect Analytics is an option from More Products that is accesses through the Dashboard.
Note: Disconnect Analytics is not available at this time.

Title 1, Chapter 17EmpowHR Version 9.0
Data W
areho
use
71
Business Intelligence Publisher Engine
BI Publisher is the integrated pixel-perfect reporting component, which allows for the creation of highlyformatted template, reports, and business documents (i.e., government forms). The user can designtemplate layouts using Microsoft Word or Adobe Acrobat. The BI Publisher Engine will then use thesetemplates, dynamically fill in the content, and bursts these reports to a variety of formats (html, PDF,excel, etc.) and deliver them to any destination. For example: Web, printer, fax, email, portal and contentservers. BI Delivers is the interface used to create BI Alerts based on analytics results.

Title 1, Chapter 17EmpowHR Version 9.0
72
Reports
A report is a Request in BI. Reports can be a table, graph or gauge. Depending on how the report isbuilt, additional data may be displayed by clicking or scrolling over parts of the report.
The data to create the report is extracted from the EmpowHR Production application and organized intological subject areas and stored in the data warehouse. The reports are derived from the data in the datawarehouse. This enables the user to create more sophistical reports in less time without affecting theprocessing response in EmpowHR. The data in the Data Warehouse is updated biweekly after each payprocessing period (after the BEAR process).
Data Warehouse displays multiple reports in a tabbed interface. The reports are interactive and displayhighly summarized and graphical data. Users can export reports to PDF and HTML and can be printedor downloaded to Excel and CSV format.
Reports can contain a variety of graphs and prompts to illustrate the different reporting options availablewith the BI tool.
The data displayed in the reports are based on the agency hierarchy and will be limited based on thelevel of security of the user. The user can drill-down by clicking the highest level of data and view thelowest level of the organizational stricture. The user can drill down a maximum of six levels oforganizational structure depending on the report.
Depending on the security of the user, there will be 9 or 11 reports available on the HR ManagerWorkforce Management Dashboard. Two of these reports, Activities by Period Details and theDepartment Employees Details, contain Personal Identification Information; therefore, access is limitedto these reports.
By default, the most recent data will be displayed; however, data can be filtered based on the criteria thatis selected. The filters are for the entire page and will alter the data displayed for all reports on the page.
Reports can be printed by clicking the print icon or link on the page. This icon opens a printer-friendlypage enabling the user to print the reports. When the icon or link is used, the user has an option to openthe report in an HTML or PDF format for printing.
The Data Warehouse optimizes, tracks, and monitors various workforce metrics. It allows users toretrieve comprehensive reports on several subject areas. The types of reports below are available in theData Warehouse; however, will only be available if the Agency users these modules in the EmpowHRapplication.
Workforce Assignments
Turnover
Jobs
Health and Safety
Organizational Effectiveness
Grievances
Disciplinary Actions

Title 1, Chapter 17EmpowHR Version 9.0
Data W
areho
use
73
The Data Warehouse also allows users to compare results across financial periods and/or years by:
Headcounts
Hiring Trends
Separation Trends
Demographic Comparisons
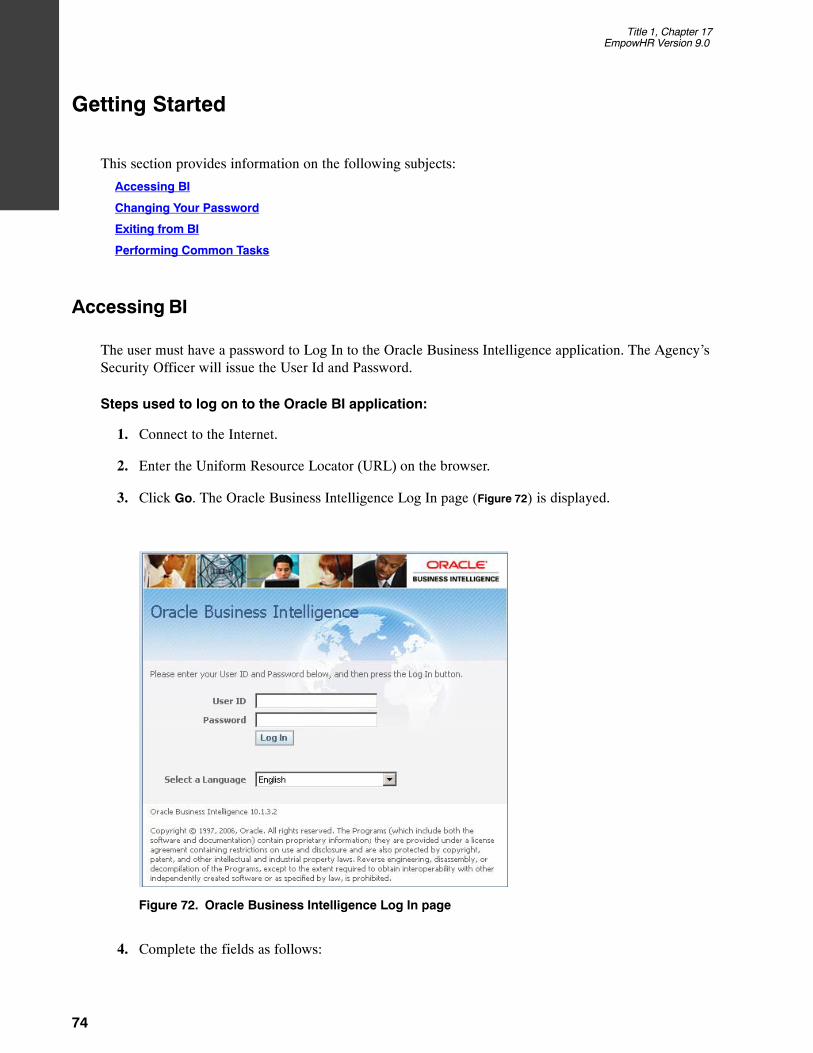
Title 1, Chapter 17EmpowHR Version 9.0
74
Getting Started
This section provides information on the following subjects:
Accessing BI
Changing Your Password
Exiting from BI
Performing Common Tasks
Accessing BI
The user must have a password to Log In to the Oracle Business Intelligence application. The Agency’sSecurity Officer will issue the User Id and Password.
Steps used to log on to the Oracle BI application:
1. Connect to the Internet.
2. Enter the Uniform Resource Locator (URL) on the browser.
3. Click Go. The Oracle Business Intelligence Log In page (Figure 72) is displayed.
Figure 72. Oracle Business Intelligence Log In page
4. Complete the fields as follows:

Title 1, Chapter 17EmpowHR Version 9.0
Data W
areho
use
75
User ID Enter the user ID assigned by the Agency’s Security Officer.
Password Enter the password assigned by the Agency’s Security Officer.
Select a Language This field defaults to English. To change the language, select theapplicable language from the drop-down list.
5. Click Log In. The Welcome page (Figure 73) is displayed.
Figure 73. Welcome page
Changing Your Password
To Log In to the Oracle BI application, the user will received a User ID and password from the AgencySecurity Officer. The user will log in using the issued User Id and Password. The application willprompt the user to change the issued password.
Steps used to change the password:
1. Connect to the Internet.
2. Enter the Uniform Resource Locator (URL) on the browser.
3. Click Go. The Oracle Business Intelligence Log In page (Figure 72) is displayed.
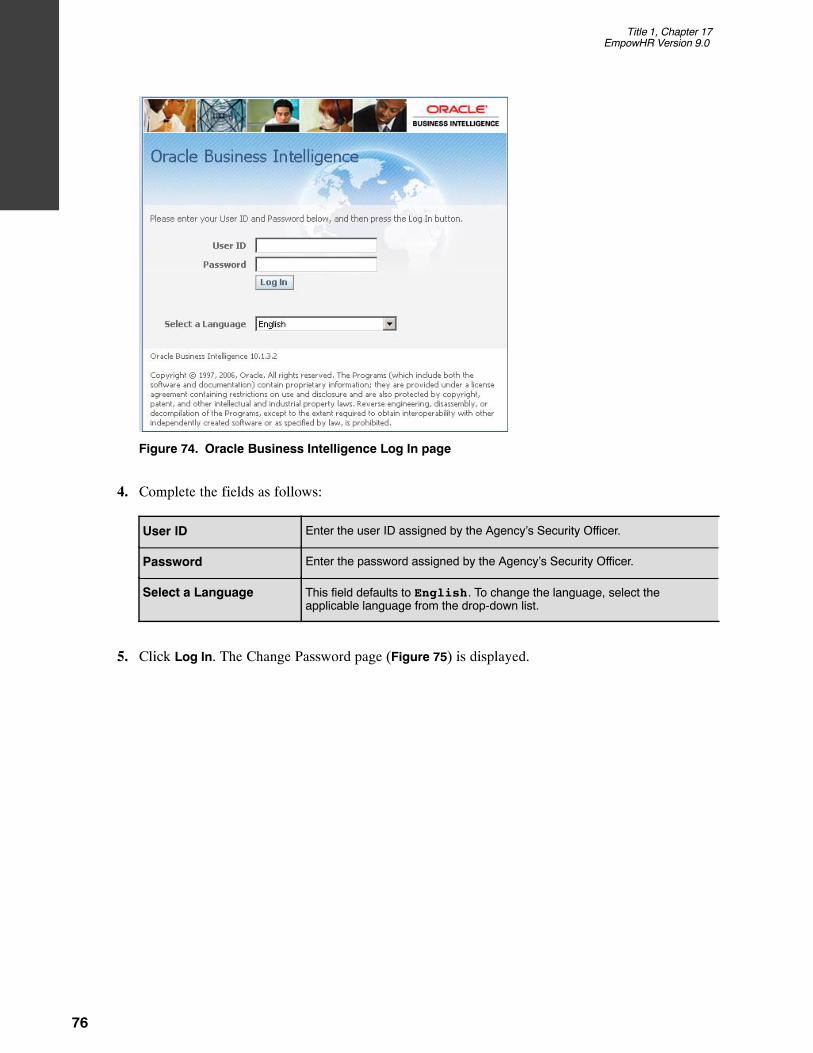
Title 1, Chapter 17EmpowHR Version 9.0
76
Figure 74. Oracle Business Intelligence Log In page
4. Complete the fields as follows:
User ID Enter the user ID assigned by the Agency’s Security Officer.
Password Enter the password assigned by the Agency’s Security Officer.
Select a Language This field defaults to English. To change the language, select theapplicable language from the drop-down list.
5. Click Log In. The Change Password page (Figure 75) is displayed.

Title 1, Chapter 17EmpowHR Version 9.0
Data W
areho
use
77
Figure 75. Change Password page
6. Complete the fields as follows:
*Current Password Enter the assigned by the Agency’s Security Officer.
*New Password Enter a new password.
*Confirm Password Confirm the password. This is the password entered in the New Passwordfield.
7. Click Change Password. The Welcome page (Figure 76) is displayed.
Figure 76. Welcome page
Exiting from BI
This section will explain the steps used to exit the Oracle BI application. The user can log out of DataWarehouse from each tab.

Title 1, Chapter 17EmpowHR Version 9.0
78
Steps used to exit BI:
1. Click Logout. The Oracle Business Intelligence Logged Out page (Figure 77) is displayed.
Figure 77. Oracle Business Intelligence Logged Out page
2. Click here to log back in. The Oracle Business Intelligence Log In page (Figure 72) is displayed.
Performing Common Tasks
This section explains how to perform common tasks in BI. It contains the following topics:
Viewing a Descriptions on a Dashboard
Viewing a Saved Request
Printing a Dashboard or Saved Request
Emailing a Dashboard or Saved Request
Downloading Results from Answers
Refreshing a BI Interactive Dashboard or BI Request
Navigating in BI (Data Warehouse)
Viewing a Descriptions on a Dashboard
A dashboard can be created with a description in the BI Presentation Catalog. If no description issupplied, the description defaults to the name of the dashboard.
To view the description, pause the cursor over the name of the dashboard in the Interactive Dashboard.
Viewing a Saved Request
A dashboard can be created with a description in the BI Presentation Catalog. If no description issupplied, the description defaults to the name of the saved request.
To view a saved request, pause the cursor over the title of the saved request in the selection pane in BIAnswers.

Title 1, Chapter 17EmpowHR Version 9.0
Data W
areho
use
79
Printing a Dashboard or Saved Request
A printer-friendly version can be displayed of the existing dashboard or request. The printer-friendlyversion does not contain any extraneous links or hypertext items.
To print use HTML or Adobe PDF (Portable Document Format). Adobe PDF is the only print optionavailable for BI Publisher reports. Adobe Reader 6.0 or greater is required to print using Adobe PDF.
Note: The HTML method of printing relies on the print handling capabilities of the user’s browser.
To print a dashboard or a saved request:
1. Navigate to an existing dashboard or request.
2. To print a request, click the print link.OR
To print a dashboard page, locate the dashboard page and click Print at the bottom of thedashboard.
3. Choose HTML or PDF.
Note: For HTML, a new window shows the selected item without the extraneous links.
Choose File> Print on the browser menu.
For PDF, use the options available in the Adobe PDF window to save or print the file.
Emailing a Dashboard or Saved Request
A Dashboard page or a request can be emailed as an attachment. The format depends on the browserused, such as Web Archive, Single File (.mht) in Internet Explorer or Mozilla Archive Format (.maf) inMozilla and Firefox.
Note: The Mozilla Archive Format capability is available as a separate downloaded plug-in.
In any browser, a dashboard page or a request can also be saved as a collection of HTML files. The usercan zip and email the corresponding directory of associated files.
To email a dashboard page or request:
1. Navigate to the dashboard page or request that should be sent.
2. To email a request, click the Print link (Figure ), and then choose HTML or PDF.
OR
To email a dashboard page, locate and click the Print button at the bottom of the dashboard, andthe choose HTML or PDF.
A new browser window opens and contains the dashboard page or the request.
3. From the browsers toolbar, choose File > Save As.
4. Save the file to the desired location, with the appropriate file type for the browser.

Title 1, Chapter 17EmpowHR Version 9.0
80
5. Send the saved attachment using an email application.
Note: The saved attachments can also be used as a means to archive and restore requests as they exist ata particular point and time.
Downloading Results from Answers
There are multiple ways to download results. These appear in the BI Answers as options for theDownload link. The Download link can also appear with a request in a dashboard.
Below are the options to download results:
Download to Excel
Download Data
Download Web Page (MHTML)
Download to Excel
This option makes the request results available to Microsoft Excel 2000 in HTML format, includingtables or chars that appear with the results. It also includes any other views included in the report. Excelcontrols the positioning of the HTML.
To download to Excel:
1. Navigate to the request.
2. Click the Download link or icon and choose either Download to Excel or Download to Excel2000. The File Download box (Figure ) is displayed.
3. Save the file to the desired location, or open it in Excel. Excel can be used to refine the formattedresults.
Download Data
This option downloads results as a tab-separated list of values. The file will have a .CSV extension tofacilitate opening it in Excel. After download a request in a tab-determined format, it can be viewed inthe saved third-party application.
To download results as a tab-separated list:
1. Navigate to the request.
2. Click the Download link or icon and choose Download Data option.
.
3. The file is saved and is displayed in the format selected.

Title 1, Chapter 17EmpowHR Version 9.0
Data W
areho
use
81
Download Web Page (MHTML)
This option download results as a Web page. This allow the user to download the underlying data for anexisting request as a Web page (MHTML) file.
To download as a Web Page:
1. Navigate to the request.
2. Click the Download link or icon and choose Download Web Page (MHTML).
3. The file is saved and is displayed in the format selected.
Refreshing a BI Interactive Dashboard or BI Request
When a BI Interactive Dashboard or BI Request is executed, a temporary storage area called Caches iscreated. This saves frequently accessed or recently accessed results. Storing certain results can help toimprove the BI performance. Use the Refresh icon to make sure that the request bypasses savedinformation in the cache and is issued to the BI Server for processing.
To refresh an inactive dashboard or request:
1. Navigate to an existing dashboard or request.
2. Click the Refresh button to refresh a dashboard.
OR
Click the Refresh link to refresh a request.
Refreshing Information in the BI Selection Pane
The selection pane appears in the BI Answers and BI Delivers. When changes have been made to savedcontent, the display can be refreshed to access the most current information. Saved requests, filters,briefing books, and dashboard content can be refreshed. The information available in the selection paneis determined by the user’s permissions and responsibilities.
To refresh information in the selection pane:
1. Click the Refresh Display link at the bottom of the selection pane.
Navigating in BI (Data Warehouse)
When accessing BI, the first page presented is usually the Department’s WelcomeDashboard (Figure 78). Dashboards typically contains reports and other information for the user’s areaof responsibility.
Note: Your Department’s dashboard may look different than the one below.

Title 1, Chapter 17EmpowHR Version 9.0
82
Figure 78. Department’s Welcome Dashboard
This section contains the following BI features:
Links
Pages
Drill Down (Interactive)
Sorting
Tabs
Preferences
Briefing Books
Links
This section describes the links that provide access to Oracle BI functions. The links are located atin the upper right hand corner of the page. The links available are determined by the user’sprivileges. Below, is an example of My Dashboard (Figure 79) with available links.
Figure 79. My Dashboard
The links are located near the top of the page. The user can access other links as views, such asDashboards, Answers, Delivers, Alerts, Administration, and My Account (Answers, Deleivers,Alerts, Administration will become available in a furture release). There are also links in themiddle of the page that allow the users to view other sites. The views and access are determinedby the user’s role and repressibilities. Below is a table that describes some of the BI feature links:
Links Description
Alerts! This link accesses the Active Alerts page, where the user can view and manageactive alerts. This like appear only if there are active alerts.
Dashboards This link accesses the Interactive Dashboard page, where the user can view thedashboards to which they have access.
Answers This link accesses BI Answers, from which the user can view, create, and managerequests.

Title 1, Chapter 17EmpowHR Version 9.0
Data W
areho
use
83
DescriptionLinks
More Products This link accesses BI Publisher, Delivers, Marketing and Disconnected Analytics/
Settings/My Account The Setting link accesses the BI Presentation Services Administration page, the ActAs page, and the My Account page. The My Account page enables the user to viewgeneral account information and set preference for the BI application.
Log Out This link is used to log out of BI. Always use this link to log out of the application.
Pages
BI is organized into pages. The Pages have two components:
Panes - Both BI Delivers and BI Answers pages display a left and right pane. The left pane isthe select pane, used to navigate to, select, and manage saved information. The right pane isused to display the work with the content selected in the left pane.
Tabs - Tabs provide access to other pages related to the current page. The tabs appear in thetop part of the page. The list of available tabs depends on the page selected.
BI feature links are used to access these pages. Each feature link provides access to a specificfeature or topic. Pages can contain other organization and navigation elements, such as tab, areas,and panes.
Figure 80. Pane and Tab page
Drill Down (Interactive)
Many of the results that appear on a report represent hierarchical data structure. BI allows the userto access different levels of detail. For example, clicking on a specific region in a chart, willdisplay values relevant to that region.
The user can also drill down in a report to view multiple organizational levels.

Title 1, Chapter 17EmpowHR Version 9.0
84
Sorting
In a dashboard, the column headers of tables that can be sorted have a slightly raised visualappearance. Click on the column header to sort it.
Preferences
From My Account page (Figure 81) the user can view general information, such as the displayname, and user ID. To navigate to My Account and to change preferences, use the followingsteps:
1. Navigate to the BI dashboard.
2. Click the My Account link at the top of My Dashboard page. My Account page (Figure 81) isdisplayed. The user can change the dashboard viewed upon login, set the location in the Localdrop-down list, select a language from the User Interface language drop-down list, or set a timezone from the Time Zone drop-down list. For more information see BI Delivers - Edit MyAccount link.
Figure 81. My Account page
Briefing Books
Steps to name briefing books:
If your organization licenses BI Briefing Books, the user can store a static snapshot or dashboard pagesor individual requests in one or more briefing books. Briefing Books can be downloaded or shared forviewing online. Briefing books and their content can also be updated, scheduled, and delivered using BIDelivers. Although a Brifeing Book folder and adding reports to a Briefing Book can be accompished,the capability to share a book is through BI Answers will be available in a future release.

Title 1, Chapter 17EmpowHR Version 9.0
Data W
areho
use
85
1. Click the Add to Briefing Book icon at the bottom left hand corner of the Dashboard. TheSave Briefing Books page (Figure 82) is displayed.
Note: The Add to Briefing Book icon is not available on an empty dashboard page.
Figure 82. Save Briefing Book Content page
2. Complete the fields as follows:
Briefing Book
3. Click the New Briefing Book link. The New Briefing Book page (Figure 83) is displayed.

Title 1, Chapter 17EmpowHR Version 9.0
86
Figure 83. New Breifing Book page
4. Complete the fields as follows:
Briefing Book Name Enter the name of the new briefing book.
Description Enter the description of the new briefing book.
5. Click Save Briefing Book to save the new book information.OR
Click Cancel to return to the Briefing Book page (Figure 82).
Note: When a new book is created or if an existing book is changed, the Save Options field group on theBriefing Book page (Figure 82) must be completed.
Save Options
Additional options may also be specified for the content and can be changed at a later date.
6. Complete the fields as follows:
Content Type Check the applicable box. The Updatable check box is the default. TheSnap Shot box can be selected if applicable.
Follow Briefing BookNavigation Links
The No check box is the default. The Yes box can be selected if applicalble.
Number of Links toFollow (5max)
This field defaults to 1.. Change the number if applicable.
Content Description Enter the narrative description of the briefing book.

Title 1, Chapter 17EmpowHR Version 9.0
Data W
areho
use
87
7. Click Add to add the briefing book information.
OR
Click Cancel to exit books.
Tabs
The Data Warehouse displays multiple tabs that generate reports. These reports are interactive anddisplay summarized and graphical data. The user can click on specific data fields on the report to displayinformation in more detail. The user can also export reports to a PDF and HTML and can be printed ordownloaded to Excel and CSV formats.
The following are tabs available:
Demography
Grade Distribution
Headcount Distribution
Headcount Trend by Department
Employment Change
Activities by Period Summary
Activities by Period Details
Activities Trend by Department
Minority Profile
Department Employee Details
Demography
The Demography reports provide a statistical overview of the biographical details of the employeessubagency, including age, gender, and ethnicity.
On the Demography tab, information is entered to generate a report. The information below will beincluded on a single report:
Employee Age Profile
Employee Average Age
Employee Education Profile
Employee Gender Profile
Employee Ethnical Group Distribution
Steps to generate a report from the Demography tab:
1. From the Dashboard (Figure 84) , complete the fields as follows:
Select Year Select the applicable year from the drop-down list.
Month Select the applicable month from the drop-down list.
Departments Select the applicable department from the drop-down list.

Title 1, Chapter 17EmpowHR Version 9.0
88
Figure 84. Dashboard page
1. Select the Demography tab. The Demography page (Figure 85)is displayed.
Figure 85. Demography detailed report
Grade Distribution
This report contains the number of employees within each grade and displays the percentage of each.
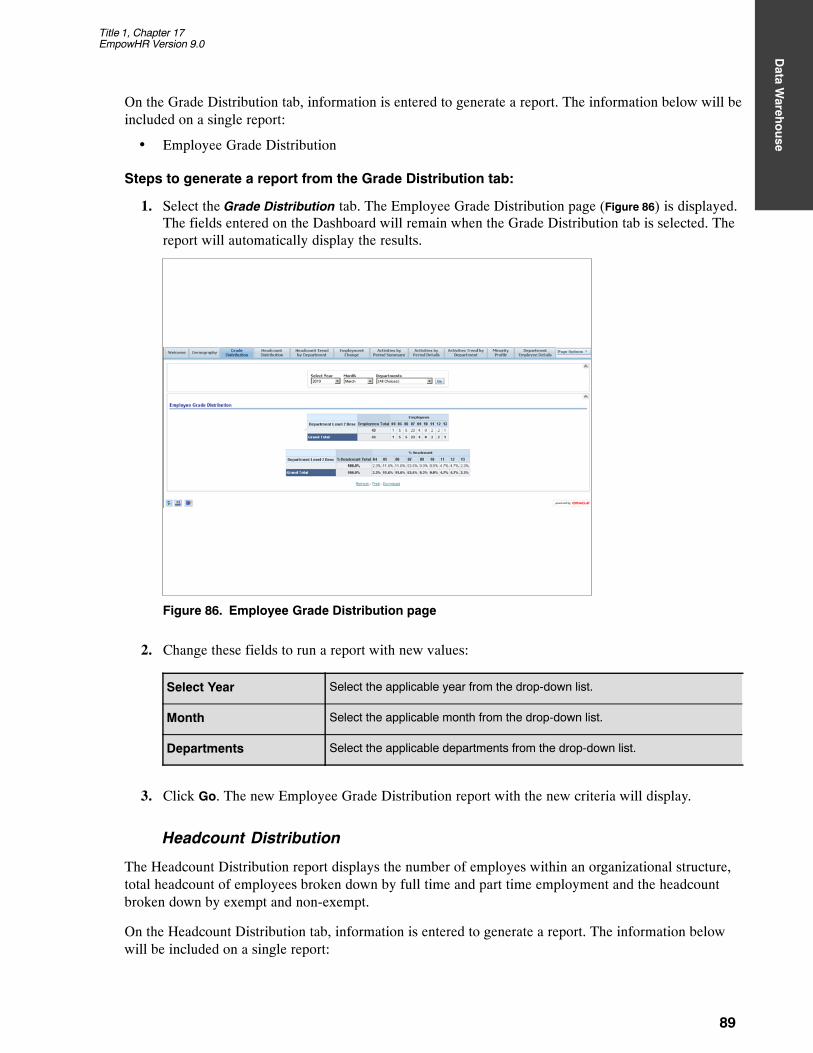
Title 1, Chapter 17EmpowHR Version 9.0
Data W
areho
use
89
On the Grade Distribution tab, information is entered to generate a report. The information below will beincluded on a single report:
Employee Grade Distribution
Steps to generate a report from the Grade Distribution tab:
1. Select the Grade Distribution tab. The Employee Grade Distribution page (Figure 86) is displayed.The fields entered on the Dashboard will remain when the Grade Distribution tab is selected. Thereport will automatically display the results.
Figure 86. Employee Grade Distribution page
2. Change these fields to run a report with new values:
Select Year Select the applicable year from the drop-down list.
Month Select the applicable month from the drop-down list.
Departments Select the applicable departments from the drop-down list.
3. Click Go. The new Employee Grade Distribution report with the new criteria will display.
Headcount Distribution
The Headcount Distribution report displays the number of employes within an organizational structure,total headcount of employees broken down by full time and part time employment and the headcountbroken down by exempt and non-exempt.
On the Headcount Distribution tab, information is entered to generate a report. The information belowwill be included on a single report:

Title 1, Chapter 17EmpowHR Version 9.0
90
Employee Headcount Distribution
Employee Headcount - Employee Type
Employee Headcount - Exempt Status
Steps to generate a report from the Headcount Distribution tab:
1. Select the Headcount Distribution tab. The Headcount Distribution page (Figure 87) is displayed.The fields entered on the Dashboard will remain when the Headcount Distribution tab is selected.The report will automatically display the results.
Figure 87. Headcount Distribution page
2. Change these fields to run a report with new values:
Select Year Select the applicable year from the drop-down list.
Month Select the applicable month from the drop-down list.
Departments Select the applicable departments from the drop-down list.
3. Click Go. The new Headcount Distribution report with the new criteria will display.
Headcount Trend by Department
The Headcount Trend by Department report contains a graph displaying the employe counts of aspecified period.
On the Headcount Trend by Department tab, information is entered to generate a report.
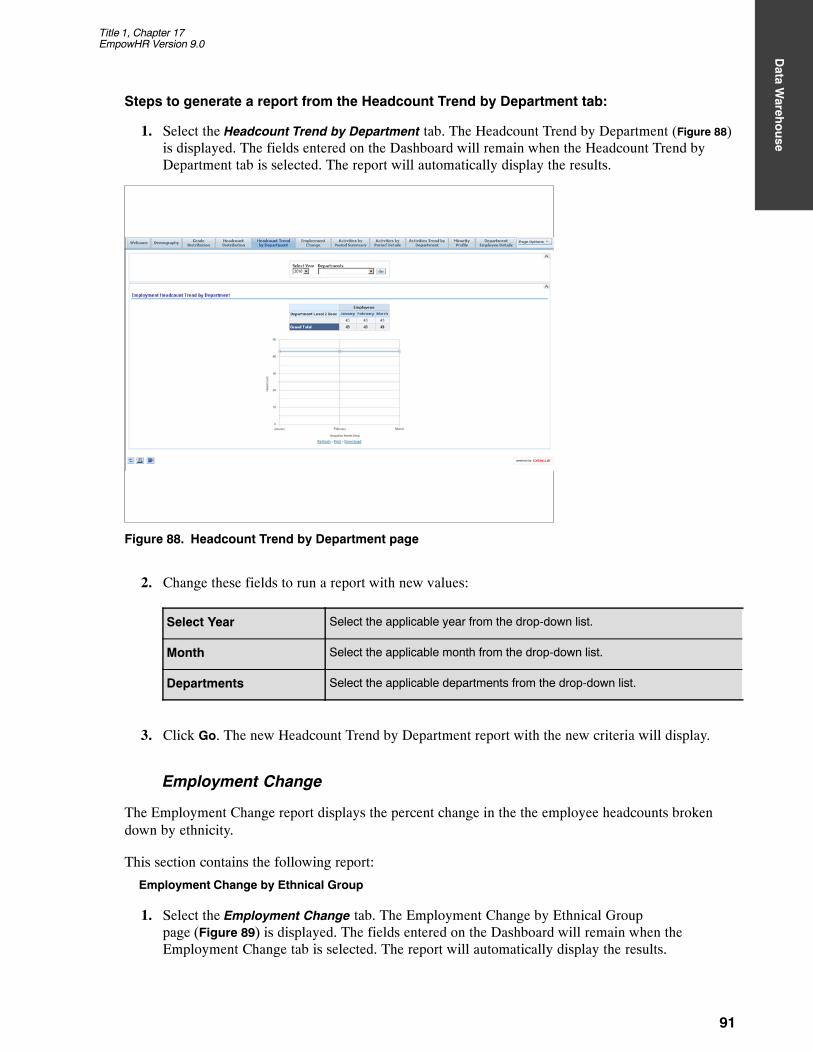
Title 1, Chapter 17EmpowHR Version 9.0
Data W
areho
use
91
Steps to generate a report from the Headcount Trend by Department tab:
1. Select the Headcount Trend by Department tab. The Headcount Trend by Department (Figure 88)
is displayed. The fields entered on the Dashboard will remain when the Headcount Trend byDepartment tab is selected. The report will automatically display the results.
Figure 88. Headcount Trend by Department page
2. Change these fields to run a report with new values:
Select Year Select the applicable year from the drop-down list.
Month Select the applicable month from the drop-down list.
Departments Select the applicable departments from the drop-down list.
3. Click Go. The new Headcount Trend by Department report with the new criteria will display.
Employment Change
The Employment Change report displays the percent change in the the employee headcounts brokendown by ethnicity.
This section contains the following report:
Employment Change by Ethnical Group
1. Select the Employment Change tab. The Employment Change by Ethnical Grouppage (Figure 89) is displayed. The fields entered on the Dashboard will remain when theEmployment Change tab is selected. The report will automatically display the results.

Title 1, Chapter 17EmpowHR Version 9.0
92
Figure 89. Employment Change by Ethnical Group page
2. Change these fields to run a report with new values:
Snapshot Year Select the applicable year from the drop-down list.
Snapshot Month Select the applicable month from the drop-down list.
Compare to Year Select the year to be compared or select a year from the drop-down list.
Compare to Month Select the month to be compared or select a month from the drop-down list.
Departments Select the applicable departments from the drop-down list.
3. Click Go. The Employment Change by Ethnical Group report with the new criteria will display.
Activities by Period Summary
The Activities by Period Summary report displays the total headcount for the highest level in theorganizational structure and the number of terminations, promotions, transfers, and accessions.
On the Activities by Period Summary tab, information is entered to generate a report. The informationbelow will be included on a single report:
HR Activities by Period
Termination Details by Period
Termination Turnover Rate
1. Select the Activities by Period Summary tab. The Activities by Period Summary reports resultspage (Figure 90) is displayed. The fields entered on the Dashboard will remain when theActivities by Period Summary tab is selected. The report will automatically display the results.

Title 1, Chapter 17EmpowHR Version 9.0
Data W
areho
use
93
Figure 90. Actiivites by Period Summary reports results page
2. Change these fields to run a report with new values:
Select Year Select the applicable year from the drop-down list.
Month Select the applicable month from the drop-down list.
Departments Select the applicable departments from the drop-down list.
3. Click Go. The Activities by Period Summary report with the new criteria will display.
Activities by Period Details
The Activities by Period Details reports contains details of each action that would affect employeeheadcounts, such as accessions, terminations, promotions, and transfers. Since this report containsemployee specific data, not all user will have the security access to this report.
On the Activities by Period Details tab, information is entered to generate a report. The informationbelow will be included on a single report:
HR Activities by Period - Details
1. Select the Activities by Period Summary tab. The HR Activities by Period page (Figure 91) isdisplayed. The fields entered on the Dashboard will remain when the Activities by Period Detailstab is selected. The report will automatically display the results.

Title 1, Chapter 17EmpowHR Version 9.0
94
Figure 91. HR Activities by Period page
2. Change these fields to run a report with new values:
Select Year Select the applicable year from the drop-down list.
Month Select the applicable month from the drop-down list.
Departments Select the applicable departments from the drop-down list.
3. Click Go. The HR Activities by Period report with the new criteria will display.
Activities Trend by Department
The Activities Trend by Department report contains headcount trends for a department by the number ofaccessions, transfers, promotions, and terminations over a specified period.
On the Activities Trend by Department tab, information is entered to generate a report. The informationbelow will be included on a single report:
HR Activities Trend by Department
1. Select the Activities Trend by Department tab. The HR Activities Trend by Departmentpage (Figure 92) is displayed. The fields entered on the Dashboard will remain when theActivities Trend by Department tab is selected. The report will automatically display the results.

Title 1, Chapter 17EmpowHR Version 9.0
Data W
areho
use
95
Figure 92. HR Activities Trend by Department page
2. Change these fields to run a report with new values:
Select Year Select the applicable year from the drop-down list.
Departments Select the applicable departments from the drop-down list.
3. Click Go. The HR Activities Trend by Department report with the new criteria will display.
Minority Report
The Minority Report contains the number of employees in the organizational structure in each grade byethnicity and the percentage of the employees in the organizational structure in each grade by ethnicity.
On the Minority Report tab, information is entered to generate a report. The information below will beincluded on a single report:
Minority Profile by Grade Report
1. Select the Minority Report tab. The Minority Profile by Grade Report page (Figure 93) isdisplayed. The fields entered on the Dashboard will remain when the Minority Report tab isselected. The report will automatically display the results.

Title 1, Chapter 17EmpowHR Version 9.0
96
Figure 93. Minority Profile by Grade page
2. Change these fields to run a report with new values:
Select Year Select the applicable year from the drop-down list.
Month Select the applicable month from the drop-down list.
Departments Select the applicable departments from the drop-down list.
3. Click Go. The Minority Profile by Grade report with the new criteria will display.
Department Employee Details
On the Department Employee Details tab, information is entered to generate a report.
1. Select the Department Employee Details tab. Information gathered is entered into prompts tobuild the report. Enter information on each prompt

Title 1, Chapter 17EmpowHR Version 9.0
Data W
areho
use
97
Figure 94. Select Year prompt
2. Select a year from the Select Year prompt (Figure 94)drop-down list.
3. Click Cancel to make another selection.
OR
Click Next Prompt to enter the information in the next prompt (Figure 95).
Figure 95. Select a Month prompt

Title 1, Chapter 17EmpowHR Version 9.0
98
4. Select a month from the Select Month prompt (Figure 95) drop-down list.
5. Click Cancel to make another selection.
OR
Click Previous Prompt to go back to the Select Year prompt (Figure 94)
OR
Click Next Prompt to enter information in the Select Department Name prompt (Figure 96).
Figure 96. Select Department Name prompt page
6. Select a department name. Multiple departments may be selected.
7. Click Cancel to make another selection.
OR
Click Skip Prompt. Information does not need to be entered in this prompt to run a report.
OR
Click Previous Prompt to go back to the Select Month prompt (Figure 95)
OR
Click Go to run the report. The Department Employee Details report (Figure 97) is displayed.

Title 1, Chapter 17EmpowHR Version 9.0
Data W
areho
use
99
Figure 97. Department Employee Details report

Title 1, Chapter 17EmpowHR Version 9.0
Index − 1
Heading Index
This index provides an alphabetical list of all headings in the procedure. When a heading is referenced, youcan use this index to locate the page number.
A
Accessing BI, 74
Activities by Period Details, 93
Activities by Period Summary, 92
Activities Trend by Department, 94
Add a Column to a Dashboard, 11
Add a New Page to a Dashboard, 8
Answers Web Catalog, 3
B
BI Delivers, 38
BI Publisher, 37
Briefing Books, 84
Business Intelligence Publisher Engine, 71
C
Changing Your Password, 75
Common Terms, 6
Create New IBot, 48
D
Dashboard Properties, 12
Dashboards, 5
Data Warehouse Overview, 1
Demography, 87
Disconnect Analytics, 70
Download Data, 80
Download to Excel, 80
Download Web Page (MHTML), 81
Downloading Results from Answers, 80
Drill Down (Interactive), 83
EEdit a Dashboard, 7
Edit My Account, 66
Emailing a Dashboard or Saved Request, 79
Employment Change, 91
Exiting from BI, 77
Exporting, 4
G
Getting Started, 74
Grade Distribution, 88
HHeadcount Distribution, 89
Headcount Trend by Department, 90
IInteractive Dashboards, 6
KKeyboard Shortcuts, 35
L
Links, 82

Title 1, Chapter 17EmpowHR Version 9.0
Index − 2
MManage Catalog, 39
Marketing, 69
Minority Report, 95
My Dashboard, 37
NNavigate to a Dashboard Page, 35
Navigating in BI (Data Warehouse), 81
Navigating in BI Interactive Dashboards, 6
PPage Options, 33
Pages, 83
PDF and Print Control, 28
Performing Common Tasks, 78
Preferences, 84
Printing a Dashboard or Saved Request, 79
RRefreshing a BI Interactive Dashboard or BI
Request, 81
Refreshing an Inactive Dashboard or Request, 81
Refreshing Information in the BI Selection Pane, 81
Reports, 72
SSecurity, 2
Show iBots Acting on My Behalf, 69
Sorting, 84
T
Tabs, 87
To create an iBot with no schedule, 51
To refresh information in the selection pane, 81
To save an iBot in a new folder that you create, 63
To start the iBot now, 52
U
Using the Save iBot Dialog Box to organize iBots, 63
V
View a Dashboard, 35
Viewing a Descriptions on a Dashboard, 78
Viewing a Saved Request, 78