empty homes in england · 4 empty homes in england introduction at empty homes we are following up...
TRANSCRIPT

Empty Homes in England 1
EmptyHomes inEngland

Empty Homes in England2
This report was produced by Empty Homes,with tables, charts, maps and advice provided by Cobweb Consulting.
Production: Fiona Shand
© Empty Homes 2016First published by Empty Homes 2016
Empty Homes registered office70 Cowcross StreetLondon EC1M 6EJTel: +44 (0)20 31350674Email: [email protected]: www.emptyhomes.comCommunity Benefit Society number 27697R
All rights reserved. Reproduction of this report by photocopying or electronic means for non-commercial purposes is permitted. Otherwise, no part of this report may be reproduced, adapted, stored in a retrieval system or transmitted by any means, electronic, mechanical, photocopying, or otherwise without the prior written permission of Empty Homes.
Empty Homes – the national campaigning charity aims in England to:
• Raise awareness of the waste of long-term empty homes.
• Research, develop and work with others to test ideas for bringing long-term empty homes back into use for those in housing need.
• Provide encouragement and advice for those seeking to bring empty homes back into use, or concerned about empty homes.
• Campaign for changes to policy and initiatives at national and local levels that will enable more action to bring empty homes back into use for those in housing need.
For more information on the work of Empty Homes-the national campaigning charity visit: www.emptyhomes.com

Empty Homes in England 3
Contents
Introduction 4
The geography of empty properties 6
Do the official statistics give us the full picture? 18
Reasons homes remain empty over the longer term 21
What works in tackling empty homes? 27
Recommendations 30
Appendices 32
Empty Homes in England4
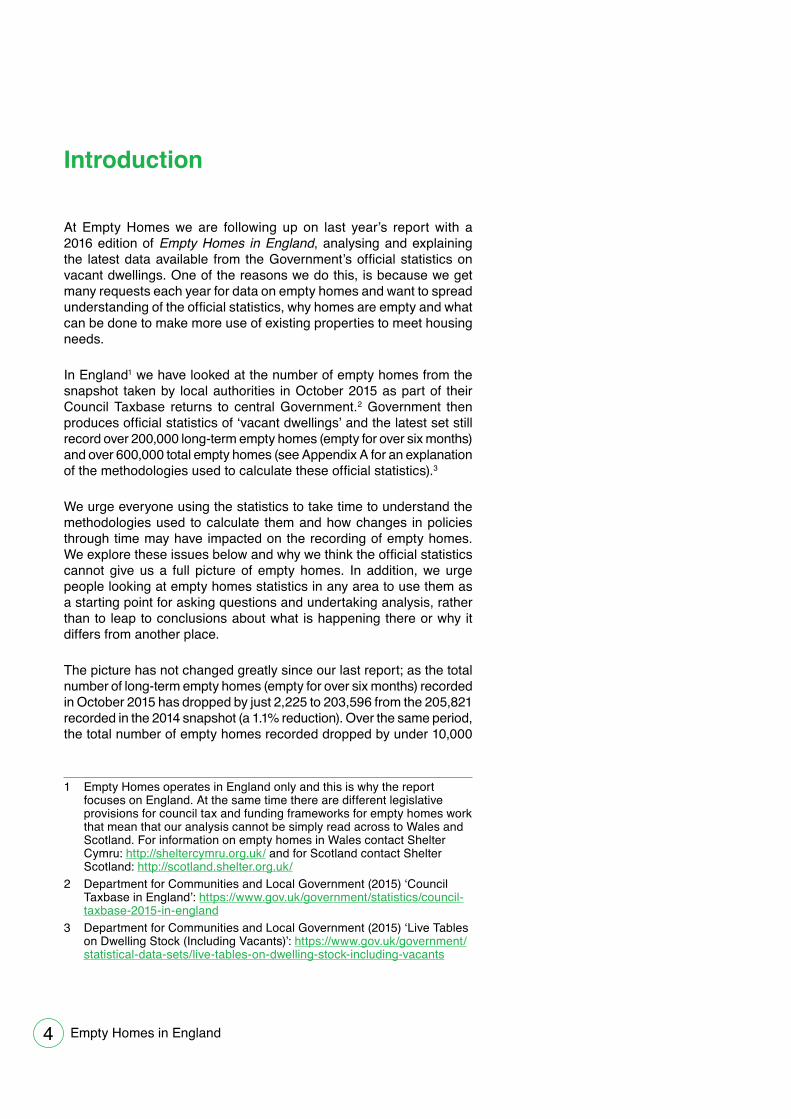
Introduction
At Empty Homes we are following up on last year’s report with a 2016 edition of Empty Homes in England, analysing and explaining the latest data available from the Government’s official statistics on vacant dwellings. One of the reasons we do this, is because we get many requests each year for data on empty homes and want to spread understanding of the official statistics, why homes are empty and what can be done to make more use of existing properties to meet housing needs.
In England1 we have looked at the number of empty homes from the snapshot taken by local authorities in October 2015 as part of their Council Taxbase returns to central Government.2 Government then produces official statistics of ‘vacant dwellings’ and the latest set still record over 200,000 long-term empty homes (empty for over six months) and over 600,000 total empty homes (see Appendix A for an explanation of the methodologies used to calculate these official statistics).3
We urge everyone using the statistics to take time to understand the methodologies used to calculate them and how changes in policies through time may have impacted on the recording of empty homes. We explore these issues below and why we think the official statistics cannot give us a full picture of empty homes. In addition, we urge people looking at empty homes statistics in any area to use them as a starting point for asking questions and undertaking analysis, rather than to leap to conclusions about what is happening there or why it differs from another place.
The picture has not changed greatly since our last report; as the total number of long-term empty homes (empty for over six months) recorded in October 2015 has dropped by just 2,225 to 203,596 from the 205,821 recorded in the 2014 snapshot (a 1.1% reduction). Over the same period, the total number of empty homes recorded dropped by under 10,000
1 Empty Homes operates in England only and this is why the report focuses on England. At the same time there are different legislative provisions for council tax and funding frameworks for empty homes work that mean that our analysis cannot be simply read across to Wales and Scotland. For information on empty homes in Wales contact Shelter Cymru: http://sheltercymru.org.uk/ and for Scotland contact Shelter Scotland: http://scotland.shelter.org.uk/
2 Department for Communities and Local Government (2015) ‘Council Taxbase in England’: https://www.gov.uk/government/statistics/council-taxbase-2015-in-england
3 Department for Communities and Local Government (2015) ‘Live Tables on Dwelling Stock (Including Vacants)’: https://www.gov.uk/government/statistical-data-sets/live-tables-on-dwelling-stock-including-vacants

Empty Homes in England 5
from 610,123 to 600,179. Having said that, the downward trend apparent since 2008 can still be seen in the Government data on recorded vacant dwellings. This has led the Government to declare that ‘the number of empty homes is now at its lowest level since records began’.4
We do not pretend that all empty homes are problematic. Some properties will be on the market for sale or renting or awaiting the new owner or tenant to move in. However, if a property has not become re-occupied within six months it is worth looking at what is happening – is it nearing being lived in again, or is it stuck empty for some reason?
Though there are common reasons why properties remain empty across England, there are local authority areas where higher levels of homes are recorded as long-term empty than the average for England as a whole. Comprehensive data is only available at a local authority level, but we know that there are neighbourhoods with particularly high levels of empty homes. In some places this may be linked to the standard of housing on offer and other quality of life considerations. We think tackling empty homes in these areas should be part of initiatives that start from the perspective of the issues people face there; these include pockets of poor standards of management in the private rented sector and poor street environments. Addressing these wider neighbourhood issues can not only bring about immediate improvements, but also ensure that fewer homes are left empty in the future, as more people put down roots and choose to stay in an area for longer. We think action in those areas to improve the housing standards for existing residents and to renovate empty properties should be seen as part of a rounded approach to addressing England’s housing crisis and delivering true opportunity and greater equality across the country.
At the same time, we think creating new homes from the empty properties that can be found across all parts of England has a valuable role to play in meeting housing needs in an environmentally sustainable way. Analysis suggests that England needs about 240,000 to 245,000 additional homes each year to meet newly arising demand, and that nearly one-third of those homes need to be at below market prices and rents.5 We think more could be done to generate additional housing supply through homes that have been empty over the long term, but at the same time, we recognise that to meet housing needs more homes must be built too. Both should go hand-in-hand to address housing needs.
4 Department for Communities and Local Government (2016) ‘Empty Homes Reach All Time Low (Press Release)’: https://www.gov.uk/government/news/empty-homes-reach-all-time-low
5 Holmans, A. (2013) ‘Town and Country Planning Tomorrow Series Paper 16 new estimates of housing demand and need in England, 2011 to 2031’, Town and Crown Planning Association (TCPA) and Alan Holmans/Cambridge Centre for Housing and Planning Research: http://www.tcpa.org.uk/data/files/HousingDemandNeed_TCPA2013.pdf

Empty Homes in England6
The geography of empty properties
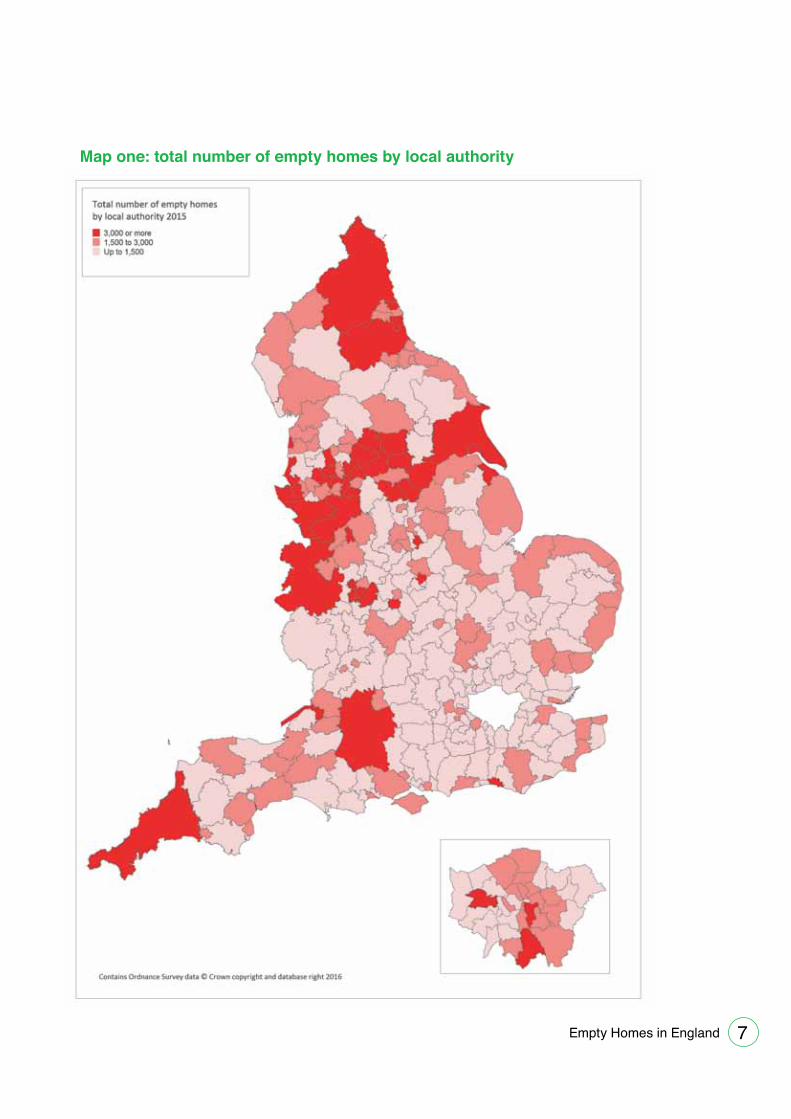
Where are the highest numbers of total empty homes and the highest proportions of dwellings empty?Mapping the official statistics of the total number of empty homes recorded by local authorities provides an insight into where there are the highest number of empty homes across England (see Map one).
It is important to recognise that some of the areas with the largest numbers of total empty homes do not have the highest proportions of their housing stock empty; these are local authorities with a larger number of dwellings, including large metropolitan areas or unitary authorities, which came about through the merger of a number of councils. For this reason, we took the official statistics on the total number of empty homes recorded in each local authority area and calculated the percentage of dwellings empty in that area. (See Appendix B for an explanation of the methodology used.)
Mapping the results shows that local authorities with the highest proportion of dwellings recorded empty are more likely to be found in the North of England (see Map two). Local authorities with the lowest proportions of homes recorded empty tend to be in more southerly locations. However, not all local authorities in southerly locations fall into the category of those with the lowest proportions of their homes empty.
Empty Homes in England 7
Map one: total number of empty homes by local authority

Empty Homes in England8
Map two: percentage of homes empty by local authority
%
Empty Homes in England 9
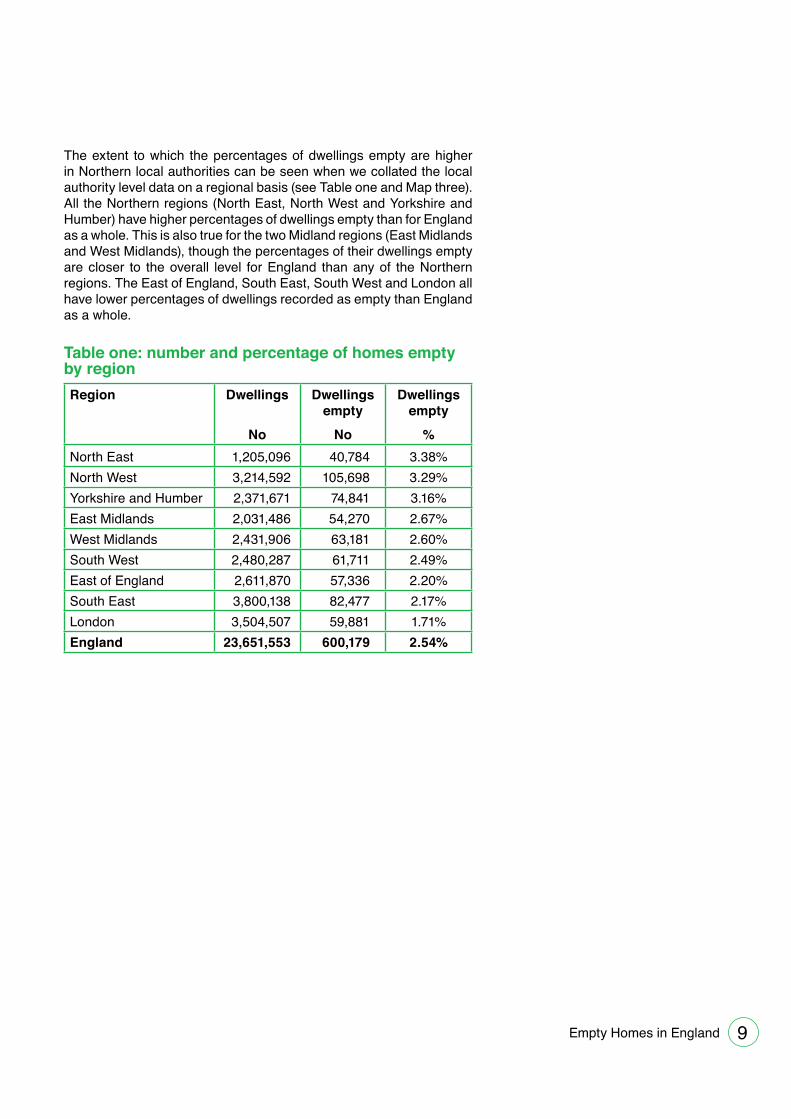
The extent to which the percentages of dwellings empty are higher in Northern local authorities can be seen when we collated the local authority level data on a regional basis (see Table one and Map three). All the Northern regions (North East, North West and Yorkshire and Humber) have higher percentages of dwellings empty than for England as a whole. This is also true for the two Midland regions (East Midlands and West Midlands), though the percentages of their dwellings empty are closer to the overall level for England than any of the Northern regions. The East of England, South East, South West and London all have lower percentages of dwellings recorded as empty than England as a whole.
Table one: number and percentage of homes empty by regionRegion Dwellings
No
Dwellings empty
No
Dwellings empty
%North East 1,205,096 40,784 3.38%North West 3,214,592 105,698 3.29%Yorkshire and Humber 2,371,671 74,841 3.16%East Midlands 2,031,486 54,270 2.67%West Midlands 2,431,906 63,181 2.60%South West 2,480,287 61,711 2.49%East of England 2,611,870 57,336 2.20%South East 3,800,138 82,477 2.17%London 3,504,507 59,881 1.71%England 23,651,553 600,179 2.54%

Empty Homes in England10
Map three: percentage of homes empty by region

Empty Homes in England 11
It is worth noting that regional averages mask larger variations across individual local authorities within each region.
For local authority level data of the total number of empty homes, please go to the official Government statistics from the Department for Communities and Local Government (2015) ‘Live Tables on Dwelling Stock (Including Vacants)’ which can be found at: https://www.gov.uk/government/statistical-data-sets/live-tables-on-dwelling-stock-including-vacants and go to Table 615.
We urge people when drawing on the local authority level statistics to take care to understand the methodology used to produce them (see Appendix A and the notes that accompany the official statistics when using the link above). It is also important not to leap to conclusions about what is happening in any one local authority area, or why the level of empty homes differs from another area. It is best to use the data as a starting point for asking questions and undertaking analysis.
It is also worth bearing in mind that some of the properties counted in the snapshot for the official statistics in October 2015 will have been brought back into use by now. While other dwellings occupied in October 2015 will have become vacant since then. The number of empty homes at any point in time shows a balance between these two flows. Population turnover, as well as how quickly properties are sold or let, are factors which explain differences between areas in the total number of empty homes.
Differences in the total number of vacant dwellings may also be partly accounted for by the extent to which an area has a backlog of long-term empty properties that are not being brought back into use. There is a fairly high degree of overlap between local authorities that have the highest percentages of homes empty, and those which have the highest percentages of dwellings long-term empty. We now turn to look at the issue of long-term empty homes.
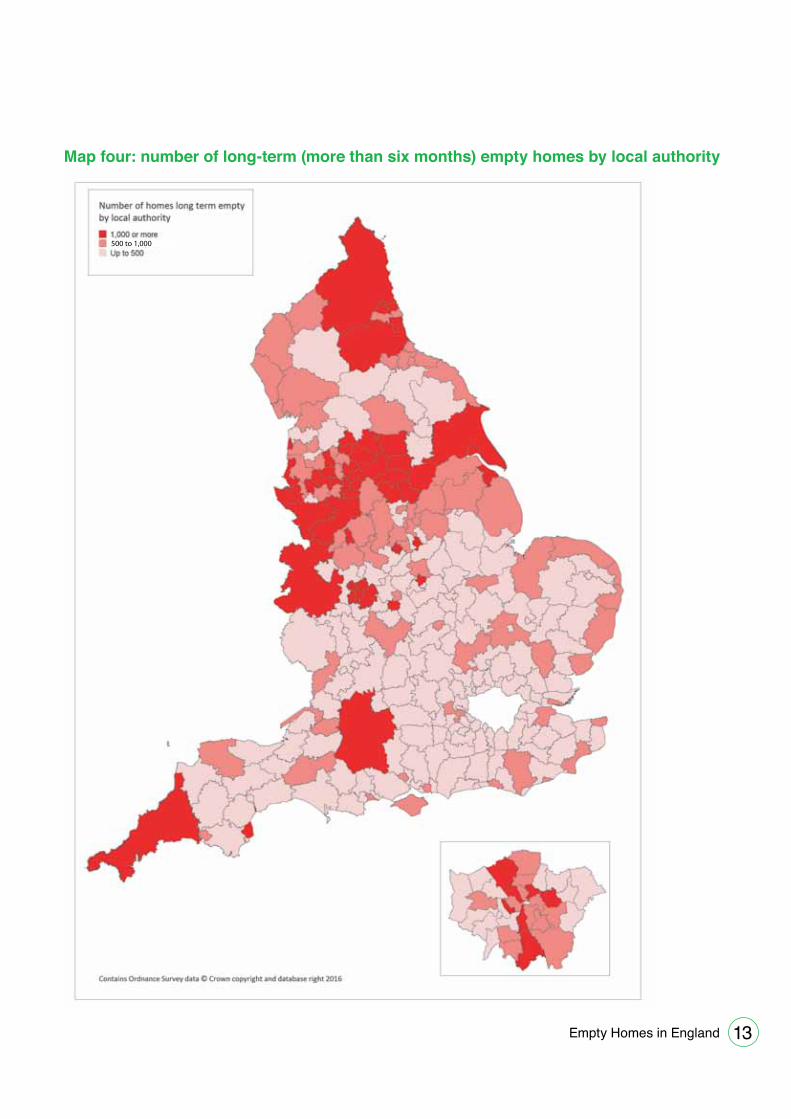
Where are the highest numbers of long-term empty homes and the highest proportions of dwellings empty for over six months?Mapping the official statistics of the number of long-term empty homes by local authority, provides an insight into where there are the highest number of homes empty for over six months (see Map four).
It is again important to recognise that some areas with the largest numbers of long-term empty homes do not have the highest proportions of their housing stock empty, as they are local authorities with a larger number of dwellings, some of which are unitary authorities formed by the merger of a number of councils. So we took the official statistics on the number of long-term empty homes in each local authority area and

Empty Homes in England12
calculated the percentage of dwellings empty in that area for over six months. (See Appendix C for an explanation of the methodology used).
Mapping the results shows that local authorities with a higher proportion of dwellings recorded empty for more than six months are often in more northerly local authority areas, but there are some noticeable exceptions in southern locations (see Map five).
Empty Homes in England 13
Map four: number of long-term (more than six months) empty homes by local authority
500 to 1,000

Empty Homes in England14
Map five: percentage of homes long-term empty by local authority
Percentage of homes long-term empty by local authority 2015

Empty Homes in England 15
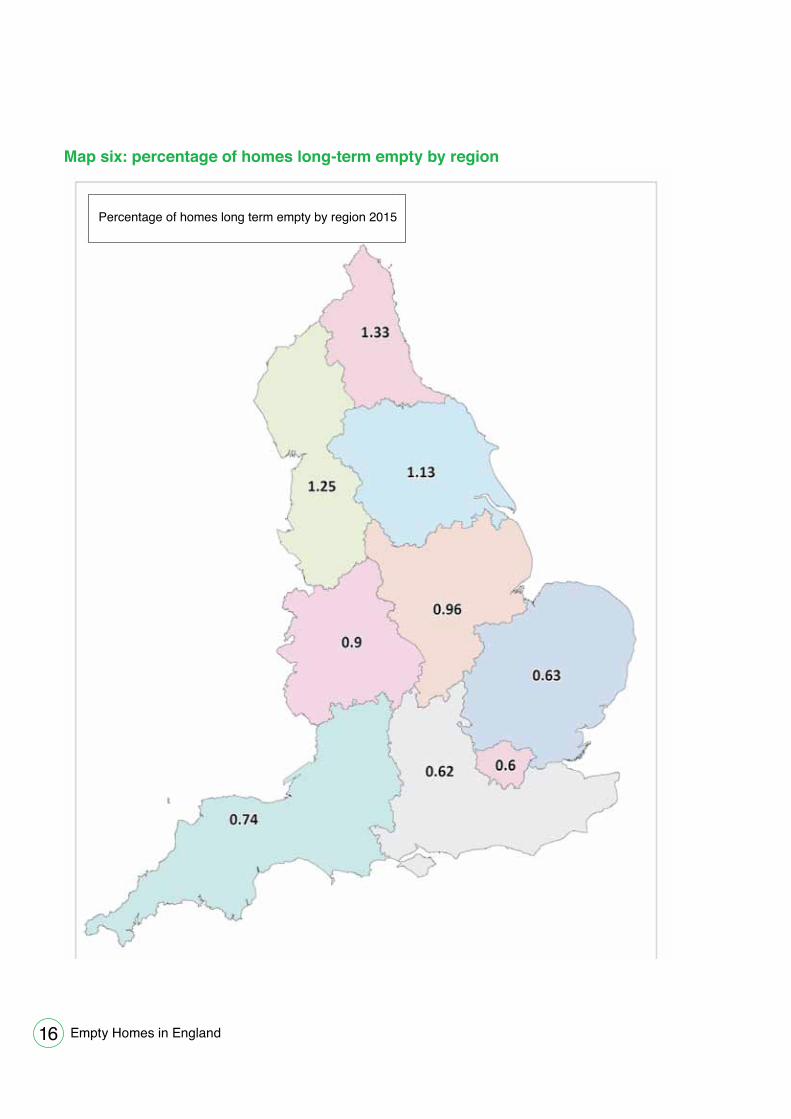
The extent to which the percentages of long-term empty dwellings are higher in the North can be seen when we collated the local authority level data on a regional basis (see Table two and Map six). All the Northern regions (North East, North West and Yorkshire and Humber) have higher percentages of dwellings recorded as long-term empty than the average for England as a whole. This is also true for the two Midland regions (East Midlands and West Midlands), although the percentage of their dwellings recorded as long-term empty is closer to the overall level for England than any of the Northern regions. The East of England, the South East, South West and London all have lower percentages of dwellings recorded as long-term empty than England as a whole.
Table two: number and percentage of homes long-term (more than six months) empty by region
Region Dwellings
No
Dwellings long-term
emptyNo
Dwellings long-term
empty%
North East 1,205,096 16,030 1.33%North West 3,214,592 40,287 1.25%Yorkshire and Humber 2,371,671 26,750 1.13%East Midlands 2,031,486 19,495 0.96%West Midlands 2,431,906 21,775 0.90%South West 2,480,287 18,273 0.74%East of England 2,611,870 16,471 0.63%South East 3,800,138 23,600 0.62%London 3,504,507 20,915 0.60%England 23,651,553 203,596 0.86%
Empty Homes in England16
Map six: percentage of homes long-term empty by region
Percentage of homes long term empty by region 2015
Empty Homes in England 17
It is worth noting that regional averages mask some larger variations across individual local authorities within each region.
For local authority level data of the total number of long-term empty homes, please go to the official Government statistics from the Department for Communities and Local Government (2015) ‘Live Tables on Dwelling Stock (Including Vacants)’ which can be found at: https://www.gov.uk/government/statistical-data-sets/live-tables-on-dwelling-stock-including-vacants and go to Table 615.
Again, care should be taken when drawing on the local authority level statistics to understand the methodology used to produce them (see Appendix A and the notes that accompany the official statistics when you follow the link above). It is important not to leap to conclusions about what is happening in any one local authority area, or why the level of empty homes differs to another area. It is best to use the data as a starting point for asking questions and looking at what more could be done to ensure that homes do not remain empty over the long-term, but are brought back into use to meet housing needs.

Empty Homes in England18
Do the official statistics give us the full picture?
The official statistics on vacant dwellings are drawn from council tax data and the primary purpose of that data is not to count empty homes. There are limitations in what the data records and can tell us.
Derelict properties not classed as dwellings for council tax purposesThe council tax data does not include empty homes that have been removed from the council tax valuation list because they are in such a state of dereliction that, even with a reasonable amount of repairs, no one could be expected to live there. In effect, such properties are not classed as dwellings for council tax purposes and so are not counted in the official vacant dwelling figures.6
Nonetheless, derelict properties are often of particular concern to local people as their poor physical state may have a direct detrimental impact on nearby properties and the neighbourhood. Derelict properties often stand out as eyesores and symbolise waste in the face of so many people being priced out of decent housing across England. Many derelict properties can be, and are being, brought back into use. For all these reasons it is important that strategies to tackle empty homes are broad-based and not just focused on properties that are recorded and counted as empty in the official statistics.
Undercounting if the local authority does not know/is not told a property is emptyIn addition, the official statistics are probably an undercount of the number of empty homes, as they are dependent on local authorities knowing whether or not individual dwellings are vacant. It would seem probable that local authorities are more likely to receive information from outgoing occupants, such as former tenants, where people are keen to let them know that they are no longer liable for council tax payments. At the same time, people may be less inclined to let their local authority know that the property is vacant if they are still liable to pay council tax, for example because they remain the owner of the empty dwelling.
People have probably been less inclined to inform their local authority that their property is empty since April 2013, with the end of the
6 The Valuation Office Agency, council tax manual provides guidance on what its listing officers will consider before agreeing to remove a dwelling from the valuation list: www.gov.uk/government/publications/council-tax-manual
Empty Homes in England 19
automatic council tax exemptions. This applied where a home was unoccupied and substantially unfurnished for up to six months, or for up to 12 months if the property was undergoing major repair works or structural alterations. Although councils can, since April 2013, decide to offer discounts of between 0% and 100% in these circumstances. Offering discounts may well encourage owners to tell the council that a property is empty.
In addition, since April 2013, authorities have been allowed to charge up to a 50% premium on the council tax if a dwelling has been empty for two years or more. As of October 2015, 262/326 of council tax charging local authorities do apply this premium to some empty dwellings.7 It is possible that this policy has also had an impact on the willingness of people to tell their council that their property is empty. Nonetheless, as of the snapshot in October 2015, councils were charging 58,756 dwellings this premium across England.8 Though of course that figure does not include all homes that were empty at the point in time for two or more years because it does not count those in local authority areas that have not adopted a policy of charging the premium.
Overall, from talking to local authorities, we think these changes are likely to have impacted negatively on the reporting and recording of empty homes since 2013. We also think there is a case for further research into the impact of adopting different local policies on the reporting of empty homes between different local authorities.
Exemptions from council taxThere are still incentives for people to inform the council that a property is empty. There are still a number of short-term exemptions from paying council tax; for example, in the event of the death of a person liable for council tax there is an exemption until probate is granted (the right to deal with an estate after someone has died), and a further exemption for up to six months from the grant of probate. There are also indefinite exemptions in some circumstances, for example if the former resident is detained, or is in hospital or a care home.
It should be noted that the official long-term vacant dwellings figures do not include dwellings where there is an exemption from paying council tax (see Appendix A for an explanation of the methodology used). So, for example, they do not include student accommodation, dwellings held for ministers of religion, armed forces accommodation, or properties held in the possession of a mortgage lender or trustee in a bankruptcy.
7 Department for Communities and Local Government (2015) ‘Local Authority Council Tax Base In England 2015’: https://www.gov.uk/government/uploads/system/uploads/attachment_data/file/478366/Local_Authority_Council_Tax_base_England_2015_Statistical_Release.pdf
8 Ibid

Empty Homes in England20
Data on the number of long-term empty homes that are exempt from council tax (and therefore not included in the official statistics) cannot be derived from the Council Taxbase data.
Local authority verification exercisesHaving said all that, local authorities do carry out verification exercises before submitting their Council Taxbase data to ensure that they have current information on whether individual dwellings are occupied or not. Local authorities also investigate reports of empty properties, and will subsequently update their council tax records. Moreover, reports of empty homes can be the starting point for the local authority taking action to ensure long-term empty homes are brought back into use. The staff who are involved in this work also tell us that they use the council tax data as their starting point for investigations. The sharing of information across empty homes and council tax teams can lead to more effective empty homes strategies and more up-to-date council tax data.
Under-utilised properties that do not count as vacant for council tax purposesAs we noted last year, there is also an issue that many properties that neighbours consider empty are not recorded in the official vacant dwelling statistics as they do not count as empty for council tax purposes. For example, this could be because they are furnished and occupied for some weeks a year, or occasionally at weekends, or during some working weeks. Some, but not all of these properties, may be classified as second homes for council tax purposes. These properties could be said to be under-utilised and it is understandable that people perceive them to be empty. This may lead to questions being asked about whether best use is being made of England’s homes and for whom new developments are being built.
Using the statistics as a starting pointWhile it is important to recognise the limitations of the official statistics, they are nonetheless a good starting point for people to ask what is happening in their area. They also enable us to look at where there appear to be relatively higher levels of empty homes, which is helpful when exploring what needs to happen to bring empty homes back into use.
Moreover, even if there are only around 200,000 long-term empty homes as recorded by the official statistics, we consider that we cannot rest until the number is brought down further. It is necessary that the country makes the most of its existing housing assets in order to meet housing needs and to address the blight of empty homes on local areas.
We do not pretend that all empty homes are problematic. Some properties will be on the market for sale or renting or awaiting the new owner or tenant to move in. However, if a property has not become re-occupied within six months it is worth looking at what is happening – is it nearing being lived in again, or is it stuck empty for some reason?

Empty Homes in England 21
Reasons homes remain empty over the longer term
Common reasons homes are empty across EnglandThe Council Taxbase data does not give us the reasons that properties are long-term empty, but from discussions with local authorities and property owners across England, we have come to understand some common reasons:
• Someone has inherited a property (perhaps jointly with other people) and is taking a long time to decide what is best to do with the property.
• A landlord previously rented out a property and it needs a lot of repair work before it can be let again; and the landlord is undecided about what to do, or putting off the work, sometimes related to time and/or money constraints.
• People or companies have bought properties to redevelop and, for a variety of reasons, including the pressure of other commitments and/or financial constraints, are taking a long time to complete the works or they have stalled.
• People are holding a property empty hoping for a rise in its market value and a corresponding capital gain before seeking to sell it. Added to which, some people have unrealistic expectations of the price their property could fetch given the local market conditions.
Reasons behind higher levels of long-term empty homes in some areasWhile there may be common reasons as to why properties remain empty across England, the official statistics indicate that there are relatively higher levels of long-term empty homes in some local authority areas. This suggests that there are also other factors at play. We know from our visits and examining local studies that there are particular concentrations of long-term empty homes in some neighbourhoods. We also know from talking to organisations working in those areas that those neighbourhoods often have one or more of the following, often interlinked, features:
• An historical decline in the population (even if it has since stabilised or even grown), often related to the decline of employment in traditional industries.
• Relatively low house prices compared to the rest of the area, region or England as a whole.
• Continued high population turnover, often linked to the poor quality
Empty Homes in England22
of housing available in the area and a perceived better quality of life and opportunities in other neighbourhoods.
• High levels of crime and antisocial behaviour with poor street environments that have a detrimental impact on existing residents and deter other people from moving into the neighbourhood, or staying for the longer term.
• Concentrations of private rented sector accommodation that would not meet the Decent Homes Standard and are poorly managed. Such properties can come to be seen as housing of a last resort for people who cannot access better options via the market or social landlords.
• A number of neglectful absentee property owners, some of whom bought properties during past regeneration initiatives (such as the Housing Market Renewal Pathfinders); and have held on to them in the hope of capital gains from property price rises that they are yet to have realised.
• A number of property owners who cannot fund or raise the finance required to refurbish their empty properties. This could be because of their credit history, or because the property’s sale value or likely rent yield is deemed too low relative to the finance required.
• Some properties that have been empty for a considerable number of years and have fallen into such disrepair that they require significant amounts of works before they can be occupied again.
This year we are conducting a survey of some local authorities with the highest levels of homes reported to be long-term empty to look in more detail at the characteristics of those areas and why more homes there are empty and remaining so over the long-term. We also intend to look at the action of local authorities, housing providers and community-led organisations in those areas to understand what is happening since the ending of Government-funded dedicated empty homes programmes in March 2015. We want to explore what is needed to spread ‘what works’ to more areas and to help more communities achieve longer lasting improvements to their housing and neighbourhoods. We intend to use the information collected to make further recommendations about how central government, local authorities and others could do more to support communities to address the issues they face.
Buy-to-leaveIn other areas, particularly where the housing market is very buoyant with rising property prices, the level of empty homes may be linked to buy-to-leave. There is some evidence that people are purchasing, primarily new-build, properties not to be used as homes, but both as a safe store of value and in anticipation of a high capital gain when the properties are sold. Some of these properties may be counted as empty homes for council tax purposes. But, as we explored above,
Empty Homes in England 23
some of these properties may be being used for part of the year for leisure, shopping or business trips, and therefore they are not counted as vacant in the official statistics. Some, but not all, of those properties may be recorded as second homes for council tax purposes.
The official vacant dwelling statistics do not show whether homes are being left empty for investment purposes. We believe that research studies based at a local level are a good way to help in understanding the extent to which buy-to-leave is happening; for example in specific new-build developments. This can be seen in the work of the London Borough of Islington, Royal Borough of Kensington and Chelsea and Westminster City Council, as well as from media investigations.9, 10, 11, 12
Relationship between empty homes and house pricesIn some areas, there are strong financial incentives for property owners to bring empty homes back into use, given the high return from either selling or renting them. For the same reason, it is also easier in some places for property owners to raise the finance needed to do repair and improvement works.
However, there is evidence, as outlined above, which suggests that in some high value areas empty homes may have been purchased as buy-to-leave properties – i.e. not to live in or rent out, but primarily for capital investment. If this is the case, then the level of empty properties could be linked to house prices, with relatively high levels in high and rising house price areas.
In order to better understand this relationship, we have analysed the official statistics on long-term vacant dwellings with data on council tax bands A to H; these have also been used in other studies as a proxy for house price values. Although council tax bands are based on property valuations on 1st April 1991, not their current value, in relative terms most properties are likely to have remained in the same band: dwellings initially placed in the bottom band A are likely to have remained relatively
9 Islington Council (2015) ‘Preventing Wasted Housing Supply: Supplementary Planning Document (July 2015)’: http://www.islington.gov.uk/publicrecords/library/Planning-and-building-control/Publicity/Public-consultation/2015-2016/(2015-09-21)-Preventing-Wasted-Housing-Supply-SPD-(adopted-July-2015).pdf
10 Royal Borough of Kensington and Chelsea (2015) ‘Report into Buy to Leave in the Royal Borough of Kensington and Chelsea’: https:/goo.gl/w18RYk
11 City of Westminster (2014) ‘The Prime Residential Market in Westminster’: http://transact.westminster.gov.uk/docstores/publications_store/news/prime_residential_research_report_140722.pdf
12 Booth, R. and Bengtsson, H. (2016) ‘The London skyscraper that is a stark symbol of the housing crisis’, The Guardian: http://www.theguardian.com/society/2016/may/24/revealed-foreign-buyers-own-two-thirds-of-tower-st-george-wharf-london

Empty Homes in England24
low in value, with those in the top band H remaining relatively high. In addition, relatively highly priced new build properties will be placed in an appropriate higher council tax band.
Our analysis is based on showing long-term empty homes as a percentage of chargeable dwellings for each of the eight council bands A to H (see Table three). This gives a total mean average of 0.88%, although two bands – bottom A and top H – are significantly higher (1.54% and 1.56% respectively). Excluding these two bands, the pattern is considerable more consistent for the other six bands B to G, with a mean average of 0.64%. This suggests that the factors affecting the level of long-term empty homes relative to dwellings in bottom band A and top H, regardless of the absolute numbers, are different in type and/or importance compared with the other bands. In particular, the higher percentage level in the lowest value properties is likely to relate to the housing market and neighbourhood conditions which we explored above. For the highest value properties, as outlined above, buy-to-leave could be a factor.
We intend to look more closely at these issues, and would encourage further local analysis of this relationship between the percentage level of long-term empty homes and council tax bands. This could help to inform empty homes strategies.
Table three: number and percentage of long-term empty homes by council tax bandCouncil tax band
Chargeable dwellings
No
Long-termempty homes
No
Chargeable dwellings long-term empty
%A 5,630,908 86,782 1.54B 4,535,699 38,718 0.85C 5,049,417 31,515 0.62D 3,576,206 20,009 0.56E 2,207,062 11,895 0.54F 1,169,282 6,754 0.58G 817,350 5,829 0.71H 134,401 2,094 1.56Total No 23,120,325 203,596Mean % 0.88
Former Housing Market Renewal (HMR) Pathfinder areasIn 2002, the Labour Government established the HMR Pathfinder programme. It was a multi-million pound programme which sought to tackle the problems ‘of neighbourhoods with acute low housing demand
Empty Homes in England 25
in the North of England and the Midlands. In such neighbourhoods the high concentrations of properties difficult to let or sell, the loss of population and the inability to attract new households had created a vicious circle of neighbourhood decline and deprivation’.13
In April 2002 the then Labour Government announced nine HMR Pathfinder areas:
1 Birmingham/Sandwell.
2 East Lancashire.
3 Hull and East Riding.
4 Manchester/Salford.
5 Merseyside.
6 Newcastle/Gateshead.
7 North Staffordshire.
8 Oldham/Rochdale.
9 South Yorkshire.
In addition, Tees Valley operated as a HMR Pathfinder after 2005, bringing the list to ten.
These ten HMR Pathfinder areas covered 30 local authority areas. (See Appendix E for a list of local authorities that had all or part of their area within a HMR pathfinder area). It should be noted that the HMR Pathfinder areas did not neatly match local authority boundaries. For example, only parts of Manchester and Liverpool were covered. Our analysis of empty homes, however, relies on the official statistics available at the whole local authority level. Nonetheless, it is clear that in 2015 there were still significant levels of long-term empty homes within some authorities where HMR pathfinders operated. Eleven of the 30 local authorities with the highest proportions of homes long-term empty in England are among the authorities in which HMR Pathfinders operated. (See Appendix F for an explanation of the methodology used).
The HMR Pathfinders programme continued until the Coalition Government ended funding for what had come to be seen as a controversial programme.
Cluster areasThe Coalition Government established the Clusters of Empty Homes Fund (Clusters funding) which made £50 million available over two years
13 National Audit Office (20017) ‘Department for Communities and Local Government: Housing Market Renewal’: https://www.nao.org.uk/wp-content/uploads/2007/11/070820.pdf

Empty Homes in England26
(2012-13 and 2013-14).14 This funding was available to local authority areas bringing a minimum of 100 homes back into use, within distinct neighbourhoods where over 10% of homes were empty and each cluster represents more than 25 empty homes.15
There is no national level data on where these concentrations of empty homes are within local authority areas. This is because national statistics are only available on a local authority-wide basis. We have listed the local authorities that were allocated funding under the Clusters programme (see Appendix G for the list), which shows that there were high concentrations of empty homes within those areas. However, there are likely to have been other areas eligible for funding on the basis of having 10% of homes empty in one or more neighbourhood that may not have bid, or may not have been successful in bidding.
It is also clear that in 2015 there were still significant levels of long-term empty homes within some local authorities where there were clusters of empty homes at the time the Clusters funding was allocated. Eleven of the 30 local authorities with the highest proportions of homes long-term empty in England are among the authorities which attracted Clusters funding. (See Appendix H for an explanation of the methodology used). On the other hand, there are some places which attracted Clusters funding that are outside the local authorities with the highest proportions of homes long-term empty. This shows the importance of local studies looking at neighbourhood level data and strategies that recognise for some local authority areas empty homes are concentrated in particular neighbourhoods.
It is also important that empty homes funding streams recognise that there are local authority areas with concentrations of empty homes. Our recommendations look at the case for dedicated programmes to support those areas that continue to have high levels, or particular concentrations, of long-term empty homes.
14 Homes and Communities Agency (2011) ‘Bringing Clusters of Empty Homes into use: Bidding Guidance’. Programme closed and document withdrawn 5 January 2016
15 Ibid

Empty Homes in England 27
What works in tackling empty homes?
Across EnglandWe explored above some of the common reasons that properties remain empty over the longer term across all parts of England. We know from our work that local authority empty homes staff/teams can be very effective in encouraging the owners of those homes to bring them back into use.
In many cases local authorities find they need to take a casework approach to liaising with individual owners to understand why their property is long-term empty and what has been holding them back from taking action. For example, is it their financial or personal circumstances that is deterring them from selling it or renting it out? Is it a bad experience they have had in renting the property in the past? Are they simply holding out for a higher sale price that might not be realistic?
Local authorities have told us that, in the majority of cases, advice and encouragement is what works in ensuring an owner brings their property back into use. We certainly see the value of having dedicated empty homes staff who can develop knowledge of the local housing market and expertise in working with owners. This is reflected in the recommendations we make.
In addition, some local authorities offer financial assistance for bringing an empty home back into use through either grants or loans. Conditions are often attached, for example, that the property must be let to a household nominated by the council.
We have also seen the valuable contribution that empty homes can make to meeting housing needs when local authorities and other housing providers seek to buy or lease such properties and refurbish them. These can then be rented at below market rates for people priced out of decent housing in the local housing market.
We would like to see more new affordable homes created from empty properties, alongside the building of new homes, to meet housing needs across England. But questions remain as to how well Government-funded programmes will support the provision of new affordable homes in empty properties with the ending of dedicated empty homes funding programmes in March 2015. We recommend that Government reinstates dedicated funding programmes for empty homes work. We also encourage local authorities and housing providers to allocate and attract funding for creating new affordable homes from empty properties.

Empty Homes in England28
Local authorities can also take enforcement action where individual property owners are not interested, or able to bring their empty property back into use. Local authorities have powers to take over the management and compulsory purchase empty properties in some circumstances. We do not suggest that such action is taken lightly, but recognise the importance of enforcement action where empty properties are a blight on the neighbourhood, or inhibiting a drive to improve an area and meet housing needs.
Areas with high levels or concentrationsIn neighbourhoods with high levels and concentrations of empty homes successful local authority-led strategies need to tackle the underlying causes of empty homes. This requires something over and above the casework approach that can be so effective elsewhere. Otherwise local action may see some properties bought back into use only for a continued high vacancy rate to be generated by a high population turnover, or reluctance of people to consider a move to the area, or to put down roots and stay for the longer-term.
Therefore, we think that tackling empty homes in these areas should be part of wider initiatives that look at the issues people face there, such as poor standards of management in the private rented sector, high levels of antisocial behaviour, and blighted street environments.
We think such strategies are more likely to be successful if they involve local residents and recognise what people think works well and less well in the area. Lasting and far-reaching improvements are more likely to be secured if local people have a genuine say in what happens. In many cases, local community-led organisations are well placed to bring empty homes back into use, alongside addressing other neighbourhood issues. As these organisations are part of the local community they are committed to making a positive difference to the area over the long term. Many community-led organisations would and could do more with greater financial capacity to extend what they do. Our recommendations look at how local authorities and central Government can help them to succeed.
We think action is needed in areas with high levels of deprivation and empty homes to improve the housing standards of existing residents, and to renovate empty properties. This should be seen as part of a rounded approach to addressing the housing crisis, and delivering true opportunity and greater equality across England. At the same time as improving the housing conditions of existing residents such an approach can stem high tenancy turnover and help keep down the number of empty homes.
In some areas, improvements to the housing and neighbourhood environment could attract more people to move there and stay for longer, so long as they could buy or rent decent properties at a price affordable

Empty Homes in England 29
to them. However, these same people would not choose to move to the area if all that was available was insecure sub-standard housing. This points to the importance of strategies that seek to diversify available housing options locally. One example is ensuring empty properties are improved for market sale, or discounted sale, to attract a range of owner-occupiers. Another example is ensuring properties are refurbished for letting by landlords who have professional standards (whether in the private sector or social sector) to attract a range of people for whom buying is not a current option, but who are nonetheless looking for affordable, decent, secure and well-maintained housing.
We have seen how community-led organisations have worked with local authorities to buy and lease long-term empty properties and refurbish them to create affordable housing. Often these organisations seek to ensure that local people get jobs and training opportunities through the refurbishment works. They are also engaged in other activities to help bring wider neighbourhood improvements. The organisations leading this work tell us that there is no shortage of people who want to move into these properties once they are refurbished, even in areas that were once labelled as ‘low demand’. We would like to see the spread of these approaches.
Such approaches not only benefit the people who get improved homes, but can also spark wider action in a neighbourhood: property owners are incentivised to invest in their properties, or people are attracted to move into the area or stay for longer. We have seen such approaches work for streets that were abandoned for many years, and where residents were surrounded by many boarded up properties. Such approaches can help ensure that neighbourhoods are pulled back from a downward spiral.
We feel that the current level of resources for tackling concentrations of empty homes falls considerably short of what is needed to create lasting changes in many areas. Without the expansion of neighbourhood improvement approaches that tackle the underlying causes of empty homes, there is a risk that people in some neighbourhoods are in effect abandoned to live in sub-standard housing in poor street environments, alongside empty and boarded up properties.
We recommend that central Government reinstates dedicated funding programmes for areas with high concentrations of empty homes to support the extension of community-led neighbourhood improvement approaches. At the same time, local authorities should look at how they can attract and allocate resources to support such work; for example from planning gain contributions, right to buy receipts and when they negotiate any devolution funding deals and programmes.
In areas where properties are being bought primarily for investment purposes to be left empty a different approach again is needed; and our recommendations address this issue.

Empty Homes in England30
Recommendations
From our understanding of the pattern of empty homes across different housing markets and what works in bringing them back into use, we make the following recommendations to see more new homes created from long-term empty properties and address neighbourhood blight.
1 Local authorities should have an empty homes strategy for their area, with aspirations to reduce the number of long-term empty homes and to attract and allocate resources to refurbish empty properties for those in housing need. Local authorities should work in partnership with property owners, housing associations and community-led organisations to realise their plan.
2 Local authorities should take a casework approach with owners of empty properties to encourage, advise and support them to bring homes back into use. Employing dedicated empty homes staff can ensure that the council is able to act on information about empty homes and build up expertise in working with owners, including taking enforcement action where necessary.
3 Central Government should re-establish dedicated grant funding programmes16 to support local authorities, housing associations and community-led organisations to create new affordable housing from long-term empty homes across England.
4 Central Government should re-establish dedicated support17 for areas with high concentrations of empty properties to support community-led neighbourhood improvement approaches which reduce the number of long-term empty properties and bring wider area improvements.
5 Local authorities should seek to support neighbourhood improvement approaches in areas with high levels of empty homes by developing strategies that involve local people, attracting and allocating funding to these areas, and supporting community-led organisations through financial support and facilitating the transfer of properties/assets.
16 Government funded dedicated empty homes grant programmes came to an end in March 2015
17 Government funding for dedicated empty homes grant programmes, including the Cluster of Empty Homes Programme came to an end in March 2015

Empty Homes in England 31
6 The Mayor of London and local authorities in high value areas, should conduct studies to understand the extent and impact of buy-to-leave and review what measures they could adopt to incentivise people to bring those properties to the market for sale or rent; and to deter people in the first place from buying properties primarily for their capital appreciation, rather than as a home to live in or rent out.
7 Central Government should look at the case for supporting additional measures to deter buy-to-leave that may require legislation at a national level.
Empty Homes in England32
Appendices
Appendix A – Methodology Government used for producing statistics on the total number of vacant dwellings and long-term vacant dwellings for 2015Total number of vacant dwellingsTo arrive at the total number of vacant dwellings for each local authority area in 201518 the Government used the Council Taxbase data returned by each council tax charging local authority.19 For each local authority area it totalled those homes that were classed, on 5th October 2015, as empty that were charged council tax, and those homes that were classed as empty and exempt from council tax in the following exemption classes:B – Unoccupied dwellings owned by a charity (up to six months)D – Unoccupied because person detained (e.g. prison)E – Unoccupied and previously the sole or main home of someone moved
into care home or hospitalF – Unoccupied because the resident is deceasedG – Unoccupied because prohibited by lawH – Unoccupied clergy dwellingsI – Unoccupied because the sole owner/tenant has moved out to receive
careJ – Unoccupied because the sole owner/tenant has moved out to give care
to anotherK – Unoccupied where the owner is a student who last lived in the dwelling
as their main homeL – Unoccupied dwelling taken into possession by a mortgage lenderQ – An unoccupied dwelling where the person who would otherwise be
liable is a trustee in bankruptcy.
The total number of vacant dwellings recorded by the official statistics for England is the sum of those calculated for each local authority.
Total number of long-term vacant dwellingsTo arrive at the number of long-term vacant dwellings for each local authority area,20 the Government used the Council Taxbase data returned
18 Department for Communities and Local Government (2016) ‘Live Tables on Dwelling Stock (Including Vacants)’: https://www.gov.uk/government/statistical-data-sets/live-tables-on-dwelling-stock-including-vacants
19 Department for Communities and Local Government (2016) ‘Council Taxbase 2015 in England’: https://www.gov.uk/government/statistics/council-taxbase-2015-in-england
20 Department for Communities and Local Government (2016) ‘Live Tables on Dwelling Stock (Including Vacants)’: https://www.gov.uk/government/statistical-data-sets/live-tables-on-dwelling-stock-including-vacants

Empty Homes in England 33
by each local authority21 showing those homes that were classed on 5th October 2015 as empty for more than six months and charged council tax, excluding those that were empty because of flooding between 1st December 2013 and 31st March 2014 and those that were empty for more than six months that were undergoing major repairs or alterations.
This is the same definition as used by Government for determining the empty homes part of the New Homes Bonus payment to each local authority which reflects year-on-year reductions in the number of long-term empty homes recorded in an area. It is also the definition commonly used by local authorities when asked to state the number of empty homes in their area.
It should be noted that this definition of long-term empty homes does not include those properties that are exempt from council tax; for example those exemption classes listed above in Appendix A (B to L plus Q). It is not possible to determine the number of long-term empty homes in these exempt classes from the Council Taxbase data.
21 Department for Communities and Local Government (2016) ‘Council Taxbase 2015 in England’: https://www.gov.uk/government/statistics/council-taxbase-2015-in-england
Empty Homes in England34
Appendix B – Methodology used to calculate the percentage of dwellings empty in an areaWe calculated the official statistics on the total number of vacant dwellings recorded in each local authority area (see Appendix A) as a percentage of dwellings in that area as per each local authority’s 2015 Council Taxbase return to Government. We took the dwelling figure to be the total number of properties on the valuation list for each local authority, less the number of demolished dwellings recorded for each area on 5th October 2015.22
This analysis was commissioned by Empty Homes from Cobweb Consulting.
22 Ibid

Empty Homes in England 35
Appendix C – Methodology used to calculate the percentage of dwellings long-term empty in an areaWe calculated the official statistics on the total number of long-term vacant dwellings recorded in each local authority area (see Appendix A) as a percentage of dwellings in that area as per each local authority’s Council Taxbase return to Government. We took the dwelling figure to be the total number of properties on the valuation list for each local authority, less the number of demolished dwellings recorded for each area on 5th October 2015.23
Given the official long-term empty homes figures do not include properties that are exempt from council tax, we could have calculated the percentage of long-term empty homes based on the number of chargeable dwellings on 5th October 2015 (after excluding demolished dwellings). However, we decided to keep the same base as used for calculating the percentage of total dwellings empty (see Appendix B) for ease of reference.
This analysis was commissioned by Empty Homes from Cobweb Consulting.
23 Ibid

Empty Homes in England36
Appendix D – Methodology used to explore the relationship between long-term empty homes and council tax bands across EnglandWe went to the original source of the Council Taxbase data24 for long-term empty homes (used to calculate the official statistics on the number of long-term vacant dwellings, see Appendix A). That data enabled us to extract the number of long-term empty homes in England by council tax bands A to H. From the same data source we extracted the number of chargeable dwellings in England by council tax bands A to H. We then calculated the percentage of chargeable dwellings long-term empty by council tax band. This is a different base than the one we used for calculating the percentage of dwellings long-term empty by local authority (see Appendix C) as we do not believe the issue of consistency that we explored in that Appendix applied. However, if we had used the same base as in Appendix C of properties on the valuation list minus the number of demolished dwellings recorded for each area on 5th October 2015, the trend would have been very similar.
This analysis was commissioned by Empty Homes from Cobweb Consulting.
24 Ibid
Empty Homes in England 37
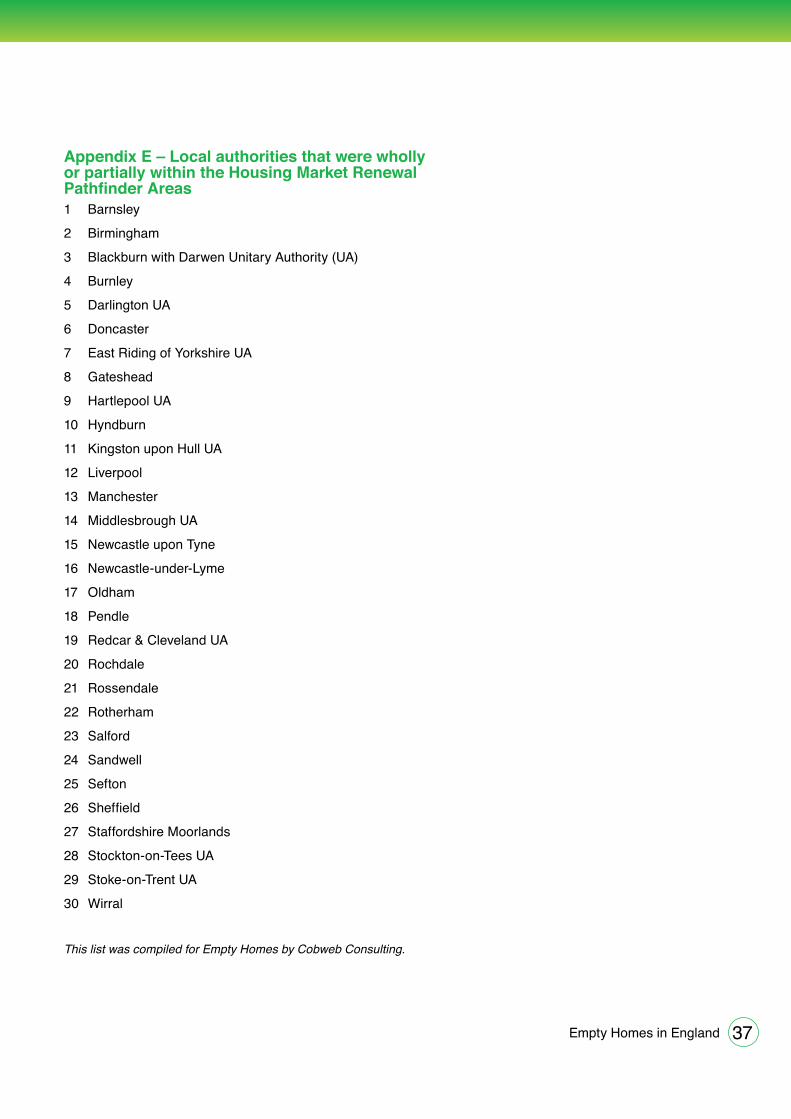
Appendix E – Local authorities that were wholly or partially within the Housing Market Renewal Pathfinder Areas1 Barnsley
2 Birmingham
3 Blackburn with Darwen Unitary Authority (UA)
4 Burnley
5 Darlington UA
6 Doncaster
7 East Riding of Yorkshire UA
8 Gateshead
9 Hartlepool UA
10 Hyndburn
11 Kingston upon Hull UA
12 Liverpool
13 Manchester
14 Middlesbrough UA
15 Newcastle upon Tyne
16 Newcastle-under-Lyme
17 Oldham
18 Pendle
19 Redcar & Cleveland UA
20 Rochdale
21 Rossendale
22 Rotherham
23 Salford
24 Sandwell
25 Sefton
26 Sheffield
27 Staffordshire Moorlands
28 Stockton-on-Tees UA
29 Stoke-on-Trent UA
30 Wirral
This list was compiled for Empty Homes by Cobweb Consulting.

Empty Homes in England38
Appendix F – Methodology used to look at the relationship between proportion of long-term empty homes at local authority level and local authorities wholly or partly within HMR Pathfinder areasWe listed local authorities in rank order of the proportion of homes long-term empty in England (in accordance with the methodology we used in Appendix C) and compared that to the list of local authorities that had been wholly or partially with HMR pathfinder areas (from Appendix E).
This analysis was commissioned by Empty Homes from Cobweb Consulting.
Empty Homes in England 39
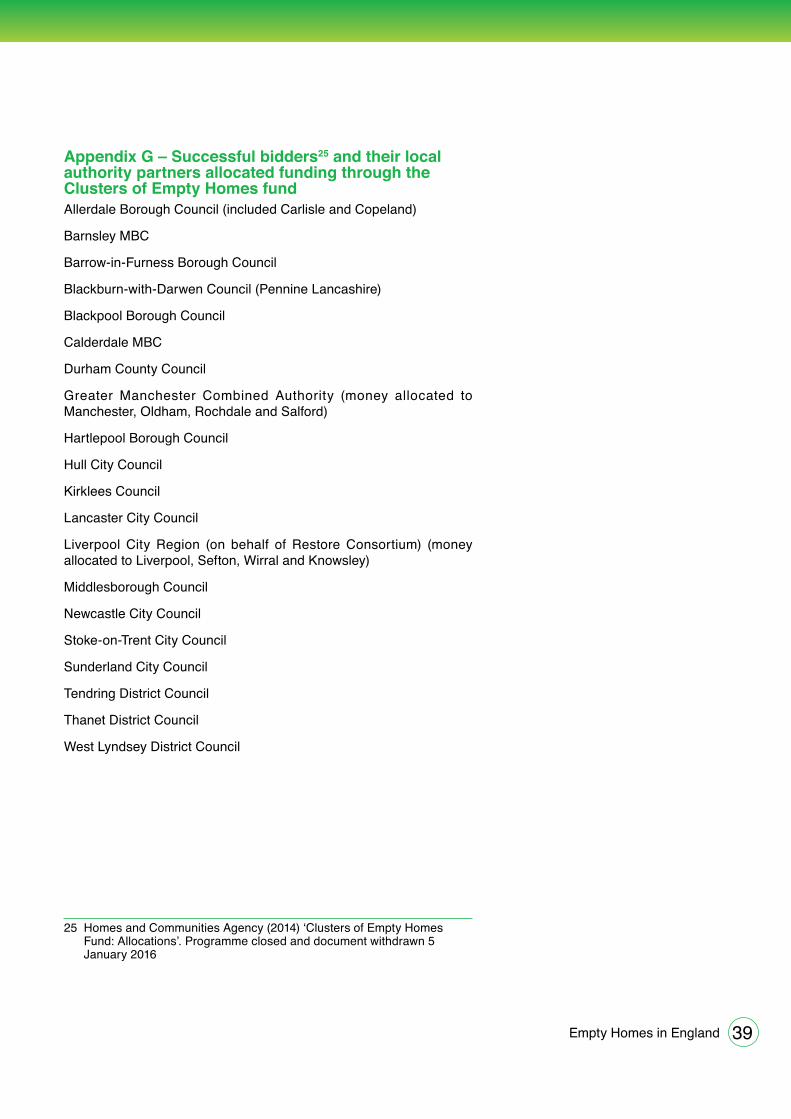
Appendix G – Successful bidders25 and their local authority partners allocated funding through the Clusters of Empty Homes fundAllerdale Borough Council (included Carlisle and Copeland)
Barnsley MBC
Barrow-in-Furness Borough Council
Blackburn-with-Darwen Council (Pennine Lancashire)
Blackpool Borough Council
Calderdale MBC
Durham County Council
Greater Manchester Combined Authority (money allocated to Manchester, Oldham, Rochdale and Salford)
Hartlepool Borough Council
Hull City Council
Kirklees Council
Lancaster City Council
Liverpool City Region (on behalf of Restore Consortium) (money allocated to Liverpool, Sefton, Wirral and Knowsley)
Middlesborough Council
Newcastle City Council
Stoke-on-Trent City Council
Sunderland City Council
Tendring District Council
Thanet District Council
West Lyndsey District Council
25 Homes and Communities Agency (2014) ‘Clusters of Empty Homes Fund: Allocations’. Programme closed and document withdrawn 5 January 2016
Empty Homes in England40
Appendix H – Methodology Empty Homes used to look at the relationship between proportion of long-term empty homes at local authority level and local authorities who received Clusters of Empty Homes Fund moneyWe listed local authorities in rank order of the proportion of homes long-term empty in England (in accordance with the methodology we used in Appendix C) and compared that to the list of local authorities that had been allocated Cluster of Empty Homes Fund monies (from Appendix G).
This analysis was commissioned by Empty Homes from Cobweb Consulting.