emsc opportunities for enhancing pediatric emergency care: pediatric readiness data: an opportunity...
TRANSCRIPT
EMSC Opportunities for Enhancing Pediatric Emergency Care: Pediatric Readiness Data: An Opportunity to Improve Quality of Care in Your Emergency Department
Moderator: Beth Edgerton, MD, MPH
Presenters:Charles Macias, MD, MPHKatherine Remick, MDEvelyn Lyons, RN, MPH
Date:Wednesday, December 17, 2014
HOUSEKEEPING RULES FOR THE WEB CONFERENCE
Everyone will be muted upon entry.
Please use the chat box (located on the bottom right corner) to ask any questions.
DO NOT PLACE THE PHONE ON HOLD as this will disrupt the webinar. If you have any technical difficulties, please contact Brandye Williams at [email protected].

As a result of having participated in this webinar, attendees will be able to:
1. Define Quality Improvement and its scope and impact in pediatric emergency care,
2. Distinguish quality assurance from quality improvement,
3. List critical components of the quality improvement process,
4. Illustrate via case presentation a pediatric emergency quality improvement opportunity, and
5. Identify potential quality improvement initiatives via pediatric readiness data.
ACCREDITATION
This activity has been planned and implemented in accordance with the accreditation requirements and policies of the Accreditation Council for Continuing Medical Education (ACCME) through the joint providership of the Indian Health Service (IHS) Clinical Support Center and the EMSC National Resource Center. The IHS Clinical Support Center is accredited by the ACCME to provide continuing medical education for physicians. The IHS Clinical Support Center designates this live activity for a maximum of 1½ AMA PRA Category 1 Credits™. Physicians should claim only the credit commensurate with the extent of their participation in the activity. The Indian Health Service Clinical Support Center is accredited as a provider of continuing nursing education by the American Nurses Credentialing Center’s Commission on Accreditation. This activity is designated 1.5 contact hours for nurses.

DISCLAIMER
Accreditation applies solely to this educational activity and does not imply approval or endorsement of any commercial product, services or processes by the CSC, IHS, the federal government, or the accrediting bodies.

FACULTY DISCLOSURE STATEMENT
As a provider accredited by ACCME, ANCC, and ACPE, the IHS Clinical Support Center must ensure balance, independence, objectivity, and scientific rigor in its educational activities. Course directors/coordinators, planning committee members, faculty, reviewers and all others who are in a position to control the content of this educational activity are required to disclose all relevant financial relationships with any commercial interest related to the subject matter of the educational activity. Safeguards against commercial bias have been put in place. Faculty will also disclose any off-label and/or investigational use of pharmaceuticals or instruments discussed in their presentation. All those in a position to control the content of this educational activity have completed the disclosure process and have indicated that they do not have any significant financial relationships or affiliations with any manufacturers or commercial products to disclose. There is no commercial interest support for this educational activity.
CE Evaluation and Certificate
Continuing Education guidelines require that the attendance of all who participate be properly documented.
Those who participate and wish to receive continuing education need to attend the activity in its entirety and complete the online evaluation by December 24, 2014. The online evaluation link will be provided at end of the educational activity by the facilitators. The online link will be available for one week to complete your evaluation. If you need assistance accessing the online evaluation link, or have questions regarding this internet education event please contact Sametria McCammon at ([email protected]).
Continuing education certificates for doctors and nurses will be automatically generated and emailed to you upon completion of the online evaluation.
TODAY’S PRESENTERS
Charles Macias, MD, MPH, Texas Children’s Hospital
Katherine Remick, MD, Austin-Travis County EMS System and UT Southwestern Austin, Dell Children’s Medical Center
Evelyn Lyons, RN, MPH, Illinois Emergency Medical Services for Children Program, Illinois Department of Public Health
Charles G Macias MD, MPHChief Clinical Systems Integration Officer, Texas Children’s
Director, Evidence Based Outcomes Center and Center for Clinical Effectiveness, Texas Children’/Baylor College of Medicine
Objectives 1. Define Quality Improvement and its scope and
impact in pediatric emergency care 2. Distinguish quality assurance from quality
improvement 3. List critical components of the quality improvement
process 4. Illustrate via case presentation a pediatric
emergency quality improvement opportunity 5. Identify potential quality improvement initiatives via
pediatric readiness data 6. Summary and take home points
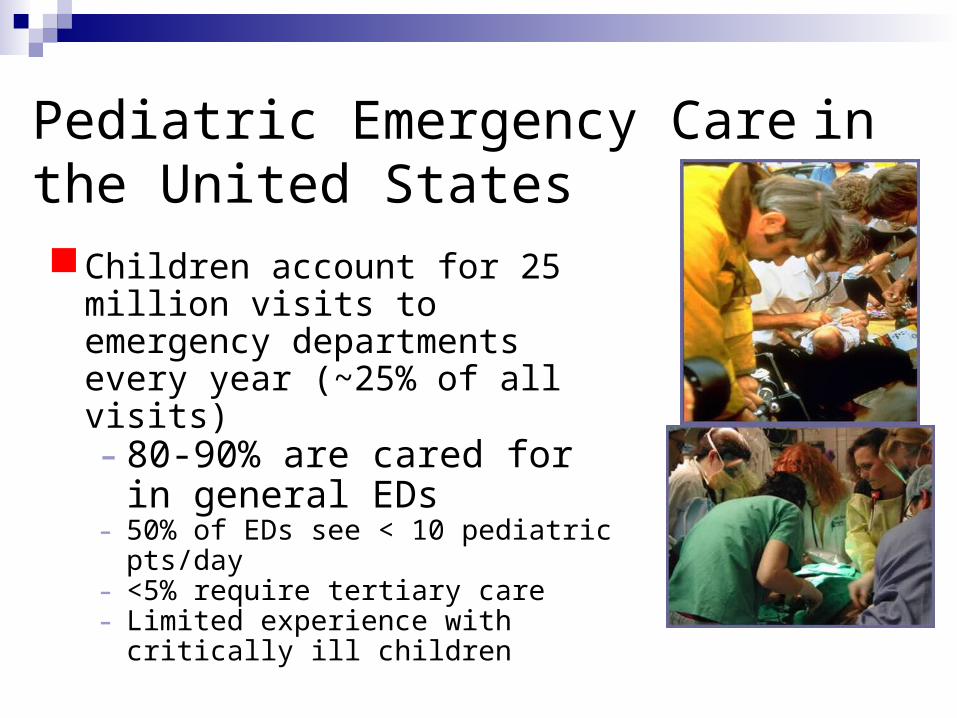
Pediatric Emergency Care in the United StatesChildren account for 25 million
visits to emergency departments every year (~25% of all visits)- 80-90% are cared for in
general EDs- 50% of EDs see < 10 pediatric pts/day- <5% require tertiary care- Limited experience with critically ill
children
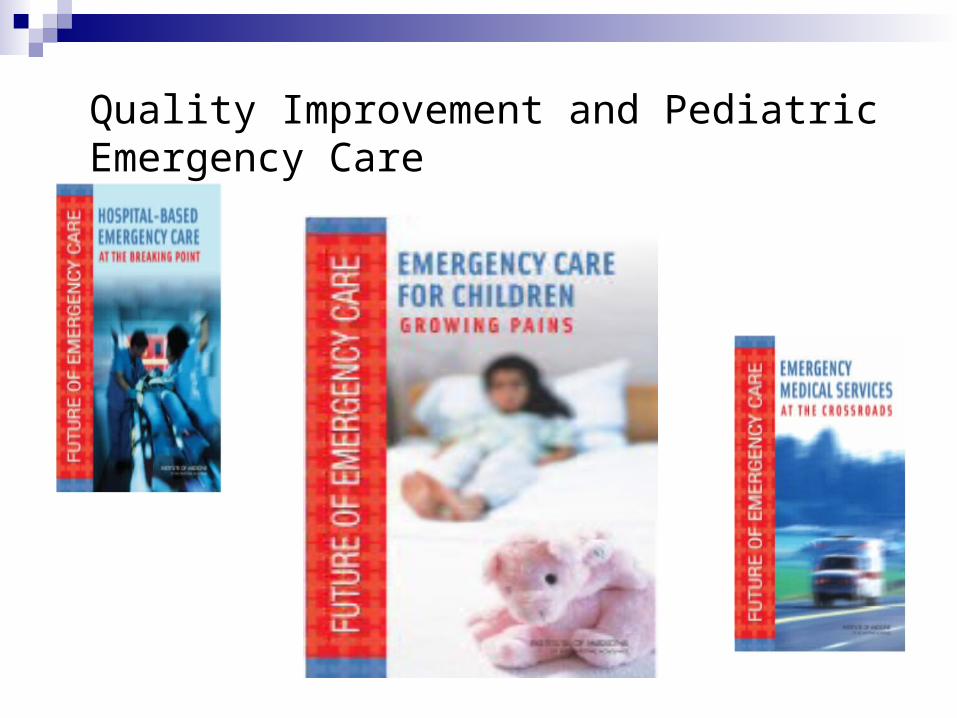
Quality Improvement and Pediatric Emergency Care

June 15, 2006
Emergency medical care in the United States is on the verge of collapse…
…As a system…it provides care of variable and often unknown quality…
14
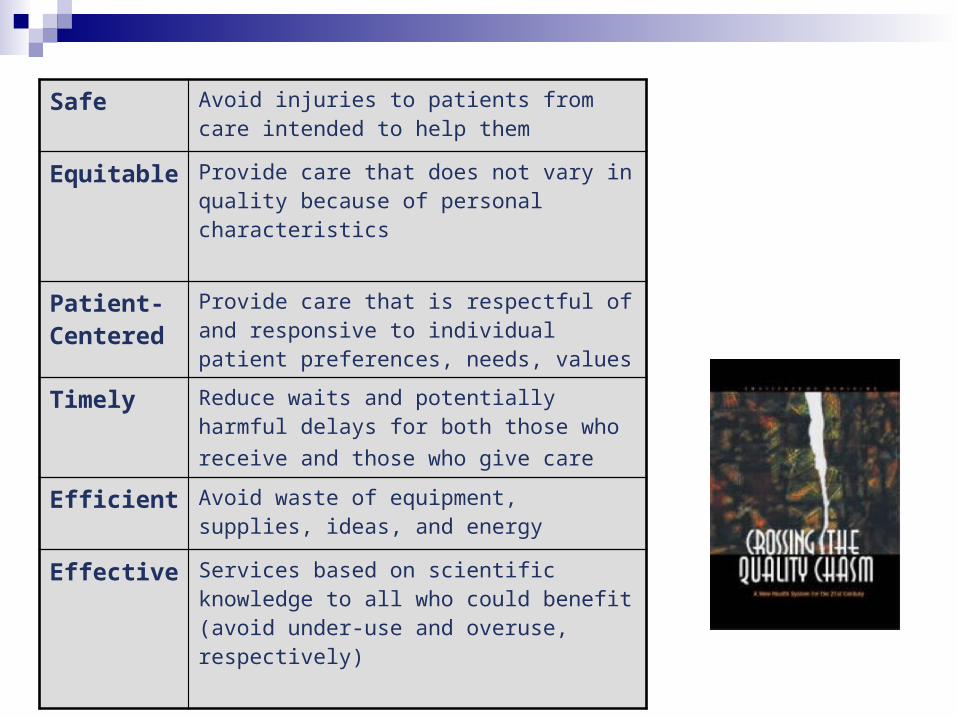
Safe Avoid injuries to patients from care intended to help them
Equitable Provide care that does not vary in quality because of personal characteristics
Patient-Centered
Provide care that is respectful of and responsive to individual patient preferences, needs, values
Timely Reduce waits and potentially harmful delays for both those who receive and those who give care
Efficient Avoid waste of equipment, supplies, ideas, and energy
Effective Services based on scientific knowledge to all who could benefit (avoid under-use and overuse, respectively)

44,000-98,000 deaths annually in the US due to preventable error
HealthGrades 2007-2009 46% lower risk of a safety
incident at a top hospital 7.3 billion in excess costs
“…Now comes a study in the current issue of the Journal of Patient Safety that says the numbers may be much higher — between 210,000 and 440,000 patients each year who go to the hospital for care suffer some type of preventable harm that contributes to their death, the study says. That would make medical errors the third-leading cause of death in America, behind heart disease, which is the first, and cancer, which is second. “
www.propublica.org, accessed 11/26/2014
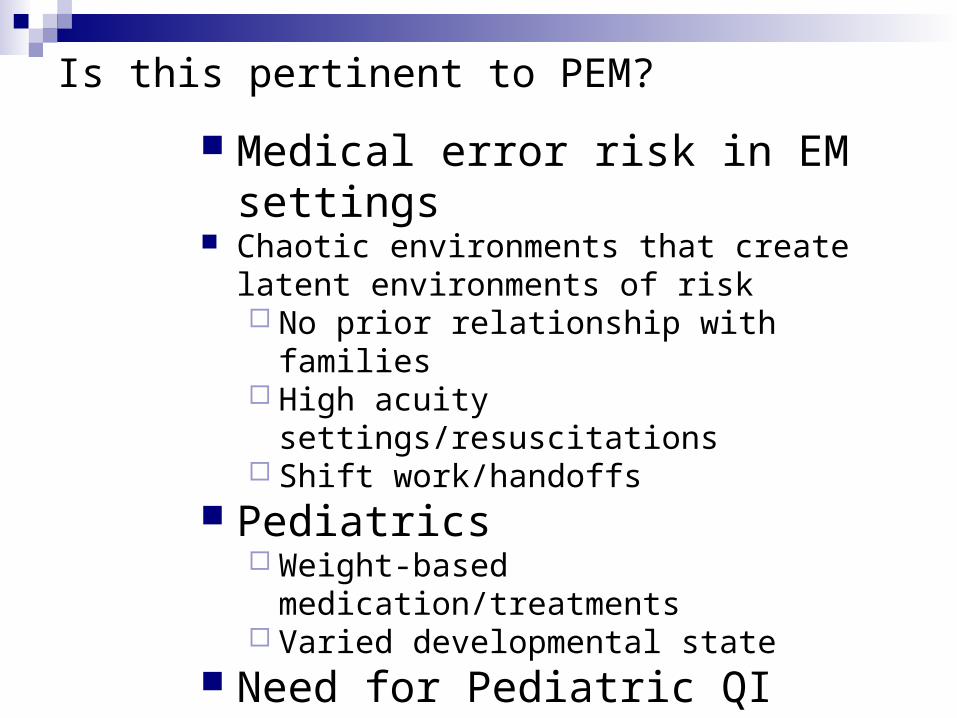
Is this pertinent to PEM?
Medical error risk in EM settings Chaotic environments that create latent
environments of risk No prior relationship with families High acuity settings/resuscitations Shift work/handoffs
Pediatrics Weight-based medication/treatments Varied developmental state
Need for Pediatric QI in health care infrastructures
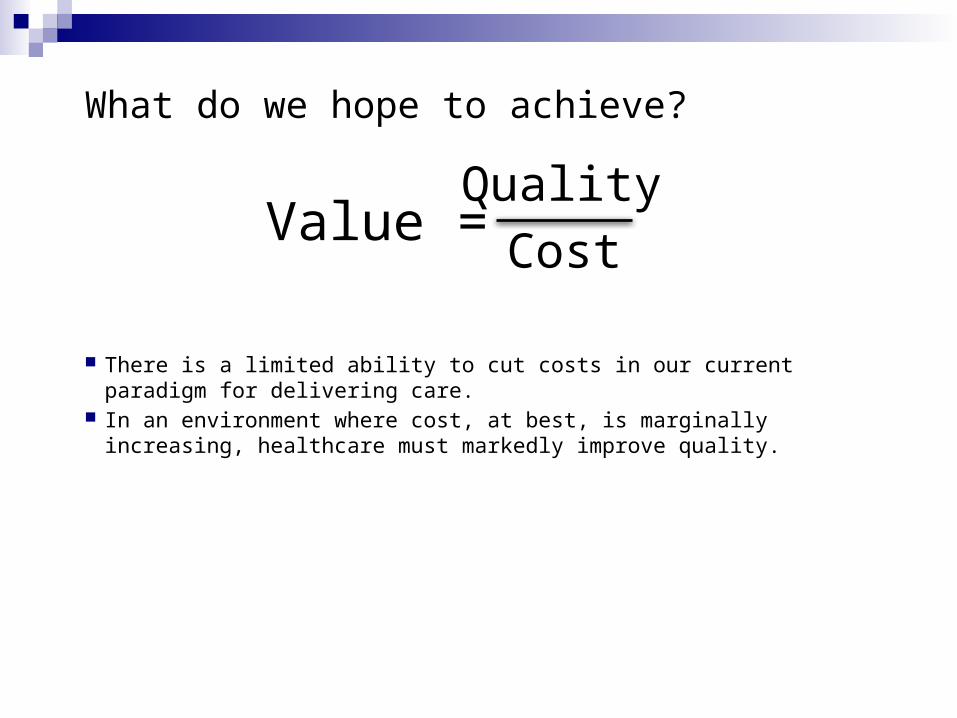
What do we hope to achieve?
There is a limited ability to cut costs in our current paradigm for delivering care.
In an environment where cost, at best, is marginally increasing, healthcare must markedly improve quality.
QualityCostValue =

Why does it matter? A parallel example
RCT of treatment of hypertension on the jobsite (a steel mill) versus referral to the PCP
No difference in compliance between the groups Exploration of factors relating to therapy revealed specific
determinants of the clinical decision to treat some, but not other, hypertensive patients:
1. The level of diastolic blood pressure.2. The patient’s age.3. ????4. The amount of target-organ damage.
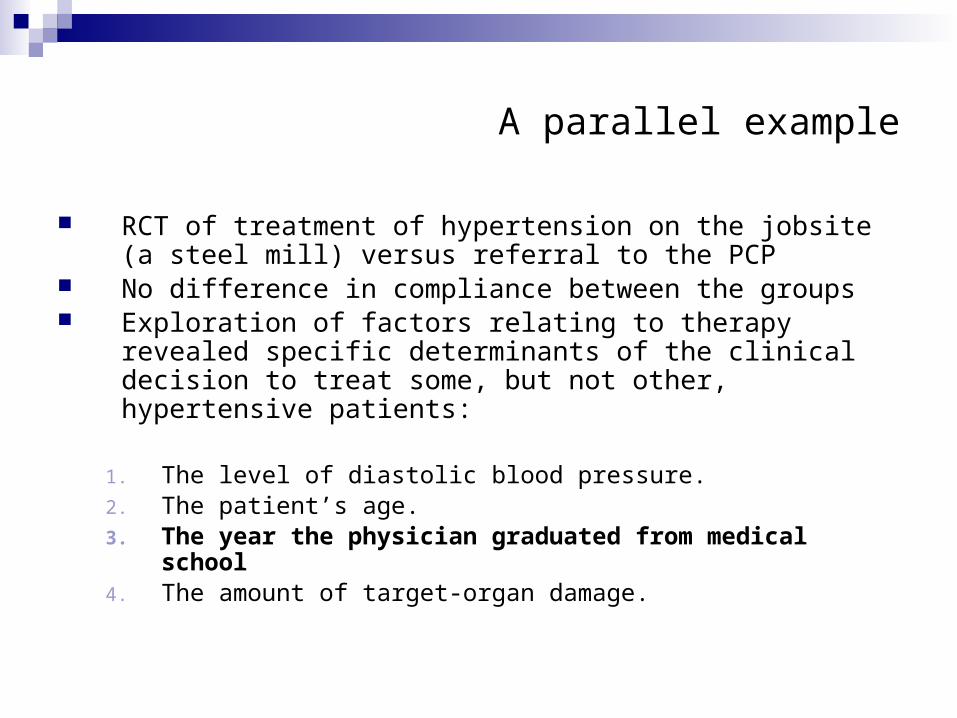
A parallel example
RCT of treatment of hypertension on the jobsite (a steel mill) versus referral to the PCP
No difference in compliance between the groups Exploration of factors relating to therapy revealed specific
determinants of the clinical decision to treat some, but not other, hypertensive patients:
1. The level of diastolic blood pressure.2. The patient’s age.3. The year the physician graduated from medical school4. The amount of target-organ damage.
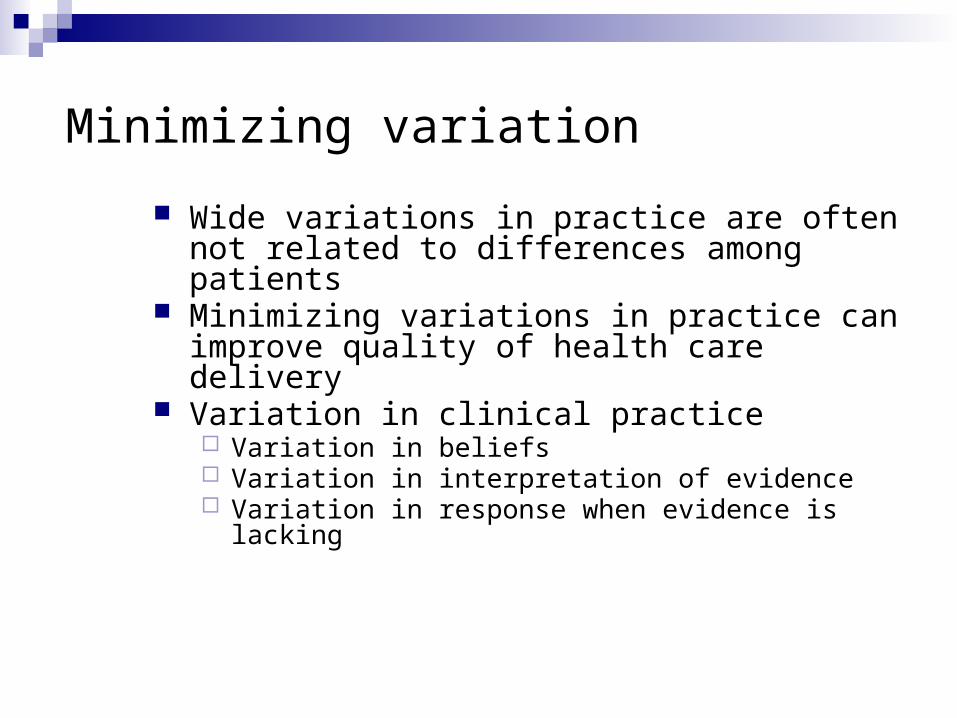
Minimizing variation
Wide variations in practice are often not related to differences among patients
Minimizing variations in practice can improve quality of health care delivery
Variation in clinical practice Variation in beliefs Variation in interpretation of evidence Variation in response when evidence is lacking

Variation in pediatric care models
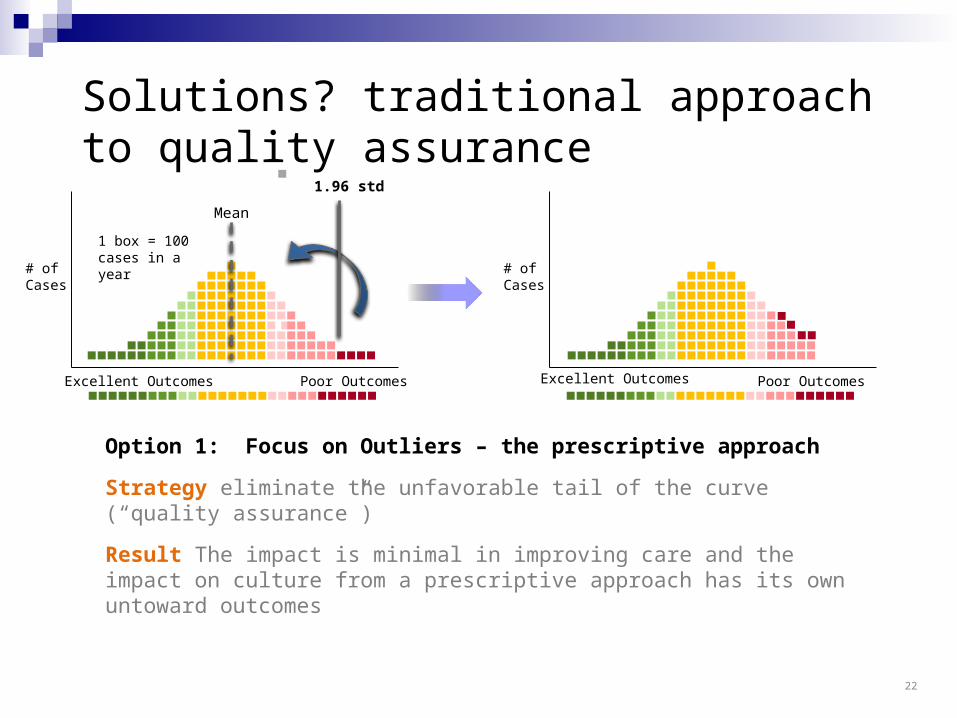
Option 1: Focus on Outliers – the prescriptive approach
Strategy eliminate the unfavorable tail of the curve (“quality assurance”)
Result The impact is minimal in improving care and the impact on culture from a prescriptive approach has its own untoward outcomes
# of Cases
Excellent Outcomes Poor Outcomes
1.96 std
# of Cases
Mean
Excellent Outcomes Poor Outcomes
1 box = 100 cases in a year
Solutions? traditional approach to quality assurance
22
Excellent Outcomes Poor Outcomes
# of Cases
Mean
1 box = 100 cases in a year
Excellent Outcomes
# of Cases
Poor Outcomes
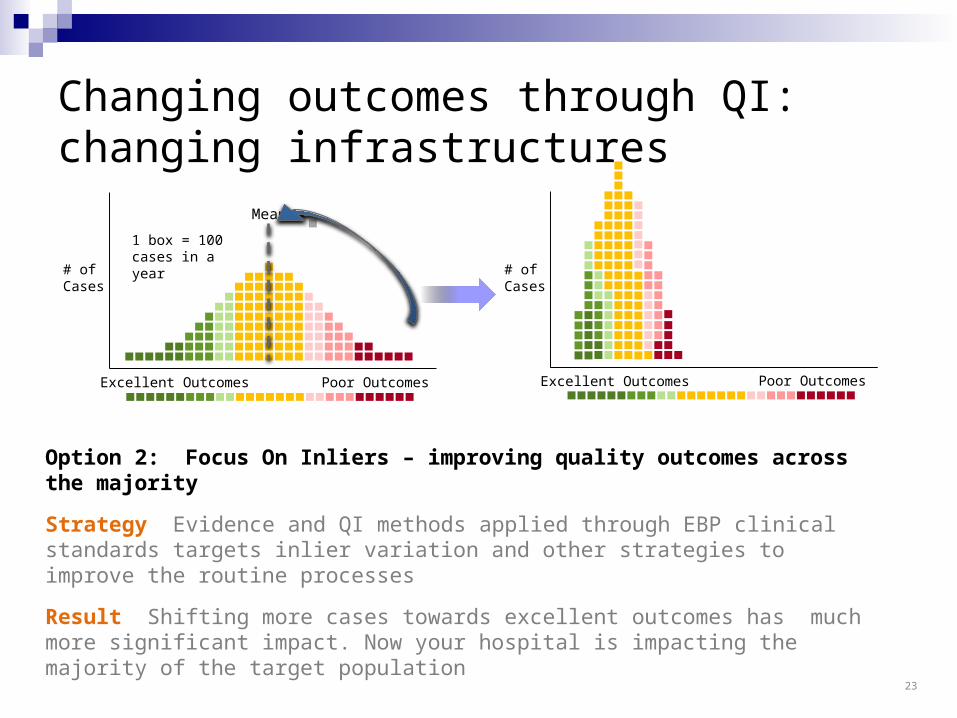
Option 2: Focus On Inliers – improving quality outcomes across the majority
Strategy Evidence and QI methods applied through EBP clinical standards targets inlier variation and other strategies to improve the routine processes
Result Shifting more cases towards excellent outcomes has much more significant impact. Now your hospital is impacting the majority of the target population
Changing outcomes through QI: changing infrastructures
23
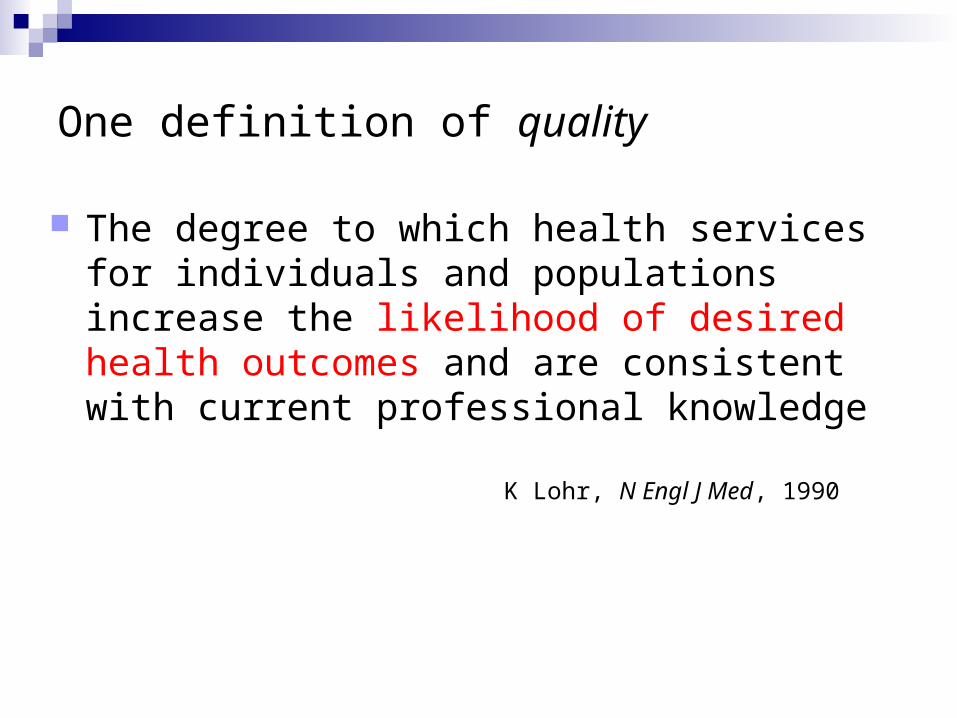
One definition of quality
The degree to which health services for individuals and populations increase the likelihood of desired health outcomes and are consistent with current professional knowledge
K Lohr, N Engl J Med, 1990
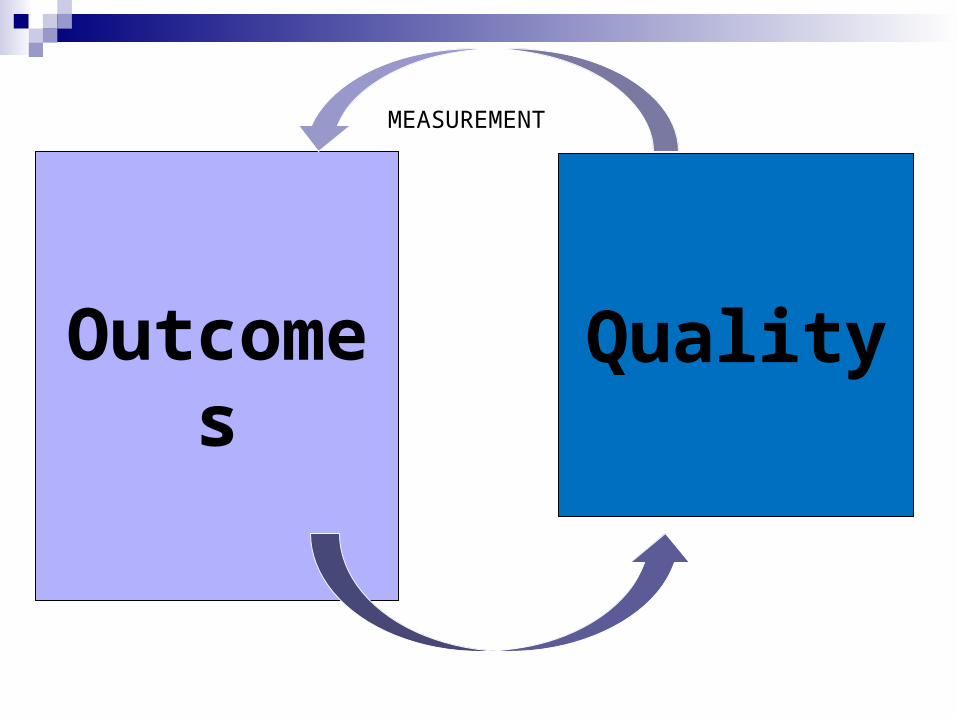
Outcomes
Quality
MEASUREMENT

One definition of quality
The degree to which health services for individuals and populations increase the likelihood of desired health outcomes and are consistent with current professional knowledge
K Lohr, N Engl J Med, 1990
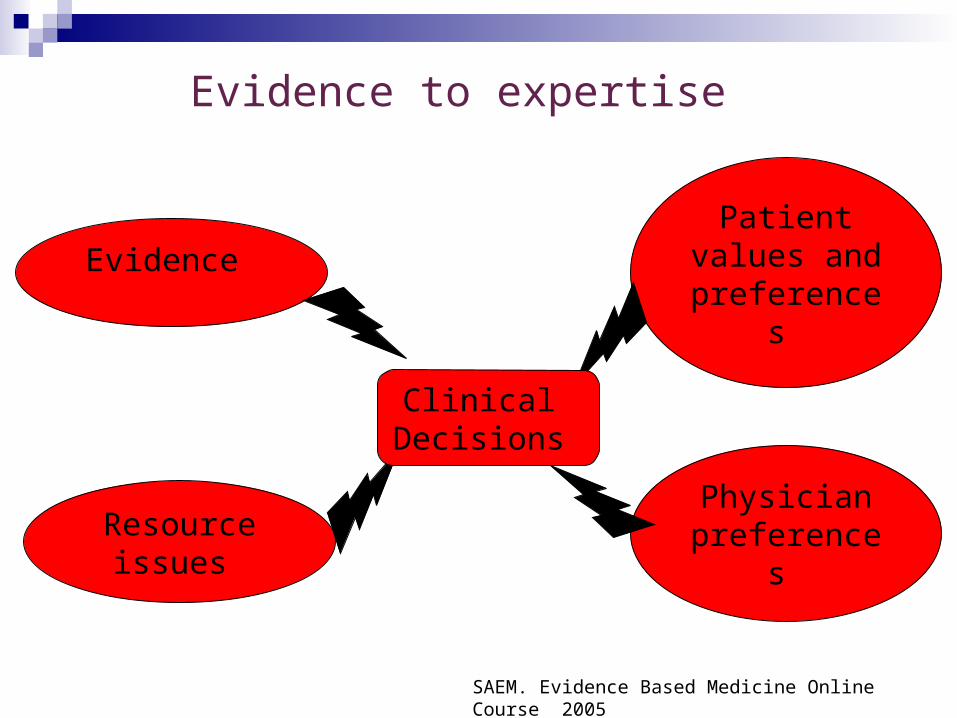
Evidence to expertise
Evidence
Physician preferences
Patient values and
preferences
Resource issues
Clinical Decisions
SAEM. Evidence Based Medicine Online Course 2005
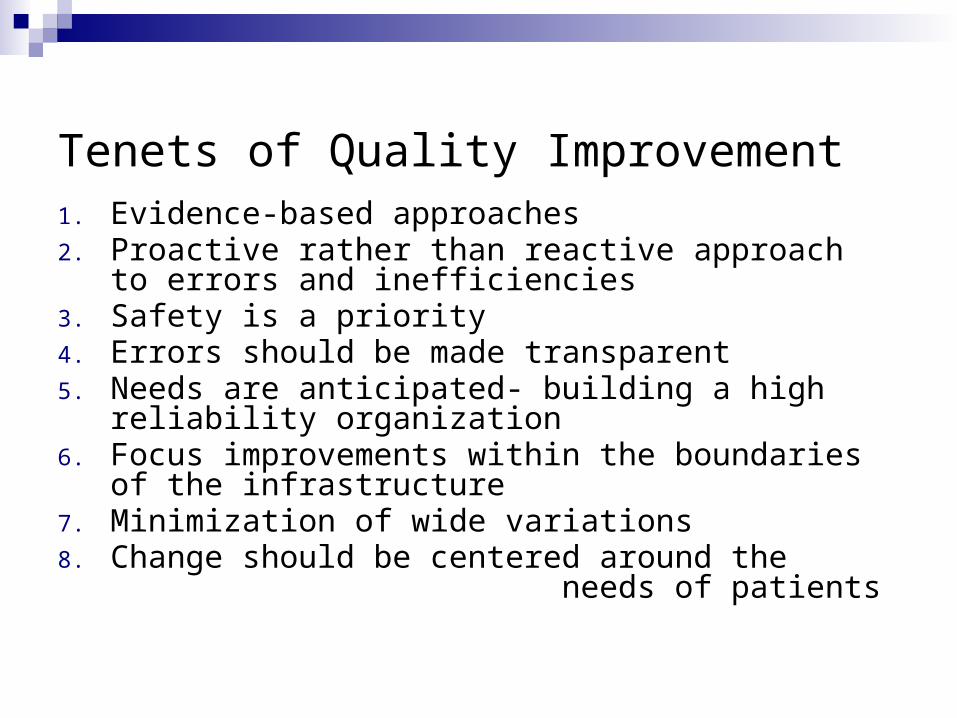
Tenets of Quality Improvement1. Evidence-based approaches2. Proactive rather than reactive approach to errors and
inefficiencies3. Safety is a priority4. Errors should be made transparent5. Needs are anticipated- building a high reliability
organization6. Focus improvements within the boundaries of the
infrastructure7. Minimization of wide variations 8. Change should be centered around the
needs of patients

SMART Aim Specific
Single focus directed at that which you are trying to accomplish
Measurable Must have a quantifiable metric
Actionable The end point needs to be defined and within the team’s
control Relevant/Realistic
Is your aim important to your patients, the providers, and the overall goals of the department/hospital
Time bound Decide on a time period during which this aim can be
accomplished
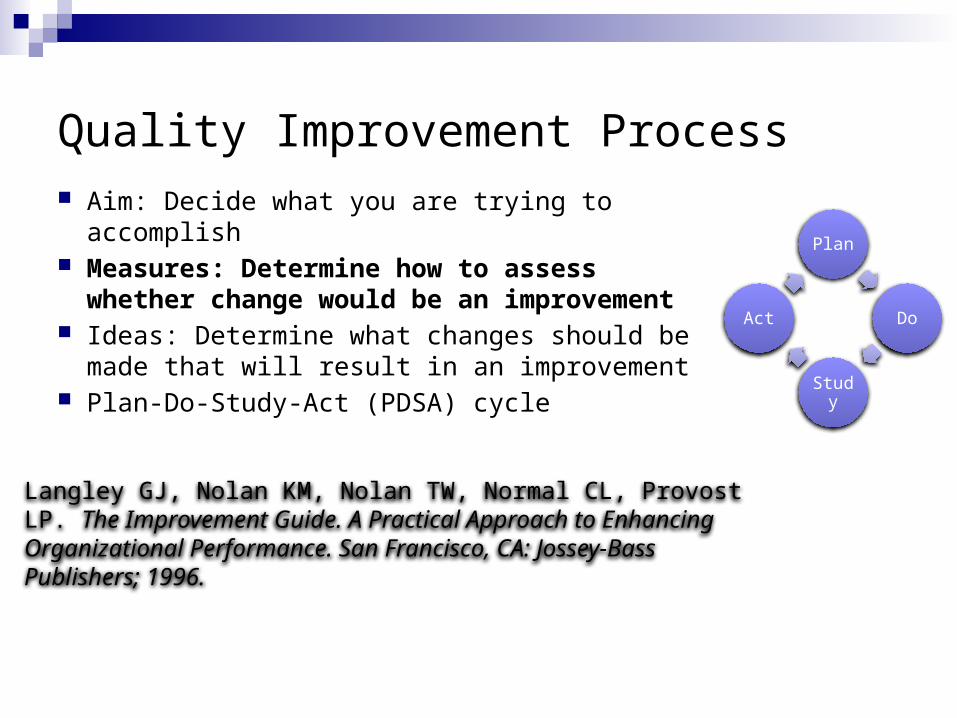
Quality Improvement Process Aim: Decide what you are trying to accomplish Measures: Determine how to assess
whether change would be an improvement Ideas: Determine what changes should be
made that will result in an improvement Plan-Do-Study-Act (PDSA) cycle
Plan
Do
Study
Act
Langley GJ, Nolan KM, Nolan TW, Normal CL, Provost LP. The Improvement Guide. A Practical Approach to Enhancing Organizational Performance. San Francisco, CA: Jossey-Bass Publishers; 1996.

Various Approaches to Determining Which Changes Will Result in Improvement Brainstorming Process mapping Identify key drivers Fishbone Diagrams (Cause and effect diagrams) Evidence-based medicine (review of the literature) Best practices (successful efforts in other units or
institutions)
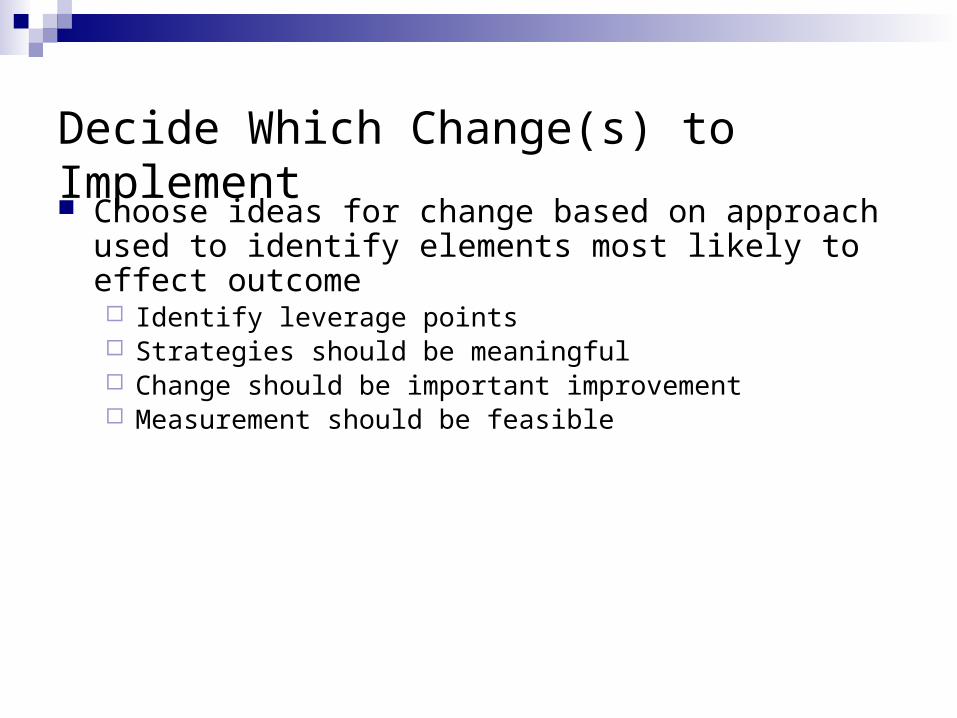
Decide Which Change(s) to Implement Choose ideas for change based on approach used to
identify elements most likely to effect outcome Identify leverage points Strategies should be meaningful Change should be important improvement Measurement should be feasible

Quality Improvement Process
Aim: Decide what you are trying to accomplish
Measures: Determine how to assess whether changes would be an improvement
Ideas: Determine what changes should be made that will result in an improvement
Plan-Do-Study-Act
Plan
Do
Study
Act

PDSA Cycle Plan
Determine your aim and how you will measure it Decide which change to make and create a plan for implementation (test
period) Develop a data collection plan
Do Gather data Record observations including unexpected
consequences
Study Compare results to previous performance
Act: Adopt, Adapt, or Abandon Consider need for continued testing Develop a plan for sustainability
Plan
Do
Study
Act
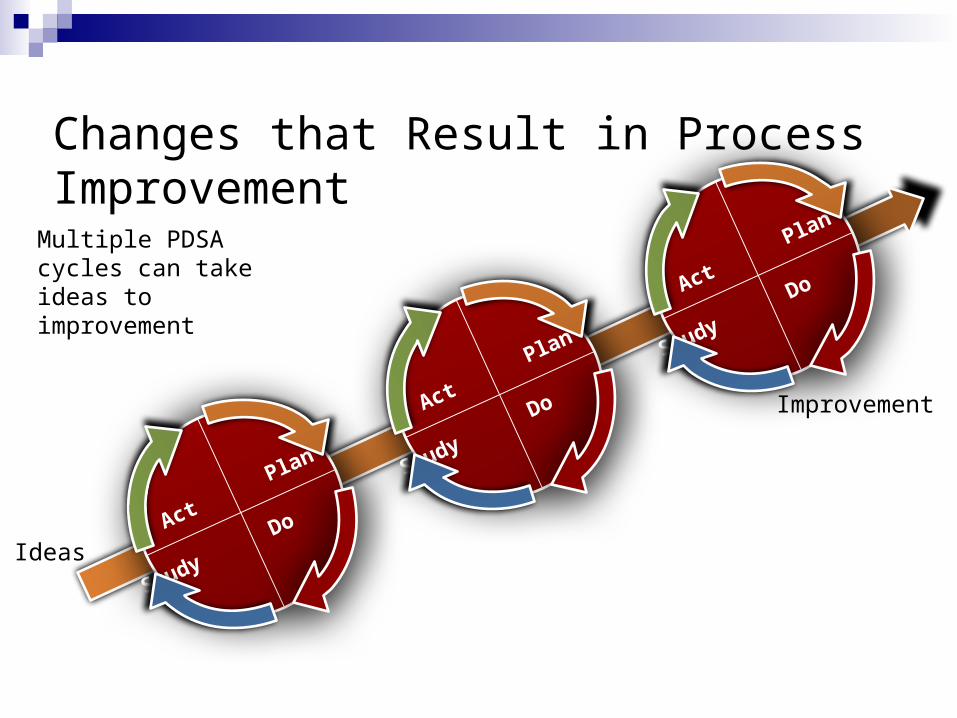
Changes that Result in Process Improvement
Ideas A
ct Plan
Study Do
Act
Plan
Study Do
Act
Plan
Study Do
Improvement
Multiple PDSA cycles can take ideas to improvement
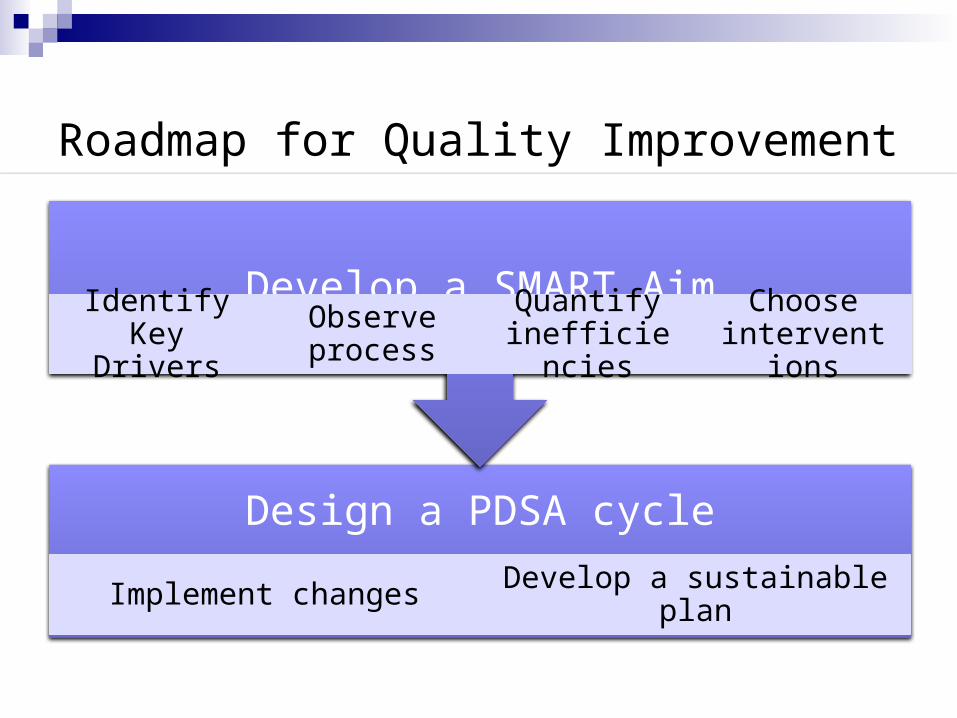
Roadmap for Quality Improvement
Design a PDSA cycle
Implement changes Develop a sustainable plan
Develop a SMART AimIdentify Key
DriversObserve process
Quantify inefficiencies
Choose interventions
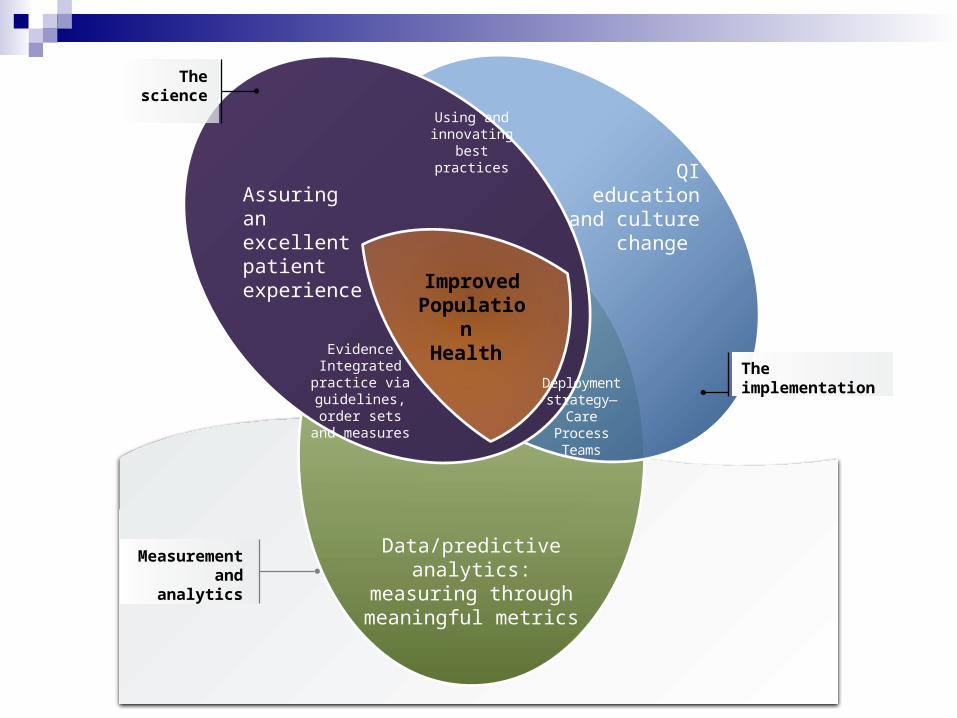
Assuring an excellent patient experience
QI education and culture change
Data/predictive analytics: measuring through meaningful metrics
The science
Measurement and analytics
The implementation
ImprovedPopulation
Health
Deployment strategy—Care
Process Teams
Evidence Integrated practice via
guidelines, order sets and measures
Using and innovating best
practices

Pediatric Readiness Data and QI Initiatives
Katherine Remick, MDAssociate Medical Director, Austin-Travis County EMS System
Pediatric Emergency Medicine, Dell Children’s Medical Center
Faculty, UTSW-Austin, Pediatric Emergency Medicine Fellowship
Disclosure
My spouse is a salaried, Manager of Core Labs for transcatheter heart valves at Edwards Lifesciences

Pediatrics 2009; 124(4):1233-43
Guidelines for Care of Children in the ED
Gausche-Hill M, Krug S, and the American Academy of Pediatrics, American College of Emergency Physicians, Emergency Nurses Association
• Recommendations regarding personnel, training, equipment, supplies, medications, support services, quality and process improvement, policies, protocols, and other resources necessary for optimal pediatric care Updated version of 2001 AAP/ACEP joint policy statement Recommendations for patient safety & disaster readiness
added Applicable standard for all EDs with 24/7 physician staffing
• Endorsed by 22 organizations, notable additions: ENA, AAFP, TJC

2009 Guidelines for Care of Children in the Emergency Department
1. Administration and Coordination
2. Physicians, Nurses, and Other Healthcare Providers
3. Quality Improvement
4. Patient Safety
5. Policies, Procedures, and Protocols
6. Support Services
7. Equipment, Supplies, and Medications
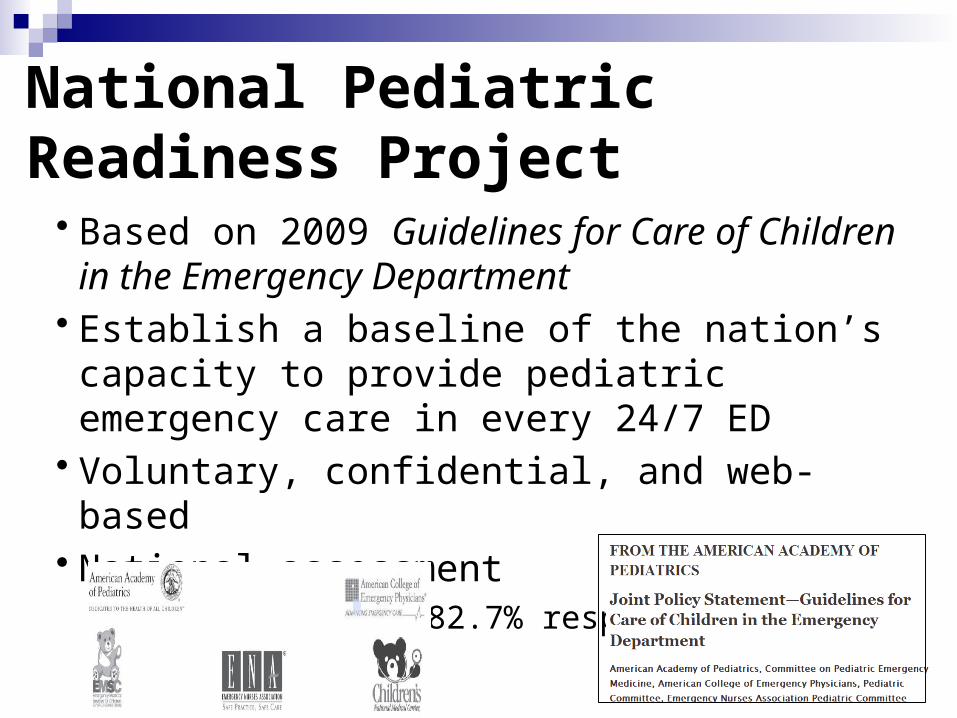
National Pediatric Readiness Project
• Based on 2009 Guidelines for Care of Children in the Emergency Department
• Establish a baseline of the nation’s capacity to provide pediatric emergency care in every 24/7 ED
• Voluntary, confidential, and web-based• National assessment
Over 4100 EDs (82.7% response)
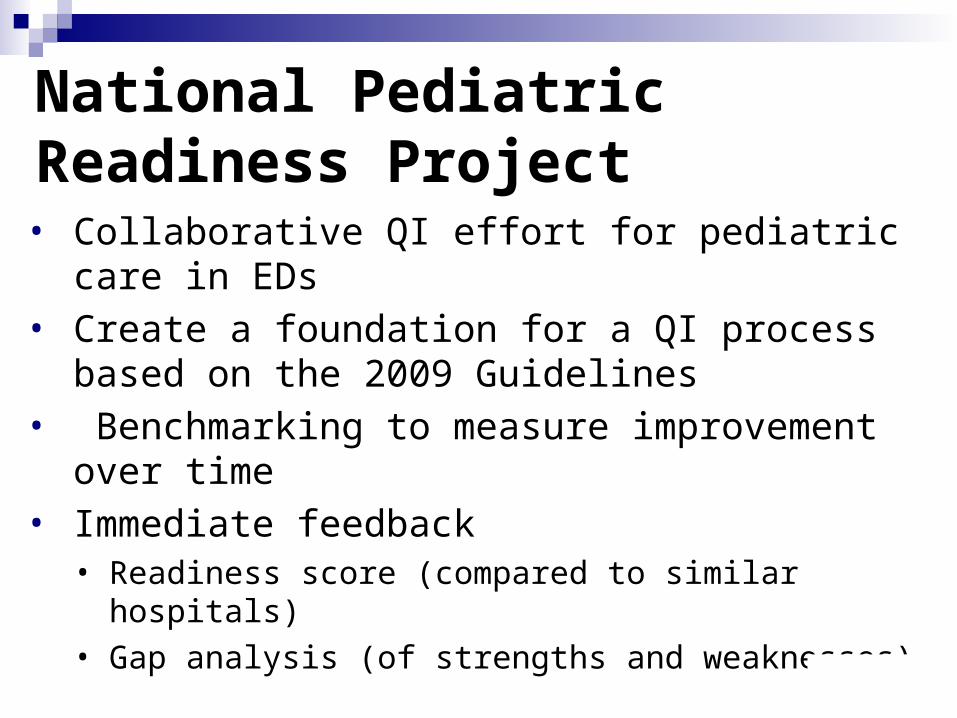
National Pediatric Readiness Project• Collaborative QI effort for pediatric care in EDs• Create a foundation for a QI process based on the
2009 Guidelines• Benchmarking to measure improvement over time• Immediate feedback
• Readiness score (compared to similar hospitals)• Gap analysis (of strengths and weaknesses)
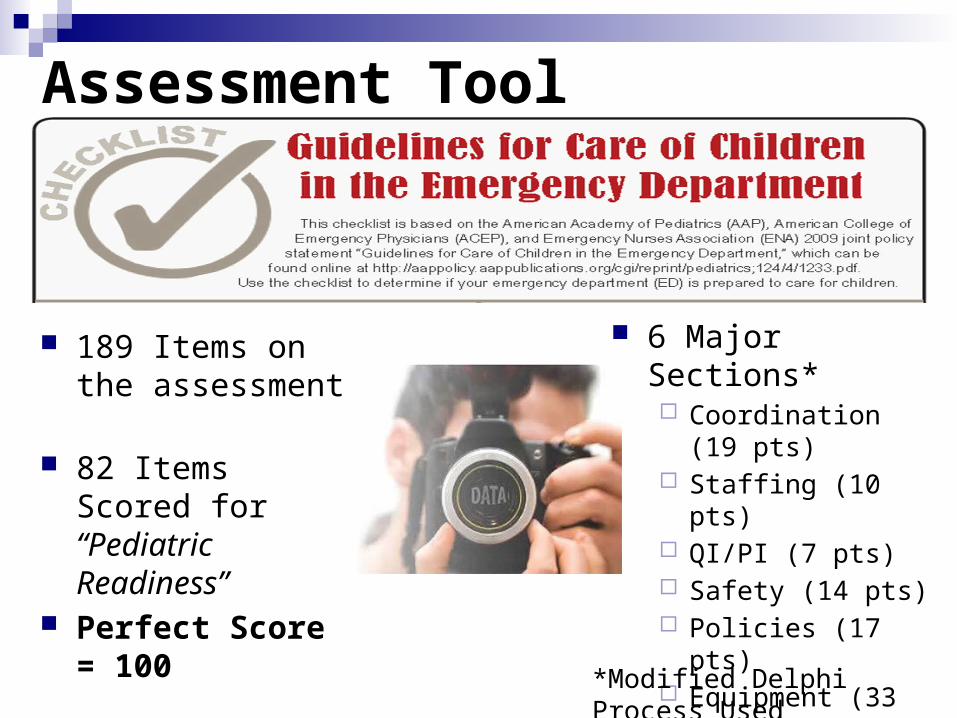
Assessment Tool
189 Items on the assessment
82 Items Scored for “Pediatric Readiness”
Perfect Score = 100
6 Major Sections* Coordination (19
pts) Staffing (10 pts) QI/PI (7 pts) Safety (14 pts) Policies (17 pts) Equipment (33
points)
*Modified Delphi Process Used

Benchmarking
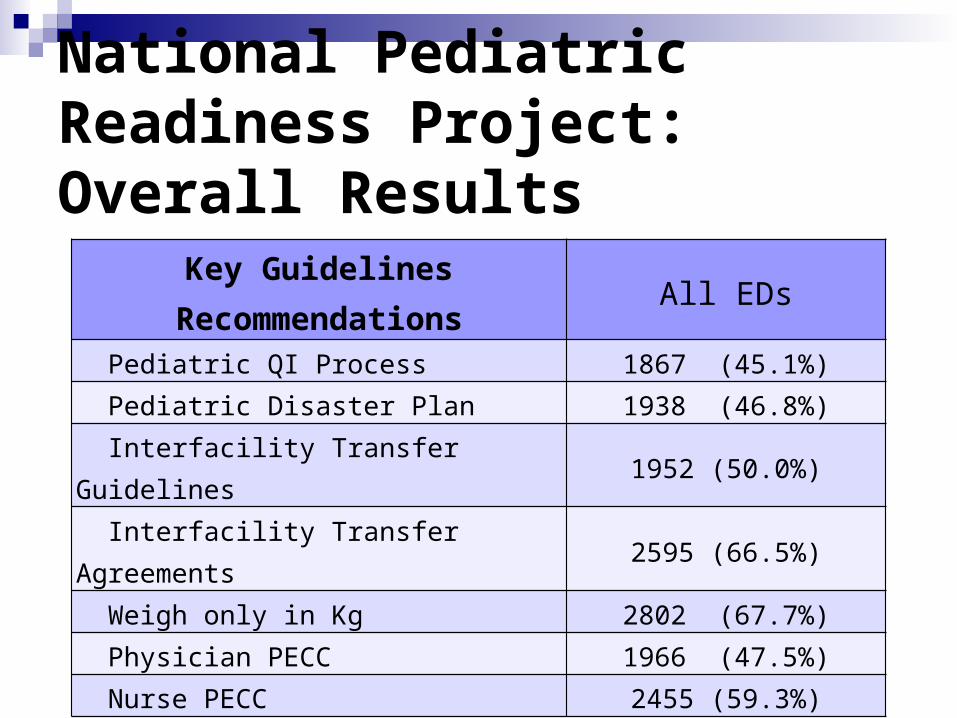
National Pediatric Readiness Project: Overall Results
Key Guidelines Recommendations All EDs Pediatric QI Process 1867 (45.1%)
Pediatric Disaster Plan 1938 (46.8%)
Interfacility Transfer Guidelines 1952 (50.0%)
Interfacility Transfer Agreements 2595 (66.5%)
Weigh only in Kg 2802 (67.7%)
Physician PECC 1966 (47.5%)
Nurse PECC 2455 (59.3%)
Using Your Gap Analysis to Identify Opportunities for Improvement Specific deficiencies based on 6 major
sections of the 2009 Guidelines Top 3-4 measures most likely to result in
enhanced pediatric readiness
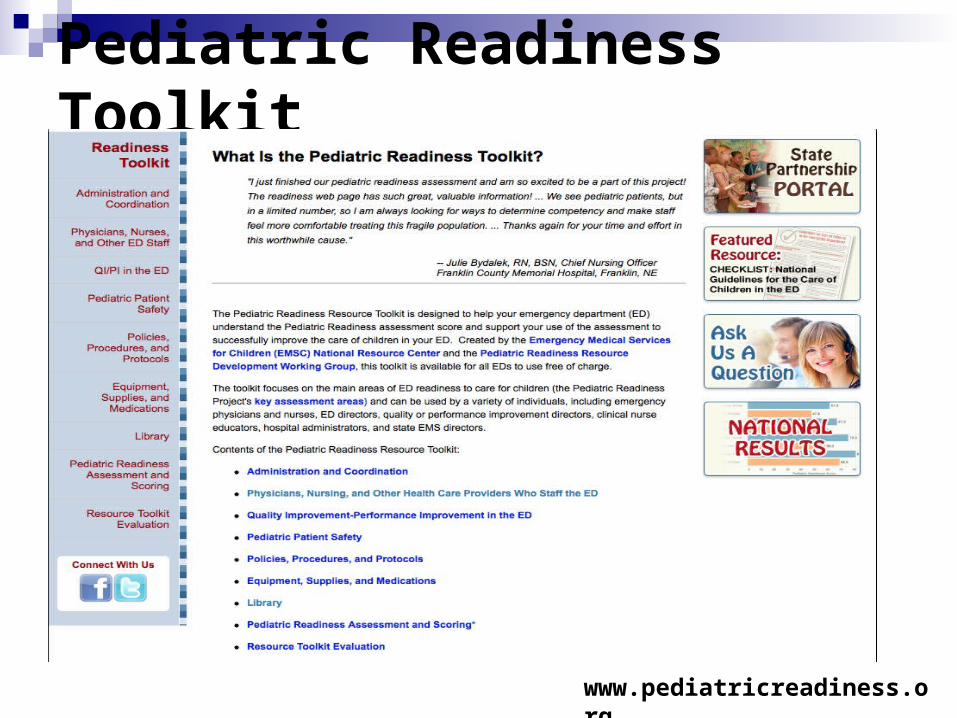
Pediatric Readiness Toolkit
www.pediatricreadiness.org

Pediatric Quality Improvementin Illinois
Evelyn Lyons, RN, MPH
EMSC Manager
Illinois Department of Public Health
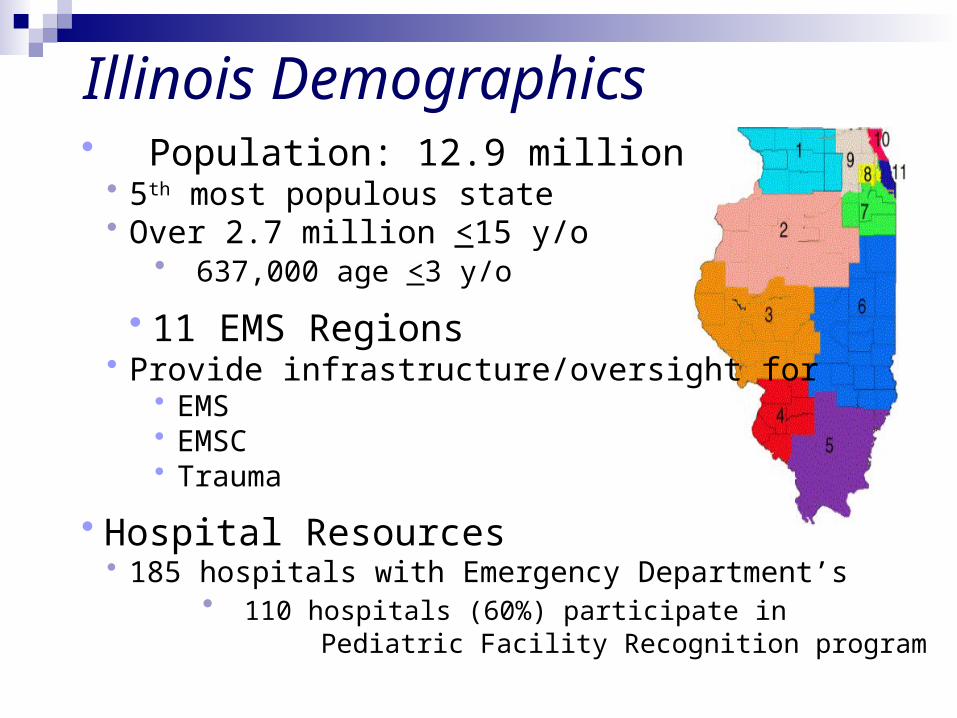
Illinois Demographics• Population: 12.9 million
• 5th most populous state• Over 2.7 million <15 y/o
• 637,000 age <3 y/o
• 11 EMS Regions• Provide infrastructure/oversight for
• EMS• EMSC• Trauma
• Hospital Resources• 185 hospitals with Emergency Department’s
• 110 hospitals (60%) participate in Pediatric Facility Recognition program

Pediatric Facility Recognition• Implemented in Illinois in 1998 by the Illinois Department of Public Health (IDPH)
• Initially voluntary process• In 2005, mandatory for EMS System Hospitals
• Tiered recognition - 110 recognized hospitals (60%)• PCCC (Pediatric Critical Care Center) – 10• EDAP (Emergency Department Approved for Pediatrics) – 87• SEDP (Standby Emergency Department Approved for Pediatrics) – 13
• Hospital utilization• In 2013, ~ 1 million ED visits 0-15 y/o
• 78% of visits to a designated PCCC, EDAP, SEDP• 30,000 visits required inpatient admission
• 94% admitted to PCCC, EDAP or SEDP
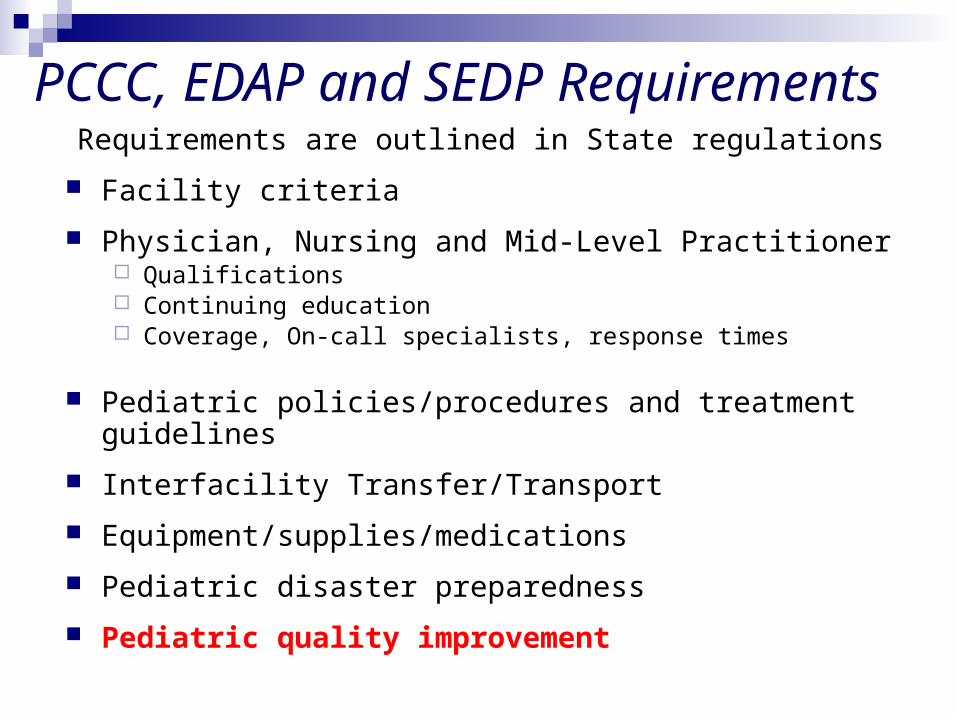
PCCC, EDAP and SEDP RequirementsRequirements are outlined in State regulations
Facility criteria
Physician, Nursing and Mid-Level Practitioner Qualifications Continuing education Coverage, On-call specialists, response times
Pediatric policies/procedures and treatment guidelines
Interfacility Transfer/Transport
Equipment/supplies/medications
Pediatric disaster preparedness
Pediatric quality improvement

Quality Improvement Requirements Pediatric quality improvement requirements
Multidisciplinary Emergency Department QI Committee/process Documented pediatric monitors must minimally address
Pediatric ED deaths Pediatric interfacility transfers Child abuse and neglect cases Critically ill/injured children in need of stabilization Pediatric strategic priorities of the institution
Pediatric Physician Champion Appointed by ED Medical Director Responsible for oversight, support, review of pediatric quality activities
Pediatric Quality Coordinator Job description includes appropriate allocation of time and resources Works with Pediatric Physician Champion Coordinates data collection/review of indicators/monitors Participates in regional pediatric QI meetings and QI activities

Regional Pediatric Quality Improvement
Examples of Regional Projects
Child Abuse/Neglect Febrile Neonate/Infant Interfacility Transfers Injury Prevention/Safety Equipment Use
in the Trauma Patient Pain Management Pediatric Mental Health Pediatric Mild Traumatic Head Injury Pediatric Sepsis Prehospital Seizure Care

Ongoing Oversight Hospital site visits by Illinois Department of Public Health
Conducted every 3-4 years
Assists in assessing compliance with Facility Recognition requirements
Pediatric Physician Champion and Pediatric Quality Coordinator review:
Quality organizational structure and reporting mechanisms Integration of pediatrics into quality improvement processes Medical record review of required monitors: Pediatric ED deaths, Interfacility
transfers, Child abuse and neglect, Critically ill/injured children
Quality improvement documentation undergoes review Monitor tools QI findings/benchmark/trending documentation Loop closure process Multidisciplinary quality meeting minutes Staff meeting minutes

Resources State Committee structure
EMSC Advisory Board Meets quarterly Provides guidance/oversight
Illinois Facility Recognition Committee and Illinois QI Subcommittee
Meet every other month Provide oversight to Facility Recognition
program Recommend changes to Facility
Recognition regulations Responsible for developing quality
improvement and educational resources Reports by each of the eleven Regional
Chairs on their regional QI activities Can access guidance and direction
EMSC Advisory Board
EMSC Facility Recognition Committee
EMSC QI Subcommittee
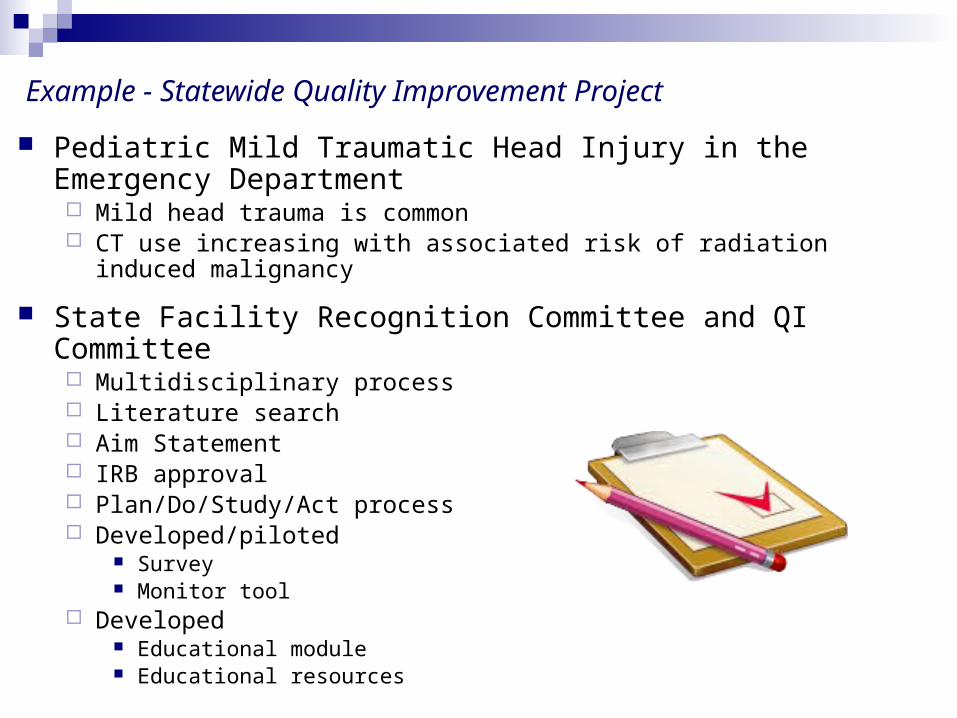
Example - Statewide Quality Improvement Project
Pediatric Mild Traumatic Head Injury in the Emergency Department Mild head trauma is common CT use increasing with associated risk of radiation induced malignancy
State Facility Recognition Committee and QI Committee Multidisciplinary process Literature search Aim Statement IRB approval Plan/Do/Study/Act process Developed/piloted
Survey Monitor tool
Developed Educational module Educational resources
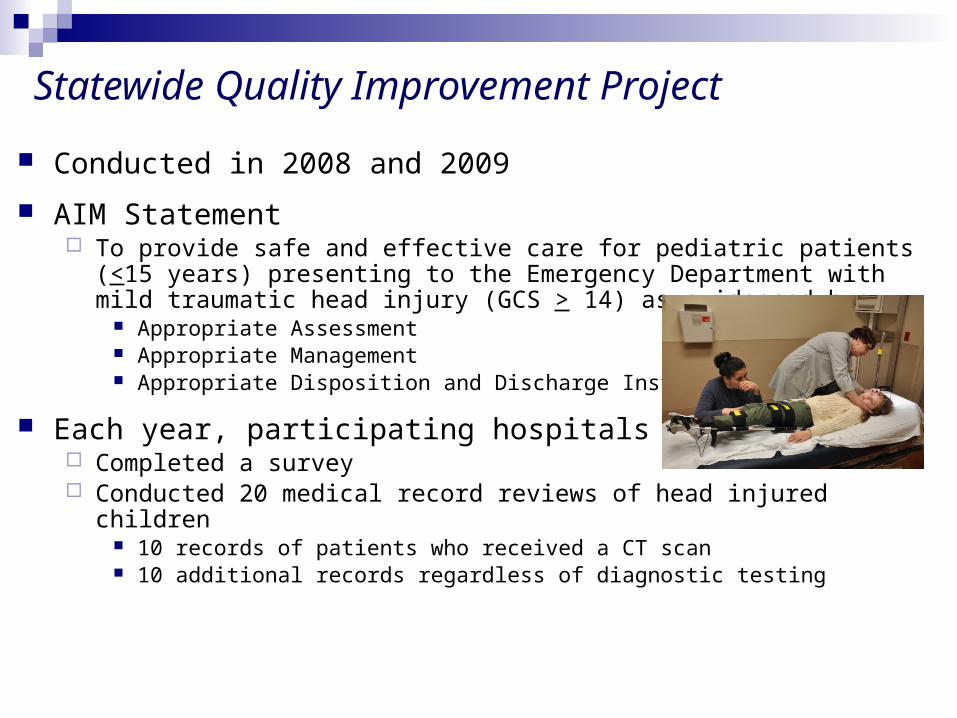
Statewide Quality Improvement Project
Conducted in 2008 and 2009
AIM Statement To provide safe and effective care for pediatric patients (<15 years) presenting
to the Emergency Department with mild traumatic head injury (GCS > 14) as evidenced by:
Appropriate Assessment Appropriate Management Appropriate Disposition and Discharge Instructions
Each year, participating hospitals Completed a survey Conducted 20 medical record reviews of head injured children
10 records of patients who received a CT scan 10 additional records regardless of diagnostic testing
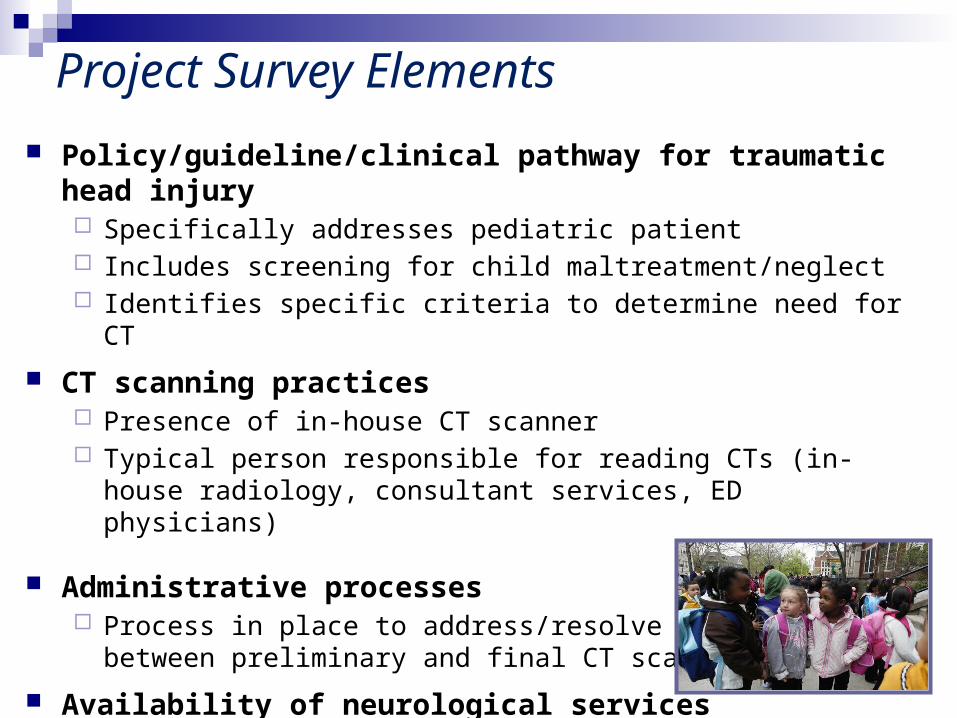
Project Survey Elements
Policy/guideline/clinical pathway for traumatic head injury Specifically addresses pediatric patient Includes screening for child maltreatment/neglect Identifies specific criteria to determine need for CT
CT scanning practices Presence of in-house CT scanner Typical person responsible for reading CTs (in-house radiology,
consultant services, ED physicians)
Administrative processes Process in place to address/resolve discrepancies between
preliminary and final CT scan findings
Availability of neurological services
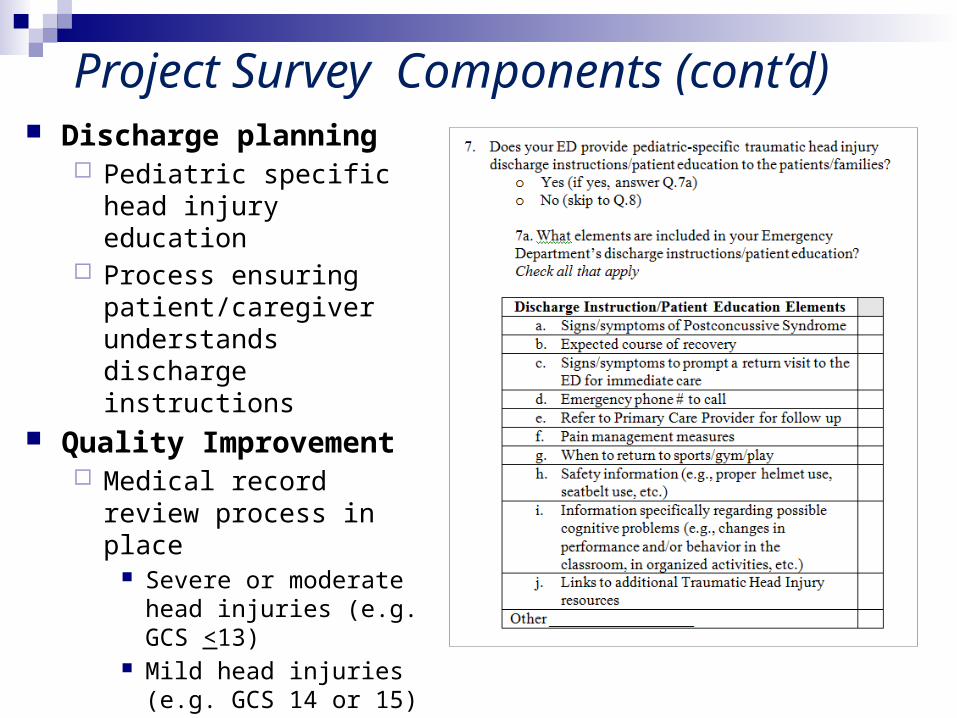
Discharge planning Pediatric specific head
injury education Process ensuring
patient/caregiver understands discharge instructions
Quality Improvement Medical record review
process in place Severe or moderate head
injuries (e.g. GCS <13) Mild head injuries (e.g.
GCS 14 or 15) Components assessed in
medical review
Project Survey Components (cont’d)
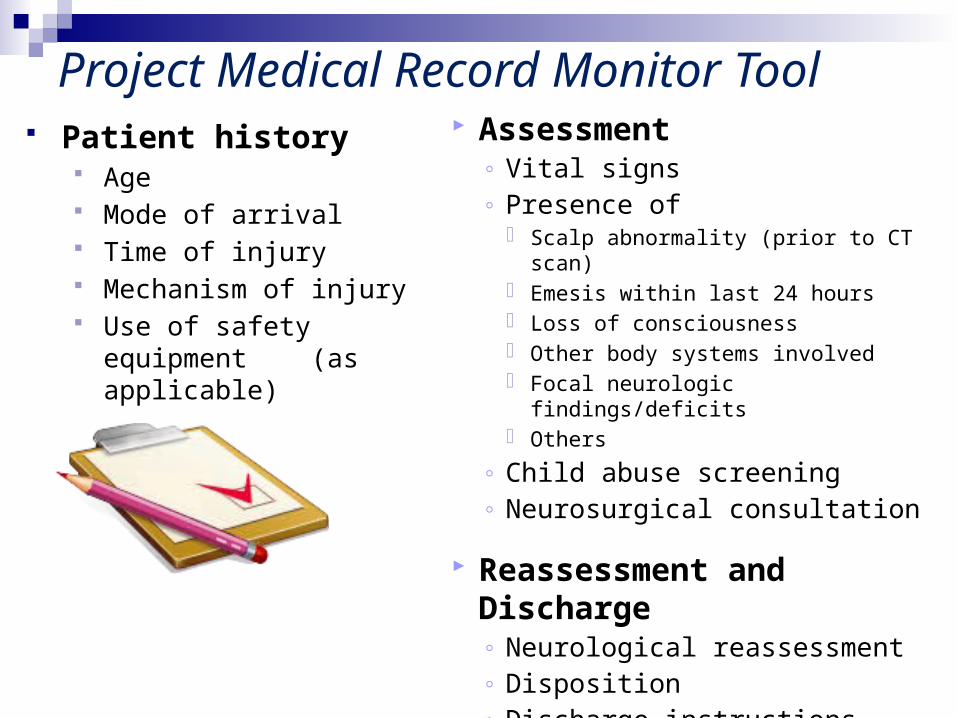
Patient history Age Mode of arrival Time of injury Mechanism of injury Use of safety equipment (as
applicable)
Project Medical Record Monitor Tool Assessment
◦ Vital signs ◦ Presence of
Scalp abnormality (prior to CT scan) Emesis within last 24 hours Loss of consciousness Other body systems involved Focal neurologic findings/deficits Others
◦ Child abuse screening◦ Neurosurgical consultation
Reassessment and Discharge◦ Neurological reassessment◦ Disposition◦ Discharge instructions

Kuppermann N, et al. Identification of children at very low risk of clinically-important brain injuries after
head trauma: a prospective cohort study.
Lancet 2009; 374: 1160-1170.
25 participating EDs
Prospective cohort study
Analyzed 42,412 children (age 0-17 y/o) presenting to ED within 24 hours of head trauma with GCS scores of 14-15
Aim - identify children at very low risk of clinically-important traumatic brain injuries for whom CT might be unnecessary
Provides data to guide clinical decision making for children presenting with head injury. Suggested algorithm for children <2 years and those age 2 and older with GCS score of 14-15.
PECARN Publication
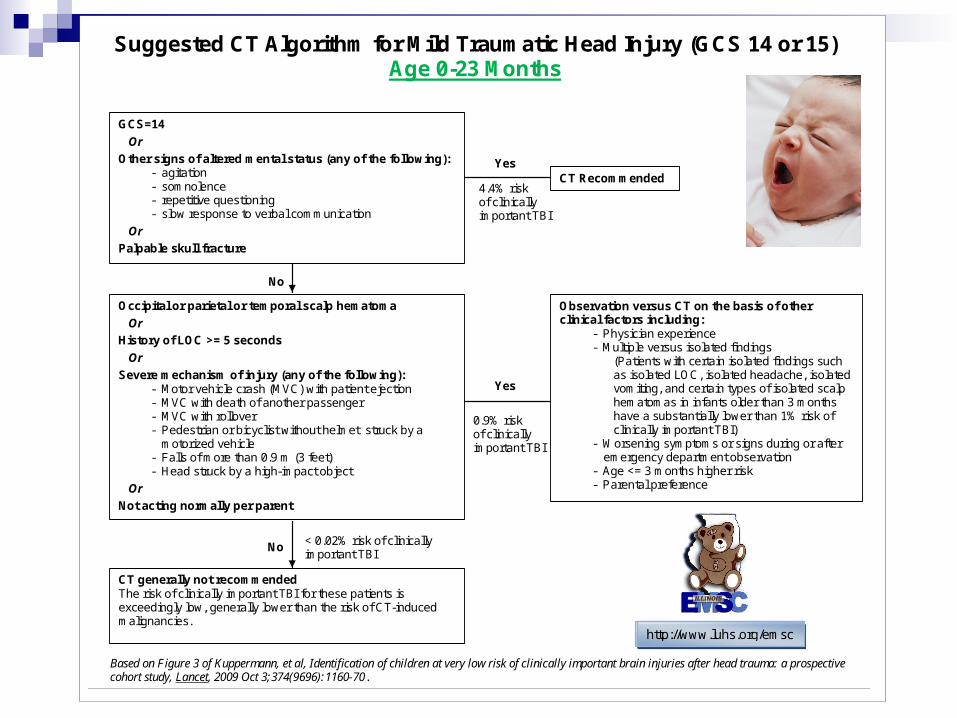
Suggested CT Algorithm for Mild Traumatic Head Injury (GCS 14 or 15) Age 0-23 Months
GCS=14
Or
Other signs of altered mental status (any of the following): - agitation - somnolence - repetitive questioning - slow response to verbal communication
Or
Palpable skull fracture
CT Recommended Yes
4.4% risk of clinically important TBI
No
Occipital or parietal or temporal scalp hematoma
Or
History of LOC >= 5 seconds
Or
Severe mechanism of injury (any of the following): - Motor vehicle crash (MVC) with patient ejection - MVC with death of another passenger - MVC with rollover - Pedestrian or bicyclist without helmet struck by a
motorized vehicle - Falls of more than 0.9 m (3 feet) - Head struck by a high-impact object
Or
Not acting normally per parent
No
CT generally not recommended The risk of clinically important TBI for these patients is exceedingly low, generally lower than the risk of CT-induced malignancies.
< 0.02% risk of clinically important TBI
Yes
Observation versus CT on the basis of other clinical factors including:
- Physician experience - Multiple versus isolated findings
(Patients with certain isolated findings such as isolated LOC, isolated headache, isolated vomiting, and certain types of isolated scalp hematomas in infants older than 3 months have a substantially lower than 1% risk of clinically important TBI)
- Worsening symptoms or signs during or after emergency department observation
- Age <= 3 months higher risk - Parental preference
0.9% risk of clinically important TBI
Based on Figure 3 of Kuppermann, et al, Identification of children at very low risk of clinically important brain injuries after head trauma: a prospective cohort study, Lancet, 2009 Oct 3;374(9696):1160-70.
http://www.luhs.org/emsc
http://www.luhs.org/emsc
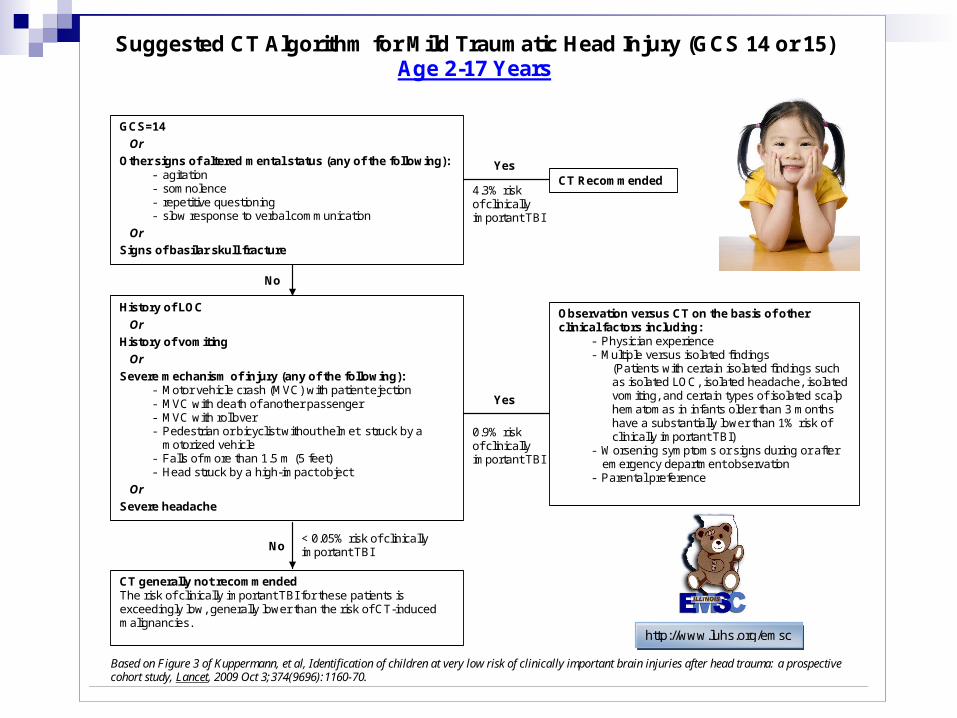
Suggested CT Algorithm for Mild Traumatic Head Injury (GCS 14 or 15) Age 2-17 Years
GCS=14
Or
Other signs of altered mental status (any of the following): - agitation - somnolence - repetitive questioning - slow response to verbal communication
Or
Signs of basilar skull fracture
CT Recommended Yes
4.3% risk of clinically important TBI
No
History of LOC
Or
History of vomiting
Or
Severe mechanism of injury (any of the following): - Motor vehicle crash (MVC) with patient ejection - MVC with death of another passenger - MVC with rollover - Pedestrian or bicyclist without helmet struck by a
motorized vehicle - Falls of more than 1.5 m (5 feet) - Head struck by a high-impact object
Or
Severe headache
No
CT generally not recommended The risk of clinically important TBI for these patients is exceedingly low, generally lower than the risk of CT-induced malignancies.
< 0.05% risk of clinically important TBI
Yes
Observation versus CT on the basis of other clinical factors including:
- Physician experience - Multiple versus isolated findings
(Patients with certain isolated findings such as isolated LOC, isolated headache, isolated vomiting, and certain types of isolated scalp hematomas in infants older than 3 months have a substantially lower than 1% risk of clinically important TBI)
- Worsening symptoms or signs during or after emergency department observation
- Parental preference
0.9% risk of clinically important TBI
Based on Figure 3 of Kuppermann, et al, Identification of children at very low risk of clinically important brain injuries after head trauma: a prospective cohort study, Lancet, 2009 Oct 3;374(9696):1160-70.
http://www.luhs.org/emsc

IL EMSC Educational Module (excerpt)Pediatric Mild Traumatic Head Injury
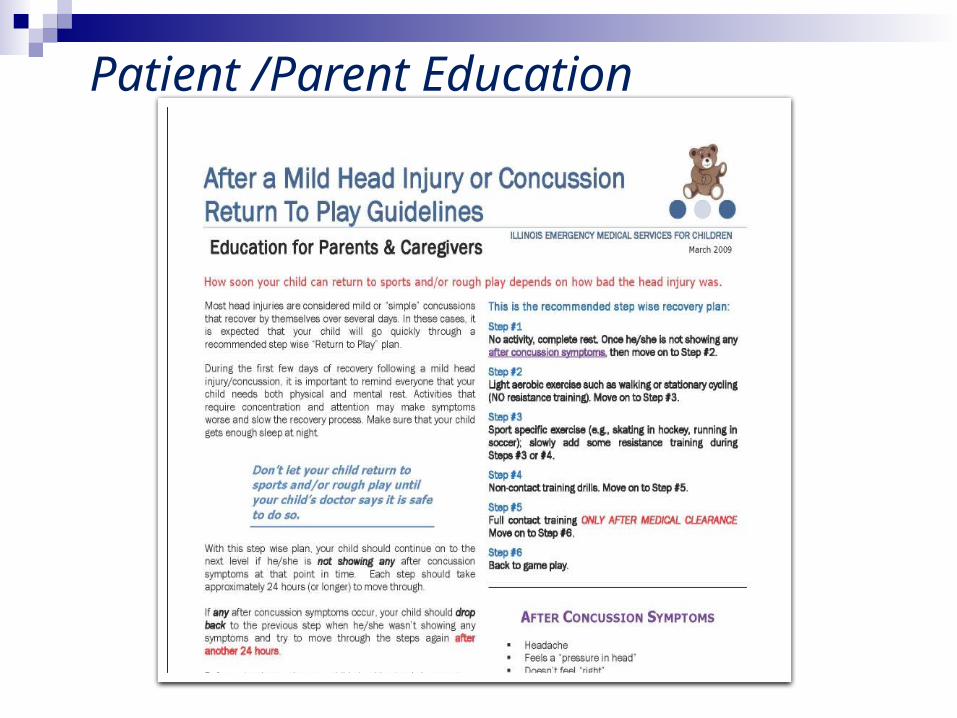
Patient /Parent Education

Response 112 hospitals responded in 2008 99 hospitals responded in 2009
Highlighted findings include: 57% respondents reported taking action (i.e. providing education or
revising documentation) as a result of participation in the statewide QI monitor. Over half of hospitals (52%) reported taking action related to their CT scanning practices based on participation in this project.
Slight increase in percentage of facilities with a policy, guideline or clinical pathway for traumatic head injury (increase from 28% in 2008 to 31% in 2009)
Policies that specifically addressed pediatrics increased from 42% in 2008 to 59% in 2009
Policies that include a process for screening for signs of child maltreatment/neglect increased from 58% in 2008 to 62% in 2009
Highlights: Survey
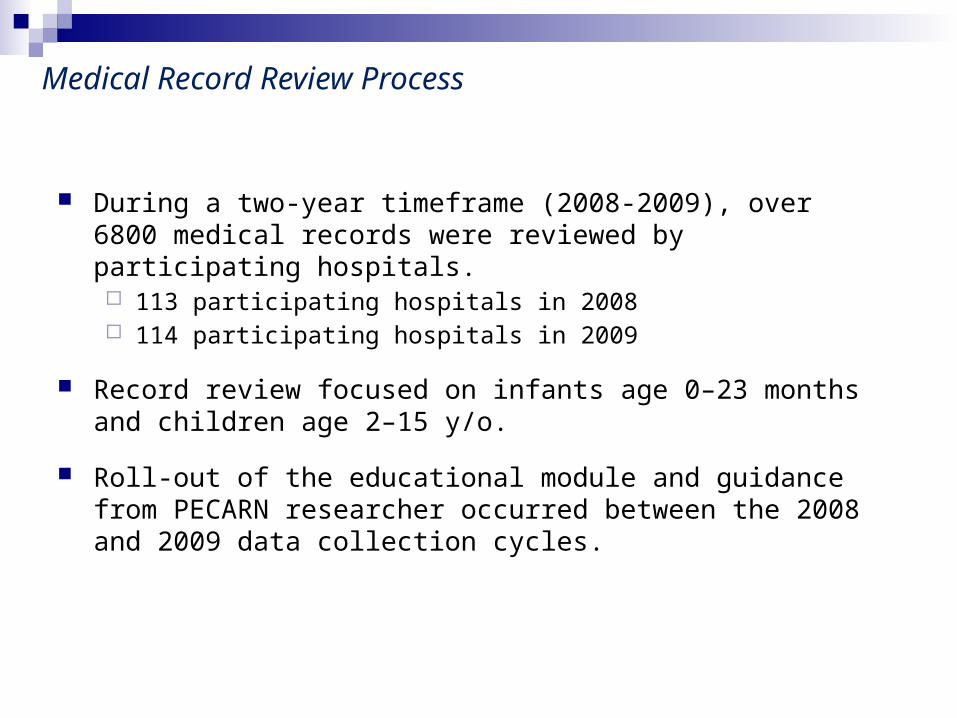
During a two-year timeframe (2008-2009), over 6800 medical records were reviewed by participating hospitals. 113 participating hospitals in 2008 114 participating hospitals in 2009
Record review focused on infants age 0–23 months and children age 2–15 y/o.
Roll-out of the educational module and guidance from PECARN researcher occurred between the 2008 and 2009 data collection cycles.
Medical Record Review Process
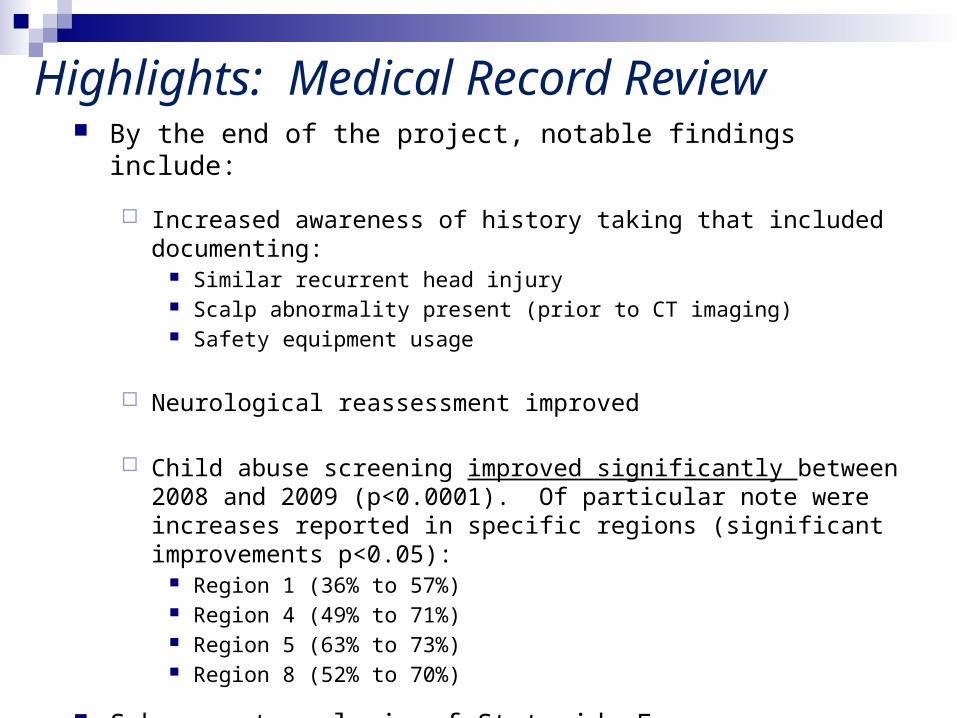
By the end of the project, notable findings include:
Increased awareness of history taking that included documenting: Similar recurrent head injury Scalp abnormality present (prior to CT imaging) Safety equipment usage
Neurological reassessment improved
Child abuse screening improved significantly between 2008 and 2009 (p<0.0001). Of particular note were increases reported in specific regions (significant improvements p<0.05):
Region 1 (36% to 57%) Region 4 (49% to 71%) Region 5 (63% to 73%) Region 8 (52% to 70%)
Subsequent analysis of Statewide Emergency Department data Suggests hospital participation in facility recognition was associated with lower
head CT usage in the ED
Highlights: Medical Record Review


Next Steps
Katherine Remick, MDAssociate Medical Director, Austin-Travis County EMS System
Pediatric Emergency Medicine, Dell Children’s Medical Center
Faculty, UTSW-Austin, Pediatric Emergency Medicine Fellowship
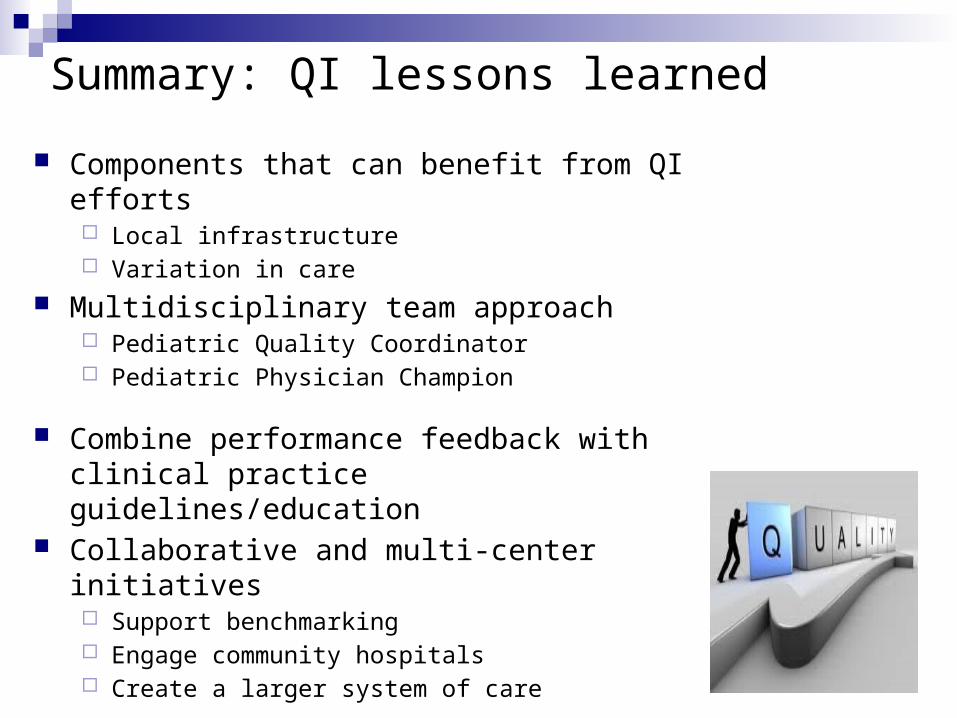
Components that can benefit from QI efforts Local infrastructure Variation in care
Multidisciplinary team approach Pediatric Quality Coordinator Pediatric Physician Champion
Combine performance feedback with clinical practice guidelines/education
Collaborative and multi-center initiatives Support benchmarking Engage community hospitals Create a larger system of care
Summary: QI lessons learned
Areas of Focus for Quality Improvement in Your ED
Family-centered/patient-centered care Cost Patient safety Best practices Efficiency
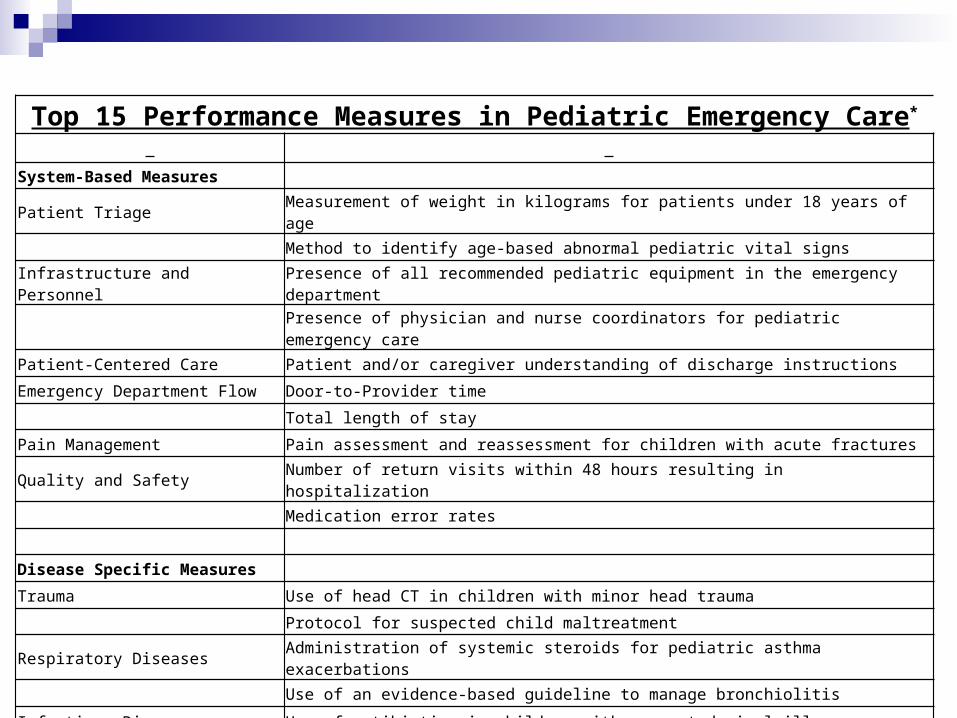
Top 15 Performance Measures in Pediatric Emergency Care*
System-Based Measures
Patient Triage Measurement of weight in kilograms for patients under 18 years of age
Method to identify age-based abnormal pediatric vital signs
Infrastructure and PersonnelPresence of all recommended pediatric equipment in the emergency department
Presence of physician and nurse coordinators for pediatric emergency care
Patient-Centered Care Patient and/or caregiver understanding of discharge instructions
Emergency Department Flow Door-to-Provider time
Total length of stay
Pain Management Pain assessment and reassessment for children with acute fractures
Quality and Safety Number of return visits within 48 hours resulting in hospitalization
Medication error rates
Disease Specific Measures
Trauma Use of head CT in children with minor head trauma
Protocol for suspected child maltreatment
Respiratory Diseases Administration of systemic steroids for pediatric asthma exacerbations
Use of an evidence-based guideline to manage bronchiolitis
Infectious Diseases Use of antibiotics in children with suspected viral illness*Based on the work of Alessandrini et al, 2011
The Business of QI: How to be an Effective Liaison Identify a team
Hospital/Administrative leadershipTechnical expertiseDay-to-day clinical leadership
Regular meetings and updates

Data Extraction
Identify a performance measure Data collection planning:
Specific data points Sources of information Timeline
Standardize the process Decide frequency of data measurement
Depends on area of focus
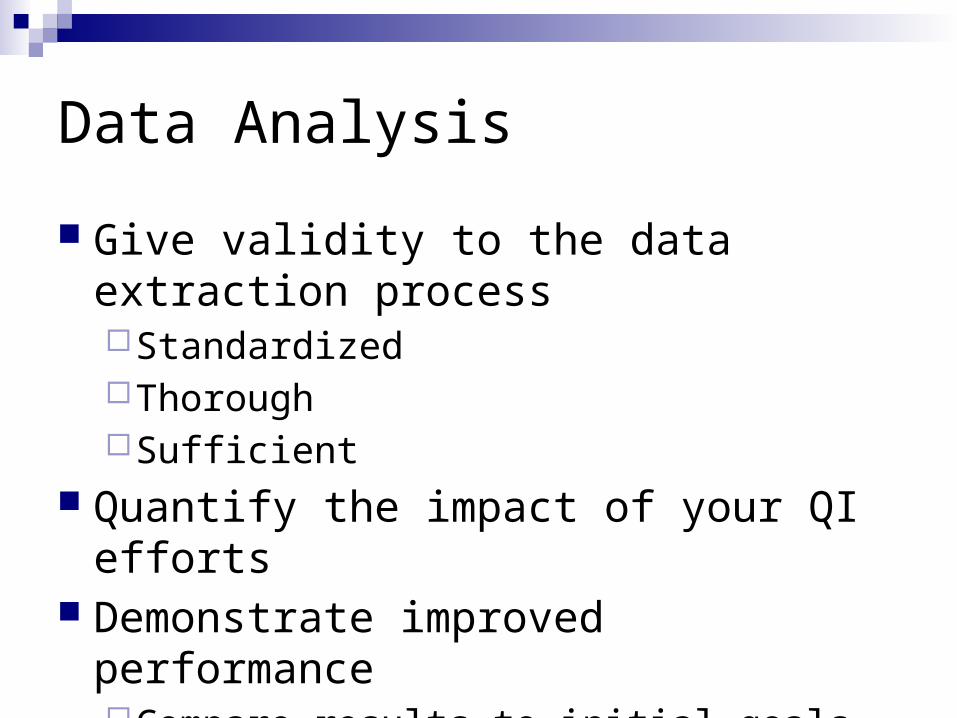
Data Analysis
Give validity to the data extraction processStandardizedThoroughSufficient
Quantify the impact of your QI efforts Demonstrate improved performance
Compare results to initial goals

Performance Management
Establish standards within your institution Define specific measures
InfrastructureServicesOutcomes
Measure and report on progress Ongoing QI program

Developing a Message for Leadership Demonstrate the value of the QI process
Financial incentives Quality of care
Minimize variation Improve overall efficiency and safety Utilize best practices Patient-centered
Accreditation Recognition as a regional expert and/or Patient-
Centered Medical Home

Assuring an excellent patient experience
QI education and culture change
Data/predictive analytics: measuring through meaningful metrics
The science
Measurement and analytics
The implementation
ImprovedPopulation
Health
Deployment strategy—Care
Process Teams
Evidence Integrated practice via
guidelines, order sets and measures
Using and innovating best
practices
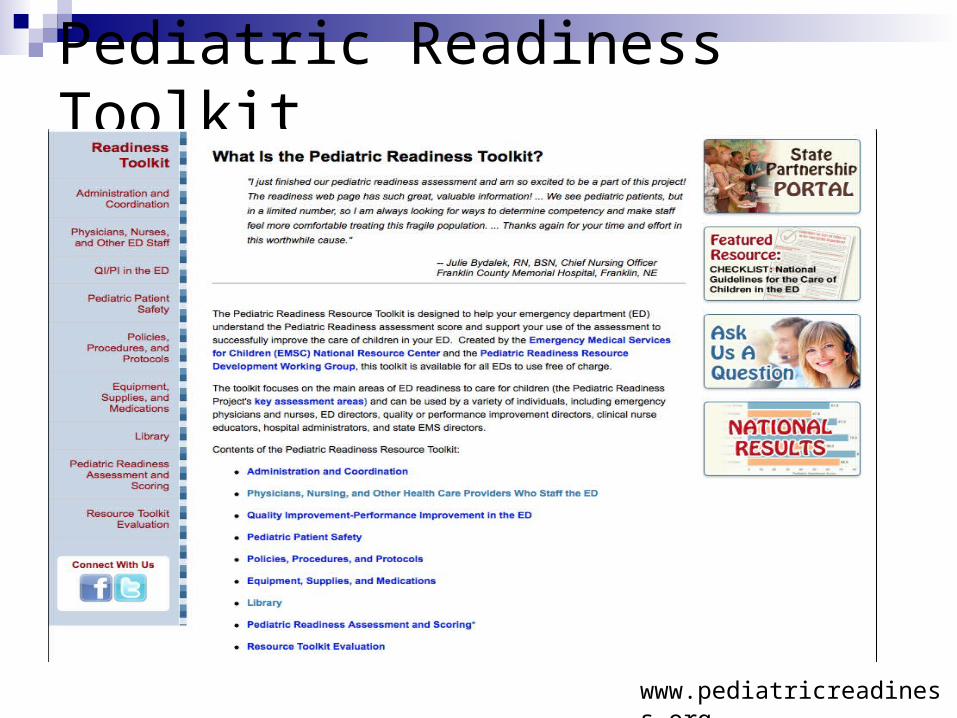
Pediatric Readiness Toolkit
www.pediatricreadiness.org

Questions and Discussion

CE Evaluation and Certificate
Continuing Education guidelines require that the attendance of all who participate be properly documented. Those who participate and wish to receive continuing education need to attend the activity in its entirety and complete the online evaluation by December 24, 2014. The online link will be available for one week to complete your evaluation.
The link to complete your online evaluation is: http://emscnrc.org/Events/Webinar_Evaluation.aspx (Note that you can only gain access to the page by copying and pasting the URL into your browser. )
If you need assistance accessing the online evaluation link, please contact Sametria McCammon ([email protected]). Your Continuing Education certificate will be automatically generated and emailed to you upon completion of the online evaluation.

Thank You for Joining Us!