emul296-pc user guide - nohau.comemul296 ™-pc user guide we would appreciate any feedback about...
TRANSCRIPT
1 ••
EMUL296™-PC
User Guide
We would appreciate any feedback about the product (including the manual)ranging from simple software defects to suggestions on how to
improve the examples.
Thank You.
•• 3 Table of Contents
EMUL296™-PC
User Guide
Copyright © 1996 by ICE Technology
ICE Technology Tel: 650.375.0409 - 800.686.6428Fax: 650.375.0409BBS: 650.375.8666
URL: http://www.icetech.comE-Mail: [email protected]
All rights reserved worldwide.Edition 1
Development Team: Documentation:Jim Hayes
Michael BartolJoey Zhuo
Jörgen Andersson
Jim HayesWolfgang WendlerJörgen Andersson

•• 4 Table of Contents
Warranty Information
The EMUL296™-PC Emulator board, Trace board, Pods, Emulator Cable, and LanICEhardware are sold with a one-year warranty starting from the date of purchase. Defectivecomponents under warranty will either be repaired or replaced at ICE Technology discretion.
Pods that use a bond-out processor are also warranted for one year from the date ofpurchase except for the processor. The bond-out processor will be replaced once if supportdetermines that the failure in the bond-out processor was not due to user's actions. Thisreplacement limit does not apply to the rest of the pod.
Each optional adapter, cable, and extender is sold with a 90-day warranty, except that itmay be subject to repair charges if damage was caused by the user's actions.
The EMUL296™-PC Emulation software is sold with no warranty, but upgrades will bedistributed to all customers up to one year from the date of purchase.
ICE Technology makes no other warranties, express or implied, including, but notlimited to, the implied warranties of merchantability and fitness for a particular purpose. Inno event will ICE Technology be liable for consequential damages. Third-party softwaresold by ICE Technology carries the manufacturer's warranty.
Warning: Always turn on the emulator before applying power to the target. Always turn off the targetpower before turning off the emulator power.

•• 5 Table of Contents
Table of Contents
Table of Contents 5
Introducing EMUL296™-PC 9
Introduction to EMUL296™-PC .......................................................................................... 9How to use this manual ........................................................................................................ 9
If you are new to emulators of any kind .................................................................. 9If you have used emulators with other microprocessors........................................... 9If you are familiar with emulators, MS Windows, and the chip,............................ 10
Manual Conventions .......................................................................................................... 10Quick Installation Instructions ........................................................................................... 10
System Requirements ........................................................................................... 10Quick Setup Instructions ...................................................................................... 10
Installing the Emulator ...................................................................................................... 10Installing the Trace Board (If Used) ................................................................................... 11Installing the Pod............................................................................................................... 11Installing the Software ....................................................................................................... 12Initial Software Configuration............................................................................................ 12Confidence Test ................................................................................................................. 13Quick Start Instructions ..................................................................................................... 13
Chapter 1: Software User Interface 17
Detailed Software Installation Instructions ......................................................................... 17Initial Software Configuration............................................................................................ 17Configuring the Software ................................................................................................... 18Projects .............................................................................................................................. 18Creating a Project .............................................................................................................. 19Setting the Paths .. ............................................................................................................. 19Mapping memory............................................................................................................... 21Emulator Hardware Configuration ..................................................................................... 21
Setting the Chip Config Registers......................................................................... 22Miscellaneous bits ................................................................................................ 24
Miscellaneous Configuration.............................................................................................. 25Enable Code Space Limits.................................................................................................. 26Window Colors .................................................................................................................. 27Reset vs. Full Reset ............................................................................................................ 28Trace Config Menu ............................................................................................................ 29Fast Break Write ................................................................................................................ 29Memory Coverage.............................................................................................................. 30
Summary Memory Coverage Report ..................................................................... 32Detailed Memory Coverage Report ....................................................................... 33
Performance Analysis ........................................................................................................ 33Menus................................................................................................................................ 36
File Menu............................................................................................................. 36Programming External FLASH Memory .............................................................. 37Programming Algorithms..................................................................................... 38View/Edit Menu ................................................................................................... 40Run Menu ............................................................................................................ 41

•• 6 Table of Contents
Breakpoints Menu ................................................................................................ 42Config Menu ........................................................................................................ 44Program Menu ..................................................................................................... 45Source Menu ........................................................................................................ 46Data Menu ........................................................................................................... 46ShadowRam Menu ............................................................................................... 47Register Menu ...................................................................................................... 47Trace Menu.......................................................................................................... 47Stack Menu .......................................................................................................... 47Watch Menu......................................................................................................... 48Window Menu...................................................................................................... 48Help Menu ........................................................................................................... 50
Dialog Boxes...................................................................................................................... 50Child Windows .................................................................................................... 50Register Windows ................................................................................................ 50Data and Shadow RAM Windows ........................................................................ 51Custom Display Format........................................................................................ 52Program Windows................................................................................................ 52In-line Assembler ................................................................................................. 53Source Windows................................................................................................... 53Trace Window...................................................................................................... 54Other Windows .................................................................................................... 54Inspect Window.................................................................................................... 55Watch Window..................................................................................................... 55Evaluate Window ................................................................................................. 55Stack Window ...................................................................................................... 55RTXC Window .................................................................................................... 56
Tool Bar............................................................................................................................. 56Help Line........................................................................................................................... 56Dynamic Data Exchange.................................................................................................... 57
Chapter 2: Emulator Macro User Guide 59
Introduction ....................................................................................................................... 59General description of the emulator macro setup .................................................. 59Visual Basic Supplemental User Guide................................................................. 59General information ............................................................................................. 60Procedure for writing a macro .............................................................................. 60Subroutine Reference............................................................................................ 64Windows API ....................................................................................................... 64Nohau Subroutines ............................................................................................... 64
Chapter 3: Emulator Board 69
EMUL/LC-ISA Emulator Board......................................................................................... 69Detailed Installation Instructions........................................................................................ 70
Setting the I/O address jumpers -- J1 .................................................................... 70Setting the Target Communication Rate -- Header JP1 ......................................... 70Communication Rate Jumper................................................................................ 71Trace Clock Rate.................................................................................................. 71The PWR Header -- JP2........................................................................................ 71Power Supply to Pod / Target ............................................................................... 71
Chapter 4: Trace Board 73

•• 7 Table of Contents
Trace Board Introduction ................................................................................................... 73Trace Board Detailed Installation Instructions ...................................................... 73External Inputs and Controls ................................................................................ 73
Introduction to Tracing ...................................................................................................... 75Triggers and Hardware breakpoints ...................................................................... 75
Trace Window ................................................................................................................... 76Pipeline Effects .................................................................................................... 76Bus Cycle Order ................................................................................................... 76Bus Width ............................................................................................................ 76
Trace Menu........................................................................................................................ 76Find Frame number .. ........................................................................................... 76Search Address .................................................................................................... 76Search Next Address ............................................................................................ 77Search Previous Address ...................................................................................... 77Find Trig point..................................................................................................... 77Save trace as text .. ............................................................................................... 77Show misc. data ................................................................................................... 78Show timestamp................................................................................................... 78Benchmarking Using Timestamp ......................................................................... 78Relative timestamp............................................................................................... 78T = 0 at Cursor..................................................................................................... 79Convert cycles to time .......................................................................................... 79Synchronize program window .............................................................................. 79Trace setup .......................................................................................................... 79Toggle trace (stop/run) ......................................................................................... 80
Trace Setup Dialog Box ..................................................................................................... 80Board Installed ..................................................................................................... 80Address ................................................................................................................ 80Trace Memory...................................................................................................... 80Triggers ............................................................................................................... 80Filter Mode: Normal............................................................................................. 82Extend Recording................................................................................................. 83Filter Mode: Window ........................................................................................... 84Editing the Trigger Conditions............................................................................. 84Break Emulation? Box.......................................................................................... 85
Chapter 5: Pod Boards 87
Features Common to All Pods ............................................................................................ 87How It Works ....................................................................................................... 87Stack Pointer ........................................................................................................ 87Indicator Lights.................................................................................................... 87How to Break Two Emulators Simultaneously ...................................................... 88Trace Input Pins ................................................................................................... 88Duplicate Resources ............................................................................................. 88Configuration Requirements................................................................................. 89Internal Addressing or Single Chip Mode............................................................. 89
Chapter 6: POD-296-256-SA-50 91
Introduction ....................................................................................................................... 91Dimensions .......................................................................................................... 92POD-296-256-SA Emulation Memory.................................................................. 93Wait States ........................................................................................................... 93
•• 8 Table of Contents
Breakpoints .......................................................................................................... 94POD-296-256-SA Headers.................................................................................... 94
Chapter 7: Accessories 99
Overview ........................................................................................................................... 99Surface-mount QFP adapters - SA Family .......................................................................... 99Surface-mount SQFP Adapters......................................................................................... 104Compilers ........................................................................................................................ 108
BSO/Tasking...................................................................................................... 108IAR Systems Software, Inc. ................................................................................ 108
Chapter 8: Troubleshooting 109
Troubleshooting Overview ............................................................................................... 109Step 1: Board I/O Addresses............................................................................... 109Step 2: .INI Editor .............................................................................................. 109Step 3: PWR and XTAL jumpers........................................................................ 110Step 4: I/O On Addresses Pins............................................................................ 110Step 5: Chip Configuration Bytes (CCB's) .......................................................... 111Step 6: The Stack Pointer ................................................................................... 111Step 7: Interrupt Vectors .................................................................................... 111Step 8: Sample User Program............................................................................. 111
EMUL296-PC Introducing EMUL296™-PC
Copyright 1996 ICE Technology •• 9
Introducing EMUL296™-PC
Introduction to EMUL296™-PC
The EMUL296™-PC is a personal computer based in-circuit emulator for Intel's 80C29616-bit family of microcontrollers. EMUL296™-PC consists of an emulator "plug-in" board, afive foot (1.5 m) cable, various pod boards and an optional trace board. The EMUL296™-PC design supports all Intel microcontrollers that are based on the 80C296SA core.
The EMUL296™-PC software is a Microsoft Windows 3.x / `95 / NT application. It followsthe MS Windows Multiple Document Interface Standard, resulting in the same look and feelas applications produced by Microsoft and others for MS Windows.
The EMUL296™-PC user interface is consistent with most other MS Windows applicationsand includes dynamically changing menus, moveable and scrollable "child" windows,function key shortcuts for menu items, and context sensitive help. Anyone familiar with MSWindows applications will be able to use EMUL296™-PC with little or no other assistance.It also supports the MS Windows Dynamic Data Exchange protocol and can export datawritten to RAM to other MS Windows applications.
The EMUL296™-PC hardware is modular. The software user interface implements aneffective high level debugger. It has support for local variables, C typedefs, and Cstructures. The Trace board options add bus cycle tracing, triggering and filtering functions.
How to use this manual
This manual was written with different kinds of users in mind. All users should have MSWindows installed and have learned the skills taught in the Basic Skills chapter of theMicrosoft Windows User's Guide. It also assumes a basic familiarity with the chip you areusing. Many of the EMUL296™-PC features are designed around the features of thesupported chips. Being familiar with the chip is a prerequisite to understanding how to usethe emulator productively.
If you are new to emulators of any kind
read the manual completely, including the reference chapters. You may skip the sectionsthat describe pods items you do not have.
If you have used emulators with other microprocessors
and understand the difference between a hardware breakpoint and a software breakpoint,but are not familiar with the chip being emulated, you are strongly encouraged to reviewthe features of the chip you have, then thoroughly read the section that describes theapplicable pod before running the emulator.

EMUL296-PC Introducing EMUL296™-PC
Copyright 1996 ICE Technology •• 10
If you are familiar with emulators, MS Windows, and the chip,
read the Emulator Board and Software User Interface Chapters, skim the section thatdescribes the pod you are using, and then begin using EMUL296™-PC, referring to on-linehelp, when needed. After a few days of use, skimming the Reference chapters mayhighlight useful features.
Manual Conventions
Type the words in double quotes exactly as shown (without the quotations) except for the<Enter>, <Ctrl>, <Tab>, and <Alt> keys. Use the <Alt> and <Ctrl> keys like shift keys. Holdthem down while you press the key that follows them in the text. For example, if the textinstructs you to type <Alt>F, press down and hold down the <Alt> key then press the F key.
Window names and labels that appear on the screen are printed in bold to set them apartfrom the rest of the text.
Notes and hints are printed in italics, and warnings have a box around them to set themapart from the rest of the manual text. Pay careful attention to them.
Quick Installation Instructions
System Requirements
EMUL296™-PC requires a personal computer with at least one free ISA (or EISA) bus slot.The PC must also have at least 2 megabytes of RAM, a CPU that is either 80386, 80486,or Pentium compatible, a hard disk with at least 3 megabytes of unused space andMicrosoft Windows 3.1 (or higher), Windows `95, Windows NT or OS/2 2.1 (or higher)installed. A mouse is not required, but is strongly recommended.
Quick Setup Instructions
The hardware and software are designed to be easily installed and quickly running on mostpersonal computer systems. Users can normally begin using their emulator (without yetconnecting to the target) after following these initial steps. However, if you are new topersonal computers, if you are unsure about what to do after reading the quick installationinstructions, or if your emulator does not work after you follow these instructions, follow thesteps for installing and configuring each board and the software as outlined in theirrespective chapters.
Installing the Emulator
Installing the emulator board is much like installing most other AT-style boards:
1. Turn off the power.
2. Remove the PC cover.
3. Remove the slot cover (if present) for an available 8 bit slot.

EMUL296-PC Introducing EMUL296™-PC
Copyright 1996 ICE Technology •• 11
4. Insert the emulator board into the slot and use a screw to secure the emulator.
5. You can now close the cover, and attach the cable to the emulator and the pod.
Installing the Trace Board (If Used)
1. Turn off the power.
2. When you assemble the pod and the trace, make sure that you have the boardsaligned as shown below:
POD (top)
TRACE (top)
Connectors
Figure 1. Assembling Pod and Trace Boards
Note: Please be aware that you’ll have to apply a fair amount of even force on the two boards tomake them snap together. Make sure that all connectors and pins are aligned so they willfit together properly.
1. Finally start the EMUL296™-PC program.
Note: It is not intended that you, as a customer, should disassemble the trace fromthe pod board once they have been assembled. ICE Technology is not responsiblefor personal injury caused by trying to separate the EMUL296-PC pod boardfrom the EMUL296-PC trace board.
Installing the Pod
With the PC power off, line up the cable connector with the slot on the emulator board, andinsert. There is no lock, but friction will secure the cable adequately. On the other end ofthe cable, insert the cable connector firmly, and tighten the screws. Remove any antistaticfoam from pins. Before attaching the pod to your target, it is a good idea to power up thePC, install the software, and follow the procedures described in the section titled"Confidence Test" on page 13.
EMUL296-PC Introducing EMUL296™-PC
Copyright 1996 ICE Technology •• 12
Installing the Software
To install this software, run SETUP.EXE by typing "WIN A:SETUP" at the DOS prompt or,from within MS Windows, by selecting the RUN item in the Program Manager File menuand typing "A:SETUP" as the file to run. A dialog box will ask for a directory for theEMUL296™-PC software. You will be asked if you have a Win NT PC. Either accept thesuggested directory or type a different one. SETUP will uncompress and copy the filesfrom the floppy to the hard disk directory specified and change the paths in the ".ini" file.When installed, there will be a EMUL296 program group containing the EMUL296 icon.Double-clicking on this icon will start the EMUL296™-PC application.
The program group will also contain icons for several .wri files. These files containimportant information about what has been fixed in the latest revisions of the software andproblems that we know about that have not been fixed yet. Please take the time to readthese files.
Initial Software Configuration
The Windows software is used for all EMUL296-PC products. The type of target processorin the software configuration must agree with the type of pod you are using. If not, you maysee an error message. To ensure that you do not get this error, we include a utility thatyou should run when you first install the emulator, and possibly again when youchange your pod type. This utility is called INI296. (You can also run this utility any time youwant to check the values in the initialization file.)
To invoke INI296, double click on the icon in the EMUL296 program group labeled INI296.If the EMUL296.INI settings are not self-consistent, you will see a warning message,otherwise you will see the window shown in Figure 2.
To correctly configure your software to match your hardware, start by selecting the pod thatmatches your pod type. If your pod cannot address memory above 64K, put a check markin the PC<64K box. If the pod you are using can address memory above 64K, either selectPC<64K (because you are not using the extra addressing) or leave the box unchecked andmake sure that the jumpers TRA16 through TRA19 match the field labeled Address fromA0 to ... For example: if TRA16 is in the EA16 position but the reset is in the GND position,click on the button labeled A16. If all the TRA headers are in the EAxx position, click on thebutton labeled A19.

EMUL296-PC Introducing EMUL296™-PC
Copyright 1996 ICE Technology •• 13
Figure 2: Choosing a target processor with INI296
Make sure that the Trace Port: field is the same as the Emulator Port: field, click on theOK button or press <Enter>. The Emulator Port: field must agree with the values you setin the J2 jumper on the emulator board, as described in the section, "Setting the I/Oaddress jumpers – J1" on page 70.
After you have set up the initial processor type and I/O addresses, you can start theemulator application. You are done with installation.
Confidence Test
Before starting the emulator software and before connecting the pod to your target, run theconfidence test installed along with the emulator program. An icon labeled "ConfidenceTest" will be in the Nohau group. Double-click on it to start the Confidence Test.
The confidence test will read the Pod name and I/O address from the EMUL296.ini file. Ifthese values are incorrect, you must run ini296.exe. It will take less than a minute tocomplete the tests. Many of the tests repeat with slight variations. If any tests reportunexpected errors, call or email [email protected] customer support for assistance.
Quick Start Instructions
This section describes how to quickly start using EMUL296™-PC to debug an existingprogram or target board once the EMUL296™-PC hardware is installed and the userinterface software is running.
To load and execute a program:
1. Select Load code .. from the File menu and identify the "absolute" file to load by usingthe dialog box
2. Click the Reset button.
Note: If you do not have code to load, do the following to enter your own smalluser program:

EMUL296-PC Introducing EMUL296™-PC
Copyright 1996 ICE Technology •• 14
click in the Program Window
type <Ctrl>-A
type in address 2080 (FF2080 if PC > 64K)
type <Ctrl>-N to force the program counter to address 2080
hit <Enter>
type: NOP <Enter>
NOP <Enter>
LJMP 2080 <Enter>then continue with item 3 below.
3. Click on the GO button in the tool barTo set a software breakpoint:
1. Click twice on the desired instruction in any Program window, or
2. Click once on the address in any Program window, or
3. Click once on the line number for the desired instruction in any Source window.To make a software breakpoint inactive either:
1. Click on the desired breakpoint in any Program or Source window, then press F2, or
2. Select Setup .. from the Breakpoints menu, click on the breakpoint, click on theToggle button, or
3. Highlight (click once on) the breakpoint and select Toggle Breakpoint from theProgram or Source menu, or
4. Highlight (click once on) the breakpoint and select Toggle from the Breakpoints menu.To delete a breakpoint either:
1. Select Setup .. from the Breakpoints menu, click on the breakpoint, click on the Deletebutton, or
2. Select Delete All from the Breakpoints menu.To use the in-line assembler to change the program loaded:
1. Scroll a Program window until it shows the address to be changed or hit <Ctrl>A andtype in the desired address
2. Highlight the instruction to be changed with the cursor or arrow keys
3. Type the desired mnemonic (this will open an Enter new instruction: dialog box) andhit <Enter>.
To change a RAM value:
1. Scroll a Data window until it shows the address to be changed
2. Highlight the address to be changed with the cursor or arrow keys
3. Type the desired value (this will open an Enter data dialog box) and hit <Enter>.

EMUL296-PC Introducing EMUL296™-PC
Copyright 1996 ICE Technology •• 15
Warning: Always turn on the PC before applying power to the target. Always turn off the targetpower before turning off the PC power.

EMUL296-PC Chapter 1: Software User Interface
Copyright 1996 ICE Technology •• 17
Chapter 1: Software User Interface
Detailed Software Installation Instructions
Before installing the software, it is important to have a basic understanding of how tooperate MS Windows. For help mastering MS Windows, please refer to the MicrosoftWindows User's Guide.
The EMUL296™-PC floppy disk includes an MS Windows compatible SETUP.EXEprogram. To install this software, run SETUP.EXE by typing "WIN A:SETUP" at the DOSprompt before entering Windows or, from within MS Windows, by selecting the RUN item inthe Program Manager File menu and typing "A:SETUP" as the file to run. A dialog box willask for a directory for the EMUL296™-PC software. You will be asked if you have a WinNT PC. Either accept the suggested directory or type a different one. SETUP will copy filesfrom the floppy to the hard disk directory specified and change the various MS Windows".ini" files as needed. When installed, there will be a EMUL296 program group with severalicons such as an EMUL296 icon and an icon for the confidence test, CONF.EXE. Double-clicking on the emulator icon will start the EMUL296™-PC application. If you wish to movethe icon to another group, you may do so by using the Move... menu item in the ProgramManager's File menu or by dragging the icon to the new group.
Initial Software Configuration
The Windows software is used for all EMUL296™-PC products. The type of targetprocessor in the software configuration must agree with the type of pod you are using. Ifnot, you may see an error message. To ensure that you do not get this error, weinclude a utility that you probably want to run when you first install the emulator, andpossibly again when you change your pod type. This utility is called INI296. (You can alsorun this utility any time you want to check the values in the initialization file.)
To invoke INI296, double click on the icon in the EMUL296 program group labeled INI296.If the EMUL296.INI settings are not self-consistent, you will see a warning message,otherwise you will see the window shown in Figure 3.
To correctly configure your software to match your hardware, start by selecting the pod thatmatches your pod type. If your pod cannot address memory above 64K, put a check markin the PC < 64K box. If the pod you are using can address memory above 64K, eitherselect PC < 64K (because you are not using the extra addressing) or leave the boxunchecked and make sure that the jumpers TRA16 through TRA19 match the field labeledAddress from A0 to ... For example: if TRA16 is in the EA16 position but the reset are inthe GND position, click on the button labeled A16. If all the TRA headers are in the EAposition, click on the button labeled A19.

EMUL296-PC Chapter 1: Software User Interface
Copyright 1996 ICE Technology •• 18
Figure 3: Choosing a target processor with INI296
Make sure that the Emulator Port address and Trace Port address are the same. Afteryou have set the Emulator Port: and Trace Port: fields, click on the OK button or press<Enter>. The Emulator Port: field must agree with the values you set in the J1 (address)jumper on the low cost emulator board, as described in the section , "Setting the I/Oaddress jumpers – J1" in the Emulator chapter.
After you have set up the initial processor type and I/O addresses, you can start theemulator application. You are done with installation.
Configuring the Software
If the Quick Installation instructions do not work, you will most likely need to adjust eitherthe hardware jumpers, the software configuration, or possibly both. Please refer to theappropriate chapters for setting the jumpers on the Emulator board or the Pod board. Thenext few pages describe all of the items in the Config menu. Use these menu items toexamine the software configuration in detail and to change it if needed.
Projects
A project is a collection of software configuration settings that areall associated with a specific person, target, or softwaredevelopment project. This menu item opens a dialog box thatallows you to set up named configurations or projects. This is firstin the menu and described first because all of the other Configmenu item settings will be stored as settings for the currentproject in a file with a ".PRO" suffix. There is an ".INI" file andthose settings are used if there is no current project. But if the".INI" file contains the name of the current project, all softwaresettings are taken from ".PRO" file for that project.
Projects behave differently than, for instance, a word processing document. All softwareconfiguration settings are written to disk every time you change projects or whenever youexit the emulator software. There is no "exit without saving changes" option. Once you
EMUL296-PC Chapter 1: Software User Interface
Copyright 1996 ICE Technology •• 19
make a change to the configuration, it is immediately effective and will, unless youmanually undo the change, be saved to the disk in the project file.
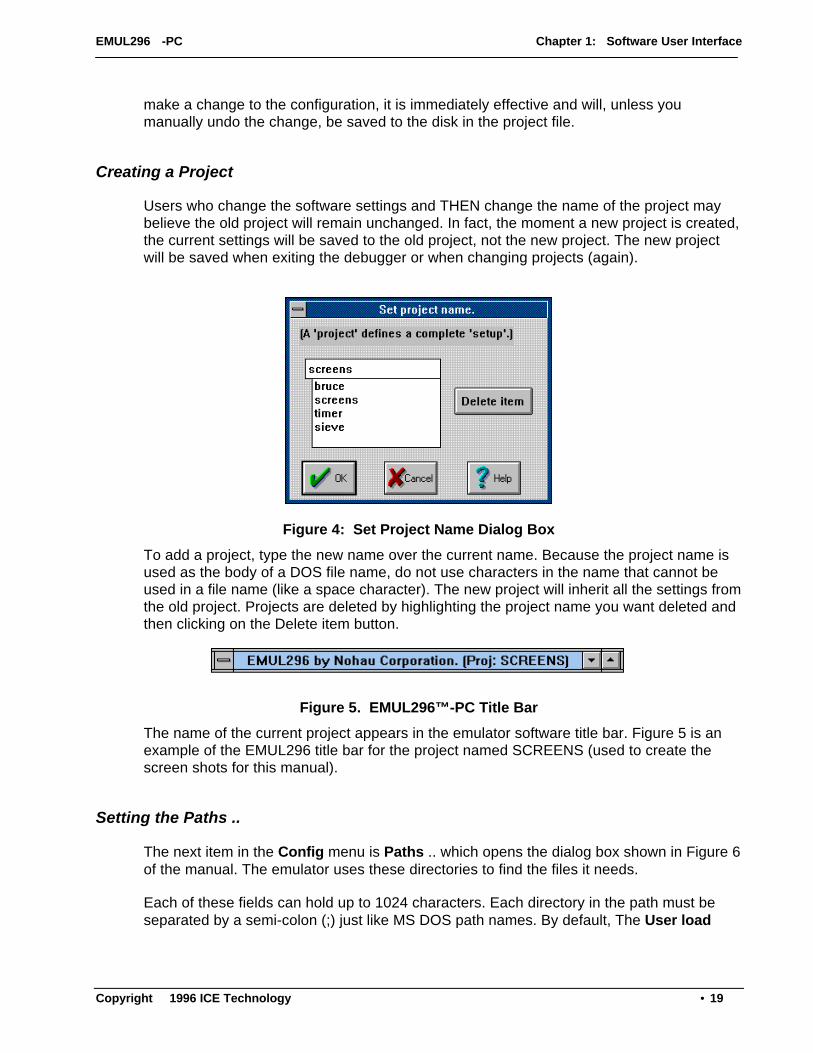
Creating a Project
Users who change the software settings and THEN change the name of the project maybelieve the old project will remain unchanged. In fact, the moment a new project is created,the current settings will be saved to the old project, not the new project. The new projectwill be saved when exiting the debugger or when changing projects (again).
Figure 4: Set Project Name Dialog Box
To add a project, type the new name over the current name. Because the project name isused as the body of a DOS file name, do not use characters in the name that cannot beused in a file name (like a space character). The new project will inherit all the settings fromthe old project. Projects are deleted by highlighting the project name you want deleted andthen clicking on the Delete item button.
Figure 5. EMUL296™-PC Title Bar
The name of the current project appears in the emulator software title bar. Figure 5 is anexample of the EMUL296 title bar for the project named SCREENS (used to create thescreen shots for this manual).
Setting the Paths ..
The next item in the Config menu is Paths .. which opens the dialog box shown in Figure 6of the manual. The emulator uses these directories to find the files it needs.
Each of these fields can hold up to 1024 characters. Each directory in the path must beseparated by a semi-colon (;) just like MS DOS path names. By default, The User load

EMUL296-PC Chapter 1: Software User Interface
Copyright 1996 ICE Technology •• 20
modules: field will contain the directory from the last loaded object file, and the Emulatorinternal files: field will contain the directory where the emulator files were installed.
The Load path: directory is the default directory searched for Intel Hex files and absoluteobject files. Any directory can be specified when loading a module, but the directory shownhere is the default. The .ext field specifies the default file extension. Files in a directory withthis extension will be shown in the Source Window.
Figure 6: Paths Dialog Box
With many compilers, the full path name of the source file is contained within the objectfile. Linked object files consisting of several linked objects will, correspondingly, haveseveral source file names and paths. If that source file name exists in the object file thatEMUL296™-PC is loading, the debugger will look for that source file when updating theSource window.
The second field, Source paths: identifies other directories to search for missing sourcefiles not identified in the object file or files moved since the compile. The directories in thisfield must be entered by the user. Once entered, directories will stay here until removed bythe user. The small check box, when checked, will tell EMUL296™-PC to look for sourcefiles in the Load path: directory as well. Simple projects may have all the source and objectfiles in the same directory (the Load path:) and may not need any directories in the Sourcepaths: field.
Note: The ".ext" field specifies the source file extension. If your C modules havethe extension ".c", enter that. To see assembler source (.asm) in the Sourcewindow, enter ".asm" .
The Emulator internal files: field will be set during the installation and probably will not needto be changed. Emulator internal files: is the directory the application uses to find thevarious support files that are part of the EMUL296™-PC software such as registerdefinition files and dynamically loaded libraries. Normally, the installation program will setthis to the proper directory. If you copy or move EMUL296™-PC to a new directory or diskdrive, remember to change this field also.

EMUL296-PC Chapter 1: Software User Interface
Copyright 1996 ICE Technology •• 21
Mapping memory
ROM and RAM on the target can be emulated by RAM on the pod board. This RAM iscalled emulation RAM. The entire address range for both ROM and RAM can be mappedto either the target or the emulator in blocks as small as the chip selects specifies. This iscontrolled by jumpers and the chip selects on the CPU.
When an address is mapped to emulation RAM on the pod, all READ, WRITE, andinstruction fetch cycles to that address are directed to emulation RAM. Target RAM, targetROM, and memory mapped devices on the target at that address are ignored. If your targethas a memory mapped I/O device within a block mapped to emulation RAM, this mappingwill prevent your application from accessing that device. To avoid this, map the blocks thatcontain target devices to the target.
Note: On reset, the emulator software will write to the CS0 registers so that CS0 will cover theentire 16 Mb memory range. This will map all memory to the pod when a jumper shunt ison JP24 (CS0) and ensure that the code can be loaded to the pod.
Emulator Hardware Configuration
Warning: The settings in this dialog box must agree withthe emulator jumper settings, the pod processortype, and the application startup code. If this isnot the case, EMUL296™-PC will not workproperly.
The Emulator Hardware .. menu item configures thesoftware to correctly communicate with the hardware.
The Emulator Port value must agree withthe jumper settings on the low cost emulatorboard header J1. (See "Setting the I/Oaddress jumpers – J1" in the Emulatorchapter). If they do not agree, theEMUL296™-PC software will not be able tocommunicate with the hardware, and thedialog box in Figure 7 will automatically bedisplayed, as a reminder that communicationhas failed and some change is needed.
Figure 7. Failed Communication Dialog Box

EMUL296-PC Chapter 1: Software User Interface
Copyright 1996 ICE Technology •• 22
Figure 8. Hardware Configuration Dialog Box
Setting the Chip Config Registers
Most of the Hardware Configuration dialog box controls how EMUL296™-PC manipulatesthe Chip Select registers. allowing the controller to read them after each reset. Normally,EMUL296™-PC must update the Chip Config registers before each reset. If it did not, theemulator might not be able to write to emulation RAM. It might be unable to load code, ortoggle breakpoints, etc.
Figure 9. Processor List Box
The processor list box lets you choose the kind of processor being emulated. This settingmust agree with the kind of processor you are using in the target or the emulator will notwork correctly. If you must change the processor type, select the correct processor fromthe list, ignore any errors, ignore any warnings that appear at this point, exit the emulatorHardware Configuration dialog box, and select Full Reset from the Config menu. Choosethe Full Reset menu item before you do anything else, or push Reset in the dialog box andthen click OK.

EMUL296-PC Chapter 1: Software User Interface
Copyright 1996 ICE Technology •• 23
Figure 10. Wait States field
The box labeled Wait States: will let you select the number of wait states (for CS0) thechip will use when accessing external memory. Emulation RAM is fast enough to respondwith 0 wait states. Target RAM may or may not be fast enough, depending upon the speedof the chips on your target. Selecting the infinite button requires that the target hardwarecorrectly assert the READY signal when the data on the bus is valid.
Figure 11. Setting the Bus Width
In the Bus width: box, selecting either 8 bit or 16 bit bus width forces the controller to useonly the specified bus width for CSO.
Figure 12. Bus Control Settings
The P5.5 pin carries the BHE/WRH signal. Selecting one of these two radio buttonscontrols which signal the controller sends on that pin. BHE stands for Bus High Enable andwill indicate that there is valid data on the high byte of the bus (D8 through D15) in 16 bitmode for either WRITE or READ bus cycles. WRH stands for WRite High and is used as aWrite Strobe to the devices connected to the high byte of the data bus during WRITEcycles.

EMUL296-PC Chapter 1: Software User Interface
Copyright 1996 ICE Technology •• 24
Miscellaneous bits
As of this writing, the Miscellaneous bits feature is not functional.
The Read CCB2 and Read CCB3 check boxes, if checked, will force the controller to readCCB2 and CCB3. If they are not checked, they will prevent the controller from reading theirrespective control bytes. If you have selected a controller from the Processor List box thatuses only 2 CCB locations, (CCB0 and CCB1) these check boxes will be gray.
Figure 13. Miscellaneous CCB bits
The 8xC296 controllers have more than 16 address bits. With a check mark, this fieldprevents the controller from addressing anything above 64k. The Use address bits A0through .. field (in the upper right corner of the dialog box) will be inactive. Address linesA16 through A19 (port E bits) may then be used for I/O. When you remove the check mark,the address bits above 15 become configurable as address bits and the address lineconfiguration field becomes active.
The PDEN check box, when checked, allows the controller to go into Power Down Mode ifthe IDLPD #2 instruction is executed.
Once all the check boxes and radio buttons are set the way you want them, click on the OKbutton. This will:
1. Update the CCB RAM locations.
2. RESET the controller.
3. Exit from the dialog box.
Figure 14. Exiting the Hardware Config dialog box
To exit the dialog box without writing any of the changes just made, click on Cancel button.To write the changes and reset the controller without exiting the dialog box, click on theReset button.

EMUL296-PC Chapter 1: Software User Interface
Copyright 1996 ICE Technology •• 25
Note: When the EMUL296™-PC software is started, the controller will be releasedfrom a reset state and it will read the CCB values from locations in the PODEPROM and execute code that writes the .ini file CCB values to the CCBRAM locations. Then the controller is reset again and this time it will read theCCB values from RAM.
Miscellaneous Configuration
The Miscellaneous item in the Config menu opens a dialog box thatcontrols special features of EMUL296™-PC:
(1) when and if automatic resets occur.
(2) optional reset vector values.
(3) the source code address range for limiting where breakpointsare set.
(4) the memory scroll range used for Data and Program window scroll bars.
(5) writing values to memory while the application is running.
By default, the emulator resets the controller when the EMUL296™-PC software is startedand after an object file is loaded. The Reset chip at start up: and the Reset chip afterload file: radio buttons can disable either of those resets which may be helpful duringparticularly difficult or unusual debugging circumstances.
Figure 15. Miscellaneous Setup Dialog Box
For example, if you have a code file you want to load but you are unsure if the CCB valuesin that code file are correct, you may not want the emulator to reset the controller right afterloading the file. Instead, you may want to load the file manually and then check the CCBvalues before they are used.
Saved watchpoints are not implemented yet. For information about the status of thisfeature, call or email customer support a [email protected].
Figure 16. One Feature Not Yet Implemented
The next field in the Miscellaneous menu dialog box, the DDE sampling interval, controlshow often Shadow RAM is updated on the screen and how often a DDE link is updated.

EMUL296-PC Chapter 1: Software User Interface
Copyright 1996 ICE Technology •• 26
There is a lower limit to how often the screen and the DDE link can be updated. This limitdepends upon the speed of your machine, how much RAM your machine has, and howmany applications are running. Due to delays from inter-application messaging in MSWindows and possible problems caused by a message backlog, the lowest setting allowedis 100 milliseconds. The upper limit is 32767 milliseconds.
Note: DDE is not supported as of this printing. Please check your current versionof software.
Figure 17. Controlling the DDE Sample Interval
Occasionally, while the emulation is running, writing a value to a RAM location can helpdebugging. For example, it might be useful to simulate a memory mapped input device thisway. The EMUL296™-PC DDE interface supports "poking" a value into an address. TheDDE link can be a two-way connection and some applications may send a value to aparticular address in emulation or target RAM. However, updating RAM at pseudo-randomtimes can be dangerous for the program and possibly the hardware you are controllingwhile you are emulating. With the next field, the DDE poke flag address, you specify anaddress of a two byte flag that, when polled and found to be set to hexadecimal 1234,indicates that it is safe to write the DDE value to RAM.
The check box to the left turns poking on or off: a check turns it on. When EMUL296™-PChas a value to "poke" into RAM (every DDE sampling interval), it first polls this box. If it ischecked, the emulator application will read the contents of the poke flag address. If thecontents are set to 1234H, then EMUL296™-PC will suspend the emulation forapproximately 200-250 microseconds while it updates RAM. Finally, EMUL296™-PC willclear the poke flag (set to 0) and restart the application. The software must reset the flag to1234 when it is again safe to update the poke addresses.
Note: Displaying Shadow RAM and sending a value to another application doesnot slow the emulation.
Enable Code Space Limits
In some symbols files, symbols are not identified as Program space variables or as Dataspace variables. If this is true of your file, you may see the EMUL296™-PC software try toset breakpoints in your variable address range. To prevent this, check the Enable codespace limits box and set the Low and High addresses to encompass just the instructions.Configured this way, EMUL296™-PC will not put breakpoints outside that address range.
EMUL296-PC Chapter 1: Software User Interface
Copyright 1996 ICE Technology •• 27
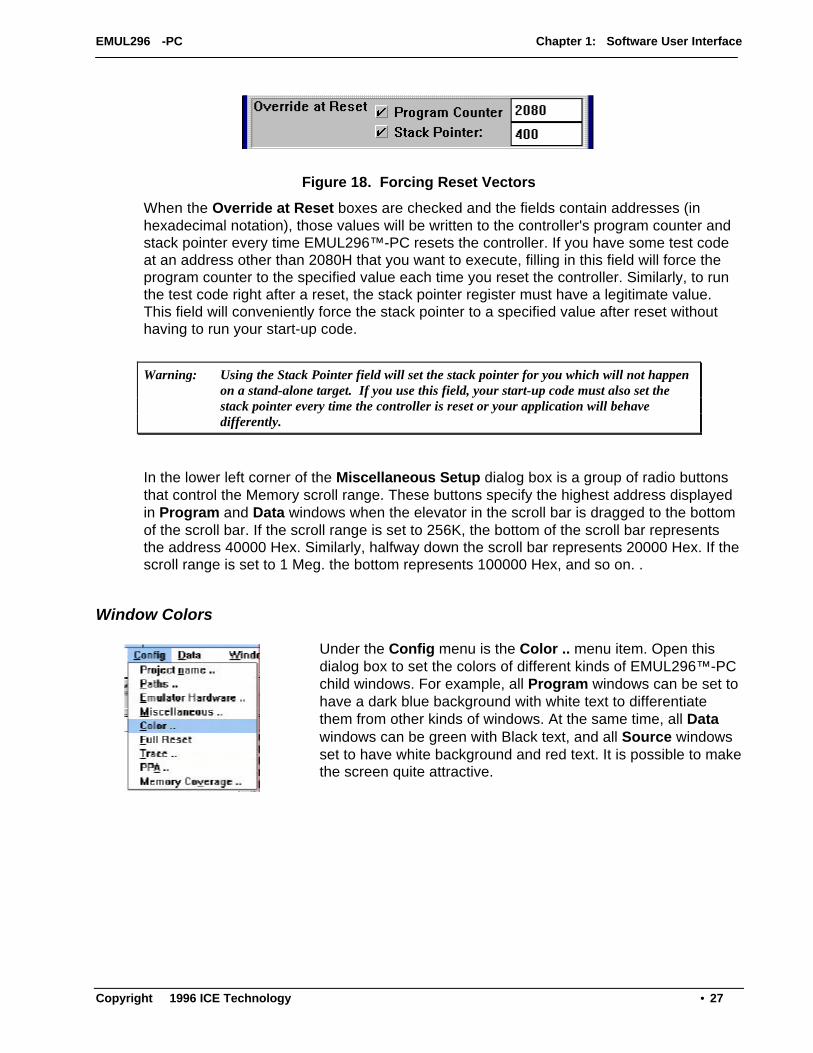
Figure 18. Forcing Reset Vectors
When the Override at Reset boxes are checked and the fields contain addresses (inhexadecimal notation), those values will be written to the controller's program counter andstack pointer every time EMUL296™-PC resets the controller. If you have some test codeat an address other than 2080H that you want to execute, filling in this field will force theprogram counter to the specified value each time you reset the controller. Similarly, to runthe test code right after a reset, the stack pointer register must have a legitimate value.This field will conveniently force the stack pointer to a specified value after reset withouthaving to run your start-up code.
Warning: Using the Stack Pointer field will set the stack pointer for you which will not happenon a stand-alone target. If you use this field, your start-up code must also set thestack pointer every time the controller is reset or your application will behavedifferently.
In the lower left corner of the Miscellaneous Setup dialog box is a group of radio buttonsthat control the Memory scroll range. These buttons specify the highest address displayedin Program and Data windows when the elevator in the scroll bar is dragged to the bottomof the scroll bar. If the scroll range is set to 256K, the bottom of the scroll bar representsthe address 40000 Hex. Similarly, halfway down the scroll bar represents 20000 Hex. If thescroll range is set to 1 Meg. the bottom represents 100000 Hex, and so on. .
Window Colors
Under the Config menu is the Color .. menu item. Open thisdialog box to set the colors of different kinds of EMUL296™-PCchild windows. For example, all Program windows can be set tohave a dark blue background with white text to differentiatethem from other kinds of windows. At the same time, all Datawindows can be green with Black text, and all Source windowsset to have white background and red text. It is possible to makethe screen quite attractive.

EMUL296-PC Chapter 1: Software User Interface
Copyright 1996 ICE Technology •• 28
Figure 19. The Color Setup Dialog Box
For each window class that you wish to change, select the window class from the Selectwindow class drop list. While that class name is showing in that field, the colors you selectwill be assigned to that class of windows.
After you have set all the colors the way you want them, you can name a color scheme bytyping the name in the Color scheme field and then click on the Save button. This colorscheme can then be recalled by selecting it from the drop list of color schemes.
Note: Not all combinations of background and foreground colors are possible.EMUL296™-PC is constrained by the same limits as MS Windows itself, andis affected by the color palette chosen in the Windows Control Panelprogram. No matter what colors you select from this palette, the exampletext pane will show you the colors that will actually be used by EMUL296™-PC.
Reset vs. Full Reset
Under most circumstances that you will encounter, a Full Resetis the same as clicking on the Reset button in the speed bar,selecting Reset Chip from the Run menu, or pressing<Ctrl>F2. With both kinds of reset, the controller is reset bypulling the reset line low. The controller reads the CCBregisters and the controller is immediately halted. When theemulator software is first started, or possibly after an accidenton the pod or target, the states of the two large logic chips onthe pod are not known. In a Full Reset, before the controller is
reset, the large logic chips on the pod are reloaded with their configuration information (youcan find the Full Reset menu item is under the Config menu). Under all circumstances you

EMUL296-PC Chapter 1: Software User Interface
Copyright 1996 ICE Technology •• 29
MAY use the Full Reset menu item in place of clicking on the Reset button. Unless you arechanging the pod type, there will be no NEED to use the Full Reset menu item.
Trace Config Menu
For information about the Trace .. menu item, please refer to the manual in Chapter 4:Trace Board.
Fast Break Write
If the emulator is connected to a motor controller, breakingexecution may be hazardous to the motor, or other parts ofthe target. At the same time, you may want, or even need, toupdate a memory location to run a certain test. The featuredesigned for these circumstances is the Fast Break Write.
A Fast Break Write breaks execution, updates one addresswith one 8 or 16 bit value, then resumes execution, all within15 microseconds or less (at 16 MHz).
Figure 20. Fast Break Write Dialog Box
The address and data fields are both in hexadecimal notation. Execution will be pausedand the address will be updated when (every time) you click on the Write button.
Hint: To read data values without delaying the application, use a Trace board andmake sure that your software regularly reads or writes to the address youwish to monitor. You can then set up a trace filter to only record the buscycles to and/or from the desired address(es). Stopping and viewing thetrace buffer does not affect the running application.

EMUL296-PC Chapter 1: Software User Interface
Copyright 1996 ICE Technology •• 30
Memory Coverage
The EMUL296™-PC trace option includes the hardware necessary tomonitor memory and correlate its use with your C source code. Ifinstructions are fetched, the trace board will mark those addresses.
Choosing Memory Coverage from the Config menu will open aCoverage window and put the trace board into a "Coverage Mode"that prevents normal tracing. As long as this coverage window is open,
the Trace window contents will not change. If initially closed, the Trace window will openempty and stay empty until you close the Memory Coverage window.
If you load your application software before you open the coverage window, the MemoryCoverage window will display rows, where each row has a starting address on the left andsmall black squares to the right of the starting address. The starting and ending addressesare taken from the object file you have last loaded. You may set any address range byselecting the Edit item in the Coverage menu.
Figure 21. Editing the Coverage Address Range
You may either edit the existing range or you may add one or more address ranges. Toedit the existing range, double click on the line containing the address range. To add anaddress range, double click on the empty line just below the existing address range.
EMUL296™-PC supports any number of address ranges. The ranges do not need to benext to each other. They may be located anywhere in the address space. The only practicallimit is that the sum of all ranges must be less than 256 kilobytes.
Once you have edited the address ranges (changed them from the default range set upwhen loading the file) you will want to save these settings for future use. The Save menuitem in the Coverage menu will write the current address range(s) to the .INI file. The Loadmenu item will read them from the .INI file.
Each square represents a memory word: two bytes starting on an even byte. Squares aregrouped into segments 8 squares across. For each address there are 4 rows of segments.“Figure 22. Typical Memory Coverage Window" shows a Memory Coverage window with7 segments in each row. In this case, each row of dots represents 70 hex bytes of memory.Each row of blocks represents 1C0 hex bytes. As the window gets wider, each rowcontains more blocks of squares and the addresses will get farther apart.

EMUL296-PC Chapter 1: Software User Interface
Copyright 1996 ICE Technology •• 31
Figure 22. Typical Memory Coverage Window
A square (or memory word) that has been covered will be blue. If either byte of the wordhas been fetched, the square will change color. Untouched squares will be black. Thisgives you a visual estimate of how much of your code has been executed since theCoverage window was last reset. For an exact representation, look at the Program andSource windows.
As shown in Figure 23, there are new symbols in the Source and Program windows. In theProgram window, you will find either a : or an x between the address and the rest ofhexadecimal value at that address. The : means that the opcode has not been executed.The x indicates that it was either executed or prefetched.
Figure 23. Program and Source Windows in Coverage Mode
In the Source window, there are 4 new indicators between the line number and the linetext: + - & % , explained below:
+ All opcodes from this line were fetched.
% Some opcodes from this line were fetched.
- No opcodes from this line were executed.
EMUL296-PC Chapter 1: Software User Interface
Copyright 1996 ICE Technology •• 32
& This line generated no executable code.
Please note two important things in Figure 23. The strcpy() call is not completely covered,so in the Source window, it is marked with a percent sign. The other important thing tonotice is that address 23E6 has a breakpoint. The instruction at address 23E9 has beenmarked as fetched (because it has been fetched) but it has NOT been executed.Instructions right after executed jumps will be shown as fetched. They may or may nothave been executed.
Summary Memory Coverage Report
A screen full of coverage information may be helpful, but it won't satisfy the FDA. or theFAA. They both want written evidence they can hold in their hands that show that yourtests actually tested your code. EMUL296™-PC can help there.
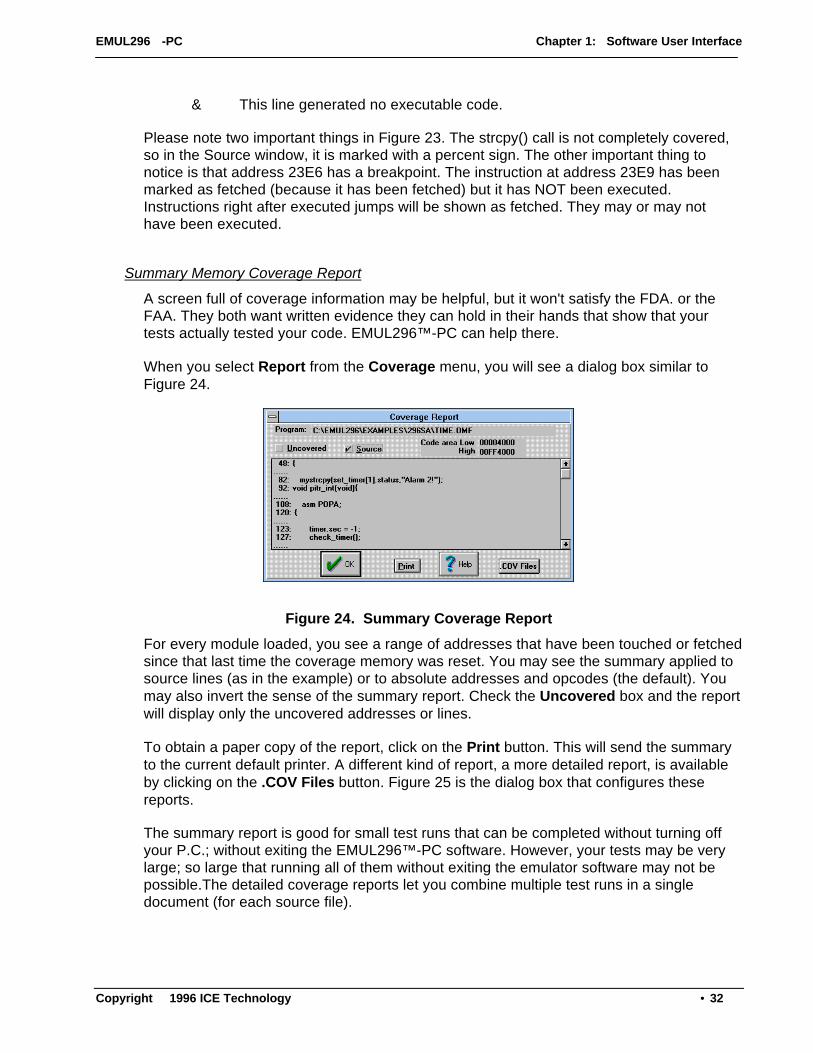
When you select Report from the Coverage menu, you will see a dialog box similar toFigure 24.
Figure 24. Summary Coverage Report
For every module loaded, you see a range of addresses that have been touched or fetchedsince that last time the coverage memory was reset. You may see the summary applied tosource lines (as in the example) or to absolute addresses and opcodes (the default). Youmay also invert the sense of the summary report. Check the Uncovered box and the reportwill display only the uncovered addresses or lines.
To obtain a paper copy of the report, click on the Print button. This will send the summaryto the current default printer. A different kind of report, a more detailed report, is availableby clicking on the .COV Files button. Figure 25 is the dialog box that configures thesereports.
The summary report is good for small test runs that can be completed without turning offyour P.C.; without exiting the EMUL296™-PC software. However, your tests may be verylarge; so large that running all of them without exiting the emulator software may not bepossible.The detailed coverage reports let you combine multiple test runs in a singledocument (for each source file).
EMUL296-PC Chapter 1: Software User Interface
Copyright 1996 ICE Technology •• 33
Detailed Memory Coverage Report
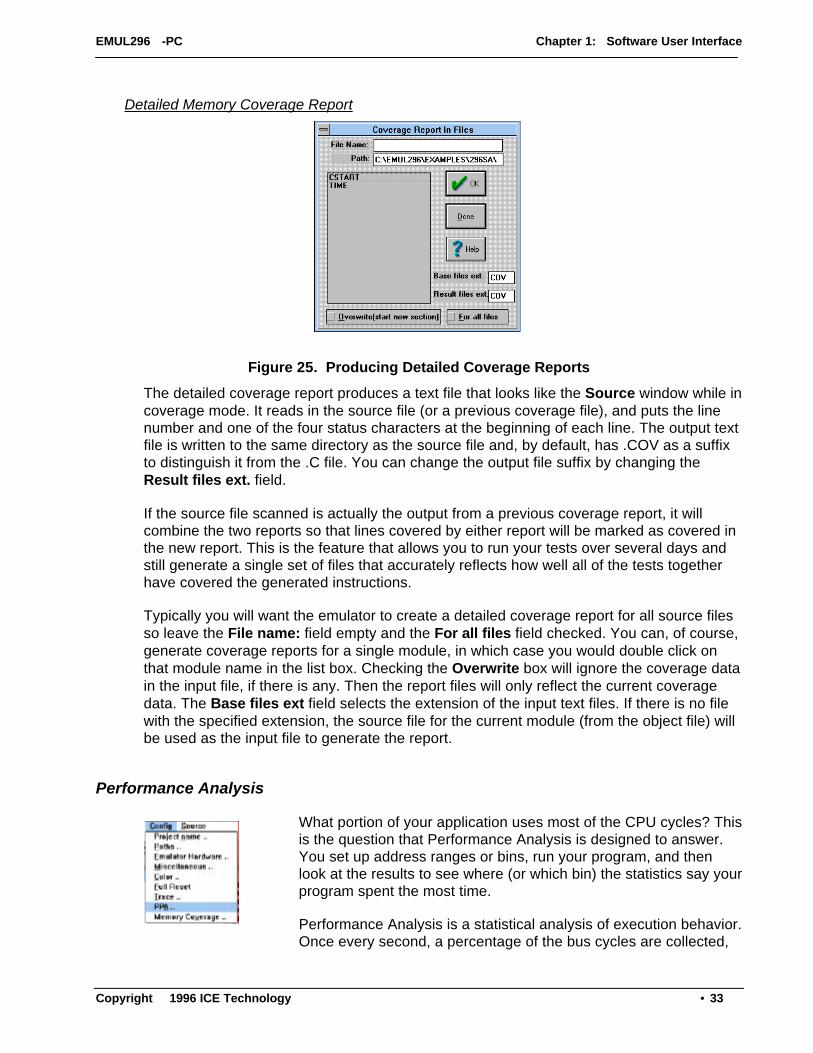
Figure 25. Producing Detailed Coverage Reports
The detailed coverage report produces a text file that looks like the Source window while incoverage mode. It reads in the source file (or a previous coverage file), and puts the linenumber and one of the four status characters at the beginning of each line. The output textfile is written to the same directory as the source file and, by default, has .COV as a suffixto distinguish it from the .C file. You can change the output file suffix by changing theResult files ext. field.
If the source file scanned is actually the output from a previous coverage report, it willcombine the two reports so that lines covered by either report will be marked as covered inthe new report. This is the feature that allows you to run your tests over several days andstill generate a single set of files that accurately reflects how well all of the tests togetherhave covered the generated instructions.
Typically you will want the emulator to create a detailed coverage report for all source filesso leave the File name: field empty and the For all files field checked. You can, of course,generate coverage reports for a single module, in which case you would double click onthat module name in the list box. Checking the Overwrite box will ignore the coverage datain the input file, if there is any. Then the report files will only reflect the current coveragedata. The Base files ext field selects the extension of the input text files. If there is no filewith the specified extension, the source file for the current module (from the object file) willbe used as the input file to generate the report.
Performance Analysis
What portion of your application uses most of the CPU cycles? Thisis the question that Performance Analysis is designed to answer.You set up address ranges or bins, run your program, and thenlook at the results to see where (or which bin) the statistics say yourprogram spent the most time.
Performance Analysis is a statistical analysis of execution behavior.Once every second, a percentage of the bus cycles are collected,

EMUL296-PC Chapter 1: Software User Interface
Copyright 1996 ICE Technology •• 34
sorted into their respective bins, and the results are displayed on the screen. As you mightguess, the percentage of the cycles that are collected depends upon the speed of yourP.C., what other tasks are running, etc.
To get more accurate results, run your program for longer periods of time. If you watch thestatistics on the screen, you will see them change quickly at first, then more slowly. Whenthey change very slowly, you know that the statistics will probably not get any moreaccurate.
Figure 26. Performance Analysis Control Window
When you select PPA Analyzer from the Config menu, you will see a control window thatlooks like Figure 26. The application and the data collection will automatically be startedevery time you open the PPA control window. The six buttons at the top of the windowcontrol the application and the data collection separately.
Note: Clicking on the SAVE button saves the setup, not the results.
Each bin is really an address range. If the address range corresponds exactly to theaddress range of a function, that function name will be displayed next to the address.
A fetch from an address that doesn't fall within any address range will be counted in theMiss bin. A fetch from within an existing but inactive address range bin will not be countedat all. It will not count in the inactive range and it will not be counted within the Miss bin.Statistics will not be kept for that inactive bin at all. The Miss bin cannot be made inactive.
The very first time you configure Performance Analysis you will find only one bin: the Missbin. This bin cannot be deleted, or edited, or be made inactive.
Figure 27. Performance Analysis Control Options
Figure 27 shows the rest of the statistics from Figure 26, plus a few options. This data settook 11 minutes and 31 seconds to collect. A total of 280,118 frames were recorded.

EMUL296-PC Chapter 1: Software User Interface
Copyright 1996 ICE Technology •• 35
Figure 27 shows that data read and write cycles were ignored; the Code only option ischecked. Only instruction fetches are counted in the statistics.
Figure 27 also shows that the Bargraph option is turned off. If you prefer a graphic display,you may turn on the Bargraph option and see the data displayed in a form similar to thatshown in Figure 28.
Figure 28. Bargraph Display Option
To add bins of your own, click on the Add button to open the list of functions shown inFigure 29. You can add any of the functions as an address range, or you may create anaddress range not on the list.
Figure 29. Adding a Bin
To add a bin corresponding to the main() function, double click on main in the function list,then click on the Add button. Note that clicking once on main will highlight it but not updatethe Start and End fields with the values for main(). Also note that double clicking does notactually add the bin. You must click on the Add button to actually add the bin. With theAddress Range dialog box open, you may add as many bins as you like before clicking onthe Done button to close it.
The Length field controls how the End field is used. With a check, the End field displaysthe length. Without a check in the Length field, the End field displays the end address inhexadecimal notation.
Using a very similar screen, any bin can be edited by double clicking on that line in thePPA Control window (Figure 26). This is how you activate and deactivate bins.
Once you have collected the data you want, EMUL296™-PC allows you to either save ordiscard the changes you just made to the list of bins. Only one bin configuration can be
EMUL296-PC Chapter 1: Software User Interface
Copyright 1996 ICE Technology •• 36
saved, not one per project like most configuration settings. This bin configuration will beautomatically restored the next time you use performance analysis.
Menus
The primary means of controlling the debugger, thus the emulation, is through menus. TheEMUL296™-PC menus conform completely with the Microsoft MDI standard. Only thosemenu items that have meaning or can be used with the current selection will highlight whenthe mouse is pointing to them. Menus are organized to hide items that are out of context.
Most menu items have "Hot Key" equivalents. That is, there is some combination offunction keys, character keys, and modifier keys (Control, Shift, or Alt keys) to select mostmenu items. The Hot Key for each menu item is shown in that menu to the right of the itemname, and are also shown below. Where you see "<Alt>FS" as the keyboard shortcut, youshould type <Alt>F (hold the Alt key down while you then press the F key) to open the Filemenu, then press the S key (without the Alt key) to activate the portion of EMUL296™-PCthat writes "S" record files. Holding down the Shift key or turning on CapsLock is notnecessary. Even though the keyboard shortcuts are all shown in capital letters, theshortcuts are not case sensitive.
File Menu
Menu Item Hot Key Function
Load code F3 Load an absolute file. EMUL296™-PCsupports many popular compiler object fileformats. See the Accessories chapter formore information.
Load default symbols .. <Alt> FL Load symbols defined by the MCUmanufacturer. Selecting this menu item willload the default symbols defined by theMCU manufacturer in their manuals. Thiswill enhance the display in Program windowby converting the addresses of registers intotheir respective names and bit descriptions.(Note: Loading default symbols may takeas long as 40 seconds on some machines.)
Load EEPROM .. (SeeNote Below)
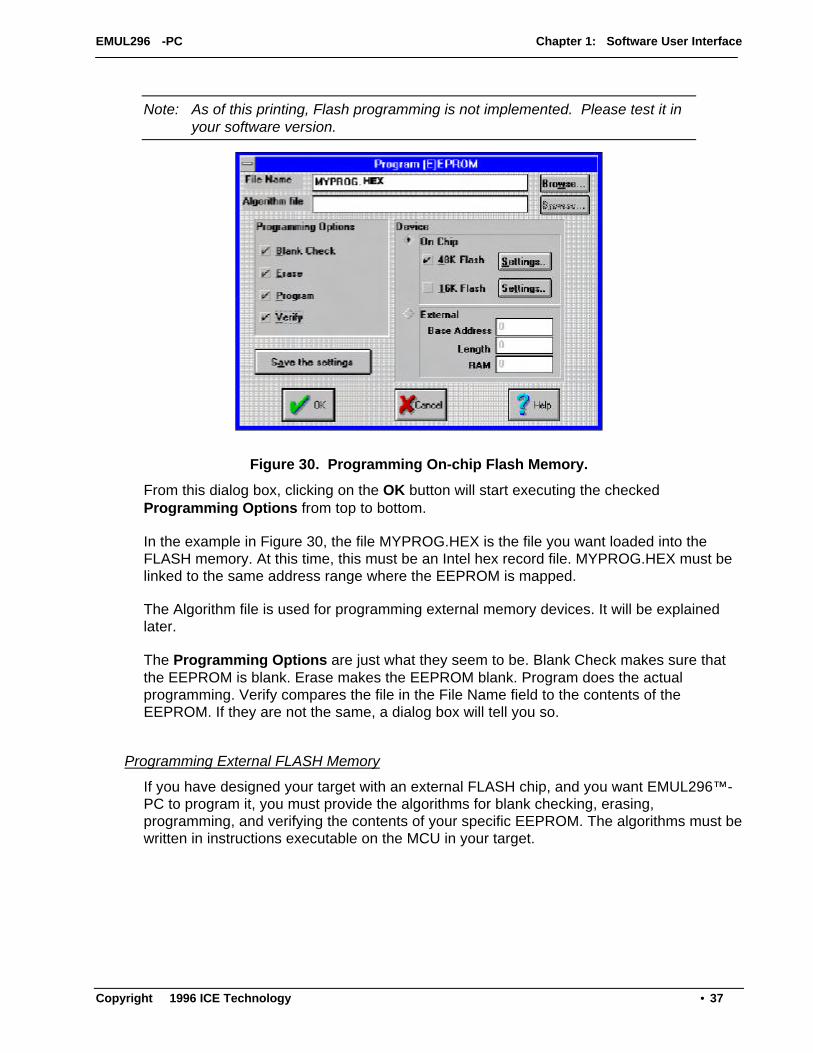
With some assistance, EMUL296™-PC canload user programs into FLASH memorydevices, whether the memory is a module inthe MCU or is a chip external to the MCU.Selecting this menu item will open theProgram (E)EPROM dialog box shown inFigure 30.
EMUL296-PC Chapter 1: Software User Interface
Copyright 1996 ICE Technology •• 37
Note: As of this printing, Flash programming is not implemented. Please test it inyour software version.
Figure 30. Programming On-chip Flash Memory.
From this dialog box, clicking on the OK button will start executing the checkedProgramming Options from top to bottom.
In the example in Figure 30, the file MYPROG.HEX is the file you want loaded into theFLASH memory. At this time, this must be an Intel hex record file. MYPROG.HEX must belinked to the same address range where the EEPROM is mapped.
The Algorithm file is used for programming external memory devices. It will be explainedlater.
The Programming Options are just what they seem to be. Blank Check makes sure thatthe EEPROM is blank. Erase makes the EEPROM blank. Program does the actualprogramming. Verify compares the file in the File Name field to the contents of theEEPROM. If they are not the same, a dialog box will tell you so.
Programming External FLASH Memory
If you have designed your target with an external FLASH chip, and you want EMUL296™-PC to program it, you must provide the algorithms for blank checking, erasing,programming, and verifying the contents of your specific EEPROM. The algorithms must bewritten in instructions executable on the MCU in your target.
EMUL296-PC Chapter 1: Software User Interface
Copyright 1996 ICE Technology •• 38
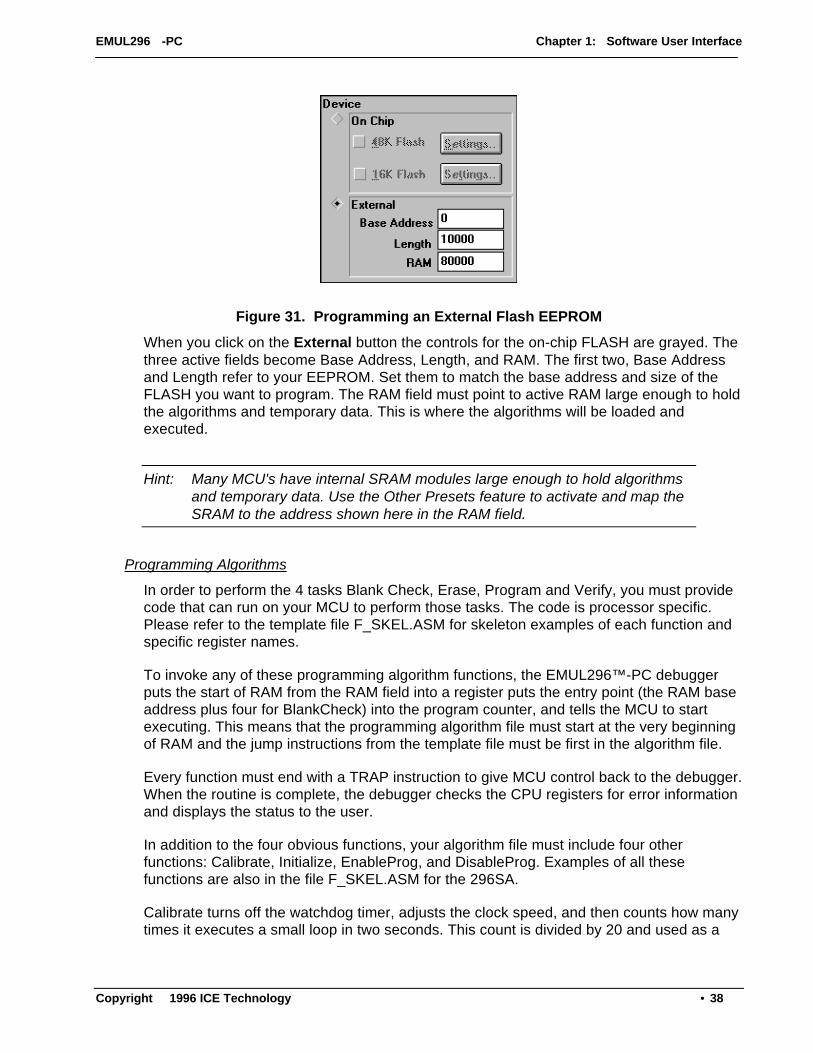
Figure 31. Programming an External Flash EEPROM
When you click on the External button the controls for the on-chip FLASH are grayed. Thethree active fields become Base Address, Length, and RAM. The first two, Base Addressand Length refer to your EEPROM. Set them to match the base address and size of theFLASH you want to program. The RAM field must point to active RAM large enough to holdthe algorithms and temporary data. This is where the algorithms will be loaded andexecuted.
Hint: Many MCU's have internal SRAM modules large enough to hold algorithmsand temporary data. Use the Other Presets feature to activate and map theSRAM to the address shown here in the RAM field.
Programming Algorithms
In order to perform the 4 tasks Blank Check, Erase, Program and Verify, you must providecode that can run on your MCU to perform those tasks. The code is processor specific.Please refer to the template file F_SKEL.ASM for skeleton examples of each function andspecific register names.
To invoke any of these programming algorithm functions, the EMUL296™-PC debuggerputs the start of RAM from the RAM field into a register puts the entry point (the RAM baseaddress plus four for BlankCheck) into the program counter, and tells the MCU to startexecuting. This means that the programming algorithm file must start at the very beginningof RAM and the jump instructions from the template file must be first in the algorithm file.
Every function must end with a TRAP instruction to give MCU control back to the debugger.When the routine is complete, the debugger checks the CPU registers for error informationand displays the status to the user.
In addition to the four obvious functions, your algorithm file must include four otherfunctions: Calibrate, Initialize, EnableProg, and DisableProg. Examples of all thesefunctions are also in the file F_SKEL.ASM for the 296SA.
Calibrate turns off the watchdog timer, adjusts the clock speed, and then counts how manytimes it executes a small loop in two seconds. This count is divided by 20 and used as a

EMUL296-PC Chapter 1: Software User Interface
Copyright 1996 ICE Technology •• 39
100 millisecond standard. Your algorithms can use this constant to produce desired delaysindependent of the target clock rate or your PC speed.
The Initialize function should contain any target or EEPROM specific setup code. It is calledonce after the calibrate routine.
If you have checked the Program box, the EnableProg function is called once, before theProgram function is called. Typically, this function will turn on any necessary programmingvoltages. Typically, the function DisableProg turns off the programming voltages.
The Program function is called as many times as necessary to completely fill the EEPROM.Before it calls Program each time, the debugger fills the buffer in RAM with some of thedata to be programmed and puts the start address in a register. The Program function mustcopy the data from the RAM buffer to the EEPROM while manipulating whatever bits arenecessary.
Verify is similar to Program in that it is called many times in succession with differentportions of the EEPROM in the RAM buffer during each call. If the verify function finds adifference, it puts a 1 into the status register, which will get reported to the user.
Menu Item Hot Key Function
Save code as .. <Alt>FS Write the contents of RAM or ROM to a HEX recordfile. Any region of memory can be saved to a filefor reloading later. Selecting this menu item opensa dialog box that lets you select an address range.Please note that only the HEX file format issupported at this time.
Remove Symbols Delete all line number and symbolic information,and close source files.
Show load info .. Display a window describing the object file lastloaded including number of variables, addressrange loaded, etc.
Preferences <Alt>FP Controls the way the emulator loads object files.
Exit <Alt>X Quit the EMUL296™-PC application. Exiting theEMUL296™-PC software will update the currentdebugger configuration to either the .ini file or to thecurrent .pro file, if one is selected.

EMUL296-PC Chapter 1: Software User Interface
Copyright 1996 ICE Technology •• 40
View/Edit Menu
Menu Item Hot Key Function
Copy to clipboard <Ctrl><Ins> Copy the text (without formatting or fontinformation) of the entire active window to theclipboard.
User defined symbols This item opens a dialog box that lets you selectthe module from which you can view symbols.
Default CPU symbols View and edit memory-mapped registers by nameand by the bit.
DDE Status Open a window displaying the DDE interfacestatus.
Note: DDE is not supported as of this printing. Please check your current versionof software.
The DDE Status menu item opens a window that displays information about the DDEinterface intended for development and debugging.
Please contact a technical support engineer for assistance using the DDE Statuswindow. [email protected]
Menu Item Hot Key Function
C call stack .. <Alt>VC Opens a child window that displays the C call stackand passed parameters needed to reach thecurrent Program Counter.
Evaluate .. <Ctrl>E Open a dialog box that evaluates C expressions.Expressions may contain variables. Assignmentexpressions may change the values of variables.
Hint: To change the value of a variable, use the Evaluate window to evaluate a Cassignment expression such as "i=75".

EMUL296-PC Chapter 1: Software User Interface
Copyright 1996 ICE Technology •• 41
Menu Item Hot Key Function
Inspect .. <Ctrl>I Open a dialog box that displays the contents of asingle variable, structure, or array in detail.
Add a watch point .. <Ctrl>W Open a child window that displays groups ofvariables that is updated every time emulation halts.
Search.. <Ctrl>S This menu item opens a dialog box that lets yousearch the active window for the kind of datadisplayed in that window. If the Source window isactive, you can search for text strings within that file.If the Trace window is active, you can search for anytrace record. (See the Trace chapter for moredetails.) In all other windows that support searching,the search is for a hex pattern.
Search next <Ctrl>X The last search defined will be performed again,from the cursor forward.
Search previous <Ctrl>P The last search defined will be performed again fromthe cursor backwards.
Run Menu
Menu Item Hot Key Function
Step into F7 Execute one instruction, including a jump instruction.If a Source window is selected, execute all theinstructions for one line of source.
Step over F8 Execute one instruction or all the instructions in asubroutine. If a Source window is selected, executeall the instructions for one line of source. Due tosome kinds of optimizations, this feature may notalways be available.
Animate .. <Ctrl>F7 Execute instructions continuously and slowly,highlighting each instruction or each line as it isexecuted.
Go F9 Begin executing instructions from the current PC atfull speed until the next breakpoint.
Go to cursor F4 Execute the instructions from the PC to the currentcursor position.

EMUL296-PC Chapter 1: Software User Interface
Copyright 1996 ICE Technology •• 42
Go to .. <Ctrl>F9 Execute the instructions from the PC to the specifiedaddress.
Go to return address <Alt>F9 Execute the instructions from the PC to the nextfound function return. Due to certain optimizations,this feature may not always be available.
Go FOREVER Execute instructions from the current PC afterdisabling all breakpoints.
Break Emulation F9 Suspend execution as if a breakpoint wasencountered.
Reset Chip <Ctrl>F2 Reset CPU without executing any instructions.
Reset and Go Reset CPU and begin execution from reset vector.
Breakpoints Menu
Menu Item Hot Key Function
Toggle F2 Disable or enable existing breakpoints.
Hardwarebreakpoints ..
Opens a dialog box that lets you set up addressranges for hardware breakpoints (that don't use thetrace board).
Break on internalaccess ..
Opens a dialog box that lets you set up addressand data masks that will cause a break on internalbus cycles of the right type.
Hardware breaksonly
If this menu item is checked, all program/sourcewindow breakpoints will result in hardwarebreakpoints..
Fast_Breaks .. Setup and execute a "fast break write" to memory.
Note: “Break on internal access” is not supported as of this printing. Please checkyour current version of software.
Under the Breakpoints menu, select Break on internal access.. This uses the Intelspecial emulation chip breakpoint register to break execution when reading or writing bytesor words to register RAM and internal RAM. These read and write cycles cannot otherwisebe seen externally with the trace card or in shadow memory. The data as well as addressmay be qualified and ranges are possible using Don't Cares in the mask bits.

EMUL296-PC Chapter 1: Software User Interface
Copyright 1996 ICE Technology •• 43
Notice that there are 11 address bits and 16 data bits, each with a check box. The addressrange of Register and internal RAM varies depending on Sx chip member.
To select accesses 100 to 1FF you might enter 100 hex and then uncheck the lower 8 bits:
(üüü ____ ____)
An unchecked bit is “don’t care” and a checked bit is significant for either address or dataqualifiers. The address and data mask is then ANDed with the entered hex address ordata value. A data range of 10 to 1F could be entered as 10 with all boxes except therightmost 4 bits checked:
(üüüü üüüü üüüü ____)
The 4 vertical boxes are checked as follows:
ARD (Address Range Detect) normally checked
WR (Write cycle) checked if a write to specified address
RD (Read cycle) checked if a read from specified address
DRD (Data Range Detect) normally checked
Leaving all four boxes empty disables any internal breakpoints.
EXAMPLE 1:
Use the supplied time.omf program and observe that the counter "ticks" is located inregister RAM at location 36 hex (not fixed location). It increments from 0 to 19 decimal inthe pitr_int periodic interrupt function before being reset and the seconds incremented.Check boxes ARD, WR, and DRD, then enter "ticks" for the address and 5 for data. Allmask boxes should be checked. Exit this pull-down and start the processor with F9. Youshould observe a breakpoint approximately 8 bus cycles after 5 was written to "ticks". Scrollup in the program disassembly window to see the "INC" opcode or view the last 8 buscycles in the trace buffer.

EMUL296-PC Chapter 1: Software User Interface
Copyright 1996 ICE Technology •• 44
EXAMPLE 2:
Type "1234 hex" in word 36 (use Data window) and then type in a LD 20, 36 opcode in theProgram window. Checking ARD, RD, and DRD, entering 36 as address and 1234 asdata (all mask bits checked) results in a breakpoint approximately 8 bus cycles after theread of 1234 from register RAM location 36.
Menu Item Hot Key Function
At .. <Alt>F2 Set a breakpoint by address, line, or line in module.
Setup .. <Alt>BS Open a breakpoint editing dialog box.
Disable all <Alt>Bi Disable all breakpoints from being active while remainingin the list.
Delete All <Alt>BD Clear all existing breakpoints.
Break now! <Ctrl>C Immediately halt the emulation.
Config Menu
Menu Item Hot Key Function
Project name .. Choose a configuration or project from a list of existingprojects, or create a new one.
Paths .. <Alt>CP Sets the default directories for finding load files, sourcefiles, and emulator files.
Emulator Hardware..
<Alt>CE Sets the emulator board address, controller type, andChip Select registers reset values.
Miscellaneous .. <Alt>CM Sets automatic PC & SP reset value, DDE samplinginterval, and memory scroll range values.
Color .. <Alt>CC Assign colors to windows.
Full Reset <Alt>CF Reloads on-pod logic & performs reset.
Trace .. <Alt>CT Please refer to the Trace Chapter for information aboutthe Trace Config dialog box.
PP Analyzer <Alt>CA Open a Performance Analysis control window and startrecording addresses.
Memory Coverage..
<Alt>CV Open the dialog box that controls Memory or Codecoverage.

EMUL296-PC Chapter 1: Software User Interface
Copyright 1996 ICE Technology •• 45
These next nine submenus share one location in the menu bar. The menu displayedcorresponds to the kind of child window selected. Selecting a different kind of child windowwill change which menu is displayed. To select a different window, either use the Windowmenu, or just click the mouse on any part of the desired window.
Program Menu
Menu Item Hot Key Function
Address.. <Ctrl>A Scroll the selected Program window to the specifiedaddress.
Origin (at programcounter)
<Ctrl>O Scroll the Program window to display the PC address.
Set new PC valueat cursor
<Ctrl>N Set the Program Counter to the address at the cursor.
Module <Ctrl>F3 Open a dialog box that allows quickly scrolling theProgram window to the start of any module.
Function <Ctrl>F Open a window listing all the functions in all modulesloaded. Selecting one will scroll the Program window tothe start of that function.
View sourcewindow
<Ctrl>V Scroll (or open) a Source window to show the source atthe current Program window cursor.
Toggle breakpoint F2 Enable or disable a breakpoint at the cursor.
Source Menu
Menu Item Hot Key Function
Address.. <Ctrl>A Scroll the selected Source window to the specifiedaddress, which may be a function name or a label.
Origin (at programcounter)
<Ctrl>O Scroll the Source window to display the Program Counteraddress.
Set new PC valueat cursor
<Ctrl>N Set the Program Counter to the address at the cursor.
Module <Ctrl>F3 Open a dialog box that allows quickly scrolling theSource window to the start of any module.

EMUL296-PC Chapter 1: Software User Interface
Copyright 1996 ICE Technology •• 46
Function <Ctrl>F Open a window listing all the functions in all modulesloaded. Selecting one will scroll the Source window to thestart of that function.
Call stack .. <Alt>SC Opens a window that displays the C call stack andpassed parameters to reach the current ProgramCounter.
View assemblycode
<Ctrl>V Scroll (or open) a Program window to the currentprogram counter (not source window cursor).
Toggle breakpoint F2 Enable or disable a breakpoint at the cursor.
Data Menu
Menu Item Hot Key Function
Address.. <Ctrl>A Scroll the selected Data window to the specified address.
Original Address <Ctrl>O Scroll the selected Data window to the last address usedin an Address.. menu command.
Edit .. <Enter> Alter the contents of the highlighted location.
Block move.. <Ctrl>B Move a segment of RAM to another location (in RAM).
Fill.. <Ctrl>F Fill RAM with the specified value or pattern.
DataDisplay as.. <Ctrl>D Set the data display mode (ASCII, hexadecimal bytes,long integers, etc. See page 50 of the manual for thecomplete list of formats).
Address space .. <Ctrl>-<Space>
Set the address space for the selected Data window.
ShadowRam Menu
Note: ShadowRAM is not supported as of this printing. Please check your currentversion of software.
Menu Item Hot Key Function
Address.. <Ctrl>A Scroll the selected ShadowRam window to the specifiedaddress.
Original Address <Ctrl>O Scroll the selected ShadowRam window to the last

EMUL296-PC Chapter 1: Software User Interface
Copyright 1996 ICE Technology •• 47
address used in an Address.. menu command.
Display as.. <Ctrl>D Set the data display mode (ASCII, hexadecimal bytes,long integers, etc. See page 50 of the manual for thecomplete list of supported formats).
Register Menu
Either select a register then select this menu item, or more simply, select a register andtype a new value. The first character typed will open the same dialog box as selecting theEdit menu.
Trace Menu
Please refer to Chapter 4: Trace Board for all information regarding the Trace board anduser interface.
Stack Menu
Menu Item Hot Key Function
Parameters in Hex <ALT>SP Display the function parameters in hex instead of in theirdeclared type.
Show function <ALT>SS Not implemented at this time.
Watch Menu
Menu Item Hot Key Function
Add .. <Insert> Open a dialog box for adding a variable to the Watchwindow.
Edit .. <Enter> Open a dialog box for editing an existing variable in theWatch window.
Remove .. <Delete> Delete the selected variable from the Watch window.
Window Menu
The Window menu items open new windows, close existing windows, select windows, andarrange windows on the screen.
Menu Item Hot Key Function
Open a new <Alt>WNP Open a new Program window.

EMUL296-PC Chapter 1: Software User Interface
Copyright 1996 ICE Technology •• 48
program window
Open a new sourcecode window
<Alt>WNS Open a Source window.
Open a new datawindow
<Alt>WND Open a Data window.
Open a newregister window
<Alt>WNR If one is open, it will ask "Are you sure?"
Open a newshadow ramwindow
Open a new ShadowRam window.(Note: ShadowRam is not supported as of this printing.Please check your current software version.)
Open a newSpecial Registerswindow
<Alt>WNE Open a new Special Registers window.
Open a new tracewindow
<Alt>WNT Open a new Trace window.
Open a new Watchwindow
<Akt>WNW Open a new Watch window.
Toggle help line <Alt>WH Turn on or off the text at the bottom of the EMUL296™-PC window.
Refresh <Ctrl>R Repaints the screen.
Tile windows <Alt>WT Resize and arrange the windows within the EMUL296™-PC application.
Cascade windows <Alt>WC Resize and overlap the windows within the EMUL296™-PC application.
Arrange Icons <Alt>WA Line up any closed EMUL296™-PC icons at the bottom ofthe main window.
Zoom F5 Expand the selected window to fill the EMUL296™-PCwindow.
Next window <Ctrl>F6 Change the currently selected (highlighted) window.
Close <Alt>F4 Close the currently selected window.

EMUL296-PC Chapter 1: Software User Interface
Copyright 1996 ICE Technology •• 49
Below the Close menu item, there is one menu item for each open window, and the activewindow will be checked. Selecting one of these items will open the window if it is closeddown to icon size, and activate it.
Help Menu
Selecting the Info .. menu item will open a box that displays the application version numberand date. Please have this information handy when calling for support.
Dialog Boxes
Many menu selections open dialog boxes that allow you to input more specific information.Some of these dialog boxes are described above next to their menu items. The rest aredescribed in this section.
Child Windows
There are nine primary child windows created by EMUL296™-PC: Program windows, Dataor Memory windows, Inspect windows, Source windows, a Registers window, aSpecialRegs window, Call Stack window, Watch windows, and Trace windows (even ifyou have no Trace board). All of these windows are opened by selecting the correspondingitem in the Window menu.
Any number of child windows may be open at the same time. Any number of child windowscan overlap but only one child window is active (has the focus) at a time. Some may bescrolled and resized to view any address desired. Their locations and sizes are saved tothe current project file when EMUL296™-PC exits, and will be restored when the softwarerestarts.
Each child window has a corresponding menu that appears between the Config menu andthe Window menu. The menu contains items that only make sense within the context ofthat window. This window-specific menu will also appear at the cursor when you click withthe Right mouse button in the body of the active window.
Register Windows
The Registers window displays the CPU registers. All registers are displayed inhexadecimal notation. Clicking anywhere in the Registers window will select that window(make it the active window) and right-clicking brings up the Registers menu. The operationsupported in the Registers window is editing register contents.
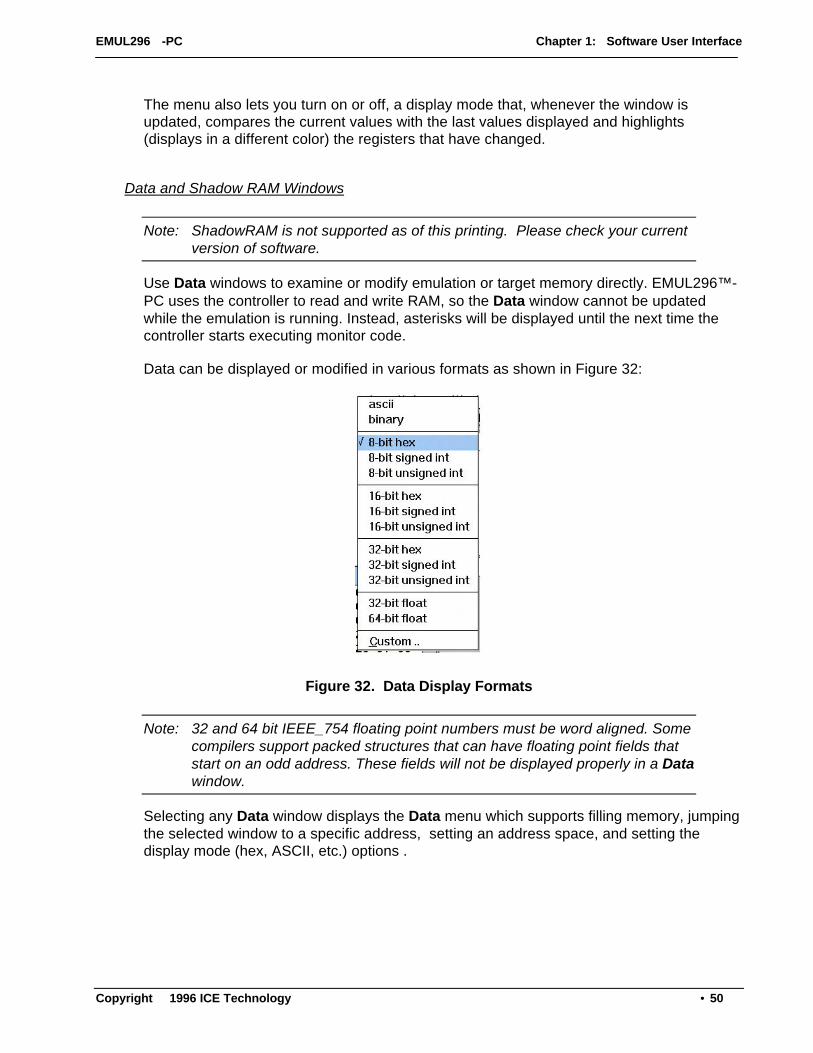
EMUL296-PC Chapter 1: Software User Interface
Copyright 1996 ICE Technology •• 50
The menu also lets you turn on or off, a display mode that, whenever the window isupdated, compares the current values with the last values displayed and highlights(displays in a different color) the registers that have changed.
Data and Shadow RAM Windows
Note: ShadowRAM is not supported as of this printing. Please check your currentversion of software.
Use Data windows to examine or modify emulation or target memory directly. EMUL296™-PC uses the controller to read and write RAM, so the Data window cannot be updatedwhile the emulation is running. Instead, asterisks will be displayed until the next time thecontroller starts executing monitor code.
Data can be displayed or modified in various formats as shown in Figure 32:
Figure 32. Data Display Formats
Note: 32 and 64 bit IEEE_754 floating point numbers must be word aligned. Somecompilers support packed structures that can have floating point fields thatstart on an odd address. These fields will not be displayed properly in a Datawindow.
Selecting any Data window displays the Data menu which supports filling memory, jumpingthe selected window to a specific address, setting an address space, and setting thedisplay mode (hex, ASCII, etc.) options .
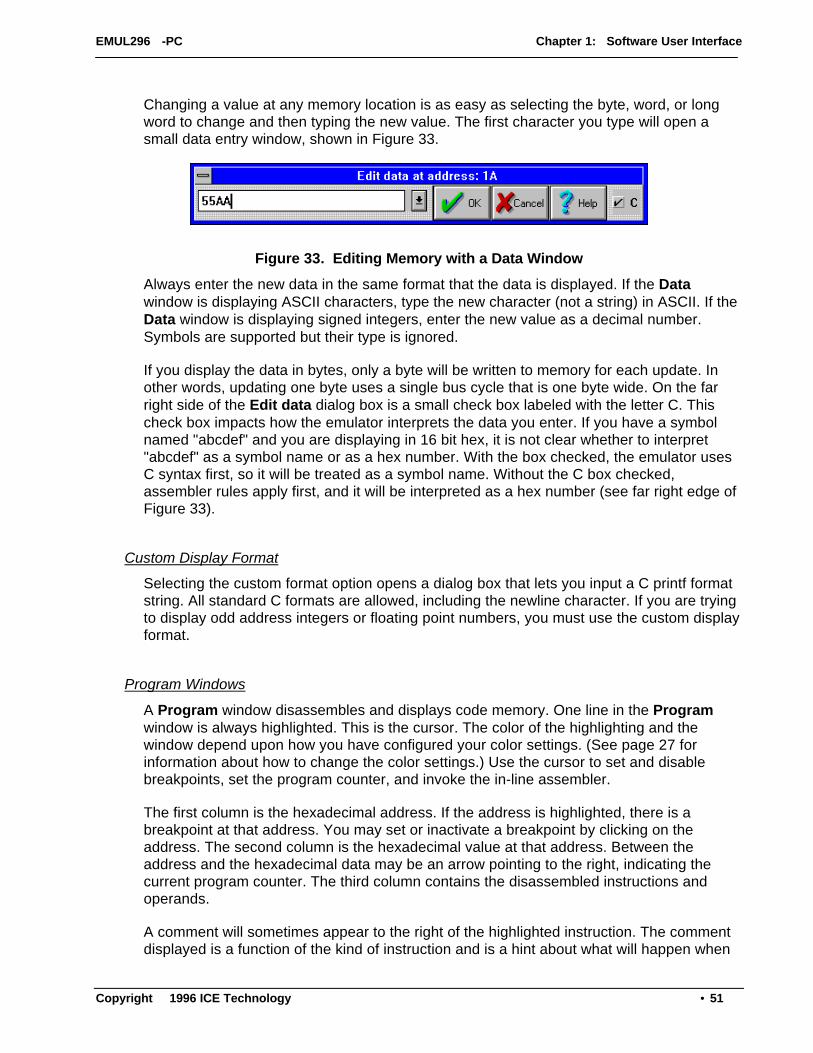
EMUL296-PC Chapter 1: Software User Interface
Copyright 1996 ICE Technology •• 51
Changing a value at any memory location is as easy as selecting the byte, word, or longword to change and then typing the new value. The first character you type will open asmall data entry window, shown in Figure 33.
Figure 33. Editing Memory with a Data Window
Always enter the new data in the same format that the data is displayed. If the Datawindow is displaying ASCII characters, type the new character (not a string) in ASCII. If theData window is displaying signed integers, enter the new value as a decimal number.Symbols are supported but their type is ignored.
If you display the data in bytes, only a byte will be written to memory for each update. Inother words, updating one byte uses a single bus cycle that is one byte wide. On the farright side of the Edit data dialog box is a small check box labeled with the letter C. Thischeck box impacts how the emulator interprets the data you enter. If you have a symbolnamed "abcdef" and you are displaying in 16 bit hex, it is not clear whether to interpret"abcdef" as a symbol name or as a hex number. With the box checked, the emulator usesC syntax first, so it will be treated as a symbol name. Without the C box checked,assembler rules apply first, and it will be interpreted as a hex number (see far right edge ofFigure 33).
Custom Display Format
Selecting the custom format option opens a dialog box that lets you input a C printf formatstring. All standard C formats are allowed, including the newline character. If you are tryingto display odd address integers or floating point numbers, you must use the custom displayformat.
Program Windows
A Program window disassembles and displays code memory. One line in the Programwindow is always highlighted. This is the cursor. The color of the highlighting and thewindow depend upon how you have configured your color settings. (See page 27 forinformation about how to change the color settings.) Use the cursor to set and disablebreakpoints, set the program counter, and invoke the in-line assembler.
The first column is the hexadecimal address. If the address is highlighted, there is abreakpoint at that address. You may set or inactivate a breakpoint by clicking on theaddress. The second column is the hexadecimal value at that address. Between theaddress and the hexadecimal data may be an arrow pointing to the right, indicating thecurrent program counter. The third column contains the disassembled instructions andoperands.
A comment will sometimes appear to the right of the highlighted instruction. The commentdisplayed is a function of the kind of instruction and is a hint about what will happen when

EMUL296-PC Chapter 1: Software User Interface
Copyright 1996 ICE Technology •• 52
the instruction is executed. For example, if the highlighted instruction will change thecontents of memory, the hint will contain the value about to be overwritten.
Program windows can control the emulation. To set a breakpoint, click once on theaddress portion of the instruction where you want the break. Or, you may click once on thedesired instruction (to highlight that instruction) and then click on it again to highlight theaddress. A breakpoint is indicated by displaying the address with white letters on a black ordark background. This second mouse click (not a double click) creates the breakpoint. Todeactivate (not delete) that breakpoint, click again on the same instruction. The addresswill no longer be highlighted and the breakpoint will be inactive. To delete the breakpoint,use the Setup .. dialog box from the Breakpoints menu. Any highlighted instruction can bea temporary breakpoint. The Run menu item Go until cursor will use the cursor as atemporary breakpoint.
In-line Assembler
The in-line assembler is easy to use; simply highlight the instruction or address you wish tochange in the Program window and type. The first character typed will open an edit dialogbox to display the characters you type and allow you to edit your assembler source line.Once the source line is as you want it, press <Enter>.
The in-line assembler will translate the input line according to the syntax described in the80C296 data books and replace the former opcode(s) and data with the new opcode(s)and data. Note that the assembler will write as many bytes as required for the newinstruction. This may overwrite part or all of subsequent instructions. Be sure to examinethe subsequent instructions as well as the new instructions for correctness.
Source Windows
The Source window displays the C source (or assembler source if the assembler supportssource line debugging) of the module containing the Program Counter. Like a Programwindow, a Source window displays the source text, line numbers, a cursor (the blinkingunderline), and a small arrow between the line numbers and the source text to indicate thecurrent Program Counter value.
After each single step, and during each animation pause, the Source window scrolls toshow the source line that generated the instruction pointed to by the new ProgramCounter, if it was generated by a source line.
Displaying and toggling breakpoints in Source windows is different than in Programwindows. In Source windows, breakpoints are displayed by inverting (or highlighting) theentire source line. In Program windows, only the address is highlighted. In Sourcewindows, a single click on any line number (or address in the Program window) will togglethe breakpoint. In both kinds of windows, pressing F2 will toggle a breakpoint on thehighlighted instruction.
When a Source window appears blank with the window title "Source", it usually means thatthe program counter is pointing to instructions derived from a module with no debugginginformation. As soon as the PC points to an instruction from a C module or assembly
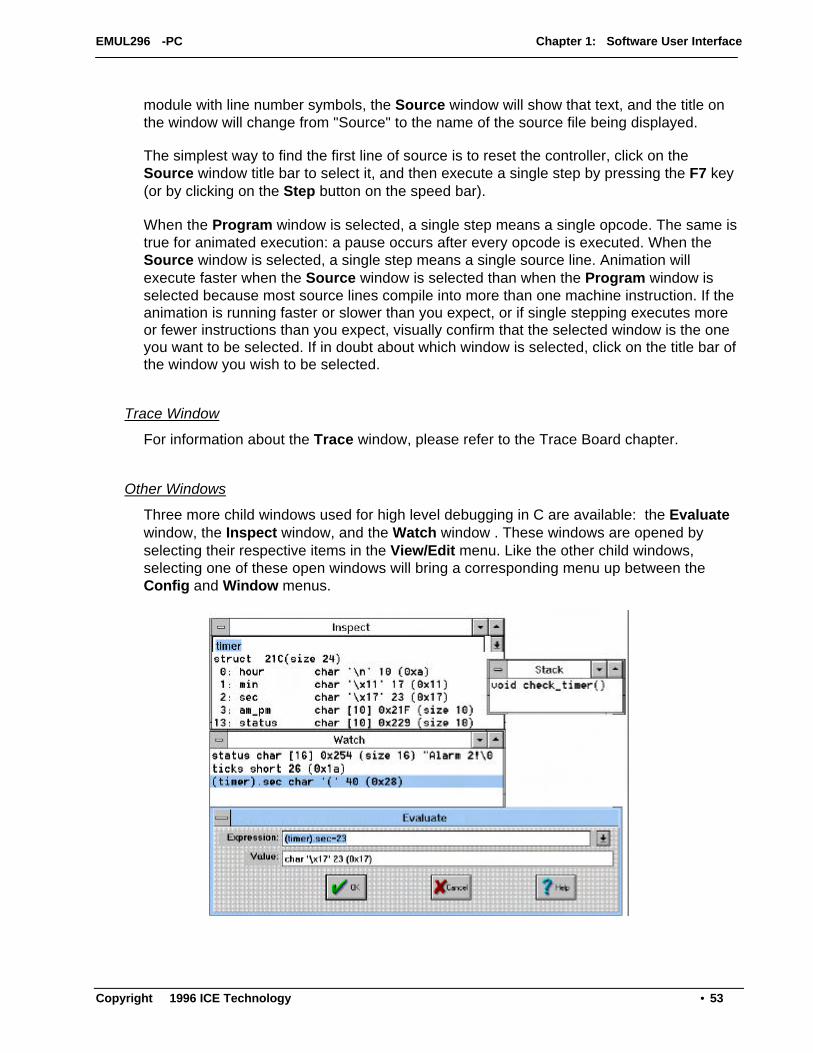
EMUL296-PC Chapter 1: Software User Interface
Copyright 1996 ICE Technology •• 53
module with line number symbols, the Source window will show that text, and the title onthe window will change from "Source" to the name of the source file being displayed.
The simplest way to find the first line of source is to reset the controller, click on theSource window title bar to select it, and then execute a single step by pressing the F7 key(or by clicking on the Step button on the speed bar).
When the Program window is selected, a single step means a single opcode. The same istrue for animated execution: a pause occurs after every opcode is executed. When theSource window is selected, a single step means a single source line. Animation willexecute faster when the Source window is selected than when the Program window isselected because most source lines compile into more than one machine instruction. If theanimation is running faster or slower than you expect, or if single stepping executes moreor fewer instructions than you expect, visually confirm that the selected window is the oneyou want to be selected. If in doubt about which window is selected, click on the title bar ofthe window you wish to be selected.
Trace Window
For information about the Trace window, please refer to the Trace Board chapter.
Other Windows
Three more child windows used for high level debugging in C are available: the Evaluatewindow, the Inspect window, and the Watch window . These windows are opened byselecting their respective items in the View/Edit menu. Like the other child windows,selecting one of these open windows will bring a corresponding menu up between theConfig and Window menus.
EMUL296-PC Chapter 1: Software User Interface
Copyright 1996 ICE Technology •• 54
Figure 34. C call stack, Evaluate, Inspect & Watch Windows
Inspect Window
The Inspect window displays a single variable, or possibly modifies that variable. To openan Inspect window, either select the Inspect .. menu item in the View/Edit menu or doubleclick in the Source window on the variable you would like to inspect. Double-click in anopen Inspect window on a structure member or array element to open an Inspect windowdetailing that field.
The Inspect window can stay open just like a Data or Watch window, and it will beupdated whenever the application stops. The variable being displayed may be part of anequation written following the rules of C that produces a single scalar answer.
Note: If you have an open Inspect window with an assignment statement, everytime the emulator stops executing, the expression will be evaluated and thevariable will be updated. The variable will appear as though your applicationis not changing it while the emulator is running.
Watch Window
The Watch window displays multiple variables being watched, one variable per line. Anylocal variable in the Watch window that is not in scope will be displayed with three questionmarks instead of its value.
Place the cursor on the variable of interest and use <CTRL>W to add it to the Watchwindow.
Evaluate Window
The Evaluate window is opened by selecting a variable in the Source window with thecursor and using <CTRL>E. This allows editing of the current variable by using the Cassignment operator = to the right of the variable. In fact, any C expression may beperformed in this edit window.
Hint: This window can also serve as a hexadecimal calculator, using the C syntax0x____ for hex numbers.
Stack Window
The Stack window displays the "call stack," or the list of functions called to reach thecurrent point in the application, and the current value of parameters passed to them (onlysupported if the compiler provides the stack information).

EMUL296-PC Chapter 1: Software User Interface
Copyright 1996 ICE Technology •• 55
Addresses are displayed and entered using hexadecimal notation or global symbol names.In all windows (excluding Inspect windows,) values may be edited by selecting that value(with the mouse or cursor keys) and then typing.
Note: Symbol names are case sensitive. If a symbol cannot be found, try the samename with a different case. Also note that some assemblers shift all symbolsto uppercase.
RTXC Window
Note: RTXC is not supported as of this printing. Please check your current versionof software.
EMUL296™-PC has built-in support for the RTXC multitasking kernel from EmbeddedSystems Products.
One you have opened an RTXC window, you have an interface that is nearly identical tothe debugging interface of RTXC itself. Just as with the kernel debugging commandinterface, you must type an exclamation mark (!) to halt normal kernel and task execution.At that point you can type commands that will display information about the kernel and anyof the tasks. This information includes task priorities, message queues, stack usage, etc.The "H" command will show you a summary of commands.
For detailed information about using the RTXC debugging features, please refer to manualthat comes with RTXC.
Tool Bar
Just below the menu bar is the "Tool Bar" containing icons or buttons that, like Hot Keys,execute frequently needed menu options when clicked. The Help button opens the MSWindows Help application to the page that describes the current context. The Reset buttonresets the controller. The Step button emulates one source line or opcode depending uponwhich window was last active. The Go button starts full speed emulation that will continueuntil a break occurs. While emulating, the Go button changes to Break, and haltsemulation when clicked. The Trace Beg button resets the Trace board and starts bus cyclerecording according to the conditions set in the Trace Setup dialog box.
Figure 35. The Tool Bar

EMUL296-PC Chapter 1: Software User Interface
Copyright 1996 ICE Technology •• 56
Help Line
At the bottom of the EMUL296™-PC window is a line of text that, depending upon thecontext, explains what the selected item is or what it does. This kind of context-sensitivehelp is turned on and off with the Toggle help line item in the Windows menu.
Dynamic Data Exchange
Note: DDE is not supported as of this printing. Please check your current versionof software.
Dynamic Data Exchange (DDE), allows one MS Windows application to send data toanother. EMUL296™-PC uses DDE protocols and export values from ShadowRam toother applications such as Word for Windows or Excel. You cannot import values toEMUL296™-PC using DDE. The following example will help you set up the DDE linkbetween EMUL296™-PC and Excel (or Excel inside Word for Windows).
Note: ShadowRAM is not supported as of this printing. Please check your currentversion of software.
To establish a link from EMUL296™-PC to Excel, select the destination cell and enter thefollowing formula:
=emul296|shadow!'< Shadow RAM address to monitor in hex notation >'
where <> is an address ("5000", for example).
All the pods come with an example file named "TIME.OMF". The TIME program writes thevalue of a timer at the location 5010H through 5030H (look at the Shadow RAM in Figure36). In the ShadowRAM Window you should choose Display as... ASCII. You will see theseconds and tenths of seconds being updated in your Excel cell, if you do the following:
Select the destination cell in Excel and enter the following formula (see Figure 36, cell A1):
=emul296|shadow!'5016'
The cell will be updated and displayed as words in decimal representation. If you would liketo have it displayed as ASCII, you must write your own function as a Macro under Excel. InFigure 36 we make a call for function AsciConv in cell A2. The function might look like:
Function AsciConv(word)
AsciConv = Chr(word And 255) + Chr((word / 256) And 255)
End Function

EMUL296-PC Chapter 1: Software User Interface
Copyright 1996 ICE Technology •• 57
The value in the Excel cell will be updated as often as indicated in the ConfigMiscellaneous .. dialog box labeled DDE sampling interval. This may be as little as 100milliseconds or as long as 32K milliseconds (32s).
Figure 36. EMUL296™-PC with DDE to Excel
Note: Editing the memory locations that represent the Stack Pointer, Imask, andWSR in a Data window will not update the Register window display or thetarget CPU registers. Always use the Register window to edit theseregisters. In the future, the software will be revised to handle the Registerand Data windows transparently.


EMUL296-PC Chapter 2: Emulator Macro User Guide
Copyright 1996 ICE Technology •• 59
Chapter 2: Emulator Macro User Guide
Introduction
The Emulator Macro System consists of two files together with thisguide. The System requires the 16 bit version of Microsoft Visual Basic 4 as itsfoundation. Macro creation uses many of the features of Visual Basic, such as debugging.The macro writer uses a low level DLL and a library of useful functions. Additionalfunctionality is easily added by the macro writer. Run macros from Visual Basic for testingand debugging or as stand alone executables.
General description of the emulator macro setup
There are two files provided in the Emulator directory:
emul296.bas the Visual Basic API
emul296m.ico the icon to use for executable macros
Note: Install Visual Basic before using these files.
The following is a guide to installing the macro system for writing macros and a referenceto the subroutines provided.
Visual Basic Supplemental User Guide
It's easy to write macros:
1. Execute Visual Basic
Set up your icon
1. Make the form invisible
2. Add the emul296.bas file to your project
3. Name your project
4. Write your macro code
5. Create your executable macro
6. Exit Visual Basic
7. Test it!For detailed instructions, please refer to the section entitled "Procedure for Writing aMacro".

EMUL296-PC Chapter 2: Emulator Macro User Guide
Copyright 1996 ICE Technology •• 60
General information
Begin by installing Visual Basic Standard or Professional edition according to theinstructions from Microsoft. Use the Standard package for writing macros, and theProfessional package for more sophisticated or database work.
Warning: DO NOT change emul296.bas. Use another module if additions are needed.
We recommend the following Visual Basic options to be found under the Options |Environment Main Menu selection.:
Require Variable Declaration = Yes
Syntax Checking = Yes
Default Save As Format = Text
Save Project Before Run = Yes
Note: Refer to the Visual Basic manual for more details about the program, as this documentcontains only the information required for writing macros.
Procedure for writing a macro
1. Execute Visual Basic, or if it is running, create a new project from the Microsoft VisualBasic main menu with File | New Project
2. Set up an icon in the main form Properties window (use the icon "emul296m.ico" forthis purpose).a. In the Properties window, click on the ICON selectionb. At the top of the Properties window, click on the "..." buttonc. In the Load Icon dialog box, select the directory where the icon is located
(i.e., c:\emul296)d. Select the emul296m.ico icon under File Name; Click OK
3. Set visible to "false" in the property window to make the main form invisible.a. In the main form Properties window, select the "visible" entryb. Click drop down arrow in the Change Windowc. Click on FALSE
4. In the Microsoft Visual Basic Main Menu, select File | Add File... to add theemul296.bas file to the projecta. In the Add File dialog box, select the c:\emul296 directoryb. Select emul296.bas; click OK
5. Name the form in the Project, and Savea. In the Properties box, click on NAMEb. Type in the new name (e.g., "LoadTime") instead of the default “form 1”c. In the Microsoft Visual Basic main menu, select File | Save Project Asd. Save changes to "LoadTime.frm"? Choose Yese. The Save File As dialog box should show "LoadTime.vbp" in c:\emul296 directory;click OKf. In the Save Project As dialog box, change the file name of the project file
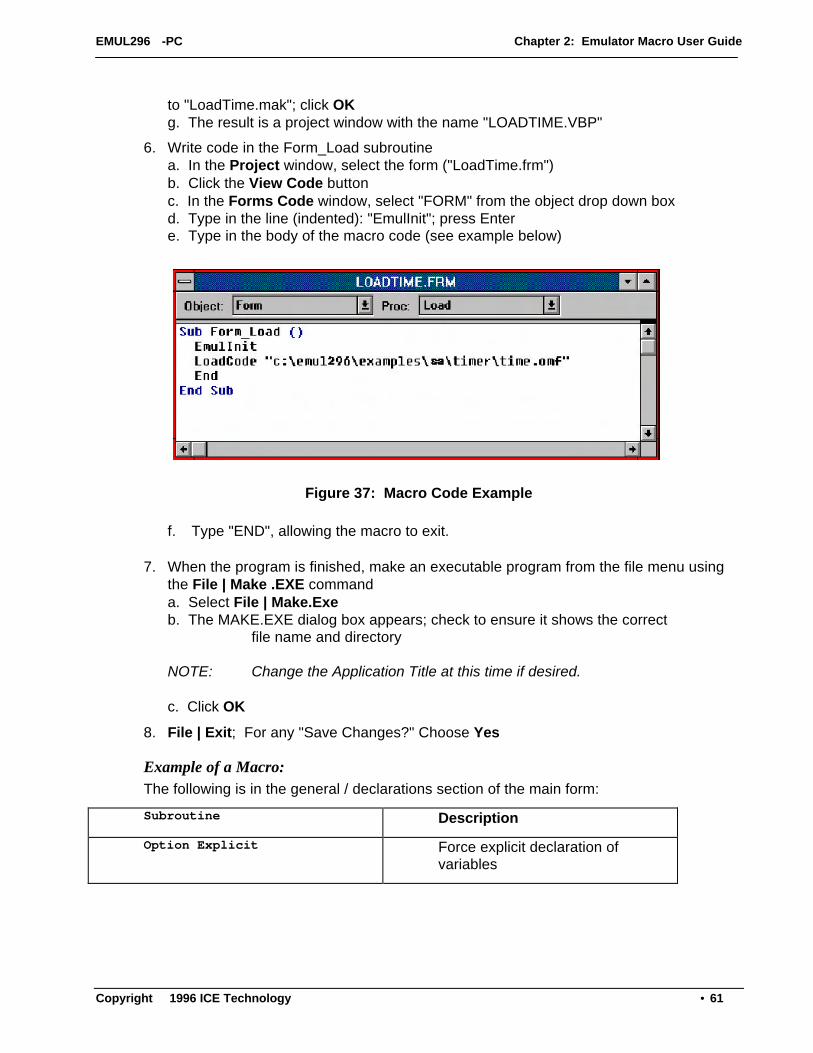
EMUL296-PC Chapter 2: Emulator Macro User Guide
Copyright 1996 ICE Technology •• 61
to "LoadTime.mak"; click OKg. The result is a project window with the name "LOADTIME.VBP"
6. Write code in the Form_Load subroutinea. In the Project window, select the form ("LoadTime.frm")b. Click the View Code buttonc. In the Forms Code window, select "FORM" from the object drop down boxd. Type in the line (indented): "EmulInit"; press Entere. Type in the body of the macro code (see example below)
Figure 37: Macro Code Example
f. Type "END", allowing the macro to exit.
7. When the program is finished, make an executable program from the file menu usingthe File | Make .EXE commanda. Select File | Make.Exeb. The MAKE.EXE dialog box appears; check to ensure it shows the correct
file name and directory
NOTE: Change the Application Title at this time if desired.
c. Click OK
8. File | Exit; For any "Save Changes?" Choose Yes
Example of a Macro:The following is in the general / declarations section of the main form:
Subroutine Description
Option Explicit Force explicit declaration ofvariables

EMUL296-PC Chapter 2: Emulator Macro User Guide
Copyright 1996 ICE Technology •• 62
Sub Form_Load () This subroutine executes when themacro loads and appears in theForm, Load section of the mainform
Dim byt As Integer Declare byt as an integer variable
Dim ret As Integer Declare ret as an integer variable
Dim dwd As Long Declare dwd as a long variable
Const ShadowRam = 1 Const ProgramWin = 2
Const RegisterWin = 3 Const DataWin = 4
Const SourceWin = 5 Constants for activating thewindows of project: proj11 (seefootnote below)
EmulInit Initialize the macro library and theEmulator (if not running)
LoadProject "proj1" Load project set up
LoadCode"c:\emul296\examples\kr\timer\time.omf"
Load the code and symbol file
WindowSelect SourceWin Select the Source window
StepOver Step a couple of times
StepOver
WindowSelect DataWin Select the Data window
SetAddress &H5000 Set the start address to 0x5000
DisplayAs DT_8BITHEX Set the format to 8 bit hex; theDT_xxx constants are found inemul296.bas
WindowSelect ShadowRam Select the ShadowRam window
SetAddress &H5000 Set the address to 0x5000
DisplayAs DT_ASCII Set the format to ASCII
WindowSelect ProgramWin Select the Program window
SetAddress &H3000 Set the address to 0x3000
1 For the current version of the macro language, we suggest that you use "project" to specify the MDI childwindow locations and their order (see "Projects" on page 18.)

EMUL296-PC Chapter 2: Emulator Macro User Guide
Copyright 1996 ICE Technology •• 63
SendKeys"nop{ENTER}nop{ENTER}nop{ENTER}ljmp 3000{ENTER}", True
Assemble some code into theProgram window. The lastparameter (True) is used to waitfor SendKeys to finish before goingon the next statement
PutPc &H3000 Set the PC to the assembled code
byt = 0 Clear the byt variable
ret = GetShadowByte(&H5010,byt)
Get the byte at 0x5010
MsgBox "Shadow byte at 0x5010 =" + Hex$(byt) + "h.", MB_OK,"LoadForm"
Display the value (MB_OK is foundin emul296.bas) in a message box
Go From 0x3000
For dwd = 0 To 100 A wait loop
DoEvents Let someone else do something
Next
Break Stop executing
dwd = GetPc() Get the current PC
MsgBox "The PC is: 0x" +Hex(dwd) + ".", MB_OK, "TestMacro"
Display it
EmulReset Prepare to run the previouslyloaded code module
SetBpAtLine 138 Set a breakpoint
GoToBP Go until a breakpoint isencounterred
End Exit from macro
End Sub
9. Enter File Manager and select emul296 directorya. Drag the executable file (in this case "LOADTIME.EXE") from the File
Manager into a file folder in the Program Managerb. Execute the program by double clicking on the iconc. Drag the project file ("LOADTIME.MAK") from the File Manager into a file
folder in the Program Managerd. To edit your macro, execute Visual Basic by double clicking on the icon
produced from step c

EMUL296-PC Chapter 2: Emulator Macro User Guide
Copyright 1996 ICE Technology •• 64
Subroutine Reference
ConstantsUse constants for the Visual Basic message box subroutine and the DisplayAs values forthe different data formats. Refer to emul296.bas for the names of these constants. Anyother constants needed are documented in the Visual Basic or Visual Basic ProfessionalHelp files.
Global VariablesUse the following four global variables (DO NOT modify them in any way):
EmulHandle This is the Windows handle for the emulator program.
EmulName This is the full emulator program name as appears inthe title bar.
EmulIniName This is the name of the current emulator ".INI" file.
EmulWorkDir This is the current working directory (usually thedirectory that the emulator program resides in).
Windows API If needed, the Windows API is documented in theVisual Basic Professional Help File system.
Windows API
If needed, the Windows API is documented in the Visual Basic Professional Help Filesystem.
Warning: Use either fixed strings (Dim str As String * 100) or variable strings (Dim str AsString) that have been pre-initialized, for example using Space$ () to make the stringas long as needed for the API call.
Subroutines
Subroutine Description
Sub Break () Stops emulator execution.
Sub DisplayAs (ntype As Integer) Changes the current display format in theactive window. (Note that this can only beused in windows that have a display format.)The window must be made active with WindowSelect.
Sub EmulInit () Sets up the macro for execution and starts theemulator program if it is not running.

EMUL296-PC Chapter 2: Emulator Macro User Guide
Copyright 1996 ICE Technology •• 65
Sub EmulReset () Performs a normal emulator reset.
Function FindEmulWindow () AsInteger
Used internally to set up the global variables,and is not normally used in macros.
Function GetByte (ByVal address AsLong) As Integer
Gets a byte from data memory.
Function GetDWord (ByVal addressAs Long) As Long
Gets a long or double word from data memory.
Function GetPc () As Long Gets the current value of the program counter.
Function GetPsw () As Long Gets the current PSW.
Function Get ShadowByte (ByValaddress As Long) As Integer
Gets a byte from ShadowRam.
Function Get ShadowWord (ByValaddress As Long) As Integer
Gets a word from ShadowRam.
Function GetSp () As Long Gets the current stack pointer value.
Function GetWord (ByVal address AsLong) As Integer
Gets a word from data memory.

EMUL296-PC Chapter 2: Emulator Macro User Guide
Copyright 1996 ICE Technology •• 66
Sub Go_() Starts executing the emulator at the currentaddress.
Sub GoToBP () Starts executing the emulator from the currentaddress and waits until a breakpoint occurs.
Sub LoadCode (codefilename AsString)
Loads a program for emulation.
Sub LoadProject (pname As String) Loads an emulator project setup file.
Sub ModuleSelect (module AsString)
Selects a new module in the current program.
Sub PutByte (ByVal address AsLong, byt As Integer)
Writes a byte into the data memory.
Sub PutDWord (ByVal address AsLong, ByVal dwrd As Long)
Writes a long or double word into datamemory.
Sub PutPc (ByVal address As Long) Sets a new value in the program counter.
Sub PutPsw (ByVal pswreg As Long) Sets a new value in the PSW.
Sub PutSp (ByVal address As Long) Sets a new value in the stack pointer.
Sub PutWord (ByVal address AsLong, ByVal wrd As Integer)
Writes a word into data memory.
Sub RePaint () Redisplays everything in the emulator mainwindow.
Sub SaveTraceText (filename AsString, startframe As Integer,stopframe As Integer)
Save the current trace from the "startframe"number to the "stopframe" number into the filename specified as a text file.
Sub SetAddress (address As Long) Sets an address in all windows that can havean address setting. The correct window mustbe made active with Window Select.
Sub SetBpAtAdr (ByVal address AsLong)
Sets a breakpoint at the requested address.
Sub SetBpAtLine (ByVal lineno AsInteger)
Sets a breakpoint at the requested linenumber.
Sub SetTrigger (ByVal trignum AsInteger, ByVal active As Integer)
Make the trigger "1, 2, 3, or filter" active orinactive.
Sub StepInto () Executes one instruction, including a jumpinstruction.
Sub StepOver () Executes one instruction or all the instructionsin a subroutine.
Function Sym (Symname As String) Gets numeric value of a symbol.

EMUL296-PC Chapter 2: Emulator Macro User Guide
Copyright 1996 ICE Technology •• 67
As Long
Sub WaitUntilReady () Wait for the emulator to become READY.
Sub WindowSelect (number AsInteger)
Activate one of the current child windows, e.g.,Data window, by the number on the Windowpop-up menu.


EMUL296-PC Chapter 3: Emulator Board
Copyright 1996 ICE Technology •• 69
Chapter 3: Emulator Board
EMUL/LC-ISA Emulator Board
Figure 38: EMUL/LC-ISA Emulator Board
The EMUL/LC-ISA board is an 8 bit P.C. card that fits into any slot. The jumpers on theemulator board control three things: 1. the address used to communicate with the Host PC,2. the maximum PC clock communication rate to the target, and 3. whether or not power isprovided to the target through the LC connector. These are all described in more detailbelow.
Note: The power jumper J2 should be left in for EMUL296-PC users.

EMUL296-PC Chapter 3: Emulator Board
Copyright 1996 ICE Technology •• 70
Detailed Installation Instructions
Setting the I/O address jumpers -- J1
Note: The factory default is 0x200 for the software and hardware.
The EMUL/LC-ISA requires 8 consecutive I/O address from the PC’s I/O address space (0Hex -- 3FF Hex) that begin on an address that is a multiple of 8. Set the emulator boardaddress using the jumpers in header J1. These addresses must not conflict with any otherI/O device. Each pair of pins in J1 represents on bit in the 10 bit address. Address bits 0,1, and 2 represent addresses within the 8 consecutive addresses and do not have pin pairsto represent them. This leaves 7 address bits (pin pairs) to set with jumpers. Shorting pinsrepresents a 0 in the address. A pair of pins with no jumper represents a 1. Below are 4examples where the Least Significant Bit (LSB) is on the left, as it in on the board, if youare holding the board so you can read the silk-screened labels, with the 25 pin D connectoron the right.
200 HexPC Bus AddressPin labels
Jumper Settings
A3 A9208 Hex
A3 A9300 HexPC Bus Address
Pin labels
Jumper Settings
A3 A93F8 Hex
A3 A9
Factory Default
Figure 39: Emulator Header J1
Setting the Target Communication Rate -- Header JP1
The PC’s system clock is divided by moving the jumper on JP1.
Set the fixed synchronous communication rate by using Figure 40 to look up the clock ratein the lower row and place one jumper on the header JP1 between the pins indicated in theupper row. There must be only ONE jumper on this header.

EMUL296-PC Chapter 3: Emulator Board
Copyright 1996 ICE Technology •• 71
3 &
41
& 2
5 &
67
& 8
9 &
10
11 &
12
13 &
14
15 &
16
17 &
18
8.3
MH
z
4.2
MH
z2
MH
z1
MH
z
524
KH
z
262
KH
z13
1 K
Hz
65 K
Hz
32 K
Hz
JP1
CLKOUT Rate:
Short these pins:
RP1
Figure 40: Header JP1
Note: The pins on JP1 are not numbered on the board. The picture above shows the orientationof both JP1 and RP1 as they appear on the emulator board. Both pin 1 holes are shownas a square, as they are on the emulator board.
Communication Rate Jumper
The communication rate jumper MUST be set in position 3,4.
Trace Clock Rate
This clock is used for logic download to the Pod. If you have any problems starting theEmulator software when using an external crystal that is less than 16Mhz; you must modifythe .INI file entry for trace clock rate (see below) even if you are not using a trace board.
[TRACE]
clock rate= Enter the POD crystal clock rate here.
The PWR Header -- JP2
Note: Leave this jumper in place.
The third header on the low cost emulator board is the PWR header, which is also labeledJP2. With the jumper in place, +5 volts is supplied from the PC’s power supply through theLC connector up to .5 amps.
Power Supply to Pod / Target
The power supply to the pod / target is controlled by jumper(s) on the POD boards. Seethe POD-296-256-SA-50 section for information on this jumper.


EMUL296-PC Chapter 4: Trace Board
Copyright 1996 ICE Technology •• 73
Chapter 4: Trace Board
Trace Board Introduction
EMUL296™-PC needs RAM to record a history of the data used and instructions executed.The trace board contains this RAM. The Pod board has the logic and connectorsnecessary to support a trace board. The card includes 96 bits of RAM for each tracerecord. Trace boards are available with two sizes of trig memory: 256K or 1M.
Trace Board Detailed Installation Instructions
There are two configuration settings related to the hardware that must be set correctlybefore the trace board can be used. These are both found in the upper left corner of theConfig Trace dialog box.
First, the software must know that there is a trace board in the PC. To indicate that there isa trace board installed, click on the Yes button next to Board installed:. If the top of theTrace window says "Not available" then this option is probably set to disable the traceboard. Figure 41 shows the normal default settings for an installed trace board.
Figure 41. Trace Board I/O Address Setting
Also critical is I/O address:. Be sure to set this field to the same base address as theemulator.
External Inputs and Controls
The Trace board records eight external digital inputs with every bus cycle. These signalsare input through the 15 pin D connector on the edge of the Trace board.
Note: As external inputs and controls are sampled every frame, you cannot expecthigher time resolution than the sample frame rate.

EMUL296-PC Chapter 4: Trace Board
Copyright 1996 ICE Technology •• 74
32
68
1213
111
57
94
10
10K
1415
V CCV CC
BlackBit 0
BrownBit 1
RedBit 2
OrangeBit 3
YellowBit 4
GreenBit 5
BlueBit 6
VioletBit 7
Red-White TRIGGER IN
GND
TRIGGER OUT
Grey (Ground)
Green-White
Clip Colors
Figure 42. Trace Board Connectors
Two of the micro-clips duplicate the trigger controls found in the SMB connectors2:TRIGGER IN (J11) and TRIGGER OUT (J10).
Note that the signal voltage levels for TRIGGER IN and TRIGGER OUT are inverted. Atransition from 5 Volts to 0 Volts on the TRIGGER OUT micro-clip indicates that a triggerhas occurred. The signal is held low until the trace board starts recording again.
The TRIGGER IN micro-clip can prevent triggering when this line is held low. As long asthis line is held low, the Last trig event repeat count will not count down, the events thatsatisfy the trigger conditions will not cause a trigger, and trace recording will not stop.
2 Some trace boards do not have SMB connectors. If your board does not, and you would like them, contact customer support at [email protected]

EMUL296-PC Chapter 4: Trace Board
Copyright 1996 ICE Technology •• 75
Introduction to Tracing
A trace history is a time ordered recording of bus cycles (with some other helpfulinformation). Events that do not affect the CPU external bus, such as testing a CPUinternal data register, will not get recorded. Events that do affect the bus will only getrecorded if the "recorder" is turned on and set up to record those types of events. Alltracing emulators record bus events and not actual instruction execution, so they all musthave some way to deal with the effects of the instruction pipeline. The trace board forEMUL296™-PC includes pipeline decoding and marks opcode fetches that are notexecuted. As a result, the display software can show the trace records as though thepipeline did not exist, but it can also display the uncorrected bus cycles just as they wererecorded.
Tracing starts automatically every time emulation starts. Even single stepping will turn onthe trace recording during that step. Clicking on the Trace Beg button or pressing the F10key will also start recording (but until emulation starts, there will be nothing to record). Oncetrace recording has started, the Trace Beg button changes to the Trace End button, andwill stop recording when clicked. The trace buffer will continue to collect records untilrecording is stopped, either by a trigger, by stopping emulation, by pressing the F10 key, orby clicking on the Trace End button.
Once emulation has started and bus cycles are "being recorded," every bus cycle isexamined to see if it meets the conditions in the Filter: field of the Trace Setup dialog box.If it does, then it will be recorded. If it does not, that bus cycle will not be recorded in thetrace buffer. Bus cycles that are not the correct type (opcode fetch, data read, or datawrite), or that fall outside the address range(s) specified in the Filter: field, will beexamined to see if they meet any trigger conditions but will not be added to the buffer.
Every time tracing starts the buffer is cleared. After recording a single step, the trace bufferwill only contain the records for that one instruction or source line. Once the buffer is full,the new records will begin to overwrite the oldest records. The trace buffer is a ring bufferthat will continue to collect new records and replace old records until recording is stopped.Triggers without an address qualifier will be made inactive.
Triggers and Hardware breakpoints
The trace board can do more than just record what happens on the controller bus. A"trigger" can occur when certain conditions on the bus are met. For example, you canprogram a trigger to occur when the instruction at 4FE Hex has been fetched for the fourthtime. Triggers can start and stop trace buffer recording, and can cause hardwarebreakpoints. These are useful if you are executing out of ROM or need to break oncertain hardware conditions. For information about how to create triggers and hardwarebreakpoints, see the section titled "Trace Setup Dialog Box" on page 80.

EMUL296-PC Chapter 4: Trace Board
Copyright 1996 ICE Technology •• 76
Trace Window
The contents of the trace buffer are displayed in the Trace window. If there is no Tracewindow open, you may open one using the Window menu item and selecting Open a newtrace buffer window. Most of the Trace window features are controlled by the trace menu,and are described in the Trace Menu section below. Please refer to both this section andthe Trace Menu section for a complete description of the Trace window.
Pipeline Effects
When a jump occurs and the pipeline is flushed, some instructions are fetched but notexecuted. These fetched but ignored instructions are captured by the trace board whenthey are fetched but the display software will not disassemble them.
Bus Cycle Order
All bus cycles are shown in the order fetched, not in the order executed. The TraceWindow shows the executed fetches, with the last row possibly showing only fetched andnot executed instructions.
Bus Width
The bus size is dynamic and can be either 8 bits or 16 bits wide, but the trace bufferalways records 16 bits of data for the each bus cycle. Whenever the bus is executing an 8bit bus cycle, the trace board will still record all 16 bits of data on the bus even though theother 8 bits are ignored by the CPU. Normally, when showing corrected bus cycles, theTrace window will not display these bytes.
Trace Menu
Like the other window-specific menus, the Trace menu only appearswhen the Trace window is selected. The Trace menu contains itemsthat control how the trace is displayed.
Find Frame number ..
When this menu item is selected, it opens a dialog box to get thedesired frame number. Once the trace buffer has records, this menuitem scrolls the trace window to the record entered in the dialog box.
Search Address ..
This menu item opens a dialog box, shown in Figure 43, to get the desired address, thensearches from the beginning in the frame buffer for the first record that contains thespecified address.
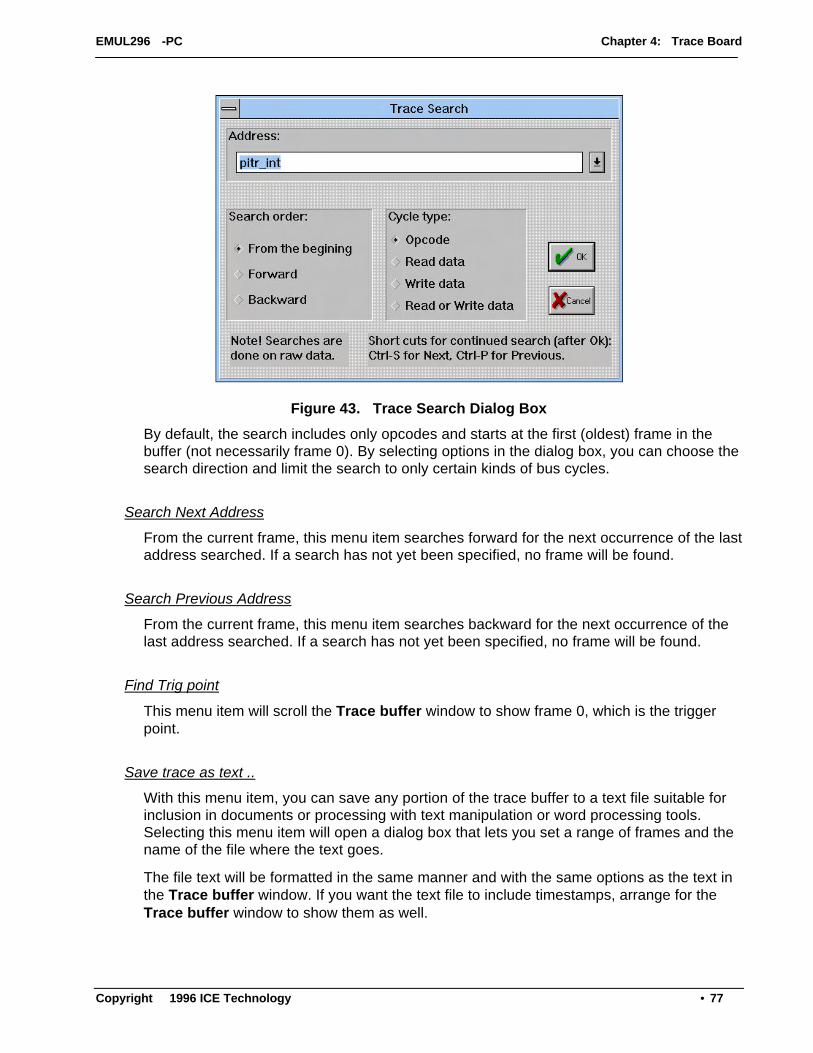
EMUL296-PC Chapter 4: Trace Board
Copyright 1996 ICE Technology •• 77
Figure 43. Trace Search Dialog Box
By default, the search includes only opcodes and starts at the first (oldest) frame in thebuffer (not necessarily frame 0). By selecting options in the dialog box, you can choose thesearch direction and limit the search to only certain kinds of bus cycles.
Search Next Address
From the current frame, this menu item searches forward for the next occurrence of the lastaddress searched. If a search has not yet been specified, no frame will be found.
Search Previous Address
From the current frame, this menu item searches backward for the next occurrence of thelast address searched. If a search has not yet been specified, no frame will be found.
Find Trig point
This menu item will scroll the Trace buffer window to show frame 0, which is the triggerpoint.
Save trace as text ..
With this menu item, you can save any portion of the trace buffer to a text file suitable forinclusion in documents or processing with text manipulation or word processing tools.Selecting this menu item will open a dialog box that lets you set a range of frames and thename of the file where the text goes.
The file text will be formatted in the same manner and with the same options as the text inthe Trace buffer window. If you want the text file to include timestamps, arrange for theTrace buffer window to show them as well.

EMUL296-PC Chapter 4: Trace Board
Copyright 1996 ICE Technology •• 78
Show misc. data
Selecting this menu item will display another 24 bits (shown as 3 bytes in hexadecimalnotation) for each record. The trace board records 8 external input bits from the DB15connector, 8 processor status signals, and 8 signals on the TRACE header on the pod witheach trace record.
Of the three bytes, the left most shows the bits input from the DB15 connector. Figure 42on page 74 shows how the pins of the DB15 are used and which color micro-clip isassigned to which bit in the display.
The other two bytes are sometimes useful to the Customer Support staff butgenerally not useful to our customers. You may ignore these bits until a Customer Supportperson asks you to list them.
Show timestamp
The timestamp is not always displayed. By default, to reduce the size of the Trace window,timestamps are not shown. To see the timestamp, select this menu item.
Benchmarking Using Timestamp
When you have captured a trace and are looking at the timestamp information, keep inmind that the timestamp reflects fetch activity. Therefore, do not try to look at thetimestamp for an individual instruction to determine the execution time. For example, if youwant to know how long it will take to execute a multiply instruction, type in ten multiplyinstructions in the Program Window. Then, type in a jump instruction to the start of themultiply sequence. Executing this sequence and looking at the trace result will let youdetermine the execution time by comparing the time the first byte of a multiply instructionwas fetched to the time the first byte of the subsequent multiply instruction was fetched.
Relative timestamp
The timestamp is an integer which is large enough to uniquely number all CLKOUT cyclesin a 26 hour period running at 50 MHz. The default display mode for the timestamp is toshow the cumulative time since (or before) the trigger. To see the delay between individualinstructions or bus cycles, select this menu item.
This display mode is also useful for timing segments of code. In the example below, onlythe bus cycles at addresses 400-410 were recorded. You can see that each timestamp isshown relative to the timestamp of the next frame in the buffer. Note that frame -1 is not743 milliseconds long. Rather, it was 743 milliseconds between the end of the bus cyclethat fetched the first word of frame -1 and the end of the bus cycle that fetched the firstword of frame 0. It took 743 to finish fetching the operands for frame -1, (execute any otherinstructions in the loop,) and to fetch the first word (4E56) of frame 0.
Also note that the timestamp for the first frame shown, frame -9, shows the time since thevery first frame in the buffer, not the time to the previous frame. This is why the timestampshow 748 milliseconds, not 742 milliseconds, as is shown for the other times through theloop.

EMUL296-PC Chapter 4: Trace Board
Copyright 1996 ICE Technology •• 79
T = 0 at Cursor
The software has the ability to force the timestamp value to zero for a certain frame, givingthe user an easy way to measure execution time (<CTRL>Z).
Figure 44. Example of relative timestamp displayed in seconds
Convert cycles to time
The actual timestamp in the trace record is a count of clock cycles. When this menu item ischecked, the timestamp is displayed in seconds (or fractions thereof) as shown in Figure44. It uses the value in the Clock field of the Trace Setup dialog box to convert the cyclecount to time. If the value in the Clock field is incorrect, these timestamps will be incorrectalso. When unchecked, the Trace window displays the timestamp in clock cycles.
Note: If the application changes the clock frequency dynamically, the timestampdisplayed in seconds may or may not be correct. The timestamp displayed inclock cycles will always be correct no matter what the clock speed.
Synchronize program window
When this menu item is checked, as you move the cursor around the Trace window fromopcode cycle to opcode cycle, the cursors in the Program and Source windows will alsomove to point to the instruction fetched and it's context. If the application is running, onlythe Source window will scroll.
Trace setup ..
Selecting this menu item, just like selecting the Trace .. menu item in the Config menu,opens the Trace Setup dialog box. The details of that dialog box are described in thefollowing paragraphs.
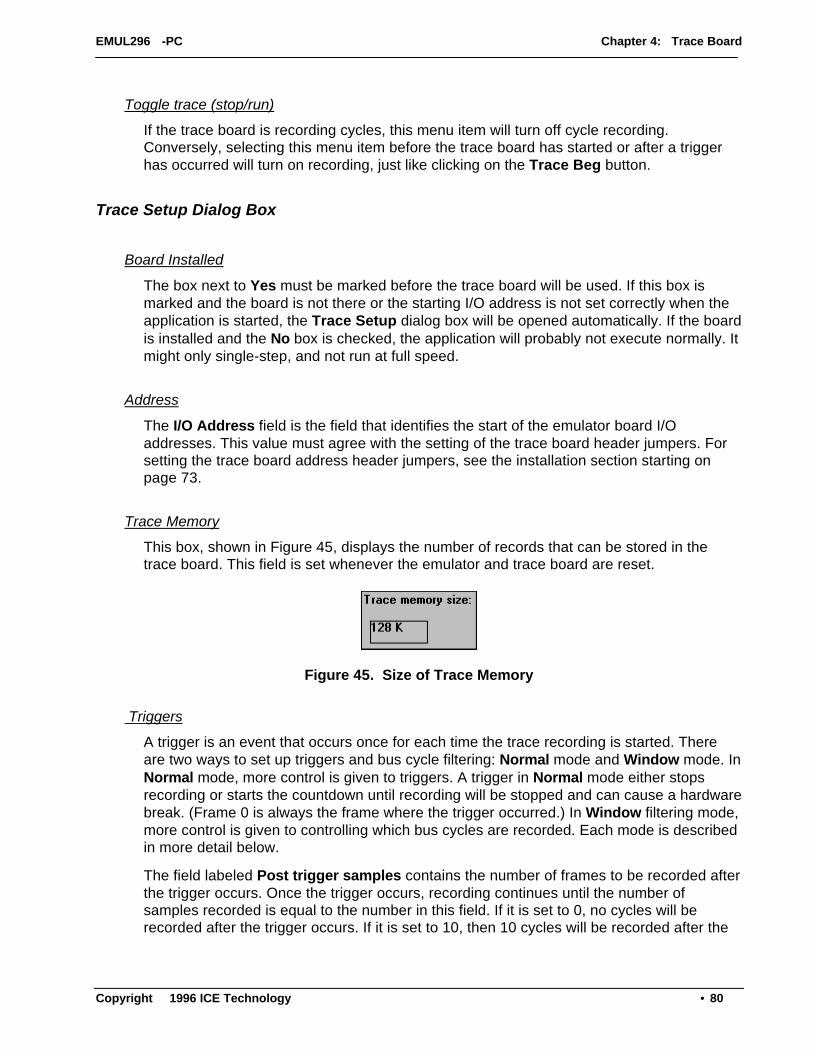
EMUL296-PC Chapter 4: Trace Board
Copyright 1996 ICE Technology •• 80
Toggle trace (stop/run)
If the trace board is recording cycles, this menu item will turn off cycle recording.Conversely, selecting this menu item before the trace board has started or after a triggerhas occurred will turn on recording, just like clicking on the Trace Beg button.
Trace Setup Dialog Box
Board Installed
The box next to Yes must be marked before the trace board will be used. If this box ismarked and the board is not there or the starting I/O address is not set correctly when theapplication is started, the Trace Setup dialog box will be opened automatically. If the boardis installed and the No box is checked, the application will probably not execute normally. Itmight only single-step, and not run at full speed.
Address
The I/O Address field is the field that identifies the start of the emulator board I/Oaddresses. This value must agree with the setting of the trace board header jumpers. Forsetting the trace board address header jumpers, see the installation section starting onpage 73.
Trace Memory
This box, shown in Figure 45, displays the number of records that can be stored in thetrace board. This field is set whenever the emulator and trace board are reset.
Figure 45. Size of Trace Memory
Triggers
A trigger is an event that occurs once for each time the trace recording is started. Thereare two ways to set up triggers and bus cycle filtering: Normal mode and Window mode. InNormal mode, more control is given to triggers. A trigger in Normal mode either stopsrecording or starts the countdown until recording will be stopped and can cause a hardwarebreak. (Frame 0 is always the frame where the trigger occurred.) In Window filtering mode,more control is given to controlling which bus cycles are recorded. Each mode is describedin more detail below.
The field labeled Post trigger samples contains the number of frames to be recorded afterthe trigger occurs. Once the trigger occurs, recording continues until the number ofsamples recorded is equal to the number in this field. If it is set to 0, no cycles will berecorded after the trigger occurs. If it is set to 10, then 10 cycles will be recorded after the

EMUL296-PC Chapter 4: Trace Board
Copyright 1996 ICE Technology •• 81
trigger occurs. If it is set to the total buffer size, then frame 0 will always be the first framein the buffer.
Note: If the trace board is configured to break execution when the trigger occurs,the Post trigger samples field is not used because recording will stop whenexecution stops. If the on trace stop box is checked, then this field controlswhen the break will occur.
The Last trigger repeat count field contains the number of times the highest numberedtrigger conditions must be met before the trigger itself occurs. If a trigger condition is set foran opcode fetch at address 400 and the Last trigger repeat count is set to 10, the first 9fetches from address 400 will be counted and the trigger will occur when that opcode isfetched for the 10th time.
This count may be as high as 256, and applies to the last (highest numbered) trigger eventthat has conditions in Normal filter mode. If Trig event3 has no conditions, it will beignored and the conditions in Trig event2 will be counted. If neither event 2 nor event 3have any conditions, the Trig event1 events will be counted.

EMUL296-PC Chapter 4: Trace Board
Copyright 1996 ICE Technology •• 82
Filter Mode: Normal
Using the Normal filter mode, you can set up 3 trigger conditions. Each trigger condition isa series of statements that are OR'ed together logically. Each statement contains oneaddress range and one type of bus cycle. Approximately 2000 statements may be used ineach trigger condition. The three triggers conditions are tested sequentially: once theconditions for trigger 1 are met, the conditions for trigger 2 (if present) are tested. If thereare no trigger 2 conditions, then all the conditions are satisfied and the trigger occurs. andlikewise for trigger 3. See the section starting on page 95 for information about setting andchanging the trigger conditions.
Figure 46 shows that trigger 1 has one condition and it will be met by "any" kind of buscycle that includes any address from 0 to 7FFFF.
Figure 46. Trigger on anything
With Filter mode: Normal, bus cycles are recorded until a trigger stops the recording.Recording bus cycles is a separate activity from deciding to trigger or not, and so it has aseparate set of conditions. The Filter: field can contain up to 2000 statements that arelogically OR'ed to decide whether to record the bus cycle or not. In Figure 47, the traceboard will record everything from the start of main to MAIN + 100H, the opcode fetchesbetween line 93 and 108 from the module TIME, and only the data bus cycles (read andwrite cycles) to and from address timer.sec (1338H).
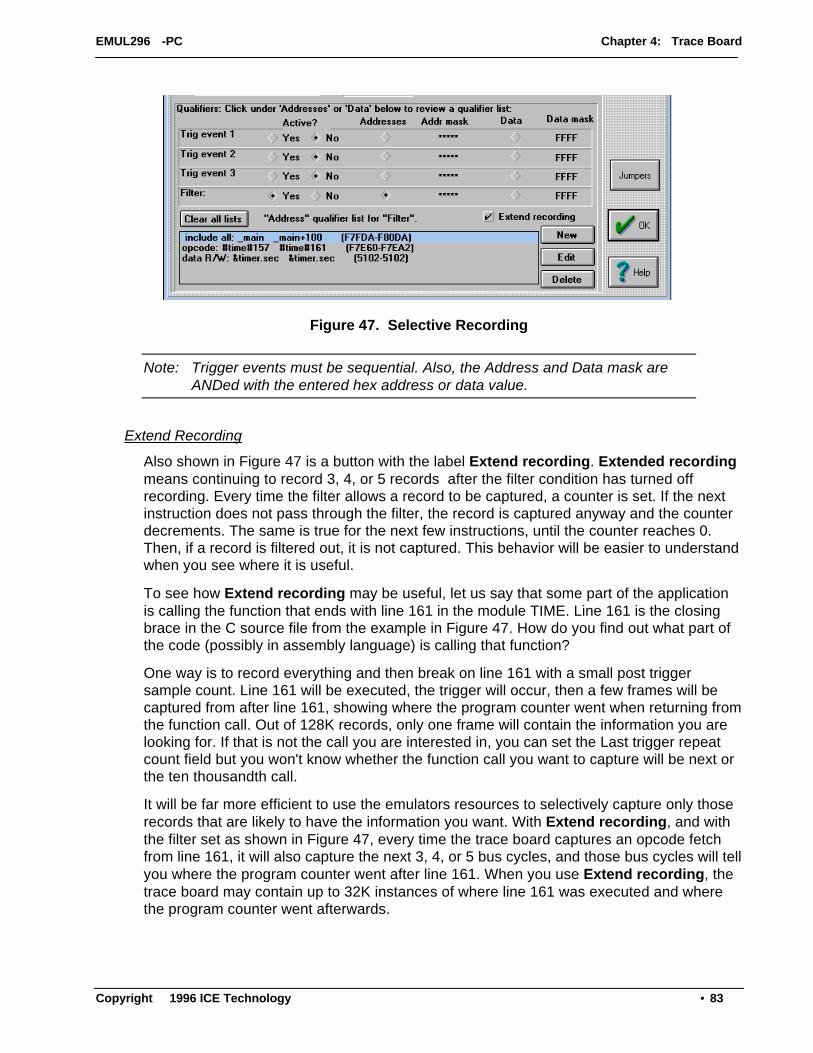
EMUL296-PC Chapter 4: Trace Board
Copyright 1996 ICE Technology •• 83
Figure 47. Selective Recording
Note: Trigger events must be sequential. Also, the Address and Data mask areANDed with the entered hex address or data value.
Extend Recording
Also shown in Figure 47 is a button with the label Extend recording. Extended recordingmeans continuing to record 3, 4, or 5 records after the filter condition has turned offrecording. Every time the filter allows a record to be captured, a counter is set. If the nextinstruction does not pass through the filter, the record is captured anyway and the counterdecrements. The same is true for the next few instructions, until the counter reaches 0.Then, if a record is filtered out, it is not captured. This behavior will be easier to understandwhen you see where it is useful.
To see how Extend recording may be useful, let us say that some part of the applicationis calling the function that ends with line 161 in the module TIME. Line 161 is the closingbrace in the C source file from the example in Figure 47. How do you find out what part ofthe code (possibly in assembly language) is calling that function?
One way is to record everything and then break on line 161 with a small post triggersample count. Line 161 will be executed, the trigger will occur, then a few frames will becaptured from after line 161, showing where the program counter went when returning fromthe function call. Out of 128K records, only one frame will contain the information you arelooking for. If that is not the call you are interested in, you can set the Last trigger repeatcount field but you won't know whether the function call you want to capture will be next orthe ten thousandth call.
It will be far more efficient to use the emulators resources to selectively capture only thoserecords that are likely to have the information you want. With Extend recording, and withthe filter set as shown in Figure 47, every time the trace board captures an opcode fetchfrom line 161, it will also capture the next 3, 4, or 5 bus cycles, and those bus cycles will tellyou where the program counter went after line 161. When you use Extend recording, thetrace board may contain up to 32K instances of where line 161 was executed and wherethe program counter went afterwards.

EMUL296-PC Chapter 4: Trace Board
Copyright 1996 ICE Technology •• 84
Filter Mode: Window
Using the Window filtering mode gives a different kind of control over what cycles arerecorded, and can selectively record program threads in a way that record filtering cannot.Like trigger conditions, the Enable recording and Disable recording conditions are setusing the editor described below, and each condition is logically OR'ed with all otherconditions to find a match. Bus cycle recording will start when the Enable recordingconditions are met, and will stop when the Disable recording conditions are met. Oncerecording has started, the conditions in the Filter field decide whether to record a bus cycleor not.
Figure 48: Filter Mode Window
Editing the Trigger Conditions
To set up the trigger conditions, click on one of the triggers (or recording controls), click onthe statement you wish to change, then click on the Edit button. This will open an Addressqualifier window like the one in Figure 49. The Start: field will be selected. Type theaddress range start (either a hexadecimal number or a symbol name), hit <TAB> to get tothe End: field (or click on it), type the upper limit of the address range, and then click onone of the types of cycles. Figure 49 shows how to monitor a single address: put thataddress in both the Start: and End: range fields.
Figure 49: Data mode = Opcode
By default the Data mode field has the Opcode box marked. Marking the Data box givesyou the options shown in Figure 50.
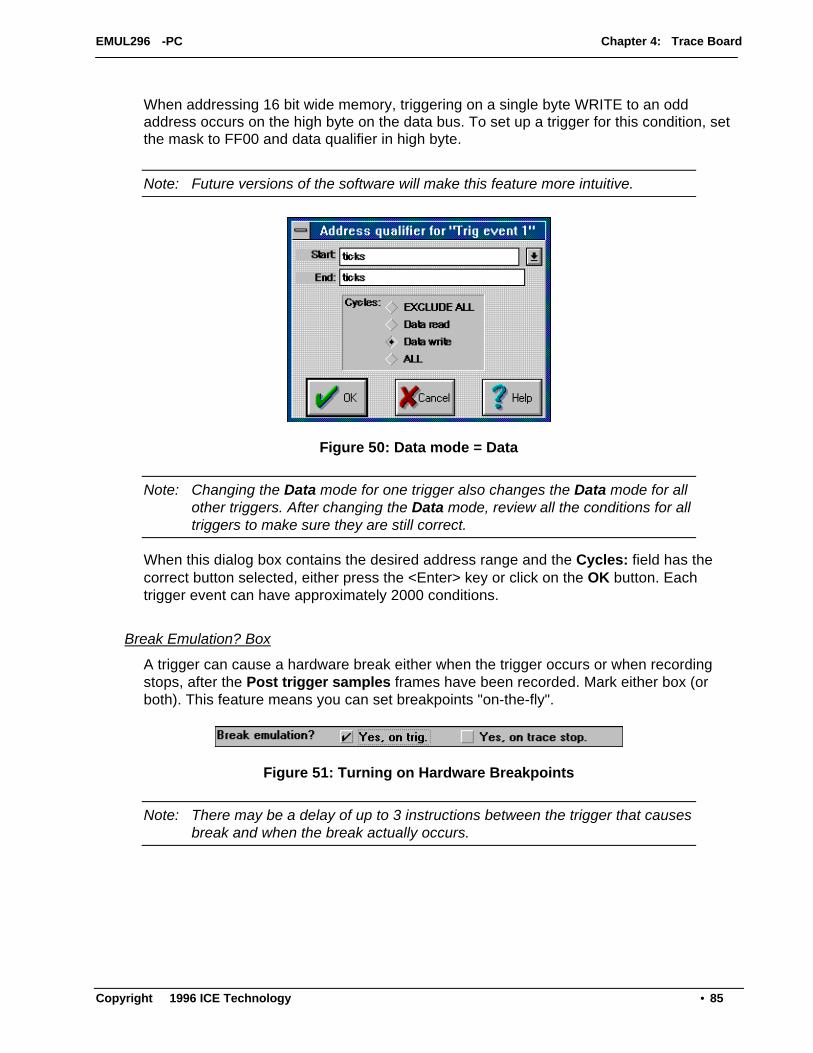
EMUL296-PC Chapter 4: Trace Board
Copyright 1996 ICE Technology •• 85
When addressing 16 bit wide memory, triggering on a single byte WRITE to an oddaddress occurs on the high byte on the data bus. To set up a trigger for this condition, setthe mask to FF00 and data qualifier in high byte.
Note: Future versions of the software will make this feature more intuitive.
Figure 50: Data mode = Data
Note: Changing the Data mode for one trigger also changes the Data mode for allother triggers. After changing the Data mode, review all the conditions for alltriggers to make sure they are still correct.
When this dialog box contains the desired address range and the Cycles: field has thecorrect button selected, either press the <Enter> key or click on the OK button. Eachtrigger event can have approximately 2000 conditions.
Break Emulation? Box
A trigger can cause a hardware break either when the trigger occurs or when recordingstops, after the Post trigger samples frames have been recorded. Mark either box (orboth). This feature means you can set breakpoints "on-the-fly".
Figure 51: Turning on Hardware Breakpoints
Note: There may be a delay of up to 3 instructions between the trigger that causesbreak and when the break actually occurs.


EMUL296-PC Chapter 5: Pod Boards
Copyright 1996 ICE Technology •• 87
Chapter 5: Pod Boards
Features Common to All Pods
Every pod is a fully functional, stand-alone 8xC296 board, with a processor, RAM, acrystal, PROM, and logic to glue all those pieces together.
How It Works
Clicking on the Reset button tells the emulator to pull the RST line low, resetting thecontroller. When the RST line is released, the controller begins by executing instructionsthat allow the emulator board to communicate with the pod. These instructions are themonitor code. The controller will continue to execute monitor code until you click on theStep button, the GO button, or select Reset and go from the Run menu.
When you click on the Break button, a specific kind of non-maskable interrupt occurs, thereturn address is pushed on the stack, the program counter is loaded with thecorresponding vector, and it continues to run at the new address. The new address ismapped to the pod. That memory contains the monitor code.
When sections of memory are displayed on your screen, it is the controller that actuallyreads the memory locations and sends the values back to the emulator board in your PC. Ifthe emulator cannot read the contents of memory, then your application will not be able toeither.
Note: If you are running user code, target power can be turned off/on to emulate power on ifreset is held low during power off. Some emulation chips will require a special powerboard.
Stack Pointer
Because the emulator pushes the return address on the stack, the Stack Pointer mustpoint to valid memory and there must be room on the stack for 2 bytes (or 4 bytes for usersof chips with larger addressable ranges) to hold the address.
In addition, there is a lower limit to the Stack Pointer. If the Stack Pointer has a value of0x50 or less, it interferes with emulation. This is not usually a problem but we want you toknow about it.
Indicator Lights
The pod boards contain 4 lights. They are labeled HALT, RESET, RUN, and USER. TheHALT light is lit whenever the P2.5 (HOLD#) goes low. The RESET light will only be litwhen the emulator resets the controller. The RUN light will be lit whenever the controller isexecuting user code (as opposed to monitor code). You may use the USER light to indicate
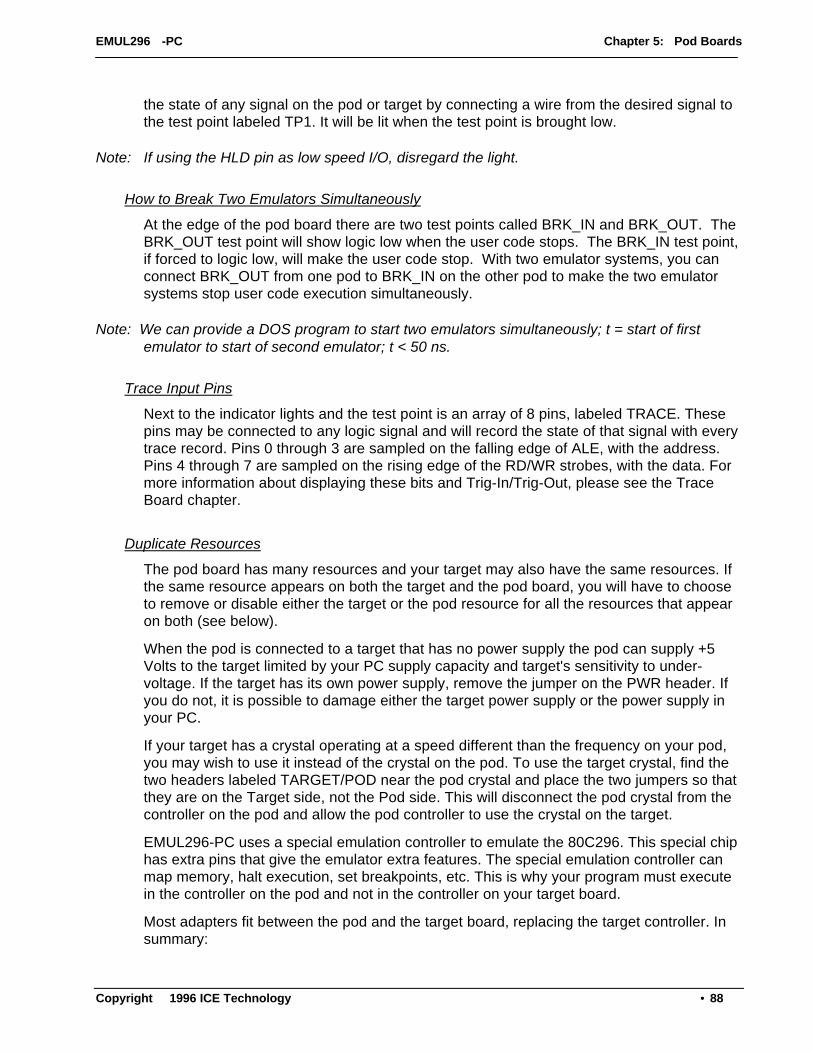
EMUL296-PC Chapter 5: Pod Boards
Copyright 1996 ICE Technology •• 88
the state of any signal on the pod or target by connecting a wire from the desired signal tothe test point labeled TP1. It will be lit when the test point is brought low.
Note: If using the HLD pin as low speed I/O, disregard the light.
How to Break Two Emulators Simultaneously
At the edge of the pod board there are two test points called BRK_IN and BRK_OUT. TheBRK_OUT test point will show logic low when the user code stops. The BRK_IN test point,if forced to logic low, will make the user code stop. With two emulator systems, you canconnect BRK_OUT from one pod to BRK_IN on the other pod to make the two emulatorsystems stop user code execution simultaneously.
Note: We can provide a DOS program to start two emulators simultaneously; t = start of firstemulator to start of second emulator; t < 50 ns.
Trace Input Pins
Next to the indicator lights and the test point is an array of 8 pins, labeled TRACE. Thesepins may be connected to any logic signal and will record the state of that signal with everytrace record. Pins 0 through 3 are sampled on the falling edge of ALE, with the address.Pins 4 through 7 are sampled on the rising edge of the RD/WR strobes, with the data. Formore information about displaying these bits and Trig-In/Trig-Out, please see the TraceBoard chapter.
Duplicate Resources
The pod board has many resources and your target may also have the same resources. Ifthe same resource appears on both the target and the pod board, you will have to chooseto remove or disable either the target or the pod resource for all the resources that appearon both (see below).
When the pod is connected to a target that has no power supply the pod can supply +5Volts to the target limited by your PC supply capacity and target's sensitivity to under-voltage. If the target has its own power supply, remove the jumper on the PWR header. Ifyou do not, it is possible to damage either the target power supply or the power supply inyour PC.
If your target has a crystal operating at a speed different than the frequency on your pod,you may wish to use it instead of the crystal on the pod. To use the target crystal, find thetwo headers labeled TARGET/POD near the pod crystal and place the two jumpers so thatthey are on the Target side, not the Pod side. This will disconnect the pod crystal from thecontroller on the pod and allow the pod controller to use the crystal on the target.
EMUL296-PC uses a special emulation controller to emulate the 80C296. This special chiphas extra pins that give the emulator extra features. The special emulation controller canmap memory, halt execution, set breakpoints, etc. This is why your program must executein the controller on the pod and not in the controller on your target board.
Most adapters fit between the pod and the target board, replacing the target controller. Insummary:

EMUL296-PC Chapter 5: Pod Boards
Copyright 1996 ICE Technology •• 89
RESOURCE: WHAT TO DO WHEN THE TARGET HAS IT:
RAM Map the RAM to the Target by using CS0..5
Crystal Move JP7 and JP10 to "TARGET" side of header
Serial Port Do not use J1, remove RXD jumper.
Power Supply Remove the jumper from the PWR header
The black wire with the micro-clip is a ground wire, which is helpful for ensuring that thepod and target grounds are at the same potential. We recommend you attach this clip to agrounded point on your target before attaching the pod to the target.
Configuration Requirements
The emulator is designed to be as transparent as possible to the target and the targetapplication. There is a short list of things that the emulator requires of the target. Those aredescribed here.
The Intel manuals say that address 18H is reserved for the Stack Pointer. However, whenfetching instructions, a fetch from that address will get the instruction from an externalmemory device. On the pod, that address contains the value 0. If you map address 18H tothe target, your target ROM/RAM must also contain a 0.
The emulator requires enough memory to push a return address onto the stack. If the stackis pointing to memory that doesn't exist or is pointing to address 0, the emulator will beunable to reach it's monitor code and communications with the emulator will fail.
Do you have enough emulator memory?A POD-296-256-xx only has 256K of breakpoint memory in parallel with 256K of emulationmemory. That means that you only have four pages to use. If you have pages thatoverlap because of this, you should order a 1M pod. For instance, if you access to aphysical memory at address 5000H, it will also show on three other pages: 45000H,85000H and C5000H. The emulator reads them from page zero.
Internal Addressing or Single Chip Mode
Note: This section pertains only to pods that emulate controllers that support single-chipoperation, unlike the current POD-296SA.
Target designs that use only internal RAM and ROM may use the address and data buspins for low speed I/O. This is called either single-chip mode or Internal Addressing mode.Pulling the EA pin high during RESET will configure the 8xC296 for internal addressing,freeing the address and data bus pins for general purpose I/O. Even when in single-chipmode, the pod still uses emulation RAM as a substitute for internal RAM and ROM in thetarget controller, which requires the same pins being used for I/O on the target. In fact,unlike a normal 8xC296, the address, data, and bus control pins on the special emulationcontroller cannot be used for low speed I/O. This creates a conflict between single-chip

EMUL296-PC Chapter 5: Pod Boards
Copyright 1996 ICE Technology •• 90
target applications and emulation. The solution to this conflict is a Port Replacement Unitthat reconstructs the low speed I/O ports for the target. (External only controllers do notneed a port replacement unit.)

EMUL296-PC Chapter 6: POD-296-256-SA-50
Copyright 1996 ICE Technology •• 91
Chapter 6: POD-296-256-SA-50
Introduction
Warning: Do not install more than one jumper on EA16 (JP6). If you do, you are likely todamage the target, the pod, or both.
This pod board contains an Intel 80C296 special emulation microcontroller chip suitable foremulating the Intel 8xC296SA, an oscillator operating at either 16, 20, or 25 (50) MHz, 256kilobytes of emulation RAM for instructions and/or data, circuits for driving the bus, twoPROMs, and two large FPGA chips.
Halt Reset Run UserJP31 JP32 JP30
ALE
/T_A
LE
P2.
5/H
OLD
#
INS
T/T
_IN
ST
JP24JP25JP26JP27JP28JP29
Mem
ory
Map
Sel
ect
JP40
Auto BWManual BW JP
5JP
21JP
17JP
12
JP13
JP14
RXD
RST
RDY
JP9GND
EA16
INSTJP6
XJP
3
PW
R
JP7 JP10TA
RG
ET
/PO
D
TA
RG
ET
/PO
D
AutoMap
NOHAU CORP. POD-296SA REV C
Figure 52: POD-296-256-SA

EMUL296-PC Chapter 6: POD-296-256-SA-50
Copyright 1996 ICE Technology •• 92
JP31 JP32 JP30
ALE
/T_A
LE
P2.
5/H
OLD
#
INS
T/T
_IN
ST
JP24JP25JP26JP27JP28JP29
Mem
ory
Map
Sel
ect
JP40
Auto BWManual BW JP
5JP
21JP
17JP
12
JP13
JP14
RXD
RST
RDY
JP9GND
EA16
INSTJP6
XJP
3
PW
R
JP7 JP10TA
RG
ET
/PO
D
TA
RG
ET
/PO
D
AutoMap
Figure 53. Enlargement of POD-296-256-SA Jumper Configuration
Dimensions
The pod board itself is 6.5 inches by 4 inches (16.6 cm. by 10.3 cm). The pod requiresbetween one and two inches (2.5 cm to 5 cm) of space above the target, depending uponwhich adapter is being used to connect the pod to the target.

EMUL296-PC Chapter 6: POD-296-256-SA-50
Copyright 1996 ICE Technology •• 93
POD-296-256-SA The footprint dimensions for the pin pattern are shown in Figure 54. Thisinformation enables the design of a board with a matching pin pattern, eliminating the needfor an adapter.
0.1 in.
0.3 in.
2.2
in.
56 m
m
1 .81 in.46 mm
Figure 54. Footprint Dimensions
POD-296-256-SA Emulation Memory
This pod comes with 256K bytes of high speed static RAM for emulating ROM or targetRAM. Controllers like the 8xC296SA, with 20 address bits, can address 1 megabyte. Supporthas information about ordering a 1 megabyte pod. (See “Do You Have EnoughEmulator Memory?” on page 89).
Wait States
The emulator uses the number of wait states specified in the Emulator Hardware Configdialog box. (or found in the CCBs. In addition, you may use the READY pin to increase thenumber of wait states to any number. If the target board continuously holds the READY pinlow, the application will stop executing and the emulator may display one of several errormessages. (An oscilloscope trace of the READ or WRITE strobe will show the strobe signalstuck low.) If the emulator hangs in this way, remove the READY jumper to isolate thetarget READY signal from the emulator READY pin until your target works.
Note: Every time you have the emulator reset the controller, the emulator software writes $0000to addresses $1F40 and $1F42. This feature uses chip select 0 to activate emulation RAMthroughout the entire address range and allows you to load code. Typically your start-upcode will reprogram the chip select registers and your application will then run normally.

EMUL296-PC Chapter 6: POD-296-256-SA-50
Copyright 1996 ICE Technology •• 94
Breakpoints
All breakpoints (hardware and software) should be enabled and disabled by clicking on theline number in either the source window or the program window. If you use the hardwarebreakpoint dialog box, make sure you put the breakpoint at the first byte of instruction.Hardware breakpoints on protected instructions3 will lock up the 80C296SA emulationchip..
POD-296-256-SA Headers
In Figure 52, all the headers are shown with their jumpers in the factory default positions.Figure 55 shows some of these headers in detail.
When shipped from the factory, all headers have jumpers located for stand-alone operation(without a target). When you do connect this pod to a target, be sure to examine alljumpers and make sure that they are all correctly placed. Use the descriptions below as aguide to jumper placement.
POD-296-256-SA Clock Headers: JP7 & JP10These jumpers are located on either side of the oscillator on the pod. They are used toselect whether the 80C296SA special emulation chip will use the clock from the target orfrom the pod. Both jumpers should be moved to the same position (TARGET or POD). Ifthe target has an oscillator at a different frequency than the one on the pod, it isrecommended that these jumpers be in the TARGET locations.
POD-296-256-SA PWR Header: XJP3This jumper should be removed when connected to the target. It is intended to supplypower to the special emulation chip when running the pod without a target. The pod cansupply up to 100 mA to the target but it is recommended that this jumper be removed whenthe target has its own power supply or when the power requirements of the target exceed0.1 amps.
POD-296-256-SA RXD Header: JP13If your target outputs debugging information on the serial port, you may wish to connect anRS232 device like a terminal or a PC to header J1. This pod includes a MAX232 chip toconvert the signal levels from RS232 to TTL levels. Whether or not you connect the RxDpin on J1 to an RS232 device, the MAX232 chip will drive the serial port input pin on thecontroller. To keep the MAX232 chip from driving the serial input pin on the controller,remove the jumper on the RXD header. To allow the MAX232 chip to drive the serial portinput pin, place a jumper on the header.
3 The following are considered to be protected instructions: PUSHF, POPF, PUSHA, POPA, DI, DI, SIGN(0xFE), and the first instruction of an interrupt service routine.

EMUL296-PC Chapter 6: POD-296-256-SA-50
Copyright 1996 ICE Technology •• 95
POD-296-256-SA RST Header: JP14Occasionally, a target may contain an external device designed to reset the controller bypulling the RST pin low. During debugging, that may be inconvenient. The signalfrom the target RST pin passes through the RST header. Removing the RST jumper willprevent the external device from resetting the pod controller.
JP24
JP25
JP26
JP27
JP28
JP29
Memory Map Select
JP40
Auto B
WM
anual BW
JP5JP21JP17JP12
JP13
JP14
RX
D
RS
T
RD
Y
JP9
GN
D
EA
16
INS
T
JP6
Auto
Map
Figure 55: Pod Configuration Headers
POD-296-256-SA Auto/Manual BW Header - JP5This jumper should remain in the default (AUTO-BW) position. (This jumper was previouslyused for the 80C296 NU emulation chip.)
POD-296-256-SA Auto Map Header: JP40This jumper, when in place, currently maps all memory to the pod. This is sometimesconvenient when running without a target. Normally, this jumper should be removed sothat all memory mapping is done using the chip selects. On previous pods (196NP/NU)this jumper would allow mapping to be done with software. Because of the largeraddressability of the 296SA and the high speeds, software mapping is not an option. Allmapping should be done with this jumper removed and corresponding jumpers should beplace on JP24-JP29. Installing JP40 will map all memory to the pod.
POD-296-256-SA JP6, JP12, JP17, & JP21 (EA16-EA19) HeadersBecause the upper address lines (A16-A19) can be used either as I/O pins or as addresslines, we need to determine whether or not these pins should be directed to pod memoryand whether or not they should be sampled in the trace. If any of these pins are notconfigured as extended address lines, the corresponding jumper should be placed in theGND position. All four jumpers should reflect the configuration of the EPORT registers. Itis also important that the Hardware Config. Menu match these jumper settings or thesoftware could hang. JP6 also has a third position labeled INST. This is not supportedand there should never be a jumper in this position.
Symbols in the Trace WindowRight out of reset, the 80C296SA looks for the start-up code and CCB values starting at FF2018. Many applications will compile and link code (and all code symbols) to page FF 0000and up. If that application also maps global variables to address 0 and then uses some of

EMUL296-PC Chapter 6: POD-296-256-SA-50
Copyright 1996 ICE Technology •• 96
the higher address pins for low speed I/O, the trace disassembly will be unable toassociate the trace buffer addresses to the correct code symbols. (Some of the EA1xjumpers will need to be in the GND position.) If this is true for your application, there is awork-around you may want to consider.
Under these circumstances, to correctly associate addresses with symbols, the trace boardneeds to receive an address that is different than the one appearing on the address pins. Ifyou run a wire from the EA1x side of the highest TRA1x header not carrying an I/O signalto the center pins of the higher address headers, the trace board will get correct addressfor code space and will likely still get correct addresses for data space bus cycles. A pictureand an example will make it much more clear.
M_I
NS
EA
17\G
ND
EA
18\G
ND
EA
19\G
ND
JP12
\TR
A17
JP17
\TR
A18
JP21
\TR
A19
EA
16
GN
D
JP6/
TR
A16
Figure 56: Wiring for 256k by 8 RAM chips
The application in Figure 56 uses the two highest address pins for low speed I/O. The 256kby 8 RAM chips for holding data need 18 address bits: bit 0 through bit 17. Again, theinstructions are mapped to the top of the address range: from FF 0000 to FF FFFF hex.This wiring ensures that when address pin 17 is high, the trace board will receive highsignals for TRA17, TRA18, and TRA19. If this example application has global data symbolsbetween 20000 hex to 40000 hex, they will not be identified correctly in the Trace window.This wiring will have no effect on how the trace displays global symbols below 20000 hexor local variables found on the stack.
POD-296-256-SA JP30-JP32 (P2.5, ALE, INST) HeaderThese jumpers should all be moved together depending upon how P2.5 is configured. IfP2.5 is configured as standard I/O, these jumpers should be in default position 1&2(P2.5,Inst,Ale). However, if P2.5 is configured as HOLD#, these jumpers should be inposition 2&3 (HOLD,T_Inst,T_Ale) -- (used to tristate these pins during hold).
POD-296-256-SA RDY Header: JP9Similar to the RST jumper, the RDY jumper passes the READY signal from the target to thecontroller. Since the controller is also responsible for communicating information to theWindows software, if Ready suspends the operation of the controller, it will also suspendthe communication between the pod and the Windows software. To get past this problem,the RDY jumper may be removed to continue operation of the controller if a problem shouldoccur.
POD-296-256-SA Memory Mapping Headers: JP24 - JP29A jumper block on one or more of these headers will pass the corresponding chip selectsignal to a PAL to create our mapping signal. One side of the header is connected to a

EMUL296-PC Chapter 6: POD-296-256-SA-50
Copyright 1996 ICE Technology •• 97
chip select signal. The other side has a pull-up resistor and is fed to the PAL. The PALANDs all of these signals together such that a logic zero on any input will map that cycle tothe pod. Thus, for each chip select that has a jumper block installed, the address range ofthat chip select will be mapped to the pod. With no jumper blocks installed, all memoryaccess will be directed to the target. A typical configuration would be to have a jumper onCS0 (JP24) only so that the code is mapped to the pod memory and all other memoryaccess will be directed to the target. This should be in addition to JP40 being removed.
Note: Software Memory mapping is NOT supported by the 296SA. The memory mapping dialogbox should not be used.
Mapping Memory Using Chip SelectsWhile debugging your hardware and software, you typically want to use the RAM on yourtarget for data and replace your EPROM with emulation RAM so you can reload and runyour application quickly.
RESISTOR 7 PACK
V CC
FROM SOFTWARE MEMORY MAPPING
JUMPERS
CS for ON-POD MEMORY
EMULATIONRAM ON POD
JP24JP25JP26
JP27
JP29JP28
P3.0/CS0P3.1/CS1P3.2/CS2
P3.3/CS3P3.4/CS4P3.5/CS5
8xC296SARD
WRL
WRH
ICE_READ
ICE_WRL
ICE_WRH
USER_READ
USER_WRL
FAST244
QUICKSWITCH USER_WRH
TO TARGET
INTEL
JP40
Figure 57: Schematic for Memory Mapping
The essence to using chip selects to map memory is to map all addresses to the target andthen use a chip select signal (or your target PAL output) to override the software mappingand re-map an address range back to the emulation memory on the pod. This signal canbe either a chip select signal from the 8xC296SA controller, or it can be the output fromsome address decoding logic.
To use a chip select signal, place a jumper on the corresponding header. JP24 throughJP29 pass CS0 through CS5 respectively. When any jumpered chip select signal is active(low) bus cycles will be directed to the pod.
To use the output from a PAL on your target, run a wire from the PAL to the JP24 header,to the pin closest to the edge of the pod. When that pin is pulled low by the PAL, buscycles will be directed to the pod.

EMUL296-PC Chapter 6: POD-296-256-SA-50
Copyright 1996 ICE Technology •• 98
Note: The read-strobe and write-strobe signals are gated so that there can never be a buscollision between emulation RAM and target memory devices.
Note: Inserting jumper JP40 will map all memory to the pod for running the emulator without atarget.
Warning: Mapping all RAM addresses to a fully functioning target will almost never cause anynew problems. But, the emulator cannot function normally when stack RAMaddresses are mapped to non-functioning RAM.
Note: When using an EMUL296 trace board, the trace port address should match the emulatorport address in the EMUL296.INI file.
Note: Because of a limitation in the debug capabilities of the current 80C296SA emulation chip,we will not support non-prioritized mode (PRIOR_EN = 0). Normal operation requires thatthe user’s code set the PRIOR_EN bit in the NMI_PEND register and that no interrupts areallowed prior to this occurring. If this is not done, the emulator will not be able to runmonitor code without being interrupted, which will result in communication errors.

EMUL296-PC Chapter 7: Accessories
Copyright 1996 ICE Technology •• 99
Chapter 7: Accessories
Overview
To support EMUL296™-PC, we provide hardware accessories and supports severalcompilers. Most of the hardware accessories are adapters for connecting the various podsto a wide variety of targets. The compilers described at the end of this chapter are for themicrocontrollers with both 16 bit and 20 bit addressing. This list of accessories wascomplete as of the publication date, but new accessories and support for new compilersare added routinely. Contact us for current prices and a complete list ofadapters and compilers for EMUL296™-PC.
This chapter contains descriptions of adapters for PLCC parts, pin grid array parts, andclips for surface mount applications. After that the Port Replacement Units are described.Following those are the miscellaneous hardware accessories that make the adapters evenmore adaptable to unusual target configurations. Finally, the compilers are described ingeneral terms; outlining issues pertinent to the EMUL296™-PC debugging environment.
The most effective way to connect the pod to the target is to design headers on your targetthat match the pins on the underside of the pod. Doing this will avoid the cost, capacitance,and extra contacts associated with each kind of adapter. If you have the space on yourtarget board, we highly recommend adding these sockets to your target. If your target doesnot have room, all of the following adapters are equally effective and easy to use.
Surface-mount QFP adapters - SA Family
The following diagrams show the proper adapter orientation for the microcontrollers listed.
Adapter Circuit BoardBond-Out on POD
8xC296SA-QFP,8xC296SA-SQFP
Orientation ofadapter PCB(usually green)
Orientation ofceramic chip ontop of POD board
Orientation ofcustomer chip
Figure 58: QFP/SQFP Adapter Orientation

EMUL296-PC Chapter 7: Accessories
Copyright 1996 ICE Technology •• 100
Target board
1.19 in.30 mm.9 in.
23 mm
Adapter Disassembled 2.09 in.53 mm.
AdapterBase
2.6 in.66 mm.
1
48
2.2 in56 mm.
J3
J1D
J1C
J1B
J1ANohau Corp. 1994
J2
Figure 59: Dimensions for EMUL296-PC/SA-ADP100-QFP/ET
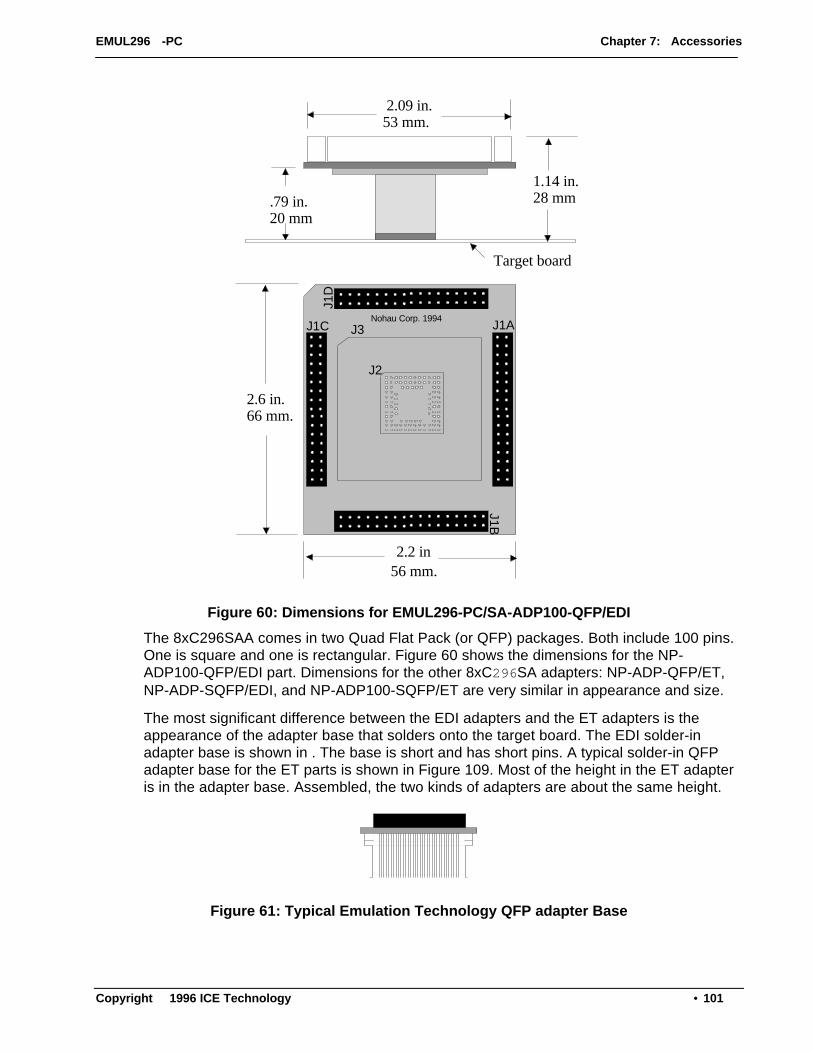
EMUL296-PC Chapter 7: Accessories
Copyright 1996 ICE Technology •• 101
Target board
1.14 in.28 mm.79 in.
20 mm
2.09 in.53 mm.
2.6 in.66 mm.
1
48
2.2 in56 mm.
J3J1
DJ1C
J1BJ1A
Nohau Corp. 1994
J2
Figure 60: Dimensions for EMUL296-PC/SA-ADP100-QFP/EDI
The 8xC296SAA comes in two Quad Flat Pack (or QFP) packages. Both include 100 pins.One is square and one is rectangular. Figure 60 shows the dimensions for the NP-ADP100-QFP/EDI part. Dimensions for the other 8xC296SA adapters: NP-ADP-QFP/ET,NP-ADP-SQFP/EDI, and NP-ADP100-SQFP/ET are very similar in appearance and size.
The most significant difference between the EDI adapters and the ET adapters is theappearance of the adapter base that solders onto the target board. The EDI solder-inadapter base is shown in . The base is short and has short pins. A typical solder-in QFPadapter base for the ET parts is shown in Figure 109. Most of the height in the ET adapteris in the adapter base. Assembled, the two kinds of adapters are about the same height.
Figure 61: Typical Emulation Technology QFP adapter Base

EMUL296-PC Chapter 7: Accessories
Copyright 1996 ICE Technology •• 102
With all the solder-in adapters, the base plugs into the rest of the adapter both to facilitatesoldering, and to let you separate the pod from the target without separating the pod fromthe adapter. Once the target, adapter, and pod are assembled, you may find it easier toseparate the two halves of the adapter than to separate the pod from the adapter. In eithercase, use care when disconnecting the pod from the target to avoid damaging any of thecomponents.
POD Board
Adapter
Target
100 squareQFP footprint
Processors:8xC296SA-SQFP(100SQFP Devices)
Notes:
Adapter, 100 pin, square QFP for 296SA. Soldersto user's board. The bottom subassembly portion ismade by EDI.
Solder Down Base(EDI#100QFS20-SD)
Figure 62: EMUL-PC/NP/Sx-ADP100-QFP/EDI Adapter Orientation in Detail

EMUL296-PC Chapter 7: Accessories
Copyright 1996 ICE Technology •• 103
POD Board
Adapter
Target
100 rectangleQFP footprint
Processors:8xC296SA-QFP(100QFP Devices)
Notes:
Adapter, 100 pin, rectangular QFP for 296SA. Soldersto user's board. The bottom subassembly portion is madeby Emulation Technology.
Solder Down Base(EPP-100QF06-SM)
Figure 63: EMUL-PC/NP/Sx-ADP100-QFP/ET Adapter Orientation in Detail
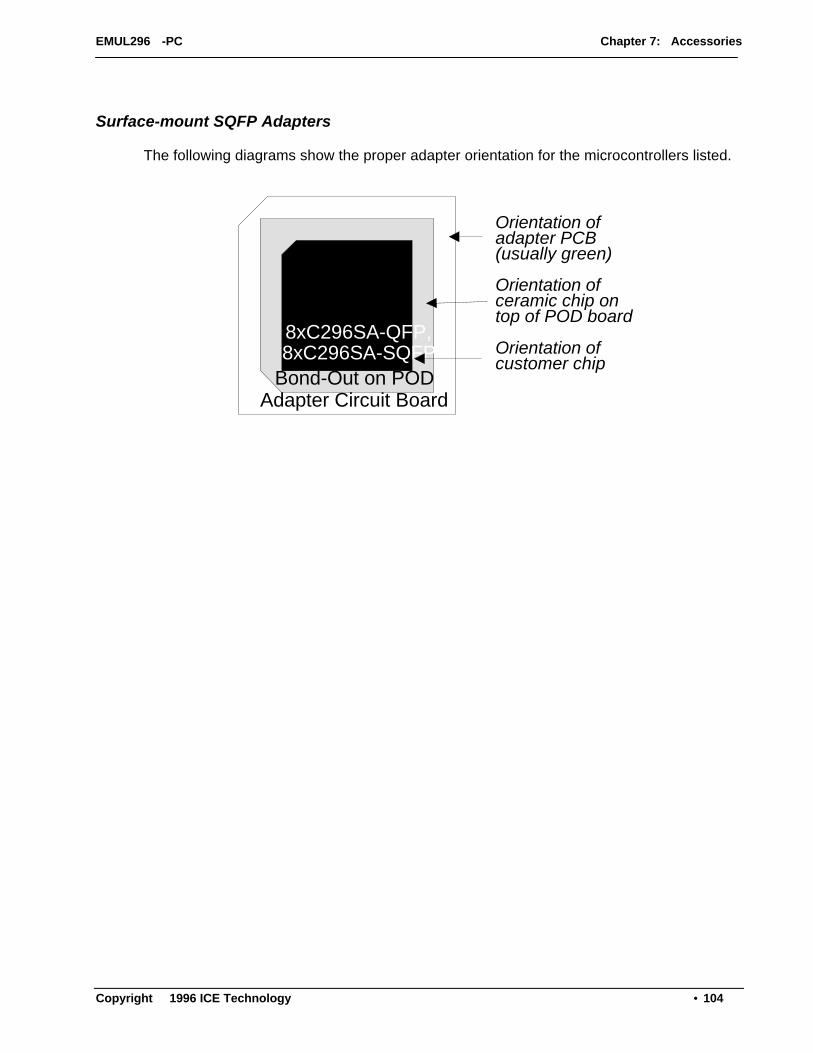
EMUL296-PC Chapter 7: Accessories
Copyright 1996 ICE Technology •• 104
Surface-mount SQFP Adapters
The following diagrams show the proper adapter orientation for the microcontrollers listed.
Adapter Circuit BoardBond-Out on POD
8xC296SA-QFP,8xC296SA-SQFP
Orientation ofadapter PCB(usually green)
Orientation ofceramic chip ontop of POD board
Orientation ofcustomer chip

EMUL296-PC Chapter 7: Accessories
Copyright 1996 ICE Technology •• 105
POD Board
Adapter
Target
100 squareQFP footprint
Processors:8xC296SA-SQFP(100SQFP Devices)
Notes:
Adapter, 100 pin, square QFP for 296SA. Soldersto user's board. The bottom subassembly portion ismade by Emulation Technology.
Solder Down Base(EPP-100QF49-SM)
Figure 64: EMUL-PC/NP/Sx-ADP100-SQFP/ET Orientation

EMUL296-PC Chapter 7: Accessories
Copyright 1996 ICE Technology •• 106
POD Board
Adapter
Target
100 squareQFP footprint
Processors:8xC296SA-SQFP(100SQFP Devices)
Notes:
Adapter, 100 pin, square QFP for 296SA. Soldersto user's board. The bottom subassembly portion ismade by EDI.
Solder Down Base(EDI#100QFS20-SD)
Figure 65: EMUL-PC/NP/Sx-ADP100-SQFP/EDI Adapter Orientation in Detail
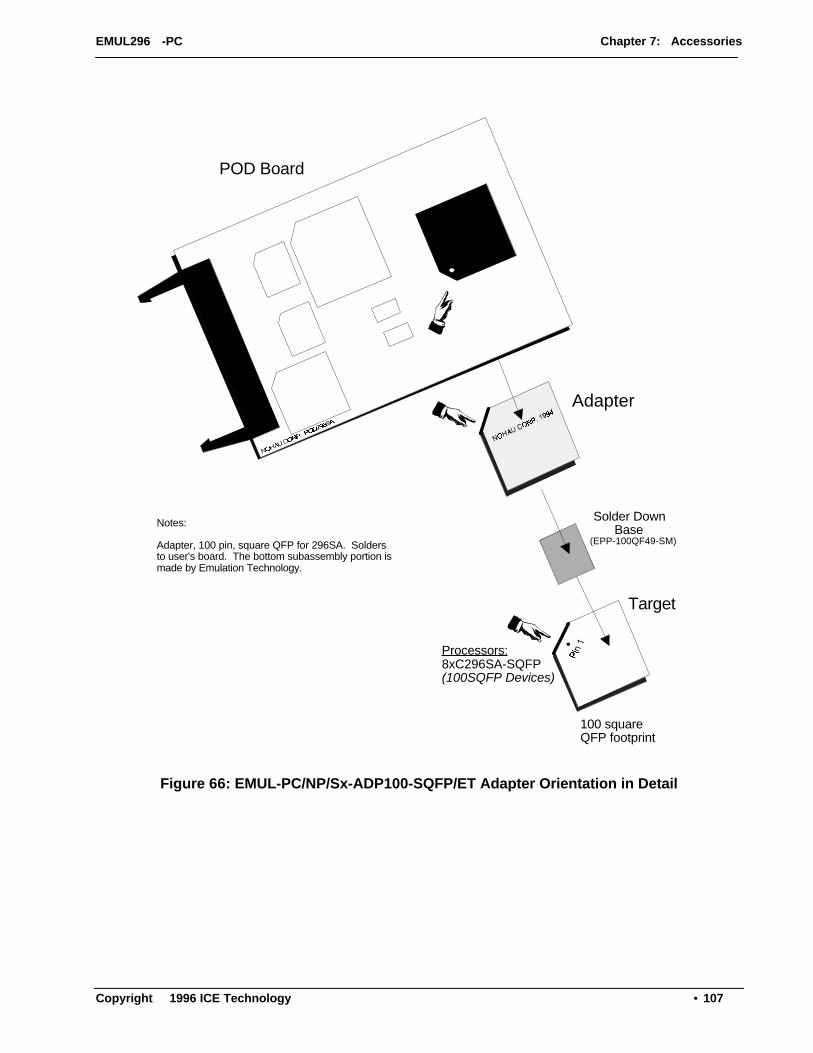
EMUL296-PC Chapter 7: Accessories
Copyright 1996 ICE Technology •• 107
POD Board
Adapter
Target
100 squareQFP footprint
Processors:8xC296SA-SQFP(100SQFP Devices)
Notes:
Adapter, 100 pin, square QFP for 296SA. Soldersto user's board. The bottom subassembly portion ismade by Emulation Technology.
Solder Down Base(EPP-100QF49-SM)
Figure 66: EMUL-PC/NP/Sx-ADP100-SQFP/ET Adapter Orientation in Detail

EMUL296-PC Chapter 7: Accessories
Copyright 1996 ICE Technology •• 108
Compilers
BSO/Tasking
Assembler notesTo do Source Level Debugging, add two switches when assembling your code: debug andsource.
Note: This applies only if you have version 4.0, revision 3 or later of the BSO/Tasking assembler.Previous versions did not support this feature.
A typical command line follows:
asm296 cstart.asm md(sa) farcode debug source
Set all other switches to match your target. For more information about other assemblersettings, refer to the BSO/Tasking manual.
The example files on the release disk include a file called CSTART.ASM. For simplicity,please use that file instead of any of the start-up example files shipped with the BSOcompiler when compiling the examples.
Note: To get line number/source information from BSO/Tasking version 4.0, use the SOURCEswitch.
Compiler NotesLike the assembler, the debug switch produces all the symbols needed by the debuggerand puts them in the unlinked object file. Set all other switches to match your target. Formore information about other compiler command line settings, refer to the manual fromBSO/Tasking.
IAR Systems Software, Inc.
Compiler NotesLike the assembler, the debug switch produces all the symbols needed by the debuggerand puts them in the unlinked object file. Set all other switches to match your target. Formore information about other compiler command line settings, refer to the manual from IARSystems Software, Inc..

EMUL296-PC Chapter 8: Troubleshooting
Copyright 1996 ICE Technology •• 109
Chapter 8: Troubleshooting
Troubleshooting Overview
If you have emulator trouble you may contact customer support at [email protected] you do, the engineer will likely lead you through the following steps to test for themost common mistakes. To save time, you may also test for the most common reasonsthat the emulator is not working the way you want.
The items to check for below are in order. Start at number 1 and continue until either theemulator works or you have reached the end of the list. Each item is a short version of adescription from earlier in this manual. Each item has at least one page number wheremore details can be found.
Note: We suggest that you remove the pod from the target when you do thefollowing steps.
Step 1: Board I/O Addresses
Confirm that the I/O address set in the jumpers on the emulator and trace boards bothagree with the software settings found in their respective configuration dialog boxes. (Formore information, see page 73.)
Step 2: .INI Editor
The Windows software is used for all EMUL296™-PC products. The type of targetprocessor in the software configuration must agree with the type of pod you are using. Ifnot, you may see a “Pod Communication Failed” error message. To ensure that you do notget this error, we include a utility that you probably want to run when you first installthe emulator, and possibly again when you change your pod type. This utility is calledINI296. (You can also run this utility any time you want to check the values in theinitialization file.)
To invoke INI296, double click on the icon in the NOHAU program group labeled INI296. Ifthe EMUL296.INI settings are not self-consistent, you will see a warning message,otherwise you will see the window shown in Figure 67.
To correctly configure your software to match your hardware, start by clicking on the buttonthat matches your pod type. If your pod should not address memory above 64K, put acheck mark in the PC < 64K box. If you are using memory above 64K, leave the boxunchecked and make sure that the jumpers TRA16 through TRA19 match the field labeledAddress from A0 to ... For example: if TRA16 is in the EA16 position but the rest are in theGND position, click on the button labeled A16. If all the TRA headers are in the EAposition, click on the button labeled A19. (For more information on INI296, see page 18.)

EMUL296-PC Chapter 8: Troubleshooting
Copyright 1996 ICE Technology •• 110
Figure 67: Choosing a target processor with INI296
After you have set the Emulator Port: and Trace Port: fields, click on the OK button orpress <Enter>. The Emulator Port: field must agree with the values you set in the J2jumper on the emulator board, as described in the section, "Setting the I/O addressjumpers -- J2" on page 70. Likewise, the Trace Port: field must agree with the way you setthe address jumpers on the emulator board.
Step 3: PWR and XTAL jumpers
If there is a power supply on the target, remove the PWR jumper from the pod (for moreinformation, see page 71).
If the crystal or oscillator on the target is running at a different frequency than the one onthe pod board, move the XTAL jumpers to the target position.
For more information, see the section in the Pod chapter that describes the kind of pod youhave.
Step 4: I/O On Addresses Pins
Most 8xC296 parts use 16 address bits. In those parts that support more address bits, thetarget can use from 0 to 4 of the extra address bits for I/O instead. The table below shows,for each combination of address pins used for addressing, how to set the jumpers shown inthe table. Make sure the jumpers on your pod match the settings in the row that applies toyour target. (For more information, see page 70.)
Bits used forAddressing
TRA16 TRA17 TRA18 TRA19
A0 - A15 GND GND GND GND
A0 - A16 EA16 GND GND GND
A0 - A17 EA16 EA17 GND GND
A0 - A18 EA16 EA17 EA18 GND
A0 - A19 EA16 EA17 EA18 EA19

EMUL296-PC Chapter 8: Troubleshooting
Copyright 1996 ICE Technology •• 111
Step 5: Chip Configuration Bytes (CCB's)
The CCB's that you specify in the hardware configuration menu must match what themicrocontroller reads from location 2018 at reset. For example, if you have mapped 2018to a target with eprom that contains CCB's specifying 8 bit mode while your hardwareconfiguration menu specifies 16 bit mode, you will surely run into trouble. (For moreinformation, see page 25.)
Note: CCB's on 80C296 pods running in "big mode" (i.e., PC>64k) are fetched atFF2018.
Step 6: The Stack Pointer
The Stack Pointer must point to valid even memory location at all times. The emulatorneeds either 2 bytes or 4 bytes of temporary storage on the stack. (SP should have a value> 0x50). (For more information, see page 87.)
Step 7: Interrupt Vectors
Support for software breakpoints requires specific values for certain interrupt vectors.When troubleshooting target systems that use 16 bits of addressing, confirm that thefollowing address have the following values:
Address: 0x0012 & 0x0014 0x2010 0x2012
Value: 0x0000 0x0012 0x0012
When troubleshooting a target design that uses a processor with 20 bits of addressing likethe 8xC296SA, add an address offset of 0xFF0000 to each of the above addresses tolocate the interrupt vectors:
Address: 0xF0012 & 0x0014 0xF2010 0xF2012
Value: 0x0000 0x0012 0x0012
If you map these addresses to the target ROM, be sure your ROM contains these values atthose addresses. If it does not, software breakpoints will not work.
Step 8: Sample User Program
If you telephone the technical support team, you will probably be asked to do thefollowing to enter a sample user program:
1. Click in the Program Window
2. Hit <Ctrl>-A
3. Type in address 2080

EMUL296-PC Chapter 8: Troubleshooting
Copyright 1996 ICE Technology •• 112
4. Hit <Enter>
5. Type: NOP <Enter>
NOP <Enter>
LJMP 2080 <Enter>
6. Click on the GO button in the tool bar.
7. Click on BREAK.
8. Make a note of software revision.
9. Make a note of compiler revision.
10. Make a note of serial numbers of boards.

EMUL296-PC INDEX
Copyright 1996 ICE Technology •• 113
INDEX
.
.INI Editor · 2
8
80C296 · 2
A
Accessories · 2Adapters
Surface-mount QFP, SA family · 2Surface-mount SQFP, SA family · 2
Add .. · 2Add a watch point .. · 2Address Range · 2Address space .. · 2Address.. · 2Animate .. · 2Arrange Icons · 2At .. · 2
B
Bargraph · 2Benchmarking
Using Timestamp · 2Bin
Adding a · 2Block move.. · 2Break
Emulation · 2On internal access .. · 2
Break Emulation? Box · 2Break now! · 2Break Two Emulators Simultaneously · 2Breakpoints
Hardware · 2BSO/Tasking · 2Bus Cycle Order · 2Bus Width · 2
C
C call stack .. · 2Call stack .. · 2Cascade windows · 2
Child Windows · 2Chip Configuration Bytes · 2Close · 2Color .. · 2Communication Rate Jumper · 2Compilers · 2Confidence Test · 2Convert cycles to time · 2Copy to clipboard · 2
D
DataDisplay as.. · 2Default CPU symbols · 2Delete All · 2Dialog Boxes · 2Disable all · 2Display as.. · 2Duplicate Resources · 2Dynamic Data Exchange · 2
E
EditTrigger Conditions · 2
Edit .. · 2EMUL/LC-ISA · 2EMUL296-PC/SA-ADP100-QFP/EDI
Dimensions · 2EMUL296-PC/SA-ADP100-QFP/ET
Dimensions · 2Emulator
Board · 2Detailed Installation Instructions · 2Hardware Configuration · 2Macro User Guide · 2Memory · 2
Emulator Hardware .. · 2EMUL-PC/NP/Sx-ADP100-QFP/EDI
Orientation · 2EMUL-PC/NP/Sx-ADP100-QFP/ET
Orientation · 2EMUL-PC/NP/Sx-ADP100-SQFP/EDI · 2EMUL-PC/NP/Sx-ADP100-SQFP/ET · 2
Orientation · 2Enable Code Space Limits · 2Evaluate .. · 2Exit · 2Extend Recording · 2External Inputs and Controls · 2
EMUL296-PC INDEX
Copyright 1996 ICE Technology •• 114
F
Fast Break Write · 2Fast_Br_W .. · 2Fill.. · 2Filter Mode: Normal · 2Filter Mode: Window · 2Find Frame number .. · 2Find Trig point · 2Full Reset · 2Function · 2
G
Go · 2FOREVER · 2To .. · 2To cursor · 2To return address · 2
H
Hardware breakpoints .. · 2Hardware breaks only · 2Headers
Auto Map · 2Auto/Manual BW · 2Clock · 2JP30-JP32 · 2JP6, JP12, JP17 & JP21 · 2Memory Mapping · 2PWR · 2RDY · 2RST · 2RXD · 2
Help Line · 2
I
I/O Addresses · 2I/O On Addresses Pins · 2IAR Systems Software, Inc. · 2Indicator Lights · 2INI296 · 2In-line assembler · 2Inspect .. · 2Installation Instructions, Quick · 2Installing
Emulator · 2Pod · 2Software · 2Trace Board · 2
Internal Addressing or Single Chip Mode · 2Interrupt Vectors · 2
L
Last trig event repeat count · 2Length field · 2Load
Code · 2Default symbols · 2EEPROM · 2
Load and execute a program · 2
M
MacroConstants · 2Example · 2Global Variables · 2Nohau Subroutines · 2Procedure for writing · 2Setup · 2Subroutine Reference · 2
Macro System · 2Manual Conventions · 2Mapping
Memory · 2Memory Using Chip Selects · 2
MemoryCoverage · 2Coverage Report, Detailed · 2Coverage Report, Summary · 2Mapping · 2
Memory Coverage .. · 2Menus · 2
Breakpoints · 2Config · 2Data · 2File · 2Help · 2Program · 2Register · 2Run · 2ShadowRam · 2Source · 2Stack · 2Trace · 2View/Edit · 2Window · 2
Microsoft Visual Basic · 2Miscellaneous .. · 2Miscellaneous bits · 2Miscellaneous Configuration · 2Miscellaneous Setup · 2Module · 2Multiple Document Interface Standard · 2

EMUL296-PC INDEX
Copyright 1996 ICE Technology •• 115
N
Next window · 2
O
OpenA new data window · 2A new program window · 2A new register window · 2A new shadow ram window · 2A new source code window · 2A new trace window · 2A Watch window · 2
Origin (at program counter) · 2Original Address · 2
P
Parameters in Hex · 2Paths
Setting · 2Paths .. · 2Performance Analysis · 2Pipeline Effects · 2Pod
Breakpoints · 2Configuration Requirements · 2Emulation Memory · 2Headers · 2
Pod Boards · 2Pod Dimensions · 2POD-296-256-SA-50 · 2Post trigger samples · 2Power Supply to Pod / Target · 2PP Analyzer · 2Preferences · 2Programming
Algorithms · 2External Flash Memory · 2Options · 2
Project name .. · 2Projects · 2
Creating · 2PWR and XTAL jumpers · 2PWR Header -- JP2 · 2
Q
QFP/SQFPAdapter Orientation · 2
Quick Start Instructions · 2
R
RAM value, change · 2Refresh · 2Relative timestamp · 2Remove .. · 2Remove Symbols · 2Reset
and Go · 2Chip · 2
Reset vs. Full Reset · 2
S
Sample User Program · 2Save
Trace as text .. · 2Save code as .. · 2Search
Address .. · 2Next Address · 2Previous Address · 2
Search next · 2Search previous · 2Search.. · 2Set new PC value at cursor · 2Setting
I/O address jumpers -- J1 · 2Target Communication Rate -- Header JP1 · 2
Setup .. · 2Setup Instructions, Quick · 2Show
Misc. data · 2Timestamp · 2
Show function · 2Show load info .. · 2Software breakpoint
Delete · 2Make inactive · 2Setting · 2
Software Configuration, Initial · 2Software Installation Instructions, Detailed · 2Software, Configuring · 2Stack Pointer · 2Step into · 2Step over · 2Symbols in the Trace Window · 2Synchronize program window · 2System Requirements · 2
T
T = 0 at Cursor · 2Tile windows · 2Toggle · 2Toggle breakpoint · 2

EMUL296-PC INDEX
Copyright 1996 ICE Technology •• 116
Toggle help line · 2Toggle trace (stop/run) · 2Tool Bar · 2Trace
Board Installed · 2Board, Detailed Installation Instructions · 2Board, Introduction · 2Clock Rate · 2Config Menu · 2I/O Address field · 2Input Pins · 2Memory · 2Setup .. · 2Setup Dialog Box · 2Triggers · 2
Trace .. · 2Tracing
Introduction to · 2Triggers · 2Troubleshooting · 2
U
User defined symbols · 2
V
View assembly code · 2
View source window · 2
W
Wait States · 2Window
Colors · 2Memory Coverage · 2PPA Control · 2Source · 2
WindowsData and ShadowRam · 2Evaluate · 2Inspect · 2Other · 2Program · 2Register · 2RTXC · 2Source · 2Stack · 2Trace · 2Watch · 2
Windows API · 2
Z
Zoom · 2