enabling an efficient and holistic liquidity management ... sheet trends high cash buffers, but much...
TRANSCRIPT

Enabling an Efficient and Holistic Liquidity
Management Framework Yields Exponential
Results
Global Liquidity and Investments
Global Transaction Services
Thursday, June 2nd, 2011
Insight | Flexibility | Results
June 2011
Global Liquidity & Investments, Global Transaction Services

I. Market and Recent Trends Overview
II. Treasury Trends
I. Liquidity & Risk Management
II. Netting
III.In-House Banking
IV.Benefits of Centralization
III.Enablers, Challenges & Success Factors
I. People, Process, Technology
II. Organization, Experience/Advisory, Service Provider
Agenda
Market and Recent Trends Overview

Balance Sheet Trends
High cash buffers, but
much of it offshore or
trapped
Attractive EM capital
issuance opportunities -
local firms and MNC’s
Underfunded pension
plans
Liquidity and working
capital management
strategies under review
Global Corporate Finance Backdrop in 2011: Recovery
The global corporate sector entered 2011 in a position of strength. The overarching corporate finance
challenge is deciding when and where to deploy this spending power – on organic growth opportunities,
on M&A, on further balance sheet strengthening or increased capital distribution.
Corporate Recovery
Pre-crisis operating
margins
Surging cash levels
Decline in leverage
Strategic Trends
Increase in M&A
– Emerging Markets
– Cross Border
Internal investment in
high-growth markets
Surge in shareholder
distributions
Risk of investor
pressure for those
failing to deliver growth
1

Treasury Priorities: Dealing with Complexity
With CEO/CFO priorities shifting from crisis management to “risk aware” sustainable growth, the role of
the Treasurer has been re-defined as a strategic partner and “gatekeeper” of the balance sheet.
Key Enablers
Streamlining and
standardizing treasury
processes to achieve
productivity gains and
enhance control
Leveraging effective
treasury technology
solutions to help achieve all
of the above
Maximizing Cash Efficiency
Building foundation of effective liquidity
management and increased cash
visibility
Connecting working capital to liquidity
management
Developing accurate cash forecasting
Improving Risk Management
Develop firm-wide view of exposures
Implement policies & clear
governance, monitor compliance
Leverage technology to provide
visibility, de-risk processes
Supporting Growth
Tap into local knowledge and expertise
in growth markets
Deploy options to reduce trapped cash
Integrate treasury processes over
acquisitions, tighten JV oversight
Leverage technology to automate and
integrate, free resource time
Treasury Challenges:
Increasing Complexity
Multiple countries and currencies of operation
Proliferating number of bank accounts to support international activities, with varying local banking practices / standards
Multiple systems and data formats
Insufficient global visibility into liquidity and risk
Challenges in consolidating critical information for senior management decision-support
2
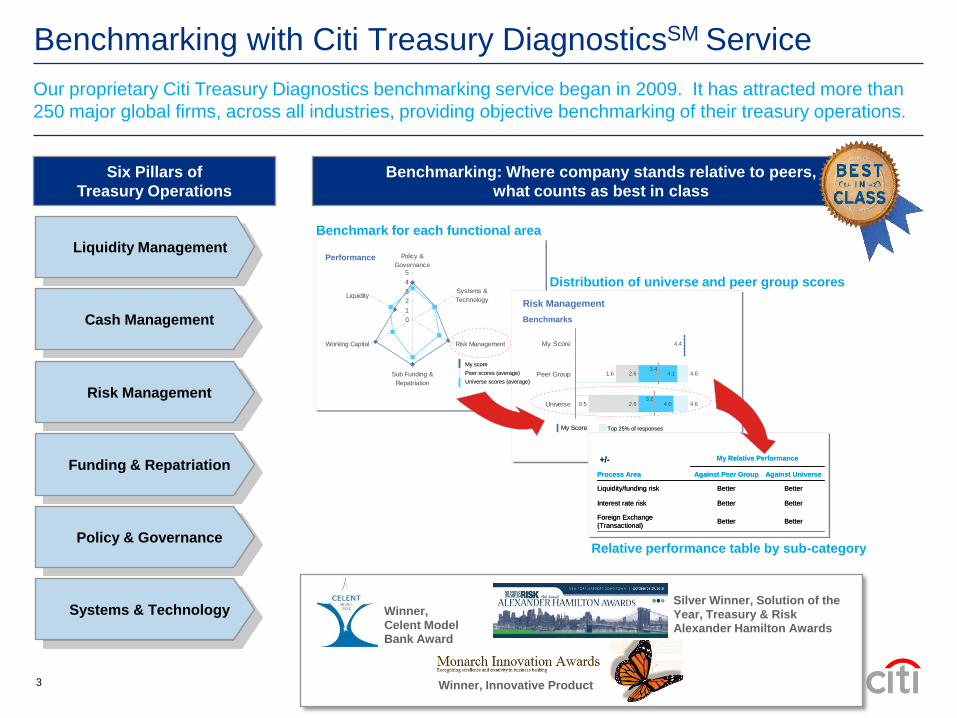
Benchmarking: Where company stands relative to peers,
what counts as best in class
Distribution of universe and peer group scores
0
1
2
3
4
5
Policy &
Governance
Liquidity
Working Capital
Sub Funding &
Repatriation
Risk Management
Systems &
Technology
My score
Peer scores (average)
Universe scores (average)
My score
Peer scores (average)
Universe scores (average)
Performance
Top 25% of responses
Core 50% (25-75%) of responses
Bottom 25% of responses
Average response
My Score Top 25% of responses
Core 50% (25-75%) of responses
Bottom 25% of responses
Average response
My Score
Benchmarks
Risk Management
4.6
4.6
4.1
4.0
2.6
2.6
4.4
0.5
1.6
My Score
Peer Group
Universe3.2
3.4
BetterBetterInterest rate risk
My Relative Performance+/-
BetterBetterForeign Exchange
(Transactional)
BetterBetterLiquidity/funding risk
Against UniverseAgainst Peer GroupProcess Area
BetterBetterInterest rate risk
My Relative Performance+/-
BetterBetterForeign Exchange
(Transactional)
BetterBetterLiquidity/funding risk
Against UniverseAgainst Peer GroupProcess Area
Benchmarking with Citi Treasury DiagnosticsSM Service
Benchmark for each functional area
Relative performance table by sub-category
Winner, Celent Model Bank Award
Silver Winner, Solution of the
Year, Treasury & Risk Alexander Hamilton Awards
Liquidity Management
Cash Management
Risk Management
Funding & Repatriation
Policy & Governance
Systems & Technology
Six Pillars of
Treasury Operations
Our proprietary Citi Treasury Diagnostics benchmarking service began in 2009. It has attracted more than
250 major global firms, across all industries, providing objective benchmarking of their treasury operations.
Winner, Innovative Product3

Treasury Trends

Cost of credit and
Bank Regulation
Failure to secure adequate liquidity can cripple growth plans
and create exposure to undue financial risk.
Economic Volatility
& EM Shift
Post crisis, M&A activity is increasing along with natural
expansion in to new markets
Risk Management:
Operational as well
as Financial
Expense and risk considerations drive demand for automated
“no touch” solutions
Treasurers continue to look for centralized solutions to
manage cash and liquidity
Counterpart Stability Balancing need for diversification whilst focusing on key
service providers that deliver the most value
Control subsidiaries and JV within agreed limits
Global Tax Environment Increased scrutiny and legislation pending
Impacts on cash concentration centers and In-house banks
in “tax-favorable markets”
Investor Valuations Liquidity solutions help reduce working capital, pay down debt
and have a positive impact on EPS and balance sheet
management
Key Treasury Concerns drive focus towards Best-in-Class
4

Benchmarking with Citi Treasury Diagnostics Service
Key Differentiators
Liquidity Management
95% + visibility of global cash
Rationalized account structure with key banking providers
Centralized, global management of physical and notional cash
pooling with 95%+ operating cash flows in the pools
Cash Flow Forecasting
Cash forecasts should be created at the legal entity since most
liquidity issues are also isolated by legal entity
Performed daily, with supporting automation
– Collections forecast using expected receipts pattern
– Payables forecast using standard payment terms
Variance analysis, with supporting KPIs/scorecard
Netting
Inclusive of 95% of legal entities and currencies (where allowed
by regulations)
Interface to ERP and TWS is fully-automated transfer
Monthly Netting Cycle
Insights from “best-in-class” treasury organizations that excel in liquidity management and netting as
they gravitate towards in-house banking
5

Evolution Towards Efficiency
I. I/C Fixed
Loans / Deposits
II. (Regional)
Liquidity
Management;
III. Cash Flow
Forecasting /
FX Risk
Management
IV. External
Deposits /
Investments
V. Intercompany
Netting
Internal
“Cashless”
VI. POBO /
ROBO
External
Finance
Company
IHB
(Treasury
Functionality)
IHB
(Integrated with
Business Units)
Netting –
Cash Settlement
Centralization
▲Strategic
structural funding
and defunding
▲Reduced
banking fees and
rationalized
account structure
▲Enhanced global
cash access and
utilization
▲Efficient “real-
time” funding of
Bus
▲Improved risk
visibility and
mitigation
▲Minimized FX
spreads
▲Improved cash
planning and
repatriation
▲Improved cash
positioning
▲Optimized global
cash utilization and
yields
▲Reduced
transaction costs
on internal flows
▲Reduced
transaction costs
on external flows
Phases of Evolution
Multi-entity
Liquidity
Management
(no
intercompany
loans)
Global
Liquidity
Management
6
Poll Questions
When you do Cash Pool, how do you manage your process (choose one)
A. Bank provided Pooling only
B. Bank and Treasury Workstation facilitated
C. Treasury Workstation facilitated
D. Manually Initiated
E. n/a; Pooling not utilized
7

Poll Questions
When you do intercompany transaction netting, what percentage of your eligible entities are included?
(choose one)
A. 95%+
B. 76-94%
C. 50-75%
D. Less than 50%.
E. n/a; Netting not utilized
8

Poll Questions
Do you have an in-house bank?
A. Yes
B. No, but planning for
C. No, no plans
9

Effective In-House Banking
Enterprise-wide Risk Management
Liquidity Risk
Foreign Exchange Risk
Interest Rate Risk
Counterparty Risk
Centralization of commercial flows
Third Party commercial payments
Internal commercial flows
Third Party commercial receipts
Efficiency through scale and centralization
Bid / Offer Spread
Transaction Costs
Enforces Policy, Procedures and Control
Increases Purchasing Power
An effective In-House Bank enables a Corporate to capture efficiencies of centralization as it aggregates
liquidity and net flows within risk, tax, legal and regulatory considerations
Global
Treasury Center
Netting
Center
&
Payments
Factory
Banks
In-house Bank
BU
BU
Liquidity
Structures
Payments
I/C
Trade Flows
MM and
FX Trades
Stand-
alone
accounts
BU
JVs
I/C T
rad
e F
low
s
10

Case Study: Large Oil Producer
Citi Solution
Liquidity Management Model
Shift from a decentralized to a centralized treasury
model – managing cash centrally
Real-time visibility and access to subsidiaries balances
and use of global cash forecasting
Provide internal funding to subsidiaries; intercompany
lending and central external borrowing through zero
balance sweep structures
Increased control over Subs opening of local accounts
Rationalize banking relationships
Tapped into internal liquidity, freed up cash and reduced
external debt
Customer Need Enhance treasury effectiveness, increase focus on liquidity and cash operations
– Lack of visibility over subs cash flows
– Lack of control over subs opening of local accounts, creating potential financial and audit risk
– More than 40 active banking relationships
– Consolidated debit of US$5.5 billion
– Excess cash balances of US$1.5 billion (despite excess cash balances, need to use external borrowings)
Sweeps to London Pool
Centralised Funding and Investments
Local Transactional Activity
New York
Warsaw, Brussels, Budapest,
Sofia Praque, Bucharest
and Kiev
Excess Funds to
London Pool
Internal Funding of
Sub Overdrafts
Commercial Payments and
Million Investments
Local Daily
TransactionLondon Pool
A large oil producer wanted to centralize their treasury to gain visibility and control over subsidiary cash
flows and their large number of banking relationships.
11
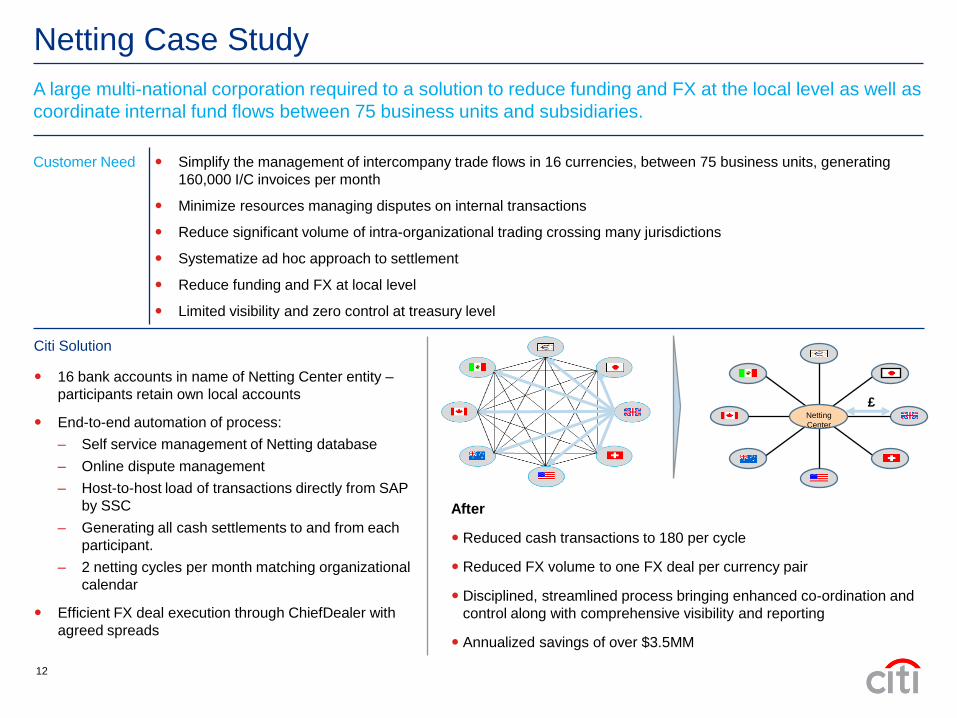
Netting Case Study
Citi Solution
16 bank accounts in name of Netting Center entity –
participants retain own local accounts
End-to-end automation of process:
– Self service management of Netting database
– Online dispute management
– Host-to-host load of transactions directly from SAP
by SSC
– Generating all cash settlements to and from each
participant.
– 2 netting cycles per month matching organizational
calendar
Efficient FX deal execution through ChiefDealer with
agreed spreads
Customer Need Simplify the management of intercompany trade flows in 16 currencies, between 75 business units, generating
160,000 I/C invoices per month
Minimize resources managing disputes on internal transactions
Reduce significant volume of intra-organizational trading crossing many jurisdictions
Systematize ad hoc approach to settlement
Reduce funding and FX at local level
Limited visibility and zero control at treasury level
After
Reduced cash transactions to 180 per cycle
Reduced FX volume to one FX deal per currency pair
Disciplined, streamlined process bringing enhanced co-ordination and
control along with comprehensive visibility and reporting
Annualized savings of over $3.5MM
A large multi-national corporation required to a solution to reduce funding and FX at the local level as well as
coordinate internal fund flows between 75 business units and subsidiaries.
Netting
Center
£
12

Enablers

Corporate Enablers
People
Processes
Technology
Treasury organization structure must be aligned with business to
ensure that common goals and objectives can be met
Expansion into new markets may require expertise outside the scope
of current staff knowledge; leveraging local market experts and project
management specialists may need to be considered
Centralized approach to policy definition and treasury processes is still
required. However, existing processes may need to be modified to
handle increased capacity and/or modified to accommodate local
requirements
KPIs should be developed to track the success of changes
implemented and identify opportunities for improvement
Existing technology infrastructure will need to be extended to include
access to treasury professionals in new markets, as well as, visibility
of new business activity
Implementation of in-house banking and netting programs, as well as,
increasing volumes may require investment in technology and
automation, where previously lower volumes and overall complexity
did not
Stronger partnerships emerging between treasury and business are evidence that success requires new
strategies for funding, as well as, coordinated support for investments in treasury technology.
13
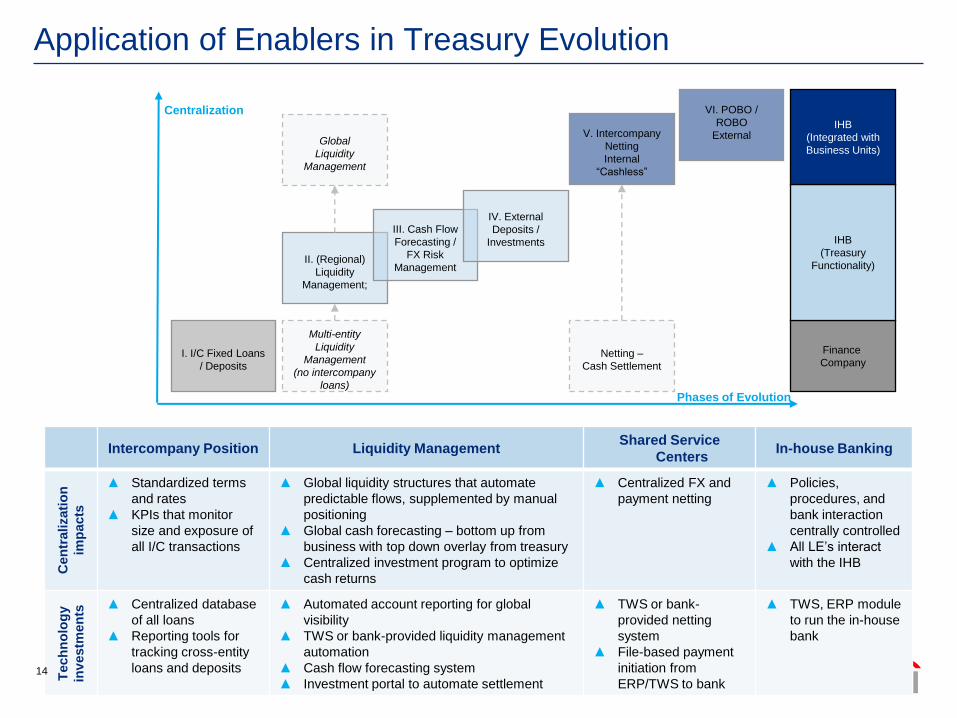
Application of Enablers in Treasury Evolution
I. I/C Fixed Loans
/ Deposits
II. (Regional)
Liquidity
Management;
III. Cash Flow
Forecasting /
FX Risk
Management
IV. External
Deposits /
Investments
V. Intercompany
Netting
Internal
“Cashless”
VI. POBO /
ROBO
External
Finance
Company
IHB
(Treasury
Functionality)
IHB
(Integrated with
Business Units)
Netting –
Cash Settlement
Centralization
Phases of Evolution
Multi-entity
Liquidity
Management
(no intercompany
loans)
Global
Liquidity
Management
Intercompany Position Liquidity ManagementShared Service
CentersIn-house Banking
Cen
tralizati
on
imp
acts
▲ Standardized terms
and rates
▲ KPIs that monitor
size and exposure of
all I/C transactions
▲ Global liquidity structures that automate
predictable flows, supplemented by manual
positioning
▲ Global cash forecasting – bottom up from
business with top down overlay from treasury
▲ Centralized investment program to optimize
cash returns
▲ Centralized FX and
payment netting
▲ Policies,
procedures, and
bank interaction
centrally controlled
▲ All LE’s interact
with the IHB
Tech
no
log
y
inv
estm
en
ts
▲ Centralized database
of all loans
▲ Reporting tools for
tracking cross-entity
loans and deposits
▲ Automated account reporting for global
visibility
▲ TWS or bank-provided liquidity management
automation
▲ Cash flow forecasting system
▲ Investment portal to automate settlement
▲ TWS or bank-
provided netting
system
▲ File-based payment
initiation from
ERP/TWS to bank
▲ TWS, ERP module
to run the in-house
bank
14

Implementing the In House BankTechnology is a key enabler of treasury evolution. Effective deployment will support visibility, risk
management and cash positioning for better control and efficiency in the treasury organization.
Implement IHB and netting systems
Aggregate all bank account information
from Citi and other third party banks
Customize reporting to match legal entity
hierarchy globally
Provide direct access to reporting to
business managers and local treasury
operations
Implement system for visibility of cash
pooling activity and perform detailed
analysis of business impacts on funding
Consolidate I/C positions into a centralized
repository to simplify initiation and
settlement
Implement file based payment execution
Automate trading of time deposits, money
market funds and other short -term fixed
income using investment portal
Global
Treasury Center
Netting
Center
&
Payments
Factory
Banks
In-house Bank
BU
BU
Liquidity
Structures
Payments
MM and
FX Trades
Stand-
alone
accounts
BU
JVs
I/C T
rad
e F
low
s
15
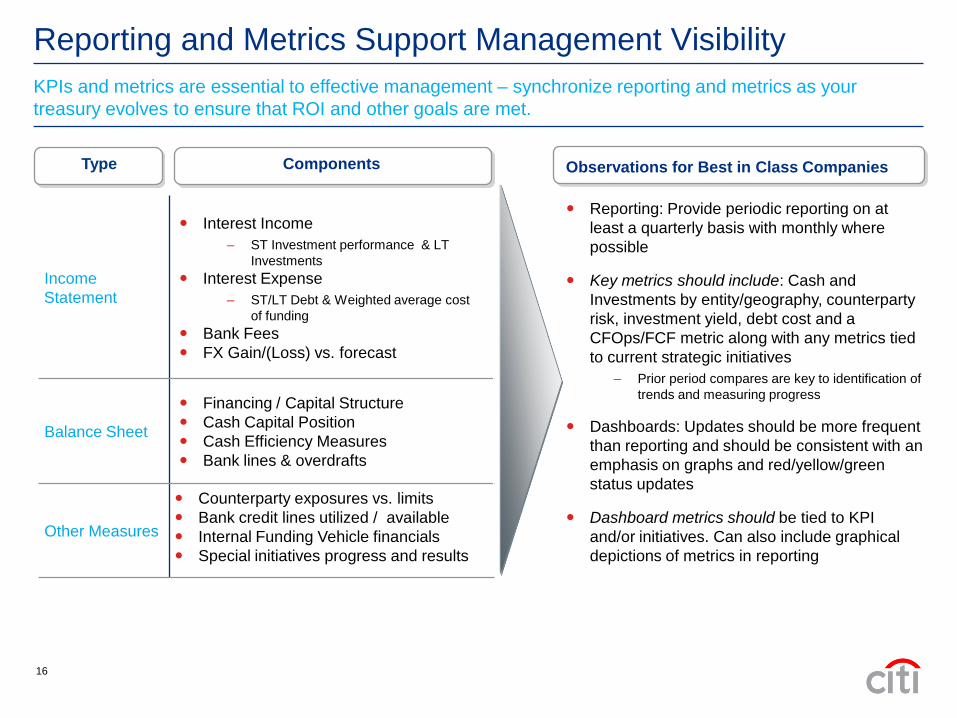
Reporting and Metrics Support Management Visibility
KPIs and metrics are essential to effective management – synchronize reporting and metrics as your
treasury evolves to ensure that ROI and other goals are met.
Type Components
Income
Statement
Interest Income
– ST Investment performance & LT
Investments
Interest Expense
– ST/LT Debt & Weighted average cost
of funding
Bank Fees
FX Gain/(Loss) vs. forecast
Balance Sheet
Financing / Capital Structure
Cash Capital Position
Cash Efficiency Measures
Bank lines & overdrafts
Other Measures
Counterparty exposures vs. limits
Bank credit lines utilized / available
Internal Funding Vehicle financials
Special initiatives progress and results
Observations for Best in Class Companies
Reporting: Provide periodic reporting on at
least a quarterly basis with monthly where
possible
Key metrics should include: Cash and
Investments by entity/geography, counterparty
risk, investment yield, debt cost and a
CFOps/FCF metric along with any metrics tied
to current strategic initiatives
– Prior period compares are key to identification of
trends and measuring progress
Dashboards: Updates should be more frequent
than reporting and should be consistent with an
emphasis on graphs and red/yellow/green
status updates
Dashboard metrics should be tied to KPI
and/or initiatives. Can also include graphical
depictions of metrics in reporting
16

Industry Best Practices Applying Technology in Treasury
Processes Supported by Treasury Technology
Source: Citi Treasury Diagnostics Service, as of March 2011
14%
21%
34%
34%
41%
67%
68%
70%
70%
73%
84%
0% 10% 20% 30% 40% 50% 60% 70% 80% 90%
Trade/Bank Guarantee Issuance
Bank Relationship M anagement
Financial Risk M anagement - FX, IR, Commodity
(Identification and M itigation Decision)
Supplier Payments
Cash Forecasting/Planning
Financial Risk M anagement - FX, IR, Commodity (Deal
Execution/Implementation)
Investing
Intercompany Loan Administration/In-house Banking
Treasury Contro ls and Accounting
Short-term Borrowing/Financing
Cash Operations/Liquidity M anagement
Significant room for
improvement
Good, but could be
better
17

Supporting Growth: 2011 & Beyond

Keep abreast of changing market conditions
Supporting Growth: 2011 and Beyond Execution Imperatives
Continued volatile market conditions and evolving
regulations require real-time information management and
improved monitoring and reporting capabilities
Maintain financial, process and supply chain flexibility to
respond to changing conditions
Implement robust control processes to monitor
operational & financial risks that come with growth
Reassess banking relationships with a view
towards future growth strategies and plans
Company-wide cash and liquidity management programs
are a must
Rethink trading models; legal and tax structures
“Piggyback” treasury objectives on organization-wide
technology/process initiatives to help drive the business
case
Close coordination with businesses, regions and partners
to identify issues and mitigants
Implement functionally centralized policies and controls
Establish governance framework, KPI’s and alerts
Ensure ability to monitor
Long-term view of requirements across a broader network
Rationalize providers to improve operating and cost
efficiency
Think strategically of treasury transformation
opportunities
Technology and Infrastructure Investment to
support global complexityContinuous Process Improvement
Industrialize global reparative processes through
deployment of technology to support working capital
management
Increase ability to generate actionable information, risk
management and analytics from global business flows
Streamline connectivity to suppliers, customers and
banking partners to minimize cost and maintenance
Implement structures and processes to continuously align
business, capital and liquidity requirements
Mitigate risk through centrally administered processes and
policies
Streamline and standardize; eliminate repetitive and parallel
processing
18

D aily C redit / D ebit T o tals
-20,000,000
-15,000,000
-10,000,000
-5,000,000
0
5,000,000
10,000,000
15,000,000
20,000,000
25,000,000
01-
M ar
06-
M ar
11-
M ar
16-
M ar
21-
M ar
26-
M ar
31-
M ar
05-
Apr
10-
Apr
15-
Apr
20-
Apr
25-
Apr
30-
Apr
05-
M ay
10-
M ay
15-
M ay
20-
M ay
25-
M ay
30-
M ay
04-
Jun
09-
Jun
14-
Jun
19-
Jun
24-
Jun
29-
Jun
04-
Jul
09-
Jul
14-
Jul
19-
Jul
Market Regulatory Guides Deloitte Tax guides
Citi Treasury Diagnostics Service Pooling Analysis
Quick reference
guide for
regulations
impacting in-
country treasury
decisions
Comprehensive
guide for
treasurers to cash
and notional
pooling
considerations in
major
concentration
centers
Developed in
partnership with
Deloitte
Representative output
from Citi Pooling
Benefit calculators
Representative output from Citi Treasury Diagnostics
Service
Treasurer’s Decision Support from Citi
19
Poll Questions
To what degree have you automated your cash flow forecasting process?
A. There is one centralized process that is automated end-to-end
B. There is one centralized process and more than 50% of the input is automated
C. There are multiple processes with different degrees of automation
D. It is a manual process
20

Poll Questions
How frequently do you report operating metrics?
A. Daily dashboard and monthly management reports
B. Weekly dashboard and monthly management reports
C. Monthly management reports
D. Less frequent than monthly
21

Poll Questions
Which of these initiatives is most important in your planning for 2011-2012?
A. Rationalize bank accounts and bank relationships
B. Review of all policies and procedures
C. Review and update liquidity structures
D. Technology investment in TWS or other desktop analytical tools
E. Investment in people, either to grow the treasury staff or bring in new expertise
22

Questions and Answers
Today’s Presenters
– Cindy Gerhard [email protected] +1 (212) 816-4844 (New York)
– Michael Botek [email protected] +1 (212) 816-0283 (New York)
Essentials of Managing Corporate Cash and Investments
– When: June 28th, 2011 (4:00 p.m. BST, 11:00 a.m. EDT)
– Speakers:
– Michael Berkowitz – NA Market Management Head, Liquidity, Investments & Information
Services
– Mali Bartlett - Global Product Management Head, Citibank Online Investments
Register at: http://www.transactionservices.citigroup.com/transactionservices/home/corporations/calendar.jsp
Future Webinars
23

© 2011 Citibank, N.A. All rights reserved. Citi and Citi and Arc Design are trademarks and service marks of Citigroup Inc. or its affiliates and are used and registered throughout the world.
IRS Circular 230 Disclosure: Citigroup Inc. and its affiliates do not provide tax or legal advice. Any discussion of tax matters in these materials (i) is not intended or written to be used, and cannot be used or relied upon, by you for the purpose of avoiding any tax penalties and (ii) may have been written in connection with the "promotion or marketing" of any transaction contemplated hereby ("Transaction"). Accordingly, you should seek advice based on your particular circumstances from an independent tax advisor.
Any terms set forth herein are intended for discussion purposes only and are subject to the final terms as set forth in separate definitive written agreements. This presentation is not a commitment to lend, syndicate a financing, underwrite or purchase securities, or commit capital nor does it obligate us to enter into such a commitment. Nor are we acting in any other capacity as a fiduciary to you. By accepting this presentation, subject to applicable law or regulation, you agree to keep confidential the existence of and proposed terms for any Transaction.
Prior to entering into any Transaction, you should determine, without reliance upon us or our affiliates, the economic risks and merits (and independently determine that you are able to assume these risks) as well as the legal, tax and accounting characterizations and consequences of any such Transaction. In this regard, by accepting this presentation, you acknowledge that (a) we are not in the business of providing (and you are not relying on us for) legal, tax or accounting advice, (b) there may be legal, tax or accounting risks associated with any Transaction, (c) you should receive (and rely on) separate and qualified legal, tax and accounting advice and (d) you should apprise senior management in your organization as to such legal, tax and accounting advice (and any risks associated with any Transaction) and our disclaimer as to these matters. By acceptance of these materials, you and we hereby agree that from the commencement of discussions with respect to any Transaction, and notwithstanding any other provision in this presentation, we hereby confirm that no participant in any Transaction shall be limited from disclosing the U.S. tax treatment or U.S. tax structure of such Transaction.
We are required to obtain, verify and record certain information that identifies each entity that enters into a formal business relationship with us. We will ask for your complete name, street address, and taxpayer ID number. We may also request corporate formation documents, or other forms of identification, to verify information provided.
Any prices or levels contained herein are preliminary and indicative only and do not represent bids or offers. These indications are provided solely for your information and consideration, are subject to change at any time without notice and are not intended as a solicitation with respect to the purchase or sale of any instrument. The information contained in this presentation may include results of analyses from a quantitative model which represent potential future events that may or may not be realized, and is not a complete analysis of every material fact representing any product. Any estimates included herein constitute our judgment as of the date hereof and are subject to change without any notice. We and/or our affiliates may make a market in these instruments for our customers and for our own account. Accordingly, we may have a position in any such instrument at any time.
Although this material may contain publicly available information about Citi corporate bond research, fixed income strategy or economic and market analysis, Citi policy (i) prohibits employees from offering, directly or indirectly, a favorable or negative research opinion or offering to change an opinion as consideration or inducement for the receipt of business or for compensation and (ii) prohibits analysts from being compensated for specific recommendations or views contained in research reports. So as to reduce the potential for conflicts of interest, as well as to reduce any appearance of conflicts of interest, Citi has enacted policies and procedures designed to limit communications between its investment banking and research personnel to specifically prescribed circumstances.
efficiency, renewable energy & mitigation
In January 2007, Citi released a Climate Change Position Statement, the first US financial institution to do so. As a sustainability leader in the financial sector, Citi has taken concrete steps to address this important
issue of climate change by: (a) targeting $50 billion over 10 years to address global climate change: includes significant increases in investment and financing of alternative energy, clean technology, and other carbon-
emission reduction activities; (b) committing to reduce GHG emissions of all Citi owned and leased properties around the world by 10% by 2011; (c) purchasing more than 52,000 MWh of green (carbon neutral) power
for our operations in 2006; (d) creating Sustainable Development Investments (SDI) that makes private equity investments in renewable energy and clean technologies; (e) providing lending and investing services to
clients for renewable energy development and projects; (f) producing equity research related to climate issues that helps to inform investors on risks and opportunities associated with the issue; and (g) engaging with
a broad range of stakeholders on the issue of climate change to help advance understanding and solutions.
Citi works with its clients in greenhouse gas intensive industries to evaluate emerging risks from climate change and, where appropriate, to mitigate those risks.
24