enabling business intelligence for everyone -...
TRANSCRIPT
PUBLISHED: OCTOBER 2009
For the latest information, please see https://www.microsoft.com/BI
Enabling Business
Intelligence for Everyone
WHITEPAPER
2 | Microsoft Business Intelligence Whitepaper
Contents
Introduction .................................................................................................................................................... 3
The Business Intelligence challenge ....................................................................................................... 4
Enabling Business Intelligence for everyone ....................................................................................... 5
Empower your people with business insights ................................................................................. 5
Improve organizational effectiveness ................................................................................................ 9
Drive IT and Developer Efficiencies ................................................................................................... 11
A trusted, integrated solution: Microsoft Business Intelligence................................................. 14
3 | Microsoft Business Intelligence Whitepaper
Introduction
From boardroom executives to frontline operation managers, the uncertain economy has highlighted the necessity—
and the benefits—of making informed decisions. To cut costs, streamline operations, and fuel continual process
improvements, employees must be empowered to make better decisions at every level in the organization. Critical
business data needs to be accessible to all employees, so that they can perform their own analyses and freely share
insights with team members. With access to relevant data, employees can find opportunities to operate more
efficiently and grow revenues, so the company can emerge stronger from any economic environment.
Microsoft delivers a complete Business Intelligence (BI) suite with the familiar productivity tools in Microsoft®
Office
2010 and the collaboration and search technologies in Microsoft®
SharePoint Server®
2010. Using Microsoft Business
Intelligence, your employees gain deep business insights while working in familiar environments, and then easily
share these insights across the organization.
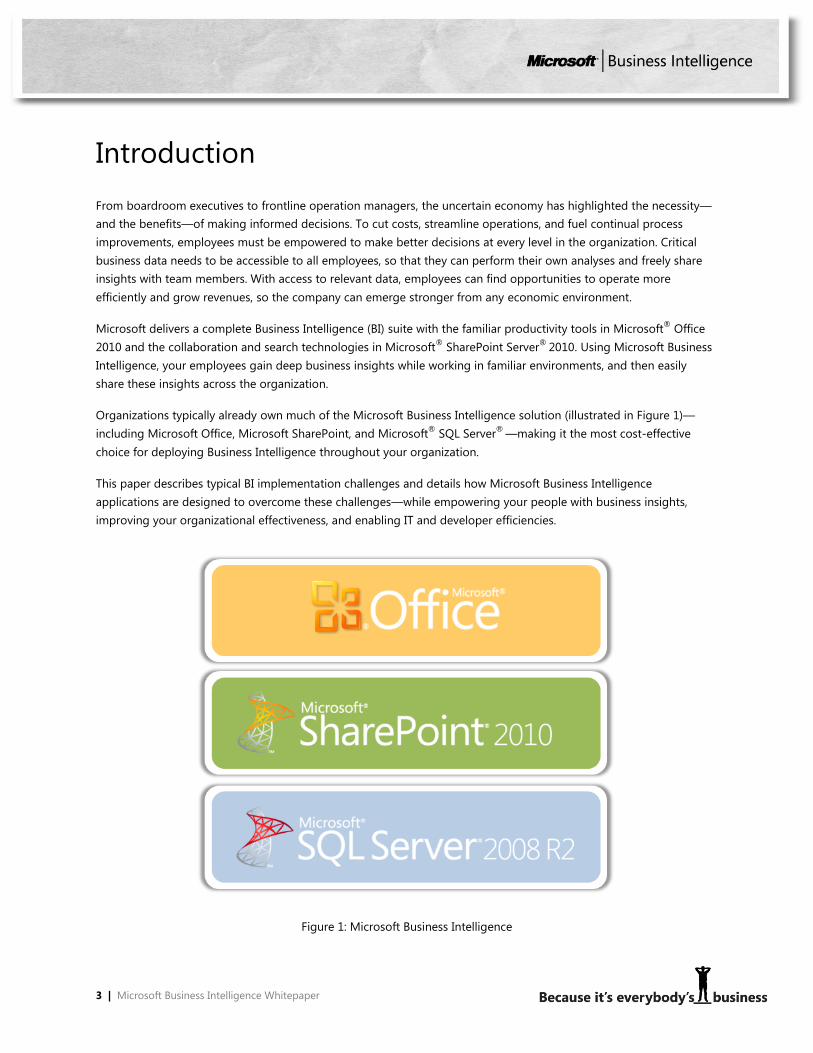
Organizations typically already own much of the Microsoft Business Intelligence solution (illustrated in Figure 1)—
including Microsoft Office, Microsoft SharePoint, and Microsoft®
SQL Server®
—making it the most cost-effective
choice for deploying Business Intelligence throughout your organization.
This paper describes typical BI implementation challenges and details how Microsoft Business Intelligence
applications are designed to overcome these challenges—while empowering your people with business insights,
improving your organizational effectiveness, and enabling IT and developer efficiencies.
Figure 1: Microsoft Business Intelligence
4 | Microsoft Business Intelligence Whitepaper
The Business Intelligence challenge
If your organization is like most, you face three main challenges when it comes to implementing a Business
Intelligence solution: staying within budget, meeting the needs of the business, and efficiently maintaining the
solution going forward.
You might struggle to find a cost-effective BI solution and implement it within reasonable timeframes. Not only are
many BI solutions expensive, they are resource-intensive because they require you to maintain multiple, non-
integrated systems and tools. For a cost-effective solution that fits your budget, you need to work within the
technology infrastructure you already have in place, minimizing start-up and implementation costs.
The second BI challenge organizations typically face revolves around meeting the needs of end users. BI solutions that
can only be mastered by a few highly-trained users will not generate widespread insights or better decision making. It
is important to choose a BI solution that supports the skill sets of the organization and that is easily accessible to all.
BI solutions featuring familiar tools and interfaces will increase adoption rates while reducing training time and cost.
Furthermore, to meet the needs of end users, a BI solution should deliver relevant information when users need it.
Today’s conventional BI implementations rely on IT departments to develop reports for the end user. More often than
not, the IT department becomes a bottleneck for the rest of the company. When IT professionals have to devote time
to producing ad-hoc reports, they have less time to focus on important high-value projects.
The third BI challenge centers on maintaining and managing BI solutions once they are in place. Inflexible architecture
and incompatible BI systems force users to create inefficient workarounds—compromising the system’s ability to
deliver timely, accurate data. It should be easy for you to track how your data and reports are being used, so that you
can move IT resources to areas of the highest need. In order for you to scale your BI solution to meet your ongoing
performance needs, the solution should be flexible, letting you expand coverage or add capabilities. The most
efficient and cost-effective solutions to maintain are those that allow for central management of enterprise-wide
workloads, integrate within the existing IT environment, and adapt to changing business needs.
5 | Microsoft Business Intelligence Whitepaper
Enabling Business Intelligence for everyone
Microsoft Business Intelligence can uniquely overcome typical BI solution challenges such as cost, wide-scale
adoption, and maintenance. By building on technology you typically already own, Microsoft Business Intelligence is
the most cost-effective solution you can buy. But even for those customers who have made no investments in
Microsoft products, they can receive business intelligence capabilities in addition to a full enterprise database
platform for a fraction of the average cost of solutions from other BI vendors.1 And once implemented, Microsoft
Business Intelligence can help you improve organizational performance by meeting your company’s individual,
organizational, and IT information and analytical needs. Specifically, Microsoft Business Intelligence combines
traditional BI with productivity and collaboration tools in order to:
1. Empower your people with business insights
2. Improve organizational effectiveness
3. Drive IT and developer efficiencies
Empower your people with business insights
You want to empower your employees with the relevant information they need to make better, more strategic
decisions. Business Intelligence gets the right information to the right people faster. Providing self-service access to BI
capabilities allows users to access, analyze, and collaborate on critical business information to make the best possible
decisions. And, self-service data access reduces user dependency on IT, speeding access to data and enabling them to
make the right decisions at the right time. At the same time, it frees IT to concentrate on higher-value projects.
For example, with self-service capabilities, customer support representatives can directly use Business Intelligence to
review information that helps them identify cross-selling and up-selling opportunities. Sales directors can gain
visibility into the pipeline and prioritize their efforts around their most profitable customers. With self-service access
to real-time information, your front-line employees can quickly analyze what’s happening within the business today,
and make decisions based on information that’s both current and relevant to their role—helping to build customer
relationships and plan for the future.
Microsoft Business Intelligence gives people the data they need to make better decisions through self-service
analysis, self-service reporting, and personalized dashboards.
Leverage managed self-service analysis
Microsoft Excel is the world’s premier analysis tool. Use the powerful self-service analytic capabilities within Microsoft
Excel to uncover patterns, slice through large amounts of data, and quickly find answers.
Microsoft Excel data analysis and visualization tools help you discover patterns, illuminate trends, and
highlight exceptions more easily. For example, use conditional formatting—including data bars, color scales,
heat maps, sparklines, and performance indicator icons—to analyze performance and generate actionable
insights.
1 When comparing the licensing and support costs over a three year period. See the “BI Pricing and Evaluation Update” from the BI Scorecard
(http://www.biscorecard.com).
6 | Microsoft Business Intelligence Whitepaper
Slicers, a new self-service analytic tool available in Microsoft Excel 2010, let you slice-and-dice through large
amounts of data to quickly identify trends. For example, slicers can help you track how many customers
purchased your product last month or last year. Slicers help highlight just one relevant section of your data,
or break it up into a few sections, so you can easily compare not only percentages but trends year-over-year,
month-over-month, or any other way you want to slice the data.
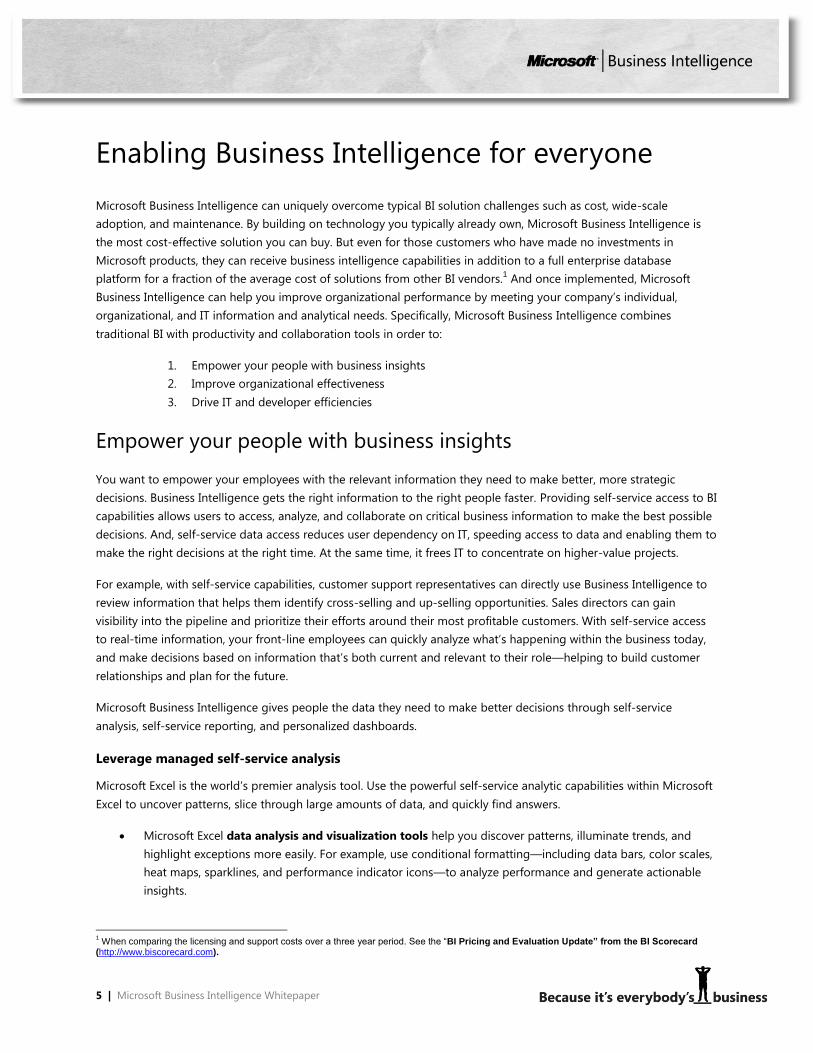
PivotTables, another self-service analytic tool, let you interactively explore data and summarize it into useful
reports, as shown in Figure 2. For example, quickly navigate through your data by rotating rows or swapping
out columns to answer multiple questions from the same data set. Drag and drop column headings to new
locations, and Microsoft Excel quickly calculates and updates the data. This makes it easy to display multiple
results such as averages, counts, minimums, and maximums.
Figure 2: Interactive PivotTable and visual slicers simplify navigation
Named Sets make it easy for users to identify only the items they care about, and work with those items in
PivotTables, PivotCharts, and Cube Functions. For example, a user can identify the top 10 salespeople or
largest purchases in the Midwest in the last month, and then re-use that data set within reports and
calculations. Additionally, by supporting combinations of items and multidimensional expressions (MDX) for
Named Sets, Excel makes just about any PivotTable possible, including ones that compare actual sales to
projections.
Microsoft SQL Server 2008 Data-Mining Add-ins help users analyze large data sets to identify issues and
opportunities facing their organization. These add-ins help users derive patterns and trends that exist in
complex data, visualize those patterns in charts and interactive views, and generate rich, colorful summaries
for presentation and analysis.
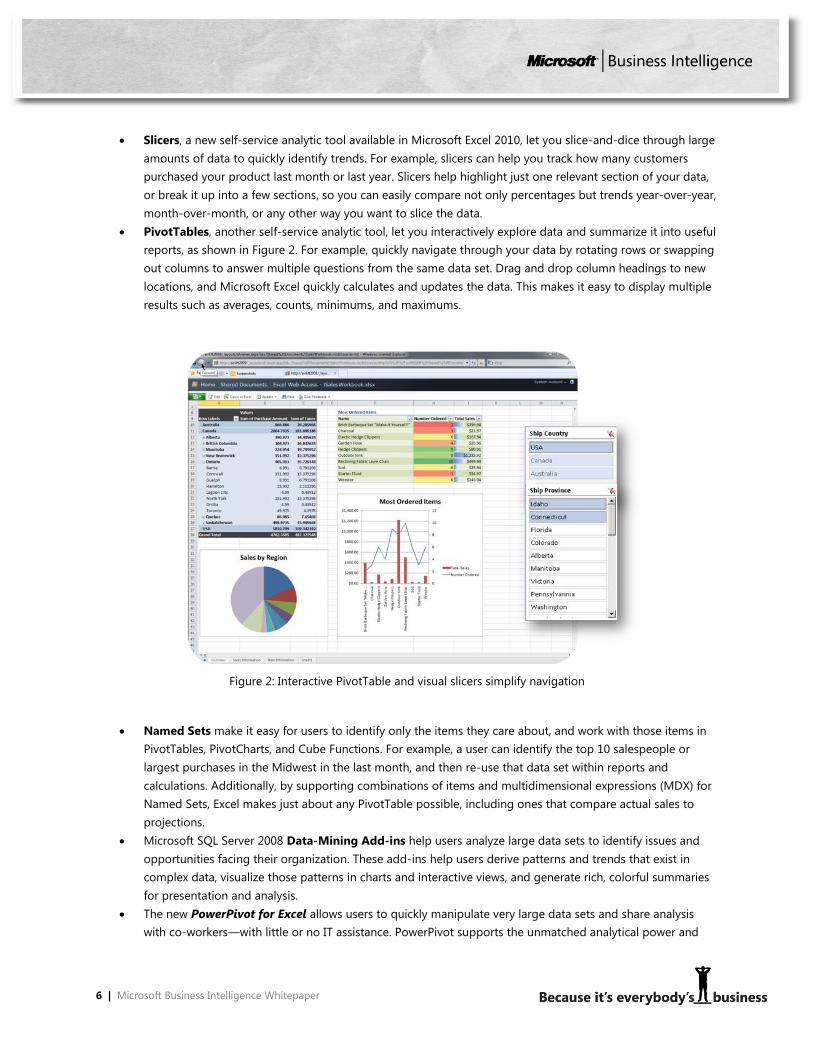
The new PowerPivot for Excel allows users to quickly manipulate very large data sets and share analysis
with co-workers—with little or no IT assistance. PowerPivot supports the unmatched analytical power and
7 | Microsoft Business Intelligence Whitepaper
ease of use of Excel while allowing users to connect to any data source—databases, reports, data feeds, Web
pages, Excel files, and more. PowerPivot for Sharepoint enables seamless integration with Microsoft
Sharepoint 2010, allowing users to share and collaborate with confidence. Team members can easily
publishing their analyses in a PowerPivot Gallery within Sharepoint, allowing other users to enjoy the same
interactivity and fast-query capabilities when working on reports in a thin client. SQL Server 2008 R2 will also
enable support for adhoc BI applications in SharePoint, including automatic data refresh, and data
processing with the same performance as in Excel. IT also benefits from the managed self-service capabilities
within PowerPivot. IT can track the usage of PowerPivot applications via the PowerPivot Management
Dashboard and identify mission-critical Excel applications, while reducing the time spent managing and
revising one-off reports.
Figure 3: PowerPivot for Excel allows for analyzing massive amounts of data
Utilize self-service reporting
Microsoft Business Intelligence also provides self-service reporting functionality. A new Report Component Library
makes it easy to design new reports and charts through powerful wizards, or edit existing reports with an intuitive,
Office-optimized interface.
The Report Component Library within Microsoft SQL Server enables IT and power users to create report
parts—such as queries, charts, graphs, and logos—and save them to the shared report part gallery for reuse
by others in the organization. This enables a “grab and go” experience—you simply use existing report parts
as building blocks to create new reports. To create a custom report in minutes, users simply browse the
gallery and drag and drop the report parts they need onto a design surface—independent of IT assistance.
Additionally, if you find pieces of information you need to spread across multiple reports, you can use the
report component library to break existing reports into smaller components in just a few simple steps. After
you save the resulting report parts to the gallery, you can reuse them to create new, more individualized
8 | Microsoft Business Intelligence Whitepaper
reports. With these features, everyone—from novices to power users—experiences more sophisticated,
enhanced reporting.
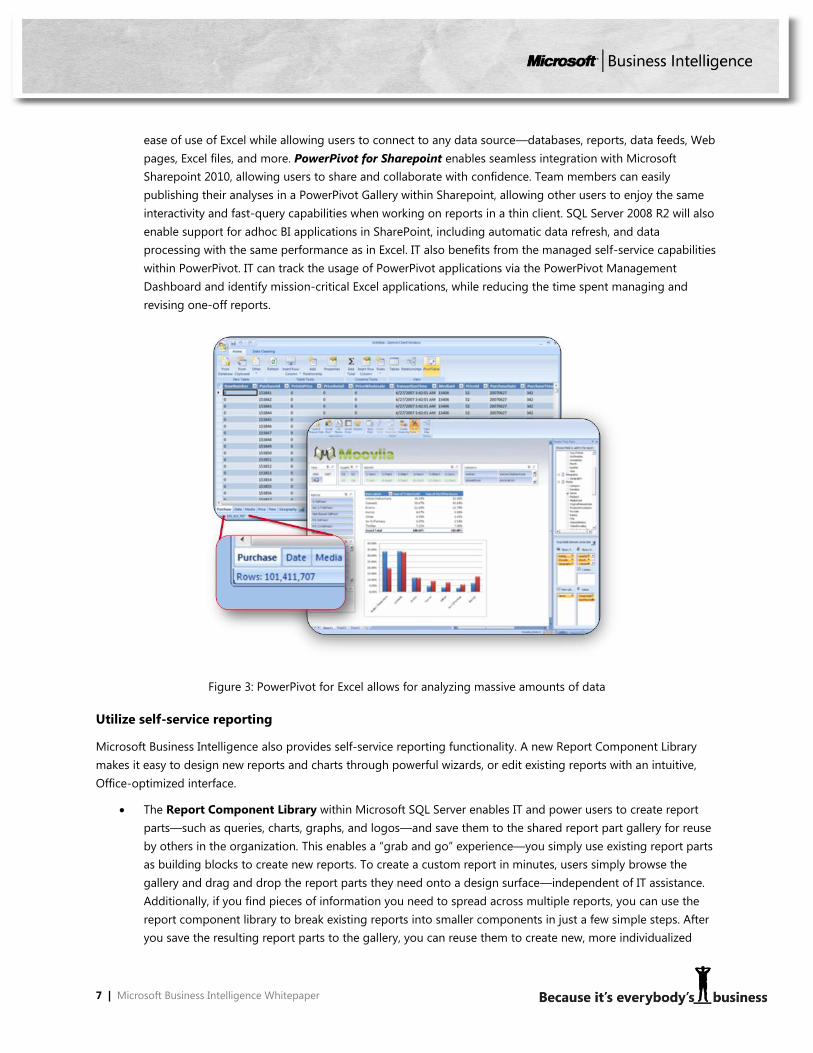
The Business Intelligence Center—an out-of-the-box site template and document library optimized for
report access and management—makes it easy to manage reports, spreadsheets, and data connections
consistently. The Report Center includes a report library, data connection library, and a business intelligence
dashboard template. Access the Business Intelligence Center and use reports as data sources for self-service
analysis in PowerPivot and Excel. This provides a secure, easy way for IT to provide timely access to the
information business users need.
Figure 4: PowerPivot workbooks within Sharepoint 2010.
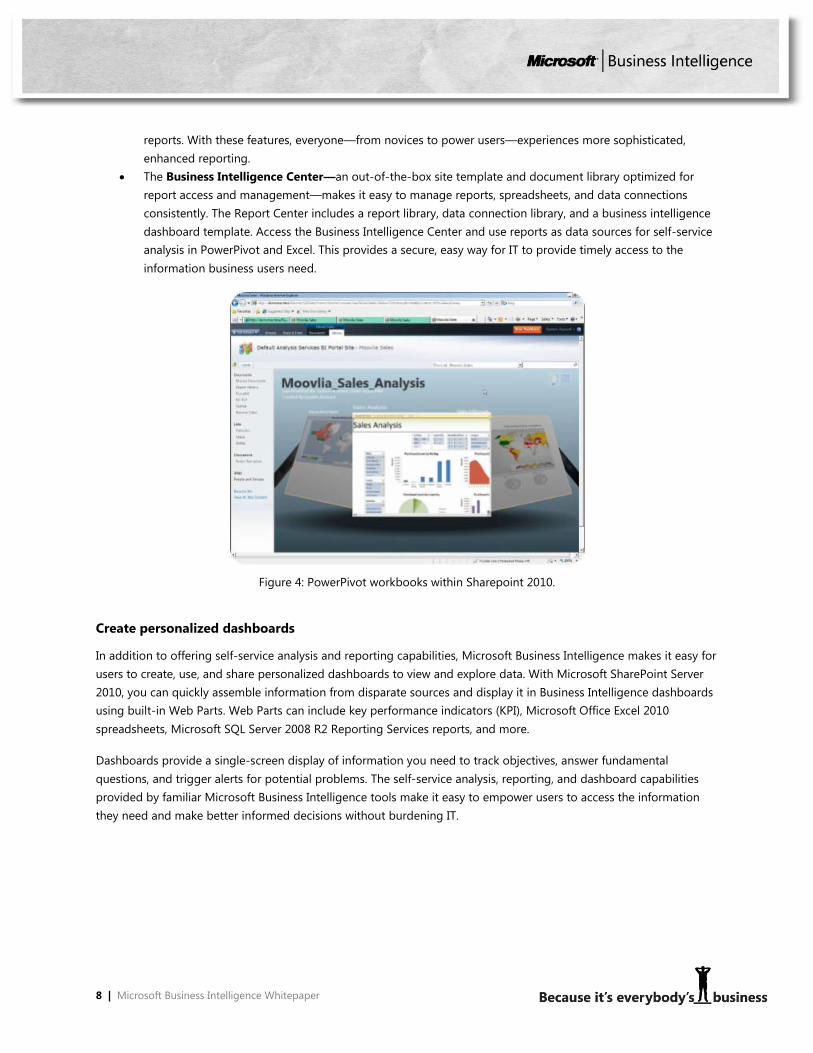
Create personalized dashboards
In addition to offering self-service analysis and reporting capabilities, Microsoft Business Intelligence makes it easy for
users to create, use, and share personalized dashboards to view and explore data. With Microsoft SharePoint Server
2010, you can quickly assemble information from disparate sources and display it in Business Intelligence dashboards
using built-in Web Parts. Web Parts can include key performance indicators (KPI), Microsoft Office Excel 2010
spreadsheets, Microsoft SQL Server 2008 R2 Reporting Services reports, and more.
Dashboards provide a single-screen display of information you need to track objectives, answer fundamental
questions, and trigger alerts for potential problems. The self-service analysis, reporting, and dashboard capabilities
provided by familiar Microsoft Business Intelligence tools make it easy to empower users to access the information
they need and make better informed decisions without burdening IT.
9 | Microsoft Business Intelligence Whitepaper
Improve organizational effectiveness
With effective Business Intelligence, you not only empower your people, you can improve organizational
effectiveness, so that your entire company operates more effectively and strategically. When you choose Microsoft
Business Intelligence, you can use BI in every part of your business productivity infrastructure. Your employees can
easily create, manage, and share data, making information more discoverable and transparent. As insights are shared
throughout the organization, decision making becomes more effective and organizational goals become more
aligned. A robust Business Intelligence solution from Microsoft helps improve organizational effectiveness by
enabling you to:
Share insights throughout the organization
Collaborate on data for more effective decision making
Search for relevant BI content
Manage structured and unstructured content
Create context-driven dashboards
Share insights throughout the organization
Excel Services, part of Microsoft SharePoint Server 2010, makes sharing business insights easier, so everyone
throughout your organization can make better business decisions. Specifically, Excel Services allows you to
dynamically render a Microsoft Excel spreadsheet as HTML so others can access, navigate, filter, and interact with the
information within a Web browser.
Excel Services also improves spreadsheet management, security, and spreadsheet model reuse using a scalable
server-based calculation service and interactive Web-based user interface. With Excel Services, you can:
Broaden the access and availability of spreadsheets by incorporating interactive spreadsheets into business
intelligence portals, dashboards, and scorecards
Secure and protect confidential information and maintain one version of the truth by locking down access at
the server
Build and create new applications
Collaborate on data for more effective decision making
Microsoft SharePoint Server 2010 helps you collaborate on insights gleaned from data for more effective decision
making, so you can further improve organizational effectiveness. Microsoft Office SharePoint provides collaborative
features to ensure that content is created, accessed, and shared in a transparent and accountable environment. For
example, you can tag a document to make the document easier to find. You can also create team sites, wikis, blogs,
mysites, and more to help people share information seamlessly. SharePoint can help track documents and alert you to
content updates relevant to your user group, meeting space, and team or project site. SharePoint also supports
workflows that can streamline approval processes and built-in versioning to help you better manage content and data
access.
Search for relevant BI content
Advanced search features help reduce BI information overload by enabling you to find relevant content quickly. You
can search for people with a particular expertise as well as documents, reports, and line-of-business data. With
10 | Microsoft Business Intelligence Whitepaper
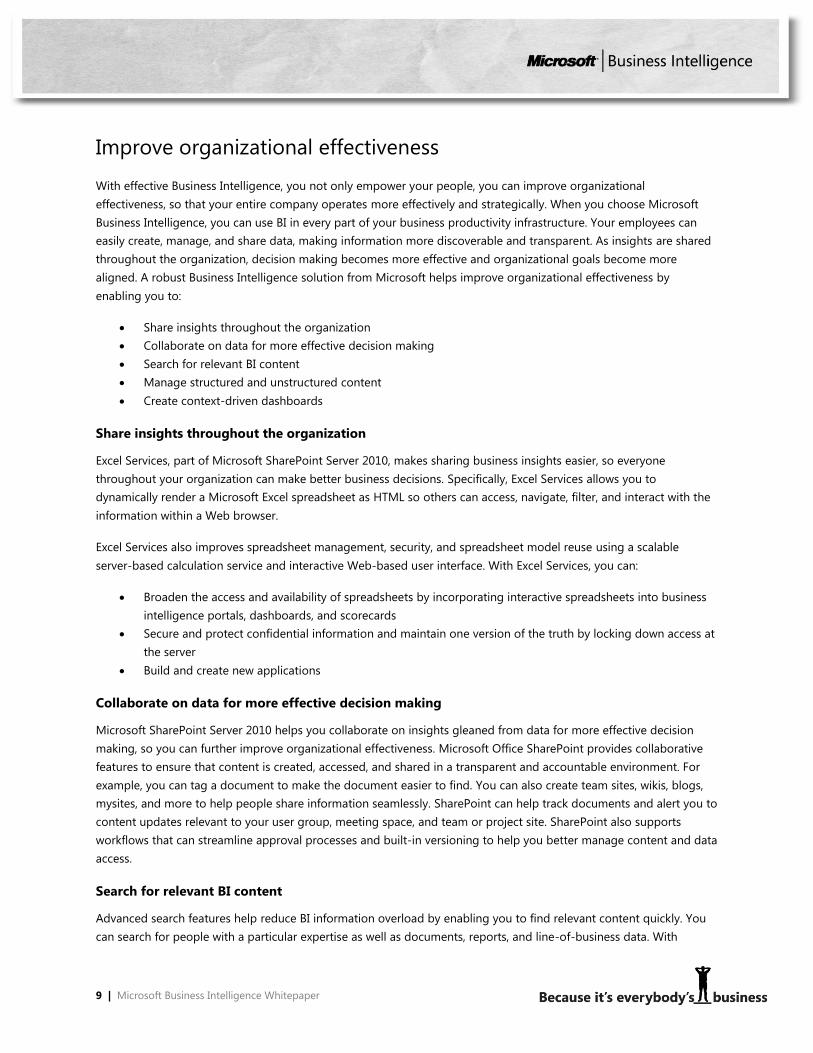
smarter, more visual, and conversational intranet searches, SharePoint lets you go beyond documents to unlock BI
information and effectively search for people, documents, and data—and deliver actionable search results, as shown
in Figure 5. Build customized search scenarios and deliver results quickly for role-specific, context-driven needs,
expanding your ability to apply BI insights across the organization.
Figure 5: Smarter, visual, and actionable search results
Manage structured and unstructured content
For Business Intelligence to be valuable, it must combine structured and unstructured content, including documents,
e-mail messages, videos, instant messages, blogs, wikis, and more. Unstructured content often exists in a state of
unmanaged chaos that prevents an organization from properly using these valuable assets to improve knowledge
sharing, boost customer communications, and increase process efficiency. Microsoft SharePoint Server 2010 includes
Enterprise Content Management (ECM) capabilities to help you overcome these challenges.
Built on a well-integrated platform, SharePoint easily extends the management of documents, records, web content,
and forms to every information worker by integrating with familiar tools such as Microsoft Office. SharePoint ensures
that all users derive the most value from their content by supporting the entire content lifecycle—from creation,
collaboration, and management, to publication, reuse, archiving, and expiration.
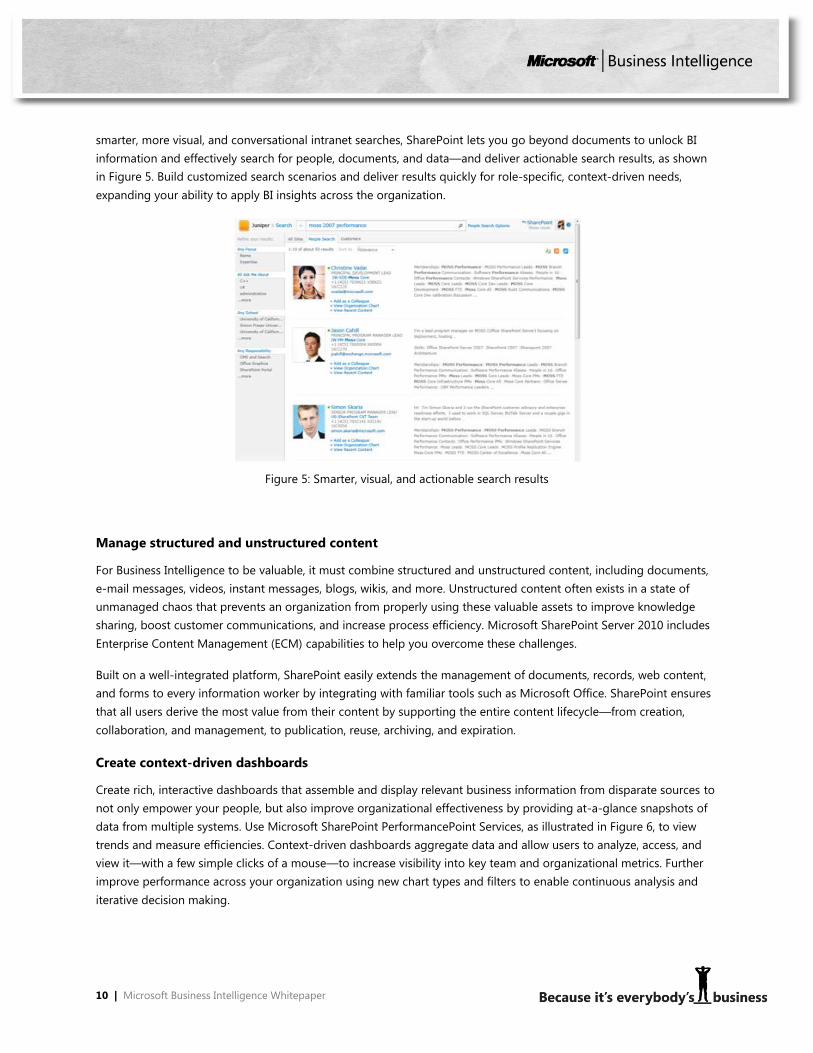
Create context-driven dashboards
Create rich, interactive dashboards that assemble and display relevant business information from disparate sources to
not only empower your people, but also improve organizational effectiveness by providing at-a-glance snapshots of
data from multiple systems. Use Microsoft SharePoint PerformancePoint Services, as illustrated in Figure 6, to view
trends and measure efficiencies. Context-driven dashboards aggregate data and allow users to analyze, access, and
view it—with a few simple clicks of a mouse—to increase visibility into key team and organizational metrics. Further
improve performance across your organization using new chart types and filters to enable continuous analysis and
iterative decision making.
11 | Microsoft Business Intelligence Whitepaper
Figure 6: Use context-driven dashboards to enhance business insight with PerformancePoint Services
Drive IT and Developer Efficiencies
Finally, Microsoft Business Intelligence enables your IT department to run more efficiently and serve users more
effectively. An integrated Business Intelligence solution from Microsoft helps minimize costs and complexity by
leveraging existing IT investments. The Microsoft Business Intelligence solution can also increase IT productivity by
using familiar and intuitive development and management tools. In addition, by providing self-service analytics and
reporting capabilities, users can get the BI capabilities they need, allowing IT to focus on other important tasks.
Easily manage the self-service environment
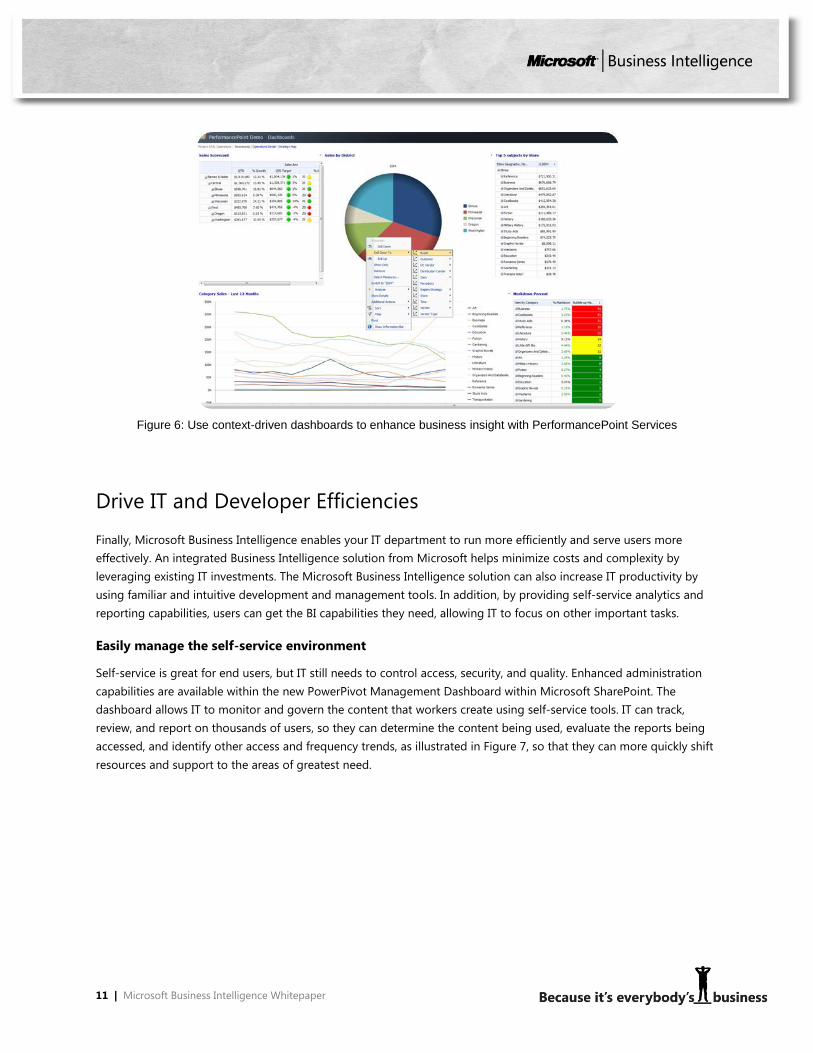
Self-service is great for end users, but IT still needs to control access, security, and quality. Enhanced administration
capabilities are available within the new PowerPivot Management Dashboard within Microsoft SharePoint. The
dashboard allows IT to monitor and govern the content that workers create using self-service tools. IT can track,
review, and report on thousands of users, so they can determine the content being used, evaluate the reports being
accessed, and identify other access and frequency trends, as illustrated in Figure 7, so that they can more quickly shift
resources and support to the areas of greatest need.
12 | Microsoft Business Intelligence Whitepaper
Figure 7: List of top workbooks
Cut cost and complexity by leveraging existing IT investments
Chances are that you already own the BI building blocks you need—Microsoft SQL Server, Microsoft SharePoint
Server, and Microsoft Office. With this broad set of BI, productivity, and collaboration capabilities from Microsoft, you
can consolidate multiple investments to save on cost and complexity.
Ensure data quality
Master Data Services (MDS) delivers a master data hub that can serve both BI and operational requirements and
improve the quality and efficiency of data and processes for all systems. The master data hub provides a centralized
approach to defining, deploying, and managing master data to help ensure reporting consistency across systems and
deliver faster, more accurate results across the enterprise. Besides simply storing the current authoritative source,
MDS enables IT organizations to track versions of master data in order to answer questions about the data at a
specific point in time.
Scale to support BI for all users at a lower TCO
It is imperative that IT departments meet the informational needs of a growing or changing organization. Microsoft
SQL Server DataWarehousing lets your IT department create and manage scalable, high-performance data
warehouses and data marts to support BI for all users at the lowest total cost of ownership (TCO), as shown in Figure
8.
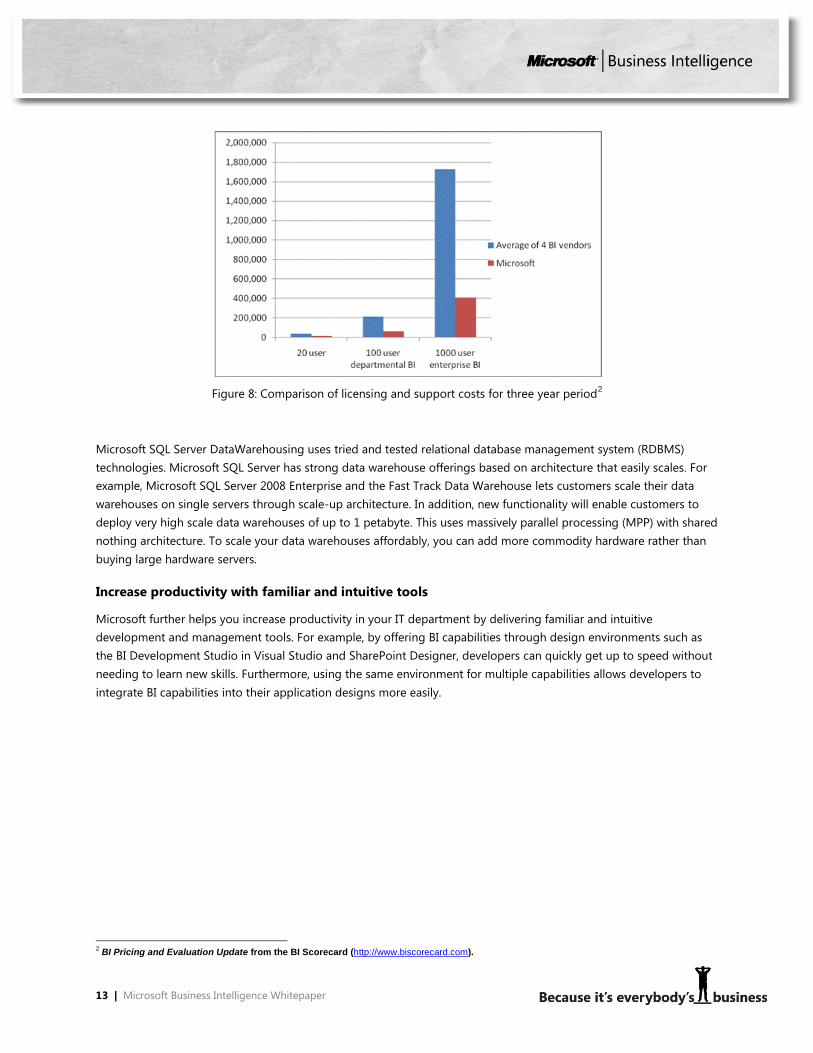
13 | Microsoft Business Intelligence Whitepaper
Figure 8: Comparison of licensing and support costs for three year period2
Microsoft SQL Server DataWarehousing uses tried and tested relational database management system (RDBMS)
technologies. Microsoft SQL Server has strong data warehouse offerings based on architecture that easily scales. For
example, Microsoft SQL Server 2008 Enterprise and the Fast Track Data Warehouse lets customers scale their data
warehouses on single servers through scale-up architecture. In addition, new functionality will enable customers to
deploy very high scale data warehouses of up to 1 petabyte. This uses massively parallel processing (MPP) with shared
nothing architecture. To scale your data warehouses affordably, you can add more commodity hardware rather than
buying large hardware servers.
Increase productivity with familiar and intuitive tools
Microsoft further helps you increase productivity in your IT department by delivering familiar and intuitive
development and management tools. For example, by offering BI capabilities through design environments such as
the BI Development Studio in Visual Studio and SharePoint Designer, developers can quickly get up to speed without
needing to learn new skills. Furthermore, using the same environment for multiple capabilities allows developers to
integrate BI capabilities into their application designs more easily.
2 BI Pricing and Evaluation Update from the BI Scorecard (http://www.biscorecard.com).
14 | Microsoft Business Intelligence Whitepaper
A trusted, integrated solution: Microsoft
Business Intelligence
To be effective, your Business Intelligence solution must be built on a trusted platform and deliver actionable insights
to users throughout the organization, who then use those insights to drive improved performance. With tools and
applications that are agile enough to meet the demands of both business users and IT, the robust Microsoft Business
Intelligence solution is designed to support better decision making through your organization.
You can leverage the investment you’ve already made in Microsoft technology. For a robust and cost-effective BI
solution, build on the industry-leading SQL Server platform, and incorporate the productivity tools of Microsoft Office
and the collaboration features of Microsoft SharePoint Server. This allows you to access, analyze, and integrate BI
data—wherever it lives, in whatever form, and into whatever tool or application you need to ensure that your
organization runs effectively.
Microsoft Business Intelligence can offer your organization these compelling benefits:
Lower total costs. Utilize your investments in Microsoft SQL Server 2008 R2, Microsoft SharePoint Server
2010, and Microsoft Office 2010 to drive end-user adoption, reduce training costs, dramatically reduce per-
user costs, and generate unprecedented value.
Empower employees to make better business decisions. Giving information workers self-service access to
information enables them to perform analysis with minimal support from IT and make fast, accurate
decisions.
Improve organizational effectiveness. Use BI as part of your business productivity infrastructure and easily
share insights with teammates and collaborate on decision making.
Enjoy IT efficiencies, rapid deployment, and faster time-to-benefits. Promote wide-spread adoption and
benefits with the intuitive yet powerful Business Intelligence capabilities embedded within everyday
productivity tools your employees already use.
To learn more, visit us at www.microsoft.com/BI.