encana management's discussion and analysis - 2011 · this management’s discussion and...
TRANSCRIPT

Encana Corporation
Management’s Discussion and Analysis
For the quarter ended March 31, 2011
(U.S. Dollars)

Encana Corporation Management’s Discussion and Analysis (prepared in US$)
1
Management’s Discussion and Analysis
This Management’s Discussion and Analysis (“MD&A”) for Encana Corporation (“Encana” or the “Company”) should be read with the unaudited Interim Consolidated Financial Statements for the period ended March 31, 2011 (“Interim Financial Statements”), as well as the audited Consolidated Financial Statements and MD&A for the year ended December 31, 2010. The Interim Consolidated Financial Statements and comparative information have been prepared in United States (“U.S.”) dollars, except where another currency has been indicated, and in accordance with International Financial Reporting Standard 1, “First-time Adoption of International Financial Reporting Standards”, and with International Accounting Standard 34, “Interim Financial Reporting”, as issued by the International Accounting Standards Board. Previously, the Company prepared its Interim and Annual Consolidated Financial Statements in accordance with Canadian generally accepted accounting principles. Production volumes are presented on an after royalties basis consistent with U.S. oil and gas reporting and the disclosure of U.S. oil and gas companies. The term “liquids” is used to represent crude oil and natural gas liquids (“NGLs”). This document is dated April 19, 2011. Readers should also read the Advisory section located at the end of this document, which provides information on Forward-Looking Statements, Oil and Gas Information and Currency and References to Encana. Encana’s Strategic Objectives Encana is a leading North American natural gas producer focused on growing its strong portfolio of natural gas resource plays from northeast British Columbia to east Texas and Louisiana. Encana believes that natural gas represents an abundant, secure, long-term supply of energy to meet North American needs. Encana is committed to the key business objectives of maintaining financial strength, optimizing capital investments and continuing to pay a stable dividend to shareholders – attained through a disciplined approach to capital spending, a flexible investment program and financial stewardship. Encana maintains a strong balance sheet and is committed to being a low-cost producer. Encana mitigates cost increases through continuing to improve operating efficiencies and technology innovation. Encana is focused on sustainable, high-growth, natural gas plays in major North American basins. Encana has a history of entering resource plays early and leveraging technology to unlock resources. With the Company’s significant portfolio of natural gas resources, Encana has the capacity for substantial production growth. This supports the Company’s long-term strategy of accelerating the value recognition of its assets. Based on the current pricing environment, the Company has aligned its growth rate more closely with the Company’s capacity to generate cash flow. Encana’s strategy for 2011 is to balance near term market uncertainty with continuing capital investment for long-term growth capacity. Further information on expected 2011 results can be found in Encana’s 2011 Corporate Guidance on the Company’s website www.encana.com.

Encana Corporation Management’s Discussion and Analysis (prepared in US$)
2
Encana’s Business Encana is organized into Divisions which represent the Company’s operating and reportable segments as follows:
� Canadian Division includes the exploration for, development of, and production of natural gas, liquids and other related activities within Canada. Four key resource plays are located in the Division: (i) Greater Sierra in northeast British Columbia, including Horn River; (ii) Cutbank Ridge in Alberta and British Columbia, including Montney; (iii) Bighorn in west central Alberta; and (iv) Coalbed Methane (“CBM”) in southern Alberta. The Canadian Division also includes the Deep Panuke natural gas project offshore Nova Scotia.
� USA Division includes the exploration for, development of, and production of natural gas, liquids and other related activities within the U.S. Four key resource plays are located in the Division: (i) Jonah in southwest Wyoming; (ii) Piceance in northwest Colorado; (iii) Haynesville in Louisiana; and (iv) Texas, including East Texas and Fort Worth.
� Market Optimization is primarily responsible for the sale of the Company's proprietary production.
These results are included in the Canadian and USA Divisions. Market optimization activities include third-party purchases and sales of product that provide operational flexibility for transportation commitments, product type, delivery points and customer diversification. These activities are reflected in the Market Optimization segment.
� Corporate and Other mainly includes unrealized gains or losses recorded on derivative financial
instruments. Once amounts are settled, the realized gains and losses are recorded in the operating segment to which the derivative instrument relates.
Market Optimization sells substantially all of the Company's upstream production to third-party customers. Transactions between segments are based on market values and eliminated on consolidation. Financial information is presented on an after eliminations basis. In addition to the Divisions above, Encana has a Natural Gas Economy team to focus on pursuing the development of expanded natural gas markets in North America, particularly within the areas of power generation and transportation. Changes in Accounting Policies On January 1, 2011, Encana adopted International Financial Reporting Standards (“IFRS”) for financial reporting purposes, using a transition date of January 1, 2010. The financial statements for the three months ended March 31, 2011, including required comparative information, have been prepared in accordance with International Financial Reporting Standards 1, First-time Adoption of International Financial Reporting Standards, and with International Accounting Standard ("IAS") 34, Interim Financial Reporting, as issued by the International Accounting Standards Board ("IASB"). Previously, the Company prepared its Interim and Annual Consolidated Financial Statements in accordance with Canadian generally accepted accounting principles ("previous GAAP"). Unless otherwise noted, 2010 comparative information has been prepared in accordance with IFRS. The adoption of IFRS has not had an impact on the Company’s operations, strategic decisions and Cash Flow. The most significant area of impact was the adoption of the IFRS upstream accounting principles. Further information on the IFRS impacts is provided in the Accounting Policies and Estimates Section of this MD&A, including reconciliations between previous GAAP and IFRS Net Earnings, Operating Earnings and other financial metrics.

Encana Corporation Management’s Discussion and Analysis (prepared in US$) 3
Non-GAAP Measures
Certain measures in this document do not have any standardized meaning as prescribed by IFRS and previous GAAP and, therefore, are considered non-GAAP measures. Non-GAAP measures are commonly used in the oil and gas industry and by Encana to provide shareholders and potential investors with additional information regarding the Company’s liquidity and its ability to generate funds to finance its operations. Non-GAAP measures include Cash Flow, Operating Earnings, Capitalization, Debt to Capitalization, Adjusted Earnings Before Interest, Taxes, Depreciation and Amortization (“Adjusted EBITDA”) and Debt to Adjusted EBITDA. Further information can be found in the Non-GAAP Measures section of this MD&A, including reconciliations of Cash from Operating Activities to Cash Flow and of Net Earnings to Operating Earnings. Results Overview Highlights For the three months ended March 31, 2011, Encana reported:
� Cash Flow of $955 million and Operating Earnings of $15 million.
� Total average production volumes of 3,335 million cubic feet equivalent (“MMcfe”) per day (“MMcfe/d”), which increased from 3,265 MMcfe/d in 2010.
� Realized financial natural gas and other commodity hedging gains of $138 million after tax.
� Average commodity prices, excluding financial hedges, of $4.64 per thousand cubic feet equivalent (“Mcfe”).
� Dividends paid of 20 cents per share.
Significant developments during the first quarter of 2011 included:
� Encana signed a Co-operation Agreement with PetroChina International Investment Company Limited (“PetroChina”), a subsidiary of PetroChina Company Limited, that would see PetroChina pay C$5.4 billion to acquire a 50 percent interest in Encana’s Cutbank Ridge business assets in British Columbia and Alberta. The transaction is subject to regulatory approval from Canadian and Chinese authorities, due diligence and the negotiation and execution of various transaction agreements, including the joint venture agreement.
� Encana acquired a 30 percent interest in the planned Kitimat liquefied natural gas export terminal, located on the west coast of central British Columbia, and the associated natural gas pipeline.
� Encana sold its Fort Lupton natural gas processing plant in Colorado for approximately $300 million.

Encana Corporation Management’s Discussion and Analysis (prepared in US$)
4
Financial Results 2011 2010
($ millions, except per share amounts) Q1 Q4 Q3 Q2 Q1 Cash Flow (1) $ 955 $ 917 $1,131 $1,217 $1,172
per share – diluted 1.29 1.25 1.53 1.65 1.56 Operating Earnings (1) 15 50 85 66 397
per share – diluted 0.02 0.07 0.12 0.09 0.53 Net Earnings 78 (469) 606 (457) 1,490
per share – diluted 0.11 (0.64) 0.80 (0.62) 1.96 Capital Investment 1,286 1,426 1,218 1,096 1,024
Net Acquisitions & (Divestitures) (131) 83 (31) (84) (118) (1) A non-GAAP measure, which is defined under the Non-GAAP Measures section of this MD&A.
Three Months ended March 31, 2011 versus March 31, 2010 Cash Flow of $955 million decreased $217 million primarily due to lower commodity prices, partially offset by higher realized financial hedging gains and higher production volumes. In the three months ended March 31, 2011:
� Average commodity prices, excluding financial hedges, were $4.64 per Mcfe compared to $5.81 per Mcfe in 2010.
� Realized financial hedging gains were $138 million after tax compared to gains of $125 million after tax in 2010.
� Average production volumes increased 70 MMcfe/d to 3,335 MMcfe/d from 3,265 MMcfe/d in 2010.
Operating Earnings of $15 million decreased $382 million primarily due to lower commodity prices and higher long-term compensation costs, partially offset by higher realized financial hedging gains and higher production volumes. Net Earnings of $78 million decreased $1,412 million primarily due to lower combined realized and unrealized financial hedging gains, lower commodity prices and higher long-term compensation costs, partially offset by higher production volumes. Combined realized and unrealized hedging gains for 2011 were $50 million after tax compared to $1,037 million after tax for 2010.

Encana Corporation Management’s Discussion and Analysis (prepared in US$) 5
Quarterly Prices and Foreign Exchange Rates 2011 2010
(average for the period) Q1 Q4 Q3 Q2 Q1
Encana Realized Pricing
Natural Gas ($/Mcf)
Including hedging $ 5.00 $ 5.03 $ 5.27 $ 5.50 $ 6.14
Excluding hedging 4.26 3.93 4.19 4.23 5.56
Natural Gas Price Benchmarks
AECO (C$/Mcf) 3.77 3.58 3.72 3.86 5.36
NYMEX ($/MMBtu) 4.11 3.80 4.39 4.09 5.30
Rockies (Opal) ($/MMBtu) 3.84 3.44 3.53 3.66 5.14
Texas (HSC) ($/MMBtu) 4.06 3.78 4.33 4.04 5.36
Basis Differential ($/MMBtu)
AECO/NYMEX 0.29 0.28 0.83 0.32 0.19
Rockies/NYMEX 0.27 0.36 0.86 0.43 0.16
Texas/NYMEX (1) 0.05 0.02 0.06 0.05 (0.06)
Foreign Exchange
U.S./Canadian Dollar Exchange Rate 1.015 0.987 0.962 0.973 0.961 (1) Texas (HSC) was higher than NYMEX in the first quarter of 2010.
Encana’s financial results are influenced by fluctuations in commodity prices, which include price differentials, and the U.S./Canadian dollar exchange rate. As a means of managing this commodity price volatility and its impact on cash flows, Encana enters into various financial hedge agreements. Unsettled derivative financial contracts are recorded at the date of the financial statements based on the fair value of the contracts. Changes in fair value result from volatility in forward curves of commodity prices and changes in the balance of unsettled contracts between periods. The changes in fair value are recognized in revenue as unrealized hedging gains and losses. Realized hedging gains and losses are recognized in revenue when derivative financial contracts are settled. In the first quarter of 2011, Encana’s average realized natural gas price, excluding hedging, reflected lower benchmark prices and widening basis differentials compared to the first quarter of 2010. Hedging activities contributed an additional $0.74 per thousand cubic feet (“Mcf”) to the average realized gas price in the first quarter of 2011. As of March 31, 2011, Encana has hedged approximately 1,767 million cubic feet (“MMcf”) per day (“MMcf/d”) of expected April to December 2011 natural gas production using NYMEX fixed price contracts at an average price of $5.75 per Mcf. In addition, Encana has hedged approximately 1,785 MMcf/d of expected 2012 natural gas production at an average price of $5.87 per Mcf and approximately 395 MMcf/d of expected 2013 natural gas production at an average price of $5.29 per Mcf. The Company’s hedging program helps sustain cash flow during periods of lower prices.

Encana Corporation Management’s Discussion and Analysis (prepared in US$) 6
Production and Net Capital Investment Production Volumes (After Royalties) 2011 2010 2009
(average daily) Q1 Q4 Q3 Q2 Q1 Q4 Q3 Q2 Produced Gas (MMcf/d)
Canadian Division 1,395 1,395 1,390 1,327 1,177 1,071 1,201 1,343
USA Division 1,801 1,835 1,791 1,875 1,946 1,616 1,524 1,581
3,196 3,230 3,181 3,202 3,123 2,687 2,725 2,924
Liquids (bbls/d)
Canadian Division 14,238 11,327 14,262 13,462 13,558 12,477 15,909 17,624
USA Division 9,023 9,206 9,142 10,112 10,108 11,586 10,325 11,699
23,261 20,533 23,404 23,574 23,666 24,063 26,234 29,323
Total (MMcfe/d)
Canadian Division 1,480 1,463 1,476 1,408 1,258 1,145 1,297 1,449
USA Division 1,855 1,890 1,846 1,936 2,007 1,686 1,586 1,651 3,335 3,353 3,322 3,344 3,265 2,831 2,883 3,100 In the first quarter of 2011, total average production volumes of 3,335 MMcfe/d increased 70 MMcfe/d from the first quarter of 2010. In the Canadian Division, higher volumes were primarily due to its successful drilling program and lower royalties. In the USA Division, volumes were lower primarily due to 2010 volumes including flush production from bringing on shut-in and curtailed production. In addition, 2011 volumes were lower by approximately 85 MMcfe/d due to net divestitures in the USA Division.
Net Capital Investment Three months ended March 31 ($ millions) 2011 2010 Canadian Division $ 625 $ 545
USA Division 643 474
Corporate & Other 18 5
Capital Investment 1,286 1,024
Acquisitions 266 28
Divestitures (1) (397) (146)
Net Acquisitions and Divestitures (131) (118)
Net Capital Investment $1,155 $ 906 (1) Reflects proceeds from divestitures. Capital investment during the first quarter of 2011 was primarily focused on continued development of Encana’s North American key resource plays. Capital investment of $1,286 million was higher compared to the first quarter of 2010 primarily due to increased spending on developing Haynesville, Piceance, Texas and CBM. Acquisitions during the first quarter of 2011 of $266 million were primarily in the Canadian Division and include land and property purchases that are complementary to existing Company assets. Land acquisitions included acreage with liquids-rich production potential.

Encana Corporation Management’s Discussion and Analysis (prepared in US$) 7
The Company’s non-core asset divestiture proceeds in the first quarter of 2011 were $98 million in the Canadian Division and $299 million in the USA Division. Divestiture proceeds in the USA Division resulted primarily from the sale of the Fort Lupton natural gas processing plant in Colorado. Encana is presently involved in a number of joint ventures with counterparties in both Canada and the U.S. These arrangements support Encana’s long-term strategy of accelerating the value recognition of its assets. Divisional Results Canadian Division Operating Cash Flow and Netbacks
Three months ended March 31
2011 2010
($ millions, except $/Mcfe) ($/Mcfe) ($/Mcfe) Revenues, Net of Royalties and excluding Hedging $ 597 $ 4.40 $ 657 $ 5.60
Realized Financial Hedging Gain 81 63
Expenses
Production and mineral taxes 4 0.03 1 0.01
Transportation 55 0.42 45 0.39
Operating 167 1.23 140 1.18
Operating Cash Flow / Netback $ 452 $ 2.72 $ 534 $ 4.02
Realized Financial Hedging Gain 0.61 0.55
Netback including Realized Financial Hedging $ 3.33 $ 4.57
Three Months ended March 31, 2011 versus March 31, 2010 Operating Cash Flow of $452 million decreased $82 million primarily due to lower realized commodity prices and higher long-term compensation costs included in operating expenses, partially offset by higher realized financial hedging gains and higher production volumes. In the first quarter of 2011:
� Lower realized commodity prices, excluding the impact of financial hedging, resulted in a decrease of $155 million in revenues, which reflects the changes in benchmark prices and basis differentials.
� Operating expenses included $0.12/Mcfe of long-term compensation costs compared to a recovery of $0.06/Mcfe for 2010.
� Realized financial hedging gains were $81 million compared to $63 million in 2010 on a before tax basis.
� Average production volumes of 1,480 MMcfe/d increased 222 MMcfe/d compared to 2010, resulting in an increase of $94 million in revenues.

Encana Corporation Management’s Discussion and Analysis (prepared in US$) 8
Results by Key Area Three months ended March 31
Daily Production (MMcfe/d after
royalties)
Capital
($ millions) Drilling Activity (net wells drilled)
2011 2010 2011 2010 2011 2010
Greater Sierra (1) 252 218 $ 140 $ 141 9 16
Cutbank Ridge (2) 518 371 112 120 12 16
Bighorn 238 198 124 108 13 15
CBM 469 434 147 119 320 299
Key Resource Plays(3) 1,477 1,221 523 488 354 346
Other 3 37 102 57 - -
Total Canadian Division 1,480 1,258 $ 625 $ 545 354 346
(1) 2011 includes Horn River, which had production of 70 MMcfe/d (2010 - 11 MMcfe/d), capital of $105 million (2010 - $110 million) and 2 net wells drilled (2010 - 6 net wells).
(2) 2011 includes Montney, which had production of 335 MMcfe/d (2010 - 200 MMcfe/d), capital of $93 million (2010 - $108 million) and 10 net wells drilled (2010 - 15 net wells).
(3) Key resource play areas were realigned in the first quarter of 2011, with comparative information restated.
Production Volumes
� Average production volumes of 1,480 MMcfe/d increased 18 percent in the first quarter of 2011 compared to the same period of 2010.
� This increase in production is primarily due to successful drilling programs at Cutbank Ridge and Horn River, and lower royalty rates compared to the first quarter of 2010 .
Division Expenses Three months ended March 31
($ millions) 2011 2010 Exploration and evaluation $ 3 $ -
Depreciation, depletion and amortization 335 295
(Gain) loss on divestitures (8) (10) In the first quarter of 2011, depreciation, depletion and amortization (“DD&A”) of $335 million increased $40 million from 2010 primarily due to higher production volumes.
0
400
800
1,200
1,600
Q2/09 Q3/09 Q4/09 Q1/10 Q2/10 Q3/10 Q4/10 Q1/11
Produced Gas (MMcf/d) Liquids (MMcfe/d)

Encana Corporation Management’s Discussion and Analysis (prepared in US$) 9
USA Division Operating Cash Flow and Netbacks Three months ended March 31
2011 2010
($ millions, except $/Mcfe) ($/Mcfe) ($/Mcfe)
Revenues, Net of Royalties and excluding Hedging $ 831 $ 4.84
$ 1,108 $ 5.94
Realized Financial Hedging Gain 130 100
Expenses
Production and mineral taxes 49 0.29 68 0.38
Transportation 172 1.03 166 0.92
Operating 135 0.75 111 0.48
Operating Cash Flow / Netback $ 605 $ 2.77 $ 863 $ 4.16
Realized Financial Hedging Gain 0.78 0.55
Netback including Realized Financial Hedging $ 3.55 $ 4.71
Three Months ended March 31, 2011 versus March 31, 2010 Operating Cash Flow of $605 million decreased $258 million primarily due to lower realized commodity prices, lower production volumes and higher long-term compensation costs included in operating expenses, partially offset by higher realized financial hedging gains. In the first quarter of 2011:
� Lower realized commodity prices, excluding the impact of financial hedging, resulted in a decrease of $183 million, which reflects the changes in benchmark prices and basis differentials.
� Average production volumes of 1,855 MMcfe/d decreased 152 MMcfe/d compared to 2010, resulting in a decrease of $82 million in revenues.
� Operating expenses included $0.16/Mcfe of long-term compensation costs compared to a recovery of $0.03/Mcfe for 2010.
� Realized financial hedging gains were $130 million compared to $100 million in 2010 on a before tax basis.
Results by Key Area
Three months ended March 31
Daily Production (MMcfe/d after
royalties)
Capital
($ millions) Drilling Activity (net wells drilled)
2011 2010 2011 2010 2011 2010
Jonah 510 595 $ 94 $ 84 25 28
Piceance 426 482 78 23 29 33
Texas 404 584 129 64 17 10
Haynesville 412 189 258 237 22 20
Key Resource Plays (1) 1,752 1,850 559 408 93 91
Other 103 157 84 66 12 11
Total USA Division 1,855 2,007 $ 643 $ 474 105 102 (1) Key resource play areas were realigned in the first quarter of 2011, with comparative information restated.

Encana Corporation Management’s Discussion and Analysis (prepared in US$) 10
Production Volumes
� Average production volumes of 1,855 MMcfe/d decreased 8 percent in the first quarter of 2011 compared to the same period of 2010.
� This decrease in production is primarily due to 2010 volumes including flush production from bringing on shut-in and curtailed production. In addition, first quarter 2011 volumes were 85 MMcfe/d lower due to net divestitures. The decrease in production was partially offset by drilling and operational success in Haynesville in 2011.
Division Expenses Three months ended March 31
($ millions) 2011 2010 Exploration and evaluation $ 5 $ 3
Depreciation, depletion and amortization 457 500
(Gain) loss on divestitures (121) (42)
In the first quarter of 2011, DD&A of $457 million decreased $43 million from 2010 primarily due to lower production volumes. The net gain on divestitures for the first quarter of 2011 of $121 million resulted primarily from the sale of the Fort Lupton natural gas processing plant for proceeds of approximately $300 million. The 2010 net gain on divestitures of $42 million resulted from non-core asset sales.
0
700
1,400
2,100
Q2/09 Q3/09 Q4/09 Q1/10 Q2/10 Q3/10 Q4/10 Q1/11
Produced Gas (MMcf/d) Liquids (MMcfe/d)
Encana Corporation Management’s Discussion and Analysis (prepared in US$) 11
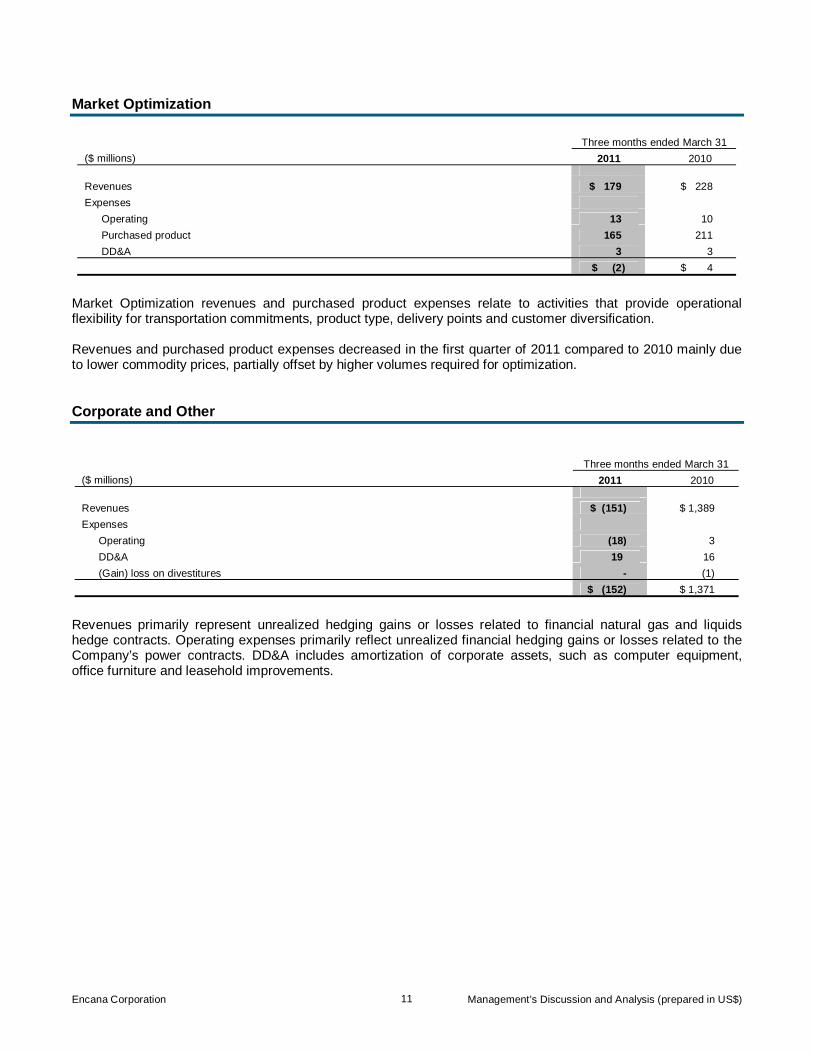
Market Optimization
Three months ended March 31
($ millions) 2011 2010 Revenues $ 179 $ 228
Expenses
Operating 13 10
Purchased product 165 211
DD&A 3 3 $ (2) $ 4
Market Optimization revenues and purchased product expenses relate to activities that provide operational flexibility for transportation commitments, product type, delivery points and customer diversification. Revenues and purchased product expenses decreased in the first quarter of 2011 compared to 2010 mainly due to lower commodity prices, partially offset by higher volumes required for optimization. Corporate and Other
Three months ended March 31
($ millions) 2011 2010 Revenues $ (151) $ 1,389
Expenses
Operating (18) 3
DD&A 19 16
(Gain) loss on divestitures - (1) $ (152) $ 1,371
Revenues primarily represent unrealized hedging gains or losses related to financial natural gas and liquids hedge contracts. Operating expenses primarily reflect unrealized financial hedging gains or losses related to the Company’s power contracts. DD&A includes amortization of corporate assets, such as computer equipment, office furniture and leasehold improvements.

Encana Corporation Management’s Discussion and Analysis (prepared in US$) 12
Other Operating Results Expenses Three months ended March 31
($ millions) 2011 2010 Accretion of asset retirement obligation $ 13 $ 13
Administrative 136 86
Interest 119 130
Foreign exchange (gain) loss, net (114) (144) $ 154 $ 85 In the first quarter of 2011:
� Administrative expense increased $50 million from 2010 primarily as a result of higher long-term compensation costs due to increased share prices.
� Foreign exchange gains decreased $30 million from 2010 as a result of lower foreign exchange gains on the revaluation of long-term debt and a loss on settlement of intercompany transactions, partially offset by gains on the revaluation of monetary assets and liabilities.
Income Tax Three months ended March 31
($ millions) 2011 2010 Current Income Tax $ (67) $ 12
Deferred Income Tax 67 439
Total Income Tax $ - $ 451 In the first quarter of 2011: �
� Current income tax, a recovery of $67 million, decreased $79 million from 2010 primarily due to lower Cash Flow resulting from lower commodity prices, partially offset by higher realized hedging gains. �
�
� Total income tax expense decreased $451 million from 2010 due to lower earnings before tax primarily resulting from lower combined realized and unrealized hedging gains and lower commodity prices. �
Encana’s effective tax rate was nil for the first quarter of 2011, compared to 23.2 percent for the first quarter of 2010. The effective tax rate in any period is a function of the relationship between total tax (current and deferred) and the amount of net earnings before income taxes for the year. The effective tax rate differs from the statutory tax rate as it takes into consideration permanent differences, adjustments to estimates, changes to tax rates and other tax legislation in each jurisdiction. Permanent differences are comprised of a variety of items, including:
� The non-taxable portion of Canadian capital gains or losses;
� International financing; and
� Foreign exchange (gains) losses not included in net earnings. Tax interpretations, regulations and legislation in the various jurisdictions in which the Company and its subsidiaries operate are subject to change. As a result, there are usually tax matters under review. The Company believes that the provision for taxes is adequate.

Encana Corporation Management’s Discussion and Analysis (prepared in US$) 13
Summary of Consolidated Net Earnings
2011 2010 2009 - Previous GAAP(1)
($ millions, except per share amounts) Q1 Q4 Q3 Q2 Q1 Q4 Q3 Q2 Continuing Operations
Net Earnings from Continuing Operations $ 78 $ (469) $ 606 $ (457) $ 1,490 $ 589 $ 39 $ 211
per share – basic 0.11 (0.64) 0.82 (0.62) 1.99 0.78 0.05 0.28
per share – diluted 0.11 (0.64) 0.80 (0.62) 1.96 0.78 0.05 0.28 Total Consolidated
Net Earnings 78 (469) 606 (457) 1,490 636 25 239
per share – basic 0.11 (0.64) 0.82 (0.62) 1.99 0.85 0.03 0.32
per share – diluted 0.11 (0.64) 0.80 (0.62) 1.96 0.85 0.03 0.32 Revenues, Net of Royalties 1,667 1,431 2,425 1,469 3,545 2,712 2,271 2,449 (1) As Encana’s IFRS transition date was January 1, 2010, 2009 comparative information has not been restated.
On November 30, 2009, Encana completed a corporate reorganization (the “Split Transaction”) to split into two independent publicly traded energy companies – Encana Corporation, a natural gas company, and Cenovus Energy Inc. (“Cenovus”), an integrated oil company. The comparative consolidated results prior to the November 30, 2009 Split Transaction include Cenovus operations. The former Canadian Plains and Integrated Oil – Canada upstream operations were transferred to Cenovus, and were reported as continuing operations. The former Integrated Oil U.S. Downstream Refining assets were also transferred to Cenovus and were reported as discontinued operations. In 2009, Encana’s Net Earnings were impacted primarily by combined realized and unrealized hedging gains of $1,143 million after tax, average production volumes of 4,365 MMcfe/d and an average commodity price of $4.49 per Mcfe, excluding financial hedges. Combined realized and unrealized hedging gains and losses after tax contributed to the quarterly volatility in net earnings (Q2 - $150 million gain; Q3 - $18 million loss; Q4 - $223 million gain). Average production included 1,362 MMcfe/d from the former Canadian Plains and Integrated Oil – Canada upstream operations. In 2010, Encana’s Net Earnings were impacted primarily by combined realized and unrealized hedging gains of $1,442 million after tax, average production volumes of 3,321 MMcfe/d and an average commodity price of $4.74 per Mcfe, excluding financial hedges. Combined realized and unrealized hedging gains and losses after tax contributed to the quarterly volatility in net earnings (Q1 - $1,037 million gain; Q2 - $77 million loss; Q3 - $542 million gain; Q4 - $60 million loss).

Encana Corporation Management’s Discussion and Analysis (prepared in US$) 14
Liquidity and Capital Resources
Three months ended March 31
($ millions) 2011 2010 Net Cash From (Used In)
Operating activities $ 633 $ (773)
Investing activities (1,261) (1,039)
Financing activities 121 (465)
Foreign exchange gain (loss) on cash and cash equivalents held in foreign currency 5 (4)
Increase (Decrease) in Cash and Cash Equivalents $ (502) $ (2,281)
Operating Activities Net cash from operating activities in the first quarter of 2011 of $633 million increased $1,406 million compared to the first quarter of 2010. This increase is a result of items discussed in the Financial Results section of this MD&A, as well as the change in non-cash working capital. For the first quarter of 2011, the net change in non-cash working capital was a deficit of $299 million, compared to a deficit of $1,914 million for the same period in 2010. The 2010 net change in non-cash working capital reflected a one time tax payment of $1,775 million related to the wind-up of the Company’s Canadian oil and gas partnership. The Company had a working capital deficit of $1,208 million at March 31, 2011 compared to a surplus of $20 million at December 31, 2010. Working capital included current debt of $1,374 million at March 31, 2011 and $500 million at December 31, 2010, which is discussed further below. Encana expects that it will continue to meet the payment terms of its suppliers. Investing Activities Net cash used for investing activities in the first quarter of 2011 of $1,261 million increased $222 million compared to the first quarter of 2010. In the first quarter of 2011, capital investment for the Canadian and USA Divisions of $1,268 million increased $249 million and net divestitures increased $13 million compared to the first quarter of 2010. Reasons for these changes are discussed under the Net Capital Investment and Divisional Results sections of this MD&A. Financing Activities Current and Long-Term Debt
Encana’s debt totaled $8,019 million at March 31, 2011 and $7,629 million at December 31, 2010. Encana’s current debt of $1,374 million at March 31, 2011 included $1,014 million in current portion of long-term debt and $360 million drawn from total available revolving credit facilities of $5.2 billion. Current debt at December 31, 2010 included $500 million in current portion of long-term debt. Long-term debt of $6,645 million at March 31, 2011 decreased from $7,129 million at December 31, 2010 primarily due to the reclassification of a C$500 million note to current debt.

Encana Corporation Management’s Discussion and Analysis (prepared in US$) 15
Credit Facilities and Shelf Prospectuses
Encana maintains two committed revolving bank credit facilities and a Canadian and a U.S. dollar shelf prospectus. As at March 31, 2011, Encana had committed revolving bank credit facilities of $5.2 billion, of which $4.8 billion remains unused.
� Encana has in place a revolving bank credit facility for C$4.5 billion ($4.6 billion) that remains committed through October 2012. At March 31, 2011, $4.2 billion remains unused.
� One of Encana’s U.S. subsidiaries has in place a revolving bank credit facility for $565 million that remains committed through February 2013. At March 31, 2011, $564 million remains unused.
As at March 31, 2011, Encana had available unused capacity under shelf prospectuses for up to $6.1 billion.
� Encana has in place a shelf prospectus whereby it may issue from time to time up to C$2.0 billion, or the equivalent in foreign currencies, of debt securities in Canada. At March 31, 2011, C$2.0 billion ($2.1 billion) of the shelf prospectus remained unutilized, the availability of which is dependent upon market conditions. The shelf prospectus expires in June 2011 and is expected to be renewed prior to expiry.
� Encana has in place a shelf prospectus whereby it may issue from time to time up to $4.0 billion, or the equivalent in foreign currencies, of debt securities in the United States. At March 31, 2011, $4.0 billion of the shelf prospectus remained unutilized, the availability of which is dependent upon market conditions. The shelf prospectus expires in May 2012.
Encana is currently in compliance with, and expects that it will continue to be in compliance with, all financial covenants under its credit facility agreements and indentures. Normal Course Issuer Bid
Encana has received regulatory approval under Canadian securities law to purchase common shares under nine consecutive annual Normal Course Issuer Bids (“NCIB”). During the first quarter of 2011, the Company did not purchase any common shares. During the first quarter of 2010, the Company purchased 9.9 million common shares for total consideration of approximately $320 million. Encana is entitled to purchase, for cancellation, up to 36.8 million common shares under the current NCIB, which commenced December 14, 2010 and terminates on December 13, 2011. Shareholders may obtain a copy of the Company's Notice of Intention to make a Normal Course Issuer Bid by contacting [email protected]. Dividends and Outstanding Share Data
Encana pays quarterly dividends to shareholders at the discretion of the Board of Directors. Dividend payments in the first quarter of 2011 were $147 million or $0.20 per share (2010 - $149 million or $0.20 per share). As at March 31, 2011, Encana had 736.3 million common shares outstanding (December 31, 2010 - 736.3 million).
Encana Corporation Management’s Discussion and Analysis (prepared in US$) 16
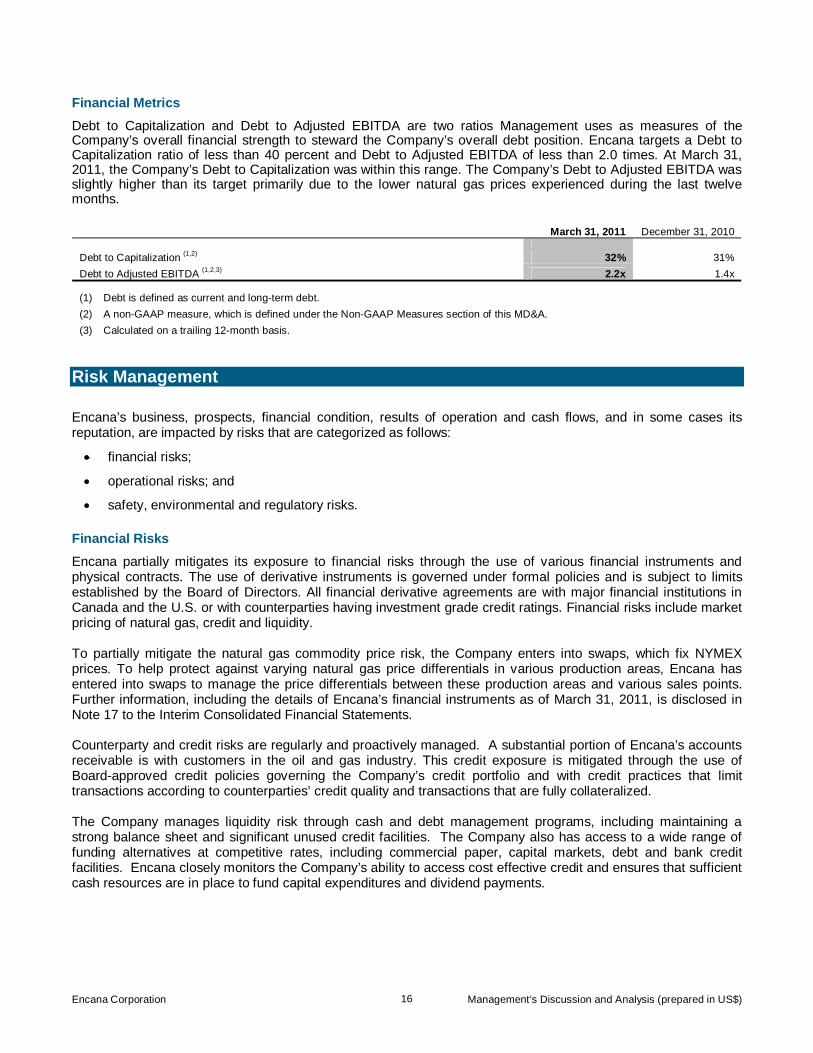
Financial Metrics
Debt to Capitalization and Debt to Adjusted EBITDA are two ratios Management uses as measures of the Company’s overall financial strength to steward the Company’s overall debt position. Encana targets a Debt to Capitalization ratio of less than 40 percent and Debt to Adjusted EBITDA of less than 2.0 times. At March 31, 2011, the Company’s Debt to Capitalization was within this range. The Company’s Debt to Adjusted EBITDA was slightly higher than its target primarily due to the lower natural gas prices experienced during the last twelve months.
March 31, 2011 December 31, 2010 Debt to Capitalization (1,2) 32% 31%
Debt to Adjusted EBITDA (1,2,3) 2.2x 1.4x (1) Debt is defined as current and long-term debt.
(2) A non-GAAP measure, which is defined under the Non-GAAP Measures section of this MD&A.
(3) Calculated on a trailing 12-month basis. Risk Management Encana’s business, prospects, financial condition, results of operation and cash flows, and in some cases its reputation, are impacted by risks that are categorized as follows:
� financial risks;
� operational risks; and
� safety, environmental and regulatory risks. Financial Risks
Encana partially mitigates its exposure to financial risks through the use of various financial instruments and physical contracts. The use of derivative instruments is governed under formal policies and is subject to limits established by the Board of Directors. All financial derivative agreements are with major financial institutions in Canada and the U.S. or with counterparties having investment grade credit ratings. Financial risks include market pricing of natural gas, credit and liquidity. To partially mitigate the natural gas commodity price risk, the Company enters into swaps, which fix NYMEX prices. To help protect against varying natural gas price differentials in various production areas, Encana has entered into swaps to manage the price differentials between these production areas and various sales points. Further information, including the details of Encana’s financial instruments as of March 31, 2011, is disclosed in Note 17 to the Interim Consolidated Financial Statements. Counterparty and credit risks are regularly and proactively managed. A substantial portion of Encana’s accounts receivable is with customers in the oil and gas industry. This credit exposure is mitigated through the use of Board-approved credit policies governing the Company’s credit portfolio and with credit practices that limit transactions according to counterparties’ credit quality and transactions that are fully collateralized. The Company manages liquidity risk through cash and debt management programs, including maintaining a strong balance sheet and significant unused credit facilities. The Company also has access to a wide range of funding alternatives at competitive rates, including commercial paper, capital markets, debt and bank credit facilities. Encana closely monitors the Company’s ability to access cost effective credit and ensures that sufficient cash resources are in place to fund capital expenditures and dividend payments.

Encana Corporation Management’s Discussion and Analysis (prepared in US$) 17
Operational Risks
The Company’s ability to operate, generate cash flows, complete projects, and value reserves is dependent on financial risks, including commodity prices mentioned above, continued market demand for its products and other risk factors outside of its control, which include: general business and market conditions; economic recessions and financial market turmoil; the ability to secure and maintain cost effective financing for its commitments; environmental and regulatory matters; unexpected cost increases; royalties; taxes; the availability of drilling and other equipment; the ability to access lands; weather; the availability of processing capacity; the availability and proximity of pipeline capacity; technology failures; accidents; the availability of skilled labour; and reservoir quality. To mitigate these risks, as part of the capital approval process, the Company’s projects are evaluated on a fully risked basis, including geological risk and engineering risk. When making operating and investing decisions, Encana’s business model allows flexibility in capital allocation to optimize investments focused on project returns, long-term value creation, and risk mitigation. Encana also mitigates operational risks through a number of other policies, systems and processes as well as by maintaining a comprehensive insurance program. Safety, Environmental and Regulatory Risks
The Company is committed to safety in its operations and has high regard for the environment and stakeholders, including regulators. The Company’s business is subject to all of the operating risks normally associated with the exploration for, development of and production of natural gas and liquids and the operation of midstream facilities. When assessing the materiality of the environmental risk factors, Encana takes into account a number of qualitative and quantitative factors, including, but not limited to, financial, operational, reputational and regulatory aspects of the identified risk factor. These risks are managed by executing policies and standards that are designed to comply with or exceed government regulations and industry standards. In addition, Encana maintains a system that identifies, assesses and controls safety, security and environmental risk and requires regular reporting to Senior Management and the Board of Directors. The Corporate Responsibility, Environment, Health & Safety Committee of Encana’s Board of Directors provides recommended environmental policies for approval by Encana’s Board of Directors and oversees compliance with government laws and regulations. Monitoring and reporting programs for environmental, health and safety performance in day-to-day operations, as well as inspections and audits, are designed to provide assurance that environmental and regulatory standards are met. Contingency plans are in place for a timely response to environmental events and remediation/reclamation strategies are utilized to restore the environment. A comprehensive discussion of Encana’s Risk Management is provided in the Company’s MD&A for the year ended December 31, 2010. Accounting Policies and Estimates Adoption of International Financial Reporting Standards The Company has prepared its March 31, 2011 Interim Consolidated Financial Statements in accordance with IFRS 1, First-time Adoption of International Financial Reporting Standards, and with IAS 34, Interim Financial Reporting, as issued by the IASB. Previously, the Company prepared its financial statements in accordance with Canadian GAAP, or previous GAAP. The adoption of IFRS has not had a material impact on the Company’s operations, strategic decisions, Cash Flow and capital expenditures. The Company’s IFRS accounting policies are provided in Note 3 to the Interim Consolidated Financial Statements. In addition, Note 20 to the Interim Consolidated Financial Statements presents reconciliations between the Company’s 2010 previous GAAP results and the 2010 IFRS results. The reconciliations include the Consolidated Balance Sheets as at January 1, 2010, March 31, 2010 and December 31, 2010, and Consolidated Statements of Earnings, Comprehensive Income, Changes in Shareholders’ Equity and Cash Flows for the three months ended March 31, 2010 and for the twelve months ended December 31, 2010. The following provides summary reconciliations of Encana’s 2010 previous GAAP and IFRS results, along with a discussion of the significant IFRS accounting policy changes.

Encana Corporation Management’s Discussion and Analysis (prepared in US$) 18
Summary Net Earnings Reconciliation
2010
($ millions) Annual Q4 Q3 Q2 Q1 Net Earnings – Previous GAAP $ 1,499 $ (42) $ 569 $ (505) 1,477
After-tax (addition) / deduction:
Exploration and evaluation 27 26 1 (1) 1
Depletion, depreciation and amortization 60 17 18 15 10
Impairments 371 371 - - -
Divestitures (gain) loss (101) 12 (51) (28) (34)
Asset retirement obligation accretion 1 1 - - -
Compensation 5 - (6) 1 10
Foreign currency (34) - 1 (35) -
329 427 (37) (48) (13)
Net Earnings - IFRS $ 1,170 $ (469) $ 606 $ (457) $ 1,490
Summary Operating Earnings Reconciliation
2010
($ millions) Annual Q4 Q3 Q2 Q1 Operating Earnings – Previous GAAP(1) $ 665 $ 68 $ 98 $ 81 $ 418
After-tax (addition) / deduction:
Exploration and evaluation 1 - 1 (1) 1
Depletion, depreciation and amortization 60 17 18 15 10
Accretion of asset retirement obligation 1 1 - - -
Compensation 5 - (6) 1 10
67 18 13 15 21
Operating Earnings – IFRS(1) $ 598 $ 50 $ 85 $ 66 $ 397 (1) A non-GAAP measure, which is defined under the Non-GAAP Measures section of this MD&A.
Financial Metrics
2010
($ millions) Annual Q4 Q3 Q2 Q1 Cash Flow (1)
Previous GAAP $ 4,439 $ 917 $ 1,132 $ 1,217 $ 1,173
IFRS 4,437 917 1,131 1,217 1,172
Capital Investment
Previous GAAP $ 4,773 $ 1,427 $ 1,227 $ 1,099 $ 1,020
IFRS 4,764 1,426 1,218 1,096 1,024
Debt to Capitalization (1)
Previous GAAP 31%
IFRS 31%
(1) A non-GAAP measure, which is defined under the Non-GAAP Measures section of this MD&A.

Encana Corporation Management’s Discussion and Analysis (prepared in US$) 19
Accounting Policy Changes The following discussion explains the significant differences between Encana’s previous GAAP accounting policies and those applied by the Company under IFRS. IFRS policies have been retrospectively and consistently applied except where specific IFRS 1 optional and mandatory exemptions permitted an alternative treatment upon transition to IFRS for first-time adopters. The most significant changes to the Company's accounting policies relate to the accounting for upstream costs. Under previous GAAP, Encana followed the Canadian Institute of Chartered Accountants (“CICA”) guideline on full cost accounting in which all costs directly associated with the acquisition of, the exploration for, and the development of natural gas and liquids reserves were capitalized on a country-by-country cost centre basis. Costs accumulated within each country cost centre were depleted using the unit-of-production method based on proved reserves determined using estimated future prices and costs. Upon transition to IFRS, the Company was required to adopt new accounting policies for upstream activities, including exploration and evaluation costs and development costs. Under IFRS, exploration and evaluation costs are those expenditures for an area where technical feasibility and commercial viability has not yet been determined. Development costs include those expenditures for areas where technical feasibility and commercial viability has been determined. Encana adopted the IFRS 1 exemption whereby the Company deemed its January 1, 2010 IFRS upstream asset costs to be equal to its previous GAAP historical upstream property, plant and equipment net book value. Accordingly, exploration and evaluation costs were deemed equal to the unproved properties balance and the development costs were deemed equal to the upstream full cost pool balance. Under IFRS, exploration and evaluation costs are presented as exploration and evaluation assets and development costs are presented within property, plant and equipment on the Consolidated Balance Sheet. Exploration and Evaluation
Exploration and evaluation assets at January 1, 2010 were deemed to be $1,885 million, representing the unproved properties balance under previous GAAP. This resulted in a reclassification of $1,885 million from property, plant and equipment to exploration and evaluation assets on Encana’s Consolidated Balance Sheet as at January 1, 2010. As at December 31, 2010, the Company's exploration and evaluation assets were $2,158 million including $1,114 million in the Canadian Division and $1,044 million in the USA Division. Under previous GAAP, exploration and evaluation costs were capitalized as property, plant and equipment in accordance with the CICA’s full cost accounting guidelines. Under IFRS, Encana capitalizes these costs initially as exploration and evaluation assets. Once technical feasibility and commercial viability of the area has been determined, the capitalized costs are transferred from exploration and evaluation assets to property, plant and equipment. Under IFRS, unrecoverable exploration and evaluation costs associated with an area and costs incurred prior to obtaining the legal rights to explore are expensed. During the twelve months ended December 31, 2010, Encana transferred $303 million of capitalized exploration and evaluation costs to property, plant and equipment and expensed $50 million of unsuccessful exploration and evaluation assets and $15 million in direct exploration costs. The application of IFRS for exploration and evaluation costs resulted in a $27 million decrease, after tax, to Encana's previous GAAP Net Earnings for the twelve months ended December 31, 2010. Depreciation, Depletion and Amortization
Development costs at January 1, 2010 were deemed to be $23,216 million, representing the upstream full cost pool balance under previous GAAP. Consistent with previous GAAP, these costs are capitalized as property, plant and equipment under IFRS. Under previous GAAP, development costs were depleted using the unit-of-production method calculated for each country cost centre. Under IFRS, development costs are depleted using the unit-of-production method calculated at the established area level. The IFRS 1 exemption permitted the Company to allocate development costs to the area level using proved reserve values for each Division as at January 1, 2010.
Encana Corporation Management’s Discussion and Analysis (prepared in US$) 20
Depleting at an area level under IFRS resulted in an $86 million increase to Encana's DD&A expense for the twelve months ended December 31, 2010. Encana's Net Earnings decreased $60 million, after tax, compared to previous GAAP for the twelve months ended December 31, 2010 as a result of depleting at an area level under IFRS. Impairments
Under previous GAAP, an upstream impairment was recognized if the carrying amount exceeded the undiscounted cash flows from proved reserves for a country cost centre. An impairment was measured as the amount by which the carrying value exceeded the sum of the fair value of the proved and probable reserves and the costs of unproved properties. Impairments recognized under previous GAAP were not reversed. Under IFRS, an upstream impairment is recognized if the carrying value exceeds the recoverable amount for a cash-generating unit. Upstream areas are aggregated into cash-generating units based on their ability to generate largely independent cash flows. If the carrying value of the cash-generating unit exceeds the recoverable amount, the cash-generating unit is written down with an impairment recognized in net earnings. Impairments recognized under IFRS are reversed when there has been a subsequent increase in the recoverable amount. Impairment reversals are recognized in net earnings and the carrying amount of the cash-generating unit is increased to its revised recoverable amount as if no impairment had been recognized for the prior periods. For the twelve months ended December 31, 2010, Encana recognized an after-tax impairment of $371 million relating to the Company's Canadian offshore upstream assets which form a cash-generating unit under IFRS. The impairment recognized was based on the difference between the December 31, 2010 net book value of the assets and the recoverable amount. The recoverable amount was determined using fair value less costs to sell based on discounted future cash flows of proved and probable reserves using forecast prices and costs. Under previous GAAP, these assets were included in the Canadian cost centre ceiling test, which was not impaired at December 31, 2010. Divestitures
Under previous GAAP, proceeds from divestitures of upstream assets were deducted from the full cost pool without recognition of a gain or loss unless the deduction resulted in a change to the country cost centre depletion rate of 20 percent or greater, in which case a gain or loss was recorded. Under IFRS, gains or losses are recorded on divestitures and are calculated as the difference between the proceeds and the net book value of the asset disposed. For the twelve months ended December 31, 2010, Encana recognized a $143 million net gain on divestitures under IFRS compared to previous GAAP results. The net gain arose from the Canadian and USA Divisions, totaling $90 million and $53 million, respectively. Accounting for divestitures under IFRS resulted in an after-tax increase of $101 million to Encana's previous GAAP Net Earnings for the twelve months ended December 31, 2010. Asset Retirement Obligation
Under previous GAAP, the asset retirement obligation was measured as the estimated fair value of the retirement and decommissioning expenditures expected to be incurred. Liabilities were not remeasured to reflect period end discount rates. Under IFRS, the asset retirement obligation is measured as the best estimate of the expenditure to be incurred and requires that the asset retirement obligation be remeasured using the period end discount rate. In conjunction with the IFRS 1 exemption regarding upstream assets discussed above, Encana was required to remeasure its asset retirement obligation upon transition to IFRS and recognize the difference in retained earnings. The application of this exemption resulted in a $32 million increase to the asset retirement obligation on Encana’s Consolidated Balance Sheet as at January 1, 2010 and a corresponding after-tax charge to retained earnings of $26 million. Subsequent IFRS remeasurements of the obligation are recorded through property, plant and equipment with an offsetting adjustment to the asset retirement obligation. As at December 31, 2010, excluding the January 1, 2010 adjustment, Encana's asset retirement obligation increased by $101 million, which

Encana Corporation Management’s Discussion and Analysis (prepared in US$) 21
primarily reflects the remeasurement of the obligation using Encana's discount rate of 5.4 percent as at December 31, 2010. Compensation
Share-based payments
Under previous GAAP, Encana accounted for certain stock-based compensation plans whereby the obligation and compensation costs were accrued over the vesting period using the intrinsic value method. The intrinsic value of a share unit is the amount by which the Company's share price exceeds the exercise price of the share unit. For these stock-based compensation plans, IFRS requires the liability for share-based payments be fair valued using an option pricing model, such as the Black-Scholes-Merton model, at each reporting date. Accordingly, upon transition to IFRS, the Company recorded a fair value adjustment of $38 million as at January 1, 2010 to increase the share-based compensation liability with a corresponding charge to retained earnings. Encana elected to use the IFRS 1 exemption whereby the liabilities for share-based payments that had vested or settled prior to January 1, 2010 were not required to be retrospectively restated. Subsequent IFRS fair value adjustments are recorded through property, plant and equipment, exploration and evaluation expenses, operating expenses and administrative expenses with an offsetting adjustment to the share-based compensation liability. In addition to the January 1, 2010 adjustment discussed above, the IFRS fair-value remeasurements subsequent to transition increased the current liability for share-based payments by $20 million as at December 31, 2010 in comparison to previous GAAP. Pensions
Encana elected to use the IFRS 1 exemption whereby the cumulative unamortized net actuarial gains and losses of the Company’s defined benefit plan are charged to retained earnings on January 1, 2010. This resulted in a $75 million increase to the accrued benefit obligation and a corresponding $55 million after-tax charge to retained earnings. The application of IFRS for share-based payments and employee benefit plans resulted in a $5 million decrease, after tax, to Encana's previous GAAP Net Earnings for the twelve months ended December 31, 2010. Foreign Currency
As permitted by IFRS 1, the Company elected to apply the exemption to set the cumulative foreign currency translation adjustment to zero upon transition to IFRS. Accordingly, $755 million was recognized as an adjustment to retained earnings on January 1, 2010. The reclassification had no impact on total shareholders’ equity as at January 1, 2010. As a result of the election, the accounts of the Company have not been retrospectively restated using IFRS foreign currency principles. Future foreign currency translation gains and losses that are recognized from the cumulative foreign currency translation adjustment will differ under IFRS compared to previous GAAP due to the exemption taken above. The application of the IFRS exemption resulted in a $34 million increase to Encana's previous GAAP Net Earnings for the twelve months ended December 31, 2010. This arose due to the reversal of a foreign exchange loss recorded under previous GAAP that had been recognized in retained earnings under IFRS as a result of the exemption. The IFRS adjustments discussed above are recorded in the Company’s functional currency and are subject to translation for presentation purposes. The associated foreign currency impacts are reported in accumulated other comprehensive income.

Encana Corporation Management’s Discussion and Analysis (prepared in US$) 22
Income Tax
Deferred income taxes have been adjusted to reflect the tax effect arising from the differences between IFRS and previous GAAP. Upon transition to IFRS, the Company recognized a $26 million reduction in the deferred income tax balance with a corresponding increase to retained earnings. For the twelve months ended December 31, 2010, the application of the IFRS adjustments discussed above resulted in a $134 million decrease to the Company's deferred income tax expense and a corresponding increase to Encana's previous GAAP Net Earnings. Other Exemptions
Other significant IFRS 1 exemptions taken by Encana at January 1, 2010 include the following:
� Business combinations and joint ventures entered into prior to January 1, 2010 were not retrospectively restated under IFRS.
� Borrowing costs directly attributable to the acquisition or construction of qualifying assets were not retrospectively restated prior to January 1, 2010.
� Leases were not reassessed to determine whether an arrangement contained a lease under International Financial Reporting Interpretations Committee 4, Determining whether an Arrangement contains a Lease, for contracts that were already assessed under previous GAAP.
The remaining IFRS 1 exemptions were not applicable or material to the preparation of Encana's Consolidated Balance Sheet at the date of transition to IFRS on January 1, 2010. Net Earnings Per Common Share
As Encana has stock-based compensation plans that may be settled in common shares or cash at the employees’ option, IFRS requires the more dilutive of cash-settled and equity-settled be used in calculating diluted net earnings per common share regardless of how the share plan is accounted for. As a result, share units that are accounted for as cash-settled may require an adjustment to the denominator for potentially dilutive share units and a corresponding adjustment to the numerator for any changes in net earnings that would result if the share units had been reported as equity instruments for the purposes of calculating diluted net earnings per common share. For the three months ended March 31, 2010 and the twelve months ended December 31, 2010, diluted net earnings per common share was calculated using the more dilutive equity-settled method. Accordingly, Net Earnings was reduced by $15 million for the three months ended March 31, 2010 and by $17 million for the twelve months ended December 31, 2010. Recent Pronouncements Issued All accounting standards effective for periods beginning on or after January 1, 2011 have been adopted as part of the transition to IFRS. The following new IFRS pronouncements have been issued but are not effective and may have an impact on the Company:
� As of January 1, 2013, Encana will be required to adopt IFRS 9, Financial Instruments, which is the result of the first phase of the IASB’s project to replace IAS 39, Financial Instruments: Recognition and Measurement. The new standard replaces the current multiple classification and measurement models for financial assets and liabilities with a single model that has only two classification categories: amortized cost and fair value. The adoption of this standard should not have a material impact on Encana’s Consolidated Financial Statements.

Encana Corporation Management’s Discussion and Analysis (prepared in US$) 23
Critical Accounting Estimates Management is required to make judgments, assumptions and estimates in applying its accounting policies and practices, which have a significant impact on the financial results of the Company. The preceding discussion outlines the Company’s significant accounting policies and practices adopted under IFRS. The following discussion outlines the accounting policies and practices involving the use of estimates that are critical to determining Encana’s financial results. Upstream Assets and Reserves
Reserves estimates can have a significant impact on earnings, as they are a key input to the Company’s DD&A calculations and impairment tests. Costs accumulated within each area are depleted using the unit-of-production method based on proved reserves using estimated future prices and costs. Costs subject to depletion include estimated future costs to be incurred in developing proved reserves. A downward revision in reserves estimates or an increase in estimated future development costs could result in the recognition of a higher DD&A charge to net earnings. Upstream assets, including exploration and evaluation costs and development costs, are aggregated into cash-generating units based on their ability to generate largely independent cash flows. If the carrying value of the cash-generating unit exceeds the recoverable amount, the cash-generating unit is written down with an impairment recognized in net earnings. The recoverable amount of an asset or cash-generating unit is the greater of its fair value less costs to sell and its value in use. Fair value less costs to sell may be determined using discounted future net cash flows of proved and probable reserves using forecast prices and costs. A downward revision in reserves estimates could result in the recognition of impairments charged to net earnings. Reversals of impairments are recognized when there has been a subsequent increase in the recoverable amount. In this event, the carrying amount of the asset or cash-generating unit is increased to its revised recoverable amount with an impairment reversal recognized in net earnings. All of Encana’s oil and gas reserves and resources are evaluated and reported on by independent qualified reserves evaluators. The estimation of reserves is a subjective process. Forecasts are based on engineering data, projected future rates of production, estimated commodity price forecasts and the timing of future expenditures, all of which are subject to numerous uncertainties and various interpretations. Reserves estimates can be revised upward or downward based on the results of future drilling, testing, production levels and economics of recovery based on cash flow forecasts. Contingent resources are not classified as reserves due to the absence of a commercial development plan that includes a firm intent to develop within a reasonable time frame. Asset Retirement Obligations
Asset retirement obligations include present obligations where the Company will be required to retire tangible long-lived assets such as producing well sites, offshore production platforms and natural gas processing plants. The asset retirement obligation is measured at the present value of the expenditure to be incurred. The associated asset retirement cost is capitalized as part of the cost of the related long-lived asset. Changes in the estimated obligation resulting from revisions to estimated timing, amount of cash flows or changes in discount rate are recognized as a change in the asset retirement obligation and the related asset retirement cost. Increases in the estimated asset retirement obligation and costs increase the corresponding charges of accretion and DD&A to net earnings. A decrease in discount rates decreases the asset retirement obligation, which decreases the accretion charged to net earnings. Actual expenditures incurred are charged against the accumulated asset retirement obligation.

Encana Corporation Management’s Discussion and Analysis (prepared in US$) 24
Goodwill
Goodwill, which represents the excess of purchase price over fair value of net assets acquired, is assessed for impairment annually at December 31 of each year. Goodwill is currently attributed to the aggregated cash-generating units that collectively form the respective Canadian and USA Divisions. This represents the lowest level that goodwill is monitored for internal management purposes. To assess impairment, the goodwill carrying amount for each Division is compared to the recoverable amount of the aggregated cash-generating units of the Division. If the carrying amount for the Division exceeds the recoverable amount, the associated goodwill is written down with an impairment recognized in net earnings. Goodwill impairments are not reversed. The recoverable amount is the greater of the Divisions fair value less costs to sell and its value in use. Fair value less costs to sell is derived by estimating the discounted after-tax future net cash flows for the aggregated cash-generating units. Discounted future net cash flows are based on forecasted commodity prices and costs over the expected economic life of the proved and probable reserves and discounted using market-based rates. A downward revision in reserves estimates could result in the recognition of a goodwill impairment charge to net earnings. Income Taxes
Encana follows the liability method of accounting for income taxes. Under this method, deferred income taxes are recorded for the effect of any temporary difference between the accounting and income tax basis of an asset or liability, using the substantively enacted income tax rates. Current income taxes for the current and prior periods are measured at the amount expected to be recoverable from or payable to the taxation authorities based on the income tax rates enacted or substantively enacted at the end of the reporting period. The deferred income tax assets and liabilities are adjusted to reflect changes in enacted or substantively enacted income tax rates that are expected to apply, with the corresponding adjustment recognized in net earnings or in shareholders’ equity depending on the item to which the adjustment relates. Tax interpretations, regulations and legislation in the various jurisdictions in which the Company and its subsidiaries operate are subject to change. As such, income taxes are subject to measurement uncertainty and the interpretations can impact net earnings through the income tax expense arising from the changes in deferred income tax assets or liabilities. Derivative Financial Instruments
As described in the Risk Management section of this MD&A, derivative financial instruments are used by Encana to manage its exposure to market risks relating to commodity prices, foreign currency exchange rates and interest rates. The Company’s policy is to not use derivative financial instruments for speculative purposes. Derivative financial instruments that do not qualify, or are not designated, as hedges for accounting are recorded at fair value. Instruments are recorded in the balance sheet as either an asset or liability with changes in fair value recognized in net earnings. Realized gains or losses are presented in revenues as the contracts are settled. Unrealized gains and losses are presented in revenue at the end of each respective reporting period based on the change in fair value. The estimate of fair value of all derivative instruments is based on quoted market prices or, in their absence, third-party market indications and forecasts. The estimated fair value of financial assets and liabilities is subject to measurement uncertainty. For 2010 through to the first quarter of 2011, the Company elected not to designate any of its derivative financial instruments as hedges for accounting. As a result, the changes in fair value of the derivative instruments were recorded in the Company’s net earnings.

Encana Corporation Management’s Discussion and Analysis (prepared in US$)
25
Non-GAAP Measures Certain measures in this document do not have any standardized meaning as prescribed by IFRS and previous GAAP and, therefore, are considered non-GAAP measures. These measures may not be comparable to similar measures presented by other issuers. These measures are commonly used in the oil and gas industry and by Encana to provide shareholders and potential investors with additional information regarding the Company’s liquidity and its ability to generate funds to finance its operations. Non-GAAP measures include Cash Flow, Cash Flow per share – diluted, Operating Earnings, Operating Earnings per share – diluted, Debt to Capitalization, and Debt to Adjusted EBITDA. Management’s use of these measures is discussed further below.
Cash Flow
2011 2010
($ millions) Q1 Q4 Q3 Q2 Q1
Cash From (Used in) Operating Activities $ 633 $ 919 $ 1,324 $ 893 $ (773)
(Add back) deduct:
Net change in other assets and liabilities (23) 1 (16) (38) (31)
Net change in non-cash working capital (299) 1 209 (286) (1,914)
Cash Flow $ 955 $ 917 $ 1,131 $ 1,217 $ 1,172
Cash Flow is a non-GAAP measure commonly used in the oil and gas industry and by Encana to assist Management and investors in measuring the Company’s ability to finance capital programs and meet financial obligations. Cash Flow is defined as cash from operating activities excluding net change in other assets and liabilities and net change in non-cash working capital.
Operating Earnings 2011 2010
($ millions) Q1 Q4 Q3 Q2 Q1
Net Earnings $ 78 $ (469) $ 606 $ (457) $ 1,490
Add back (losses) and deduct gains (after tax):
Unrealized hedging gain (loss) (88) (269) 331 (340) 912
Exploration and evaluation - (26) - - -
Impairments - (371) - - -
Gain (loss) on divestitures 83 (12) 51 28 34
Non-operating foreign exchange gain (loss) 68 159 139 (211) 147
Operating Earnings $ 15 $ 50 $ 85 $ 66 $ 397
Net Earnings per share – diluted $ 0.11 $ (0.64) $ 0.80 $ (0.62) $ 1.96
Operating Earnings per share – diluted $ 0.02 $ 0.07 $ 0.12 $ 0.09 $ 0.53
Operating Earnings is a non-GAAP measure that adjusts Net Earnings by non-operating items that Management believes reduces the comparability of the Company’s underlying financial performance between periods. Operating Earnings is commonly used in the oil and gas industry and by Encana to provide investors with information that is more comparable between periods. Operating Earnings is defined as Net Earnings excluding non-recurring or non-cash items that Management believes reduces the comparability of the Company's financial performance between periods. These after-tax items may include, but are not limited to, unrealized hedging gains/losses, exploration and evaluation expenses,

Encana Corporation Management’s Discussion and Analysis (prepared in US$) 26
impairments and impairment reversals, gains/losses on divestitures, foreign exchange gains/losses and the effect of changes in statutory income tax rates. Encana has updated its Operating Earnings definition to exclude non-operating items resulting from the adoption of IFRS, such as exploration and evaluation expenses and gains/losses on divestitures. Debt to Capitalization
Debt to Capitalization is a non-GAAP measure of the Company’s overall financial strength used by Management to steward the Company’s overall debt position. Capitalization is a non-GAAP measure defined as current and long-term debt plus shareholders’ equity. Debt to Adjusted EBITDA
Debt to Adjusted EBITDA is a non-GAAP measure used by Management as a measure of the Company’s overall financial strength to steward the Company’s overall debt position. Adjusted EBITDA is a non-GAAP measure defined as trailing 12-month Net Earnings before gains or losses on divestitures, income taxes, foreign exchange gains or losses, interest, accretion of asset retirement obligation, DD&A, exploration and evaluation expenses and impairments. Advisory Forward-Looking Statements In the interest of providing Encana shareholders and potential investors with information regarding the Company and its subsidiaries, including Management’s assessment of Encana’s and its subsidiaries’ future plans and operations, certain statements contained in this document constitute forward-looking statements or information (collectively referred to herein as “forward-looking statements”) within the meaning of the “safe harbour” provisions of applicable securities legislation. Forward-looking statements are typically identified by words such as “anticipate”, “believe”, “expect”, “plan”, “intend”, “forecast”, “target”, “project” or similar words suggesting future outcomes or statements regarding an outlook. Forward-looking statements in this document include, but are not limited to, statements with respect to: ability to meet 2011 strategy to balance near term market uncertainty with capital investment for long-term growth; projections contained in the 2011 Corporate Guidance (including estimates of cash flow per share, upstream operating cash flow, natural gas and NGLs production, growth per share, capital investment, net divestitures, and operating costs); potential completion of a joint venture transaction with PetroChina and with other third parties; projections relating to the adequacy of the Company’s provision for taxes; projections with respect to natural gas production from resource plays; the flexibility of capital spending plans and the source of funding therefore; the effect of the Company’s risk management program, including the impact of derivative financial instruments; the impact of the changes and proposed changes in laws and regulations, including greenhouse gas, carbon and climate change initiatives on the Company’s operations and operating costs; projections that the Company’s Bankers’ Acceptances and Commercial Paper Program will continue to be fully supported by committed credit facilities and term loan facilities; the Company’s continued compliance with financial covenants under its credit facilities; the Company’s ability to pay its creditors, suppliers, commitments and fund its 2011 capital program and pay dividends to shareholders; the effect of the Company’s risk mitigation policies, systems, processes and insurance program; the Company’s expectations for future Debt to Capitalization and Debt to Adjusted EBITDA ratios; the expected impact and timing of various accounting pronouncements, rule changes and standards, including IFRS, on the Company and its Consolidated Financial Statements; and projections that natural gas represents an abundant, secure, long-term supply of energy to meet North American needs. Readers are cautioned not to place undue reliance on forward-looking statements, as there can be no assurance that the plans, intentions or expectations upon which they are based will occur. By their nature, forward-looking statements involve numerous assumptions, known and unknown risks and uncertainties, both general and specific, that contribute to the possibility that the predictions, forecasts, projections and other forward-looking statements will not occur, which may cause the Company’s actual performance and financial results in future periods to differ materially from any estimates or projections of future performance or results expressed or implied by such forward-looking statements. These assumptions, risks and uncertainties

Encana Corporation Management’s Discussion and Analysis (prepared in US$) 27
include, among other things: volatility of and assumptions regarding commodity prices; assumptions based upon Encana’s current guidance; the risk that the Company may not conclude potential joint venture arrangements with PetroChina or others as a result of various conditions not being met and raise third party capital investments; fluctuations in currency and interest rates; product supply and demand; market competition; risks inherent in the Company’s and its subsidiaries’ marketing operations, including credit risks; imprecision of reserves and resources estimates and estimates of recoverable quantities of natural gas and liquids from resource plays and other sources not currently classified as proved, probable or possible reserves or economic contingent resources; the Company’s and its subsidiaries’ ability to replace and expand natural gas reserves; marketing margins; potential disruption or unexpected technical difficulties in developing new facilities; unexpected cost increases or technical difficulties in constructing or modifying processing facilities; risks associated with technology; the Company’s ability to generate sufficient cash flow from operations to meet its current and future obligations; the Company’s ability to access external sources of debt and equity capital; the timing and the costs of well and pipeline construction; the Company’s and its subsidiaries’ ability to secure adequate product transportation; changes in royalty, tax, environmental, greenhouse gas, carbon, accounting and other laws or regulations or the interpretations of such laws or regulations; political and economic conditions in the countries in which the Company and its subsidiaries operate; terrorist threats; risks associated with existing and potential future lawsuits and regulatory actions made against the Company and its subsidiaries; and other risks and uncertainties described from time to time in the reports and filings made with securities regulatory authorities by Encana. Although Encana believes that the expectations represented by such forward-looking statements are reasonable, there can be no assurance that such expectations will prove to be correct. Readers are cautioned that the foregoing list of important factors is not exhaustive. Forward-looking statements with respect to anticipated production, reserves and production growth, including over five years or longer, are based upon numerous facts and assumptions including a projected capital program averaging approximately $6 billion per year, that underlies the long range plan of Encana which is subject to review annually and to such revision for factors including the outlook for natural gas commodity prices and the expectations for capital investment by the Company, achieving an average drilling rate of approximately 2,500 net wells per year, Encana’s current net drilling location inventory, natural gas price expectations over the next few years, production expectations made in light of advancements in horizontal drilling, multi-stage fracture stimulation and multi-well pad drilling, the current and expected productive characteristics of various existing resource plays, Encana’s estimates of reserves and economic contingent resources, expectations for rates of return which may be available at various prices for natural gas and current and expected cost trends. Furthermore, the forward-looking statements contained in this document are made as of the date of this document, and except as required by law, Encana does not undertake any obligation to update publicly or to revise any of the included forward-looking statements, whether as a result of new information, future events or otherwise. The forward-looking statements contained in this document are expressly qualified by this cautionary statement. Forward-looking information respecting anticipated 2011 Cash Flow, operating cash flow and pre-tax cash flow for Encana is based upon achieving average production of oil and gas for 2011 of between 3.475 to 3.525 billion cubic feet equivalent (“Bcfe”) per day (“Bcfe/d”), commodity prices for natural gas of NYMEX $4.50/Mcf to $5.00/Mcf, crude oil (WTI) $85.00/bbl to $95.00/bbl, U.S./Canadian dollar foreign exchange rate of $0.95 to $1.05 and a weighted average number of outstanding shares for Encana of approximately 736 million. Assumptions relating to forward-looking statements generally include Encana’s current expectations and projections made by the Company in light of, and generally consistent with, its historical experience and its perception of historical trends, as well as expectations regarding rates of advancement and innovation, generally consistent with and informed by its past experience, all of which are subject to the risk factors identified elsewhere in this document. Encana is required to disclose events and circumstances that occurred during the period to which this MD&A relates that are reasonably likely to cause actual results to differ materially from material forward-looking statements for a period that is not yet complete that Encana has previously disclosed to the public and the expected differences thereto. Such disclosure can be found in Encana’s news release dated April 20, 2011, which is available on Encana’s website at www.encana.com and on SEDAR at www.sedar.com.

Encana Corporation Management’s Discussion and Analysis (prepared in US$) 28
Oil and Gas Information NI 51-101 of the CSA imposes oil and gas disclosure standards for Canadian public companies engaged in oil and gas activities. In previous years, Encana relied upon an exemption from Canadian securities regulatory authorities to permit it to provide disclosure relating to reserves and other oil and gas information in accordance with U.S. disclosure requirements. As a result of the expiry of that exemption, Encana is providing disclosure which complies with the annual disclosure requirements of NI 51-101 in its 2010 Annual Information Form (“AIF”). The Canadian protocol disclosure is contained in Appendix A and under “Narrative Description of the Business” in the 2010 AIF. Encana has obtained an exemption dated January 4, 2011 from certain requirements of NI 51-101 to permit it to provide certain disclosure prepared in accordance with U.S. disclosure requirements, in addition to the Canadian protocol disclosure. That disclosure is primarily set forth in Appendix D of the 2010 AIF. A description of the primary differences between the disclosure requirements under the Canadian standards and the disclosure requirements under the U.S. standards is set forth under the heading “Reserve Quantities and Other Oil and Gas Information” in the 2010 AIF. Natural Gas, Crude Oil and NGLs Conversions
In this document, certain crude oil and NGLs volumes have been converted to cubic feet equivalent (cfe) on the basis of one barrel (bbl) to six thousand cubic feet (Mcf). Cfe may be misleading, particularly if used in isolation. A conversion ratio of one bbl to six Mcf is based on an energy equivalency conversion method primarily applicable at the burner tip and does not represent value equivalency at the wellhead. Resource Play
Resource play is a term used by Encana to describe an accumulation of hydrocarbons known to exist over a large areal expanse and/or thick vertical section, which when compared to a conventional play typically has a lower geological and/or commercial development risk and lower average decline rate.
Currency and References to Encana All information included in this document and the Interim Consolidated Financial Statements and comparative information is shown on a U.S. dollar, after royalties basis unless otherwise noted. Encana’s functional currency is Canadian dollars, however, the Company has adopted the U.S. dollar as its presentation currency to facilitate a more direct comparison to other North American oil and gas companies. For convenience, references in this document to “Encana”, the “Company”, “we”, “us”, “our” and “its” may, where applicable, refer only to or include any relevant direct and indirect subsidiary corporations and partnerships (“Subsidiaries”) of Encana Corporation, and the assets, activities and initiatives of such Subsidiaries.
Additional Information Further information regarding Encana Corporation, including its Annual Information Form, can be accessed under the Company’s public filings found at www.sedar.com and on the Company’s website at www.encana.com.