end-of-pipe denitrification using ras effluent waste ...orbit.dtu.dk/files/51231569/suhr.pdf ·...
TRANSCRIPT
General rights Copyright and moral rights for the publications made accessible in the public portal are retained by the authors and/or other copyright owners and it is a condition of accessing publications that users recognise and abide by the legal requirements associated with these rights.
• Users may download and print one copy of any publication from the public portal for the purpose of private study or research. • You may not further distribute the material or use it for any profit-making activity or commercial gain • You may freely distribute the URL identifying the publication in the public portal
If you believe that this document breaches copyright please contact us providing details, and we will remove access to the work immediately and investigate your claim.
Downloaded from orbit.dtu.dk on: May 30, 2018
End-of-pipe denitrification using RAS effluent waste streams: Effect of C/N-ratio andhydraulic retention time
Suhr, Karin Isabel; Pedersen, Per Bovbjerg; Arvin, Erik
Published in:Aquacultural Engineering
Link to article, DOI:10.1016/j.aquaeng.2012.11.005
Publication date:2013
Link back to DTU Orbit
Citation (APA):Suhr, K. I., Pedersen, P. B., & Arvin, E. (2013). End-of-pipe denitrification using RAS effluent waste streams:Effect of C/N-ratio and hydraulic retention time. Aquacultural Engineering, 53(SI), 57-64. DOI:10.1016/j.aquaeng.2012.11.005

Accepted Manuscript
Title: End-of-pipe denitrification using RAS effluent wastestreams: Effect of C/N-ratio and hydraulic retention time
Authors: Karin I. Suhr, Per Bovbjerg Pedersena, Erik Arvin
PII: S0144-8609(12)00089-1DOI: doi:10.1016/j.aquaeng.2012.11.005Reference: AQUE 1665
To appear in: Aquacultural Engineering
Received date: 8-11-2012Accepted date: 19-11-2012
Please cite this article as: Suhr, K.I., Pedersena, P.B., Arvin, E., End-of-pipedenitrification using RAS effluent waste streams: Effect of C/N-ratio and hydraulicretention time, Aquacultural Engineering (2010), doi:10.1016/j.aquaeng.2012.11.005
This is a PDF file of an unedited manuscript that has been accepted for publication.As a service to our customers we are providing this early version of the manuscript.The manuscript will undergo copyediting, typesetting, and review of the resulting proofbefore it is published in its final form. Please note that during the production processerrors may be discovered which could affect the content, and all legal disclaimers thatapply to the journal pertain.

Page 1 of 26
Accep
ted
Man
uscr
ipt
1
End-of-pipe denitrification using RAS effluent waste streams: Effect of C/N-ratio and hydraulicretention time
Author: Karin I. Suhr (corresponding);Affiliation: Technical University of Denmark, DTU Aqua, Section for Aquaculture, The North sea Research Centre, P.O. Box 101, DK-9850 Hirtshals, Denmark, [email protected]
Per Bovbjerg Pedersen; Affiliation: Technical University of Denmark, DTU Aqua, Section for Aquaculture, The North sea Research Centre, P.O. Box 101, DK-9850 Hirtshals, Denmark, [email protected]
Erik Arvin Affiliation: Technical University of Denmark, DTU Environment, Department of Environmental Engineering, Miljoevej 113, DK-2800 Lyngby, Denmark, [email protected]
Highlights
End-of-pipe single-sludge denitrification rate: 125 ± 15.7 g NO3-N m-3reactor d-1
Laboratory sludge hydrolysis: 17-24 % higher VFA compared to sludge basin yield
Effect of C/N-ratio on N-removal rate depended on the hydraulic retention time
A model developed in AQUASIM simulated the on-farm denitrification reactors well
Besides denitrification; indications of anammox and DNRA was observed.
Abstract
Environmentally sustainable aquaculture development requires increased nitrogen removal
from recirculating aquaculture systems (RAS). In this study, removed solids from a large
commercial outdoor recirculated trout farm (1000 MT year-1) were explored as an
endogenous carbon source for denitrification. This was done by; (1) a controlled laboratory
experiment on anaerobic hydrolysis of the organic matter (from sludge cones, drumfilter, and
biofilter back-wash), and (2) an on-site denitrification factorial experiment varying the
soluble COD (CODS) / NO3-N ratio from 4 – 12 at hydraulic retention times (HRT) from 50
– 170 min in simple 5.5 m3 denitrification reactors installed at the trout farm.
The lab-experiments showed that the major part of the readily biodegradable organic matter
was hydrolyzed within 14 days, and the hydrolysis rate was fastest the first 24 hours. Organic
matter from the sludge cones generated 0.21 ± 0.01 g volatile fatty acids (VFA) g-1 total
volatile solids (TVS), and the VFAs constituted 75% of CODS. Analogously, 1 g TVS from
the drum filter generated 0.15 ± 0.01 g VFA, constituting 68% of the CODS. Comparison of
the laboratory hydrolysis experiments and results from the on-farm study revealed as a rough

Page 2 of 26
Accep
ted
Man
uscr
ipt
2
estimate that potentially 17 - 24% of the generated VFA was lost due to the current sludge
management.
Inlet water to the denitrification reactors ranged in NO3-N concentration from 8.3 to 11.7 g
m-3 and CODS from 52.9 to 113.4 g m-3 (10.0 ± 1.2 �C). The highest NO3-N removal rate
obtained was at the intermediate treatments; 91.5 – 124.8 g N m-3reactor d
-1. The effect of the
C/N ratio depended on the HRT. At low HRT, the variation in C/N ratio had no significant
effect on NO3-N removal rate, contrary to the effect at the high HRT. The stoichiometric ratio
of CODS/NO3-N was 6.0 ± 2.4, ranging from 4.4 (at the high HRT) to 9.3 (at the low HRT).
A simple model of the denitrification reactor developed in AQUASIM showed congruence
between modeled and measured data with minor exceptions. Furthermore, this study pointed
to the versatility of the NO3-N removal pathways expressed by the bacterial population in
response to changes in the environmental conditions; from autotrophic anammox activity
presumably present at low C/N to dissimilatory nitrate reduction to ammonia (DNRA) at high
C/N, besides the predominate “normal” heterotrophic dissimilatory nitrate reduction
(denitrification).
Keywords: RAS, denitrification, sludge hydrolysis, volatile fatty acids
1. Introduction
The future increase in aquaculture production in Europe relies on the ability of making it
environmentally sustainable in a cost-effective way, a development endorsed by the
implementation of the EU Water Framework Directive (Directive 2000/60/EC). In Denmark,
this has led to an increasing number of traditional freshwater flow-through trout farms being
retrofitted to semi-closed outdoor recirculating aquaculture systems (RAS) called
“ModelTroutFarms” (MTF) (Pedersen et al., 2008). The application of RAS in such large
commercial trout production systems has demonstrated the potential for combining
economically viable production and reduced environmental impact. In the future, aquaculture
production in Denmark will be regulated by a licensed maximum allowed nutrient (nitrogen
(N), phosphorous (P), organic matter (O)) waste output to the recipient waters. This will give
the fish farmer increased incentives to improve farm operation and waste management,
enabling increased production without increased environmental impact.
The MTF concept is based on water intake from bore holes and is operated at app. 96% water
recirculation. Water treatment consists of particulate matter removal in sludge cones and

Page 3 of 26
Accep
ted
Man
uscr
ipt
3
drum filters, organic matter removal and nitrification in biofilters, and effluent polishing in
constructed wetlands before discharge into the watercourse. Sludge (from sludge cones, drum
filter, biofilter back-wash) is stored in sludge basins. From the basins, an overflow of settled
water is led into the constructed wetlands. Settled sludge is exported from the MTF for
agricultural fertilizing purposes or costly disposal. A two-year measuring campaign on eight
MTFs identified N as the nutrient being least retained within the system; 50% of N was
removed; 76% of P; 93 % of biological oxygen demand (BOD5) and 87% of chemical oxygen
demand (COD) (Svendsen et al., 2008). Thus, an urge to improve N removal in MTF exists,
and consequently formed the main objective of this study.
Dissolved nitrogen is loaded to the water phase in the RAS in the form of total ammonia
nitrogen (TAN), representing some 70% of the total dissolved and suspended N-compounds
excreted from the protein catabolism in the fish (Dalsgaard and Pedersen, 2011; Kajimura et
al., 2004). The mechanisms removing dissolved N from the aqueous environment are either
assimilation in bacterial or plant biomass or denitrification. Quantitatively, denitrification is
by far the most important removal process in MTF systems. Denitrification is an anoxic
microbial process where nitrate in the absence of oxygen is used as electron acceptor for
respiration of organic matter (Brock and Madigan, 1991). In the MTF system, the
denitrification process is mainly taking place in the constructed wetlands (Svendsen et al.,
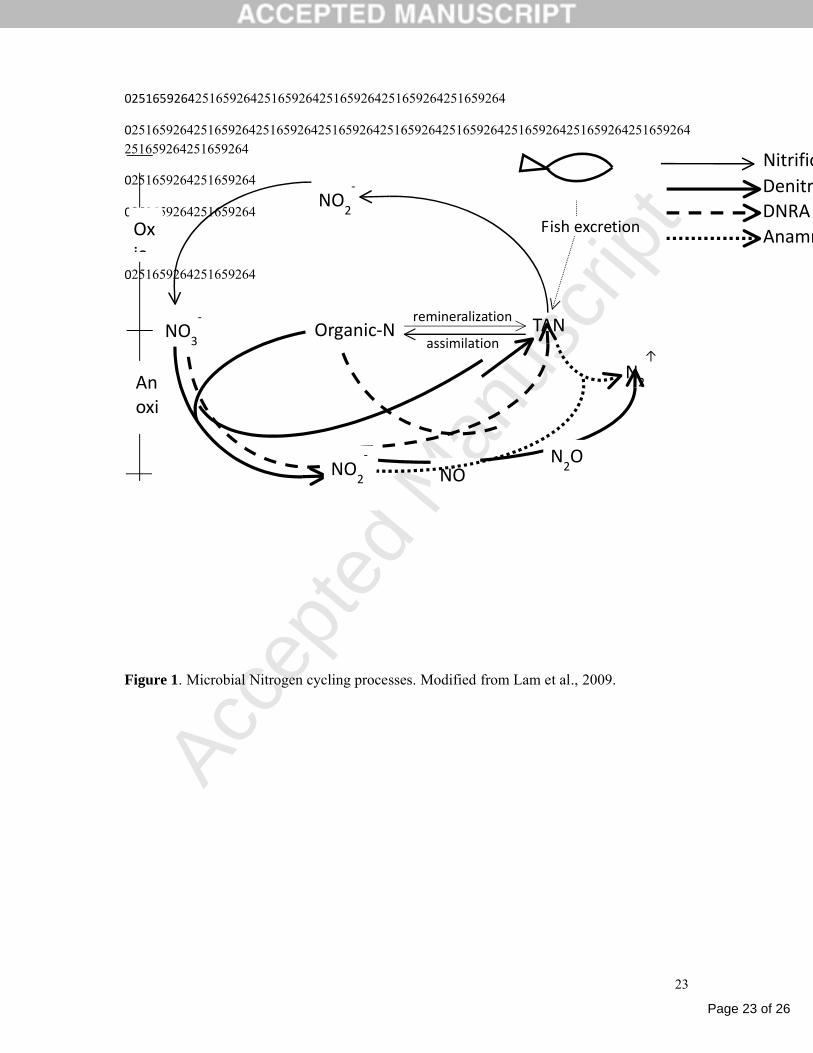
2008). An overview of the microbial nitrogen cycling processes is schematically represented
in Fig. 1. NO3-N is formed by the aerobic nitrification process (TAN oxidation + nitrite
oxidation). The reduction of NO3-N to gaseous N2 (denitrification) is a sequence of
intermediate steps with NO2-N being the first intermediate compound in the sequence (Fig.
1). Additionally, dependent on the environmental conditions, two other ways of NO3-N/ NO2-
N reduction exits: (1) Dissimilatory nitrate reduction to ammonium (DNRA) in excessive
reductive environments (high C/N-ratio) (Washbourne et al., 2011), and (2) Anaerobic
ammonium oxidation (anammox), an autotrophic process (low C/N-ratio) where ammonium
serves as the electron donor for reduction of NO2-N to N2 (Jetten et al., 1998).
Bacteria gain less energy by denitrification than by aerobic respiration (van de Leemput et al.,
2011), which makes oxygen an important inhibitory regulator of the denitrification process.
The relative enzyme activity for the different steps in the denitrification sequence can differ
among different bacteria (Tiedje, 1988) and environmental factors (e.g. oxygen level, pH,
temperature, energy source/ organic compound availability and nature) will affect
denitrification rates (Henze et al., 2002) as well as the regulation of the different enzymatic
Page 4 of 26
Accep
ted
Man
uscr
ipt
4
steps (Bauman et al., 1996). Complete denitrification without accumulation of toxic
intermediates can thus be a challenging operation, if conditions are not properly controlled
(van Rijn and Rivera 1990, Lee et al., 2000). The composition of the organic matter affects
the denitrification rate as a result of how easily it is metabolized. Small C-compounds (<1000
Da) such as volatile fatty acids (VFA) are readily transportable across the bacterial
membrane, whereas larger molecules need to be hydrolyzed by exogenous enzymes before
subsequent membrane transport (Ahring, 2003).
Nitrogen removal in specific denitrification reactors has not been extensively used in
commercial cold water RAS due to the relatively harmless effect of NO3-N towards fish and
a lack of economic incentive to reduce discharge values. In warm water RAS, nevertheless,
the advantages of including a denitrification unit, in terms of reduced fresh water intake (/
reduced heating costs) and gain of alkalinity (Otte and Rosenthal, 1979) has been
commercialized. Such systems typically rely on an exogenous small molecular weight C-
source (e.g. methanol) for the denitrification process, making the process fast and relatively
easy to control, because hydrolysis time for transforming a more complex C-source into
available small C-compounds can be disregarded. However, a potential cost-efficient and
sustainable approach would be to use the endogenous organic matter produced at the RAS as
C-source for denitrification (single-sludge denitrification), taking advantage of the
concomitant COD reduction (Aboutboul et al., 1995, van Rijn, 1996, Martins et al., 2010).
The ratio between available organic matter and nitrate-N (COD/NO3-N ratio) for
denitrification is generally 3 – 6 (van Rijn et al., 2006).
Most of the MTF/ RAS facilities should be able to produce this C/N ratio given appropriate
solid organic matter removal technologies. The measured waste output from MTFs
demonstrated COD/NO2+3-N = 6.7-5.2 during a two year monitoring project (Svendsen et al.,
2008). Klas et al. (2006a) developed a model for single-sludge denitrification in RAS, and
demonstrated the feasibility of the model in a lab-scale activated sludge experiment (Klas et
al., 2006b).
In this first study reporting on pilot scale single-sludge denitrification applied in commercial
MTF systems, we focused on exploiting the existing effluent streams for a controlled and
enhanced end-of-pipe denitrification process unit before the constructed wetlands. The easily
degradable organic compounds generated by hydrolysis of the organic matter in the sludge
thickening basins were used to fuel the denitrification of water discharged from the fish
rearing units. The experiment was conducted in 5.5 m3 tanks. We investigated the effects of

Page 5 of 26
Accep
ted
Man
uscr
ipt
5
varying the CODS/NO3-N ratio from 4 to 12 at hydraulic retention times (HRT) ranging from
50 to 170 min in a full factorial design in order to find optimal combinations for process
operation. We consider the two factors are important parameters for future dimensioning and
operation of specific single-sludge denitrification reactors. Degradation properties of the
organic matter were characterized in a separate laboratory hydrolysis experiment.
2. Materials and Methods
2.1. Experimental set-up at the fish farm
Two identical 5.5 m3 cylindrical PE-tanks (height 3 m, diameter 1.7 m) with conical (60○
slope) bottom were operated as up-flow single-sludge denitrification reactors in a duplicate
set-up. Nitrate-rich outlet water (12.7-17.6 g NO3--N m-3) from a commercial (1,000 MT/y),
outdoor trout RAS (described in Suhr and Pedersen (2010)) was supplied to the experimental
reactors by way of a side-stream passage. An overflow stream from the sludge basin at the
RAS was used as organic carbon source for the denitrification process. The two inlet streams
were mixed just prior to the inlet at the bottom of the up-flow reactors.
Flows were continuously monitored by electronic flowmeters (IFC010, KROHNE, Duisburg,
Germany) to support calculation of the ratio of NO3--N-containing RAS effluent and C-
containing water from the sludge basin.
The denitrification reactors had been operating for more than three months prior to the
experiment.
2.2. Sludge hydrolysis
The sludge basin was fed by three organic matter waste streams from the RAS facility; (1)
flush water containing settled faecal matter and uneaten feed pellets from sedimentation
traps/sludge cones, (2) flush water with drum filter retained particulate matter, and (3)
biofilter back-wash water (Table 1). The sludge cones were emptied every 48 hrs. Two of the
12 biofilter sections were backwashed daily, which in effect gave a weekly backwash
frequency and a daily backwash discharge to the sludge bed. The drum filter was in
continuous operation. Degradation properties of the organic matter from these different
streams were characterized by a separate 16 day anaerobic hydrolysis experiment.
Page 6 of 26
Accep
ted
Man
uscr
ipt
6
Samples were collected at the RAS as a single sampling event, extracted approximately
halfway through the flushing event, e.g. if the flushing took approximately 12 min, the
sampling began after 5 min. The drum filter waste sample, however, was taken from a
temporary sludge-thickening device receiving the effluent waste stream. From each discharge
stream a 20 l sample was collected, cooled on ice, and transported directly to the laboratory.
Each sample was distributed in triplicate 2 l glass bottles sealed with rubber stoppers, and
incubated at room temperature (20 ± 2⁰C) with equal, continuous complete stirring by use of
magnetic stirrers. Supernatant water was discharged prior to incubation if a well-defined
phase- separation had occurred in the raw samples, and the up-concentration factor measured
as; volatile suspended solids (VSS) content in sample/VSS content in raw sample, was noted.
VSS was measured according to Danish Standard (DS 207). Produced gas was vented out
through a one-way valve inserted in a tube through the rubber stopper. A second tube in the
stopper was extended into the water phase, from which samples of 50 ml were withdrawn.
Inert nitrogen gas was used to purge the sludge solution backwards in the sampling tube
when sampling sessions were ended.
Samples were taken at day 0, 1, 2, 4, 6, 8, 10, 14, and 16. Analysis of the samples comprised
measurement of pH, total chemical oxygen demand (CODT) (Hach Lange test kit no. LCK
514), soluble COD (CODS) (Hach Lange, LCK 414), TAN (Hach Lange, LCK 305), and
volatile fatty acids (VFA, Hach Lange, LCK 365). Total volatile solids (TVS) were measured
on raw samples, and in the hydrolysis experiment on concentrated samples at day 0 and 16,
by oven drying according to Danish Standard (DS 204). The samples for chemical analysis
were centrifuged (4500 x g, 10 min, 5 ⁰C) prior to filtration (0.45 μm) with exception of total
COD samples. The Hach Lange test kit (LCK 365) method used for measuring the VFA
content quantifies all the acids as acetate. A factor of 1.07 was used to convert acetate into
acetate-COD units based on the stoichiometry of acetate oxidation (g O2 g-1 acetate);
CH3COOH + 2 O2 → 2 CO2 + 2 H2O
2.3. On-farm denitrification experiments: Design, sampling, and chemical analysis
The experimental design and subsequent response surface analysis was made with
Unscrambler ® 9.1 (Camo Software, Norway).
The C/N ratio (CODS / NO3--N) of the inlet water to the experimental denitrification reactors
was varied from 4 to 12 and the hydraulic retention time (HRT) from 50 to 150 min

Page 7 of 26
Accep
ted
Man
uscr
ipt
7
according to a full factorial design with two replicate runs of the intermediate treatment
(Table 2). The experimental order was randomised and the intermediate runs were conducted
with a 7 day interval. For data processing, the independent variables (C/N-ratio and HRT)
were the measured data (and not the designed values) as these were not identical in all
settings due to practical restrictions (Table 2). Furthermore, data from 5 additional runs in the
same setup (C/N 5.6 – HRT 96; C/N 7.5 – HRT 159; C/N 11 – HRT 197; C/N 15.8 – HRT
109, C/N 16 – HRT 188), representing a 14 week period in all, were included in the dataset
for response surface modelling to strengthen the model.
Student’s t-tests (2-tailed, unpaired, equal variances) were performed in Excel 2010
(Microsoft Office).
Water temperature was 10.0 ± 1.2 �C (n=14) during the experiments.
Acclimatization time before sampling was minimum 3 times the HRT of the treatment.
Replicate samples from reactor inlet and outlet were taken at 10 min interval from both
reactors. The samples were immediately filtered (0.45 µm) and analyzed for TAN by the
indophenolblue method with salicylate (Danish Standard DS 224), NO2-N by the
diazotization with sulfanilamide and coupling to N-(1-naphyl)-ethylendiamine method (DS
223), and NO3-N by reaction with 2, 6-dimethylphenol (ISO 7890/1). Chemical oxygen
demand (CODS) was determined by Merck test kit (Merck KGaA, Darmstadt, Germany),
which was modified from ISO 15705. Alkalinity was measured by titration to pH 4.5 by 0.1
M hydrochloric acid. Temperature, oxygen content and pH were monitored with Hach
HQ40d instruments (Hach Lange GmbH, Düsseldorf, Germany).
Content of VFA (Hach Lange test kit LCK 365) in the overflow stream from the sludge basin
was also monitored at each experimental run.
2.4. Modeling of the denitrification reactors
The computer program AQUASIM 2.1 (Reichert, 1994) for identification and simulation of
aquatic systems was used for modeling the single-sludge denitrification reactor. The
expression used for describing the denitrification rate was according to Henze et al. (2002):
r = μm * ((CNO3 / (CNO3 + KsNO3) * (CODbio/ (CODbio + KsCOD)) * X
where; r: Denitrification rate (g N m-3 d-1); μm: Maximum specific growth rate of heterotrophs
(d-1); CNO3: Nitrate-N concentration (g m-3); KsNO3: Half-saturation constant for NO3-N (g N
m-3); CODbio: Biodegradable COD (g m-3); KsCOD: Half-saturation constant for CODbio (g
COD m-3); X: Biomass concentration (g COD m-3).

Page 8 of 26
Accep
ted
Man
uscr
ipt
8
The stoichiometric coefficients of the variables were:
CNO3: - (1-Y)/(2.86 * Y)
CODbio: - 1/Y
X: 1(biomass concentration in the tank equals to the biomass concentration in the inlet,
because the HRTs employed were relatively short (0.8 - 3.0 h) compared to microbial
doubling times (min. 3.7 h)).
The yield constant, Y, was set to 0.5 g COD g-1COD, KsCOD to 10 g COD m-3, KsNO3 to 0.35
g NO3-N m-3, and μm to 4.5 d-1. All values derived from Henze et al. (2002).
The biodegradable COD (CODbio) was approximated by the soluble COD, CODS.
The biomass (X) was approximated by 0.5 * the particulate COD fraction, and total COD
(CODT) was set to 3 * soluble COD (CODS), thus; X = (3 * CODS - CODS) * 0.5.
The 5.5 m3 tank was modeled as a completely mixed flow reactor (CMFR) because data for
hydraulic flow characterization were not available. The inlet flows and inlet substrate
concentrations were inserted in the model according to Table 2.
3. Results
3.1. Sludge hydrolysis experiment
Anaerobic hydrolysis of two different organic waste streams - sludge cones and drum filter -
from the RAS farm showed similar degradation patterns independent of origin (Fig. 2 and 3).
The quantity of organic matter sampled from the biofilter back-wash water was too low to
generate a reproducible result of the hydrolysis from this source (Table 1).
Organic matter from the sludge cones generated 0.21 ± 0.01 g VFA g-1 TVS, and the VFAs
constituted 75% of CODS. Drum filter retained organic matter generated 0.15 ± 0.01 g VFA
g-1 TVS and VFA constituted 68% of the CODS (Table 1).
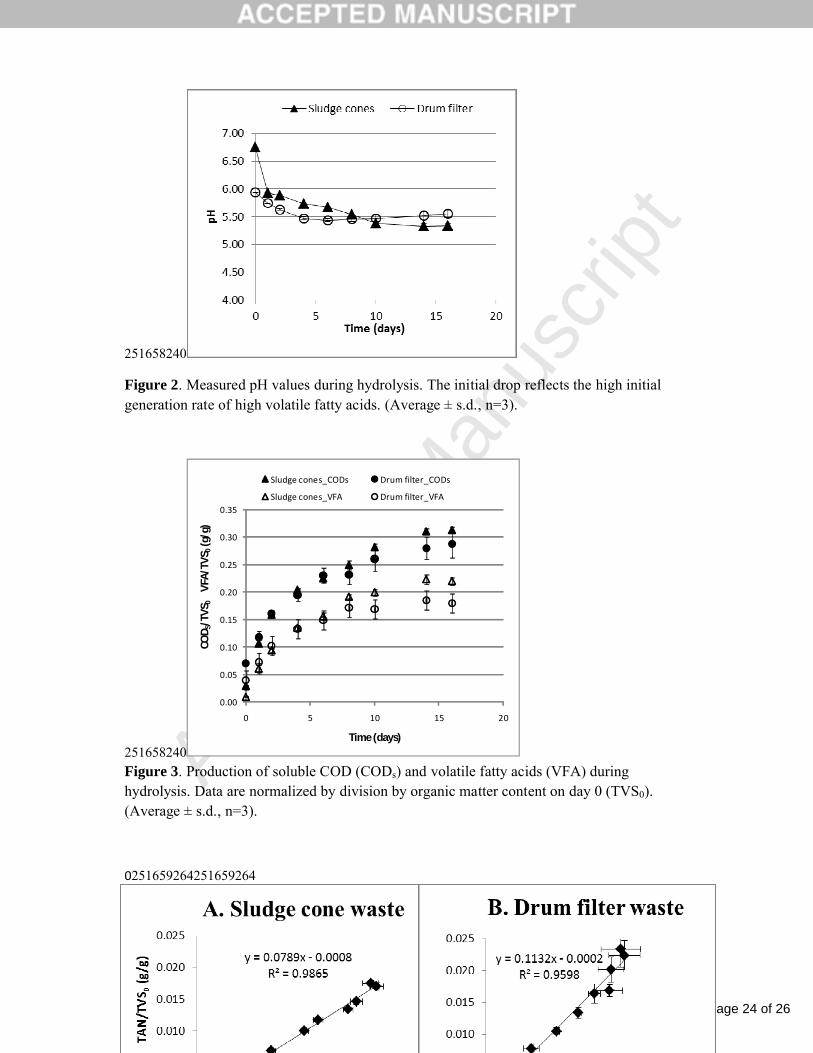
The highest VFA generation rate was recorded at the start of the experiment (Fig. 3). This
was correlated to the pH readings that showed the sharpest drop during the first 24 h (Fig. 2).
No increase in VFA was recorded from day 14 to 16 (Fig. 3).
An increase in TAN during hydrolysis was measured, and the production was closely
correlated to VFA generation (Fig. 4). The data showed a production of 0.08 and 0.11 g TAN
g-1 VFA-COD from the sludge cone (R2=0.99) and the drum filter (R2=0.96) sludge,
respectively.

Page 9 of 26
Accep
ted
Man
uscr
ipt
9
During the hydrolysis period (day 0-16), the proportion of CODS to CODT increased from
1.5% ± 0.1 to 15.1% ± 0.4 and from 3.7% ± 0.1 to 15.1% ± 1.1 for sludge cones and drum
filter sludge, respectively.
3.2.1. Performance of the single-sludge denitrification reactors: NO3-N removal
The highest N removal rate was obtained at the intermediate treatments and reached 91.5 –
124.8 g NO3-N m-3reactor d
-1 (Table 3). High nitrate removal (95.4 g NO3-N m-3reactor d
-1) was
also monitored at the high C/N - high HRT treatment, comparable to the removal range at the
intermediate runs. However, the high C/N - high HRT treatment generated a significant
amount of TAN (Table 3), a unique feature of this treatment. The experiment showed that the
effect of the C/N ratio depended on the HRT. At low HRT, the variation in C/N ratio had no
significant effect on NO3-N removal rate (Table 3), contrary to the effect at the high HRT (by
t-tests).
The average NO3-N concentration varied from 8.3 to 11.7 g m-3 in the inlet water and the
average CODs varied from 52.9 to 113.4 g m-3 in the experimental runs (Table 2). Predicted
outlet values from the model simulations of the single-sludge denitrification were in the same
order as the experimental data, despite of the very simple model and rough assumption of
flow characteristics (completely mixed) and of the values applied for the constants. Only few
treatments were poorly simulated (6.04 g NO3-N m-3 measured in the outlet versus 3.3 g m-3
modeled in the High C/N - Low HRT treatment, and 31.2 g CODs m-3 measured in the outlet
versus 12.5 g m-3 modeled in the Low C/N – High HRT treatment (Table 2)). The cause of
these major deviations will be further treated below (3.2.2. TAN, NO2-N, and alkalinity
changes and in 4. Discussion).
Performing a multivariate response surface analysis of the data rendered a maximal nitrate
removal of 98.6 g NO3-N m-3reactor d
-1 at C/N= 9.4 and HRT= 111 min (R2= 0.84, and a
multiple correlation coefficient 0.92) (Fig. 5). Thus, the multivariate data analysis indicated
that the optimal setting at the running conditions was close to the intermediate levels. Besides
the main effects (C/N and HRT) the interaction and squared terms were included in the
model. Only the squared terms were significant, indicating a non-linear effect of C/N and
HRT, in accordance with figure 5.

Page 10 of 26
Accep
ted
Man
uscr
ipt
10
Overall, the stoichiometric ratio of CODS/NO3-N measured experimentally was 6.0 ± 2.4
(average ± s.d., n=12), ranging from 4.4 ± 0.8 to 9.3 ± 2.0 at the high and low HRT,
respectively. Inlet pH during the experiment was 7.00 ± 0.08 (average ± s.d., n=12), ranging
from 6.92 ± 0.01 to 7.07 ± 0.03 at high C/N and low C/N, respectively.
The VFA-COD concentration in the overflow stream of the sludge basin feeding the
denitrification reactors during the experiment was on average 94 ± 18 mg l-1 (n=6) making up
51 ± 6% of the sCOD content.
3.2.2. Performance of the single-sludge denitrification reactors: TAN, NO2-N, and alkalinity
changes
The reactors removed TAN as expected with (low) O2 content in the inlet waters at all
settings (Table 3), except at high C/N – high HRT where TAN was produced. This unique net
production of TAN was correlated with a considerable higher alkalinity production than
expected if only dissimilatory nitrate reduction to N2 was considered (Table 3). At low C/N –
high HRT conditions, on the other hand, increased TAN removal was observed, and an
alkalinity consumption was measured, which was contrary to the theoretically calculated
alkalinity production based upon mere nitrate reduction to N2 (Table 3).
NO2-N values showed the relatively greatest variability between the two replicate reactors
(Table 3) in accordance with the intermediate nature of this N-compound. The highest NO2-N
production levels (Table 3) coincided with the two treatments with poor concordance
between modeled and measured output values (Table 2).
4. Discussion
4.1. Sludge hydrolysis experiment
When comparing the two sludge types, the drum filter waste had a lower pH-value (Fig. 2)
and a higher VFA content (Fig. 3) at start (day 0), than the sludge cone waste. This could be
due to either (1) generally older or readily degradable material with hydrolysis and
fermentation processes already in progress, or (2) smaller particles rendering higher
hydrolysis rate affecting the material even before start up in the laboratory (despite the cooled
state during transport), or a combination of both. From hydrolysis day 8 and onwards, a

Page 11 of 26
Accep
ted
Man
uscr
ipt
11
tendency to relative stagnation in VFA and CODS generation from drum filter waste
compared to sludge cone waste was observed (Fig. 3). The marginal difference observed in
TAN generating rate between the two waste sources (Fig. 4) might indicate that drum filter
particles contained more protein than particles from sludge cones. This effect, however,
might also relate to relatively older material, since protein degradation has been found to be
more dependent on sludge retention time than carbohydrate and lipid degradation
(Elefsiniotis and Oldham, 1994). The sludge cone waste exhibited faster settling properties
than the drum filter waste, probably due to more dense and larger sized particles compared to
the drum filter waste. Anyway, the stirring during the experiment probably disintegrated the
particles into more homogenous sizes, and the initial physical difference between the samples
did not seem to affect the measured sample characteristics (pH, VFA, CODS, and TAN) to a
greater extent than the points mentioned above. The pH dropped below 6 on the first day of
hydrolysis (Fig. 2). At this pH, loss of VFA to methane production is most likely negligible
since methanogenic bacteria are considered to be inhibited at pH below 6-5.5 (Henze et al.,
2002).
The organic matter was sampled from the RAS farm according to the routines for waste
discharge and as a single sampling event (section 2.2. Sludge hydrolysis). More extensive
experiments will have to be conducted to fully elucidate differences in sludge types and time
effects on degradation.
On-farm analysis of the overflow stream from the sludge basin to the denitrification reactors
during the experiment showed that VFAs constituted 51 ± 6 % of the CODS. In the
laboratory, the VFAs made up 68 and 75 % of the CODS from drum filter and sludge cone
waste, respectively (Table 1). This indicates that a considerable amount (about 17 - 24 %) of
potential VFAs were unexploited or simply lost by aerobic heterotrophic growth,
dissimilatory nitrate reduction to ammonia (or N2), and/or methanogenic activity, because the
current sludge storage basin management was not optimized for generating VFAs for
denitrification.
The greatest VSS reduction measured after 16 days of hydrolysis was 32% (in sludge cones),
and consequently more than 2/3 of the organic matter was very slowly biodegradable. Klas et
al. (2006a) reported a biodegradability in all likelihood above 80% for marine aquaculture
sludge (in a 15 days period), and up to 99.6% COD removal has been found in RAS sludge

Page 12 of 26
Accep
ted
Man
uscr
ipt
12
digestion (HRT 6-8 days at 30⁰ C) for methane production (Mirzoyan et al., 2010). This
suggests that optimization of biomass and hydrolysis conditions could further improve the
biodegradability of the organic matter collected at the farm.
4.2.1. Single-sludge denitrification experiment – NO3-N removal rate
This study was conducted on a commercial RAS farm, imposing a substantial source of
variation on the data from farm-management and natural dynamics, which is partly reflected
in the observed variability from the duplicate denitrification reactors. Removal rates were
calculated as concentration differences (between denitrification reactor inlet and outlet) times
the flow rate. This makes the impact from analytical measurement error relatively more
susceptible to low HRT treatments (as the lower difference in absolute concentrations yields
higher coefficients of variation). These technicalities should be kept in mind when evaluating
the results (Table 2 and 3).
The maximum denitrification rate in the reactor was 125 ± 15.7 g NO3-N m-3reactor d
-1 (or 60
± 6.0 g NO3-N kg-1TVS d-1) when utilizing the organic matter from the overflow of the
sludge storage basin as carbon source for the process. In a comprehensive review, van Rijn et
al. (2006) reported denitrification rates in aquaculture systems ranging from 24-3984 g NO3-
N m-3 d-1. This wide range reflected differences in system configurations, operational
parameters, management, etc.. The maximum rate measured in the present study was more
than doubled when polyethylene netshaped (Bioblok®, 200 m2 m-3) fixed-bed media were
inserted in the reactors (Suhr et al., unpublished results), indicating that retention of
suspended solids and heterotrophic biomass in the reactors and altered flow characteristics
could considerably increase N-removal efficiency. In accordance with this, experimental
scale fluidized bed and polymer media filters have shown high NO3-N removal rates (1039-
1848 g NO3-N m-3 d-1) in aquaculture systems (Boley et al., 2000, Shnel et al., 2002, Gelfand
et al., 2003). Increased surveillance and diligent sludge removal management, however, are
required in such filter types.
The NO2+3-N removal rate measured in the constructed wetlands of the MTFs was on average
1.5 – 1.9 g N m-2 d-1 (Svendsen et al., 2008). At an average depth of 0.9 m in the wetlands this

Page 13 of 26
Accep
ted
Man
uscr
ipt
13
corresponds to a removal of 1.7 – 2.1 g N m-3 d-1. The maximum volumetric removal rate of
125 ± 15.7 g NO3-N m-3reactor d
-1 measured in this study makes the N-removal process 60 - 75
times more efficient in the reactors than in the constructed wetlands. However, the C/N-ratio
was somewhat higher in the maximum N-removal reactor treatment (CODS/NO3-N = 6.9)
compared to the average ratios in the inlet to the constructed wetlands (COD/NO2+3-N = 5.5).
Nevertheless, the results of this study suggest strongly that a more dedicated sludge treatment
would be profitable if a MTF was to implement a controlled single-sludge denitrification unit
prior to the constructed wetlands. In an optimized sludge digestion unit fueling the
denitrification reactor, proper hydraulic mixing should be sustained. Incoming “pure” flush
water (containing high oxygen but no nitrate nor considerable organic matter) should be by-
passed straight into the constructed wetlands or as a minimum up-concentrated before
entering the sludge digestion unit. A drawback of using single-sludge denitrification
technology is the more soluble state of the wasted sludge and release of nutrients (TAN,
PO42-) from it (Klas et al., 2006a, Conroy and Couturier, 2010). A clarifier unit and further
removal of excess nutrients could potentially remedy this and lead to successful operation of
the whole RAS system.
4.2.2. Single-sludge denitrification experiment – Environmental effects on microbial N-cycle
processes
In all the denitrification experimental runs, a little nitrifier activity was assumed, as oxygen
was present in the inlet (Table 3) and some TAN removal was measured. However, the
amount of oxygen consumed by nitrifiers compared to heterotrophs was not possible to
quantify from the data obtained. Similarly, it was not possible to distinguish whether the
measured NO2-N removed or formed originated from incomplete/partial nitrification or
incomplete denitrification, as such quantification would require tracer marked N-compounds.
Consequently, the intermediate NO2-N compound pool was disregarded when calculating the
theoretical alkalinity removal by denitrification in Table 3, as well as in the reflections below.
At high HRT, the response of the microbial N-transformation pathways to the differentiated
environmental conditions imposed by the varied C/N-ratio was distinct.
The TAN production observed at the high C/N – high HRT treatment was most likely due to
dissimilatory nitrate reduction to ammonia (DNRA). The alkalinity production, being higher
than expected when only dissimilatory nitrate reduction to N2 was considered (Table 3),
Page 14 of 26
Accep
ted
Man
uscr
ipt
14
confirmed that additional alkalinity was produced probably via DNRA, as DNRA produces
about twice the alkalinity as denitrification (van de Leemput et al., 2011) .
Conversely, at the low C/N – high HRT treatment, an increased TAN removal was observed,
along with a net alkalinity consumption (Table 3). If all TAN was oxidized by nitrifiers
alkalinity consumption would have been 2.8 eqv m-3 d-1, and with all NO3-N removed by
heterotrophic denitrification (producing 2.6 eqv alkalinity m-3 d-1, Table 3), the overall
alkalinity consumption would be a total of 0.2 eqv m-3 d-1. (Even if all NO2-N produced was
included in the nitrified N-pool, a maximal net consumption would be 1.6 eqv alkalinity m-3
d-1.) This leaves a relatively large gap up to the 2.6 alkalinity measured (Table 3). The
anammox process (TAN + 1.32 NO2 + 0.066 HCO3- + 0.13 H+ → 1.02 N2 + 2.03 H2O + 0.26
NO3- + 0.066 CH2O0.5N0.15) produces 0.064 eqv alkalinity mol-1 TAN (Kunenen, 2008). One
possible hypothesis, that could make the alkalinity measured match the N-transformations,
could be the presence of the anammox process removing some part of the NO3-N (via NO2-
N) and TAN. This anammox hypothesis is furthermore supported by the AQUASIM model,
since the model showed a remarkable large discrepancy for this particular run between the
modeled CODS output versus the 2.5 times higher measured CODS output (Table 2). Thus, in
the most reductive environment (high C/N) indications of DNRA activity was detected,
whereas in the least reductive environment (low C/N) indications of autotrophic anammox
activity was noted (Table 3). This effect of C/N-ratio on activation of alternative NO3-N
removal pathways was not detected at the low HRT, probably because less extreme
environments were induced at such short retention time (50 min).
The growth rate of anammox bacteria is very low (0.1-0.05 day-1, i.e. doubling time 1 - 2
weeks), which makes the occurrence of these bacteria in normal heterotrophic denitrifying
wastewater processes unlikely (van Loosdrecht and Jetten, 1998). However, since the MTF
sludge storage basin was not operated as a completely mixed system, it had been
continuously in use (> 2 years), and it was the source feeding organic matter and biomass into
the denitrifying reactors, it seems reasonable to assume that such bacteria existed in the
environment. Anammox bacteria have been identified in (marine) seabream RAS
environment (solid waste, faeces, and fish intestines) (Lahav et al., 2009), and the
contribution of the anammox process in denitrifying filters has previously been quantified to
15% of the total removal (Tal et al., 2009).
4.2.3. Single-sludge denitrification experiment – Modeling of the denitrification reactors

Page 15 of 26
Accep
ted
Man
uscr
ipt
15
A very simple model was formulated in AQUASIM, only describing the heterotrophic
denitrification process and using the yield constant and half-saturation constants normally
applied in wastewater treatment systems. The modeled outlet values were within 49 - 119 %
of measured NO3-N (average 77 ± 26 %) and within 40 - 98 % of measured CODs values
(average 77 ± 21 %) (Table 2).
At high HRT, the effect of increasing the C/N-ratio from low to high level on NO3-N removal
was measured (as well as modeled, (Table 2)), as an approximate doubling of the rate (Table
3). However, at low HRT, a similar C/N-ratio effect on NO3-N removal was modeled but not
measured. This was due to the poorly simulated Low HRT - High C/N-ratio treatment (Table
2). Whether the divergence was caused by distortion in effect between the CMFR modeled
and the actual unknown flow-type at this treatment, or was caused by an unknown sludge
basin management-inflicted effect, cannot be determined from the available data. It is well-
known, however, that the type of hydraulic flow regimen in biological filters is an important
factor for efficiency and performance (Chen et al., 2006).
Overall, the CODS model simulations were satisfactory, apart from the High HRT - Low
C/N-ratio treatment, presumably having autotrophic anammox activity. The modeled outlet
CODS values were all generally lower than experimentally measured. This could indicate that
the approximation of biomass or yield factor was marginally overestimated. The estimation
of biomass was based upon the measured CODS values (section 2.4. Modeling of the
denitrification reactors) implicating a relatively great uncertainty about the estimate. A more
precise assessment could have been done by measurements in separate (lab) experiments on
subsamples from the reactors.
Denitrifying pilot-scale upflow sludge blanket reactors in pilot scale tilapia RAS are operated
at flow velocities of 0.3 – 0.6 m h-1 (Eding et al., 2009) or 0.32 – 0.33 m h-1 (Martins et al.,
2009) to ensure a high sludge retention time (SRT) relatively to a short water HRT, as sludge
hydrolysis and VFA generation is an integrated part of these types of reactors. In this study,
the up-flow velocity ranged from 0.9 - 3.0 m h-1 (high HRT 0.9-1.0 m h-1; low HRT 2.9 – 3.0
m h-1; intermediate HRT 1.4 m h-1). According to the guidelines mentioned by Eding et al.
(2009) this could lead to a loss of the major part of the particulate matter in the reactors. It
seems reasonable to assume that this indeed happened, since the experimental data showed
relatively acceptable fit with the CMFR model applied (HRT = SRT in the CMFR model).
The response surface plot (Fig.5) illustrates well that the highest removal rate was measured
at the intermediate levels.

Page 16 of 26
Accep
ted
Man
uscr
ipt
16
5. Conclusions
Further reduction of nitrogen discharge from Danish ModelTroutFarms (MTF) requires more
efficient denitrification than presently obtained in the constructed wetlands. This study
showed that controlled single-sludge denitrification is a feasible option and a rational next
step of development for Danish MTFs. Hydrolysis experiments with MTF-generated sludge
indicated that potentially 17 - 24 % of the volatile fatty acids (VFA) produced in the MTF
sludge storage basin was lost due to the current sludge management practice. Optimizing
sludge handling in order to fully take advantage of the biodegradable organic matter will be a
central parameter for successful single-sludge denitrification.
In the single-sludge denitrification experiment investigating C/N-ratios from 4 – 12 at
hydraulic retention times of 50 – 170 min, the maximum denitrification rate was found to be
125 ± 15.7 g NO3-N m-3reactor d
-1 (corresponding to 60 ± 6.0 g NO3-N kg-1 total volatile solids
(TVS) d-1) at the intermediate settings C/N = 6.9 and HRT = 98 min.
The experiment showed that the effect of the C/N-ratio was dependent on HRT. Increased
C/N-ratio induced a higher NO3-N removal rate at high HRT. At low HRT, however, this
effect was not observed. Furthermore, this study pointed towards versatile bacterial NO3-N
removal pathways in response to changes of environmental conditions; from indications of
autotrophic anaerobic ammonia oxidation (anammox) activity at low C/N to dissimilatory
nitrate reduction to ammonia (DNRA) at high C/N-ratio.
Acknowledgements
This work was partly funded by the European Fisheries Fund (EFF) and the Danish Ministry
of Food, Agriculture and Fisheries. The technical skills and assistance of Ole Madvig Larsen,
Rasmus Frydenlund Jensen and Ulla Sproegel is highly appreciated. Lars Flemming Pedersen
is acknowledged for critical reading and comments to the manuscript.
References
Aboutboul, Y., Arviv, R., van Rijn, J. 1995. Anaerobic Treatment of Intensive Fish Culture
Effluents - Volatile Fatty-Acid Mediated Denitrification. Aquaculture 133, 21-32.

Page 17 of 26
Accep
ted
Man
uscr
ipt
17
Ahring, B.K., 2003. Perspectives for Anaerobic Digestion, in: Ahring, B.K. (Ed.),
Biomethanation II. Springer Verlag, Berlin Heidelberg, pp.1-30.
Baumann, B., Snozzi, M., Zehnder, A.J.B., van der Meer, J.R., 1996. Dynamics of
denitrification activity of Paracoccus denitrificans in continuous culture during aerobic-
anaerobic changes. J. Bacteriol. 178, 4367-4374.
Boley, A., Muller, W.R., Haider, G., 2000. Biodegradable polymers as solid substrate and
biofilm carrier for denitrification in recirculated aquaculture systems. Aquacult. Eng. 22, 75-
85.
Brock, T.D. and Madigan, M.T., 1991. Biology of Microorganisms. 6th ed. Prentice-Hall
International Inc., New York.
Chen, S., Ling, J., Blancheton, J., 2006. Nitrification kinetics of biofilm as affected by water
quality factors. Aquacult. Eng. 34, 179-197.
Conroy, J., Couturier, M., 2010. Dissolution of minerals during hydrolysis of fish waste
solids. Aquaculture 298, 220-225.
Dalsgaard, J., Pedersen, P.B., 2011. Solid and suspended/dissolved waste (N, P, O) from
rainbow trout (Oncorynchus mykiss). Aquaculture 313, 1-4, 92-99.
DS (Danish Standard) 204. 1980. Determination of total residue and total fixed residue in
water, sludge and sediment. Danish Standard, DS 204:1980, 4 pp.
DS (Danish Standard) 207. 1985. Total non filtrable residue and fixed matter in non filtrable
residue. Danish Standard, DS 207:1985, 4 pp.
DS (Danish Standard) 223. 1991. Water analysis - Determination of the sum of nitrite- and
nitrate-nitrogen, DS 223:1991, 20 pp.
DS (Danish Standard) 224. 1975. Water analysis - Determination of ammonia-nitrogen, DS
224:1975, 8 pp.
Eding, E., Verdegem, M., Martins, C., Schlaman, G., Heinsbroek, L., Laarhoven, B., Ende,
S., Verreth, J., Aartsen, F., Bierbooms, V., 2009. Tilapia farming using Recirculating
Aquaculture Systems (RAS) – Case study in the Netherlands. In “A handbook for sustainable

Page 18 of 26
Accep
ted
Man
uscr
ipt
18
aquaculture”, 71-95. Wageningen, The Netherlands, 20 Mar. 2012
<http://www.sustainaqua.org/images/handbook/EN.pdf>.
Elefsiniotis, P., Oldham, W. K., 1994. Anaerobic acidogenesis of primary sludge: The role of
solids retention time. Biotechnol. Bioeng. 44, 7-14.
Gelfand, I., Barak, Y., Evan-Chen, Z., Cytryn, E., Krom, M., Neori, A., van Rijn, J., 2003. A
novel zero-discharge intensive seawater recirculating system for culture of marine fish. J.
World Aquacult. Soc. 34, 344-358.
Henze, M., Harremoës, P., Jes la Cour, J., Arvin, E., 2002. Wastewater treatment: biological
and chemical processes. 3rd edition. Springer-Verlag, Berlin Heidelberg, Germany.
ISO (International Organisation for Standardization) 7890/1. 1986. Water quality –
determination of nitrate. Part 1: 2,6-dimethylphenol spectrometric method, ISO 7890/1:1986,
15 pp.
ISO (International Organisation for Standardization) 15705. 2002. Water quality –
determination of the chemical oxygen demand index (ST-COD) – small scale sealed tube
method, ISO 15705:2002(E), 18 pp.
Jetten, M., Strous, M., van de Pas-Schoonen, K., Schalk, J., van Dongen, U., van de Graaf,
A., 1998. The anaerobic oxidation of ammonium. FEMS Microbiol. Rev. 22, 421-437.
Kajimura, M, Croke, S.J., Glover, C.N., Wood, C.M., 2004. Dogmas and controversies in the
handling of nitrogenous wastes: The effect of feeding and fasting on the excretion of
ammonia, urea and other nitrogenous waste products in rainbow trout. J. Exp. Biol. 207,
1193-2002.
Klas, S., Mozes, N., Lahav, O., 2006a. A conceptual, stoichiometry-based model for single-
sludge denitrification in recirculating aquaculture systems. Aquaculture 259, 328-341.
Klas, S., Mozes, N., Lahav, O., 2006b. Development of a single-sludge denitrification
method for nitrate removal from RAS effluents: Lab-scale results vs. model prediction.
Aquaculture 259, 342-353.
Kunenen, J.G., 2008. Anammox bacteria: from discovery to application. Nature 6, 320-326.

Page 19 of 26
Accep
ted
Man
uscr
ipt
19
Lahav, O., Massada, I.B., Yackoubov, D., Zelikson, R., Mozes, N., Tal, Y., Tarre, S, 2009.
Quantification of anammox activity in a denitrification reactor for a recirculating aquaculture
system. Aquaculture 288, 76-82
Lam, P., Lavik, G., Jensen, M.M., van de Vossenberg, J., Schmid, M., Woebken, D., 2009. Revising the nitrogen cycle in the Peruvian oxygen minimum zone. Proc. Natl. Acad. Sci. 24, 4752-4757.
Lee, P.G., Lea, R.N., Dohmann, E., Prebilsky, W., Turk, P.E., Ying, H., Whitson, J.L., 2000.
Denitrification in aquaculture systems: an example of a fuzzy logic control problem.
Aquacult. Eng. 23, 37-59.
Martins, C.I.M., Ochola, D., Ende, S.S.W., Eding, E.H., Verreth, J.A.J. 2009. Is growth
retardation present in Nile tilapia Oreochromis niloticus cultured in low water exchange
recirculating aquaculture systems? Aquaculture 298, 43-50.
Martins, C.I.M., Eding, E.H., Verdegem, M.C.J., Heinsbroek, L.T.N., Schneider, O.,
Blancheton, J.P., Roque d’Orbcastel, E., Verreth, J.A.J., 2010. New developments in
recirculating aquaculture systems in Europe: A perspective on environmental sustainability.
Aquacult. Eng. 43, 83-93.
Mirzoyan, N., Tal, Y., Gross, A., 2010. Anaerobic digestion of sludge from intensive
recirculating aquaculture systems: Review. Aquaculture 306, 1-6.
Otte, G., Rosenthal, H., 1979. Management of a closed brackish water-system for high-
density fish culture by biological and chemical water treatment. Aquaculture 2, 169-181.
Pedersen, P.B., Svendsen, L.M., Sortkjær, O., Ovesen, N.B. Skriver, J., Larsen, S.E.,
Rasmussen, R.S., Dalsgaard, A.J.T., 2008. Environmental benefits achieved by applying
recirculation technology at Danish trout farms (Model Trout Farm).In: Proceedings of the
Aquacultural Engineering Society’s Fourth Issues Forum, p. 139.
Reichert, P., 1994. AQUASIM - a tool for simulation and data-analysis of aquatic systems.
Water Science and Technology. 30, 21-30.
Shnel, N., Barak, Y., Ezer, T., Dafni, Z., can Rijn, J., 2002. Design and performance of a
zero-discharge tilapia recirculating system. Aquacult. Eng. 26, 191-203.

Page 20 of 26
Accep
ted
Man
uscr
ipt
20
Suhr, K.I., Pedersen, P.B., 2010. Nitrification in moving bed and fixed bed biofilters treating
effluent water from a large commercial outdoor rainbow trout RAS. Aquacult. Eng. 42, 31-
37.
Svendsen, L.M., Sortkjær, O., Ovesen, N.B., Skriver, J., Larsen, S.E., Bouttrup, S., Pedersen,
P.B., Rasmussen, R.S., Dalsgaard, A.J.T., Suhr, K.I., 2008. Modeldambrug under
forsøgsordningen. Faglig slutrapport for “Måle -og dokumentationsprojekt for
modeldambrug”. [In Danish]. DTU Aqua-report no. 193-08, DTU Aqua, Nordsøen
Forskerpark, Hirtshals, Denmark.
Tiedje, J.M. 1988. Ecology of denitrification and dissimilatory nitrate reduction to ammonia,
in: Zehnder, A.J.B. (Ed.), Biology of Anaerobic Microorganisms. Wiley, New York, 179-
244.
Tal, Y., Schreier, H.J., Sowers, K.R., Stubblefield, J.D., Place, A.R., Zohar, Y., 2009.
Environmentally sustainable land-based marine aquaculture. Aquaculture 286, 28-35.
van de Leemput, I.A., Veraat, A.J., Dakos, V., de Klein, J.J.M., Strouss, M., Scheffer, M.,
2011. Predicting microbial nitrogen pathways from basic principles. Environm. Microb. 13,
1477-1487.
van Loosdrecht, M.C.M., Jetten, M.S.M., 1998. Microbiological conversions in nitrogen
removal. Wat. Sci. Tech. 38, 1-7.
van Rijn, J. 1996. The potential for integrated biological treatment systems in recirculating
fish culture - A review. Aquacult. 139, 181-201.
van Rijn, J., Rivera, G., 1990. Aerobic and anaerobic biofiltration in an aquaculture unit:
nitrite accumulation as a result of nitrification and denitrification. Aquacult. Eng. 9, 1-18.
van Rijn, J., Tal, Y., Schreier, H.J., 2006. Denitrification in recirculating systems: Theory and
applications. Aquacult. Eng. 34, 364-376.
Washbourne, I.J., Crenshaw, C.L., Baker, M.A., 2011. Dissimilatory nitrate reduction
pathways in an oligotrophic freshwater ecosystem: spatial and temporal trends. Aquat.
Microb. Ecol. 65, 55-64.

Page 21 of 26
Accep
ted
Man
uscr
ipt
21
Table 1. Characteristics of the three different organic matter waste stream samples taken from the commercial RAS farm and used for a 16 days laboratory hydrolysis experiment (average ± s.d., n=3).
Start, day 0 End, day 16Up-conc.a TVS0 (g
kg-1)TVS16 (g kg-1)
CODSb/TVS0 (g g-
1) VFAb/TVS0 (g g-
1)Sludge cones 4.8
19.74 ± 0.36
16.84 ± 0.70 0.28 ± 0.01 0.21 ± 0.01
Drum filter
-33.16 ± 0.05
30.34 ± 0.34
0.22 ± 0.02 0.15 ± 0.01
Back-washc
4.3 1.04 ± 0.05
1.00 ± 0.07
aUp-concentration factor: VSS content of sample (when supernatant water had been tapped off)/ VSS content of raw sample bProduced during the hydrolysis period (content day 16 – content day 0)
cThe initial TVS0 content was too low to generate reproducible results during hydrolysis, and was subsequently
withdrawn from further analysis
Table 2. The experimental runs for the experiment investigating C/N ratio (as CODS / NO3-N) and hydraulic retention time (HRT) from 4 – 12 and 50 – 170 min, respectively (H: High, L: Low, I: Intermediate) in two 5.5 m3 reactors. Measured (out) values of NO3-N and CODS
from the reactors (average ± s.d., n=2) are listed versus modeled (m. out) values.
Experimental runs Flow NO3-N (g m-3)
C/N HRT (min) Q (m3 d-1) In out m. out* in
L 4.6 ± 0.3 L 49 ± 0.2 160.64 ± 0.79 11.62 ± 0.20 9.82 ± 0.37 9.2 52.9 ± 2.5H 12.2 ± 0.3 L 50 ± 0.2 159.56 ± 0.74 8.29 ± 0.17 6.04 ± 0.20 3.3 101.4 ± 0.0L 4.2 ± 0.9 H 167 ± 0.6 47.52 ± 0.17 11.60 ± 0.94 6.98 ± 1.96 5.3 48.8 ± 6.9

Page 22 of 26
Accep
ted
Man
uscr
ipt
22
H 10.7 ± 0.1 H 148 ± 1.6 53.44 ± 0.57 10.60 ± 0.10 0.77 ± 1.03 0.4 113.4 ± 0.2I 8.5 ± 0.4 C 104 ± 1.1 76.40 ± 0.79 9.18 ± 0.31 2.59 ± 0.30 1.8 77.9 ± 0.9I 6.9 ± 0.0 C 98 ± 0.2 80.76 ± 0.17 11.67 ± 0.08 3.17 ± 1.13 3.8 80.6 ± 0.6
*Value in the outlet according to model simulations.
Table 3. Removal rate of NO3-N, TAN, and NO2-N measured at the different experimental runs. The measured removal rate of alkalinity (negative removal= production) is shown versus the calculated alkalinity removal if all nitrate was removed by dissimilatory reduction to N2. (Average ± s.d., n=2)
Experimental runs Inlet Removal rate (g m-3reactor d
-1)
C/N HRT (min) O2 (g m-3) NO3-N TAN NO2-N Alkalinity
L 4.6 ± 0.3 L 49 ± 0.2 3.55 ± 0.29 52.6 ± 16.3 2.1 ± 1.4 -5.5 ± 6.2 -3.2 H 12.2 ± 0.3 L 50 ± 0.2 2.16 ± 0.13 65.3 ± 10.6 4.5 ± 8.7 -8.9 ± 7.6 -3.5 L 4.2 ± 0.9 H 167 ± 0.6 2.80 ± 0.28 39.9 ± 8.7 19.7 ± 2.8 -9.6 ± 7.7 2.6 H 10.7 ± 0.1 H 148 ± 1.6 3.43 ± 0.03 95.4 ± 8.1 -5.4 ± 4.3 3.8 ± 5.3 -9.6 I 8.5 ± 0.4 I 104 ± 1.1 2.62 ± 0.13 91.5 ± 7.5 4.4 ± 5.3 -1.9 ± 2.9 -6.8 I 6.9 ± 0.0 I 98 ± 0.2 4.02 ± 0.04 124.8 ± 15.7 6.4 ± 3.1 2.1 ± 6.1 -10.9
*DN: Denitrification. Alkalinity removal calculated as - 0.91 eqv. mol-1 N (Henze et al., 2002).
Page 23 of 26
Accep
ted
Man
uscr
ipt
23
0251659264251659264251659264251659264251659264251659264
0251659264251659264251659264251659264251659264251659264251659264251659264251659264251659264251659264
0251659264251659264
0251659264251659264
0251659264251659264
Figure 1. Microbial Nitrogen cycling processes. Modified from Lam et al., 2009.
Organic-N TAN
Fish excretionNO
2
-
NO3
-
N2
↑
remineralization
assimilation
NON
2O
NO2
-
DenitrificationDNRA (high C/N)Anammox (low C/N)
Nitrification
Oxic
Anoxic
Page 24 of 26
Accep
ted
Man
uscr
ipt
24
251658240
Figure 2. Measured pH values during hydrolysis. The initial drop reflects the high initial generation rate of high volatile fatty acids. (Average ± s.d., n=3).
251658240
0.00
0.05
0.10
0.15
0.20
0.25
0.30
0.35
0 5 10 15 20
COD S
/TVS
0VF
A/TV
S 0(g
/g)
Time (days)
Sludge cones_CODs Drum filter_CODs
Sludge cones_VFA Drum filter_VFA
Figure 3. Production of soluble COD (CODs) and volatile fatty acids (VFA) during hydrolysis. Data are normalized by division by organic matter content on day 0 (TVS0). (Average ± s.d., n=3).
0251659264251659264

Page 25 of 26
Accep
ted
Man
uscr
ipt
25
Figure 4. Correlation of TAN and VFA production during anaerobic hydrolysis of waste from sludge cone (A) and drum filter (B). (Average ± s.d., n=3).

Page 26 of 26
Accep
ted
Man
uscr
ipt
26
0251659264251659264251659264
Fig. 5. Response Surface analysis of the effect of hydraulic retention time (HRT) and C/N-ratio on NO3-N removal (g m-3 d-1).
C / N
HRT (min)