end zone reinforcement for pretensioned concrete girders journal/2004/may-june... · zontal and...
TRANSCRIPT

In this study, a literature review was conducted toestablish the background of current specificationsand to evaluate the applicability of varioustheories and methods for design of end zonereinforcement. Analytical methods reviewed inthis paper include finite element analysis, strut-and-tie modeling, and the Gergely-Sozenequivalent beam method. Previous experimentalwork combined with work conducted as part ofthis study was used to correlate between varioustheoretical and experimental results. This paperillustrates that no single theoretical methodadequately represents the complex behavior at theend of a pretensioned concrete member. A generalsemi-empirical design procedure is proposed here.It is based on theoretical behavior andexperimental observation. Standard reinforcementdetails are given. The proposed procedure couldresult in significant reduction in the amount ofreinforcement while maintaining acceptable crackcontrol at the member end. Application of theproposed procedure to highly pretensioned bridgegirders is demonstrated.
Cracks are frequently observed at the ends of preten-sioned concrete members at the time of prestresstransfer, especially in narrow-stemmed members
such as I-girders and inverted-tee beams. These cracks arecaused primarily by the concentration of prestressing forcesat the time of prestress release. They are commonly hori-zontal and occur near the junction of the bottom flange andweb. Some diagonal cracks are also observed higher up onthe web. The AASHTO LRFD Specifications1 require that 4percent of the total prestressing force be used as the tensile
2 PCI JOURNAL
Christopher Y. Tuan, P.E.Associate ProfessorUniversity of Nebraska-LincolnOmaha, Nebraska
Sherif A. Yehia, P.E.Assistant Professor
Western Michigan UniversityKalamazoo, Michigan
Nipon JongpitaksseelResearch AssistantUniversity of Nebraska-LincolnOmaha, Nebraska
Maher K. Tadros,Ph.D., P.E., FPCI
Charles J. Vranek ProfessorUniversity of Nebraska-Lincoln
Omaha, Nebraska
End Zone Reinforcement forPretensioned Concrete Girders
force in the vertical reinforcement atthe end zone of a girder. AASHTOLRFD further stipulates that this verti-cal reinforcement be designed for astress of 20 ksi (138 MPa) and placedwithin a distance from the end equal toone-fourth of the girder depth, h/4.With the use of high strength concreteincreasing, relatively large prestress-ing forces are specified for preten-sioned girders. Also, 0.6 in. (15 mm)diameter strands are being used at thestandard 2 in. (51 mm) spacing inplace of conventional 0.5 in. (13 mm)diameter strands, which can increasethe prestressing force by as much as40 percent. With greater prestressingforces, it has become impractical toplace a large amount of reinforcementwithin the short distance required byAASHTO. Designers are faced withthe dilemma of either violating theAASHTO requirements or using lessefficient girder designs. Some design-ers question the validity of AASHTObecause the girders do not undergosignificant end cracking. They do notsee any negative effects of thesecracks, which are often enclosed incast-in-place end diaphragms.
BACKGROUNDA literary review was conducted to
document the background of end rein-forcement requirements in AASHTOand to survey various design methods.An experimental investigation wasalso conducted to evaluate the strainsand stresses in end zone reinforcementdesigned according to current specifi-cations. Based on this investigation, adesign procedure is proposed. Rein-forcement details based on the designprocedure were used in several full-scale bridge girders, which exhibitedless end zone congestion and im-proved crack control.
CURRENT SPECIFICATIONSIn the early 1960s, Marshall and
Mattock2 developed a simple designequation for the required area endzone reinforcement. The semi-empiri-cal equation was based on testing of14 pretensioned girders whose depthsranged from 22.5 to 25.0 in. (572 to635 mm). The splitting reinforcement
May-June 2004 3
area As is given by the following equa-tion:
where Pi is the total prestressing force,fsm is the maximum allowable stress inarea As, h is the total girder depth, andlt is the transfer length of the strand.
This equation was deemed accuratefor girders whose geometries satisfiedh/lt ≤ 2 and yielded conservative de-signs for h/lt > 2. A transfer lengthequal to 50 strand diameters was rec-ommended unless experimental evi-dence dictated otherwise. Marshalland Mattock recommended that theend zone stirrups be distributed uni-formly over a length equal to one-fifthof the girder depth. Their work wasbased on relatively small laboratorybeams. It was difficult to extend itsuse to girders in current practice with-
out additional experimental work. Insome cases it is common to have gird-ers as deep as 100 in. (2540 mm). Di-rect application of this method wouldimply the need to provide end zone re-inforcement for a splitting force asgreat as 8 percent of the prestressingforce.
Article 9.22.1 of the AASHTOStandard Specifications3 appears to bea simplified form of the recommenda-tions of Marshall and Mattock. Thefollowing statement regarding the endzone reinforcement requirements forpretensioned concrete girders first ap-peared in the 1961 AASHTO InterimSpecifications: “In pretensionedbeams, vertical stirrups acting at a unitstress of 20,000 psi [138 MPa] to re-sist at least 4 percent of the total pre-stressing force shall be placed withinthe distance of d/4 of the end of thebeam, the end stirrup to be as close tothe end of the beam as practicable.”
AP
f
h
lsi
sm t
=
0 021. (1)
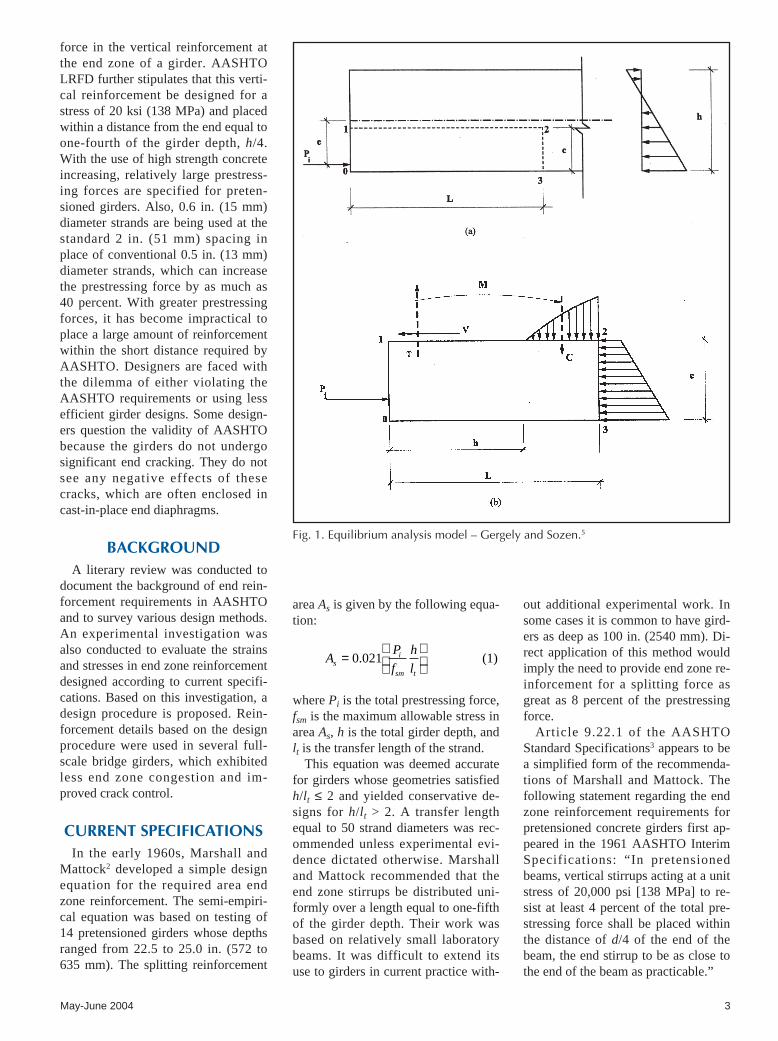
Fig. 1. Equilibrium analysis model – Gergely and Sozen.5

4 PCI JOURNAL
This provision is nearly identical toMarshall and Mattock’s recommenda-tion if h/lt is taken as a constant of 2.For 0.5 in. (13 mm) diameter strands,this ratio represented a girder depth of50 in. (1270 mm). At the time of theirintroductions in the 1960s, the provi-sions conservatively covered most ofthe girder sizes used at that time, andthe constant ratio of 2 was believed tobe conservative. Article 9.22.1 in theAASHTO Standard Specifications re-mains unchanged to this day. Article5.10.10.1 in the AASHTO LRFDSpecifications contains essentially thesame provisions as those in theAASHTO Standard Specifications ex-cept that the reinforcement is placedwithin a distance equal to 25 percent of
the member total depth, h, rather than25 percent of the effective depth, d.
ANALYTICAL MODELSThis section summarizes the analyt-
ical models that have been used inprevious research on end zone behav-ior in pretensioned concrete members.The end zone stress distribution in apretensioned concrete girder is a func-tion of the location and magnitude ofthe prestressing strands, the degree ofbond between strands and the sur-rounding concrete, the amount ofstrand draping in the end zone, thesection geometry, and the concretematerial properties. Once the concretecracks, modeling the cracked end zone
becomes more complicated.
Finite Element Modeling
Elastic stress analysis methods, par-ticularly the finite element analysis,are useful for predicting the probablelocations and orientations of cracks.Kannel et al.4 developed a finite ele-ment model to predict the formation ofend zone cracks under the influence ofthree-dimensional stresses created bydraped prestressing strands and theorder of strand release. Their modelswere used to investigate field mea-surement results and to manage theorder of strand release. However, theywere not easy to use in design of rein-forcement for crack control.
Gergely-Sozen Model
Due to the presence of cracking,elastic analysis methods become in-valid for determining end zone stressdistribution caused by prestressingforces. In addition, the vertical stirrupsin the end zone are not effective untilhorizontal cracks have been initiated.Due to these facts, Gergely and Sozen
5
developed a method of analysis basedon the equilibrium conditions of thecracked end zone which was a furtherdevelopment of the work of Lenschowand Sozen.6 This equilibrium analysisprocedure is equally applicable to pre-tensioned and post-tensioned mem-bers.
Fig. 1 shows a representation of theend zone stresses. In Fig. 1a, the com-pressive stress distribution in the con-crete due to the applied prestressingforce becomes linear at some distanceL from the member end. If a horizon-tal crack occurs along Face 1-2 at aheight c from the bottom of the girder,the equilibrium conditions can be es-tablished using the free body diagramdefined by Points 0, 1, 2, and 3 illus-trated in Fig. 1b. A moment and shearforce will generally exist on Face 1-2due to the prestressing forces and thecompressive concrete stress distribu-tion. The linear stress distributionalong Face 2-3 is calculated based onthe geometry of girder cross section,the prestressing forces, and the strandpattern. The Face 1-2 location is deter-mined such that the internal moment,
0
10
20
30
40
50
60
-6000 -5000 -4000 -3000 -2000 -1000 0 1000Moment (in-kips)
Depth (in.)
Layer b1 16
Layer b2 16
Layer b3 8
Layer t2 2
Layer t3 2
Layer t4 2
Layer t5 2
Resultant
5498.9 in-kips@ 25.5 in.
No. of
Bonded
Strands
Fig. 2. Moment diagram at end zone of NU1600 I-girder.

May-June 2004 5
M, is the maximum value to occur onany horizontal face between the bot-tom and top faces. This is the facewhere cracking is likely to initiate.The resisting moment is provided bythe tensile force, T, in the end zone re-inforcement and the compressive re-sultant force, C, in the concrete, asshown in Fig. 1b.
Fig. 2 shows a typical moment dia-gram for an NU1600 I-girder. Addi-tional graphs have been developed inReference 7 for the maximum mo-ments of several sections, includingstandard AASHTO bulb tees, rectan-gular girders, and box beams as wellas Nebraska inverted-tee and I-girdersshapes.8 These graphs serve as valu-able guides for locating the initiationof splitting cracks. The authors believethat the Gergely-Sozen Method is themost practical solution for analysis ofprestressed member end zones.
Strut-and-Tie Model
The strut-and-tie model (STM) is astrength limit state analysis method.The model is useful in assessing thestress flow in the end zone and locat-ing zones of concrete tension. Its usein determining the amount of splittingreinforcement, however, may produceoverly conservative estimates. Be-cause some researchers9 have appliedthis method to the design of preten-sioned member end zones, the methodis briefly discussed here.
In the STM method, the forces in-ternal to a member are confined in aseries of straight-line compressionstruts and tension ties that are con-nected at discrete nodal points, thusforming a truss. The compressiveforces are carried by the concretestruts, and the tensile forces are car-ried by the conventional and/or pre-stressed reinforcement. Because of thenonlinear stress distribution in the endzone due to concentrated prestressingforces, it is called a disturbed region,or D-region.
A strut-and-tie model must satisfyforce equilibrium in this region. Itdoes not require that compatibility ofdeformations, or strains, be satisfied.It is generally analyzed at the strengthlimit state, where it is assumed thatconcrete tension is non-existent and
Table 1. Geometric and material properties and reinforcement details (Phase I).Properties NU1800 NU1600 IT600 IT400
Number of specimens 3 3 3 3
Girder length (ft) 127 118 50 48
Drape length (ft) 51 55 — —
Number of draped strands 8 6 — —
Number of straight strands46 38
16 12(4 debonded) (12 debonded)
Cross-sectional area (sq in.) 857.3 810.8 246 196
Moment of inertia (in.4) 611,328 458,482 11,938 3568
Strand diameter (in.) 0.5 0.5 0.5 0.5
Reinforcement in end zone 2 No. 5 @ 2 in. 2 D18 @ 2 in. 2 D20 @ 2 in. 2 D18 @ 2 in.
Amount of steel 14 No. 5 12 D18 4 D20 4 D18
(within h/5 distance)
Concrete strength, fci′ (psi) 7021 6890 7343 6112
Concrete modulus, Eci (ksi) 5003 5658 5148 5116
Note: 1 in. = 25.4 mm; 1 ft = 0.3048 m; 1 sq in. = 645.2 mm2; 1 in.4 = 416,231 mm4; 1 psi = 0.0069 MPa; 1 ksi = 6.9 MPa.
concrete compression has a uniformintensity. Because compatibility is notrequired to be satisfied and because alarge number of truss models can begenerated for the same problem, theresults of the STM method giveupper-bound solutions that can bemuch more conservative than thosegiven by other methods.
In applying the STM to a pre-stressed girder end zone analysis, de-signers must keep the steel stressbelow the limit that would create un-desirable crack widths, typically 20 to24 ksi (140 to 160 MPa). The incon-sistency between the intent and appli-cation of the STM in the design endzone reinforcement for serviceabilityleads to the conclusion that the STMmethod should be used only qualita-tively, rather than quantitatively, forthe design of pretensioned girder endzones.
Sanders and Breen10 conducted ex-tensive research on the anchoragezone reinforcement for post-tensionedconcrete girders using STM at thestrength limit state. An STM was de-veloped for the design of reinforce-ment to resist splitting in the end zoneof post-tensioned concrete members.They indicated that their model couldnot be directly applied to pretensionedmembers because the primary objec-tive in pretensioned members is tocontrol cracks at service load, and theforce transfer between pretensionedstrands and the surrounding concreteis gradual.
References 7 and 9 indicate thatusing the STM in pretensioned endzones could yield a splitting force be-tween 4 to 13 percent of the preten-sioning force. Because other methodsyield 4 percent or less, the results ofthe STM analysis lead to significantlyoverestimating the end zone reinforce-ment required.
EXPERIMENTALINVESTIGATION
The experimental program in thisstudy consisted of two phases. InPhase I, the stresses and strains in theend zone vertical reinforcement ofvarious girders designed in accordancewith the current AASHTO LRFDSpecifications1 were measured and an-alyzed. In Phase II, new end zone re-inforcement details were proposed,tested, and evaluated.
Phase I End Zone Details
The objective of Phase I was toevaluate stresses in the end zone verti-cal reinforcement at strand release inactual girders, designed in accordancewith the AASHTO LRFD Specifica-tions. Data were collected from 12pretensioned concrete girders pro-duced by two precast producers in thestate of Nebraska, including six NU I-girders and six inverted-tee (IT) gird-ers. Table 1 gives the geometric prop-erties, material properties, andprestressing and reinforcement details

6 PCI JOURNAL
of the Phase I girders. End zone rein-forcement in these specimens wasplaced a distance equal to one-fourthof the girder height at each end. Thereinforcement shown in Table 1 was
spaced at 2 in. (51 mm) on center ineach face of the web.
Figs. 3 and 4 show the girder crosssection and locations of the straingauges for the NU I-girders and IT
girders, respectively. The Gergely-Sozen model5 was used to predict themaximum moment locations wherestrain gauges were to be mounted.Strain gauges were mounted on the
Fig. 4. End zonedetail and straingauge location-
IT400.
Fig. 3. End zonereinforcement
detail and straingauge location-
NU1800.
May-June 2004 7
vertical reinforcement of the girderend nearest the live end of the pre-stressing bed abutment. This locationwas selected to ensure that the highestprestressing force in the entire bedwas utilized in the measurements. Insome girders, strain gauges were in-stalled at both ends to distinguish be-tween each end, and to average thesplitting force for both ends.
Samples of D18 and D20 deformedwires and No. 5 reinforcing bars weretested to obtain the stress-strain rela-tionships needed to convert straingauge readings into stresses. Duringrelease, strain readings of vertical re-inforcement were recorded.
For all girders, the draped strandswere released suddenly by flame cut-ting. Then, the bottom straight strandswere released gradually with hydraulicjacks. Gradual release of all straightstrands is the standard practice in Ne-braska. Flame cutting of strandsshould be performed carefully to avoiddynamic and uneven distribution of re-lease stresses. The authors recommendthat precast concrete producers releasethe entire prestressing force graduallyand simultaneously, especially forgirders with high prestressing forces.
Analysis of Phase I Test Results
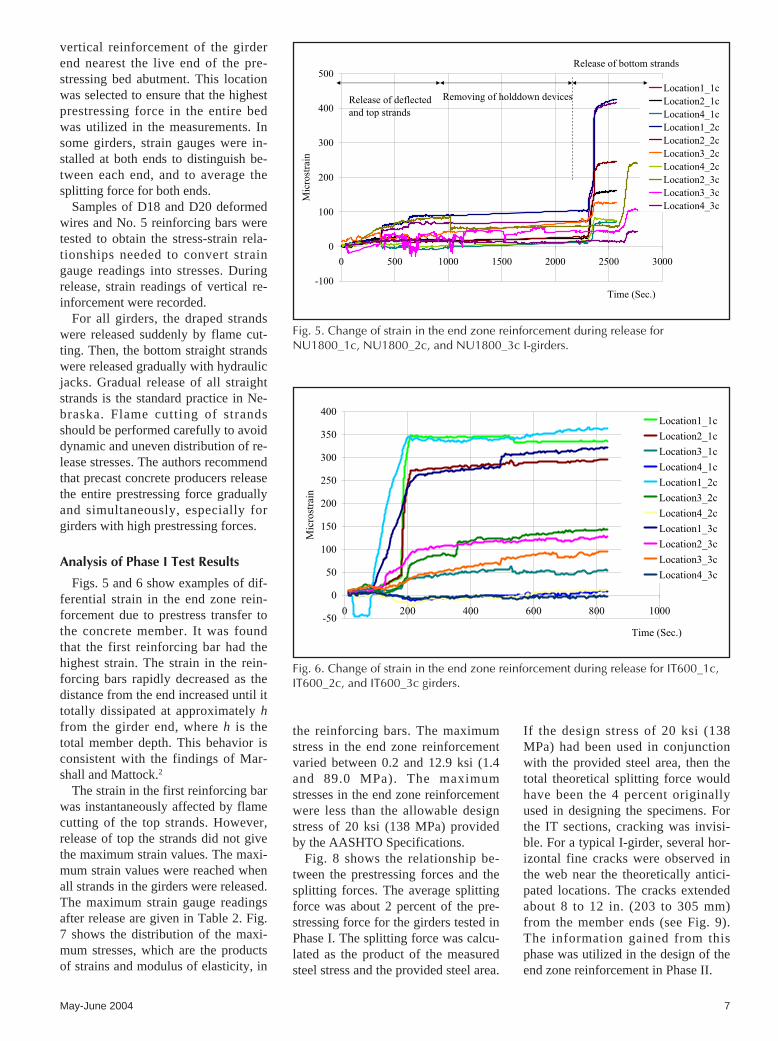
Figs. 5 and 6 show examples of dif-ferential strain in the end zone rein-forcement due to prestress transfer tothe concrete member. It was foundthat the first reinforcing bar had thehighest strain. The strain in the rein-forcing bars rapidly decreased as thedistance from the end increased until ittotally dissipated at approximately hfrom the girder end, where h is thetotal member depth. This behavior isconsistent with the findings of Mar-shall and Mattock.2
The strain in the first reinforcing barwas instantaneously affected by flamecutting of the top strands. However,release of top the strands did not givethe maximum strain values. The maxi-mum strain values were reached whenall strands in the girders were released.The maximum strain gauge readingsafter release are given in Table 2. Fig.7 shows the distribution of the maxi-mum stresses, which are the productsof strains and modulus of elasticity, in
-100
0
100
200
300
400
500
0 500 1000 1500 2000 2500 3000
Time (Sec.)M
icro
stra
in
Location1_1c
Location2_1c
Location4_1c
Location1_2c
Location2_2c
Location3_2c
Location4_2c
Location2_3c
Location3_3c
Location4_3c
Release of deflected
and top strands
Release of bottom strands
Removing of holddown devices
-50
0
50
100
150
200
250
300
350
400
0 200 400 600 800 1000
Time (Sec.)
Mic
rost
rain
Location1_1c
Location2_1c
Location3_1c
Location4_1c
Location1_2c
Location3_2c
Location4_2c
Location1_3c
Location2_3c
Location3_3c
Location4_3c
the reinforcing bars. The maximumstress in the end zone reinforcementvaried between 0.2 and 12.9 ksi (1.4and 89.0 MPa). The maximumstresses in the end zone reinforcementwere less than the allowable designstress of 20 ksi (138 MPa) providedby the AASHTO Specifications.
Fig. 8 shows the relationship be-tween the prestressing forces and thesplitting forces. The average splittingforce was about 2 percent of the pre-stressing force for the girders tested inPhase I. The splitting force was calcu-lated as the product of the measuredsteel stress and the provided steel area.
If the design stress of 20 ksi (138MPa) had been used in conjunctionwith the provided steel area, then thetotal theoretical splitting force wouldhave been the 4 percent originallyused in designing the specimens. Forthe IT sections, cracking was invisi-ble. For a typical I-girder, several hor-izontal fine cracks were observed inthe web near the theoretically antici-pated locations. The cracks extendedabout 8 to 12 in. (203 to 305 mm)from the member ends (see Fig. 9).The information gained from thisphase was utilized in the design of theend zone reinforcement in Phase II.
Fig. 5. Change of strain in the end zone reinforcement during release forNU1800_1c, NU1800_2c, and NU1800_3c I-girders.
Fig. 6. Change of strain in the end zone reinforcement during release for IT600_1c,IT600_2c, and IT600_3c girders.

8 PCI JOURNAL
Phase II Proposed End Zone Details
Based on the observations and anal-ysis from Phase I, new end zone de-tails were developed. The design ofthe new details was based on the fol-lowing criteria:
1. End zone reinforcement shouldbe concentrated at the end of thegirder such that the first bar is locatedas close as possible to the end. It wasobserved in Phase I that only the rein-forcement located h/8 from the end ofthe member experienced significantstress. There was some stress appliedto the reinforcement located h/8 to h/2from the end. Beyond that zone, ten-sile stresses in the splitting reinforce-ment were very small, as seen in Fig.7.
2. A steel stress of 20 ksi (138 MPa)was used to design the reinforcementfor of the splitting force. This stresswas expected to correlate well withobserved steel stress near the very endof the member in Phase II, where thesplitting reinforcement was reducedcompared to that of Phase I.
3. The special vertical reinforcementat the end zone was designed for asplitting resistance of about 2 percentof the prestressing force and wasplaced within 0.125h of the end. Theremainder was balanced with rein-forcement corresponding to that calcu-lated for the critical shear section. Forexample, if the critical shear section is0.720h from the support face and ifthe support is 6 in. (152 mm) wide,then there are two reinforcementzones. The first zone contains the
Table 2. Microstrain in the end zone reinforcement at release (Phase I).Location 1 Location 2 Location 3 Location 4
Specimen z (in.) Microstrain z (in.) Microstrain z (in.) Microstrain z (in.) Microstrain
NU1800_1c 2 416 8 162 12 N/A 16 71
NU1800_2c 2 425 8 245 12 126 16 74
NU1800_3c 2 N/A 8 239 12 105 16 43
NU1600_1c 2 216 8 201 12 188 16 116
NU1600_2c 2 460 8 220 12 156 16 N/A
NU1600_3c 2 444 8 N/A 12 165 16 82
IT600_1c 2 348 6 201 12 54 18 8
IT600_2c 2 363 6 N/A 12 143 18 13
IT600_3c 2 323 6 128 12 96 18 6
IT400_1c 2 315 8 108 12 68 16 32
IT400_2c 2 302 8 N/A 12 70 16 16
IT400_3c 2 96 8 39 12 32 16 30
Note: 1 in. = 25.4 mm.
0
5
10
15
20
25
0 2 4 6 8 10 12 14 16 18 20
Distance from the Beam End (in.)
Rei
nfo
rcem
ent
Str
ess
(ksi
)
NU1800_1c
NU1800_2c
NU1800_3c
NU1600_1c
NU1600_2c
NU1600_3c
IT400_1c
IT400_2c
IT400_3c
IT600_1c
IT600_2c
IT600_3c
0
10
20
30
40
50
60
70
80
0 250 500 750 1000 1250 1500 1750 2000 2250 2500
Prestressing Force (kip)
Bursting Force
(kips)NU Girder 0.6 in. Dia.
NU Girder 0.5 in. Dia.
IT Girder 0.5 in. Dia.
Pr = 0.04P
Pr = 0.03P
Pr = 0.02P
Fig. 7. Variation of maximum vertical reinforcement stress over end zone.
Fig. 8. Relationships between splitting force and prestressing force.

May-June 2004 9
splitting reinforcement at 2 in. (51mm) spacings. It should be located to0.125h from the member end. The sec-ond begins at 2 in. (51 mm) from theend of the first zone and continues asrequired for shear. (See Table 3 for il-lustration.) Note that some of the spec-imens of Phase II were reinforced withthe details used in current practice.This was done for comparison pur-poses.
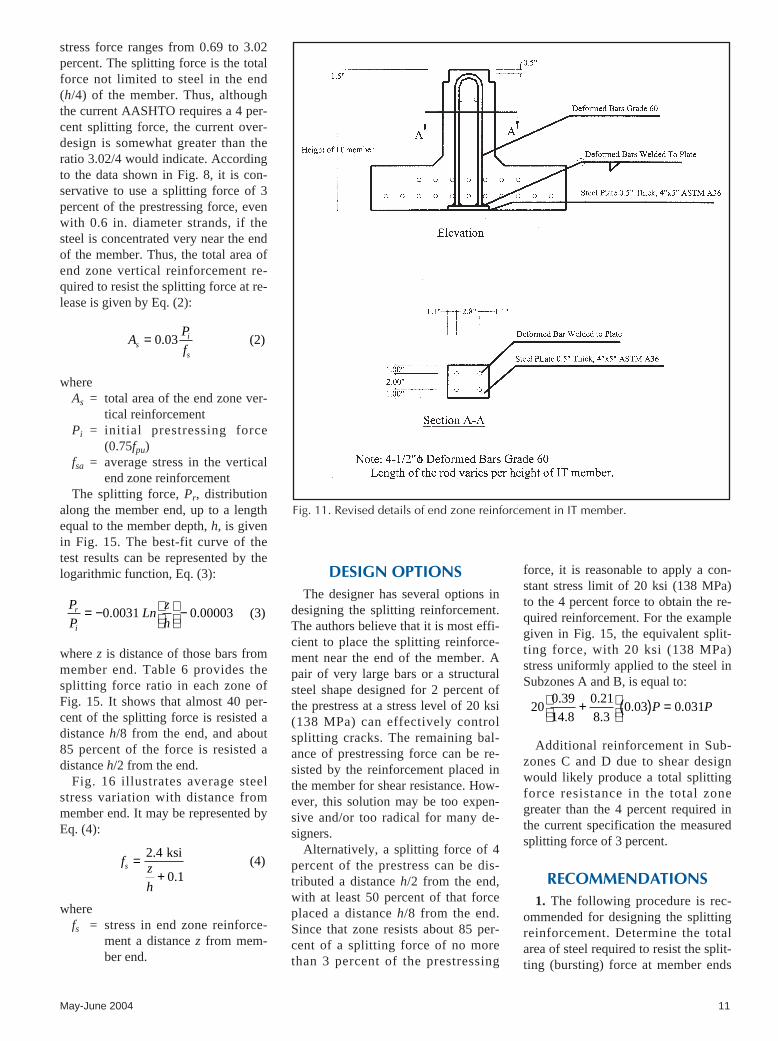
For IT400 girders, threaded rodswere initially used as reinforcementfor splitting resistance. They werelater revised to Grade 60 reinforcingbars fabricated with a welded baseplate. For the I-girder specimens thedetails used in the experiments werethe ones recommended for implemen-tation.
Fig. 10 shows the reinforcementused in the end zone of the IT400specimen. Fig. 11 shows the inverted-tee reinforcement detail recommendedfor practice. The proposed end zonereinforcement details used in thePhase II experiments are shown inFigs. 12 and 13. The details shown inthese two figures show small weldedtop plates used to provide adequateanchorage. Note that all shear rein-forcement used in Nebraska consistsof specially fabricated welded wire re-inforcement. Chapter 3 of the PCIBridge Design Manual11 shows detailsof WWR used as shear reinforcementin I-girders. The current and proposedend zone details for the NU1100 I-girder are presented in Figs. 14a and14b, respectively.
Because both the special end zonereinforcement and shear reinforcementis located within a distance of h/4, thesplitting resistance within h/4 of themember may be significantly largerthan 2 percent of the prestressingforce. Strain measurements in thisphase were taken similar to Phase I.
Phase II Test Results
The maximum strains in the endzone reinforcement are summarized inTable 4. Note that the specimen desig-nations in the table include the letter“c” for current detail, and the letter“n” for new details. Concrete crackingand steel strains in this phase exhib-ited very similar patterns to those ob-
served in Phase I. The strains foundusing the new details were smallercompared those found using the con-ventional details. This indicates im-proved efficiency of steel placementdespite the lower quantities used.
The inverted-tee specimen alsodemonstrated that even with the sameamount of reinforcement as the con-ventional details, concrete crackingand steel strain were improved withthe new reinforcement details. Thisconfirms the need to place a relativelylarge area of reinforcement as close tothe member end as possible. Higherprestressing force used in the invertedtee in Phase II [619.7 kips (2.75 MN)]compared to that used in Phase I[371.8 kips (1.65 MN)] did not causeadditional cracking or steel strain aslong as the design was done for a pro-
portionate splitting force and good de-tailing was provided.
The IT400 is only 400 mm (15.74in.) deep. In this case, one-eighth ofthe member depth is less than 2 in. (51mm). It is important for most of thesplitting resistance reinforcement to beplaced within that limited length. Onemust keep in mind that most of bridgemember ends eventually get enclosedin concrete diaphragms. Thus, con-crete cover to that steel is less criticalthan in the exposed part of the girder.The confinement and anchorage pro-vided by the end plates contributed tothe improved performance.
Because of the relatively low strainin the inverted tee specimen and be-cause of the relatively high cost of thethreaded rod used in the test, it wasdecided to convert to the reinforcing
Fine crack
Crack tipFine crack
Crack tip
Fig. 9. Comparison on splitting cracks on the NU1600 I-girder web between current(top) and proposed (bottom) end zone reinforcement.

10 PCI JOURNAL
bar shown in Fig. 11. It is still recom-mended that the inverted U-shaped barbe welded to the base plate for con-finement and anchorage benefits.
This observation can also be madeto the I-girders. The first reinforcingbar experienced the strain. The straindecreased rapidly from the girder end.The maximum stresses varied between0.4 and 25.8 ksi (2.8 and 178 MPa).
The crack width and length from theend were smaller than those observedusing the current reinforcement de-tails. Using a design steel stress of 20ksi (138 MPa) works well with theend conditions in this phase. If the re-quired reinforcement is spread over arelatively long distance, e.g. h/2 or h,the stress level as an average over thelength would not be reached. On the
Table 3. Geometric and material properties and reinforcement details (Phase II).Properties NU1600 NU1100 NU1100 IT400
Number of specimens 2 2 2 2 4 1 1
Girder length (ft) 135 78 10 51
Draped length (ft) 60 35 — —
Number of 8 6 — —
draped strands
Number of 40 (12 debonded) 18 44 18 + 2 (top)
straight strands
Cross-sectional 810.8 694.6 694.6 196
area (sq in.)
Moment of 458,482 182,279 182,279 3568
inertia (in.4)
Strand diameter (in.) 0.6 0.6 0.6 0.5
Splitting14 D28
2 No. 5 + 8 D28
2 No. 5 + 2 No. 5 + 4 TR1/2 4 TR3/4
reinforcement 2 No. 5 @ 2 in. 2 No. 5 @ 2 in. 2 No. 5 @ 2 in.
Shear reinforcement 2 D18 @ 4 in. 2 D18 @ 4 in. 2 D18 @ 4 in. 2 D18 @ 4 in. 2 D18 @ 4 in. 2 D18 @ 4 in. 2 D18 @ 4 in.
Concrete strength, 8669 6881 6003 5537 11,474 6821
fci′ (psi)
Concrete modulus, 4385 4512 5102 4080 6213 4940
Eci (ksi)
other hand, it appears that the designis not optimum if wider cracks, repre-sented by larger steel stress, can betolerated. An extreme stress as high as30 ksi is currently accepted in flexuraldesign for crack control.
Again, the Gergely-Sozen methodwas an effective means of predictionof crack location. The cracks occurredaround the maximum moment loca-tions predicted using that method. Theuse of 0.6 in. prestressing strands toslightly increases the splitting force, ascompared to that provided by 0.5 in.strands. This is illustrated in Fig. 8 andwas factored into the recommendeddesign procedure.
ANALYSIS OF END ZONEBEHAVIOR
Linear regression analysis was usedto develop the relationship betweenstress in the splitting reinforcementand distance from girder end. Thisanalysis was used to predict the tensilestresses in the reinforcement that werenot directly instrumented. The totalsplitting force equaled the sum of indi-vidual bar forces. Table 5 shows thesignificant parameters affecting thesplitting force in the tested girders.The ratio of the splitting force to pre-
Fig. 10a. New end zone reinforcement detail – IT400. Fig. 10b. Shear reinforcementplaced after the end zonereinforcement – IT400.
Note: 1 in. = 25.4 mm; 1 ft = 0.3048 m; 1 sq in. = 645.2 mm2; 1 in.4 = 416,231 mm4; 1 psi = 0.0069 MPa; 1 ksi = 6.9 MPa.
May-June 2004 11
stress force ranges from 0.69 to 3.02percent. The splitting force is the totalforce not limited to steel in the end(h/4) of the member. Thus, althoughthe current AASHTO requires a 4 per-cent splitting force, the current over-design is somewhat greater than theratio 3.02/4 would indicate. Accordingto the data shown in Fig. 8, it is con-servative to use a splitting force of 3percent of the prestressing force, evenwith 0.6 in. diameter strands, if thesteel is concentrated very near the endof the member. Thus, the total area ofend zone vertical reinforcement re-quired to resist the splitting force at re-lease is given by Eq. (2):
where As = total area of the end zone ver-
tical reinforcement Pi = initial prestressing force
(0.75fpu)fsa = average stress in the vertical
end zone reinforcementThe splitting force, Pr, distribution
along the member end, up to a lengthequal to the member depth, h, is givenin Fig. 15. The best-fit curve of thetest results can be represented by thelogarithmic function, Eq. (3):
where z is distance of those bars frommember end. Table 6 provides thesplitting force ratio in each zone ofFig. 15. It shows that almost 40 per-cent of the splitting force is resisted adistance h/8 from the end, and about85 percent of the force is resisted adistance h/2 from the end.
Fig. 16 illustrates average steelstress variation with distance frommember end. It may be represented byEq. (4):
where fs = stress in end zone reinforce-
ment a distance z from mem-ber end.
f z
h
s =+
2 4
0 1
. ksi
. (4)
P
PLn
z
hr
i
= −
−0 0031 0 00003. . (3)
AP
fsi
s
= 0 03. (2)
DESIGN OPTIONSThe designer has several options in
designing the splitting reinforcement.The authors believe that it is most effi-cient to place the splitting reinforce-ment near the end of the member. Apair of very large bars or a structuralsteel shape designed for 2 percent ofthe prestress at a stress level of 20 ksi(138 MPa) can effectively controlsplitting cracks. The remaining bal-ance of prestressing force can be re-sisted by the reinforcement placed inthe member for shear resistance. How-ever, this solution may be too expen-sive and/or too radical for many de-signers.
Alternatively, a splitting force of 4percent of the prestress can be dis-tributed a distance h/2 from the end,with at least 50 percent of that forceplaced a distance h/8 from the end.Since that zone resists about 85 per-cent of a splitting force of no morethan 3 percent of the prestressing
force, it is reasonable to apply a con-stant stress limit of 20 ksi (138 MPa)to the 4 percent force to obtain the re-quired reinforcement. For the examplegiven in Fig. 15, the equivalent split-ting force, with 20 ksi (138 MPa)stress uniformly applied to the steel inSubzones A and B, is equal to:
Additional reinforcement in Sub-zones C and D due to shear designwould likely produce a total splittingforce resistance in the total zonegreater than the 4 percent required inthe current specification the measuredsplitting force of 3 percent.
RECOMMENDATIONS1. The following procedure is rec-
ommended for designing the splittingreinforcement. Determine the totalarea of steel required to resist the split-ting (bursting) force at member ends
200 39
14 8
0 21
8 30 03 0 031
.
.
.
.. .+
( ) =P P
Fig. 11. Revised details of end zone reinforcement in IT member.

12 PCI JOURNAL
due to prestress transfer in preten-sioned members from the relationshipin Eq. (5):
where Pi is initial prestress just beforerelease, and fs is the steel stress limittaken as 20 ksi. For members withfully tensioned Grade 270, low-relax-ation strands, Eq. (5) may be simpli-fied as Eq. (6):
where Aps is the total area of preten-sioning steel.
2. Place at least 50 percent of thearea of splitting reinforcement as closeto the member end as possible, but notbeyond h/8 from the member, where his the total member depth. This rein-forcement should consist of bars thatare welded to the plate at the bottomof the member and to small plates atthe top, as shown in Figs. 11 to 14, inorder to ensure adequate anchorage ofthat reinforcement. The bars may be aslarge as needed with a clear end coverof 1 in. (25 mm) to allow for top an-chorage space and a clear spacing of 1in. (25 mm) to allow for 3/4 in. (19mm) aggregates. If the end h/8 of thegirder is not embedded in a cast-in-place concrete diaphragm, or corro-sion is otherwise a concern, thewelded assembly of bars, bottom plateand top plates should be galvanized.
3. Distribute the remainder of thearea of splitting reinforcement evenlywithin the next zone (3h/8) of themember end. This zone should also bechecked for critical shear section rein-forcement and use the larger area rein-forcement required. The reinforcementin this zone may be detailed in a con-ventional manner with standard hooksand longitudinal (cross) wires.
EXAMPLESThe following examples are in-
tended to illustrate rather extreme ap-plications encountered in the states ofNebraska and Washington in recentyears. These applications were madepossible through the use of I-girderswith relatively large bottom flanges,
A As ps= 0 4. (6)
AP
fsi
s
= 0 04. (5)
Fig. 12. Details of proposed end zone reinforcement.
Fig. 13. Proposed endzone detail for NU-I
girders.

May-June 2004 13
relatively large 0.6 in. (15 mm) diame-ter strands, and high strength concrete.These recent developments allow gird-ers of limited depths to span fartherthan previously possible. As a result,however, large prestressing forces areencountered requiring large amountsof splitting reinforcement in a limitedzone at member ends.
Example 1: Consider an NU1100(43.3 in. deep) I-girder with 60–0.6 in.fully tensioned strands. The requiredsplitting reinforcement =0.4(60)(0.217) = 5.21 sq in. At least5.21/2 = 2.60 sq in. should be placedwithin (43.3/8) = 5.41 in. from themember end. Use 2 No. 8 bars at 1.5in. and 2 No. 8 bars at 3.5 in., for atotal area of 4(0.79) = 3.16 sq in. The
remaining area = 5.21 – 3.16 = 2.05 sqin. should be distributed between 3.5in. and 43.3/2 = 21.65 in. measuredfrom the end. If D18 welded wire rein-forcement is selected, 2.05/0.18 = 12vertical wires should be placed in thatzone. The required maximum spacingof pairs of D18 is (21.65 – 3.5)/6, or 3in. If at the critical section in shear,the shear stress required to be resisted
Table 4. Microstrain in the end zone reinforcement at release (Phase II).Location 1 Location 2 Location 3 Location 4
Specimen z (in.) Microstrain z (in.) Microstrain z (in.) Microstrain z (in.) Microstrain
NU1600_1c 1 674 5 515 7 432 11 235
NU1600_2n 1 N/A 5 566 7.5 370 11.5 243
NU1600_3c 0.75 350 2.5 297 8.5 171 12.5 55
NU1600_4n 2.25 545 5.5 356 9.5 415 13.5 394
NU1100_1c 2 577 4 443 6 361 10 174
NU1100_2n 1 417 3 N/A 5 291 9 166
NU1100_3c 2 679 4 497 6 N/A 10 72
NU1100_4n 1 363 3 N/A 5 143 9 13
NU1100_5n 2 889 3.7 809 5.5 724 9.5 535
NU1100_6n 1.2 861 3 782 6 N/A 9.2 510
NU1100_7n 1.5 818 3.5 737 6.5 607 8.5 522
NU1100_8n 1.5 848 3.2 773 6.5 628 8.7 532
IT400_1n2 1 81 3 58 6 53 12 53
IT400_2n4 1 73 3 N/A 6 61 12 39
Note: 1 in. = 25.4 mm.
Fig. 14b. Proposed end zone detail NU1100 I-girder NU1100I-girder.
Fig. 14a. Current end zone detail.

14 PCI JOURNAL
by the shear reinforcement, Av, is 1.8ksi. Considering the web width, bw, ofNU I-girder series of 150 mm (5.9in.), the required spacing of D18Grade 60 wire is Avfy/vsbw =
(2)(0.18)(60)/(1.8)(5.9) = 2 in. Thus,the spacing of 2 in. required for shearresistance controls the design of thiszone. The end h/2 of the member is,therefore, to be reinforced with 4 No.
Table 5. Tensile forces in vertical reinforcement.Phase Specimen Pr (kips) Pi (kips) Lt (in.) h (in.) yb (in.) Mmax (ft-kips) ym (in.) Pr/Pi (percent)
I NU1800_1c 29.34 1549.1 30 70.9 32 372.9 30.25 1.89
NU1800_2c 32.73 1549.1 30 70.9 32 372.9 30.25 2.11
NU1800_3c 29.13 1549.1 30 70.9 32 372.9 30.25 1.88
NU1600_1c 18.78 991.4 30 63.0 28.4 227.6 27.25 1.89
NU1600_2c 12.41 991.4 30 63.0 28.4 227.6 27.25 1.25
NU1600_3c 11.99 991.4 30 63.0 28.4 227.6 27.25 1.21
IT600_1c 11.98 495.7 30 23.6 8.73 33.9 9.75 2.42
IT600_2c 10.29 495.7 30 23.6 8.73 33.9 9.75 2.08
IT600_3c 14.46 495.7 30 23.6 8.73 33.9 9.75 2.92
IT400_1c 8.98 371.8 30 15.8 5.76 10.3 7.50 2.42
IT400_2c 8.15 371.8 30 15.8 5.76 10.3 7.50 2.19
IT400_3c 9.12 371.8 30 15.8 5.76 10.3 7.50 2.45
II NU1600_1c 47.76 1581.9 36 63.0 28.4 222.7 26.00 3.02
NU1600_2n 41.20 1581.9 36 63.0 28.4 222.7 26.00 2.60
NU1600_3c 23.06 1581.9 36 63.0 28.4 222.7 26.00 1.46
NU1600_4n 45.95 1581.9 36 63.0 28.4 222.7 26.00 2.90
NU1100_1c 30.82 1054.6 36 43.3 19.6 182.7 15.20 2.92
NU1100_2n 22.01 1054.6 36 43.3 19.6 182.7 15.20 2.09
NU1100_3c 29.06 1054.6 36 43.3 19.6 182.7 15.20 2.76
NU1100_4n 26.86 1054.6 36 43.3 19.6 182.7 15.20 2.55
NU1100_5n 54.55 1933.5 36 43.3 19.6 253.9 17.50 2.82
NU1100_6n 53.00 1933.5 36 43.3 19.6 253.9 17.50 2.74
NU1100_7n 47.72 1933.5 36 43.3 19.6 253.9 17.50 2.47
NU1100_8n 49.36 1933.5 36 43.3 19.6 253.9 17.50 2.55
IT400_1n2 4.26 619.7 30 15.8 5.76 16.3 7.75 0.69
IT400_2n4 4.92 619.7 30 15.8 5.76 16.3 7.75 0.79
Note: 1 in. = 25.4 mm; 1 kip = 4.45 kN; 1 ft-kip = 1.35 kN-m.
0.0000
0.0025
0.0050
0.0075
0.0100
0.0125
0.0150
0 0.25 0.5 0.75 1 1.25Distance from the Beam End/Girder Height (z/h)
Mea
sure
d T
ensi
le F
orc
e (k
ip)/
Pre
stre
ssin
g F
orc
e (k
ip)
Test Data
Average Test Data
h/2h/4h/8h/8
A B CD
Pr/P = –0.0031Ln(z/h) – 0.00003
8 bars plus 16 D18 at a center-to-cen-ter spacing of 2 in. The total distanceover which this reinforcement is pro-vided is 1 in. plus 10 spaces at 2 in. =21 in.
Example 2: Consider a W83MGWashington Super Girder. The totaldepth is 2100 mm (82.68 in.) and theweb width is 155 mm (6.10 in.). Theprestressing consists of 74–0.6 in.strands having a total area of 16.058sq in. The required splitting reinforce-ment = 6.42 sq in. Provide at least3.21 sq in. within the first 10.4 in. ofthe member. Use 4 No. 8 bars (3.16 sqin.) at 2 in. in pairs at 2 in. spacing. Ifa minimum cover of 1 in. must be sat-isfied, 8 No. 6 bars (3.52 sq in.) inpairs at 2 in. may be used. The re-maining 2.9 sq in. may be distributedover a distance = 41.34 – (1.375 + 2 +2 + 2) = 33.96 in. This would corre-spond to 16 No. 4 bars in pairs at 4 in.spacing. The shear capacity is as-sumed here not to control the designof the calculated reinforcement.
Fig. 15. Variation of force in vertical reinforcement due to prestressing force.

May-June 2004 15
CONCLUSIONSBased on the results in this investi-
gation, the following conclusions aremade:
1. Calculation of the amount and lo-cation of splitting reinforcement at theends of pretensioned concrete mem-bers, to control splitting cracks at timeof prestress transfer, is complicateddue to the large number of contribut-ing factors and the large random vari-ability of the parameters involved. Un-like post-tensioning where the entireprestressing force is introduced at themember end, transfer of pretensioningforce to concrete occurs graduallythrough bond between individualstrands and the surrounding concrete.As the prestress spreads into the mem-ber cross section concrete materialnonlinear behavior and cracking con-tribute to the inability to develop aclosed form solution.
2. The Marshall-Mattock research inthe 1960s gave a solid foundation forsemi-empirical design of splitting re-inforcement, although it was based onsmall laboratory experiments withvery low prestressing forces. Left inits original form, it would give moreaccurate results than the simplifiedversion included in the currentAASHTO Specifications.
3. Current mathematical modelingtechniques include the strut-and-tiemethod, finite element analysis andGergely-Sozen equivalent girder anal-ysis. The strut-and-tie modelingmethod produces an upper bound solu-tion that is generally too conservative.Finite element analysis is too complexto use in conventional design and gen-erally includes unrealistic simplifyingassumptions. The Gergely-Sozenmethod is based on simple flexureanalysis. It has been shown in this re-search to accurately predict crackingin the full-scale specimens.
4. An upper bound value of thesplitting force, based on the experi-ments conducted in this research, is 3percent of the prestressing force with0.6 in. (15 mm) diameter strands. Thesplitting force is somewhat lowerwhen 0.5 in. (13 mm) diameter strandsare used. The stress in the splitting re-inforcement is close to 25 ksi (172MPa) in the bars nearest the member
Table 6. Splitting force ratios.Subzone A B C D
Length h/8 h/8 h/4 h/2
Bursting force, percent 39 21 25 15
0.0
5.0
10.0
15.0
20.0
25.0
0.000 0.125 0.250 0.375 0.500 0.625 0.750 0.875 1.000 1.125 1.250
Distance from the Beam End/Girder Height (z/h)
Des
ign
Ste
el S
tres
s (k
si)
h/4h/4h/8h/8
14.8 ksi
10.7 ksi
6.9 ksi
4.0 ksi2.8 ksi
h/4
8.3 ksi
5.1 ksi
fs = 2.4/(z/h + 0.1)
ends. It diminishes very sharply as thedistance from the end increases. Thesteel stress may be assumed to practi-cally disappear at a distance equal tothe member depth. These findings areconsistent with those of Marshall-Mattock. Initiation of cracking in thespecimens was accurately predicted bythe Gergely-Sozen method.
5. About 60 percent of the splittingforce develops in the first h/4 of themember. About 85 percent developsin the first h/2. Because the effective-ness of the steel is largely a functionof how close it is to the member end,design for a uniform stress of 20 ksi(138 MPa) would require inputting asplitting force larger than the mea-sured 2 to 3 percent of the prestressingforce.
6. The most effective reinforcementfor control of end-zone splittingcracks is that placed at the very end ofthe member. Such special reinforce-ment may be too expensive to use.
7. A realistic solution is to designthe splitting reinforcement for a forceequal to 4 percent of the prestressingforce and a uniform stress of 20 ksi(138 MPa). To allow for this high av-
erage stress to be used, at least 50 per-cent of that reinforcement should beplaced a distance h/8 from the end.The remainder should be placed be-tween h/8 to h/2 from the end. Beyondh/2, splitting reinforcement should notbe needed, and shear reinforcement, ifneeded, should be used.
8. The proposed procedure requiresthe same total splitting reinforcementarea as the current AASHTO Specifi-cations. Thus, it may be seen as a vali-dation of the AASHTO provisions.
9. Calculation and detailing of thesplitting reinforcement results in im-proved crack control due to the specialanchorage requirements of the largeend bars and in reduced end zone con-gestion when the steel is distributedover h/2 rather than the current h/4 re-quirement in AASHTO.
10. The proposed method may stillbe too conservative. Additional exper-iments are needed to investigate thepossibility of reducing the splitting re-inforcement with increased stress limitto 30 ksi (207 MPa) or even 36 ksi(248 MPa). These two values aresometimes accepted for crack controlin flexural design. With adequate ex-
Fig. 16. Proposed design stress distribution in the end zone reinforcement.
16 PCI JOURNAL
perimental justification, it may be pos-sible to raise the 20 ksi (138 MPa)limit.
ACKNOWLEDGMENTThe authors would like to acknowl-
edge the valuable feedback fromLyman Freemon, Sam Fallaha, andGale Barnhill of the Bridge Divisionof the Nebraska Department of Roads.
The authors also wish to thank NickMeek and Kelvin Lien of the Civil En-gineering Department of the Univer-sity of Nebraska for their assistance inthe experiments and data collection.Specimens for the experimental pro-gram and technical assistance wereprovided by Rinker Materials, Omaha,Nebraska, and Concrete Industries,Lincoln, Nebraska. Financial supportprovided by the Nebraska Department
of Roads and the Center for Infrastruc-ture Research of the University of Ne-braska-Lincoln is greatly appreciated.The authors would like to thank thetechnical reviewers and the PCIJOURNAL editorial staff for theirconstructive comments. Special thanksare extended to Steve Seguirant andJack Breen for their very detailed andhelpful review comments.
1. AASHTO, AASHTO LRFD Specifications for HighwayBridges, 2002 Interim, American Association of State High-way and Transportation Officials, Washington, DC.
2. Marshall, W. T., and Mattock, A. H., “Control of HorizontalCracking in the Ends of Pretensioned Prestressed ConcreteGirders,” PCI JOURNAL, V. 7, No. 5, October 1962, pp. 56-74.
3. AASHTO, Standard Specifications for Highway Bridges, 16thEdition, American Association of State Highway and Trans-portation Officials, Washington, DC, 1996.
4. Kannel, J., French, C., and Stolarski, H., “Release Methodol-ogy of Strands to Reduce End Cracking in Pretensioned Con-crete Girders,” PCI JOURNAL, V. 42, No. 1, January-Febru-ary 1997, pp. 42-54.
5. Gergely, P., and Sozen, M. A., “Design of Anchorage ZoneReinforcement in Prestressed Concrete Beams,” PCI JOUR-NAL, V. 12, No. 2, April 1967, pp. 63-75.
6. Lenschow, R. J., and Sozen, M. A., “A Practical Analysis ofthe Anchorage Zone Problem in Prestressed Beam,” ACI Jour-
nal, Proceedings, V. 62, No. 11, November 1965, pp. 1421-1439.
7. Prestressed Beam End Reinforcement and Camber, NebraskaDepartment of Roads, Project Number SPR-PL-1 (38) P536,University of Nebraska, (Maher K. Tadros and Sherif A.Yehia, principal investigators), June 2002.
8. Tadros, M. K., “Design Aids for Nebraska University (NU)Metric Precast Prestressed Concrete I-Girders,” prepared forNebraska Department of Roads, Lincoln, NE, 1996.
9. Castrodale, R. W., Liu, A., and White, C. D., “SimplifiedAnalysis of Web Splitting in Pretensioned Concrete Girders,”Proceedings, PCI/FHWA/NCBC Concrete Bridge Conference,Nashville, TN, October 6-9, 2002.
10. Sanders, D. H., and Breen, J. E., “Post-Tensioned AnchorageZones with Single Straight Concentric Anchorages,” ACIStructural Journal, V. 94, No. 2, March-April 1997, pp 146-158.
11. Precast Prestressed Concrete Bridge Design Manual, Pre-cast/Prestressed Concrete Institute, Chicago, IL, 1997.
Aps = area of prestressing steel As = area of the end zone vertical reinforcementbw = width of girder webEci = modulus of elasticity of concrete at time of pre-
stress releasefci′ = concrete strength at releasefpu = specified tensile strength of prestressing strandfs
= stress in end zone reinforcement at distance zfrom member end
fsm
= maximum stress in end zone reinforcement fsa = average stress in the vertical end zone reinforce-
menth = girder depth
lt = transfer length of the strandMmax= maximum moment in girder sectionPi = initial prestressing force, assumed 0.75fpu for low
relaxation strands Pr = splitting force due to release of pretensioned
strand to concreteyb = distance from centroid to bottom fiber of cross
sectionym = distance between location of maximum moment
and bottom fiber of cross sectionz = distance of vertical reinforcement from member
end
REFERENCES
APPENDIX – NOTATION