endesa chile may 2007 - iis windows serverlibrary.corporate-ir.net/library/10/106/106239/items/...13...
TRANSCRIPT

1
Endesa Chile
May 2007

2
Index
Financial Profile and Dividend Distributionüü
üü Operating Highlights and Investments
üü Introduction
üü Sustainability and Social Responsibility
üü Value Drivers

3
Simplified Ownership Structure
ARGENTINA
Pangue
94,99%
Celta
100,00%
San Isidro
100,00%
Costanera
69,76%1
El Chocón
64,69%2
GENERATION
Ingendesa
100%
Túnel El Melón
99,95%
ENDESA
VPP
(Affiliates)
COLOMBIA
Betania
99,99%
Emgesa
23,45%
PERÚCHILE
Edegel
33,06%
Pehuenche
92,65%
Other Businesses
Enigesa
100,00%
CEMSA
45,00%
Gas Atacama
50,00%
ENDESA BRASIL
33,6%3
Electrogas
42,50%Endesa Eco
100,00%
HidroAysén
51,0%
1 y 2Considers recent interest purchases in El Chocón (additional 17,2%) and in Costanera (additional 5,5%)
3Considers the exercise of convertible bonds of AMPLA estimated by year 2008

4
4,477 MW36% Installed Cap.
22 Plants
1,430 MW30% Installed Cap.
9 Plants
2,829 MW21% Installed Cap.
11 Plants
TOTAL: 12.374 MWTOTAL: 12.374 MW
47 Plants47 Plants
3,639 MW15% Installed Cap.
5 Plants
Gx: 980 MW (2 plants)Dx: 4.8 mm Clients
Tx: 2,100 MW
COLOMBIA
PERU
CHILE
Equity AffiliateEndesa Brasil
ARGENTINA
(33.6%)
Figures as of March 2007
Hydro 64%
Thermo 36%
Installed Capacity per Country

5
90
105
120
135
150
165
180
195
210
225
240
255
270
1993
1994
1995
1996
1997
1998
1999
2000
2001
2002
2003
2004
2005
2006
Mar-07
Regional Energy Demand Index
Base 1993 = 100%
ü Increasing demand in all 5 countries in which we are present
ü Lack of investments necessary to face the increase in demand
ü Regional scenario of pressures for an increase in energy prices
CHILE
PERU
ARGENTINA
BRAZIL
COLOMBIA
Demand Growth during 1Q07 vs. 1Q06:
Chile 5.9% Argentina 4.5% Brasil 3.7%
Perú 9.5% Colombia 5.2%

6
Endesa Chile – Strengths & Opportunities
Ø Financial Results Improving
Ø Highly efficient Generation Assets
Ø Stable Cash Flow
Ø Strengthened Balance Sheet
Ø Know-how of the Business
Investment Opportunities
Región à muy bien
Ø Economic Stability
Ø Growing Demand
Ø Positive Changes in Regulation
Region à Growing
Endesa à well prepared

7
Argentina10%
Perú12%
Chile55%
Colombia23%
EBITDA Distribution per Country
Figures presented in Chilean GAAP expressed in historical US$
Total EBITDA 1Q07Total EBITDA 1Q07
US$ 406 millionUS$ 406 million Chile58%
Argentina8%
Colombia21%
Peru13%
Total EBITDA 2006Total EBITDA 2006
US$ 1,279 millionUS$ 1,279 million

8
Thermopeakers
Operational Efficiencies
2/3 EOC plants à most efficient in their markets
00
2,000
4,000
Hydro
7,932 MW 64%
Thermo(efficient)
3,769 MW 31%
00
6,000
8,000
10,000
99,29%99.29%99,15%99.15%
aaParPar meter Endesa Benchmark
Availability
0505
93,45%93.45%
NERC 04 NERC 04
89,27%89.27%
Figures as of March 31st, 2007
aaParPar meter Endesa Benchmark
Reliability
0505 NERC 04 NERC 04
Hydro Thermo(efficient)
Thermo(peakers)
673 MW 5%
NERC: North American Electric Reliability Council

9
Commercial Policy
ü Key strategic instrument for adding value to our portfolio
ü Optimizes our commercial portfolioü Reduces risks associated with overexposing our
capacity
0%
20%
40%
60%
80%
100%
120%
1998-2000 2007-2010
Regulated
Un-regulated
Spot28%
56%
35%
36%
16%29%

10
Index
Financial Profile and Dividend Distributionüü
üü Operating Highlights and Investments
üü Introduction
üü Sustainability and Social Responsibility
üü Value Drivers

11
High
light
s
Fina
ncia
l Inf
o
Consolidated Energy Sales & Average Sale PriceEnergy Sales & Average Sale Priceü Increasing operating performance and EBITDA
throughout the years.ü Highly competitive generation assets (64%
Hydro).ü Stable growth (energy consumption growing). ü Investment opportunities.
52,98646,86545,038 49,54156,942 57,988
30.926.1
38.534.944.241.9
0
20,000
40,000
60,000
Dec-02 Dec-03 Dec-04 Dec-05 Dec-06 Mar-07
Gigawatt Hours
5
20
35
50
65
(US$/MWh)
As of March 2007 (3M)As of March 2007 (3M)
36%21%
64%79%
Capacity mix Generation mix
Hydro
Thermal24%
36%
40%
Physical SalesMix
Regulated
Un-regulated
Spot
(US$ million) Mar-06 Mar-07 % Var.Operating Revenues 552 731 32%Operating Income 227 316 39%Financial Debt 3,925 3,947 1%EBITDA 305 406 33%
Mar-07 figures in this graph are expressed in TTM.
12
High
light
s
Fina
ncia
l Inf
o
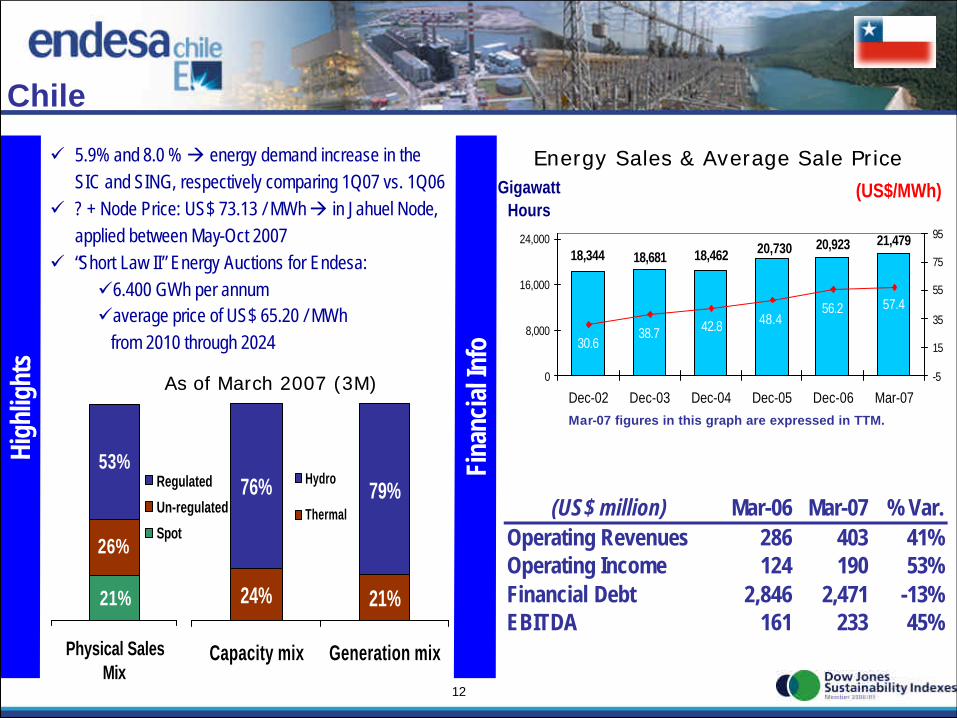
Chile
26%
21%
53%
Physical SalesMix
Regulated
Un-regulated
Spot
21,47920,92318,46218,344 18,681
20,730
56.2 57.4
42.8 48.4
30.638.7
0
8,000
16,000
24,000
Dec-02 Dec-03 Dec-04 Dec-05 Dec-06 Mar-07
Gigawatt Hours
-5
15
35
55
75
95
(US$/MWh)
Energy Sales & Average Sale PriceEnergy Sales & Average Sale Priceü 5.9% and 8.0 % à energy demand increase in the SIC and SING, respectively comparing 1Q07 vs. 1Q06
ü ? + Node Price: US$ 73.13 / MWh à in Jahuel Node, applied between May-Oct 2007
ü “Short Law II” Energy Auctions for Endesa:ü6.400 GWh per annumüaverage price of US$ 65.20 / MWh
from 2010 through 2024
24% 21%
76% 79%
Capacity mix Generation mix
Hydro
Thermal (US$ million) Mar-06 Mar-07 % Var.Operating Revenues 286 403 41%Operating Income 124 190 53%Financial Debt 2,846 2,471 -13%EBITDA 161 233 45%
Mar-07 figures in this graph are expressed in TTM.
As of March 2007 (3M)As of March 2007 (3M)

13
High
light
s
ü 4.5% à energy demand increase in the MEM comparing 1Q07 vs. 1Q06
ü Over 20% increase in average spot prices during 1Q07 vs 1Q06 à recognition of higher Natural Gas prices for industrial users
ü Foninvemem 1,600 MW : 21% share
Fina
ncia
l Inf
o
Argentina
17%
83%
Physical SalesMix
Un-regulated
Spot
13,86113,92611,603
7,8979,260
12,578
31.7 33.322.9 24.3
17.3 20.20
4,000
8,000
12,000
16,000
Dec-02 Dec-03 Dec-04 Dec-05 Dec-06 Mar-07
Gigawatt Hours
0
20
40
60
80
(US$/MWh)
Energy Sales & Average Sale PriceEnergy Sales & Average Sale Price
64% 63%
36% 37%
Capacity mix Generation mix
Hydro
Thermal
(US$ million) Mar-06 Mar-07 % Var.Operating Revenues 79 99 25%Operating Income 13 17 31%Financial Debt 218 320 47%EBITDA 29 33 14%
Mar-07 figures in this graph are expressed in TTM.
As of March 2007 (3M)As of March 2007 (3M)
14
High
light
s
Fina
ncia
l Inf
o
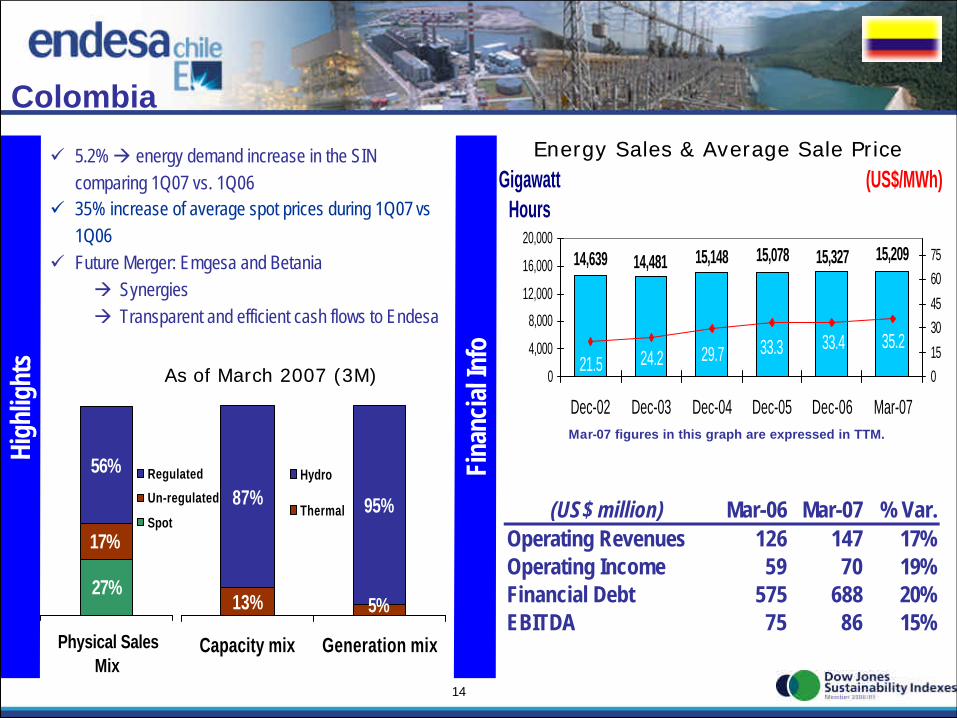
Colombia
Energy Sales & Average Sale PriceEnergy Sales & Average Sale Priceü 5.2% à energy demand increase in the SIN comparing 1Q07 vs. 1Q06
ü 35% increase of average spot prices during 1Q07 vs1Q06
ü Future Merger: Emgesa and Betaniaà Synergiesà Transparent and efficient cash flows to Endesa
15,20915,32715,14814,639 14,481 15,078
33.4 35.229.7 33.3
21.5 24.20
4,000
8,000
12,000
16,000
20,000
Dec-02 Dec-03 Dec-04 Dec-05 Dec-06 Mar-07
Gigawatt Hours
015
3045
6075
(US$/MWh)
13%
87% 95%
5%
Capacity mix Generation mix
Hydro
Thermal
17%
27%
56%
Physical SalesMix
Regulated
Un-regulated
Spot(US$ million) Mar-06 Mar-07 % Var.
Operating Revenues 126 147 17%Operating Income 59 70 19%Financial Debt 575 688 20%EBITDA 75 86 15%
Mar-07 figures in this graph are expressed in TTM.
As of March 2007 (3M)As of March 2007 (3M)

15
High
light
s
Fina
ncia
l Inf
o
PerúEnergy Sales & Average Sale PriceEnergy Sales & Average Sale Priceü 9.5% à energy demand increase in the SINAC
comparing 1Q07 vs. 1Q06.ü Low prices of natural gas from Camisea ü June 2006à merger with Etevensa:
üAddition of 457 MW of Thermal Capacityü Improved hydrological exposure
ü Law 28,832: (i) energy bidding process; (ii) long-term contracts with regulated consumers; (iii) fixed pricessubject to indexation
7,4396,776
4,3284,158 4,443 4,600
46.3 45.052.3 48.039.1 40.6
0
2,000
4,000
6,000
8,000
Dec-02 Dec-03 Dec-04 Dec-05 Dec-06 Mar-07
Gigawatt Hours
0
30
60
90
120
(US$/MWh)
48%32%
52%68%
Capacity mix Generation mix
Hydro
Thermal
46%
12%
42%
Physical SalesMix
Regulated
Un-regulated
Spot (US$ million) Mar-06 Mar-07 % Var.Operating Revenues 62 83 34%Operating Income 30 39 30%Financial Debt 277 469 69%EBITDA 40 54 35%
Mar-07 figures in this graph are expressed in TTM.
As of March 2007 (3M)As of March 2007 (3M)

16
Expected LNG Arrival: Mid of 2009Expected LNG Arrival: Mid of 2009
Liquefied Natural Gas Project in Chile
ü Chilean government initiative, led by ENAPü LNG à Reliable source of generation fuelü Price in line with other commodity pricesü LNG supplied by British Gasü Endesa Chile will participate in the re-gasification terminal (9.5
m3/day)

17
üInstalled Cap.: 377 MW (with LNG)
üInvestment: US$ 210.5 millionüTurbine Manufacturer: Mitsubishi
üFirst LNG Power Plant in Chile
üDUAL Technology for Operations (LNG and Fuel Oil)
Expected Date of Completion:Expected Date of Completion:
üü Open Cycle: April 2007 (operating)Open Cycle: April 2007 (operating)
üü Combined Cycle: March 2008Combined Cycle: March 2008
San Isidro Plant Expansion Project, Chile

18
üPass-through Plant
üInstalled capacity: 32 MW
üInvestment: US$ 44 million
üEnvironmental permits
approved
Expected Date of Completion: 2nd Semester 2007Expected Date of Completion: 2nd Semester 2007
Palmucho, Pass-Through Hydroelectric Plant, Chile

19
Expected Date of Completion: April 2008 Expected Date of Completion: April 2008
Upcoming Endesa ECO Projects:
üMini-hydro “Ojos de Agua”üMaule Region, ChileüInstalled capacity: 9.0 MWüInvestment: US$ 19 millionüRegistered as CDM Project under UNFCCC
üMini-hydro “Ojos de Agua”üMaule Region, ChileüInstalled capacity: 9.0 MWüInvestment: US$ 19 millionüRegistered as CDM Project under UNFCCC
üFirst wind farm “Canela” (I, II) in SICüInstalled capacity: 18.15 MWüInvestment: US$ 30 million
üFirst wind farm “Canela” (I, II) in SICüInstalled capacity: 18.15 MWüInvestment: US$ 30 million
Expected Date of Completion: 2nd semester 2007Expected Date of Completion: 2nd semester 2007

20
Aysen Project
ü Plants: El Salto, Baker 1, Pascua 2, Pascua 1 and Baker 2
ü Installed capacity: 2,400 MW
ü Total investment: US$ 4,000 million(including transmission line)
Expected Time of Completion all plants: 2018Expected Time of Completion all plants: 2018
üInvestment includes a 2,000 kms Direct Current (HVDC) transmission line from Cochrane to Santiago (US$1.5 billion)
üAgreement with Transelec for research and valuation
Expected Date of Completion (first plant): 2012Expected Date of Completion (first plant): 2012
21
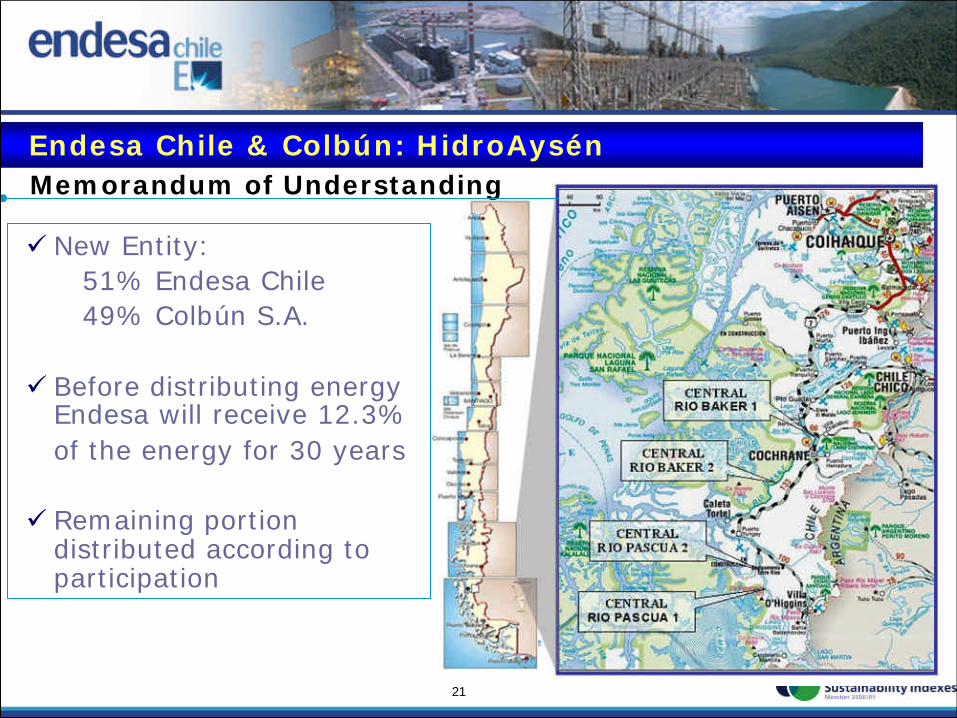
Endesa Chile & Colbún: HidroAysén
ü New Entity:51% Endesa Chile49% Colbún S.A.
ü Before distributing energy Endesa will receive 12.3%of the energy for 30 years
ü Remaining portion distributed according to participation
Memorandum of Understanding

22
Aysen Project: Environmental Issues
ü Consciousness of sustainable development based on the protection of
nature and social development
ü Environmental Impact Studies to comply and respond to:
à minimize flooding surface
à protection of wild life (flora and fauna)
à impact in glaciers
à impact in touristic and agricultural zones
à minimize reallocations of local inhabitants
23
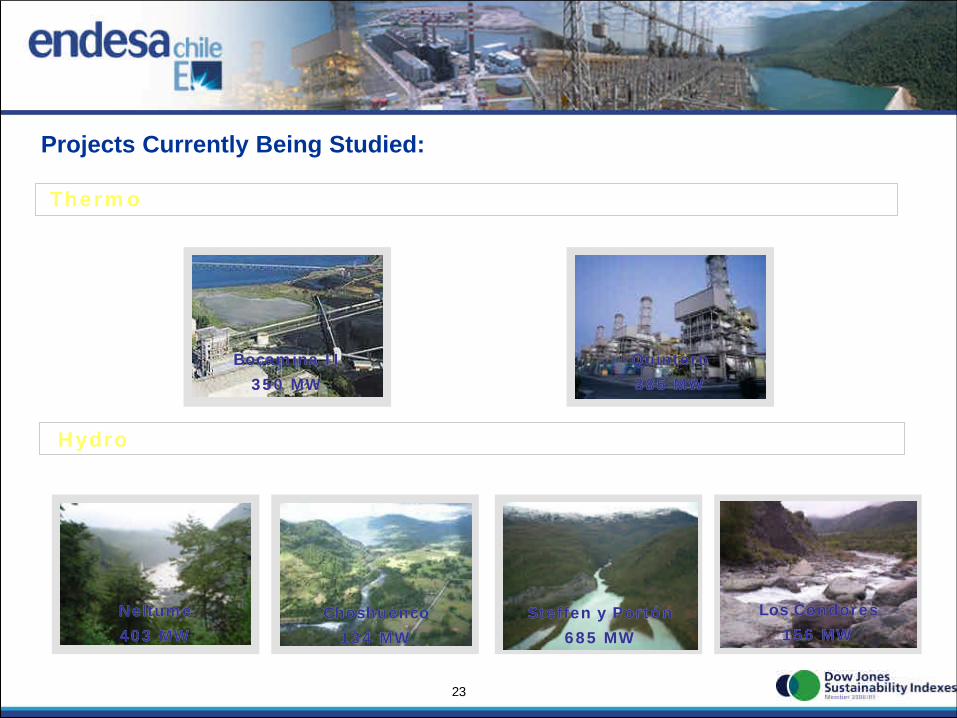
Thermo
Hydro
ChoshuencoChoshuenco
134 MW134 MW
Los CLos Cóóndoresndores
156 MW156 MWNeltumeNeltume
403 MW403 MW
Bocamina IIBocamina II
350 MW350 MW
QuinteroQuintero
385 MW385 MW
Steffen y PortSteffen y Portóónn
685 MW685 MW
Projects Currently Being Studied:

24
ü Authority’s response to high energy demand in the country
ü Financed by MEM account receivables
ü 89% of the generators adhered
ü 7% projected property of plants without direct contributions by Endesa
ü Commitment to recover market prices by 2008
2 New Combined Cycles
totalizing 1,600 MW
Argentina
FONINVEMEM
Expected date of completion:Open cycle: End of 2008Combined cycle: During 2009
25
Index
Financial Profile and Dividend Distributionüü
üü Operating Highlights and Investments
üü Introduction
üü Sustainability and Social Responsibility
üü Value Drivers
26
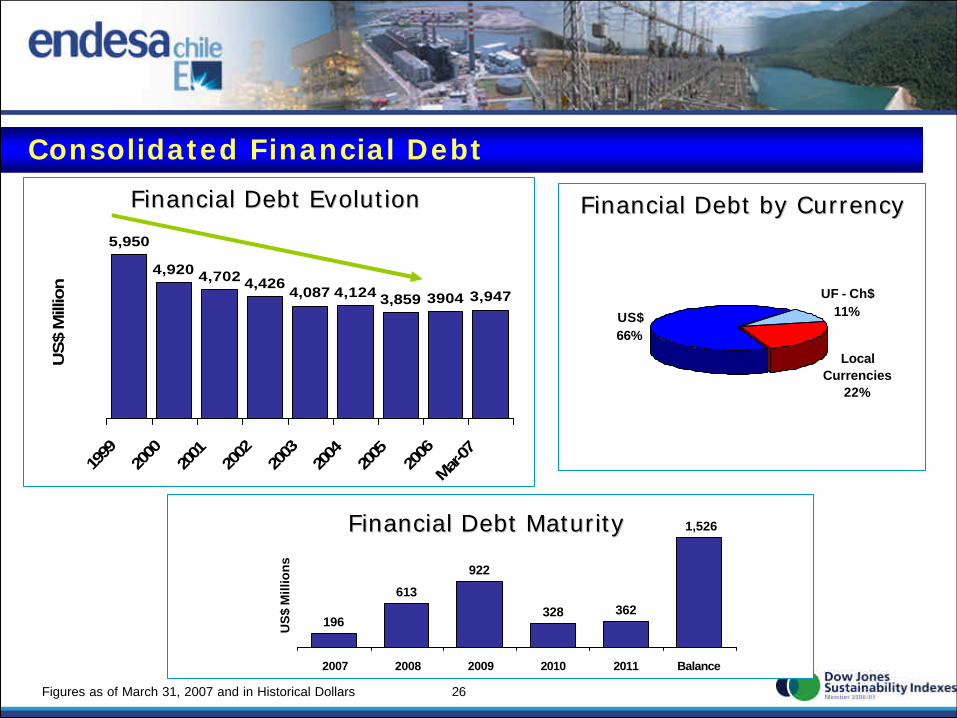
5,950
4,920 4,702 4,4264,087 4,124 3,859 3,9473904
1999
2000
2001
2002
2003
2004
2005
2006
Mar-07
US
$ M
illio
n
Financial Debt EvolutionFinancial Debt Evolution
Consolidated Financial Debt
Local Currencies
22%
US$66%
UF - Ch$11%
Financial Debt by CurrencyFinancial Debt by Currency
196
613
922
362328
1,526
2007 2008 2009 2010 2011 Balance
US
$ M
illio
ns
Financial Debt MaturityFinancial Debt Maturity
Figures as of March 31, 2007 and in Historical Dollars

27
Financial Ratios
323
1,380
758875
9711,105
1,279
296 335 346 349 322
2.9
4.67
3.54.25
5.84
3.1
4.3
2.6 2.6 2.8 3.2
4.0
0
250
500
750
1000
1250
1500
2002 2003 2004 2005 2006 Mar-07
US
$ M
illio
ns
0
1
2
3
4
5
6
7
Tim
es
EBITDA Financial Expenses
Financial Debt/EBITDA Coverage
Figures expressed in historical US$. Figures as of Mar-07 are TTM.

28
*
* Considers the exercise of a Yankee Bond Put Option in 2009 worth US$ 220 million, which matures in 2037.
Debt Profile by Country
Figures as of March 31, 2007
ChileTotal Financial Debt:
US$ 2,471 million
23586 13
414
14213
12 14
384
41
414631*
2007 2008 2009 2010 2011 2012 2013 2014 2015 2016 2017 After2017
35 3280
8 17 0 0 085
14372
2007 2008 2009 2010 2011 2012 2013 2014 2015 2016 2017
63 58 61
4 0 0 0 0 0
5974
2007 2008 2009 2010 2011 2012 2013 2014 2015 2016 2017
ColombiaTotal Financial Debt:
US$ 687 million
PeruTotal Financial Debt:
US$ 471 million
ArgentinaTotal Financial Debt:
US$ 320 millones44 26
123023
26 2223 42
Mitsubishi El Chocón
2973
110
0 0
96
1878
139
0
144
2007 2008 2009 2010 2011 2012 2013 2014 2015 2016 2017

29
ü Investment Grade from all international rating agencies.
ü Current ratings: – Moody's Baa3 Stable– Standard and Poor's BBB- Positive *– Fitch BBB Stable
* S&P under review for possible upgrade
Rating Agencies
30
Index
Financial Profile and Dividend Distributionüü
üü Operating Highlights and Investments
üü Introduction
üü Value Drivers
üü Sustainability and Social Responsibility

31
2000 2001 2002 2003 2004 2005 2006 2007
DSE
Ad
din
g V
alu
e
MAC
SGA
Sustainability & Social Responsability

32
39%
63%
86%98% 98%
2002 2003 2004 2005 2006
Environment and Corporate Social Responsibility
Installed Capacity ISO 14001 Certified
Installed Capacity OHSAS 18001 Certified
0% 3%
28%
95% 96%
2002 2003 2004 2005 2006
Figures as of December 31st, 2006

33
Index
Financial Profile and Dividend Distributionüü
üü Operating Highlights and Investments
üü Introduction
üü Sustainability and Social Responsibility
üü Value Drivers

34
ü Increasing efficiency and capacity
ü Improving operating performance
ü Continuous efforts over issues concerning:ü Sustainability ü Corporate Governance
ü Optimization of asset portfolio
Endesa Chile
Increasing Return for our InvestorsIncreasing Return for our InvestorsValue Drivers
Portfolio consisting of investments in 5
countries, but anchored in Chile
35
Contact us at:
Endesa Chile’s Investor Relations Team
Jaime MonteroInvestor Relations
DirectorEndesa Chile
(56-2) [email protected]
Irene AguilóInvestor Relations
Executive(56-2) 630 96 04
Jacqueline MichaelInvestor Relations
Executive(56-2) 630 95 [email protected]
This presentation may contain statements that constitute forward-looking statements within the meaning of the Private Securities Litigation Reform Act of 1995. These statements may appear in a number of places in this announcement and include statements regarding the intent,
belief or current expectations of Endesa Chile and management with respect to, among other issues: (1)Endesa Chile business and cost-reduction plans; (2) trends affecting Endesa Chile financial condition or results of operations, including market trends in the electricity sector in Chile or elsewhere; (3) supervision and regulation of the electricity sector in Chile or elsewhere; and (4) the future effects of any changes in the
laws and regulations applicable to Endesa Chile and its affiliates. Such forward-looking statements are not guarantees of future performance and involve risks and uncertainties. Actual results may differ materially from those in the forward-looking statements as a result of various factors.
Readers are cautioned not to place undue reliance on those forward-looking statements, which speak only as of their dates. Endesa Chile undertakes no obligation to release the results of any revisions to these forward-looking statements.
Juan Pablo ReitzeHead of Investor
Relations(56-2) 630 96 [email protected]