endesa q1 2020 - seeking alpha
TRANSCRIPT
Endesa Q1 2020Consolidated results
May 04, 2020
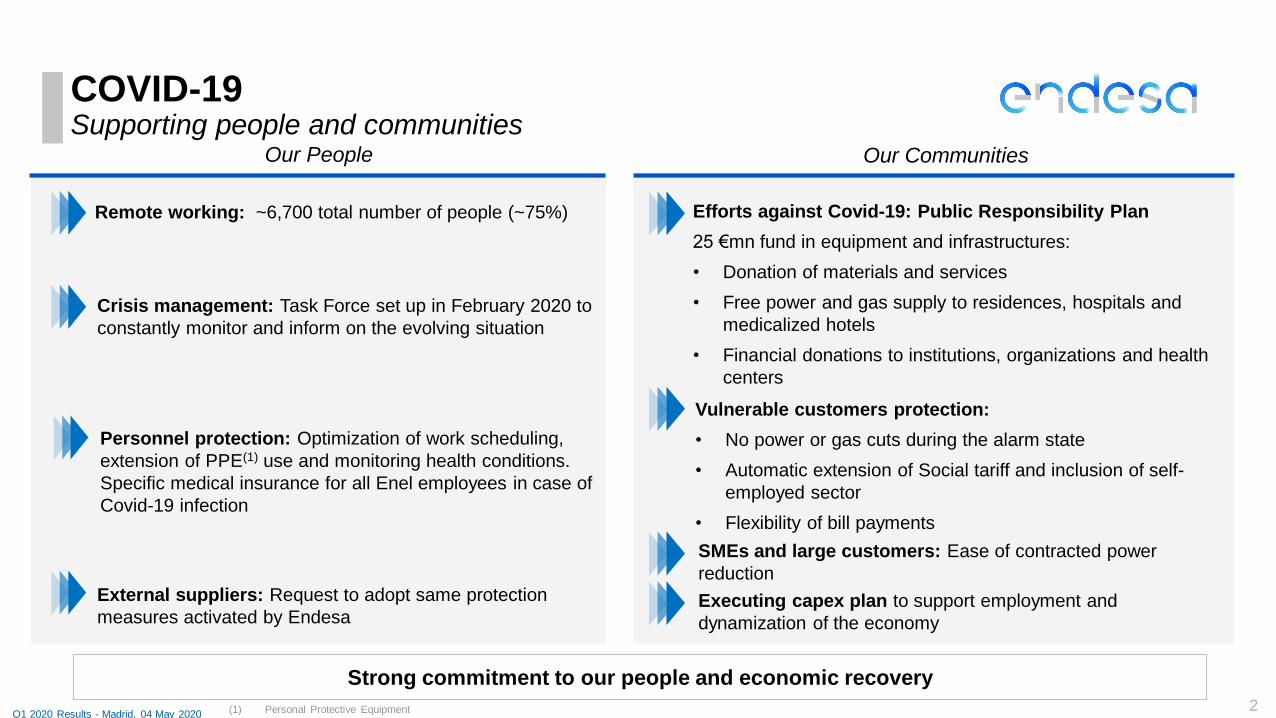
COVID-19Supporting people and communities
Our People
Efforts against Covid-19: Public Responsibility Plan
25 €mn fund in equipment and infrastructures:
• Donation of materials and services
• Free power and gas supply to residences, hospitals and
medicalized hotels
• Financial donations to institutions, organizations and health
centers
2
Vulnerable customers protection:
• No power or gas cuts during the alarm state
• Automatic extension of Social tariff and inclusion of self-
employed sector
• Flexibility of bill payments
Remote working: ~6,700 total number of people (~75%)
Crisis management: Task Force set up in February 2020 to
constantly monitor and inform on the evolving situation
External suppliers: Request to adopt same protection
measures activated by Endesa
Personnel protection: Optimization of work scheduling,
extension of PPE(1) use and monitoring health conditions.
Specific medical insurance for all Enel employees in case of
Covid-19 infection
Our Communities
SMEs and large customers: Ease of contracted power
reduction
(1) Personal Protective Equipment
Executing capex plan to support employment and
dynamization of the economy
Strong commitment to our people and economic recovery
Q1 2020 Results - Madrid, 04 May 20202
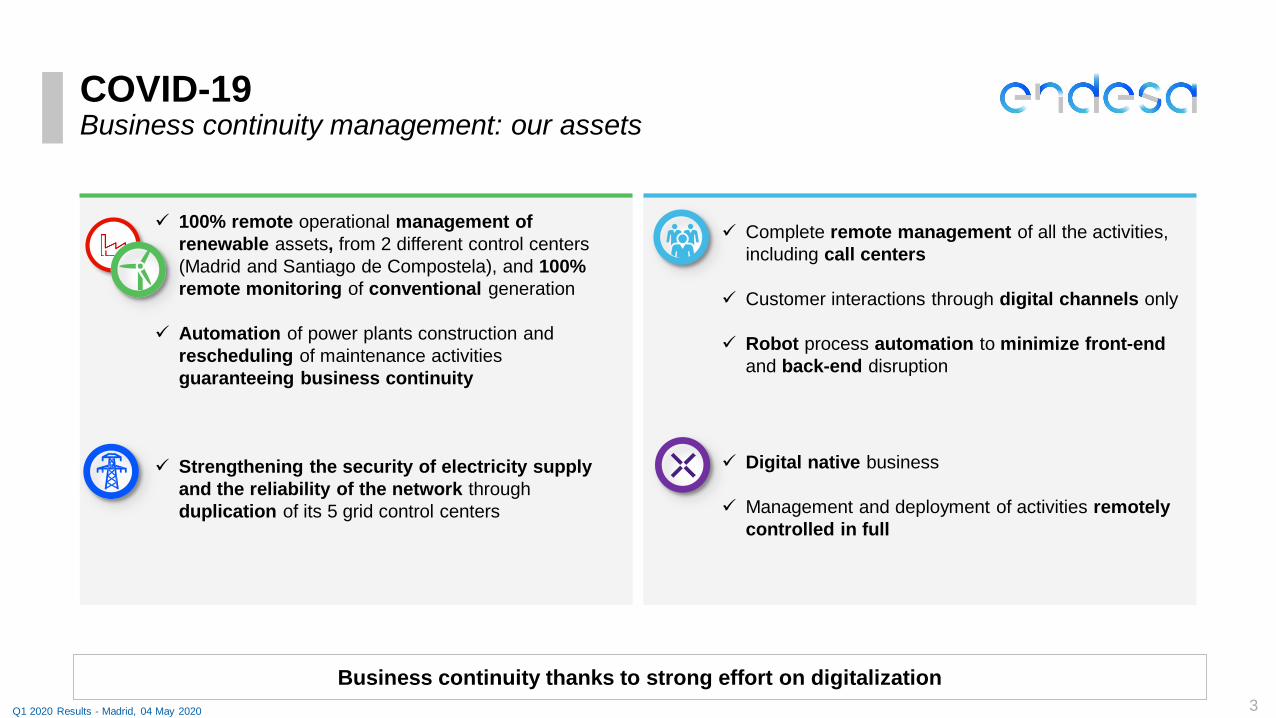
COVID-19Business continuity management: our assets
3
✓ 100% remote operational management of
renewable assets, from 2 different control centers
(Madrid and Santiago de Compostela), and 100%
remote monitoring of conventional generation
✓ Automation of power plants construction and
rescheduling of maintenance activities
guaranteeing business continuity
✓ Strengthening the security of electricity supply
and the reliability of the network through
duplication of its 5 grid control centers
✓ Complete remote management of all the activities,
including call centers
✓ Customer interactions through digital channels only
✓ Robot process automation to minimize front-end
and back-end disruption
✓ Digital native business
✓ Management and deployment of activities remotely
controlled in full
Business continuity thanks to strong effort on digitalization
Q1 2020 Results - Madrid, 04 May 2020 3
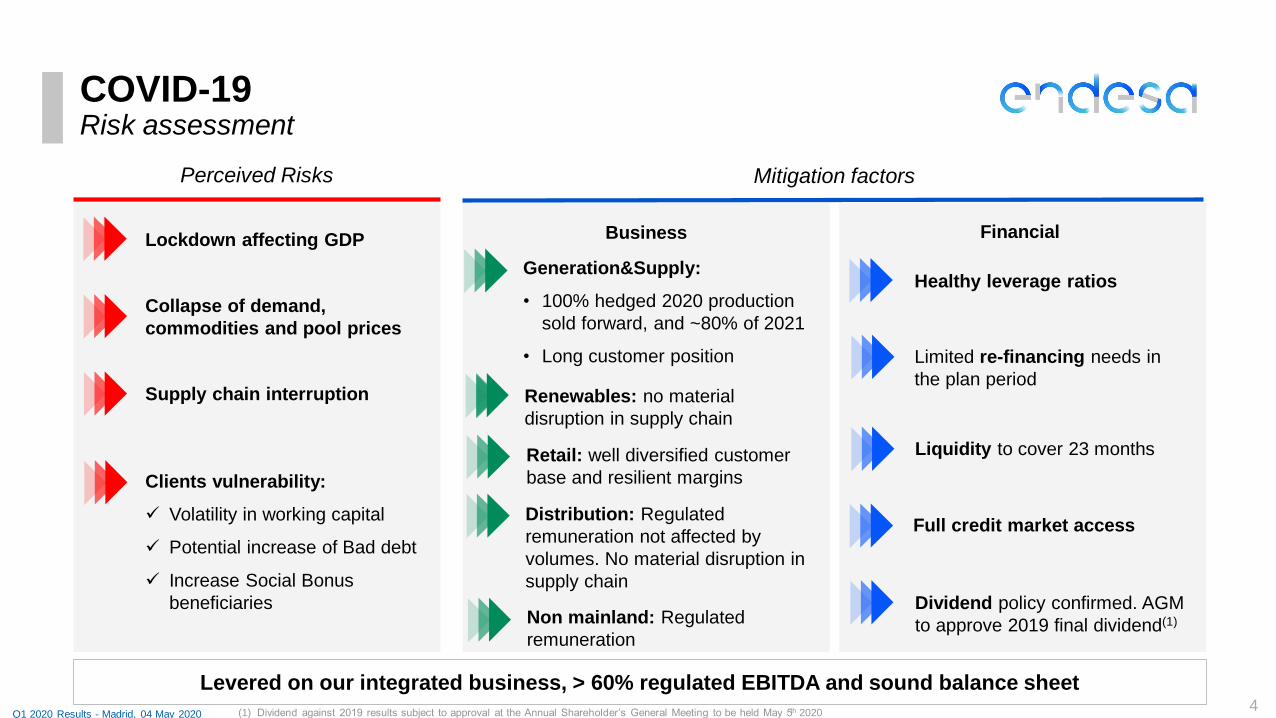
COVID-19Risk assessment
Perceived Risks
Business
Collapse of demand,
commodities and pool prices
Generation&Supply:
• 100% hedged 2020 production
sold forward, and ~80% of 2021
• Long customer position
Renewables: no material
disruption in supply chain
Distribution: Regulated
remuneration not affected by
volumes. No material disruption in
supply chain
Limited re-financing needs in
the plan period
Liquidity to cover 23 monthsRetail: well diversified customer
base and resilient margins
Levered on our integrated business, > 60% regulated EBITDA and sound balance sheet
Dividend policy confirmed. AGM
to approve 2019 final dividend(1)Non mainland: Regulated
remuneration
Full credit market access
Mitigation factors
Financial
Supply chain interruption
Clients vulnerability:
✓ Volatility in working capital
✓ Potential increase of Bad debt
✓ Increase Social Bonus
beneficiaries
Lockdown affecting GDP
Healthy leverage ratios
Q1 2020 Results - Madrid, 04 May 2020 (1) Dividend against 2019 results subject to approval at the Annual Shareholder’s General Meeting to be held May 5th 20204
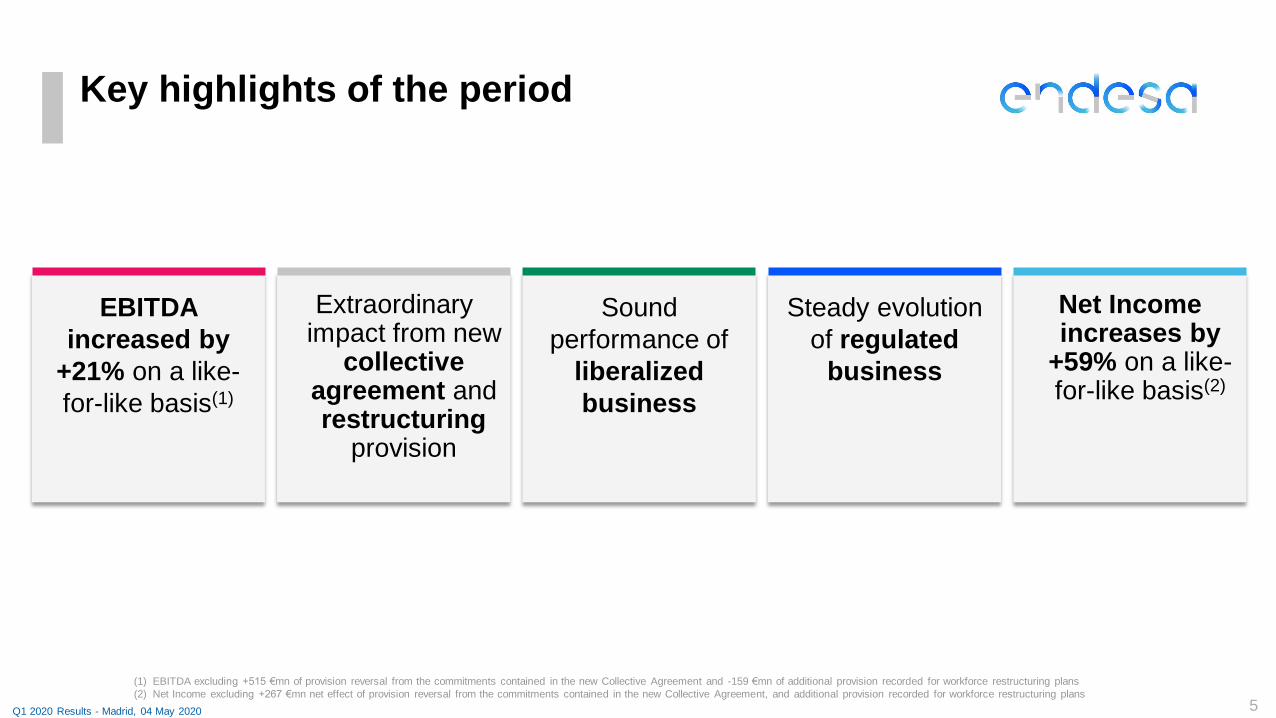
EBITDA
increased by
+21% on a like-
for-like basis(1)
Sound
performance of
liberalized
business
Key highlights of the period
Steady evolution
of regulated
business
Extraordinary impact from new
collective agreement and restructuring
provision
Net Income increases by
+59% on a like-for-like basis(2)
(1) EBITDA excluding +515 €mn of provision reversal from the commitments contained in the new Collective Agreement and -159 €mn of additional provision recorded for workforce restructuring plans
(2) Net Income excluding +267 €mn net effect of provision reversal from the commitments contained in the new Collective Agreement, and additional provision recorded for workforce restructuring plans
Q1 2020 Results - Madrid, 04 May 2020 5
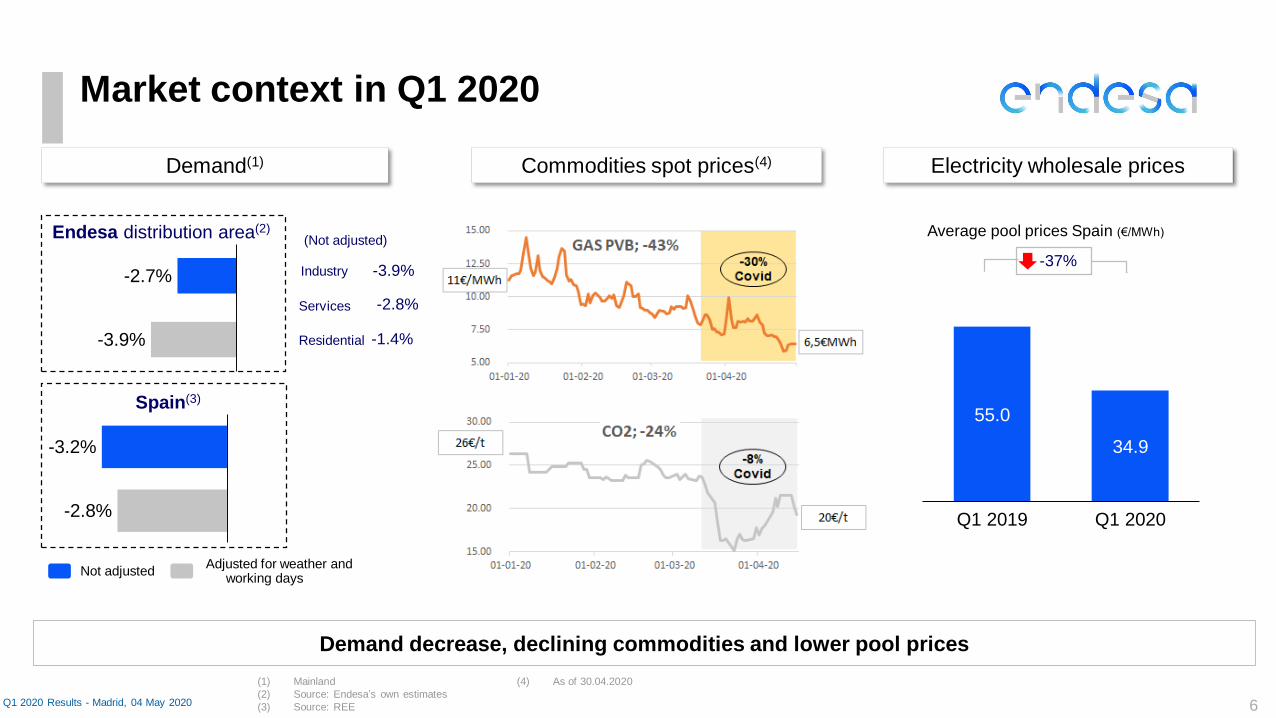
(1) Mainland
(2) Source: Endesa’s own estimates
(3) Source: REE
(4) As of 30.04.2020
Market context in Q1 2020
Q1 2020 Results - Madrid, 04 May 2020
Demand decrease, declining commodities and lower pool prices
Spain(3)
Endesa distribution area(2)
Industry
Residential
Services
-3.9%
-2.8%
-1.4%
(Not adjusted)
6
Demand(1) Commodities spot prices(4)
-2.8%
-3.2%
-2.7%
-3.9%
55.0
Q1 2020Q1 2019
34.9
Average pool prices Spain (€/MWh)
-37%
Electricity wholesale prices
Adjusted for weather and working days
Not adjusted
7
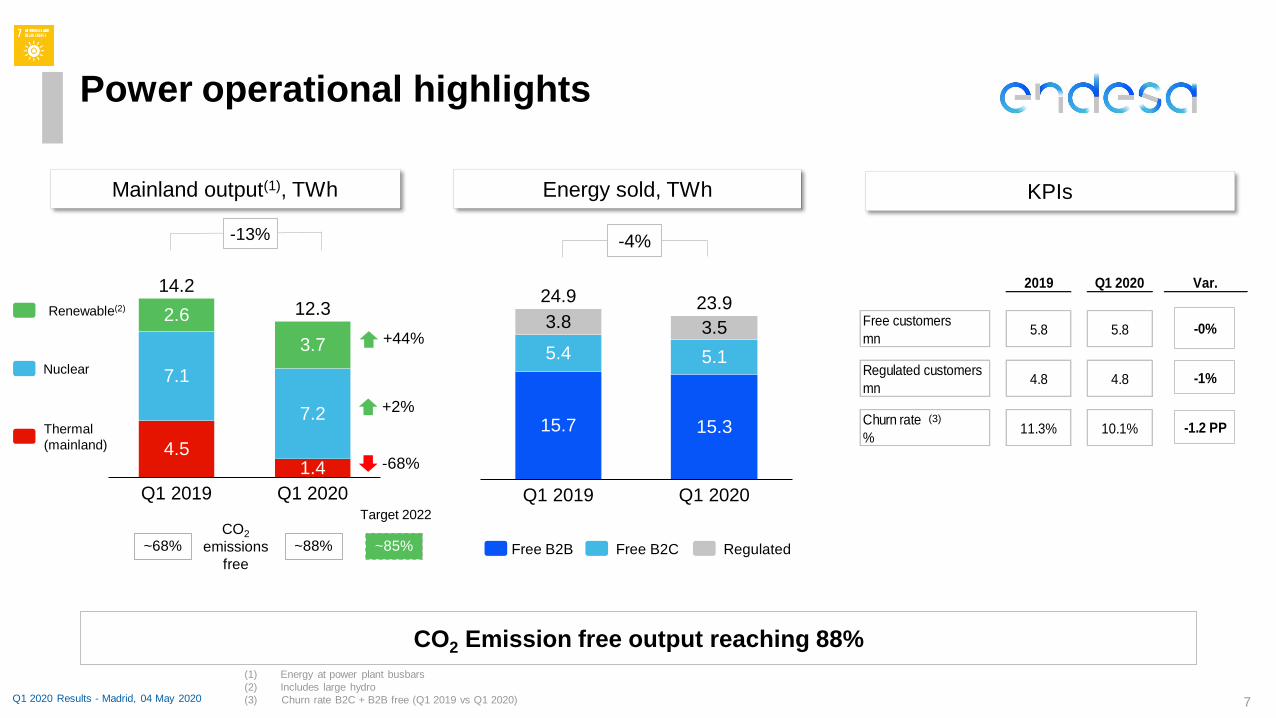
2019 Q1 2020 Var.
Free customers
mn5.8 5.8 -0%
Regulated customers
mn4.8 4.8 -1%
Churn rate
%11.3% 10.1% -1.2 PP
Q1 2020
3.7
2.6
1.4
7.1
7.2
4.5
Q1 2019
14.2
12.3
KPIsEnergy sold, TWh
Power operational highlights
CO2 Emission free output reaching 88%
(1) Energy at power plant busbars
(2) Includes large hydro
(3) Churn rate B2C + B2B free (Q1 2019 vs Q1 2020)
-4%
Free B2B Free B2C Regulated
Q1 2020 Results - Madrid, 04 May 2020
(3)
Mainland output(1), TWh
CO2
emissions
free
~88%~68%
-13%
~85%
Target 2022
-68%
+44%
+2%
Nuclear
Thermal
(mainland)
Renewable(2)
15.3
23.9
15.7
5.4
3.53.8
Q1 2020Q1 2019
5.1
24.9
8
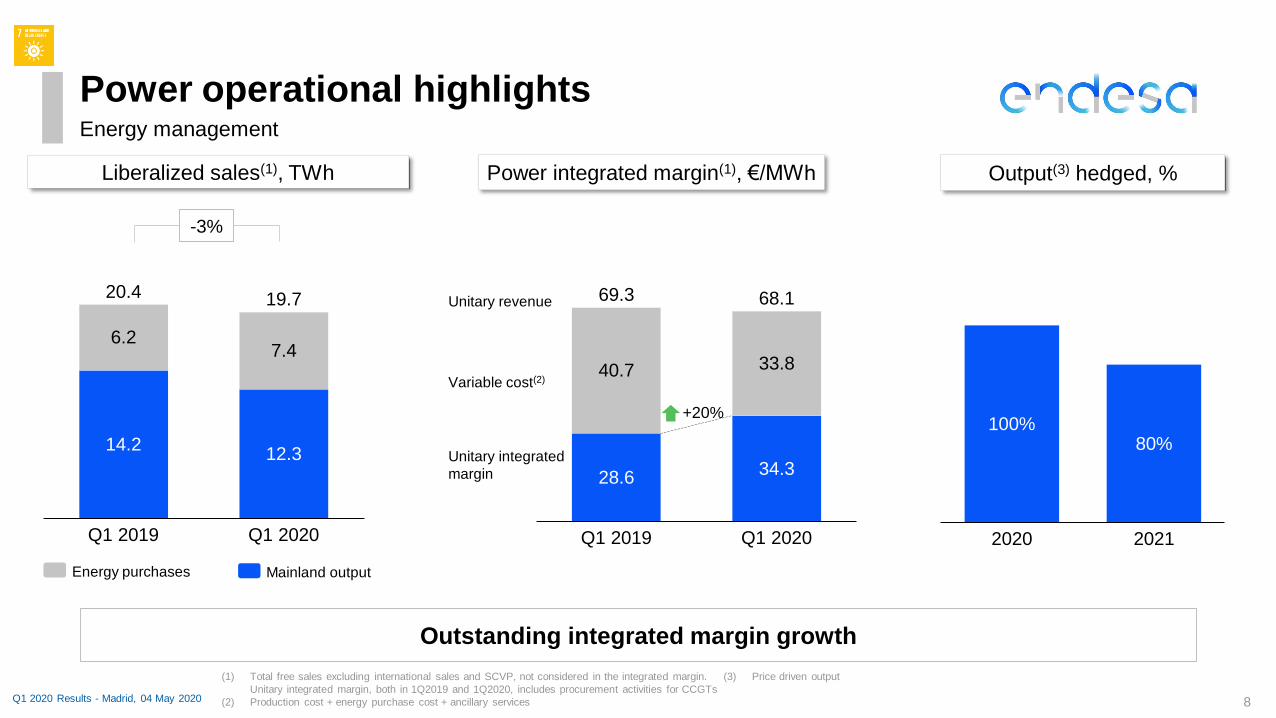
68.1
34.3
40.7 33.8
28.6
Q1 2019 Q1 2020
69.3
+20%
2020
100%
2021
80%
Liberalized sales(1), TWh
Power operational highlightsEnergy management
Outstanding integrated margin growth
-3%
Q1 2020 Results - Madrid, 04 May 2020
Power integrated margin(1), €/MWh
Unitary integrated
margin
Unitary revenue
Energy purchases Mainland output
(1) Total free sales excluding international sales and SCVP, not considered in the integrated margin.
Unitary integrated margin, both in 1Q2019 and 1Q2020, includes procurement activities for CCGTs
(2) Production cost + energy purchase cost + ancillary services
(3) Price driven output
Variable cost(2)
Output(3) hedged, %
14.2
6.2
Q1 2019
12.3
19.7
7.4
20.4
Q1 2020
9
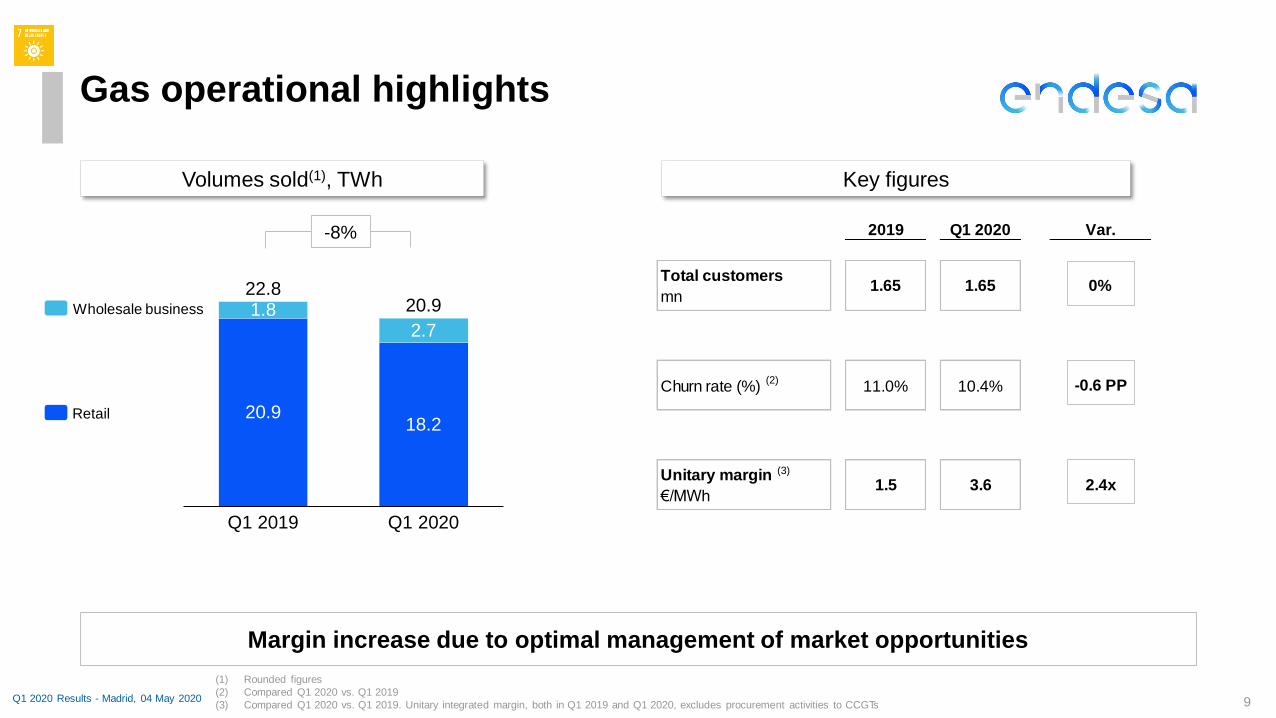
2019 Q1 2020 Var.
Total customers
mn1.65 1.65 0%
Churn rate (%) 11.0% 10.4% -0.6 PP
Unitary margin
€/MWh1.5 3.6 2.4x
Volumes sold(1), TWh Key figures
Gas operational highlights
Margin increase due to optimal management of market opportunities
(1) Rounded figures
(2) Compared Q1 2020 vs. Q1 2019
(3) Compared Q1 2020 vs. Q1 2019. Unitary integrated margin, both in Q1 2019 and Q1 2020, excludes procurement activities to CCGTs
-8%
Retail
(2)
(3)
Wholesale business
Q1 2020 Results - Madrid, 04 May 2020
1.8
Q1 2019
20.918.2
2.7
Q1 2020
22.820.9

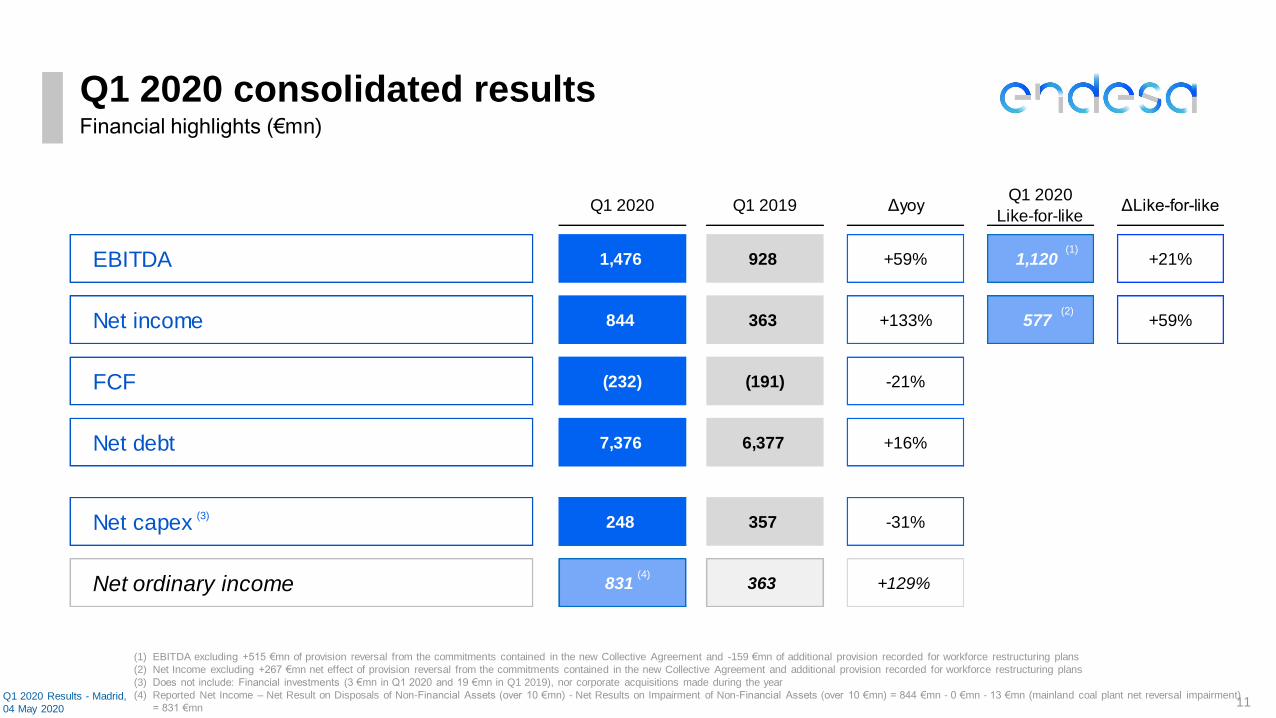
Q1 2020 consolidated results
Financial results
11
Q1 2020 Q1 2019 ΔyoyQ1 2020
Like-for-likeΔLike-for-like
EBITDA 1,476 928 +59% 1,120 +21%
Net income 844 363 +133% 577 +59%
FCF (232) (191) -21%
Net debt 7,376 6,377 +16%
Net capex 248 357 -31%
Net ordinary income 831 363 +129%
Q1 2020 consolidated resultsFinancial highlights (€mn)
Q1 2020 Results - Madrid,
04 May 2020
(1) EBITDA excluding +515 €mn of provision reversal from the commitments contained in the new Collective Agreement and -159 €mn of additional provision recorded for workforce restructuring plans
(2) Net Income excluding +267 €mn net effect of provision reversal from the commitments contained in the new Collective Agreement and additional provision recorded for workforce restructuring plans
(3) Does not include: Financial investments (3 €mn in Q1 2020 and 19 €mn in Q1 2019), nor corporate acquisitions made during the year
(4) Reported Net Income – Net Result on Disposals of Non-Financial Assets (over 10 €mn) - Net Results on Impairment of Non-Financial Assets (over 10 €mn) = 844 €mn - 0 €mn - 13 €mn (mainland coal plant net reversal impairment)
= 831 €mn
(1)
(4)
(2)
(3)
12
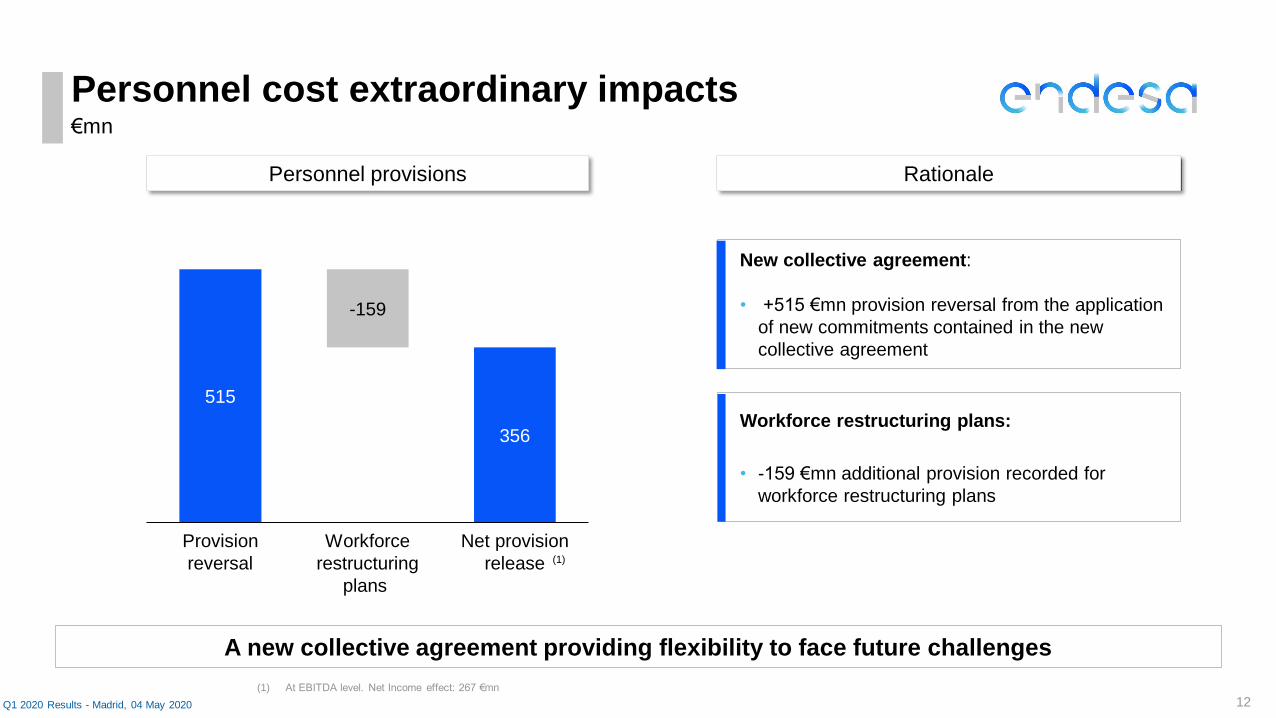
Personnel cost extraordinary impacts€mn
Q1 2020 Results - Madrid, 04 May 2020
Personnel provisions Rationale
515
356
-159
Provision
reversal
Workforce
restructuring
plans
Net provision
release
A new collective agreement providing flexibility to face future challenges
New collective agreement:
• +515 €mn provision reversal from the application
of new commitments contained in the new
collective agreement
Workforce restructuring plans:
• -159 €mn additional provision recorded for
workforce restructuring plans
(1) At EBITDA level. Net Income effect: 267 €mn
(1)

501 489
62
185
81
365
550
Gx+Sx
19
Q1 2019
-12
Q1 2020Dx Non mainland Gx
928
1,120
Like-for-like EBITDA evolution
13
€mn
+21%
+33%
+50%
+96%
DYoY
(reported)
Gx+SxNon mainland GxDistribution
EBITDA improvement mainly supported by liberalized business performance
(1) EBITDA excluding +515 €mn of provision reversal from the commitments contained in the new collective agreement, and -159 €mn of additional provision recorded for workforce restructuring plans
(2) Gx+Sx figures include Generation and Supply business, Corporate Structure, Services and Adjustments and does not include Non-mainland generation
(2)
Q1 2020 Results - Madrid, 04 May
2020
-2%
+31%
+51%
DYoY
(like-for-like)
+21% +59%(1)
501
688
62
94
563
782
1Q 2019 1Q 2020
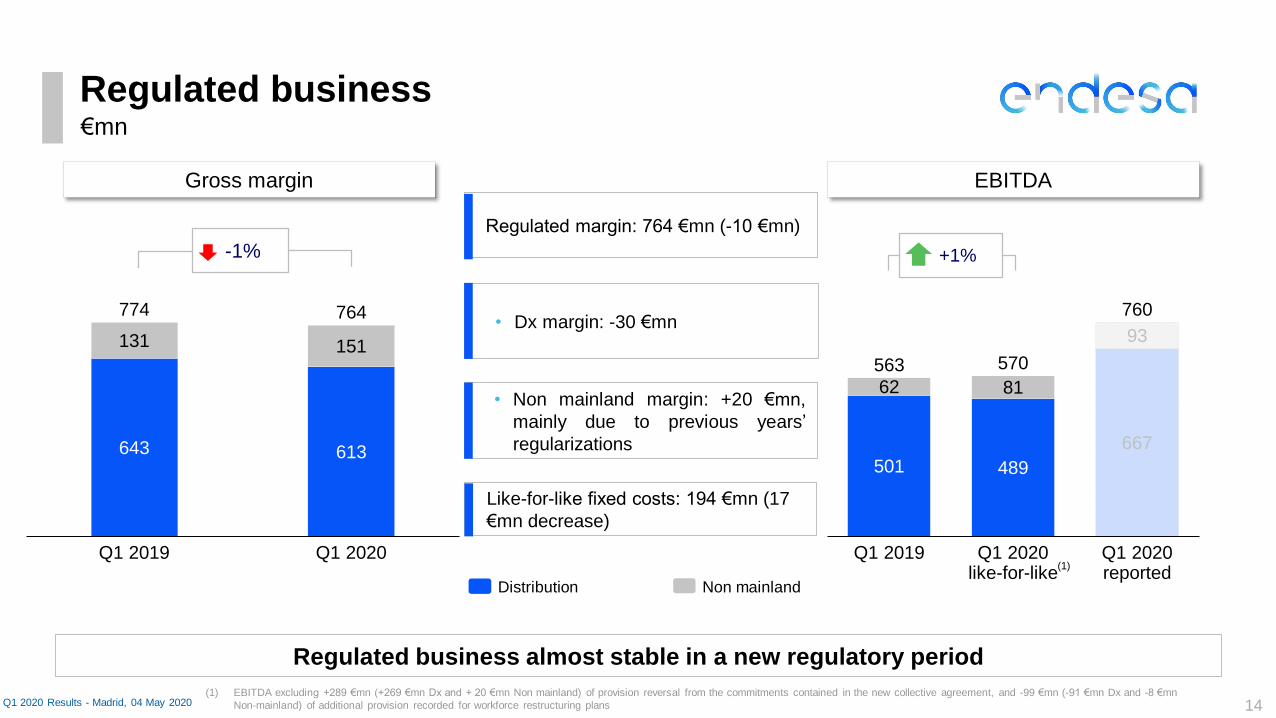
Regulated business
14Q1 2020 Results - Madrid, 04 May 2020
+1%
€mn
Regulated business almost stable in a new regulatory period
Non mainlandDistribution
-1%
Like-for-like fixed costs: 194 €mn (17
€mn decrease)
Regulated margin: 764 €mn (-10 €mn)
• Dx margin: -30 €mn
• Non mainland margin: +20 €mn,
mainly due to previous years’
regularizations
Gross margin EBITDA
643 613
131 151
Q1 2019 Q1 2020
764774
501 489
667
62 81
93
Q1 2020 like-for-like
Q1 2019
563
Q1 2020 reported
570
760
(1) EBITDA excluding +289 €mn (+269 €mn Dx and + 20 €mn Non mainland) of provision reversal from the commitments contained in the new collective agreement, and -99 €mn (-91 €mn Dx and -8 €mn
Non-mainland) of additional provision recorded for workforce restructuring plans
(1)
€mn
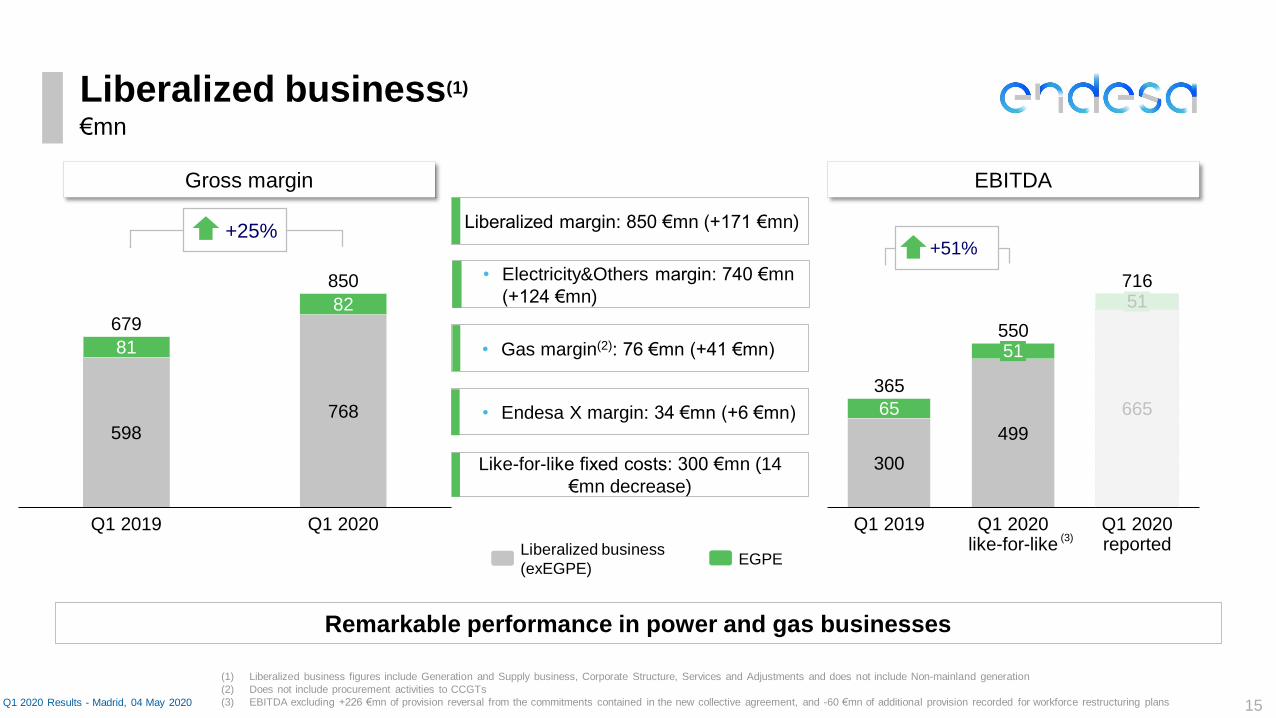
15Q1 2020 Results - Madrid, 04 May 2020
+25%
Liberalized business(1)
EGPELiberalized business
(exEGPE)
(1) Liberalized business figures include Generation and Supply business, Corporate Structure, Services and Adjustments and does not include Non-mainland generation
(2) Does not include procurement activities to CCGTs
(3) EBITDA excluding +226 €mn of provision reversal from the commitments contained in the new collective agreement, and -60 €mn of additional provision recorded for workforce restructuring plans
Remarkable performance in power and gas businesses
Like-for-like fixed costs: 300 €mn (14
€mn decrease)
Liberalized margin: 850 €mn (+171 €mn)
• Electricity&Others margin: 740 €mn
(+124 €mn)
• Gas margin(2): 76 €mn (+41 €mn)
• Endesa X margin: 34 €mn (+6 €mn)
Gross margin EBITDA
300
499
66565
Q1 2020 like-for-like
Q1 2019 Q1 2020 reported
51
51
365
550
716
598768
81
82
Q1 2019 Q1 2020
850
679
+51%
(3)
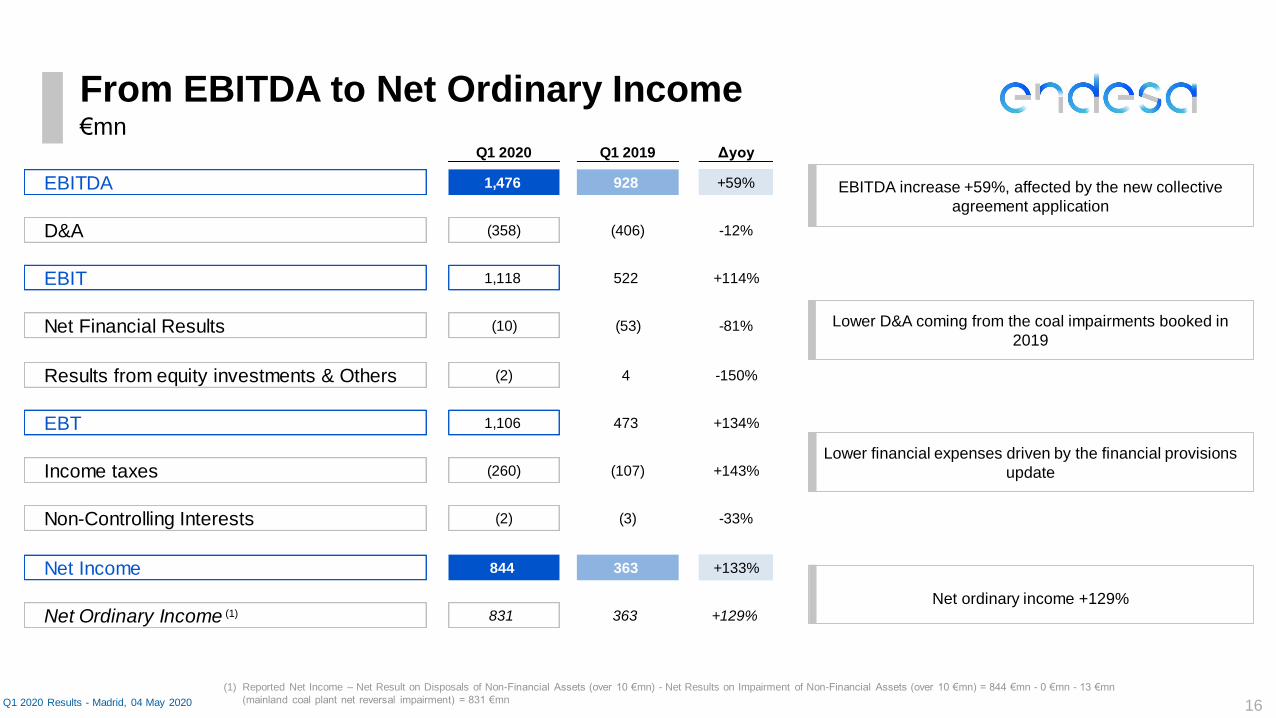
Q1 2020 Q1 2019 Δyoy
EBITDA 1,476 928 +59%
D&A (358) (406) -12%
EBIT 1,118 522 +114%
Net Financial Results (10) (53) -81%
Results from equity investments & Others (2) 4 -150%
EBT 1,106 473 +134%
Income taxes (260) (107) +143%
Non-Controlling Interests (2) (3) -33%
Net Income 844 363 +133%
Net Ordinary Income 831 363 +129%
From EBITDA to Net Ordinary Income
16Q1 2020 Results - Madrid, 04 May 2020
€mn
(1) Reported Net Income – Net Result on Disposals of Non-Financial Assets (over 10 €mn) - Net Results on Impairment of Non-Financial Assets (over 10 €mn) = 844 €mn - 0 €mn - 13 €mn
(mainland coal plant net reversal impairment) = 831 €mn
EBITDA increase +59%, affected by the new collective
agreement application
Lower D&A coming from the coal impairments booked in
2019
Lower financial expenses driven by the financial provisions
update
Net ordinary income +129%(1)
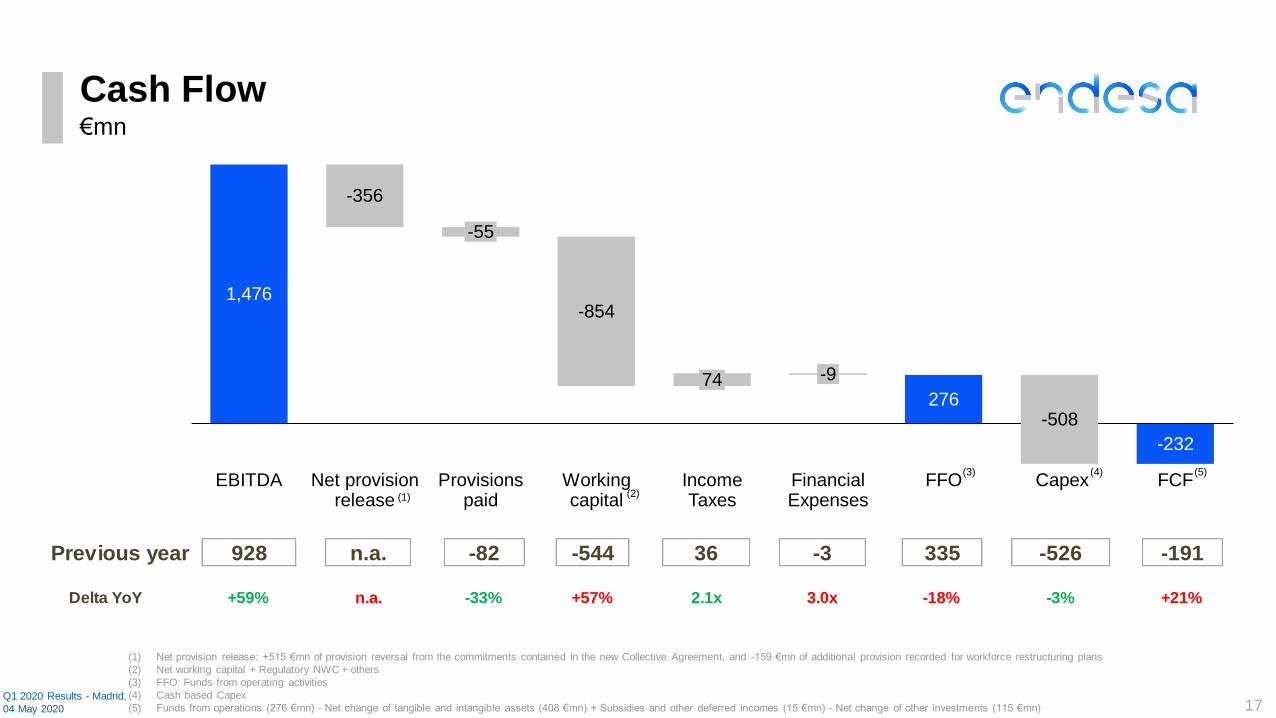
Previous year 928 n.a. -82 -544 36 -3 335 -526 -191
Delta YoY +59% n.a. -33% +57% 2.1x 3.0x -18% -3% +21%
276
-232
Net provision release
Provisions paid
1,476
Working capital
EBITDA
-356
-854
-55
74
Income Taxes
Capex
-9
Financial Expenses
FFO
-508
FCF
Cash Flow
17Q1 2020 Results - Madrid,
04 May 2020
€mn
(1) Net provision release: +515 €mn of provision reversal from the commitments contained in the new Collective Agreement, and -159 €mn of additional provision recorded for workforce restructuring plans
(2) Net working capital + Regulatory NWC + others
(3) FFO: Funds from operating activities
(4) Cash based Capex
(5) Funds from operations (276 €mn) - Net change of tangible and intangible assets (408 €mn) + Subsidies and other deferred incomes (15 €mn) - Net change of other investments (115 €mn)
(2)
(3) (4) (5)
(1)
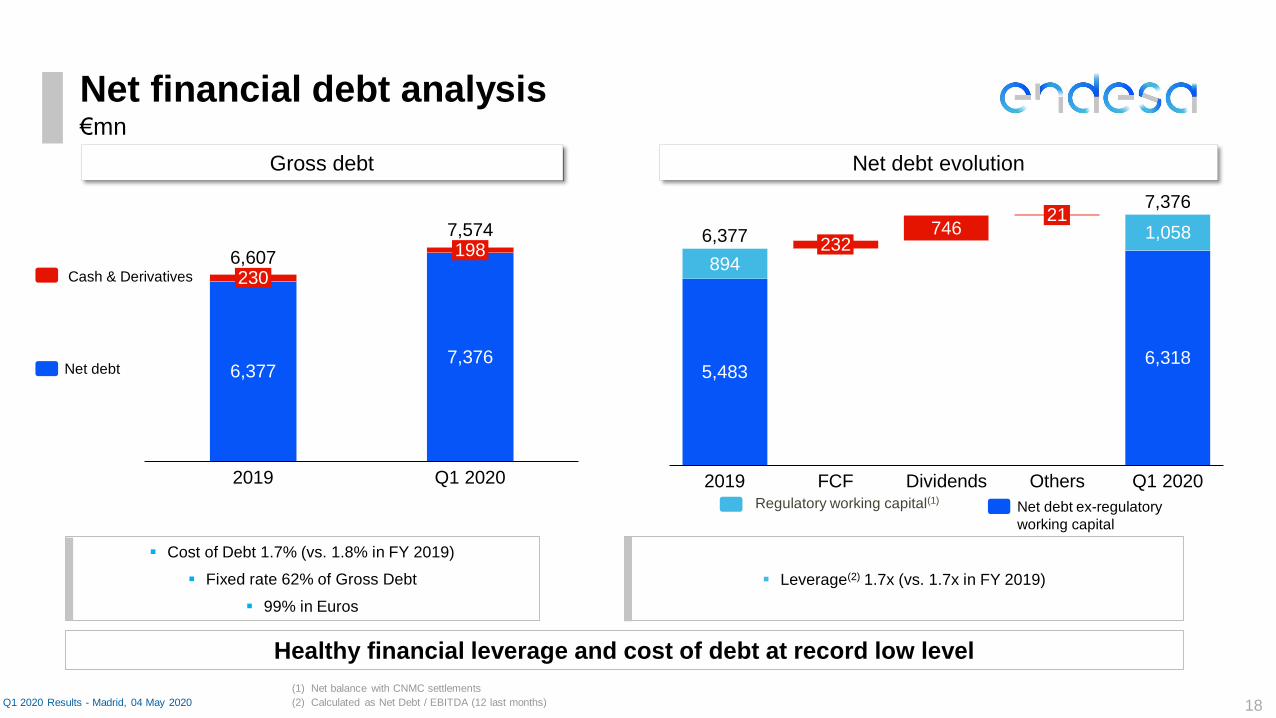
(1) Net balance with CNMC settlements
(2) Calculated as Net Debt / EBITDA (12 last months)
Net financial debt analysis
18Q1 2020 Results - Madrid, 04 May 2020
€mn
Healthy financial leverage and cost of debt at record low level
Net debt
Cash & Derivatives
▪ Leverage(2) 1.7x (vs. 1.7x in FY 2019)
▪ Cost of Debt 1.7% (vs. 1.8% in FY 2019)
▪ Fixed rate 62% of Gross Debt
▪ 99% in Euros
Gross debt Net debt evolution
7,574
7,3766,377
2306,607
2019
198
Q1 2020
894
746
FCF Others
5,483
Q1 20202019
232
Dividends
21
6,318
1,0586,377
7,376
Net debt ex-regulatory
working capital
Regulatory working capital(1)
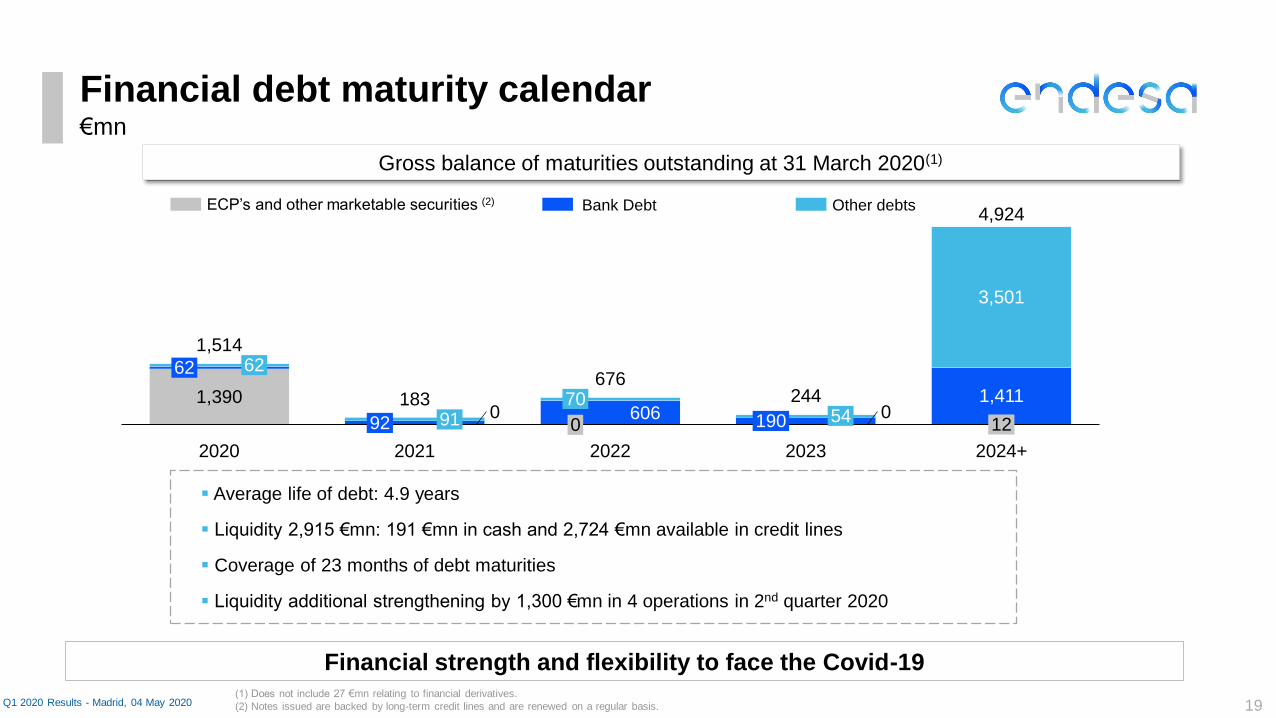
606
62
1,390
62
2020
91920
2021
70
0 12
2022
541900
2023
3,501
1,411
2024+
1,514
183676
244
4,924
(1) Does not include 27 €mn relating to financial derivatives.
(2) Notes issued are backed by long-term credit lines and are renewed on a regular basis.
Bank DebtECP’s and other marketable securities (2) Other debts
Financial debt maturity calendar
19Q1 2020 Results - Madrid, 04 May 2020
▪ Average life of debt: 4.9 years
▪ Liquidity 2,915 €mn: 191 €mn in cash and 2,724 €mn available in credit lines
▪ Coverage of 23 months of debt maturities
▪ Liquidity additional strengthening by 1,300 €mn in 4 operations in 2nd quarter 2020
€mn
Gross balance of maturities outstanding at 31 March 2020(1)
Financial strength and flexibility to face the Covid-19
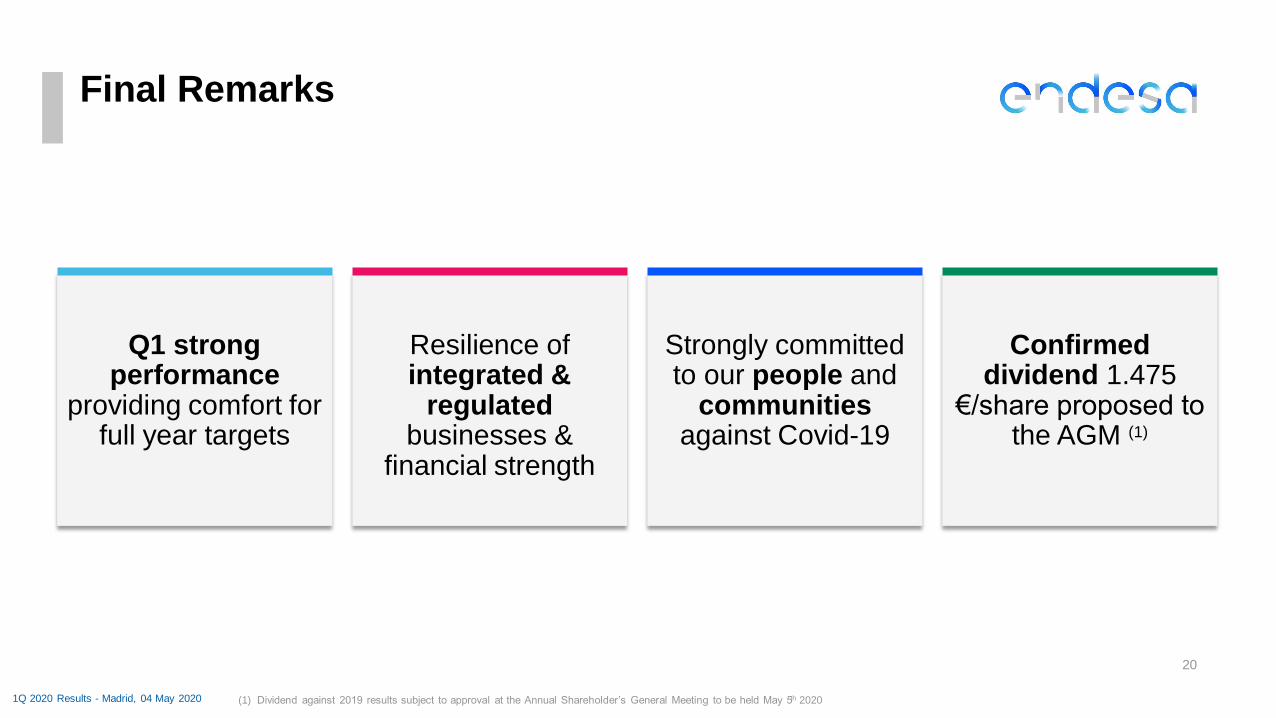
Final Remarks
20
Strongly committed to our people and
communitiesagainst Covid-19
Resilience of integrated &
regulated businesses &
financial strength
Confirmed dividend 1.475
€/share proposed to the AGM (1)
Q1 strong performance
providing comfort for full year targets
1Q 2020 Results - Madrid, 04 May 2020 (1) Dividend against 2019 results subject to approval at the Annual Shareholder’s General Meeting to be held May 5th 2020

Q1 2020 consolidated results
Annexes
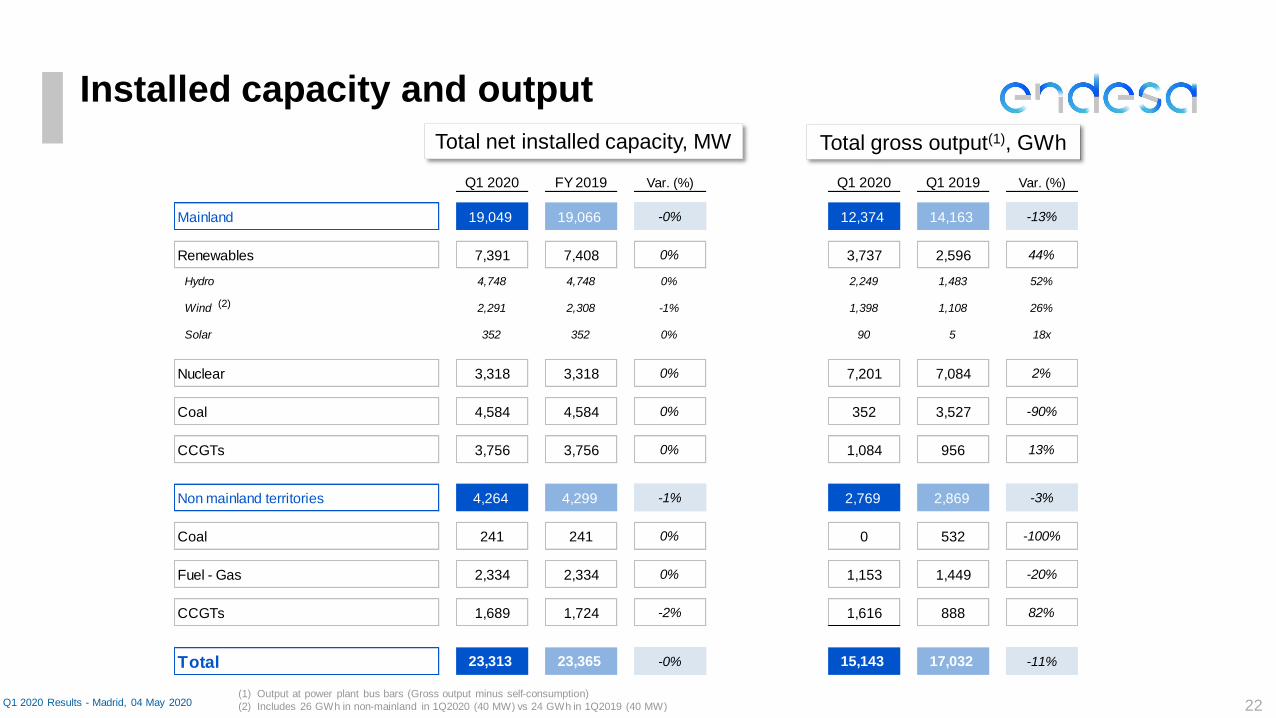
Q1 2020 FY 2019 Var. (%) Q1 2020 Q1 2019 Var. (%)
Mainland 19,049 19,066 -0% 12,374 14,163 -13%
Renewables 7,391 7,408 0% 3,737 2,596 44%
Hydro 4,748 4,748 0% 2,249 1,483 52%
Wind 2,291 2,308 -1% 1,398 1,108 26%
Solar 352 352 0% 90 5 18x
Nuclear 3,318 3,318 0% 7,201 7,084 2%
Coal 4,584 4,584 0% 352 3,527 -90%
CCGTs 3,756 3,756 0% 1,084 956 13%
Non mainland territories 4,264 4,299 -1% 2,769 2,869 -3%
Coal 241 241 0% 0 532 -100%
Fuel - Gas 2,334 2,334 0% 1,153 1,449 -20%
CCGTs 1,689 1,724 -2% 1,616 888 82%
Total 23,313 23,365 -0% 15,143 17,032 -11%
(1) Output at power plant bus bars (Gross output minus self-consumption)
(2) Includes 26 GWh in non-mainland in 1Q2020 (40 MW) vs 24 GWh in 1Q2019 (40 MW)
Installed capacity and output
22Q1 2020 Results - Madrid, 04 May 2020
Total net installed capacity, MW Total gross output(1), GWh
(2)
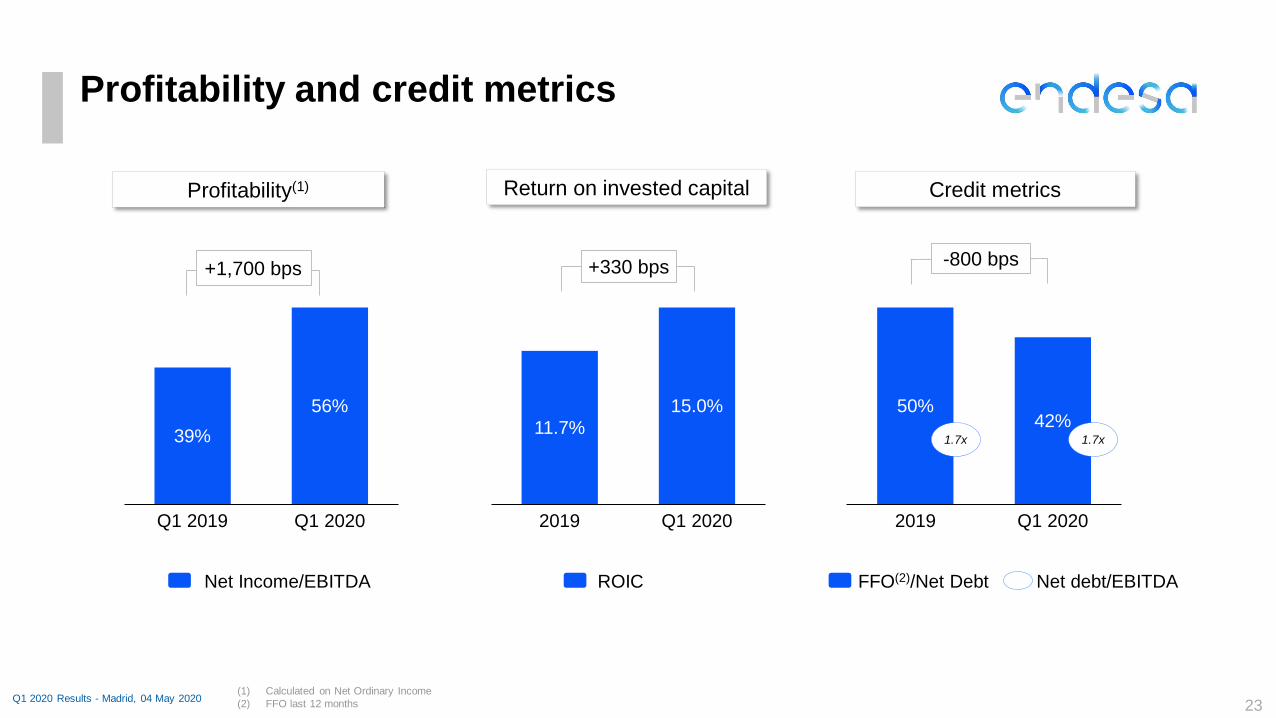
39%
Q1 2019 Q1 2020
56%
11.7%
2019
15.0%
Q1 2020
50%
2019
42%
Q1 2020
Profitability and credit metrics
+1,700 bps-800 bps+330 bps
(1) Calculated on Net Ordinary Income
(2) FFO last 12 months
Net Income/EBITDA
1.7x 1.7x
FFO(2)/Net Debt Net debt/EBITDAROIC
Q1 2020 Results - Madrid, 04 May 202023
Profitability(1) Return on invested capital Credit metrics
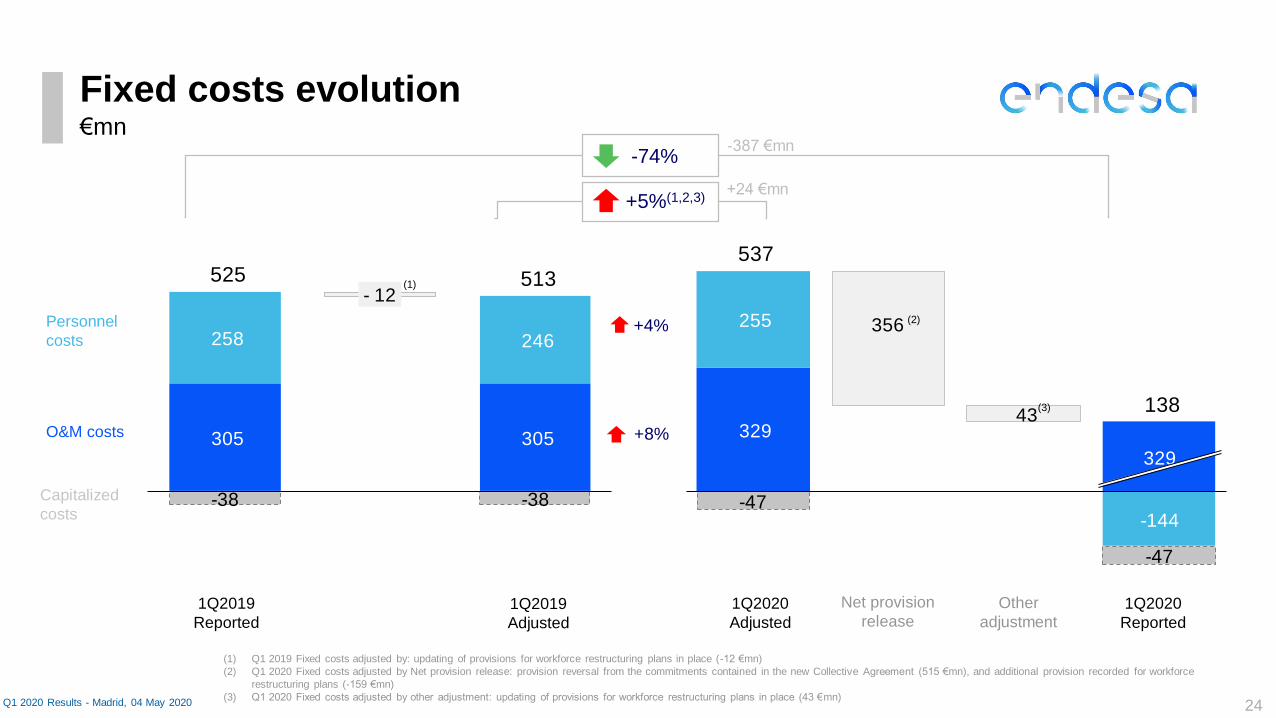
305 305
258
- 12
246
-38 -38
525 513
329
329
255 356
43
-144 -47
-47
537
138
Fixed costs evolution
O&M costs
Personnel
costs
Capitalized
costs
-74%
+5%(1,2,3)
+8%
Q1 2020 Results - Madrid, 04 May 2020
+4%
(1) Q1 2019 Fixed costs adjusted by: updating of provisions for workforce restructuring plans in place (-12 €mn)
(2) Q1 2020 Fixed costs adjusted by Net provision release: provision reversal from the commitments contained in the new Collective Agreement (515 €mn), and additional provision recorded for workforce
restructuring plans (-159 €mn)
(3) Q1 2020 Fixed costs adjusted by other adjustment: updating of provisions for workforce restructuring plans in place (43 €mn)
€mn-387 €mn
+24 €mn
24
(1)
1Q2019
Reported
1Q2019
Adjusted
1Q2020
Adjusted
1Q2020
Reported
(2)
(3)
Net provision
releaseOther
adjustment
25
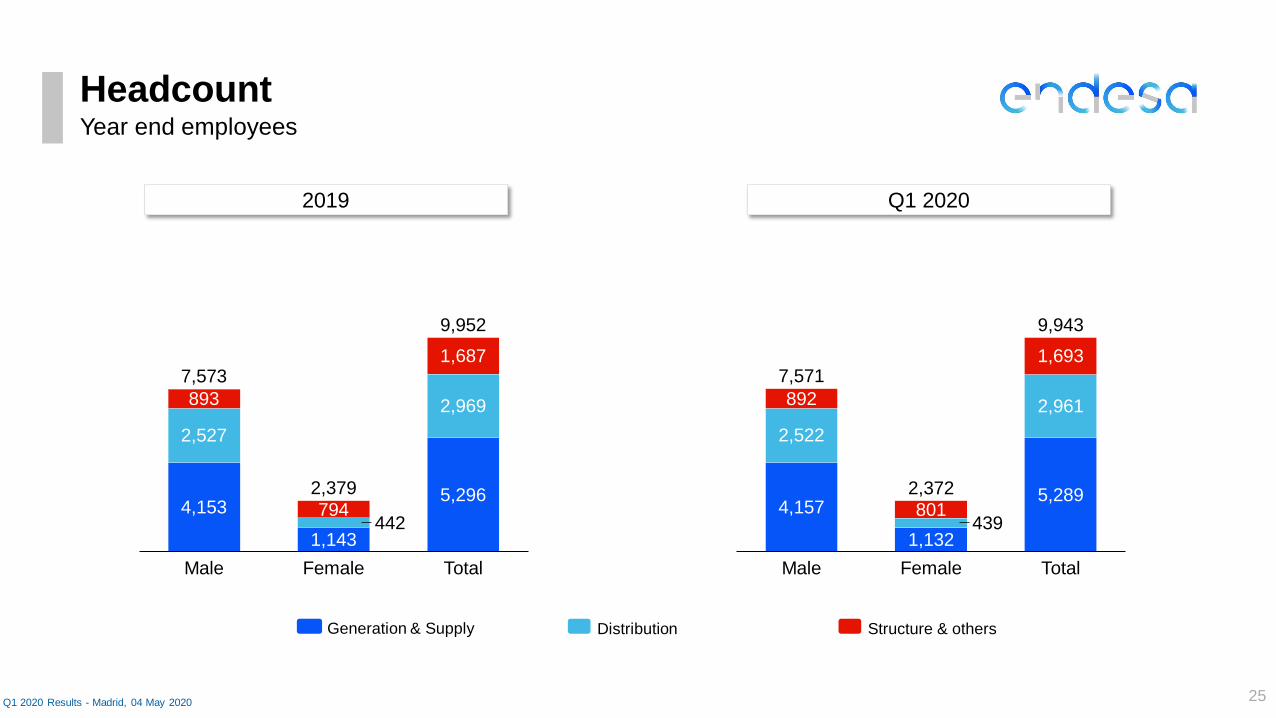
Headcount
Q1 2020 Results - Madrid, 04 May 2020
Distribution Structure & othersGeneration & Supply
Year end employees
2019 Q1 2020
442
893
7945,296
4,153
2,527
2,969
Male Female
1,143
1,687
9,952
Total
7,573
2,379
439
892
801
2,961
4,157
Total
1,132
2,522
5,289
Male
9,943
Female
1,6937,571
2,372
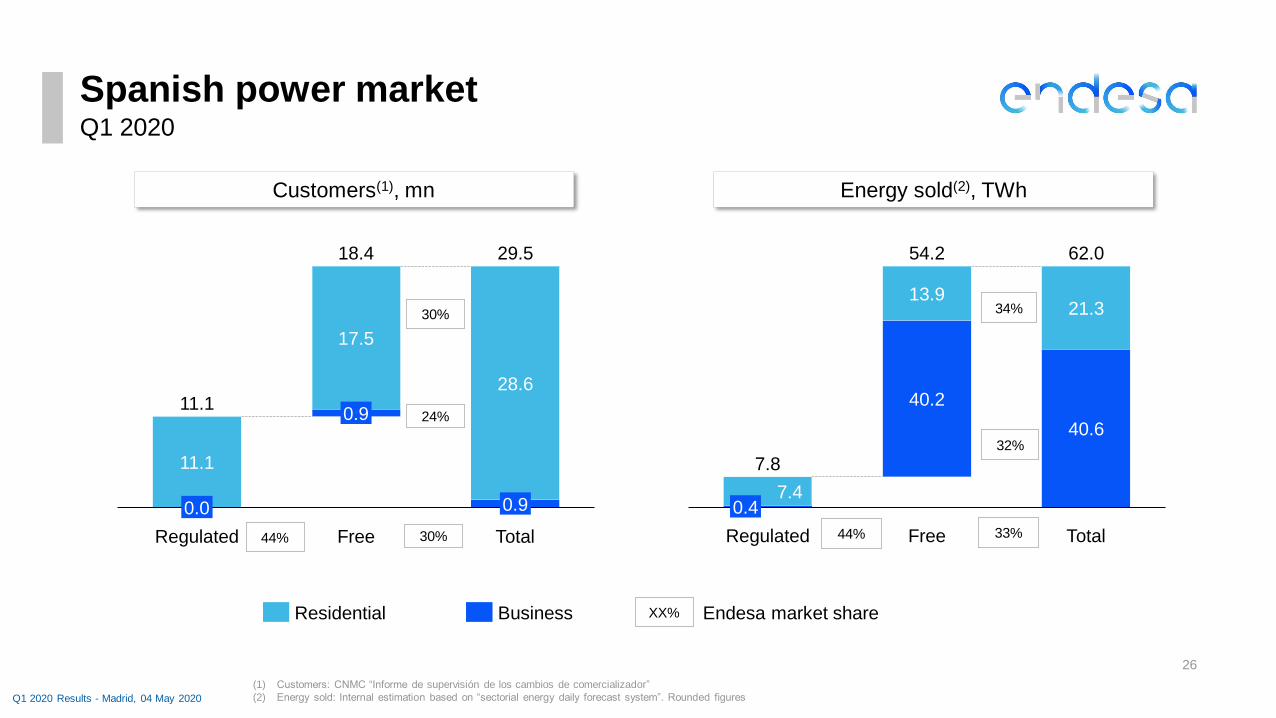
Spanish power market
26
Q1 2020
(1) Customers: CNMC “Informe de supervisión de los cambios de comercializador”
(2) Energy sold: Internal estimation based on “sectorial energy daily forecast system”. Rounded figuresQ1 2020 Results - Madrid, 04 May 2020
Customers(1), mn Energy sold(2), TWh
0.9
11.1
0.0 0.9
Total
17.5
Regulated
28.6
Free
11.1
18.4 29.5
7.8
7.4
62.0
0.4
Regulated
13.9
Free
40.2
40.6
21.3
Total
54.2
BusinessResidential XX% Endesa market share
30%44%
30%
24%
33%44%
32%
34%
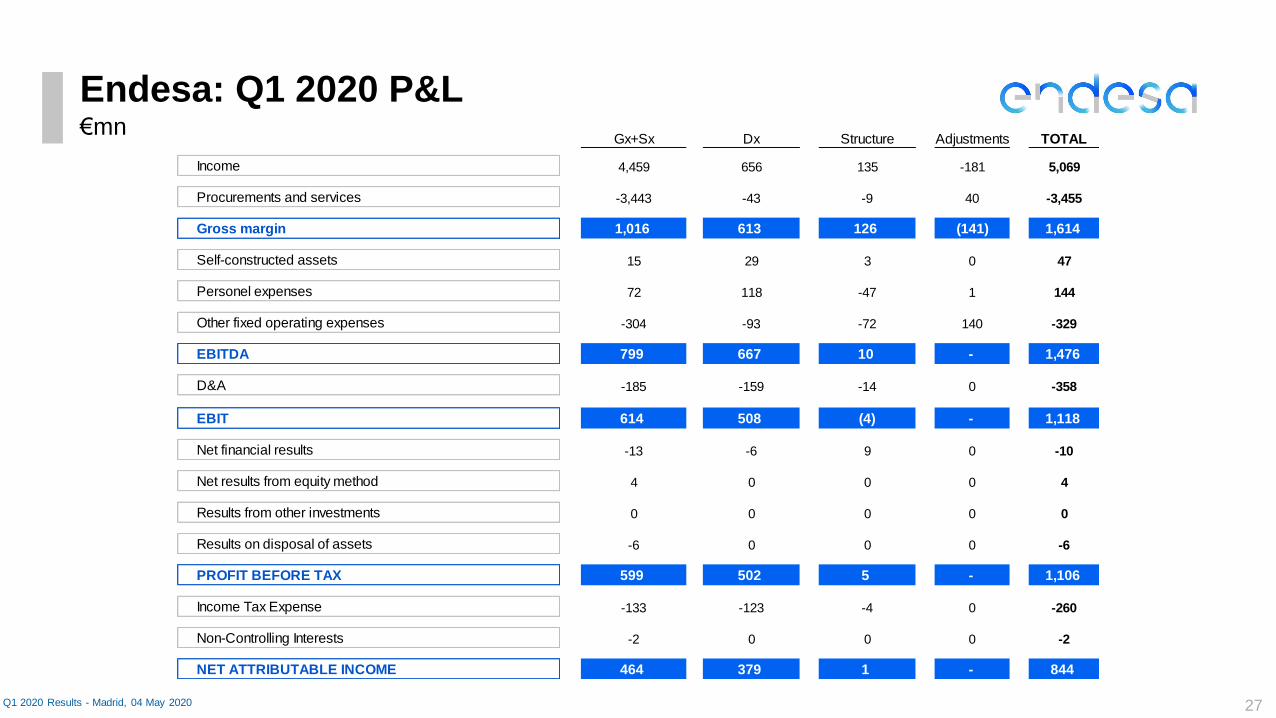
Gx+Sx Dx Structure Adjustments TOTAL
Income 4,459 656 135 -181 5,069
Procurements and services -3,443 -43 -9 40 -3,455
Gross margin 1,016 613 126 (141) 1,614
Self-constructed assets 15 29 3 0 47
Personel expenses 72 118 -47 1 144
Other fixed operating expenses -304 -93 -72 140 -329
EBITDA 799 667 10 - 1,476
D&A -185 -159 -14 0 -358
EBIT 614 508 (4) - 1,118
Net financial results -13 -6 9 0 -10
Net results from equity method 4 0 0 0 4
Results from other investments 0 0 0 0 0
Results on disposal of assets -6 0 0 0 -6
PROFIT BEFORE TAX 599 502 5 - 1,106
Income Tax Expense -133 -123 -4 0 -260
Non-Controlling Interests -2 0 0 0 -2
NET ATTRIBUTABLE INCOME 464 379 1 - 844
Endesa: Q1 2020 P&L
27Q1 2020 Results - Madrid, 04 May 2020
€mn
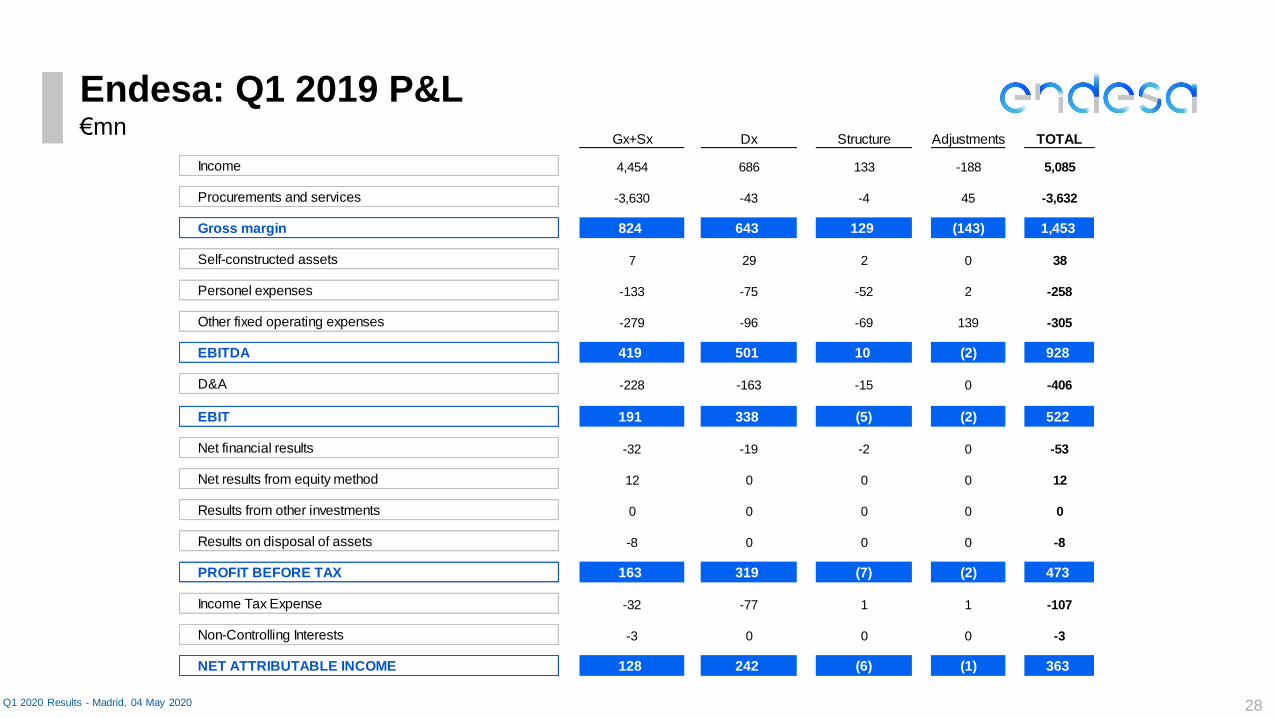
Gx+Sx Dx Structure Adjustments TOTAL
Income 4,454 686 133 -188 5,085
Procurements and services -3,630 -43 -4 45 -3,632
Gross margin 824 643 129 (143) 1,453
Self-constructed assets 7 29 2 0 38
Personel expenses -133 -75 -52 2 -258
Other fixed operating expenses -279 -96 -69 139 -305
EBITDA 419 501 10 (2) 928
D&A -228 -163 -15 0 -406
EBIT 191 338 (5) (2) 522
Net financial results -32 -19 -2 0 -53
Net results from equity method 12 0 0 0 12
Results from other investments 0 0 0 0 0
Results on disposal of assets -8 0 0 0 -8
PROFIT BEFORE TAX 163 319 (7) (2) 473
Income Tax Expense -32 -77 1 1 -107
Non-Controlling Interests -3 0 0 0 -3
NET ATTRIBUTABLE INCOME 128 242 (6) (1) 363
Endesa: Q1 2019 P&L
28Q1 2020 Results - Madrid, 04 May 2020
€mn
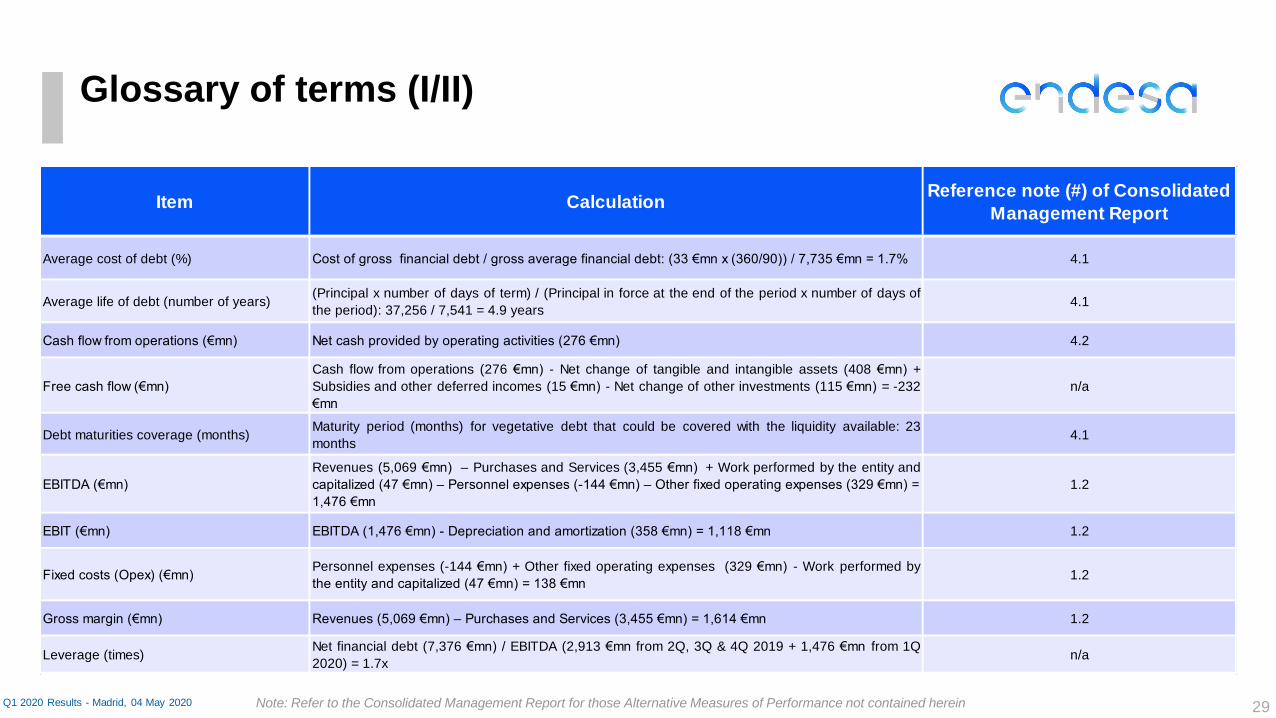
Item CalculationReference note (#) of Consolidated
Management Report
Average cost of debt (%) Cost of gross financial debt / gross average financial debt: (33 €mn x (360/90)) / 7,735 €mn = 1.7% 4.1
Average life of debt (number of years)(Principal x number of days of term) / (Principal in force at the end of the period x number of days of
the period): 37,256 / 7,541 = 4.9 years4.1
Cash flow from operations (€mn) Net cash provided by operating activities (276 €mn) 4.2
Free cash flow (€mn)
Cash flow from operations (276 €mn) - Net change of tangible and intangible assets (408 €mn) +
Subsidies and other deferred incomes (15 €mn) - Net change of other investments (115 €mn) = -232
€mn
n/a
Debt maturities coverage (months)Maturity period (months) for vegetative debt that could be covered with the liquidity available: 23
months4.1
EBITDA (€mn)
Revenues (5,069 €mn) – Purchases and Services (3,455 €mn) + Work performed by the entity and
capitalized (47 €mn) – Personnel expenses (-144 €mn) – Other fixed operating expenses (329 €mn) =
1,476 €mn
1.2
EBIT (€mn) EBITDA (1,476 €mn) - Depreciation and amortization (358 €mn) = 1,118 €mn 1.2
Fixed costs (Opex) (€mn)Personnel expenses (-144 €mn) + Other fixed operating expenses (329 €mn) - Work performed by
the entity and capitalized (47 €mn) = 138 €mn1.2
Gross margin (€mn) Revenues (5,069 €mn) – Purchases and Services (3,455 €mn) = 1,614 €mn 1.2
Leverage (times)Net financial debt (7,376 €mn) / EBITDA (2,913 €mn from 2Q, 3Q & 4Q 2019 + 1,476 €mn from 1Q
2020) = 1.7xn/a
29
Glossary of terms (I/II)
Q1 2020 Results - Madrid, 04 May 2020 Note: Refer to the Consolidated Management Report for those Alternative Measures of Performance not contained herein
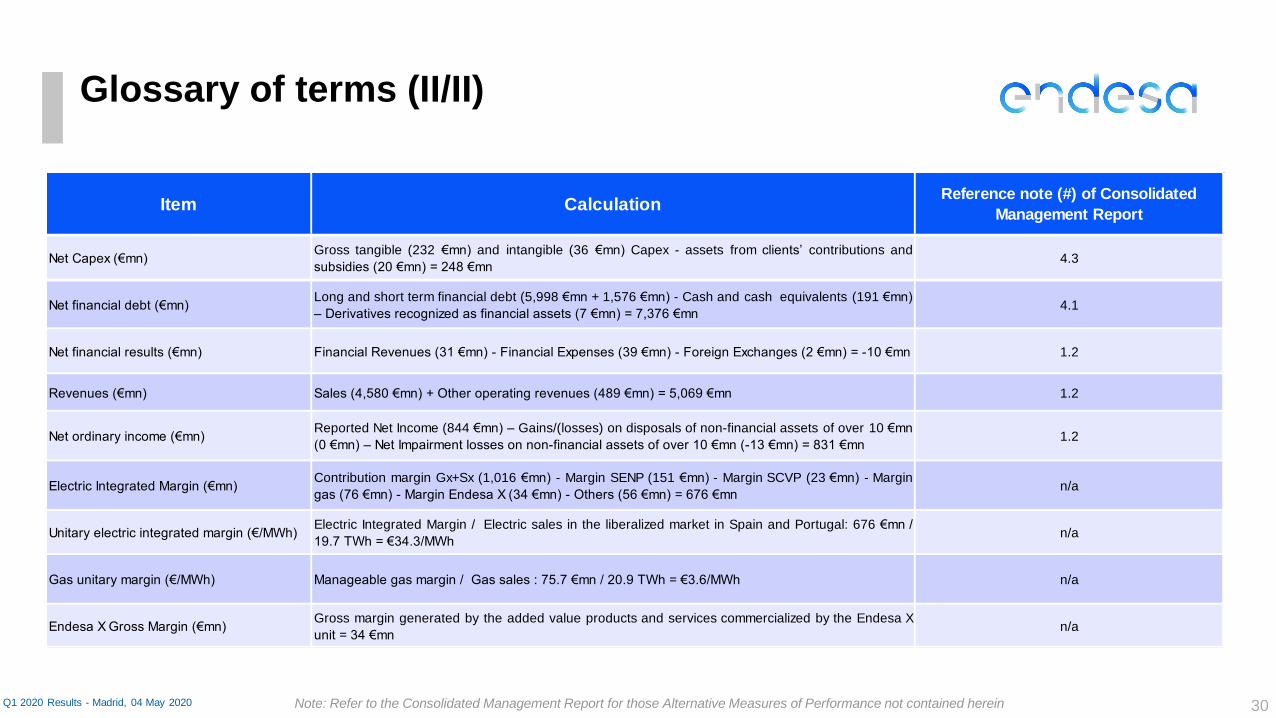
Item CalculationReference note (#) of Consolidated
Management Report
Net Capex (€mn)Gross tangible (232 €mn) and intangible (36 €mn) Capex - assets from clients’ contributions and
subsidies (20 €mn) = 248 €mn4.3
Net financial debt (€mn)Long and short term financial debt (5,998 €mn + 1,576 €mn) - Cash and cash equivalents (191 €mn)
– Derivatives recognized as financial assets (7 €mn) = 7,376 €mn4.1
Net financial results (€mn) Financial Revenues (31 €mn) - Financial Expenses (39 €mn) - Foreign Exchanges (2 €mn) = -10 €mn 1.2
Revenues (€mn) Sales (4,580 €mn) + Other operating revenues (489 €mn) = 5,069 €mn 1.2
Net ordinary income (€mn)Reported Net Income (844 €mn) – Gains/(losses) on disposals of non-financial assets of over 10 €mn
(0 €mn) – Net Impairment losses on non-financial assets of over 10 €mn (-13 €mn) = 831 €mn1.2
Electric Integrated Margin (€mn)Contribution margin Gx+Sx (1,016 €mn) - Margin SENP (151 €mn) - Margin SCVP (23 €mn) - Margin
gas (76 €mn) - Margin Endesa X (34 €mn) - Others (56 €mn) = 676 €mnn/a
Unitary electric integrated margin (€/MWh)Electric Integrated Margin / Electric sales in the liberalized market in Spain and Portugal: 676 €mn /
19.7 TWh = €34.3/MWhn/a
Gas unitary margin (€/MWh) Manageable gas margin / Gas sales : 75.7 €mn / 20.9 TWh = €3.6/MWh n/a
Endesa X Gross Margin (€mn)Gross margin generated by the added value products and services commercialized by the Endesa X
unit = 34 €mnn/a
30
Glossary of terms (II/II)
Note: Refer to the Consolidated Management Report for those Alternative Measures of Performance not contained hereinQ1 2020 Results - Madrid, 04 May 2020
This document contains certain "forward-looking" statements regarding anticipated financial and operating results and statistics and other future events. These statements are not
guarantees of future performance and they are subject to material risks, uncertainties, changes and other factors that may be beyond ENDESA’s control or may be difficult to predict.
Forward-looking statements include, but are not limited to, information regarding: estimated future earnings; anticipated changes in generation and market share; expected changes in
demand for gas and gas sourcing; management strategy and goals; estimated cost reductions; tariffs and pricing structure; estimated capital expenditures; estimated asset disposals;
estimated changes in capacity and capacity mix; repowering of capacity and macroeconomic conditions. The main assumptions on which these expectations and targets are related to
the regulatory framework, exchange rates, commodities, counterparties, divestments, increases in production and installed capacity in markets where ENDESA operates, increases in
demand in these markets, allocation of production amongst different technologies, increases in costs associated with higher activity that do not exceed certain limits, electricity prices not
below certain levels, the cost of CCGT plants, and the availability and cost of the gas, coal, fuel oil and emission rights necessary to run our business at the desired levels.
In these statements, ENDESA avails itself of the protection provided by the Private Securities Litigation Reform Act of 1995 of the United States of America with respect to forward-
looking statements.
The following important factors, in addition to those discussed elsewhere in this document, could cause financial and operating results and statistics to differ materially from those
expressed in our forward-looking statements:
Economic and industry conditions; factors related to liquidity and financing; operating factors; strategic and regulatory, legal, fiscal, environmental, political and governmental factors;
reputational factors and transaction and commercial factors.
Further details on the factors that may cause actual results and other developments to differ significantly from the expectations implied or explicitly contained in this document are given in
the Risk Factors section of the current ENDESA regulated information filed with the Comisión Nacional del Mercado de Valores (the Spanish securities regulator or the “CNMV” for its
initials in Spanish).
No assurance can be given that the forward-looking statements in this document will be realised. Except as may be required by applicable law, neither Endesa nor any of its affiliates
intends to update these forward-looking statements.
Disclaimer
31

Mar Martinez
Head of Investor Relations
Investor Relations team
Isabel Permuy
Javier Hernandez
Francesc Trilla
Juan Carlos Jimenez
Sonia Herranz
Paloma de Miguel
32
IR Team
Contacts
Email: [email protected]
Phone: + 34 91 213 15 03
+ 34 91 213 90 49
Website: www.endesa.com
Contact us