endogeneity of inflation targetpapers.bok.or.kr/repec_attach/wpaper/english/wp-2016-18.pdf ·...
TRANSCRIPT
Endogeneity of Inflation Target
Soyoung Kim*, Geunhyung Yim**
The views expressed herein are those of the authors and do not necessarily reflect the official views of the Bank of Korea. When reporting or citing this paper, the authors’ names should always be explicitly stated.
* Professor, Department of Economics, Seoul National University, Tel: +82-2-880-2689, E-mail: [email protected].** Economist, Economic Research Institute, The Bank of Korea, Tel: +82-2-759-5349, E-mail: [email protected].
The authors are grateful to Byungkuk Kim, Kiyoung Jeon, Hyunjoo Ryou, Seryung Park, and other anonymous referees for their valuable comments for this paper.

Contents
Ⅰ. Introduction ················································································ 1
Ⅱ. Empirical Method ···································································· 4
Ⅲ. Empirical Results ······································································· 7
Ⅳ. Extended Experiments ·························································14
Ⅴ. Conclusion ·················································································22
References ·························································································23
Appendix ··························································································· 26

Endogeneity of Inflation Target
Under inflation targeting, central banks set an inflation target in advance and then try to make an actual inflation hit the target. However, central banks may have an incentive to adjust the target to actual inflation rates such as past inflation rates, to make the actual inflation rate close to the target. This paper examines this issue of “endogeneity of inflation target” by using various empirical methods with the sample of 19 inflation targeting countries. Empirical results show that an inflation rate has significantly positive effect on the inflation target of the next period. Empirical results further suggest that this endogeneity of the inflation target is found more strongly in central banks with low credibility or weak performance than in central banks with high credibility or strong performance.
Keywords: Inflation targeting, Inflation rate, Inflation target, Endogeneity
JEL Classification: E31, E58
1 BOK Working Paper No. 2016-18
Ⅰ. Introduction
Since New Zealand adopted inflation targeting in 1990, more and more
countries have joined to adopt inflation targeting. In many countries, even in
emerging countries, actual inflation rates dropped sharply after introducing
inflation targeting. By now, more than 30 countries have adopted inflation
targeting.
However, some previous studies have challenged the success story of
inflation targeting, by arguing that the adoption of inflation targeting is an
endogenous choice. Ball and Sheridan (2005), in a debate on the evaluation of
the macroeconomic performance of the inflation targeting system, pay attention
to the fact that the inflation levels of inflation targeting adopters were relatively
higher than those of non-adopters during the preinflation targeting period.
Based on this observation, they claim that stabilizing effects from the adoption
of inflation targeting argued by Bernanke et al. (1999) were likely to be a
“regression to the mean” phenomenon in fact. That is, the inflation level
decreased and the real GDP volatility reduced in countries that adopted
inflation targeting, but it was a mere reaction to the high inflation of the
pre-inflation targeting period. That is, higher inflation resulted in the adoption
of the inflation targeting system on the one hand and the lower inflation and
stable output during the inflation targeting period on the other hand. Ball and
Sheridan (2005) show that there was no evidence of a causal relation from the
adoption of inflation targeting to better economic performance in case the
decision on the adoption of inflation targeting was made endogenously.
Following the study of Ball and Sheridan (2005), many studies have investigated
this endogeneity issue when measuring the performance of inflation targeting
(Uhlig, 2004; Mishikin and Schmidt-Hebbel, 2002; Gertler, 2005; Mishkin,
2005; Mishkin and Schmidt-Hebbel, 2006).1)
1) To resolve this endogeneity issue, a variety of methodologies such as difference in difference method (Cecchetti and Ehrmann (2000), Hu (2003), Neumann and von Hagen (2002)), controlling for initial conditions (Ball and Sheridan (2005), Gonçalvez and Salles (2008)), instrumental variable approach (Mishkin and Schmidt-Hebbel (2007)), and propensity score matching (Lin and Ye (2007, 2009), Vega and Winkelried (2005)) have been tried. For a survey of literature, refer to Svensson (2011).
Endogeneity of Inflation Target 2
This paper brings attention to another type of endogeneity issue in relation
to inflation targeting. While previous studies have discussed the endogeneity of
the adoption of inflation targeting, this paper analyzes the endogeneity of an
inflation target itself under inflation targeting. That is, a central bank under
inflation targeting may adjust its inflation target endogenously to the state of
the economy, in particular, past inflation rates.2)
For example, the Bank of Indonesia set a three-year inflation target in 2004:
as 6 ± 1% in 2005, 5.5 ± 1% in 2006, and 5 ± 1% in 2007. But when the
inflation rate increased more than expected (10.5% in 2005), the Bank of
Indonesia adjusted the target in 2005, to 8 ± 1% in 2006, 6 ± 1% in 2007, and
5 ± 1% in 2008.
As another example, the central bank of Colombia decreased the annual
inflation target from 22% (1993) to 19% (1994), 18% (1995), and 17% (1996), as
the inflation rate decreased from 27% in 1992 to 22.5% in 1993, 22.8% in 1994,
and 20.9% in 1995. However, as the inflation rate did not fall much in 1996
(20.8%), the central bank increased the target for 1997 to 18%. Then, the
inflation rate did drop to 18.5% in 1997, and accordingly the central bank
decreased the target for 1998 to 16%. Further, as the inflation rate dropped
from 18.7% (in 1998) to 10.9% (in 1999), the bank again lowered the target
from 15% (1999) to 10% (2000). Even in more recent years, the central bank of
Colombia adjusted the target rate due to changes in inflation rates. As the
inflation rate increased sharply from 5.5% in 2007 to 7% in 2008, the central
bank raised the target from 3.5~4.5% (2008) to 4.5~5.5% (2009). Then, the
inflation rate dropped in 2009 (4.2%), and subsequently the target for 2010
decreased to 3 ± 1%. In fact, the correlation between the inflation target and
the lagged inflation rate in Colombia is 1.
There can be various reasons for such endogeneity. For example, under
inflation targeting, central banks often face huge pressures on keeping an actual
2) In principle, from the monetarist’s viewpoint, there is no need for the inflation target to be dependent upon any economic fundamentals (Anderson et al. (2014)).
3 BOK Working Paper No. 2016-18
inflation rate within a target range. With such pressures, when an actual inflation
rate deviates from an inflation target, central banks may decide to change the
inflation target itself to close the gap between the inflation target and actual
inflation rate. In other words, central banks ideally set an inflation target first,
and then an actual inflation rate is supposed to be adjusted to the target, if
successful. Instead, central banks may adjust an inflation target to an actual
inflation rate, especially when it is difficult to make the actual inflation rate meet
the target. With such endogeneity, inflation targeting may look successful even
when it is not. In addition, such endogeneity may weaken the stabilizing role of
inflation targeting. Inflation targeting is expected to help stabilize inflation by
setting the target, trying to achieve the target, showing such efforts of central
banks to economic agents, and leading economic agents to set inflation
expectations close to the target. However, if central banks change the target
according to past inflation rates or inflation expectations, inflation expectations
of economic agents and actual inflation rates may not be stabilized.3)
In this paper, we investigate whether an actual inflation rate affects a future
inflation target or whether an inflation target is influenced by past actual
inflation rates, by examining 19 inflation targeting countries. We perform the
Granger causality test and draw scatter plots for individual countries and run
panel regressions as a more formal analysis. The analysis implies that past
inflation rates have a significant influence on the inflation target of the next
period. That is, there exists endogeneity when central banks set their inflation
targets. These results are robust to various modifications of the model, for
example, considering the reverse causality and reducing the sample period. We
also divide the sample countries into two groups by to what extent each central
bank achieved the inflation target: high vs. low performance groups. Then, we
3) If the Phillips curve is non-linear, the sacrifice ratio is dependent upon the level of the inflation rate. In this case, if a central bank considers the sacrifice ratio when setting an inflation target, the decision on the inflation target may reflect the inflation performance of the economy. Some DSGE literature models time-varying inflation target assuming that a central bank changes its target as it learns the structure of the economy such as output-inflation trade-off. See Cogley et al. (2010).
Endogeneity of Inflation Target 4
perform the previous analysis for each group. The result shows that the low
performance group much more actively adjust inflation targets to the past level
than high performance group. This may suggest that central banks with low
performance have more incentive to adjust an inflation target close to the past
inflation rate to minimize the gap between actual inflation and the target.
The rest of this paper is organized as follows. In Section 2, we explain the
empirical methodology. In Section 3, we present the empirical results. In
Section 4, we conduct various extended analyses. In Section 5, we conclude with
a summary of the results.
Ⅱ. Empirical Method
1. Data
As of April 2015, 32 countries are explicitly adopting inflation targeting as the
monetary policy regime. Among them, we exclude seven countries that have made
an inflation target decision no more than once and six countries that have adopted
inflation targeting only recently, say after the 2008~09 global financial crisis. By
excluding these 13 countries, we end up with 19 countries, to analyze the relation
between an inflation target and past inflation rates.4) Those 19 countries are Brazil,
Canada, Chile, Colombia, Czech Republic, Ghana, Guatemala, Hungary,
Indonesia, Israel, Korea, Mexico, New Zealand, Peru, the Philippines, Poland,
Romania, Thailand, and Turkey. In terms of the sample period, we include not
only the explicit but also implicit targeting period, since the explicit inflation
targeting period is often short and we also want to see the overall experience of
inflation targeting. In Section 4, we conduct an analysis with the sample of only
explicit targeting periods, to check the robustness of our main results.5)
4) The former case includes Armenia, Australia, Iceland, Norway, South Africa, Sweden, United Kingdom while the latter case includes Albania, Georgia, India, Japan, Moldova, Serbia.

5 BOK Working Paper No. 2016-18
We use the inflation rate and inflation target data of 19 countries. The IMF’s
International Financial Statistics (IFS) is the main source of our inflation rate
data but we also collect the data from each central bank’s web pages since some
data such as core CPI is hard to obtain from IFS. We acquire inflation target
data mainly from each central bank’s web pages, but some omitted values are
collected from IMF country report and Mishkin and Savastano (2002).
2. Empirical methodology
To investigate the relation between past inflation rates and current inflation
targets, we use various empirical methods. First, we examine preliminary data
properties by conducting the Granger causality test for each country. Second,
we report scatter plots for each country to have a rough idea of the relation.
Third, we conduct the panel regression analysis to formally infer the relation.
We conduct the Granger causality test for actual inflation rates and
mid-point inflation targets in each country. The inflation targeting period is
considered, but there are some exceptions. For Korea, it is from 2000 to 2006
when the Bank of Korea targeted the core CPI, and for the Czech Republic, it is
after 2002 as the Czech National Bank changed the target index from net CPI
to headline CPI in 2002. In case of Indonesia, we analyze the period of after
2003 when monthly inflation data are available. We exclude Thailand because
the Bank of Thailand first changed its mid-point inflation target in 2015. We
use monthly data to secure enough degrees of freedom.
We report scatter plots for individual countries. Before conducting the main
regression analysis, we would like to sketch the relationship between an actual
inflation rate and inflation target in each country. Formal regression analysis for
5) Chile, Colombia, Ghana, Indonesia, Mexico, Peru, and Turkey announced the implicit inflation target because they were not sure that they have macroeconomic preconditions that were required for the successful management of inflation targeting. But in the case of Ghana, we consider only the explicit inflation targeting period because data is not available for the implicit inflation targeting period. Details on the timing of adoption and the change in the inflation target are summarized in Table A1 in the Appendix.
Endogeneity of Inflation Target 6
individual countries would be interesting, but which is not easy only with the
limited number of observations. Therefore, we report informal scatter plots for
individual countries. We use annual data on inflation rates and mid-point of
inflation target data of 19 countries. We use annual data, instead of monthly
data, since inflation target decisions are made at best at annual frequency and
we would like to infer central banks’ behavior on setting inflation targets.
Scatter plots are produced in a fashion to display mid-point of inflation
targets in certain periods and the inflation performance of the immediately
preceding years at the same time. We consider three ways of calculating past
inflation performance: the inflation rate of previous one year, the average
inflation of previous two years, and the average inflation rate of previous
inflation target years. For example, if the inflation target period is set for 3
years from 2013 to 2015, the average of the mid-point of inflation target in
2013~15 is compared with the inflation rate in 2012, the average inflation rate
in 2011~12, and the average inflation rate in 2010~12, respectively. However,
the length of the period of which inflation performance is measured does not
exceed maximum three years.
We conduct the panel regression analysis. Three kinds of models are
considered. First, we run a simple regression model where the mid-point of
inflation target is a dependent variable and the past inflation rate is an
explanatory variable:
(1)
where is the mid-point value of inflation target and is the
inflation rate in the previous period, and is an error term. The exact definitions
are the same as those used in scatter plots.
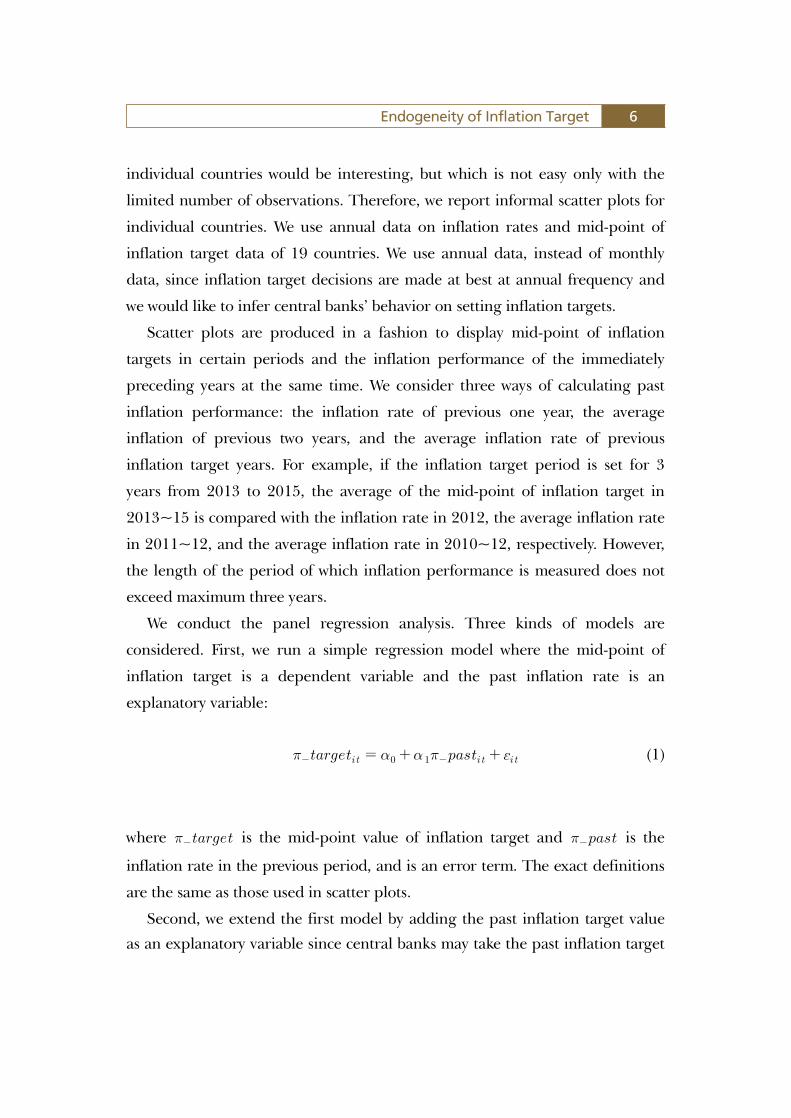
Second, we extend the first model by adding the past inflation target value
as an explanatory variable since central banks may take the past inflation target
7 BOK Working Paper No. 2016-18
value into consideration when they set the current inflation target:
(2)
where is the past inflation target value. In equation (1), the past
inflation rate may have an explanatory power even when the past target
explains the current target since the past target and the past inflation rate may
be correlated. In equation (2), such possibility is controlled for.
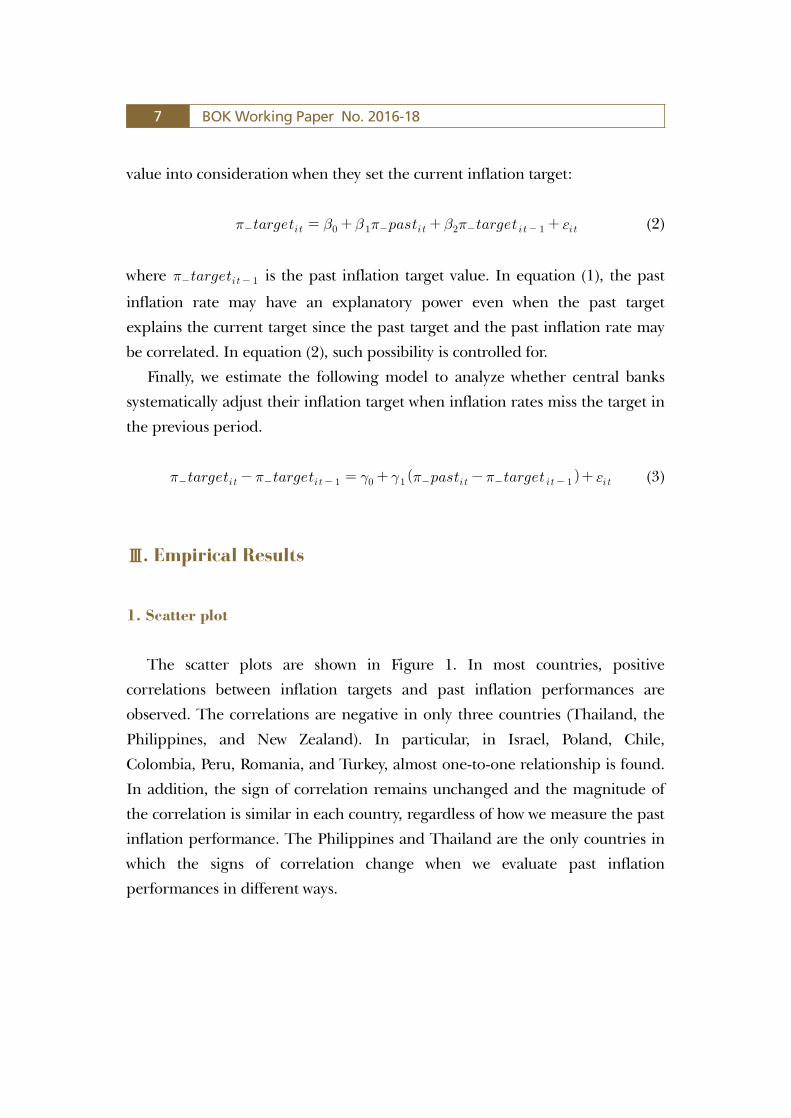
Finally, we estimate the following model to analyze whether central banks
systematically adjust their inflation target when inflation rates miss the target in
the previous period.
(3)
Ⅲ. Empirical Results
1. Scatter plot
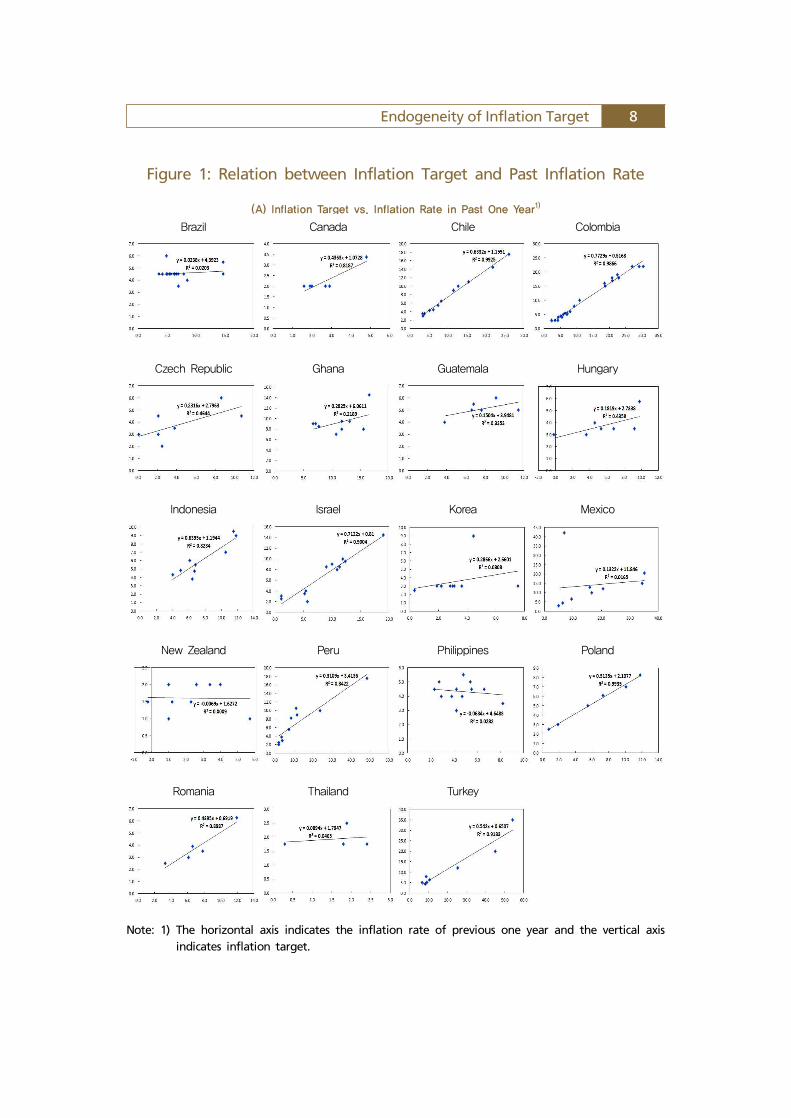
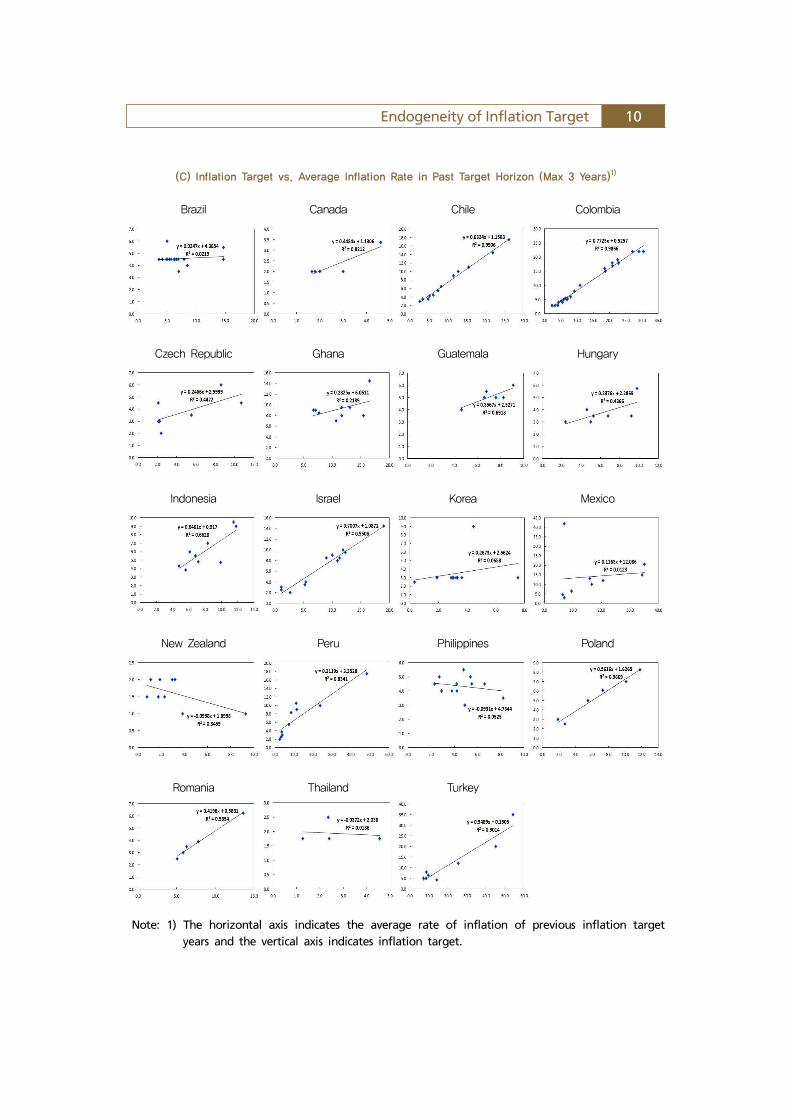
The scatter plots are shown in Figure 1. In most countries, positive
correlations between inflation targets and past inflation performances are
observed. The correlations are negative in only three countries (Thailand, the
Philippines, and New Zealand). In particular, in Israel, Poland, Chile,
Colombia, Peru, Romania, and Turkey, almost one-to-one relationship is found.
In addition, the sign of correlation remains unchanged and the magnitude of
the correlation is similar in each country, regardless of how we measure the past
inflation performance. The Philippines and Thailand are the only countries in
which the signs of correlation change when we evaluate past inflation
performances in different ways.
Endogeneity of Inflation Target 8
Figure 1: Relation between Inflation Target and Past Inflation Rate
(A) Inflation Target vs. Inflation Rate in Past One Year1)
Brazil Canada Chile Colombia
Czech Republic Ghana Guatemala Hungary
Indonesia Israel Korea Mexico
New Zealand Peru Philippines Poland
Romania Thailand Turkey
Note: 1) The horizontal axis indicates the inflation rate of previous one year and the vertical axis indicates inflation target.

9 BOK Working Paper No. 2016-18
(B) Inflation Target vs. Average Inflation Rate in Past Two Year1)
Brazil Canada Chile Colombia
Czech Republic Ghana Guatemala Hungary
Indonesia Israel Korea Mexico
New Zealand Peru Philippines Poland
Romania Thailand Turkey
Note: 1) The horizontal axis indicates the average rate of inflation of previous two years and the vertical axis indicates inflation target.
Endogeneity of Inflation Target 10
(C) Inflation Target vs. Average Inflation Rate in Past Target Horizon (Max 3 Years)1)
Brazil Canada Chile Colombia
Czech Republic Ghana Guatemala Hungary
Indonesia Israel Korea Mexico
New Zealand Peru Philippines Poland
Romania Thailand Turkey
Note: 1) The horizontal axis indicates the average rate of inflation of previous inflation target years and the vertical axis indicates inflation target.

11 BOK Working Paper No. 2016-18
Table 1: Granger Causality Test Results1)
Akaike Criterion Schwartz Criterion
lag F-value2) lag F-value2)
Brazil 7 3.485 *** [0.002] 2 0.596 [0.552]
Canada 12 1.753 * [0.056] 1 2.468 [0.117]
Chile 6 2.817 ** [0.011] 1 6.882 *** [0.009]
Colombia 6 8.386 *** [0.000] 2 11.606 *** [0.000]
Czech 3 1.601 [0.191] 1 1.237 [0.268]
Ghana 1 2.928 * [0.090] 1 2.928 * [0.090]
Guatemala 5 5.124 *** [0.000] 2 6.463 *** [0.002]
Hungary 2 0.560 [0.572] 1 1.013 [0.316]
Indonesia 4 11.263 *** [0.000] 1 7.934 *** [0.006]
Israel 7 4.289 *** [0.000] 2 3.471 ** [0.032]
Korea 0 - 0 -
Mexico 12 11.276 *** [0.000] 5 2.879 ** [0.015]
New Zealand 4 0.125 [0.973] 1 0.048 [0.827]
Peru 2 2.075 [0.128] 2 2.075 [0.128]
Philippines 2 4.334 ** [0.015] 2 4.334 ** [0.015]
Poland 2 3.545 ** [0.031] 2 3.545 ** [0.031]
Romania 12 2.186 ** [0.019] 1 0.240 [0.625]
Turkey 12 2.630 *** [0.004] 1 14.940 *** [0.000]
Notes: 1) The null hypothesis is that an actual inflation does not Granger cause an inflation target. 2) The bold numbers are F-values and their corresponding p-values are in brackets. *, **,
*** mean that the estimates are significant at the 10%, 5%, and 1% significance levels respectively.
2. Granger causality test
Table 1 reports the results of the Granger causality test. For each country, we
report two results; one is when the lag length is selected based on Akaike
Criterion, and the other is when the lag length is selected based on Schwartz
Criterion. The null hypothesis is that inflation rates do not Granger cause
inflation targets. In many countries, past inflation rates help explain the

Endogeneity of Inflation Target 12
movement of inflation targets. In 14 out of total 18 countries, the null
hypothesis is rejected at least in one case at the 10% significance level. In eight
countries (Chile, Colombia, Guatemala, Indonesia, Israel, the Philippines,
Poland and Turkey), the null hypothesis is rejected in both cases at the 5%
significance level. The results suggest that past inflation rates are likely to
influence inflation targets in many countries.
3. Panel regression
Table 2 shows the panel regression estimates for equation (1) by pooled OLS, the
fixed effect model, and the random effect model. The estimates for the coefficient
of the past inflation rate are significantly different from zero and positive. This
result supports the idea that the past inflation performance affects the inflation
target of the next period. The size of estimated coefficients ranges from 0.43 to
0.54. In all cases, the coefficient is significant at the 1% significance level.
Table 2: Equation (1) Estimation Result
Pooled OLS1) Fixed Effect Model1) Random Effect Model1)
1.874***[0.365]
2.099***[0.393]
1.768***[0.376]
2.382***[0.394]
2.544***[0.419]
2.275***[0.405]
1.874***[0.365]
2.131***[0.442]
1.793***[0.389]
0.538***
[0.030]0.479***[0.035]
0.538***[0.030]
0.479***
[0.030]0.431***[0.035]
0.463***[0.031]
0.539***
[0.031]0.482***[0.036]
0.532***[0.031]
Observations 180 180 180 180 180 180 180 180 180
R² 0.642 0.584 0.633 0.536 0.482 0.529
Notes: 1) Standard errors are in brackets. *, **, *** mean that the estimates are significant at the 10%, 5%, and 1% significance levels respectively.
2) is the inflation rate of the previous one year, is the average inflation
rate of the past two years, and is the average inflation rate for the past
target horizon.
13 BOK Working Paper No. 2016-18
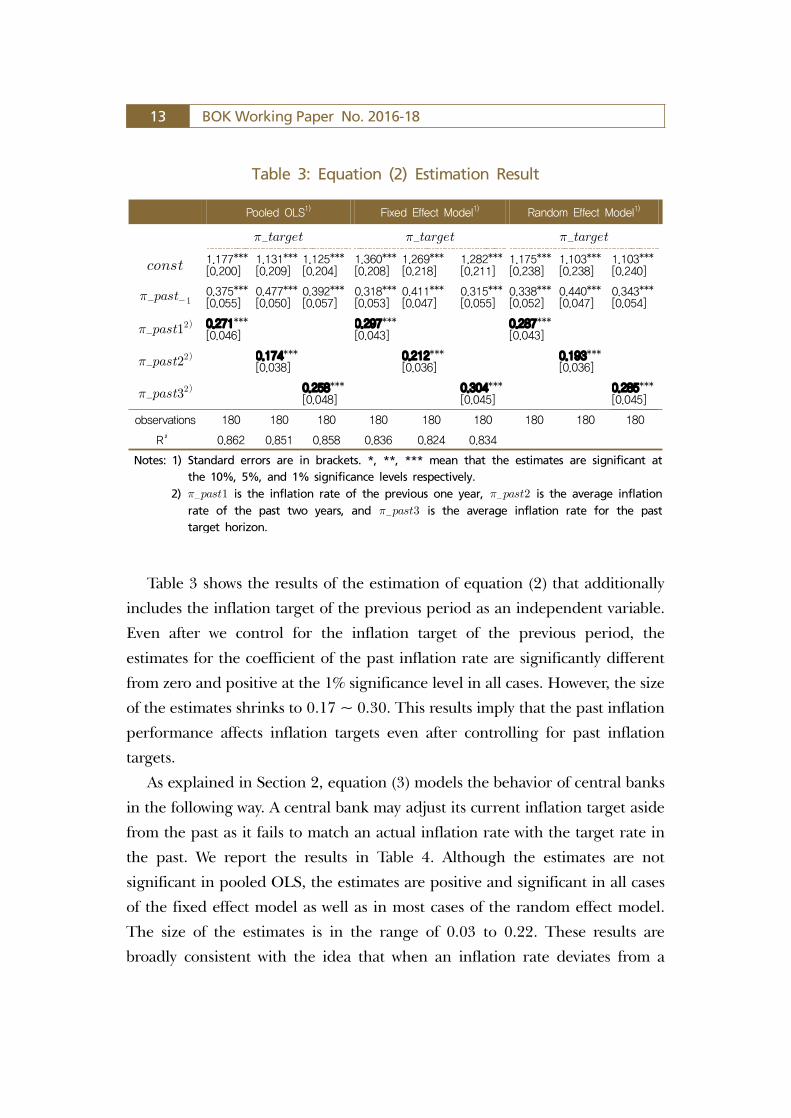
Table 3 shows the results of the estimation of equation (2) that additionally
includes the inflation target of the previous period as an independent variable.
Even after we control for the inflation target of the previous period, the
estimates for the coefficient of the past inflation rate are significantly different
from zero and positive at the 1% significance level in all cases. However, the size
of the estimates shrinks to 0.17 ~ 0.30. This results imply that the past inflation
performance affects inflation targets even after controlling for past inflation
targets.
As explained in Section 2, equation (3) models the behavior of central banks
in the following way. A central bank may adjust its current inflation target aside
from the past as it fails to match an actual inflation rate with the target rate in
the past. We report the results in Table 4. Although the estimates are not
significant in pooled OLS, the estimates are positive and significant in all cases
of the fixed effect model as well as in most cases of the random effect model.
The size of the estimates is in the range of 0.03 to 0.22. These results are
broadly consistent with the idea that when an inflation rate deviates from a
Table 3: Equation (2) Estimation Result
Pooled OLS1) Fixed Effect Model1) Random Effect Model1)
1.177***[0.200]
1.131***[0.209]
1.125***[0.204]
1.360***[0.208]
1.269***[0.218]
1.282***[0.211]
1.175***[0.238]
1.103***[0.238]
1.103***[0.240]
0.375***[0.055]
0.477***[0.050]
0.392***[0.057]
0.318***[0.053]
0.411***[0.047]
0.315***[0.055]
0.338***[0.052]
0.440***[0.047]
0.343***[0.054]
0.271***
[0.046]0.297***[0.043]
0.287***[0.043]
0.174***
[0.038]0.212***[0.036]
0.193***[0.036]
0.258***
[0.048]0.304***[0.045]
0.285***[0.045]
observations 180 180 180 180 180 180 180 180 180
R² 0.862 0.851 0.858 0.836 0.824 0.834
Notes: 1) Standard errors are in brackets. *, **, *** mean that the estimates are significant at the 10%, 5%, and 1% significance levels respectively.
2) is the inflation rate of the previous one year, is the average inflation rate of the past two years, and is the average inflation rate for the past target horizon.

Endogeneity of Inflation Target 14
target, central banks tend to adjust the target of the next period in a way of
reducing the deviation from the inflation rate and the target.
Ⅳ. Extended Experiments
1. Robustness
In this section, we examined the robustness of the results by extending the
model in various directions.
First, we restrict the sample period to the explicit inflation targeting period
only, since the behavior of central banks during the implicit inflation targeting
period may be different from that during the explicit inflation targeting period.
As mentioned in Section 2, some countries like Chile, Colombia, Indonesia, and
Peru operated the implicit inflation targeting period before explicitly adopting
Table 4: Equation (3) Estimation Result
PooledOLS1)
Fixed EffectModel1)
Random EffectModel1)
-1.114***[0.217]
-1.068***[0.226]
-1.121***[0.222]
-1.206***[0.200]
-1.241***[0.209]
-1.253***[0.204]
-1.167***[0.291]
-1.117***[0.252]
-1.190***[0.284]
2)0.103[0.071]
0.194***[0.070]
0.141**[0.069]
2)0.036[0.057]
0.143**[0.057]
0.056[0.057]
2)0.097[0.073]
0.211***[0.072]
0.139*[0.072]
Observations 161 161 161 161 161 161 161 161 161
R² 0.013 0.002 0.011 0.052 0.043 0.057
Notes: 1) Standard errors are in brackets. *, **, *** mean that the estimates are significant at the 10%, 5%, and 1% significance levels respectively.
2) is the inflation rate of the previous one year, is the average inflation rate of the past two years, and is the average inflation rate for the past target horizon.

15 BOK Working Paper No. 2016-18
inflation targeting. They assessed that they had weak macroeconomic
preconditions required for the success of inflation targeting. Such conditions
are, for instance, central bank independence, technical infrastructure including
the capability to forecast major economic variables, well-functioning price
system, and sound financial markets including banking and capital markets.
The estimation results are displayed in Tables 5 and 6. The results are
qualitatively similar to the baseline case in which the implicit inflation targeting
period is included in the sample. The inflation target still responds significantly
to the past inflation. In both equation (1) and equation (2), the estimates of
coefficient of the past inflation rate is significantly different from zero at the 1%
significance level regardless of the estimation method. Also, the size of the
estimates, which is between 0.431~0.588 in equation (1) and 0.240~0.344 in
equation (2), is similar to that of the whole inflation targeting period.
Table 5: Explicit Inflation Targeting Period (Equation (1))
Pooled OLS1) Fixed Effect Model1) Random Effect Model1)
1.454***[0.234]
0.990***[0.235]
1.377***[0.259]
2.056***[0.252]
1.563***[0.261]
2.003***[0.265]
1.622***[0.256]
1.171***[0.266]
1.635***[0.311]
0.539***
[0.033]0.438***[0.038]
0.502***[0.034]
0.588***
[0.033]0.496***[0.038]
0.546***[0.034]
0.532***
[0.036]0.431***[0.039]
0.466***[0.036]
Observations 140 140 140 140 140 140 140 140 140
R² 0.658 0.703 0.615 0.526 0.582 0.506
Notes: 1) Standard errors are in brackets. *, **, *** mean that the estimates are significant at the 10%, 5%, and 1% significance levels respectively.
2) is the inflation rate of the previous one year, is the average inflation rate of the past two years, and is the average inflation rate for the past target horizon.

Endogeneity of Inflation Target 16
Up to now, we analyze the effects of inflation rates on inflation targets.
However, an inflation target may also affect an actual inflation rate. To control
for such reverse causality, the system estimation is conducted by considering the
following equation additionally.
(4)
The system of equations (2) and (4) is estimated by using three stage least
squares (3SLS) method. Table 7 reports the results.
Table 6: Explicit Inflation Targeting Period (Equation (2))
Pooled OLS1) Fixed Effect Model1) Random Effect Model1)
0.585***[0.203]
0.584***[0.211]
0.544**[0.213]
1.258***[0.263]
1.309***[0.262]
1.263***[0.269]
0.585***[0.203]
0.584***[0.211]
0.544**[0.213]
0.492***[0.052]
0.404***[0.071]
0.512***[0.055]
0.371***[0.059]
0.229***[0.078]
0.363***[0.063]
0.492***[0.052]
0.404***[0.071]
0.512***[0.055]
0.258***
[0.039]0.245***[0.042]
0.258***[0.039]
0.320***
[0.056]0.344***[0.060]
0.320***[0.056]
0.240***
[0.042]0.244***[0.046]
0.240***[0.042]
Observations 127 127 127 127 127 127 127 127 127
R² 0.799 0.783 0.783 0.630 0.627 0.614
Notes: 1) Standard errors are in brackets. *, **, *** mean that the estimates are significant at the 10%, 5%, and 1% significance levels respectively.
2) is the inflation rate of the previous one year, is the average inflation rate of the past two years, and is the average inflation rate for the past target horizon.
17 BOK Working Paper No. 2016-18
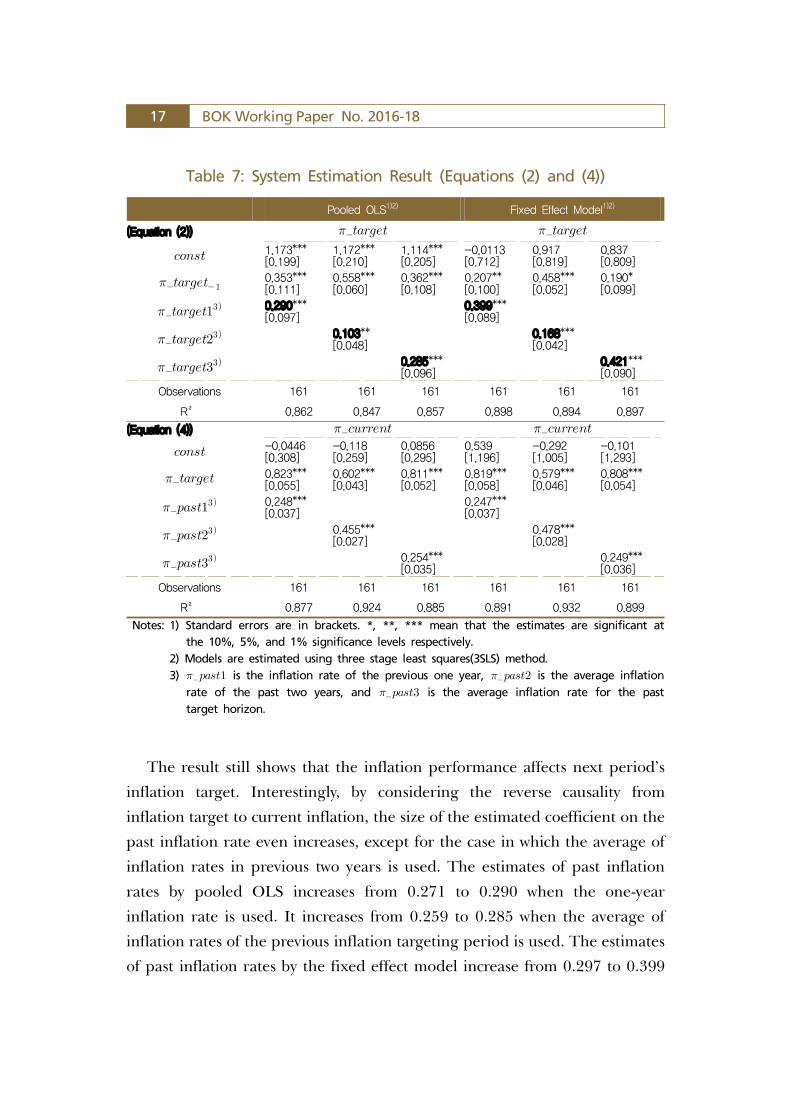
The result still shows that the inflation performance affects next period’s
inflation target. Interestingly, by considering the reverse causality from
inflation target to current inflation, the size of the estimated coefficient on the
past inflation rate even increases, except for the case in which the average of
inflation rates in previous two years is used. The estimates of past inflation
rates by pooled OLS increases from 0.271 to 0.290 when the one-year
inflation rate is used. It increases from 0.259 to 0.285 when the average of
inflation rates of the previous inflation targeting period is used. The estimates
of past inflation rates by the fixed effect model increase from 0.297 to 0.399
Table 7: System Estimation Result (Equations (2) and (4))
Pooled OLS1)2) Fixed Effect Model1)2)
(Equation (2))
1.173***[0.199]
1.172***[0.210]
1.114***[0.205]
-0.0113[0.712]
0.917[0.819]
0.837[0.809]
0.353***[0.111]
0.558***[0.060]
0.362***[0.108]
0.207**[0.100]
0.458***[0.052]
0.190*[0.099]
0.290***
[0.097]0.399***[0.089]
0.103**
[0.048]0.168***[0.042]
0.285***
[0.096]0.421***[0.090]
Observations 161 161 161 161 161 161
R² 0.862 0.847 0.857 0.898 0.894 0.897
(Equation (4))
-0.0446[0.308]
-0.118[0.259]
0.0856[0.295]
0.539[1.196]
-0.292[1.005]
-0.101[1.293]
0.823***[0.055]
0.602***[0.043]
0.811***[0.052]
0.819***[0.058]
0.579***[0.046]
0.808***[0.054]
0.248***
[0.037]0.247***[0.037]
0.455***
[0.027]0.478***[0.028]
0.254***
[0.035]0.249***[0.036]
Observations 161 161 161 161 161 161
R² 0.877 0.924 0.885 0.891 0.932 0.899
Notes: 1) Standard errors are in brackets. *, **, *** mean that the estimates are significant at the 10%, 5%, and 1% significance levels respectively.
2) Models are estimated using three stage least squares(3SLS) method. 3) is the inflation rate of the previous one year, is the average inflation
rate of the past two years, and is the average inflation rate for the past target horizon.
Endogeneity of Inflation Target 18
and 0.304 to 0.421, respectively.
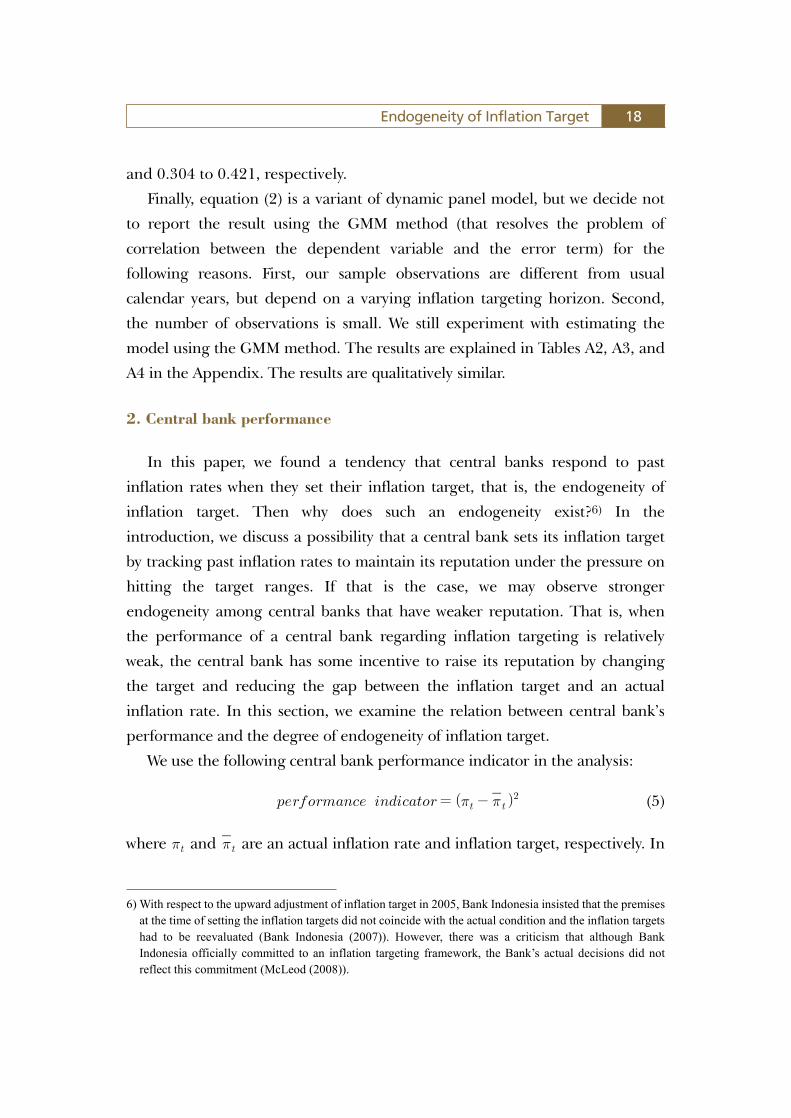
Finally, equation (2) is a variant of dynamic panel model, but we decide not
to report the result using the GMM method (that resolves the problem of
correlation between the dependent variable and the error term) for the
following reasons. First, our sample observations are different from usual
calendar years, but depend on a varying inflation targeting horizon. Second,
the number of observations is small. We still experiment with estimating the
model using the GMM method. The results are explained in Tables A2, A3, and
A4 in the Appendix. The results are qualitatively similar.
2. Central bank performance
In this paper, we found a tendency that central banks respond to past
inflation rates when they set their inflation target, that is, the endogeneity of
inflation target. Then why does such an endogeneity exist?6) In the
introduction, we discuss a possibility that a central bank sets its inflation target
by tracking past inflation rates to maintain its reputation under the pressure on
hitting the target ranges. If that is the case, we may observe stronger
endogeneity among central banks that have weaker reputation. That is, when
the performance of a central bank regarding inflation targeting is relatively
weak, the central bank has some incentive to raise its reputation by changing
the target and reducing the gap between the inflation target and an actual
inflation rate. In this section, we examine the relation between central bank’s
performance and the degree of endogeneity of inflation target.
We use the following central bank performance indicator in the analysis:
(5)
where and are an actual inflation rate and inflation target, respectively. In
6) With respect to the upward adjustment of inflation target in 2005, Bank Indonesia insisted that the premises at the time of setting the inflation targets did not coincide with the actual condition and the inflation targets had to be reevaluated (Bank Indonesia (2007)). However, there was a criticism that although Bank Indonesia officially committed to an inflation targeting framework, the Bank’s actual decisions did not reflect this commitment (McLeod (2008)).

19 BOK Working Paper No. 2016-18
equation (5), high (low) value of the indicator represents weak (strong)
performance of a central bank that tries to keep the inflation rate near the target.
This performance indicator is closely related to the central bank
credibility. The definition of the indicator is consistent with the common
notion that “the credibility means that your pronouncements are believed”
(Blinder (1998)). Recently, Bordo and Siklos (2014, 2015a, 2015b)
express the credibility of a central bank as the squared differential between
the observed inflation rate and central bank’s target, similarly to equation
(5). The difference is that Bordo and Siklos (2014, 2015a, 2015b) estimate
‘implied inflation objective’ from the monetary policy rule such as the
Taylor Rule as a proxy for , but this paper uses the exact inflation target
data that central banks actually announced.
We compute the average of the performance indicator after the adoption
of inflation targeting using monthly inflation data of each country. Then, we
classify 19 countries into two groups, based on the average values of the
performance indicator. The high performance group includes Canada, Chile,
Czech Republic, Israel, Korea, New Zealand, Peru, the Philippines, Poland,
and Thailand, while the low performance group includes Brazil, Colombia,
Ghana, Guatemala, Hungary, Indonesia, Mexico, Romania, and Turkey.
Detailed information about the indicator values and classification is shown in
Table A5 of the Appendix.
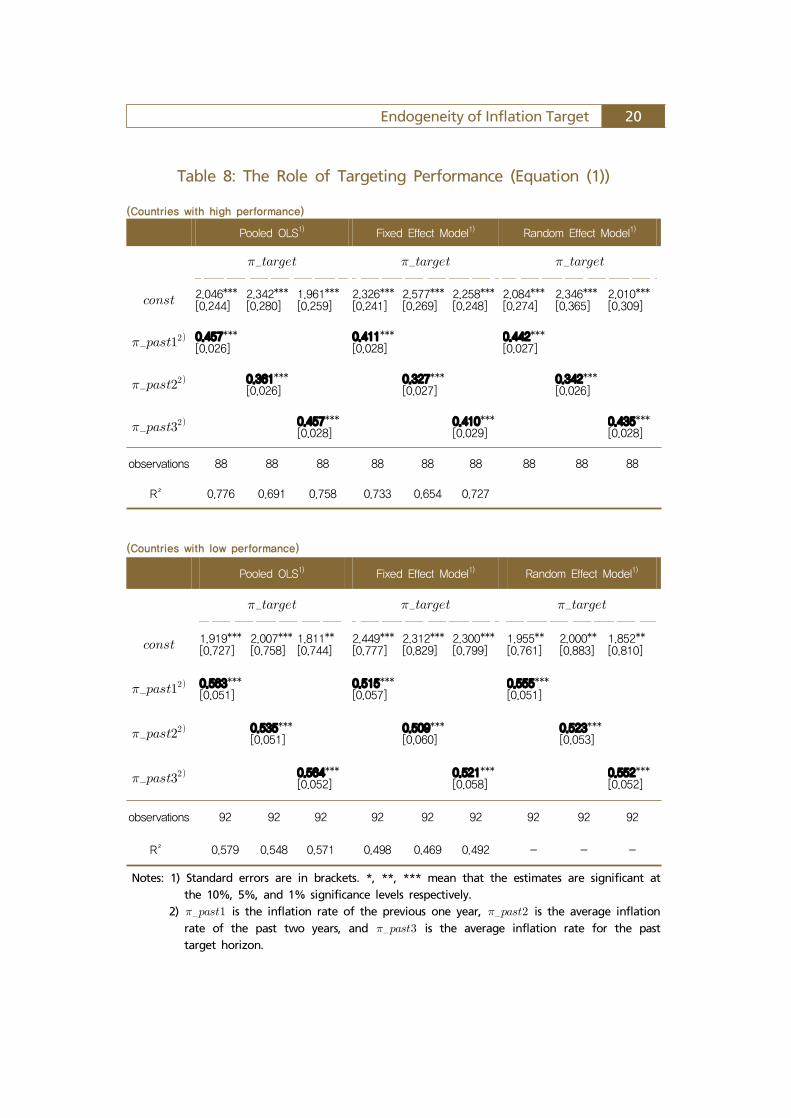
Tables 8 and 9 present the estimation results for equations (1) and
(2), respectively, for each group. The results show that in both groups,
past inflation rates have a positive effect on the inflation target of the
next period. The estimated coefficient is larger in the low performance
group than that in the high performance group in all cases. In addition, the
estimated coefficients are significantly different from zero in all cases of
the low performance group, but not in a few cases of high performance
group. These results suggest that past inflation rates affect inflation
targets more strongly in the low performance group than in the high
performance group. In other words, we find stronger endogeneity of an
inflation target in central banks with low reputation or weak performance.
Endogeneity of Inflation Target 20
Table 8: The Role of Targeting Performance (Equation (1))
(Countries with high performance)
Pooled OLS1) Fixed Effect Model1) Random Effect Model1)
2.046***[0.244]
2.342***[0.280]
1.961***[0.259]
2.326***[0.241]
2.577***[0.269]
2.258***[0.248]
2.084***[0.274]
2.346***[0.365]
2.010***[0.309]
0.457***
[0.026]0.411*** [0.028]
0.442***[0.027]
0.361***
[0.026]0.327*** [0.027]
0.342***[0.026]
0.457***
[0.028]0.410***[0.029]
0.435***[0.028]
observations 88 88 88 88 88 88 88 88 88
R² 0.776 0.691 0.758 0.733 0.654 0.727
(Countries with low performance)
Pooled OLS1) Fixed Effect Model1) Random Effect Model1)
1.919***[0.727]
2.007***[0.758]
1.811**[0.744]
2.449***[0.777]
2.312***[0.829]
2.300***[0.799]
1.955**[0.761]
2.000**[0.883]
1.852**[0.810]
0.563***
[0.051]0.515***[0.057]
0.555***[0.051]
0.535***
[0.051]0.509*** [0.060]
0.523***[0.053]
0.564***
[0.052]0.521***[0.058]
0.552***[0.052]
observations 92 92 92 92 92 92 92 92 92
R² 0.579 0.548 0.571 0.498 0.469 0.492 - - -
Notes: 1) Standard errors are in brackets. *, **, *** mean that the estimates are significant at the 10%, 5%, and 1% significance levels respectively.
2) is the inflation rate of the previous one year, is the average inflation rate of the past two years, and is the average inflation rate for the past target horizon.

21 BOK Working Paper No. 2016-18
Table 9: The Role of Targeting Performance (Equation (2))
(Countries with high performance)
Pooled OLS1) Fixed Effect Model1) Random Effect Model1)
0.839***[0.208]
0.768***[0.227]
0.795***[0.205]
1.060***[0.259]
1.041***[0.288]
1.046***[0.255]
0.839***[0.208]
0.768***[0.227]
0.795***[0.205]
0.502***[0.080]
0.648***[0.089]
0.498***[0.081]
0.455***[0.091]
0.552***[0.106]
0.430***[0.092]
0.502***[0.080]
0.648***[0.089]
0.498***[0.081]
0.187***
[0.064]0.191***[0.067]
0.187***[0.064]
0.049
[0.057]0.086[0.063]
0.049[0.057]
0.194***
[0.066]0.213***[0.069]
0.194***[0.066]
observations 78 78 78 78 78 78 78 78 78
R² 0.873 0.860 0.873 0.800 0.782 0.804
(Countries with low performance)
Pooled OLS1) Fixed Effect Model1) Random Effect Model1)
1.418***[0.369]
1.426***[0.383]
1.388***[0.382]
1.479***[0.351]
1.320***[0.369]
1.377***[0.361]
1.235***[0.464]
1.181***[0.450]
1.208***[0.426]
0.356***[0.078]
0.448***[0.067]
0.379***[0.082]
0.286***[0.071]
0.381***[0.060]
0.288***[0.074]
0.300***[0.071]
0.404***[0.061]
0.322***[0.076]
0.274***
[0.067]0.325***[0.059]
0.314***[0.059]
0.189***
[0.056]0.252***[0.050]
0.226***[0.050]
0.254***
[0.071]0.329***[0.062]
0.298***[0.065]
observations 83 83 83 83 83 83 83 83 83
R² 0.839 0.830 0.832 0.847 0.840 0.843
Notes: 1) Standard errors are in brackets. *, **, *** mean that the estimates are significant at the 10%, 5%, and 1% significance levels respectively.
2) is the inflation rate of the previous one year, is the average inflation rate of the past two years, and is the average inflation rate for the past target horizon.

Endogeneity of Inflation Target 22
Ⅴ. Conclusion
This paper empirically investigates whether an inflation target responds to
past inflation rates in 19 inflation targeting countries. The empirical results
show that the inflation target of many central banks respond significantly and
positively to past inflation rates. This result does not depend on the methods
we adopt, that is, the Granger causality test, scatter plot, and panel regression.
The results suggest that there exists the endogeneity in inflation targets. We also
show that strong endogeneity is found in a central bank with low credibility or
weak performance, which may suggest that such an endogeneity may come
from the incentive for a central bank to raise its reputation to reduce the
deviation of an actual inflation rate from the target.
The analysis of this paper implies that it is better not to aggravate the
endogeneity problem. In order for inflation targets to act as nominal anchors
for monetary policy seeking stable growth, the targets should be the
appropriate rates reflecting the structure of economy, and also set at the level of
which is in line with the medium-term inflation path.
Some future studies are worthwhile. First, it is important to further
investigate why some central banks change inflation targets in response to past
inflation rates. Second, it is worthwhile to analyze what is the consequence of
this endogeneity of inflation targets, for example, how it affects the social
welfare and the overall macroeconomic performance of the economy and
whether it stabilize/destabilize inflation rates and output.

23 BOK Working Paper No. 2016-18
References
Anderson, D., D. P. J. Botman, and B. Hunt (2014), “Is Japan’s Population
Aging Deflationary?” IMF Working Paper 14/139.
Ball, L. M., N. Sheridan (2005), “Does Inflation Targeting Matter?” In
Bernanke, B. S., Woodford, M. (Eds.), The Inflation-targeting Debate,
University of Chicago Press.
Ball, L. (2010), “The Performance of Alternative Monetary Regimes,” The
Handbook of Monetary Economics, Vol. 3, Chapter 23.
Bank Indonesia (2007), “Economic Report on Indonesia,” Jakarta: Bank Indonesia.
Blinder, A. S. (1999), “Central Banking in Theory and Practice,” MIT Press.
Bordo, M. D., P. L. Siklos (2014), “Central Bank Credibility, Reputation and
Inflation Targeting in Historical Perspective,” NBER Working Paper No. 20693.
Bordo, M. D., P. L. Siklos (2015a), “Central Bank Credibility: An Historical
and Quantitative Exploration,” NBER Working Paper No. 20824.
Bordo, M. D., P. L. Siklos (2015b), “Central Bank Credibility Before and After
the Crisis,” NBER Working Paper No. 21710.
Brito, R. D., B. Bystedt (2010), “Inflation Targeting in Emerging Economies: Panel
Evidence,” Journal of Development Economics, Vol. 91(2), pp. 198-210.
Cecchetti, S. G., M. Ehrmann (1999), “Does Inflation Targeting Increase Output
Volatility? An International Comparison of Policymakers’ Preferences and
Outcomes,” NBER Working Paper No. 7426.
Geraats, P. M. (2013), “The Effect of Inflation Targeting: A Mean-Reverting
Mirage?” University of Cambridge Working Paper.

Endogeneity of Inflation Target 24
Gertler, M. (2005), Comment on L. Ball and N. Sheridan, “Does Inflation Targeting Matter?” In The Inflation Targeting Debate, edited by B. S. Bernanke and M. Woodford, 276–81, University of Chicago Press for the NBER.
Cogley, T., G. E. Primiceri, and T. J. Sargent (2010), “Inflation-Gap Persistence in the U.S.?” American Economic Journal: Macroeconomics, Vol. 2(1) pp. 43-69.
Gonçalves, C. E. S., J. M. Salles (2008), “Inflation Targeting in Emerging Economies: What Do the Data Say?” Journal of Development Economics, Vol. 85(1–2), pp. 312-318.
Gonçalves, C. E. S., A. Carvalho (2009), “Inflation Targeting Matters: Evidence from OECD Economies’ Sacrifice Ratios,” Journal of Money, Credit and Banking, Vol. 41(1), pp. 233-243.
Hammond, G. (2012), “State of the Art of Inflation Targeting,” Center for Central Bank Studies Handbook, No. 29, Bank of England.
Hu, Y. (2003), “Empirical Investigations of Inflation Targeting,” IIE Working Paper Series No. 03-6. Institute for International Economics, Washington.
Lin, S., H. Ye (2007), “Does Inflation Targeting Make a Difference? Evaluating the Treatment Effect of Inflation Targeting in Seven Industrial Countries,” Journal of Monetary Economics, Vol. 54(8), pp. 2521-2533.
Lin, S., H. Ye (2009), “Does Inflation Targeting Make a Difference in Developing Countries?” Journal of Monetary Economics, Vol. 89(1), pp. 118-123.
McLeod, R. H. (2008), “Survey of Recent Development,” Bulletin of Indonesian Economic Studies, Vol. 44(2), pp. 183-208.
Mishkin, F. S., K. Schmidt-Hebbel (2002), “One Decade of Inflation Targeting in the World: What Do We Know and What Do We Need to Know?” In Inflation Targeting: Design, Performance, Challenges, edited by N. Loayza and R. Soto, Santiago: Central Bank of Chile.
25 BOK Working Paper No. 2016-18
Mishkin, F. S., M. A. Savastano (2002), “Monetary Policy Strategies for Emerging Market Countries: Lessons from Latin America,” Comparative Economic Studies, Vol. 44(2), pp. 45-82.
Mishkin, F. S. (2005), “The inflation Targeting Debate,” John Kuszczak Memorial Lecture at the Bank of Canada’s Annual Conference, Issues in Inflation Targeting, Ottawa, April 28-29, 2005.
Mishkin, F. S., K. Schmidt-Hebbel (2006), “Does Inflation Targeting Make a Difference?” Central Bank of Chile Working Papers No.404.
Neumann, M. J. M., J. Von Hagen (2002), “Does Inflation Targeting Matter?” Federal Reserve Bank of St. Louis Review, Vol. 84(4), pp. 127-148.
Svensson, Lars E. O. (2010), “Inflation Targeting,” The Handbook of Monetary Economics, Vol. 3, Chapter 2, pp. 127-131.
Uhlig, H. (2004), “Comment” on “The Macroeconomic Effects of Inflation Targeting” by A. T. Levin, F. M. Natalucci, and J. M. Piger, in The Federal Reserve Bank of St. Louis Review, Vol. 86(4), pp. 51-80.
Vega, M., D. Winkelreid (2005), “Inflation Targeting and Inflation Behavior: A Successful Story,” International Journal of Central Banking, Vol. 1(3), pp. 153-175.
Willard, L. B. (2012), “Does Inflation Targeting Matter? A Reassessment,” Applied Economics, Vol. 44(17), pp. 2231-2244.
Appendix: Tables
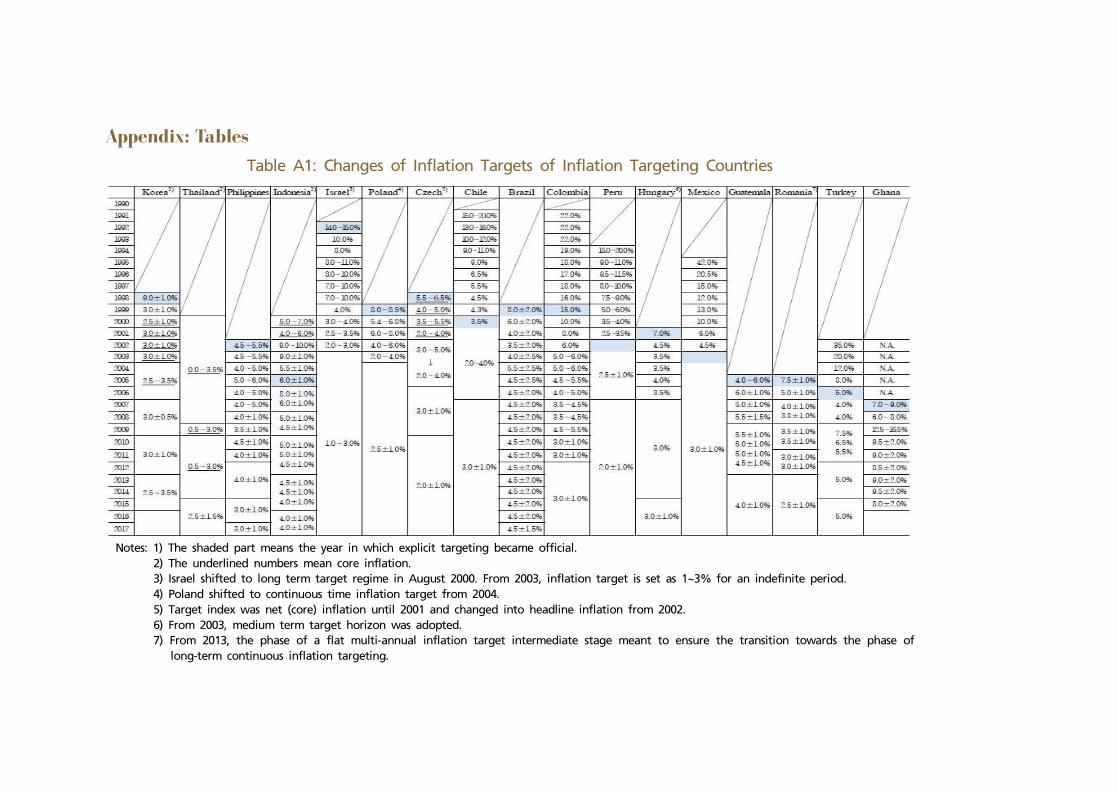
Table A1: Changes of Inflation Targets of Inflation Targeting Countries
Notes: 1) The shaded part means the year in which explicit targeting became official. 2) The underlined numbers mean core inflation. 3) Israel shifted to long term target regime in August 2000. From 2003, inflation target is set as 1~3% for an indefinite period. 4) Poland shifted to continuous time inflation target from 2004. 5) Target index was net (core) inflation until 2001 and changed into headline inflation from 2002. 6) From 2003, medium term target horizon was adopted. 7) From 2013, the phase of a flat multi-annual inflation target intermediate stage meant to ensure the transition towards the phase of
long-term continuous inflation targeting.

Table A1: Changes of Inflation Targets of Inflation Targeting Countries (continued)
Notes: 1) The shaded part means the year in which explicit targeting became official. 2) Inflation target index was changed from RPIX into CPI from 2004. Source: Central Banks, etc.

Table A2: GMM Estimation Result (Equation (2))
Notes: 1) Standard errors are in brackets. *, **, *** mean that the estimates are significant at the 10%, 5%, and 1% significance levels respectively.
2) is the inflation rate of the previous one year, is the average inflation rate of the past two years, and is the
average inflation rate for the past target horizon. 3) Windmeijer (2005) bias-corrected robust standard errors are reported.
First Difference GMM System GMM
One Step GMM Two Step GMM3) One Step GMM Two Step GMM3)
1.519***[0.175]
1.441***[0.188]
1.473***[0.181]
1.438***[0.470]
1.406***[0.474]
1.459***[0.510]
1.486***[0.170]
1.459***[0.178]
1.455***[0.173]
1.418***[0.522]
1.355***[0.491]
1.425***[0.463]
0.420***[0.052]
0.465***[0.048]
0.429***[0.055]
0.416***[0.144]
0.463***[0.0964]
0.428**[0.201]
0.460***[0.049]
0.491***[0.045]
0.451***[0.052]
0.470**[0.189]
0.491***[0.130]
0.451***[0.138]
0.188***
[0.042]0.190**[0.090]
0.157***[0.039]
0.149[0.135]
0.147***
[0.037]0.149**[0.071]
0.124***[0.033]
0.127[0.093]
0.183***
[0.045]0.184[0.203]
0.166***[0.042]
0.168[0.127]
observations 142 142 142 142 142 142 161 161 161 161 161 161
number of instrumental variables
62 62 62 62 62 62 79 79 79 79 79 79

Table A3: Explicit Inflation Targeting Period - GMM Estimation Result (Equation (2))
First Difference GMM System GMM
One Step GMM Two Step GMM3) One Step GMM Two Step GMM3)
1.609***[0.298]
1.757***[0.288]
1.542***[0.298]
1.540***[0.391]
1.669[1.106]
1.525[1.038]
1.593***[0.268]
1.683***[0.262]
1.514***[0.270]
1.582***[0.299]
1.718**[0.755]
1.510***[0.343]
0.336***[0.070]
0.186*[0.101]
0.311***[0.072]
0.340**[0.143]
0.168[0.359]
0.308[0.200]
0.377***[0.061]
0.255***[0.089]
0.356***[0.063]
0.384***[0.100]
0.222*[0.116]
0.358***[0.113]
0.212***
[0.046]0.205**[0.104]
0.179***[0.044]
0.172*[0.090]
0.302***
[0.076]0.309**[0.139]
0.257***[0.072]
0.268**[0.133]
0.240***
[0.051]0.243**[0.096]
0.207***[0.049]
0.206**[0.097]
observations 103 103 103 103 103 103 121 121 121 121 121 121
number of instrumental variables
58 58 58 58 58 58 75 75 75 75 75 75
Notes: 1) Standard errors are in brackets. *, **, *** mean that the estimates are significant at the 10%, 5%, and 1% significance levels respectively.
2) is the inflation rate of the previous one year, is the average inflation rate of the past two years, and is the
average inflation rate for the past target horizon. 3) Windmeijer (2005) bias-corrected robust standard errors are reported.
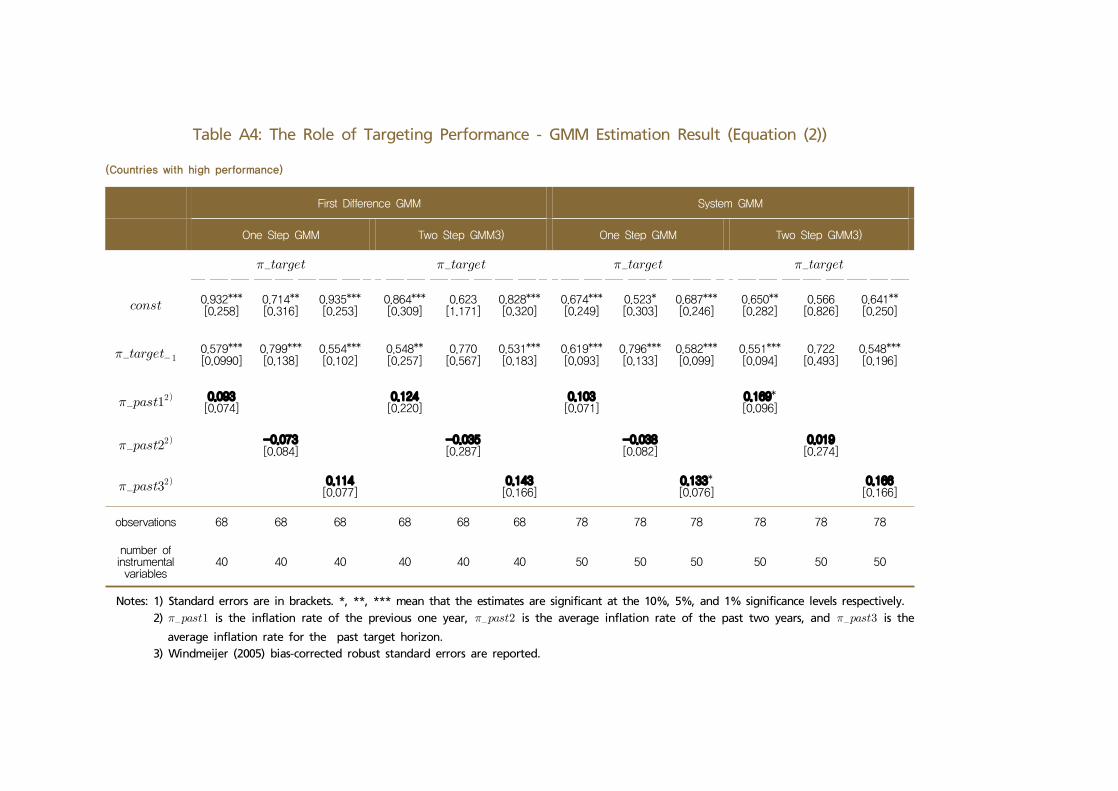
Table A4: The Role of Targeting Performance - GMM Estimation Result (Equation (2))
(Countries with high performance)
First Difference GMM System GMM
One Step GMM Two Step GMM3) One Step GMM Two Step GMM3)
0.932***[0.258]
0.714**[0.316]
0.935***[0.253]
0.864***[0.309]
0.623[1.171]
0.828***[0.320]
0.674***[0.249]
0.523*[0.303]
0.687***[0.246]
0.650**[0.282]
0.566[0.826]
0.641**[0.250]
0.579***[0.0990]
0.799***[0.138]
0.554***[0.102]
0.548**[0.257]
0.770[0.567]
0.531***[0.183]
0.619***[0.093]
0.796***[0.133]
0.582***[0.099]
0.551***[0.094]
0.722[0.493]
0.548***[0.196]
0.093
[0.074]0.124[0.220]
0.103[0.071]
0.169*[0.096]
-0.073
[0.084]-0.035[0.287]
-0.038[0.082]
0.019[0.274]
0.114
[0.077]0.143[0.166]
0.133*[0.076]
0.166[0.166]
observations 68 68 68 68 68 68 78 78 78 78 78 78
number of instrumental variables
40 40 40 40 40 40 50 50 50 50 50 50
Notes: 1) Standard errors are in brackets. *, **, *** mean that the estimates are significant at the 10%, 5%, and 1% significance levels respectively. 2) is the inflation rate of the previous one year, is the average inflation rate of the past two years, and is the
average inflation rate for the past target horizon. 3) Windmeijer (2005) bias-corrected robust standard errors are reported.

(Countries with low performance)
First Difference GMM System GMM
One Step GMM Two Step GMM3) One Step GMM Two Step GMM3)
1.696***[0.267]
1.474***[0.302]
1.625***[0.290]
1.541***[0.583]
1.449**[0.730]
1.439[1.171]
1.774***[0.261]
1.682***[0.280]
1.721***[0.273]
1.679***[0.525]
1.622**[0.693]
1.406[1.618]
0.370***[0.061]
0.417***[0.053]
0.393***[0.067]
0.380**[0.184]
0.414*[0.229]
0.407[0.420]
0.433***[0.057]
0.466***[0.051]
0.435***[0.062]
0.432**[0.189]
0.464**[0.192]
0.462[0.437]
0.236***
[0.051]0.223*[0.127]
0.177***[0.046]
0.174[0.117]
0.209***
[0.045]0.209[0.144]
0.152***[0.039]
0.156[0.110]
0.220***
[0.057]0.227[0.272]
0.178***[0.050]
0.186[0.228]
observations 74 74 74 74 74 74 83 83 83 83 83 83
number of instrumental variables
49 49 49 49 49 49 66 66 66 66 66 66
Notes: 1) Standard errors are in brackets. *, **, *** mean that the estimates are significant at the 10%, 5%, and 1% significance levels respectively. 2) is the inflation rate of the previous one year, is the average inflation rate of the past two years, and is the
average inflation rate for the past target horizon. 3) Windmeijer (2005) bias-corrected robust standard errors are reported.

Endogeneity of Inflation Target 32
Table A5: Performance Indicator and Country Group
Country Performance Indicator Group
Thailand 1.1 High
Canada 1.1 High
Korea 1.7 High
Peru 2.7 High
New Zealand 3.0 High
Philippines 3.8 High
Poland 3.8 High
Czech 4.1 High
Israel 6.0 High
Chile 6.4 High
Hungary 6.5 Low
Romania 6.6 Low
Colombia 8.1 Low
Guatemala 8.5 Low
Indonesia 12.0 Low
Brazil 12.7 Low
Ghana 27.6 Low
Mexico 29.1 Low
Turkey 40.4 Low
Average 6.9 -
Note: 1) “High”and“Low”indicate high and low performance group respectively.

<Abstract in Korean>
물가목표의 내생성
김소영*, 임근형**
물가안정목표제 하에서 중앙은행들은 원칙적으로 물가목표를 선제적으로
설정하고 난 후 실제 인플레이션이 물가목표와 근접하도록 통화정책을 운영하
게 된다. 하지만 현실적으로는 실제 인플레이션과 물가목표 간의 괴리를 해소
하기 위해 물가목표를 과거 인플레이션에 부합하는 수준에서 설정하려는 유인
이 존재할 가능성이 있다. 본고는 물가안정목표제를 운영 중인 19개 국가를 대
상으로 물가목표 설정 과정에 있어서의 내생성 존재 여부를 다양한 실증분석
방법을 통해 살펴보았다. 실증분석 결과 실제 인플레이션이 다음 기의 물가목
표 설정에 유의한 영향을 미치는 것으로 나타났다. 뿐만 아니라 물가목표 달성
성과가 낮거나 평판이 좋지 않은 중앙은행일수록 실제 인플레이션 움직임을
뒤따라 물가목표를 조정하는 성향이 강한 것으로 분석되었다.
핵심 주제어: 물가안정목표제, 인플레이션, 물가목표, 내생성
JEL Classification: E31, E58
* 서울대학교 경제학부 교수 (전화: 02-880-2689, E-mail: [email protected])** 한국은행 경제연구원 거시경제연구실 부연구위원 (전화: 02-759-5349, E-mail: [email protected])
본 연구내용은 집필자의 개인의견이며 한국은행의 공식견해와는 무관합니다. 따라서 본 논문의 내용을 보도하거나 인용할 경우에는 집필자 명을 반드시 명시하여 주시기 바랍니다.
BOK 경제연구 발간목록한국은행 경제연구원에서는 Working Paper인 『BOK 경제연구』를 수시로 발간하고 있습니다.
BOK 경제연구』는 주요 경제 현상 및 정책 효과에 대한 직관적 설명 뿐 아니라 깊이 있는
이론 또는 실증 분석을 제공함으로써 엄밀한 논증에 초점을 두는 학술논문 형태의 연구이며
한국은행 직원 및 한국은행 연구용역사업의 연구 결과물이 수록되고 있습니다.
BOK 경제연구』는 한국은행 경제연구원 홈페이지(http://imer.bok.or.kr)에서 다운로드하여
보실 수 있습니다.
제2014 -1 Network Indicators for Monitoring Intraday Liquidity in BOK-Wire+
Seungjin Baek⋅Kimmo Soram ki⋅Jaeho Yoon
2 중소기업에 대한 신용정책 효과 정호성⋅임호성
3 경제충격 효과의 산업간 공행성 분석 황선웅⋅민성환⋅신동현⋅김기호
4 서비스업 발전을 통한 내외수 균형성장: 기대효과 및 리스크
김승원⋅황광명
5 Cross-country-heterogeneous and Time-varying Effects of Unconventional Monetary Policies in AEs on Portfolio Inflows to EMEs
Kyoungsoo Yoon⋅Christophe Hurlin
6 인터넷뱅킹, 결제성예금 및 은행 수익성과의 관계 분석
이동규⋅전봉걸
7 Dissecting Foreign Bank Lending Behavior During the 2008-2009 Crisis
Moon Jung Choi⋅Eva Gutierrez⋅Maria Soledad Martinez Peria
8 The Impact of Foreign Banks on Monetary Policy Transmission during the Global Financial Crisis of 2008-2009: Evidence from Korea
Bang Nam Jeon⋅Hosung Lim⋅Ji Wu
9 Welfare Cost of Business Cycles in Economies with Individual Consumption Risk
Martin Ellison⋅Thomas J. Sargent
10 Investor Trading Behavior Around the Time of Geopolitical Risk Events: Evidence from South Korea
Young Han Kim⋅Hosung Jung
11 Imported-Inputs Channel of Exchange Rate Pass-Through: Evidence from Korean Firm-Level Pricing Survey
Jae Bin Ahn⋅Chang-Gui Park
제2014 -12 비대칭 금리기간구조에 대한 실증분석 김기호
13 The Effects of Globalization on Macroeconomic Dynamics in a Trade-Dependent Economy:the Case of Korea
Fabio Milani⋅Sung Ho Park
14 국제 포트폴리오투자 행태 분석: 채권-주식 투자자금간 상호관계를 중심으로
이주용⋅김근영
15 북한 경제의 추격 성장 가능성과 정책 선택 시나리오
이근⋅최지영
16 Mapping Korea's International Linkages using Generalised Connectedness Measures
Hail Park⋅Yongcheol Shin
17 국제자본이동 하에서 환율신축성과 경상수지 조정: 국가패널 분석
김근영
18 외국인 투자자가 외환시장과 주식시장 간 유동성 동행화에 미치는 영향
김준한⋅이지은
19 Forecasting the Term Structure of Government Bond Yields Using Credit Spreads and Structural Breaks
Azamat Abdymomunov⋅Kyu Ho Kang⋅Ki Jeong Kim
20 Impact of Demographic Change upon the Sustainability of Fiscal Policy
Younggak Kim⋅Myoung Chul Kim⋅Seongyong Im
21 The Impact of Population Aging on the Countercyclical Fiscal Stance in Korea, with a Focus on the Automatic Stabilizer
Tae-Jeong Kim⋅Mihye Lee⋅Robert Dekle
22 미 연준과 유럽중앙은행의 비전통적 통화정책 수행원칙에 관한 고찰
김병기⋅김진일
23 우리나라 일반인의 인플레이션 기대 형성 행태 분석
이한규⋅최진호

제2014 -24 Nonlinearity in Nexus between Working Hours and Productivity
Dongyeol Lee⋅Hyunjoon Lim
25 Strategies for Reforming Korea's Labor Market to Foster Growth
Mai Dao ‧Davide Furceri⋅Jisoo Hwang⋅Meeyeon Kim⋅Tae-Jeong Kim
26 글로벌 금융위기 이후 성장잠재력 확충: 2014 한국은행 국제컨퍼런스 결과보고서
한국은행 경제연구원
27 인구구조 변화가 경제성장률에 미치는 영향: 자본이동의 역할에 대한 논의를 중심으로
손종칠
28 Safe Assets Robert J. Barro
29 확장된 실업지표를 이용한 우리나라 노동시장에서의 이력현상 분석
김현학⋅황광명
30 Entropy of Global Financial Linkages Daeyup Lee
31 International Currencies Past, Present and Future: Two Views from Economic History
Barry Eichengreen
32 금융체제 이행 및 통합 사례:남북한 금융통합에 대한 시사점
김병연
33 Measuring Price-Level Uncertainty and Instability in the U.S., 1850-2012
Timothy Cogley⋅Thomas J. Sargent
34 고용보호제도가 노동시장 이원화 및 노동생산성에 미치는 영향
김승원
35 해외충격시 외화예금의 역할 : 주요 신흥국 신용스프레드에 미치는 영향을 중심으로
정호성⋅우준명
36 실업률을 고려한 최적 통화정책 분석 김인수⋅이명수
37 우리나라 무역거래의 결제통화 결정요인 분석 황광명⋅김경민⋅노충식⋅김미진
38 Global Liquidity Transmission to Emerging Market Economies, and Their Policy Responses
Woon Gyu Choi⋅Taesu Kang⋅Geun-Young Kim⋅Byongju Lee

제2015 -1 글로벌 금융위기 이후 주요국 통화정책 운영체계의 변화
김병기⋅김인수
2 미국 장기시장금리 변동이 우리나라 금리기간구조에 미치는 영향 분석 및 정책적 시사점
강규호⋅오형석
3 직간접 무역연계성을 통한 해외충격의 우리나라 수출입 파급효과 분석
최문정⋅김근영
4 통화정책 효과의 지역적 차이 김기호
5 수입중간재의 비용효과를 고려한 환율변동과 수출가격 간의 관계
김경민
6 중앙은행의 정책금리 발표가 주식시장 유동성에 미치는 영향
이지은
7 은행 건전성지표의 변동요인과 거시건전성 규제의 영향
강종구
8 Price Discovery and Foreign Participation in The Republic of Korea's Government Bond Futures and Cash Markets
Jaehun Choi⋅Hosung Lim⋅Rogelio Jr. Mercado⋅Cyn-Young Park
9 규제가 노동생산성에 미치는 영향: 한국의 산업패널 자료를 이용한 실증분석
이동렬⋅최종일⋅이종한
10 인구 고령화와 정년연장 연구(세대 간 중첩모형(OLG)을 이용한 정량 분석)
홍재화⋅강태수
11 예측조합 및 밀도함수에 의한 소비자물가 상승률 전망
김현학
12 인플레이션 동학과 통화정책 우준명
13 Failure Risk and the Cross-Section of Hedge Fund Returns
Jung-Min Kim
14 Global Liquidity and Commodity Prices Hyunju Kang⋅Bok-Keun Yu⋅Jongmin Yu
15 Foreign Ownership, Legal System and Stock Market Liquidity
Jieun Lee⋅Kee H. Chung

제2015 -16 바젤Ⅲ 은행 경기대응완충자본 규제의 기준지표에 대한 연구
서현덕⋅이정연
17 우리나라 대출 수요와 공급의 변동요인 분석 강종구⋅임호성
18 북한 인구구조의 변화 추이와 시사점 최지영
19 Entry of Non-financial Firms and Competition in the Retail Payments Market
Jooyong Jun
20 Monetary Policy Regime Change and Regional Inflation Dynamics: Looking through the Lens of Sector-Level Data for Korea
Chi-Young Choi⋅Joo Yong Lee⋅Roisin O'Sullivan
21 Costs of Foreign Capital Flows in Emerging Market Economies: Unexpected Economic Growth and Increased Financial Market Volatility
Kyoungsoo Yoon⋅Jayoung Kim
22 글로벌 금리 정상화와 통화정책 과제: 2015년 한국은행 국제컨퍼런스 결과보고서
한국은행 경제연구원
23 The Effects of Global Liquidity on Global Imbalances
Marie-Louise DJIGBENOU-KRE⋅Hail Park
24 실물경기를 고려한 내재 유동성 측정 우준명⋅이지은
25 Deflation and Monetary Policy Barry Eichengreen
26 Macroeconomic Shocks and Dynamics of Labor Markets in Korea
Tae Bong Kim⋅Hangyu Lee
27 Reference Rates and Monetary Policy Effectiveness in Korea
Heung Soon Jung⋅Dong Jin Lee⋅Tae Hyo Gwon⋅Se Jin Yun
28 Energy Efficiency and Firm Growth Bongseok Choi⋅Wooyoung Park⋅Bok-Keun Yu
29 An Analysis of Trade Patterns in East Asia and the Effects of the Real Exchange Rate Movements
Moon Jung Choi⋅Geun-Young Kim⋅Joo Yong Lee
30 Forecasting Financial Stress Indices in Korea: A Factor Model Approach
Hyeongwoo Kim⋅Hyun Hak Kim⋅Wen Shi

제2016 -1 The Spillover Effects of U.S. Monetary Policy on Emerging Market Economies: Breaks, Asymmetries and Fundamentals
Geun-Young Kim⋅Hail Park⋅Peter Tillmann
2 Pass-Through of Imported Input Prices to Domestic Producer Prices: Evidence from Sector-Level Data
JaeBin Ahn⋅Chang-Gui Park⋅Chanho Park
3 Spillovers from U.S. Unconventional Monetary Policy and Its Normalization to Emerging Markets: A Capital Flow Perspective
Sangwon Suh⋅Byung-Soo Koo
4 Stock Returns and Mutual Fund Flows in the Korean Financial Market: A System Approach
Jaebeom Kim⋅ Jung-Min Kim
5 정책금리 변동이 성별 ‧ 세대별 고용률에 미치는 영향
정성엽
6 From Firm-level Imports to Aggregate Productivity: Evidence from Korean Manufacturing Firms Data
JaeBin Ahn⋅Moon Jung Choi
7 자유무역협정(FTA)이 한국 기업의 기업내 무역에 미친 효과
전봉걸⋅김은숙⋅이주용
8 The Relation Between Monetary and Macroprudential Policy
Jong Ku Kang
9 조세피난처 투자자가 투자 기업 및 주식시장에 미치는 영향
정호성⋅김순호
10 주택실거래 자료를 이용한 주택부문 거시건전성 정책 효과 분석
정호성⋅이지은
11 Does Intra-Regional Trade Matter in Regional Stock Markets?: New Evidence from Asia-Pacific Region
Sei-Wan Kim⋅Moon Jung Choi
12 Liability, Information, and Anti-fraud Investment in a Layered Retail Payment Structure
Kyoung-Soo Yoon⋅Jooyong Jun
13 Testing the Labor Market Dualism in Korea
Sungyup Chung⋅Sunyoung Jung
14 북한 이중경제 사회계정행렬 추정을 통한 비공식부문 분석
최지영

제2016 -15 Divergent EME Responses to Global and Domestic Monetary Policy Shocks
Woon Gyu Choi⋅Byongju Lee⋅ Taesu Kang⋅Geun-Young Kim
16 Loan Rate Differences across Financial Sectors: A Mechanism Design Approach
Byoung-Ki Kim⋅Jun Gyu Min
17 근로자의 고용형태가 임금 및 소득 분포에 미치는 영향
최충⋅정성엽
18 Endogeneity of Inflation Target Soyoung Kim ⋅Geunhyung Yim