enea 2014 fy
TRANSCRIPT

We have been consistently realising the vision of an integrated, flexible and efficient energy group Q4 2014, 2014
Warsaw, 20 March 2015

2
We have built a strong organisation capable of rivalry on the competitive market
2013
2014
New corporate governance
Shared Services Centre
New customer service model
New model of product billing
Membership in London commodity
exchange
Sales in the whole of Poland
Integrated management
systems
Non-core companies
restructuring
Risk management policies
Market Maker on PPE
Process automation
Skills management
Attractive range of products and
services
Consistent realisation of
the investment programme
Group’s strategy
Consolidation of production fuels
trading
Integration of the Generation
Area
Code of Ethics
Fast Close
Investment financing
restructuring
Insurance Policy
Tax Capital Group Sales channels optimisation
Integration of distribution
service
Management by objectives
Gas trade Centralisation of purchases
Business Continuity
Management
MPEC Białystok
Management information model
Code of Values
Innovations
ENEA fundation

3
We operate based on three efficiently interacting segments
Trade Distribution
• Customer service centralisation • Competitive product portfolio • Non-standard structured origination
products • Construction of Polish-wide sales
structures • Market Maker on PPE • Access to the most liquid in Europe
market of CO2 allowances
• Programme enhancing reliability and reducing network failure rate
• Significant improvement of SAIDI and SAIFI ratios
• Development of information tools supporting the grid management
• Construction and reconstruction of overhead cable lines and switching stations
• CAPEX 2014 – PLN 826 mln
• 3 competence areas: • System Power Plants • Heat and cogeneration • RES
• Takeover of MPEC Białystok • Unit No. 11 • Cogeneration combined heat
and power plant in Piła • Heat recovery system in
Białystok Heat and Power Plant • Limitation of concentrations
of emitted pollutions • CAPEX 2014 – PLN 1,832 mln
Generation

4
Agenda
Energy market and key operating data
ENEA CG's financial results in 2014 and Q4 2014
Modern management model of ENEA CG
New unit in Kozienice Power Plant

ENEA Group strengthens its position on the competitive energy market
Grzegorz Kinelski Vice-President of the Management Board for Commercial Affairs

Energy market and key operating data
In 2014 the existing downward trend reversed on the energy market
6
• Higher average price of baseload by 16.9% yoy • SPOT market was influenced by: • the introduced mechanism of remunerating
for the operating power reserve • loss in power available for OTSs • situation on the European Carbon market • limitations in the intersystemic exchange
• Almost for the whole 2014 energy prices on the forward market were in the upward trend
• The average price of baseload increased in 2015 by 4.9% to 168.13 PLN/MWh (in relation to the average baseload price for 2014)
• At the end of quotations the price of BASE Y-15 amounted to 177.00 PLN/MWh and was by 17.2% higher than BASE Y-14 at the end of quotations
150
160
170
180
190
200
210
I II III IV V VI VII VIII IX X XI XII
2014
BASE_Y-15 BASE_Y-16 SPOT 2013-14
BASE Y-15, BASE Y-16 prices vs. SPOT prices

Energy market and key operating data
• The emission allowances market was affected by works over:
• the so called backloading • keeping free allowances for energy consuming
industry in order to reduce the carbon leakage phenomenon
• determination of the strategy of the new climate and energy package
• market stabilisation reserve • Price of EUA allowances on SPOT market in 2014
increased by over 50% during 2014
• Coal prices on foreign markets at the end of 2014
were on the lowest level since 2012 • Prices reported at the end of 2014
• Amsterdam-Rotterdam-Antwerp: 70.68 USD/t • Richards Bay: 65.95 USD/t • Newcastle: 63.53 USD/t
Global prices of coal regularly decrease
7
60
70
80
90
100
110
120
I II III IV V VI VII VIII IX X XI XII I II III IV V VI VII VIII IX X XI XII I II III IV V VI VII VIII IX X XI XII
2012 2013 2014
USD
/t
Monthly indices of coal prices (globalCOAL)
Richards Bay (RPA) Newcastle (Australia) Amsterdam-Rotterdam-Antwerpia
4
5
6
7
8
I II III IV V VI VII VIII IX X XI XII
2014
EUR/
t
Cena CO2 Dec-15CO2 price Dec-15
EUA price

Energy market and key operating data
8
In 2014 we reconstructed the electricity sales portfolio
14 747 14 935
13 205
16 339
3 942 4 115
3 540 3 700
2 500
3 500
4 500
5 500
6 500
7 500
10 000
12 000
14 000
16 000
18 000
2011 2012 2013 2014
PLN
mln
GW
h
Sales volume Sales revenue
Due to introducing new products into the range and reorganisation of the sales area we reconstructed the portfolio of electricity sales to business customers. At the same time, we managed to maintain the level of sales to household customers.
Sales of electricity to end users

Energy market and key operating data
9
ENEA Group increased energy production
[GWh] Q4 2013 Q4 2014 Change 2013 2014 Change
Total generation of energy, including:
2 866 3 357 17.1% √ 11 854 12 812 8.1% √
Conventional generation
2 569 3 099 20.6% √ 10 890 11 779 8.2% √
Generation from RES
297 258 -13.1% 964 1 033 7.2% √
In 2014 ENEA Group increased production of energy both from conventional sources and RES
In Q4 2014, RES production dropped due to lesser windiness, hydrological conditions, reduced co-firing

10
Agenda
ENEA CG's financial results in 2014 and Q4 2014
Modern management model of ENEA CG
Energy market and key operating data
New unit in Kozienice Power Plant

ENEA Group improved financial results in the demanding market environment
Dalida Gepfert Vice-President of the Management Board for Financial Affairs

ENEA CG's financial results in 2014 and Q4 2014
12
We reported better financial results
[PLN mln] Q4 2013 Q4 2014 Change 2013 2014 Change
Net sales revenue 2 363.3 2 628.2 11.2% √ 9 150.5 9 855.4 7.7% √
EBITDA 273.5 399.1 45.9% √ 1 667.6 1 914.9 14.8% √
Net profit 60.9 72.8 19.6% √ 722.5 909.1 25.8% √
Net debt/EBITDA -0.6 0.5 1.1 -0.6 0.5 1.1
ENEA CG's financial results in 2014 and Q4 2014
13
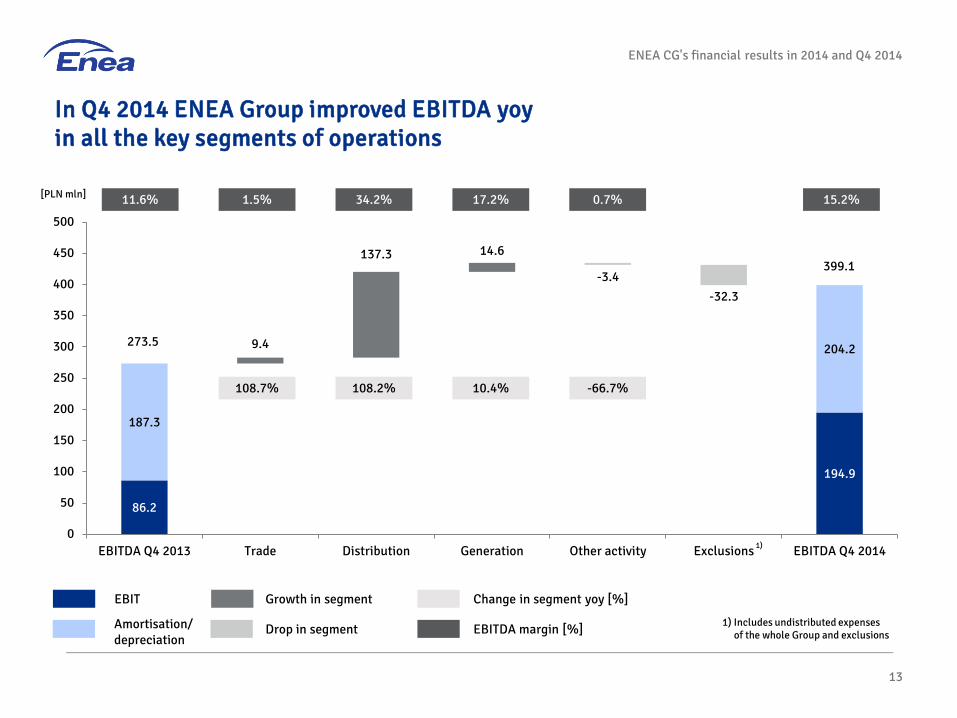
In Q4 2014 ENEA Group improved EBITDA yoy in all the key segments of operations
86.2
194.9
187.3
204.2 9.4
137.3 14.6
-3.4 -32.3
0
50
100
150
200
250
300
350
400
450
500
EBITDA Q4 2013 Trade Distribution Generation Other activity Exclusions EBITDA Q4 2014
[PLN mln]
EBIT Growth in segment
Drop in segment
Change in segment yoy [%]
EBITDA margin [%]
11.6% 34.2% 17.2% 0.7% 15.2% 1.5%
108.7% 108.2% 10.4% -66.7%
273.5
399.1
1)
1) Includes undistributed expenses of the whole Group and exclusions
Amortisation/ depreciation

ENEA CG's financial results in 2014 and Q4 2014
Segment of trade Increase of EBITDA by PLN 9.4 mln (108.7%) • lower average purchase price of energy by 10.4% √ • higher volumes of sales by 889 GWh √ • lower average selling price by 11.1% • higher written-off debts by PLN 11 mln Segment of distribution Increase of EBITDA by PLN 137.3 mln (108.2%) • average price lower by 19% and lower volumes of energy purchases
for covering the book-tax difference and own needs by 143 GWh √ • employment and exploitation process optimisation √ • lower costs of legal regulations under grid assets by PLN 134 mln √ • higher costs of transmission services by PLN 33 mln Segment of generation Increase of EBITDA by PLN 14.6 mln (10.4%) • lower fixed costs by PLN 39 mln √ • higher revenue from sales of heat (by PLN 31 mln)
and electricity (by PLN 9 mln) in the segment of heat • asset write-down in the biogas area (PLN 30 mln)
14
In Q4 2014 ENEA Group improved EBITDA yoy in all the key segments of operations
[PLN mln] Q4 2013 Q4 2014 Change
Generation 140.9 155.5 10.4%
[PLN mln] Q4 2013 Q4 2014 Change
Trade 8.7 18.1 108.7%
[PLN mln] Q4 2013 Q4 2014 Change
Distribution 126.9 264.2 108.2%

ENEA CG's financial results in 2014 and Q4 2014
15
In 2014 the highest result and the greatest increase in EBITDA was reported in the segment of distribution of ENEA Group
905.9 1 186.5
761.8
728.4
225.8 148.6
-101.8
-10.3 -15.1
0
500
1 000
1 500
2 000
2 500
EBITDA 2013 Trade Distribution Generation Other activity Exclusions EBITDA 2014
[PLN mln]
EBIT
Amortisation/ depreciation
Growth in segment
Drop in segment
18.2% 38.8% 20.3% 5.3% 19.4% 2.5%
-48.9% 24.2% 26.6% -31.6%
Change in segment yoy [%]
EBITDA margin [%]
1 667.6
1 914.9
1)
1) Includes undistributed expenses of the whole Group and exclusions

ENEA CG's financial results in 2014 and Q4 2014
Segment of trade Drop of EBITDA by PLN 101.8 mln (48.9%) • lower average purchase price of energy by 12.4% √ • higher volumes of sales by 3,123 GWh √
• lower average selling price by 15.6% • reduction in household tariff • higher costs of ecological obligations by PLN 52 mln Segment of distribution Increase of EBITDA by PLN 225.8 mln (24.2%) • average price lower by 17% and lower volumes of energy purchases
for covering the book-tax difference and own needs by 247 GWh √ • employment and exploitation process optimisation √ • lower costs of legal regulations under grid assets by PLN 166 mln √
• higher costs of transmission services by PLN 110 mln Segment of generation Increase of EBITDA by PLN 148.6 mln (26.6%) • higher revenue from compensation for recovery of stranded
costs by PLN 257 mln √ • lower fixed costs by PLN 62 mln √ • higher revenue from sales of heat (by PLN 24 mln)
and electricity (by PLN 20 mln) in the segment of heat √ • lower margin on generation of electricity by PLN 95 mln • asset write-down in the biogas area (PLN 30 mln) • loss of EBITDA due to failure of unit No. 9 by PLN 23 mln
16
In 2014 the highest result and the greatest increase in EBITDA was reported in the segment of distribution of ENEA Group
[PLN mln] 2013 2014 Change
Generation 559.4 708.0 26.6%
[PLN mln] 2013 2014 Change
Trade 208.2 106.5 -48.9%
[PLN mln] 2013 2014 Change
Distribution 933.6 1 159.4 24.2%

ENEA CG's financial results in 2014 and Q4 2014
17
Despite the realisation of an ambitious CAPEX programme, the Group maintains the debt ratio on a safe level
1 573
687
909
728
1 116
-407
-258
-2 538
-436
-500
0
500
1 000
1 500
2 000
2 500
3 000
3 500
Cash as at1 January 2014
Net profit Amortization anddepreciation
Working capitalwithout LTA
Receivablesfrom LTA
CAPEX¹ External funding Other² Cash as at31 December
2014
1) Acquisition of tangible and intangible assets and acquisition of shares in MPEC Białystok for PLN 260 mln 2) Including distribution of dividend (PLN 252 mln)
[PLN mln]

Activities undertaken in 2014-2016 will allow to reduce costs by around PLN 500 mln
ENEA CG's financial results in 2014 and Q4 2014
18
Focusing on profitability improvement and a high cost discipline bring indicative effects to the Group
[PLN mln] 2014 forecast 2014 realisation
Generation 130 133
Distribution 64 102
Sales 5 9
SSC 5 5
Other companies 4 3
Total 208 252 √

ENEA CG's financial results in 2014 and Q4 2014
19
A modern management model and the implemented efficiency improvement programme positively affect the financial results of ENEA CG
Financial results of ENEA CG exceeded the consensus
CAPEX expenditures totalling to PLN 2.7 billion in 2014 with a low value of net debt/EBITDA ratio on the level of 0.5
PLN 252 mln cost savings in 2014 - by 152% more than anticipated in the strategy
Management process optimisation allows for a swift reaction and adjusting to the current conditions on the energy market

20
Agenda
ENEA CG's financial results in 2014 and Q4 2014
Modern management model of ENEA CG
Energy market and key operating data
New unit in Kozienice Power Plant

Thanks to the reorganisation of structures and process we have built competitive advantages on the market
Krzysztof Zamasz President of the Board

Modern management model of ENEA CG
New corporate governance:
New corporate governance changed the way the functions in the Group are managed
Introduced a clear and effective Capital Group's management model
Guarantees efficient and transparent management of all the companies
Defines the issue of the Group's interest in order to implement the strategy
Introduced relevant amendments to the Statutes of ENEA Group Companies, rules of the Boards and their Supervisory Boards guaranteeing efficient management
Improved the decision making model due to transferring of some competences to Committees and entities managing the Management Departments
Committees and Management Departments in ENEA Group
The Management Board of ENEA S.A.
Trade and Promotion Committee
Finance and IT Committee Risk Committee
Compliance Committee
Management Committee
Investment Committee
Audit Management Department
Purchase Management Department
HR Management Department
Security and Legal Service Management
Department
Communication Management Department
22

SSC
Customer Service
IT
Finance and Accounting
Personnel
Logistics
Legal Services
coordination
Modern management model of ENEA CG
23
The structure built with Customer needs in mind raises the efficiency and facilitates management
We are implementing almost 30 optimisation projects aiming at the facilitation and fastening of the day to day operations, which will contribute to raising the quality of our services
We improved the management process
We have shortened the decision making path
We efficiently use the employee potential and knowledge in the Group
We introduce homogeneous standards of provided services
We have reduced costs (elimination of bureaucracy and task doubling)

Modern management model of ENEA CG
24
New integrated information systems support process management
SAP
• Automation and raising the specialisation level • Increasing the elasticity of business processes • Reduction of costs related to maintaining separate systems • Standardised and tailored executive reports
Integration of key information on the company in one place
ENEA, ENEA Operator, ENEA Centrum, ENEA Trading
IFS
• Business process optimisation • Implementation of a uniform solution in units
being part of the segment of generation • Optimal use of the system licences and dedicated database • Building the competence centre
Management support with the area of generation
ENEA Wytwarzanie
WORKFLOW
• Improvement of work in SAP/IFS system • Optimisation of costs and time related to logistics, storing,
management, printing and copying paper documents • Increasing the safety of document circulation • Development of a central repository of documents
Organisation of the purchase documents circulation
ENEA, ENEA Operator, ENEA Centrum, ENEA Trading, ENEA Wytwarzanie
CCSS
• Standardisation and improvement
of the Customer Service quality • Optimisation of the information infrastructure
supporting Customer Service processes • Starting e-Invoices and electronic channels
of Customer service: e-CSC, e-Payments • Better efficiency of post-sales servicing processes
Starting of the central billing system and CRM - Comprehensive Customer Service
System (CCSS)
ENEA, ENEA Operator, ENEA Centrum

Modern management model of ENEA CG
In 2015, we are planning to increase the capital expenditures in all the areas of operations:
25
Implemented organisational solutions allow for building an optimum investment portfolio
Area of generation - mainly unit 11 and wind farm acquisitions
Area of distribution - mainly improvement of reliability ratios (infrastructure modernisation, connection of new recipients and energy generators)
Capital expenditures [PLN mln]
2013 2014 2015 plan
Generation 1 265 1 832 2 509
Unit 11 969 1 096 1 587
RES 16 13 418
Distribution 900 826 899
Support and other 29 91 125
TOTAL 2 195 2 749 3 558
Optimal investment
portfolio
Investment decisions
Investment Committee;
ENEA's Board
ENEA CG financial
model
Guarantee of a homogeneous assessment of investment
projects and selection of the best projects
Continuous observation of the macroeconomic, legal and
energy market environment
Projection of ENEA Group's development
in the long run
ENEA CG strategy
Environment monitoring

Modern management model of ENEA CG
Key features of the coordinated model:
26
Adopted rules of risk management are set based on the highest management standards and are compliant with best market practices within this area
The concept of the risk management in ENEA Group was based on the coordinated model. The key strategy of its functioning is coordination of the risk management processes in the Group by ENEA S.A.
The Group Companies manage risks based on homogeneous standards specified in Policies and Procedures
The Companies manage risks operationally within allocated limits and subject to the rules approved by ENEA Group's Risk Committee
Particular companies report to the parent company within realised activities as regards risk management
ENEA S.A. is the process coordinator in the Group
Front-, Middle- and Back Office organisational division is in force in the companies
27
ENEA CG's financial results in 2014 and Q4 2014
Modern management model of ENEA CG
Agenda
Energy market and key operating data
New unit in Kozienice Power Plant

Commissioning of the new unit will allow to maximise production and margin level
Paweł Orlof Vice-President of the Management Board for Corporate Affairs

0%
20%
40%
60%
80%Scope of works preformed in 2014
New unit in Kozienice Power Plant
29
2014 was a key period for a successful investment implementation
2012 – 2013 2014 2015
Performance of a reinforced concrete structure of the cooling tower jacket to the level of 163 m
Performance of the lower foundation slab with poles of the load bearing structure of the turbine set
Performance of the foundation and steel structure for the engine room to the level of 17 m
Completion of the assembly of the boiler's load bearing structure with grate
Completion of the boiler slab assembly
Completion of the assembly of absorber's and IOS blowdown tank's structure

We have been consistently realising the vision of an integrated, flexible and efficient energy group Q4 2014, 2014
IR contact: [email protected]

Additional information
Additional information
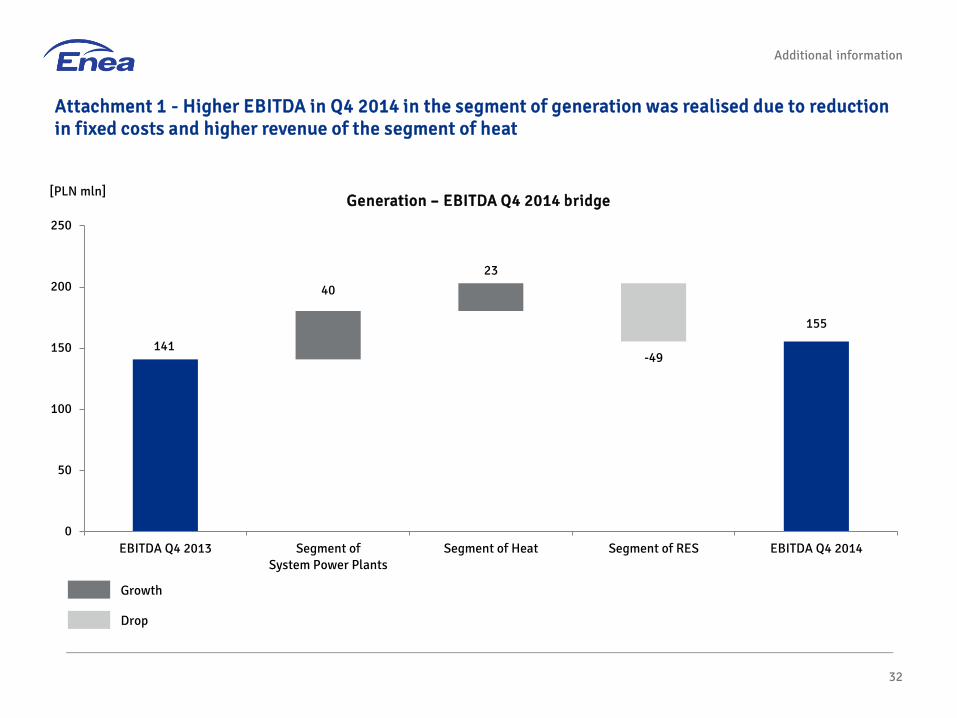
Attachment 1 - Higher EBITDA in Q4 2014 in the segment of generation was realised due to reduction in fixed costs and higher revenue of the segment of heat
32
40 23
-49 141
155
0
50
100
150
200
250
EBITDA Q4 2013 Segment ofSystem Power Plants
Segment of Heat Segment of RES EBITDA Q4 2014
[PLN mln] Generation – EBITDA Q4 2014 bridge
Growth
Drop

Additional information
Attachment 2 - EBITDA in the segment of trade increased by 143% yoy in Q4 2014 due to higher volumes of sales and lower electricity purchase price
33
15
3
-9
9
18
0
5
10
15
20
25
30
EBITDA Q4 2013 First contribution margin Cost of sales Other factors EBITDA Q4 2014
[PLN mln] Trade – EBITDA Q4 2014 bridge
Growth
Drop

Additional information
Attachment 3 - Lower costs of legal regulations under grid assets, exploitation process and employment optimisation affected the growth of EBITDA in the segment of distribution in Q4 2014
34
9
138
-8 -2
127
264
0
50
100
150
200
250
300
EBITDA Q4 2013 Regulation Gird assets Organisation Other factors EBITDA Q4 2014
[PLN mln] Distribution – EBITDA Q4 2014 bridge
Growth
Drop
Additional information
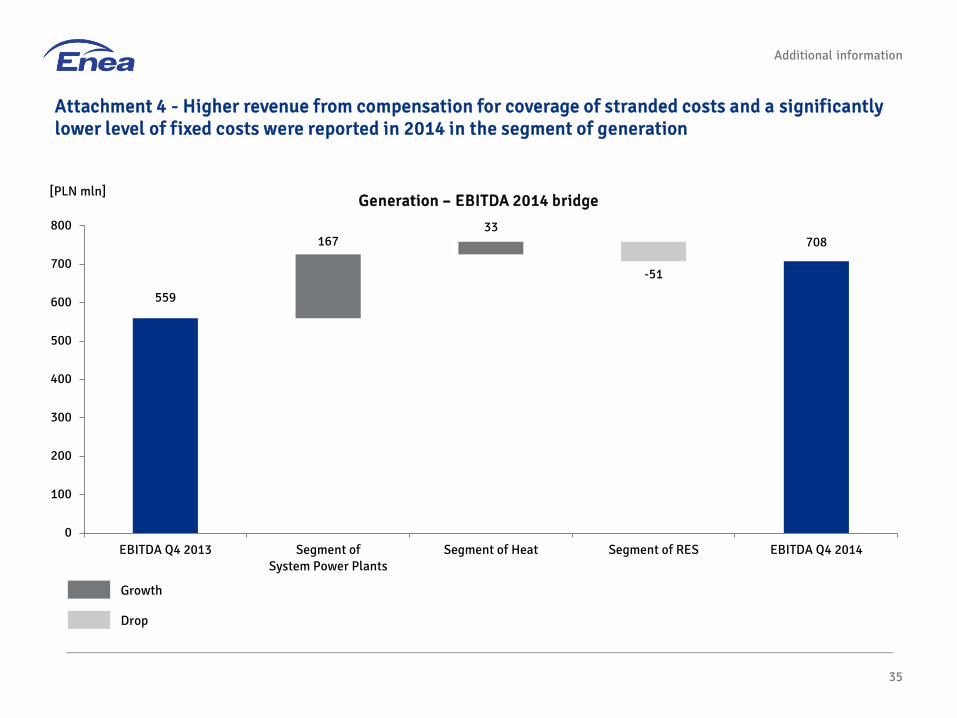
Attachment 4 - Higher revenue from compensation for coverage of stranded costs and a significantly lower level of fixed costs were reported in 2014 in the segment of generation
35
167 33
-51
559
708
0
100
200
300
400
500
600
700
800
EBITDA Q4 2013 Segment ofSystem Power Plants
Segment of Heat Segment of RES EBITDA Q4 2014
[PLN mln] Generation – EBITDA 2014 bridge
Growth
Drop

Additional information
36
Attachment 5 – Lower first contribution margin charged the result of the segment of trade in 2014
10
-102 -10
208
106
0
50
100
150
200
250
EBITDA 2013 First contribution margin Cost of sales Other factors EBITDA 2014
[PLN mln] Trade – EBITDA 2014 bridge
Growth
Drop

Additional information
37
Attachment 6 - Employment and grid assets exploitation process optimisation supported the result of the segment of distribution in 2014
2
174 48 1
934
1 159
0
200
400
600
800
1 000
1 200
1 400
EBITDA 2013 Regulation Gird assets Organisation Other factors EBITDA 2014
[PLN mln] Distribution – EBITDA 2014 bridge
Growth
Drop