energising a sustainable
TRANSCRIPT
INTEGRATED ANNUAL REPORT 2020
ENERGISING A
SUSTAINABLETOMORROW


InsideThisReport
Energising ASustainable Tomorrow
Tenaga Nasional Berhad has continued to play our role in driving the nation forward. We have been there, powering reliable and affordable energy to people and businesses as well as progressing sustainably in line with our focused strategies.
Today, our role is even more critical than ever. As the world emerges from the grips of one of the most devastating pandemics, there is an urgent need to rebuild lives and economies in a manner that is supportable. This is something that resonates with TNB’s own ongoing transformation. We believe that to energise a sustainable tomorrow, we need to work together, as one, to develop a better world with brighter lives.
Cover Rationale
WE ARE TNB
CREATING CONTINUED VALUE
CREATING VALUE THROUGH STRONG GOVERNANCE
ABOUT THIS REPORT
05 Thank You From The Board06 We Are TNB07 Our Investment Case
- Financial Highlights- Group Quarterly Financial Performance- Six-Year Group Financial Summary - Six-Year Group Growth Summary - Simplified Group Statement of
Financial Position
34 The Market Landscape36 Our Value Creation Model
Achieving Our Strategic Ambitions38 Future Generation Sources40 Grid of The Future42 Winning The Customer44 Future Proof Regulations
59 Our Board at a Glance60 Board of Directors’ Profile72 Company Secretary’s Profile73 Organisational Structure74 Senior Management Profile82 Chairman’s Introduction to Corporate
Governance83 Principle A: Board Leadership and
Effectiveness
170 Directors’ Report175 Consolidated Statement of
Financial Position177 Consolidated Statement of Profit
or Loss178 Consolidated Statement of
Comprehensive Income
- Statement of Value Added- Distribution of Value Added- Core Revenue - Our Credit Ratings - Our Shareholding Structure - Generation Fuel Mix- Our Scorecard
16 Our Structure18 Our International Footprint
Mapping Our PerformanceAgainst the Capitals46 Financial Capital48 Manufactured Capital50 Natural Capital52 Intellectual Capital54 Human Capital56 Social and Relationship Capital
103 Principle B: Effective Audit and Risk Management
111 Principle C: Integrity in Corporate Reporting and Meaningful Relationship with Stakeholders
118 Statement on Risk Management and Internal Control
123 Additional Compliance Information
179 Consolidated Statement of Changes in Equity
182 Consolidated Statement of Cash Flows186 Notes to the Financial Statements338 Statement by Directors338 Statutory Declaration339 Independent Auditors’ Report
FROM OUR LEADERSHIP
SUSTAINABILITY STATEMENT
FINANCIAL STATEMENTS
346 Corporate Information347 Statistics of Shareholdings350 Net Book Value of Land and Buildings351 Notice of the 31st Annual General Meeting354 Statement Accompanying Notice of the 31st Annual General Meeting
• Proxy Form
ADDITIONAL INFORMATION
126 Sustainability at TNB- TNB’s Sustainability Strategy- Spirit of Responsibility- TNB’s Stakeholder Engagement- What Matters to Us- Linking Performance to Global
Agenda- How TNB is Addressing a Global
Pandemic140 Empowering The Nation
- Sustainable Infrastructure and Ecosystems
- Customer Centricity
147 Environmental Stewardship- Minimising Environmental Impacts- Climate Change
153 Our People and Their Value- Employment Management and
Relations- Prioritising Health, Safety and
Personal Well-Being160 Contributing to Upliftment of
Communities- Community Investments and
Promoting Education- Dermasiswa My Brighter Future (MyBF)
22 Chairman’s Letter to Shareholders26 President/Chief Executive Officer’s Review
Navigation Icon in this Integrated Report
This icon tells you where you can find related information in our report.

p.2
TENAGA NASIONAL BERHAD
About This Report
Our Capitals
Our capitals are the resources and relationships that are essential to our business and which we leverage to create value.
FINANCIAL
Funds available to TNB to manage our operations, namely our shareholders’ equity, borrowings
and income
MANUFACTURED
Physical assets and infrastructure that enable us to carry out our business,
namely our plants, transmission
and distribution networks, fibre
optic cable, office premises and
vehicles
NATURAL
Renewable and non-renewable environmental
resources used by TNB to generate
electricity such as coal, natural gas, liquefied natural gas, water and
sunlight
INTELLECTUAL
Our Research and Development
capabilities, investments into new technologies
and innovation that enhance
our operational efficiency and facilitate our
transition into green energy
HUMAN
Our people, who are responsible for ensuring we meet our obligation to keep the lights
on day after day; and our Board
of Directors who ensure sound governance
SOCIAL & RELATIONSHIP
The strength we derive from
maintaining strong relationships with
our investors, employees, trade
unions, customers, suppliers and the
community at large
Materiality
Information disclosed is relevant to our material matters, which have been determined by extensive stakeholder engagement as well as internal evaluation. These material matters reflect existing and emerging risks and opportunities, which could affect our ability to create value in the short, medium and long term.
Reporting Framework
Other than be guided by the International Integrated Reporting Framework (IIRF), we have referred to the principles and requirements of the Main Market Listing Requirements of Bursa Malaysia Securities Berhad (MMLR), the Companies Act 2016, the Malaysian Code on Corporate Governance 2017 (MCCG), the Corporate Governance Guide (3rd Edition) issued by Bursa Malaysia, Malaysian Financial Reporting Standards (MFRS), and International Financial Reporting Standards (IFRS).
This Integrated Report has been prepared to provide a balanced and accurate account of Tenaga Nasional Berhad (TNB)’s performance and prospects. It outlines our ongoing 10-year transformational strategy, Reimagining TNB 2025, and describes challenges posed by the operating environment as well as other key risks impacting the energy industry. The Report is intended primarily for our shareholders, financiers and investors, but is also relevant to stakeholders who seek to understand how we create value through good governance, in addition to how we balance our vision for sustainable growth against environmental and social imperatives.

p.3
INTEGRATED ANNUAL REPORT 2020
About This Repor t
OVERVIEWOF OURBUSINESS & OPERATIONS
Pages 6, 18-19 formore information
Verification & Approval
Our Board acknowledges its responsibility in ensuring the integrity of this Integrated Report, which in its opinion addresses issues that are material to the Group’s ability to create value and fairly presents the integrated performance of TNB.
Feedback
We welcome feedback to the Report, and look forward to receiving your comments/suggestions via email to [email protected].
Our Sustainability Report details the manner in which TNB creates value for our stakeholders, focusing on our economic, environmental, social and governance imperatives.
• Global Reporting Initiative (GRI) Standards: Core option
• GRI Electric Utilities Sector Disclosures• Bursa Malaysia’s MMLR• Bursa Malaysia’s Sustainability Reporting Guide 2nd
Edition• Task Force on Climate-related Financial Disclosures
(TCFD)framework
SustainabilityReport
Scope and Boundary
In this report, we disclose material information relating to the Group covering the year from 1 January 2020 to 31 December 2020. In cases where material for FY2020 was not available, the most recent material was provided.
Forward-looking Statements
This report contains certain forward-looking statements relating to future performance. Such statements are premised on current assumptions and circumstances, which could change, hence they necessarily involve uncertainty. Various factors could cause actual results to differ materially from those expressed or implied by these forward-looking statements.
Targeted Readers
This report is primarily intended to address questions that our shareholders and prospective investors may have. However, the information provided includes the way we create value for other key stakeholders, including our employees, customers, regulators and the community.
Where You Will Find Our Management Discussion & Analysis
Although we have not presented a Management Discussion & Analysis (MD&A) in this report, key components of the MD&A can be found in the following pages:
Topic
OURSTRATEGY
DISCUSSION OF OUR FINANCIAL RESULTS AND FINANCIAL POSITION
REVIEW OF OPERATING ACTIVITIES
ANTICIPATED OR KNOWN RISKS
OURPROSPECTS
Pages 38-57 formore information
Pages 23 and 27 for more information
Pages 26-31 formore information
Pages 118-122 formore information
Pages 25 and 31 formore information
Supplementary Report
This report is supplemented by our Sustainability Report.
Report Disclosure Reporting Framework

05Thank You From The Board
06We Are TNB
07Our Investment Case- Financial Highlights- Group Quarterly Financial Performance- Six-Year Group Financial Summary - Six-Year Group Growth Summary - Simplified Group Statement of Financial Position- Statement of Value Added- Distribution of Value Added- Core Revenue - Our Credit Ratings - Our Shareholding Structure - Generation Fuel Mix- Our Scorecard
16Our Structure
18Our International Footprint
We are TNB

The last few months have been tumultuous, if
not traumatic, for many. In Malaysia, not only
have we experienced an ongoing pandemic
that has robbed people of their livelihoods and
claimed lives, people in the East Coast have
had to face the additional ordeal of the annual
floods, which hit with its usual vengeance.
It has been a period of immense physical,
mental and emotional upheaval, leaving scars
that only time will heal.
Yet, amid the chaos around us, a group of our very own warga TNB have been working diligently to ensure some semblance of normalcy. They
have ventured into red zones, isolated because of high COVID-19 numbers, to fix breakdowns and to connect MCO posts to the grid. They have
gone into the thick of the viral infection – the hospitals that serve as treatment centres – to install gensets to ensure continuity of supply.
In each instance, they have put aside their own fears in the name of the greater good – to bring relief to those confined to homes with no
electricity; comfort to the police patrolling red zones; and peace of mind to healthcare workers at our hospitals.
Virus or not, breakdowns will happen; and to ensure restoration of supply within 24 hours, they have worked long hours, sometimes alone, to get
the job done.
Frontliners with young children have sent their sons and daughters to live with relatives to avoid any possibility of transmitting the virus to them.
Having done this, some have gone months without seeing their loved ones.
If the pandemic were not enough, towards year end and throughout January, states such as Pahang and Johor were yet again inundated by the
floods. As always, electricity poles and cables were damaged. Despite the risk of further landslides and trees being uprooted, our teams set out
again, braving the elements, to repair and restore service. We had to mobilise teams from various states to manage the flood-engulfed areas.
This meant arduous journeys, sometimes as long as 13 hours because normal routes were under water. Yet, driven by a deep-rooted sense of
duty, they went. They fixed. And they returned.
These men and women embody the values that we hold dear at TNB. Through their dedication and commitment, they have done TNB proud; and
we would like to acknowledge the immense sacrifices they have made in the name of national service. To each and every one of our frontliners,
“Terima Kasih”. We may not be able to thank all of you in person, but would like to do so here. We hope you read this message and know
that, to us, all of you are heroes.
Dato’ Seri Mahdzir bin Khalid
Chairman
Thank You From The Board
p.5

p.6
TENAGA NASIONAL BERHAD
Integrity Collaborative Professionalism
Commercial OthersStreetlightIndustrial Mining
Customer Centricity Forward Thinking Mindfulness
INDUSTRIALOur industrial customers engage in the manufacture of
goods and services. Although they make up the smallest segment of our customers, they also account for the
majority of our electricity sales.
COMMERCIALOur commercial customers are our second-largest
source of electricity sales, carrying out the business and commercial activities which drive our economy.
RESIDENTIALOur residential customers represent the majority of
Malaysia’s estimated 32.68 million population. As our largest market, they drive us to deliver excellence in our
products and services.
· We uphold the highest
ethical standards and
do what is right, all the
time
· We are fair, honest
and transparent - in
everything we do
· We always seek
to achieve mutual
benefit for the country,
company and
customers
· We trust each other,
believe in teamwork,
and win together as
one company
· We proactively
help each other,
communicate
clearly and provide
constructive feedback
· We embrace diversity
and inclusivity, and
we value outside in
perspectives
· We take full ownership
and accountability for
our actions
· We consistently
demonstrate high
performance and
productivity
· We are result-focused
and carry out our
duties with discipline
· We seek to truly
understand customers’
needs and always stay
a step ahead
· We continue to build
trust by delivering on
our promises
· We look for
unexpected ways to
delight our customers
· We are bold, challenge
the status quo, and
encourage agility and
innovation
· We commit to ensuring
the sustainability of
TNB in all aspects
· We make informed
decisions and learn
from our mistakes
· We know who we are,
and we stand by our
values
· We are empathetic,
respectful and
compassionate
to others and the
environment
· We protect the safety
and promote the well-
being of our people
and the public
We Are TNB
OUR PURPOSE
OUR CORE VALUES AND BEHAVIOURS
OUR CUSTOMERS’ PROFILE
OUR ASPIRATION
Together we brighten lives through innovative and sustainable solutions
towards a better world
We have served our industrial, commercial and residential customers in Malaysia for over 70 years.
Total 10.08 millionBreakdown of Customers(Peninsular Malaysia and Sabah)
To be a leading provider of sustainable energy solutions in Malaysia and
internationally
8,257,592
1,690,347
33,257 14,6355384,526
Domestic

p.7
INTEGRATED ANNUAL REPORT 2020
WE ARE TNB
Our Investment Case
FINANCIAL HIGHLIGHTS
GROUP COMPANY
Financial YearEnded 31 December
31.12.2020 31.12.2019 31.12.2020 31.12.2019
PROFITABILITY (RM Million)
Revenue 43,976.0 50,939.7 40,758.3 47,242.3
Operating profit 7,358.8 8,206.8 7,362.3 6,562.6
Profit before taxation and zakat 4,235.4 5,477.7 3,070.5 2,872.5
Net profit attributable to owners of the Company 3,592.7 4,529.2 2,675.3 1,965.0
KEY BALANCE SHEET DATA (RM Million)
Property, plant and equipment 112,596.1 109,966.0 69,528.7 71,345.7
Total assets 181,433.3 178,847.2 173,180.8 172,364.2
Total borrowings 49,452.6 45,411.7 22,091.3 19,488.1
Total liabilities 123,983.4 119,565.1 126,425.8 122,869.5
Share capital 11,675.2 11,446.1 11,675.2 11,446.1
Shareholders’ equity 57,449.9 59,282.1 46,755.0 49,494.7
SHARE INFORMATION
Per share (sen)
Basic earnings 63.06 79.64
Diluted earnings 62.79 79.64
Dividend (sen):
- Interim 22.00 30.00
- Final 18.00 20.00
- Special 40.00 50.00
Net assets per share attributable to owners of the Company 978.7 1,019.6
FINANCIAL RATIOS
Return on assets (%) 2.4 2.8
EBITDA margin (%) 40.9 36.1
Debt-equity (net of cash) ratio 0.63 0.53
Key Highlights
Unit Demand Growth
(4.9%)
2.4%
RM7,850.1
USD60.6
RM181,433.3
RM43,976.0
RM59,442.5
Return on Assets*
CAPEX
Average Coal Price
Total Assets
Total Revenue
Market Capitalisation
EBITDA Margin
million
per MT
million
million
million
RM3,592.7
Net Profit Attributable toOwners of the Company
million
RM(6,429.1)
40.9%
Operating ExpensesIncrease/(Decrease)
million
* Based on adjusted net profit
p.8
TENAGA NASIONAL BERHAD
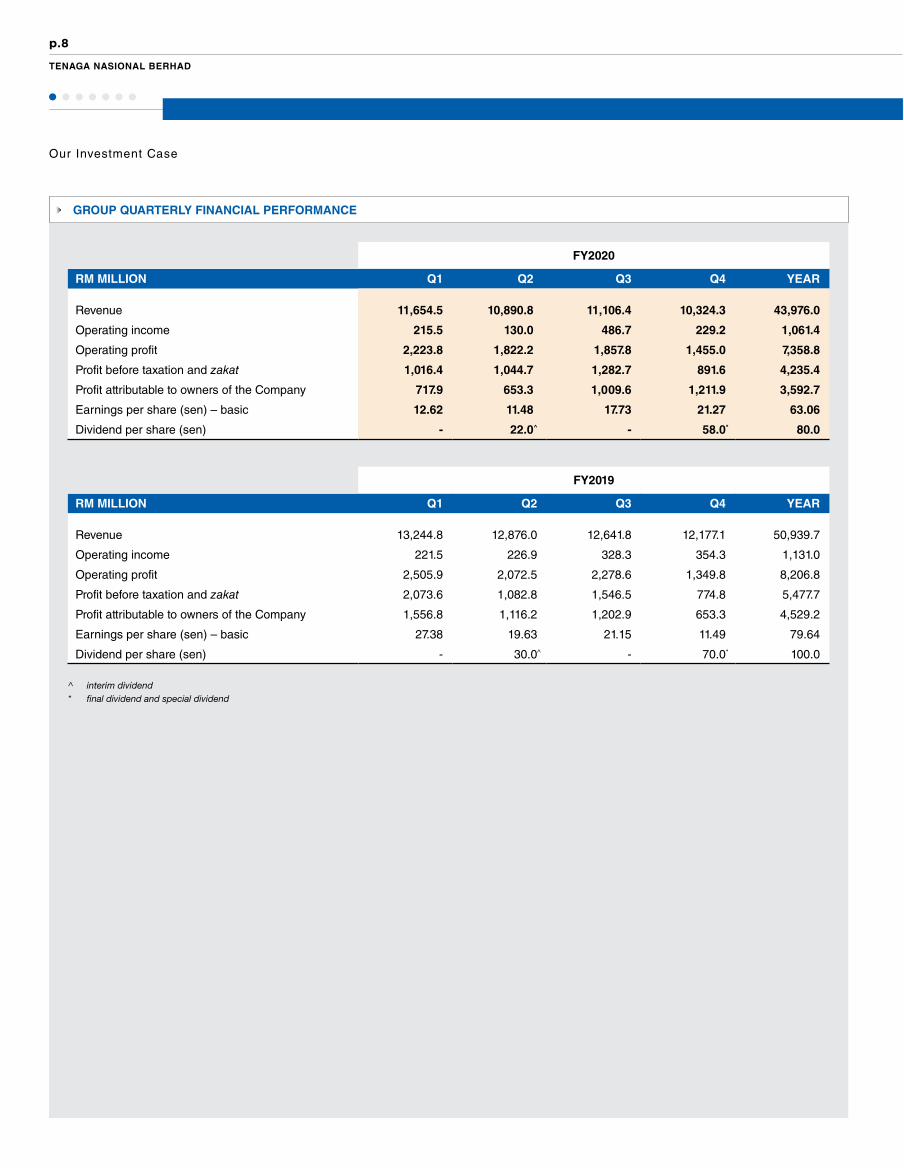
GROUP QUARTERLY FINANCIAL PERFORMANCE
FY2020
RM MILLION Q1 Q2 Q3 Q4 YEAR
Revenue 11,654.5 10,890.8 11,106.4 10,324.3 43,976.0
Operating income 215.5 130.0 486.7 229.2 1,061.4
Operating profit 2,223.8 1,822.2 1,857.8 1,455.0 7,358.8
Profit before taxation and zakat 1,016.4 1,044.7 1,282.7 891.6 4,235.4
Profit attributable to owners of the Company 717.9 653.3 1,009.6 1,211.9 3,592.7
Earnings per share (sen) – basic 12.62 11.48 17.73 21.27 63.06
Dividend per share (sen) - 22.0^ - 58.0* 80.0
FY2019
RM MILLION Q1 Q2 Q3 Q4 YEAR
Revenue 13,244.8 12,876.0 12,641.8 12,177.1 50,939.7
Operating income 221.5 226.9 328.3 354.3 1,131.0
Operating profit 2,505.9 2,072.5 2,278.6 1,349.8 8,206.8
Profit before taxation and zakat 2,073.6 1,082.8 1,546.5 774.8 5,477.7
Profit attributable to owners of the Company 1,556.8 1,116.2 1,202.9 653.3 4,529.2
Earnings per share (sen) – basic 27.38 19.63 21.15 11.49 79.64
Dividend per share (sen) - 30.0^ - 70.0* 100.0
^ interim dividend* final dividend and special dividend
Our Investment Case

p.9
INTEGRATED ANNUAL REPORT 2020
WE ARE TNB
SIX-YEAR GROUP FINANCIAL SUMMARY
GROUP
YEAR/PERIOD ENDED31.08.2016 31.08.2017 31.12.2017*
(Restated)31.08.2018 31.12.2019 31.12.2020
OPERATING RESULTS (RM Million)
Revenue 44,531.5 47,416.9 15,692.2 50,392.5 50,939.7 43,976.0
Operating profit 9,072.0 9,364.0 3,014.0 6,875.6 8,206.8 7,358.8
Profit before taxation and zakat 8,066.8 8,281.8 2,843.5 5,046.6 5,477.7 4,235.4
Net profit attributable to owners of the Company 7,367.6 6,904.0 2,622.3 3,723.7 4,529.2 3,592.7
KEY BALANCE SHEET DATA (RM Million)
Property, plant and equipment 96,512.7 103,083.7 104,807.6 111,445.5 109,966.0 112,596.1
Total assets 132,902.2 142,012.4 144,250.0 153,695.0 178,847.2 181,433.3
Total borrowings 34,306.7 38,846.5 41,443.7 47,832.4 45,411.7 49,452.6
Total liabilities 80,302.5 84,427.6 86,261.0 94,643.1 119,565.1 123,983.4
Share capital 11,025.8 11,124.9 11,199.6 11,446.1 11,446.1 11,675.2
Shareholders’ equity 52,599.7 57,584.8 57,989.0 59,051.9 59,282.1 57,449.9
SHARE INFORMATION
Per share (sen)
Basic earnings 130.55 122.00 46.32 65.62 79.64 63.06
Diluted earnings 130.16 121.52 46.21 65.39 79.64 62.79
Gross dividend 32.00 61.00 21.41 53.27 100.00 80.00
Net assets per share attributable to owners of the Company 928.3 1,009.2 1,007.2 1,017.0 1,019.6 978.7
Share price as at reporting date (RM) 14.74 14.28 15.26 13.60 13.26 10.42
FINANCIAL RATIOS
Return on assets (%) 6.4 5.4 5.3 3.2 2.8 2.4
Return on shareholders’ equity (%) 16.1 13.3 13.2 8.3 8.5 7.4
Gearing (%) 39.5 40.3 41.6 44.8 43.4 46.3
EBITDA margin (%) 33.2 32.6 32.3 26.5 36.1 40.9
Effective weighted average cost of funds (%) 5.1 4.7 5.0 5.0 5.1 4.9
Interest coverage (%) 14.2 10.6 9.5 7.9 5.4 4.9
Currency mix (RM:Foreign) 83:17 77:23 79:21 74:26 76:24 75:25
Debt-equity (net of cash) ratio 0.33 0.37 0.44 0.50 0.53 0.63
Our Investment Case
* Financial period ended 31 December 2017

p.10
TENAGA NASIONAL BERHAD
Our Investment Case
SIX-YEAR GROUP GROWTH SUMMARY
NET PROFIT ATTRIBUTABLE TO OWNERS OF THE COMPANY (RM MILLION)
SHAREHOLDERS’ EQUITY (RM MILLION)
2017 2017*(Restated)2016 2018 2019 2020 2017 2017*
(Restated)2016 2018 2019 2020
TOTAL ASSETS (RM MILLION)
TOTAL BORROWINGS(RM MILLION)
RETURN ON ASSETS(%)
2017 2017*(Restated)2016 2018 2019 2020 2017 2017*
(Restated)2016 2018 2019 2020 2017 2017*(Restated)2016 2018 2019 2020
GEARING (%)
INTEREST COVERAGE(%)
BASIC EPS(SEN)
2017 2017*(Restated)2016 2018 2019 2020 2017 2017*
(Restated)2016 2018 2019 2020 2017 2017*(Restated)2016 2018 2019 2020
REVENUE (RM MILLION)
2017 2017*(Restated)2016 2018 2019 2020
43,9
7650,9
40
50,3
93
15,6
92
47,4
17
44,
532
3,59
3
4,52
9
3,72
4
2,62
2
6,90
4
7,36
8
57,4
50
59,2
82
59,0
52
57,9
89
57,5
85
52,6
00
178,
847
153,
695
144,
250
142,
012
132,
902
181,
433
49,4
53
45,4
12
47,8
32
41,4
44
38,8
47
34,3
07
2.42.
83.2
5.35.4
6.4
46.3
43.444.
8
41.6
40.3
39.5
7.99.
510.6
14.2
4.9
5.4
63.1
79.6
65.6
46.3
122.
0
130.
6
* Financial period ended 31 December 2017

p.11
INTEGRATED ANNUAL REPORT 2020
WE ARE TNB
Our Investment Case
SIMPLIFIED GROUP STATEMENT OF FINANCIAL POSITION
Property, Plant and Equipment
Trade and Other Receivables
Inventories
Deposits, Bank and Cash Balances
Other Assets
TOTAL ASSETS
1.1%
61.4%
2.7%
5.2%
0.04%
3.5%
25.4%
7.5%
4.4%
2.1%
18.8%
3.5%
31.3%
2019
Trade and Other Payables
Current Taxation
Employee Benefits
Deferred Taxation
Consumer Deposits Contract Liabilities
Total Borrowings Other Current and Non-Current Liabilities
TOTAL LIABILITIES& EQUITIES
2019
62.1%
0.9%
3.8%
3.6%
29.6%
2020
5.8%
0.02%
3.6%
4.3%
2.3%
17.4%
7.6%
27.3%
2020

p.12
TENAGA NASIONAL BERHAD
19.3%
5.3%
15.1%
60.3%
2019
STATEMENT OF VALUE ADDED
DISTRIBUTION OF VALUE ADDED
Our Investment Case
31.12.2020 31.12.2019
VALUE ADDED (RM Million)
Revenue 43,976.0 50,939.7
Operating expenses excluding staff costs and depreciation (22,684.2) (29,624.9)
Net loss on impairment of financial instruments (546.2) (302.4)
Operating income 1,061.4 1,131.0
Finance income 317.7 525.1
Finance cost (3,668.7) (3,382.7)
Fair value of financial instruments 124.9 (38.0)
Foreign exchange gain/(loss) 26.2 113.9
Share of results of associates and joint ventures 76.5 52.6
Value added available for distribution 18,683.6 19,414.3
DISTRIBUTION (RM Million)
To employees:
Employment cost 3,825.8 3,747.7
To the Government:
Taxation and zakat 619.0 1,032.7
To shareholders:
Dividends 5,235.8 3,014.1
Non-controlling interest 23.7 (84.2)
To reinvest to the Group:
Depreciation 10,622.4 10,188.9
Retained profit (1,643.1) 1,515.1
Total distributed 18,683.6 19,414.3
Employment Cost
Taxation and Zakat
Dividends and Non-Controlling Interest
Depreciation and Retained Profit
20.5%
3.3%
28.1%
48.1%
2020

p.13
INTEGRATED ANNUAL REPORT 2020
WE ARE TNB
Our Investment Case
CORE REVENUE
** Others include Agriculture, Mining, Public Lighting, Accrued Revenue, Sales Discount, EGAT, LPL, TNBI (UK WIND & Vortex), Other regulatory adjustment, Relief Package from Government, SESB Tariff Support Subsidy and Merdeka Incentive
*** Others include Agriculture, Mining, Public Lighting, EGAT, LPL, TNBI (UK WIND & Vortex)
2019
2020
TNB
40,758.3
47,242.3
SESB
2,227.7
2,321.3
LPL
340.0
516.8
TNBI (UK WIND)
120.7
103.3
Others*
489.7
756.0
TNBI (Vortex)
39.6
-
Total
43,976.0
50,939.7
RM Million
2019
92.7%
4.6%
1.0%
1.5%
0.2%
Industrial DomesticCommercial Others
TNB LPLSESB TNBI (UK WIND) OthersTNBI (Vortex)
GROUP SALES OF ELECTRICITY BY SECTOR
RM46,237.8Million
* Others include Goods & Services, Construction Contracts
117,188.2GWh
92.7%
5.0%
0.3%
35.9%
0.8%
1.1%
0.1%
2020
1.6%**
38.6%
23.9%
27.3%
2.9%*** 37.4%
32.4%

p.14
TENAGA NASIONAL BERHAD
Our Investment Case
OUR CREDIT RATINGS
International Rating Agency
Standard &Poor’s RatingsServices (S&P)
Moody’s Investors Services (Moody’s)
BBB+Stable
A3Stable
Local Rating Agency
RAM RatingServices
Berhad (RAM)
MalaysianRating Corporation
Berhad(MARC)
AAAStable
AAAIS/AAA Stable
JEP: 70% ownership
OUR SHAREHOLDING STRUCTURE
25.7%
18.5%
7.3%
17.7%
20.0%
0.1%
0.01%
16.4%
1.5%
12.9%
Khazanah Nasional Berhad
Permodalan Nasional Berhad
Kumpulan WangPersaraan (Diperbadankan)
Employees Provident Fund Board
Europe
Pacific
Africa
Local Corporation & Retail
Other Government Agencies
Foreign ShareholdingTNB
ShareholdingAs at 31 December 2020 70.7
TotalGovernment Agencies
41.3%
38.6%
North America
Asia
ForeignShareholding
GENERATION FUEL MIX
in Peninsular Malaysia for FY2020
Coal
Gas
Hydro
Solar
48.9%
31.0%
19.5%
0.6%
KEV: 60% ownership

p.15
INTEGRATED ANNUAL REPORT 2020
WE ARE TNB
Our Investment Case
OUR SCORECARD
31.08.2016 31.08.2017 31.12.2017 31.12.2018 31.12.2019 31.12.2020
Return on asset 6.4% 5.4% 5.3%(5) 3.2% 2.8% 2.4%
Generation market share(1) 52.3% 52.3% 50.6% 49.9% 51.42% 51.76%
Customer satisfaction index(4) 81% 81% N/A(4) 81% 81% 86%
Corporate reputation index(4) 82% 81% N/A(4) 88% 87% 81%
Equivalent availability factor(2) 87.62% 87.13% 85.45% 88.93% 81.77% 87.39%
Equivalent unplanned outage factor(2) 5.05% 3.76% 4.84% 3.84% 7.97% 6.65%
Transmission system minutes(1) 1.47minute
0.23minute
0.05minute
0.35minute
0.27minute
0.08minute
System average interruption durationindex(1) (SAIDI) minutes/customer/year
49.71 50.24 18.05 48.22 48.13 44.95
Transmission losses(1) 1.28% 1.29% 1.30% 1.43% 1.35% 1.47%
Distribution losses(1) 6.11% 6.21% 6.13% 6.39% 6.30% 6.69%
Employee engagement score(3) 89% 89% N/A(4) 86% 89% 89%
(1) For Peninsular Malaysia only.(2) All Coal, Gas and Hydro power plants under TNB Power Generation Sdn. Bhd.(3) TNB conducts its employee engagement survey biennially. The scores for both FY2016 and FY2017 are based on survey conducted in FY2016.(4) The respective surveys were not conducted during this four-month Annual Report period.(5) Financial Period Ended 31 December 2017 (Restated).
GENERATION MARKET SHARE(1)
(%)EQUIVALENT UNPLANNED OUTAGE FACTOR (%)
20172016 2018 2019 202020172016 2018 2019 2020
RETURN ON ASSET (%)
2017 2017(Restated)
2017(Restated)
2017(Restated)
2016 2018 2019 2020
2.4%2.
8%
3.2%
5.3%5.
4%
6.4%
51.7
6%
51.4
2%
49.9
%
50.6
%
52.3
%
52.3
%
6.65
%
7.97
%
3.8
4%
4.8
4%
3.76
%
5.05
%

p.16
TENAGA NASIONAL BERHAD
Our Structure
* TNB and its wholly owned subsidiary, TNB Power Generation Sdn. Bhd., own 70% in Southern Power Generation Sdn. Bhd.** GVO Wind Limited, Bluemerang Capital Limited and Vortex Solar Investments S.A.R.L. Group of Companies are detailed out
on pages 215-222 of this Integrated Annual Report.
49% SD Plantation TNBES Renewable Energy Sdn. Bhd.
100% TNB POWERGENERATION SDN. BHD.
TNB Pasir Gudang Energy Sdn. Bhd.100%
TNB Connaught Bridge Sdn. Bhd.100%
TNB Manjung Five Sdn. Bhd.100%
100% Integrax Berhad
TNB Janamanjung Sdn. Bhd.100%
100% TNB Prai Sdn. Bhd.
100% TNB Northern Energy Berhad
100% TNB Western Energy Berhad
100% UNITEN R&D Sdn. Bhd.
Yayasan Canselor Universiti Tenaga Nasional
100% UNIVERSITI TENAGANASIONAL SDN. BHD.Kapar Energy Ventures Sdn. Bhd.60%
70% Southern Power Generation Sdn. Bhd.*
70% Jimah East Power Sdn. Bhd.
TNB Sepang Solar Sdn. Bhd.100%
TNB Bukit Selambau Solar Sdn. Bhd.100%
Tenaga Nasional Berhad
100% LBT Two Sdn. Bhd. (Dormant)
100% Pelabuhan Lumut Sdn. Bhd.
100% Lekir Bulk TerminalSdn. Bhd.
50% Lumut Maritime Terminal Sdn. Bhd.
100%
LMT Capital Sdn. Bhd.(Dormant)
100% TNB RENEWABLES SDN. BHD.
100% TNB ENGINEERINGCORPORATION SDN. BHD.
100% TNEC Construction Sdn. Bhd. (Dormant)
70% Cooling Energy Supply Sdn. Bhd.
Tomest Energy Management Sdn. Bhd. (In Members’ Voluntary Winding Up)
51%
100% TNEC Operations and Maintenance Sdn. Bhd. (Dormant)
70% Selesa Energy Systems Sdn. Bhd. (Dormant)
100% Bangsar Energy Systems Sdn. Bhd.
49% Abraj Cooling LLC
77% Airport Cooling Energy Supply Sdn. Bhd.
100% TNB Labs Sdn. Bhd.
100% TNB RESEARCH SDN. BHD.
Gunung Tenaga Sdn. Bhd.40%
100% REV Horizon Sdn. Bhd.
100% REV PROPERTY HOLDINGS SDN. BHD.
100% TNB INTEGRATED LEARNINGSOLUTION SDN. BHD.
100% ALLO TECHNOLOGY SDN. BHD.
100% TNB GLOBAL CAPTIVE (L) LTD.
100% TNB-IT SDN. BHD.
100% MALAYSIA TRANSFORMERMANUFACTURING SDN. BHD.
100% TNB GLOBAL VENTURESCAPITAL BERHAD
100% TNB FUEL SERVICES SDN. BHD.
100% TNBX Sdn. Bhd.
100% GSPARX Sdn. Bhd.
100% TNB RETAIL SDN. BHD.
GMR Tenaga Operations and Maintenance Private Limited
50%
100% TNB Operations & Maintenance International Ltd.
100% Oasis Parade Sdn. Bhd.
Alimtiaz Operation & Maintenance Company Limited
10%
Saudi-Malaysia Operation & Maintenance Services Company Limited
30%
100% TNB Repair and Maintenance Sdn. Bhd.
100% Tenaga WHR 1 Sdn. Bhd.
100% TNB REMACO Pakistan (Private) Limited
100% Trichy Energy Limited (Dormant)
100% Trichy Power Limited (Dormant)Less 1 Share

p.17
INTEGRATED ANNUAL REPORT 2020
WE ARE TNB
Subsidiaries Associates Joint Ventures Simple Investments Trust FoundationsLegend:
100% Independent Power International Ltd.
30%
30%
GMR Energy Limited
100% POWER AND ENERGY INTERNATIONAL (MAURITIUS) LTD.
Malaysian ShoaibaConsortium Sdn. Bhd.
20%
Saudi-Malaysia Water & Electricity Co. Ltd.
50%
100% TNB INTERNATIONAL SDN. BHD.
49% FIBRECOMM NETWORK (M) SDN. BHD.
100% Jimah Energy Ventures Sdn. Bhd.
TEKNOLOGI TENAGA PERLIS CONSORTIUM SDN. BHD.
20%
GB3 SDN. BHD.20%
25% JIMAH ENERGY VENTURES HOLDINGS SDN. BHD.
ASSOCIATES
50% SEATRAC SDN. BHD. (Dormant)
JOINT VENTURE
100% TNB POWER DAHARKI LTD.
100% TNB VENTURES SDN. BHD.
83% SABAH ELECTRICITY SDN. BHD.
100% ARUNA SERVICIOS INTEGRALES S.L.U.
Gama Enerjî Anonîm Sîrketî
60% TENAGA SWITCHGEAR SDN. BHD.
100% TNB Liberty Power Limited
76% Tenaga Cable Industries Sdn. Bhd.
100% Elopura Power Sdn. Bhd. (Dormant)
100% Global Power Enerjî Sanayî Ve Tîcaret Anonîm Sîrketî
60% TSG Ormazabal Sdn. Bhd.
95% PT. Tenaga Nusa Bakti (Dormant)
Tenaga Middle East ElectricContracting L.L.C. (Dormant)
34%
100% TNB TOPAZ ENERGY SDN. BHD.
100% Vortex Solar UK4 Limited
Vortex Solar Investments S.A.R.L.**55%
100% TNB ENERGY SERVICES SDN. BHD.
100% Tenaga E Mobility Solutions Sdn. Bhd.
FTJ Bio Power Sdn. Bhd.40%
Maevi Sdn. Bhd.70%
49% Metrosphere Hydro Tersat Sdn. Bhd.
20% Jana Landfill Sdn. Bhd.
100% Tenaga Investments UK Ltd.
100% Tenaga Wind Ventures UK Ltd.
100% GVO Wind Limited**
100% Bluemerang Capital Limited**
YAYASAN TENAGA NASIONAL
RETIREMENT BENEFIT TRUST FUND
TRUST FOUNDATIONS
SIMPLE INVESTMENTS
LABUAN REINSURANCE (L) LTD.10%
FEDERAL POWER SDN. BHD.8.91%
20%
PERUSAHAAN OTOMOBIL ELEKTRIK (MALAYSIA) SDN. BHD. (In Winding Up by the Court)
DORMANT COMPANIES
100% TNP Construction Sdn. Bhd.
100% TNB CAPITAL (L) LTD.
100% TNB PROPERTIES SDN. BHD.
100%
Lahad Datu Holdings Sdn. Bhd.(In Members’ Voluntary Winding Up)
100%
Lahad Datu EnergySdn. Bhd. (In Members’ Voluntary Winding Up)
100% ORION MISSION SDN. BHD.
100% TNB RISK MANAGEMENT SDN. BHD.
100% TNB HIDRO SDN. BHD.
100% TNB TRANSMISSIONNETWORK SDN. BHD.
100% TNB GENERATION SDN. BHD.
100% TNB DISTRIBUTION SDN. BHD.
100% TNB ENGINEERS SDN. BHD.
70% SEPANG POWER SDN. BHD.
40% KM Metro-TNB Properties Sdn. Bhd.
50%
Eastern Sabah Power Consortium Sdn. Bhd. (In Members’ Voluntary Winding Up)
MANJUNG ISLAND ENERGY BERHAD(Subsidiary as defined by MFRS 10, 11 and 12)
The information is as at 22 March 2021.
p.18
TENAGA NASIONAL BERHAD
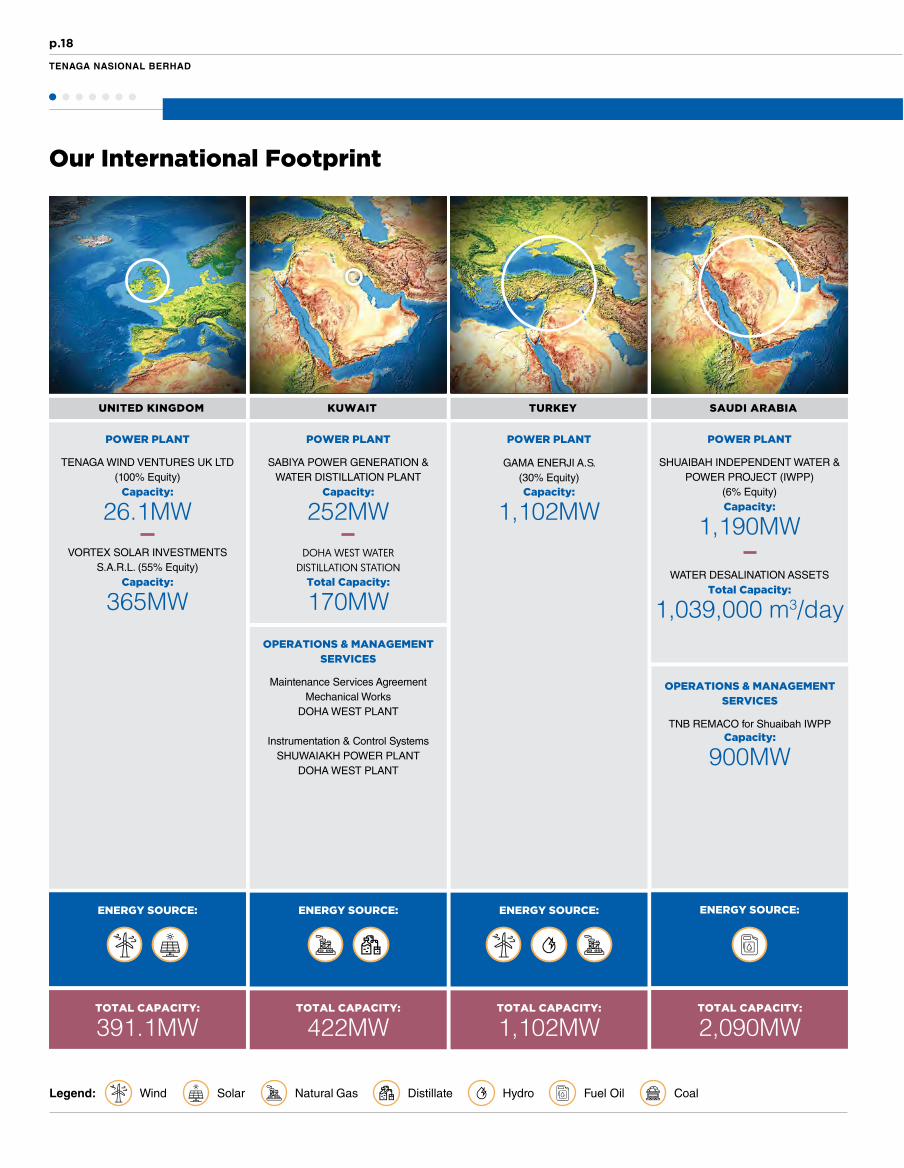
Our International Footprint
SAUDI ARABIA
POWER PLANT
OPERATIONS & MANAGEMENTSERVICES
TNB REMACO for Shuaibah IWPPCapacity:
900MW
Capacity:
1,190MW
Total Capacity:
1,039,000 m3/day
SHUAIBAH INDEPENDENT WATER & POWER PROJECT (IWPP)
(6% Equity)
WATER DESALINATION ASSETS
KUWAIT TURKEY
POWER PLANT POWER PLANT
Capacity:
1,102MW
GAMA ENERJI A.S.(30% Equity)
OPERATIONS & MANAGEMENTSERVICES
Maintenance Services AgreementMechanical Works
DOHA WEST PLANT
Instrumentation & Control SystemsSHUWAIAKH POWER PLANT
DOHA WEST PLANT
UNITED KINGDOM
POWER PLANT
Capacity:
26.1MW
TENAGA WIND VENTURES UK LTD(100% Equity)
Capacity:
365MW
VORTEX SOLAR INVESTMENTS S.A.R.L. (55% Equity)
Capacity:
252MW
SABIYA POWER GENERATION &WATER DISTILLATION PLANT
Total Capacity:
170MW
DOHA WEST WATERDISTILLATION STATION
ENERGY SOURCE:
TOTAL CAPACITY:
2,090MW
ENERGY SOURCE: ENERGY SOURCE:
TOTAL CAPACITY:
1,102MWTOTAL CAPACITY:
422MW
ENERGY SOURCE:
TOTAL CAPACITY:
391.1MW
Wind Solar Natural Gas Distillate Hydro Fuel Oil CoalLegend:

p.19
INTEGRATED ANNUAL REPORT 2020
WE ARE TNB
Our International Footprint
INDIA PAKISTAN
POWER PLANT
OPERATIONS & MANAGEMENTSERVICES
POWER PLANT
Capacity:
235MW
LIBERTY POWER LTD(WHOLLY-OWNED)
Capacity:
2,064MW
GMR ENERGY LTD(30% Equity)
INDONESIA
INTERCONNECTION
Capacity:
600MW
PT PLN (PERSERO) Development of the Sumatra – Peninsular
Malaysia High Voltage Direct Current Interconnection
CAMBODIA
ENERGY SOURCE: ENERGY SOURCE:
TOTAL CAPACITY:
600MWTOTAL CAPACITY:
400MWTOTAL CAPACITY:
2,064MWTOTAL CAPACITY:
235MW
Capacity:
1,223MW
– TNB REMACO & BALLOKI POWER PLANT NATIONAL POWER PARK
MANAGEMENT COMPANY LIMITED – Balloki Power Plant
400MWTechnical Advisoryfor EDC HFO Plant
MANN & Wartsila Engines


From OurLeadership
22Chairman’s LetterTo Shareholders
26President/Chief Executive Officer’s Review

p.22
TENAGA NASIONAL BERHAD
Chairman’s Letterto Shareholders
Dear Shareholders
Although we have gone through a year that has perhaps been the most challenging since the 2008 Financial Crisis, TNB has proven not only our resilience but also our deep-rooted ethos of service, and of serving the nation. United in a mission to fulfil our responsibilities, our people have gone the extra
mile to keep the lights on. This, more than anything, makes me very proud, and gives me pleasure in presenting our report for the year.

p.23
INTEGRATED ANNUAL REPORT 2020
FROM OUR LEADERSHIP
As I write this message, the country – like many others in the world – is facing a third wave of the COVID-19 pandemic, which has brought untold damage to lives and economies everywhere. With movement restrictions and the need to maintain social distancing, businesses have shut down. People have lost their jobs while others are working from home. Worst of all, some of us have lost our loved ones.
In these unusual and difficult times, our priority at TNB has been to serve the nation and rakyat, while ensuring the safety and well-being of our employees. Although electricity demand has been impacted by restrictions on business activity, it has been critical to ensure security of supply to support all essential services as well as people working from home. This has meant that our generation, grid and distribution network employees, as well as those involved in restoration and reconnection, have continued to report for work. Together with those providing TNB CareLine customer services, security services and mobile generator facilities, they have helped to keep the nation going – safely and securely. Once again, I would like to express my heartfelt appreciation for their sense of duty and national service.
Over and above keeping the lights on, TNB has lent our full support to the Government’s efforts to contain the pandemic. It gives me pride to share that we were one of the first corporate entities to come forward to offer aid, initially pledging RM10 million to the Ministry of Health (MOH) and then another RM17.5 million to state health departments for ventilators and other medical equipment as well as supplies. We also invested RM1 million to connect Movement Control Order (MCO) booths and posts to electricity; and RM3.6 million to provide mobile generators for all critical health centres to ensure continuity of supply.
Internally, we channelled RM1 million to our regional offices for use in community relief programmes. Meanwhile, staff, retirees and the Board contributed a total of RM1 million towards Tabung Kilat COVID-19 PELITAWANIS, a fund set up by our women’s association, PELITAWANIS, in aid of those affected by the pandemic.
Recognising that many Malaysians will have been under financial stress, we sought to lighten their burden via bill discounts. This has seen TNB absorbing RM250 million from residential, industrial and commercial customers’ bills over a period of nine months from April to December 2020. For residential customers, we also offered an Easy Payment Plan entailing a six-month interest-free payment. In addition, we waived all late payment interest fees and suspended disconnection activities until end of December 2020.
Our Performance
The drop in electricity demand due to the pandemic resulted in a 4.9% decrease in sales within Peninsular Malaysia, which adversely impacted our revenue. Our profit after tax (PAT) was also affected, and dropped by 18.6% to RM3.62 billion.
Despite the reduced PAT, I’m pleased to share that our performance is still sufficiently robust for TNB to continue to honour our dividend policy of 30% to 60% payout based on our adjusted profit after tax, and minority interests (PATAMI). In October 2020, we paid an interim dividend of 22.0 sen per share amounting to RM1.26 billion. Based on our full-year performance, the Board has approved a final single-tier dividend of 18.0 sen per share and a special dividend of 40.0 sen per share which will be paid in April 2021. This translates into a total dividend of 80.0 sen per share, amounting to RM4.56 billion in payout representing 58.5% of our PATAMI.
Chairman’s Letter to Shareholders

p.24
TENAGA NASIONAL BERHAD
Chairman’s Letter to Shareholders
Enhanced Social Citizenry
Although much of our resources during the year was focused on managing the challenges brought about by the pandemic, we did not neglect our existing outreach programmes through which we seek to uplift the lives of the marginalised and underserved. TNB believes in contributing to social equity not because it is expected of us but because we feel strongly it is the right thing to do. Much of our efforts focus on access to quality education for underprivileged students, as education is key to upward social mobility.
One of our flagship programmes is the provision of scholarships and study loans by our Foundation, Yayasan Tenaga Nasional (YTN). In 2020, its 28th year of implementation, we awarded 678 students financial assistance to pursue secondary and tertiary studies in Malaysia and overseas. This brings the total number of scholarship recipients to more than 18,000. I am truly proud of this programme and would like to highlight the fact that a number of senior management who have grown their careers with TNB started out as our scholars.
Targeting the B40 community specifically, YTN recently launched the Dermasiswa My Brighter Future programme to support tertiary studies in Science, Technology, Engineering and Mathematics (STEM) subjects. In 2020, RM40.4 million was channeled towards this programme, which has benefitted 5,268 students.
TNB as a corporation also runs a number of educational programmes. This includes supporting eight Trust Schools under a joint programme with Yayasan Amir via an annual contribution of RM6.4 million. We also channelled RM1.36 million towards the Ceria ke Sekolah programme through which we provide basic school supplies to students from low-income families. In addition, we continued to partner with the Tun Hussein Onn Eye Hospital in a Better Brighter Vision programme, and helped 724 primary and secondary students in Kedah obtain corrective glasses. This will go a long way towards improving their performance at school.In response to job loss due to the pandemic, we
also introduced a Reskilling TNB programme to train displaced workforce and equip them with the skills necessary for the electricity supply industry.
It gives me pleasure to share that we also made progress with two key environmental initiatives, namely our firefly colony conservation programme and mangrove rehabilitation programme. Under the firefly initiative, we contributed RM986,000 towards research and development on four colonies: Kampung Kuantan, which has one of the largest firefly colonies in Southeast Asia, as well as Kampung Yak Yah in Terengganu; Kampung Sungai Timun in Negeri Sembilan; and Kampung Dew in Perak. In addition, we donated RM33,500 to 76 boatmen whose incomes would have been compromised due to the drop in number of visitors throughout the year. Towards mangrove rehabilitation, we planted 10,600 saplings in Sg Limau, Manjung, to strengthen our coastal ecosystem.
Recognising difficulties faced by Zoo Negara in gaining funds amid the pandemic, we also donated RM500,000 for the upkeep of the animals.
to the MOH and state health departments for ventilators, other medical equipment and supplies
mangrove saplings in Sg Limau, Manjung, to strengthen our coastal ecosystem
to 76 boatmen from Kampung Kuantan Fireflies Park, Kampung Dew, Kampung Sungai Timun and Kampung Yak Yah whose income would have been compromised due to the drop in number of visitors throughout the year
towards supporting eight Trust Schools
Contributed
Planted
Donated
Contributed
RM27.5 million
10,600
RM33,500
RM6.4 million
students since YTN’s incorporation
Awarded scholarshipsto more than
18,000
The Upskilling Programme for TNB Contractors launched by Dato' Seri Mahdzir bin Khalid helps our contractors enhance their competencies in street lighting, cabling works, metering and many others.
p.25
INTEGRATED ANNUAL REPORT 2020
FROM OUR LEADERSHIP
Chairman’s Letter to Shareholders
Outlook
The year 2021 has begun with an increase in COVID-19 incidence. However, measures taken by the Government, as well as the rollout of vaccines lend reason for optimism. We believe that the economy will pick up compared to 2020 and, with it, demand for electricity will increase.
Our focus during the year will be to continue to support the Government and other relevant stakeholders in protecting and eventually rebuilding our economy. We also look to further improve industry efficiencies and enhance customer experience, while continuing to promote the use of sustainable energy as we balance the grid system’s security and affordability.
We thank the Government for continued support of the Incentive Based Regulation (IBR) which has been critical in ensuring industry stability since its inception in 2015. Regulatory Period 2 (RP2) of the IBR was supposed to end on 31 December 2020, however the Government has given the RP2 a year’s extension as the focus was entirely shifted to managing the COVID-19 pandemic and its immediate impacts on public health, the economy and society. This is positive news as it ensures sufficient time for the industry to outline the next step in investments needed to support the nation’s recovery in Regulatory Period 3 (RP3) (2022-2024). We have submitted our proposal on this and look forward
to the Government’s decision towards the end of 2021. Via our proposal, we seek not only to improve the nation’s electricity infrastructure and services but also to support the nation’s economic recovery in line with global trends, and especially the transition towards greener, more sustainable energy.
Acknowledgements
The nature of the energy sector is such that we work very closely with a number of stakeholders. Each stakeholder group is important to us, and I would like to take this opportunity to thank the Government and regulatory bodies, our suppliers, business partners, financiers and shareholders for their varied contributions that, together, have provided immense and invaluable support to TNB.
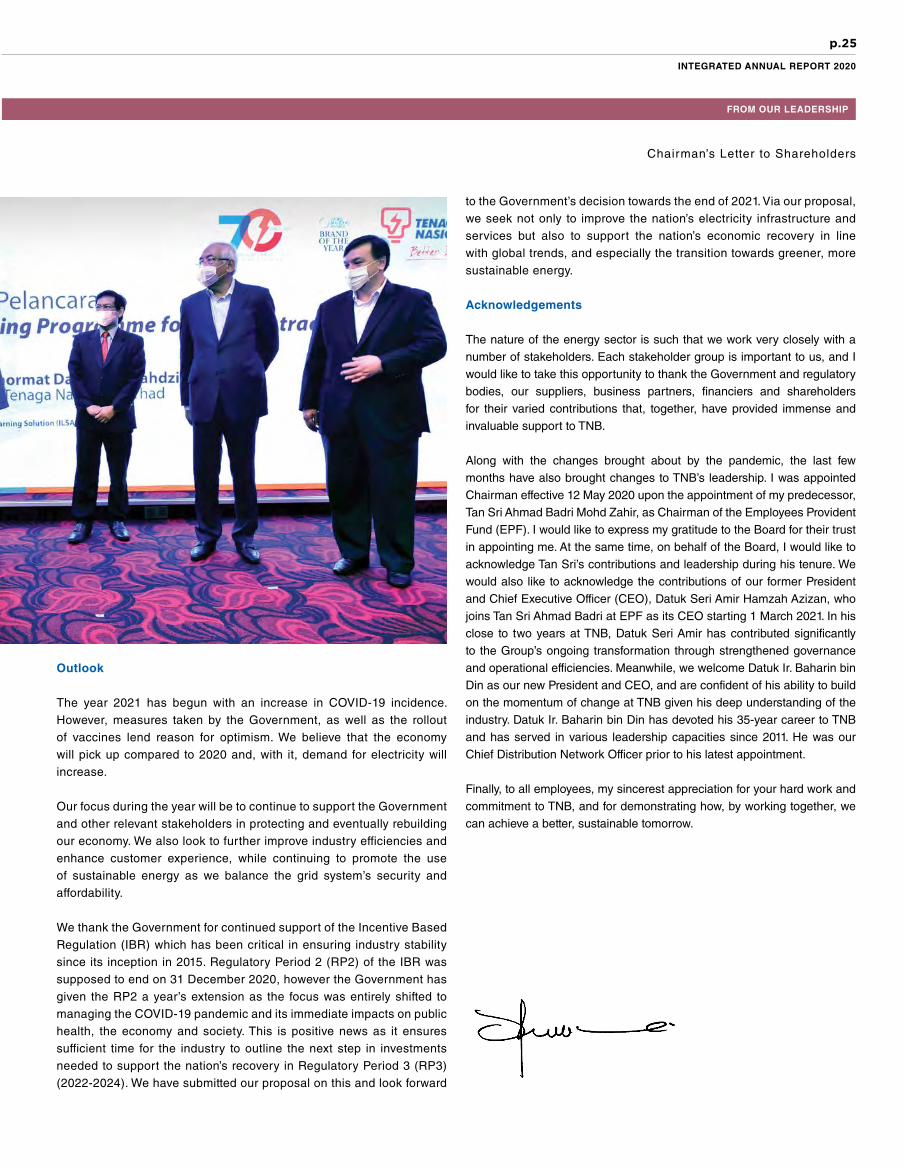
Along with the changes brought about by the pandemic, the last few months have also brought changes to TNB’s leadership. I was appointed Chairman effective 12 May 2020 upon the appointment of my predecessor, Tan Sri Ahmad Badri Mohd Zahir, as Chairman of the Employees Provident Fund (EPF). I would like to express my gratitude to the Board for their trust in appointing me. At the same time, on behalf of the Board, I would like to acknowledge Tan Sri’s contributions and leadership during his tenure. We would also like to acknowledge the contributions of our former President and Chief Executive Officer (CEO), Datuk Seri Amir Hamzah Azizan, who joins Tan Sri Ahmad Badri at EPF as its CEO starting 1 March 2021. In his close to two years at TNB, Datuk Seri Amir has contributed significantly to the Group’s ongoing transformation through strengthened governance and operational efficiencies. Meanwhile, we welcome Datuk Ir. Baharin bin Din as our new President and CEO, and are confident of his ability to build on the momentum of change at TNB given his deep understanding of the industry. Datuk Ir. Baharin bin Din has devoted his 35-year career to TNB and has served in various leadership capacities since 2011. He was our Chief Distribution Network Officer prior to his latest appointment.
Finally, to all employees, my sincerest appreciation for your hard work and commitment to TNB, and for demonstrating how, by working together, we can achieve a better, sustainable tomorrow.
Dato’ Seri Mahdzir bin KhalidChairman

p.26
TENAGA NASIONAL BERHAD
Dear Valued Stakeholders
It has been an extremely challenging year, one that has tested TNB to our limits. Yet, we have continued to serve the nation and rakyat at the highest level of operational efficiencies. Uncertainties and instabilities brought about by the pandemic have made it all the more imperative for us to provide safe and reliable electricity supply in an environmentally sustainable manner, at a cost that is equitable for all stakeholders. We have responded to this with a strategy refresh placing us in a better position to fulfil our critical responsibilities.
President/Chief Executive Officer’s Review
The year 2020 has been extremely challenging with movement and social restrictions necessitated by the pandemic severely curtailing economic activity as well as travel, drastically reducing demand for energy. The International Energy Agency (IEA) estimates that global demand would have dropped by about 6%, equivalent to that for the whole of India, the world’s third largest energy consuming nation.
More positively, however, reduced demand has given impetus to the transition towards more sustainable sources of energy. After years of investment into renewable energy (RE), prompted by increasing awareness of the necessity to mitigate climate change, technological advances have
made greener cheaper. Leveraging its greater affordability, and the luxury of choosing between conventional and sustainable forms of energy, governments have almost unanimously opted for the latter. As a result, while overall global electricity demand decreased, that for RE has grown.
In Malaysia, along with the 5.6% contraction in gross domestic product (GDP) in 2020, we experienced a 4.9% drop in energy demand within the peninsular. This forced us to take more than 1,200 hours of generation plant downtime, which had repercussions on operating efficiency, fixed cost absorption and profitability. Further impacting our bottom line, financial instability caused by the pandemic led to a higher bill payment default rate.

p.27
INTEGRATED ANNUAL REPORT 2020
FROM OUR LEADERSHIP
President/Chief Executive Officer ’s Review
Amid these difficulties, TNB’s response has been to put national interest above all else. We have been fully supportive of all efforts to contain the virus, contributing no less than RM28 million in essential equipment to hospitals and funds to various organisations. We have also continued to serve all our customers – especially those under financial strain – allocating RM250 million worth of discounts for a nine-month period under the Government’s Prihatin Rakyat Economic Stimulus Package; as well as easy payment plans.
Of note, the year saw us review our 10-year strategic plan, Reimagining TNB, to become a leaner, greener, more efficient organisation that is better able to serve the nation and rakyat. Uncertainties and instabilities brought about by the pandemic have made it more imperative for us to provide safe and reliable electricity supply in an environmentally sustainable manner, at a cost that is equitable for all stakeholders. Our strategy refresh has put us in a better position to fulfil this critical responsibility.
Highlights: Key Performance Indicators
The RM3.0 billion ICPT adjustment due to lower fuel prices together with the drop in electricity sales contributed to a 13.7% decrease in revenue, which came in at RM43.98 billion. This, together with negative MFRS16 impact
from the reduction in capacity payment as well as the discount provided to customers in need as a result of the pandemic, led to a 18.6% reduction in profit after tax (PAT) to RM3.62 billion from RM4.45 billion in 2019.
Despite the drop in profit, proactive balance sheet management enabled TNB to maintain a robust dividend yield of 7.7%, the highest among top 30 KLCI companies for the second year running.
In contrast to our financial performance, we continued to maintain world-class operations. As a result of constant improvements to our grid, we achieved a System Average Interruption Duration Index (SAIDI) of 44.95 minutes per customer per year, compared to 48.13 minutes in 2019; and system minutes of 0.0806, which was 70.2% better than 0.2707 minutes in 2019. Of note, our performance this year has been the best to date; that this should have come amid a global pandemic reflects the commitment and dedication of our employees. To all our employees, and especially those directly involved in keeping our lights on, syabas!
In spite of the challenges faced, we also managed to further increase the already high level of customer satisfaction attained in 2019, of 81%, by scoring 86% in our Customer Satisfaction Index (CSI) score, our highest ever. This reflects not only our service reliability but also efforts to go

p.28
TENAGA NASIONAL BERHAD
President/Chief Executive Officer ’s Review
Our Refreshed Framework for Reimagining TNB
Strategic Themes
Pillars
TNB’s corebusinesses
Enablers
Required to deliverStrategic Themes
Cuts across pillars
Defines priorities for TNB across core business area
To Be a Leading Provider
of Sustainable Energy Solutions in Malaysia and Internationally
Capital allocation and value creation
Digital and data analytics
Corporate and organisation structure
Culture, capabilities and performance management
Future Generation
Sources
Gridof theFuture
Winningthe
Customer
FutureProof
Regulations
Uplift Domestic Core
Diversify Internationally
Energy Transition
beyond the norm to serve and show we care. As described in the “Thank You!” message in this report, our people have gone the extra mile to keep the lights on, not only amid the pandemic but also in areas on the East Coast of the peninsular which were once again inundated by the annual floods.
Further validation of TNB’s operational excellence has been provided by the World Bank’s Ease of Doing Business (DB) rankings. In the World Bank’s 2020 DB Report, Malaysia was ranked 4th out of 190 nations in terms of the time taken and cost of getting electricity supply, for the second consecutive year. This marks a significant improvement from our 8th ranking in 2018.
Safety is another one of our headline KPls, and I am pleased to share that we lowered TNB Group’s Lost Time Injury Frequency (LTIF) to 1.29 compared to 1.42 in 2019. However, we sadly recorded one fatality among our staff this year. Although this is an improvement from two fatalities in 2019, it is still not good enough. We are firmly committed to zero fatalities – not only among our staff but also those of our contractors. And we will continue to strengthen our safety practices to achieve this.
Strategy Refresh
2020 represented the mid-point of our Reimagining TNB 2016-2025 strategic journey. This, coupled with acceleration of the energy transition in the global energy space, inspired a study on how TNB can further strengthen our position within the future energy landscape.
As a result of this study, we refreshed our Reimagining strategy. While maintaining the four pillars that drive our sustainable operations, we have revised our aspiration to be more relevant to the most pressing issues facing the industry, i.e. “To be a leading provider of sustainable energy solutions in Malaysia and internationally”. We have also incorporated three Strategic Themes that cut across our pillars defining priorities for TNB’s core business areas. These themes are: Uplift Domestic Core, Diversify Internationally and Energy Transition. Finally, we have added two new enablers in the foundation of our refreshed framework, i.e. Digital and data analytics; and Culture, capabilities and performance management.
p.29
INTEGRATED ANNUAL REPORT 2020
FROM OUR LEADERSHIP
President/Chief Executive Officer ’s Review
The most salient change in our refreshed strategy is the emphasis placed on ensuring we are part of the energy transition that is unfolding around us. Coal’s biggest advantage is its price. It has been and continues to be the cheapest source of fuel in Malaysia. However, the price of renewable sources – specifically solar – has been trending downwards. The levelised cost of electricity (LCOE) of solar is now cheaper than gas, and could very well be at par with coal in the near future. As we approach price parity, our energy transition will not just be environmentally sound but also economically viable.
Meanwhile, we are investing an increasingly larger portion of our capital expenditure (capex) on further enhancements of our grid, which plays an essential role in supporting Malaysia’s energy transition. We are also focused on nurturing a Reimagining Culture, in which TNB employees fully embrace our aspiration and have the competencies to ensure we achieve our objectives, as this is fundamental to our strategic plan.
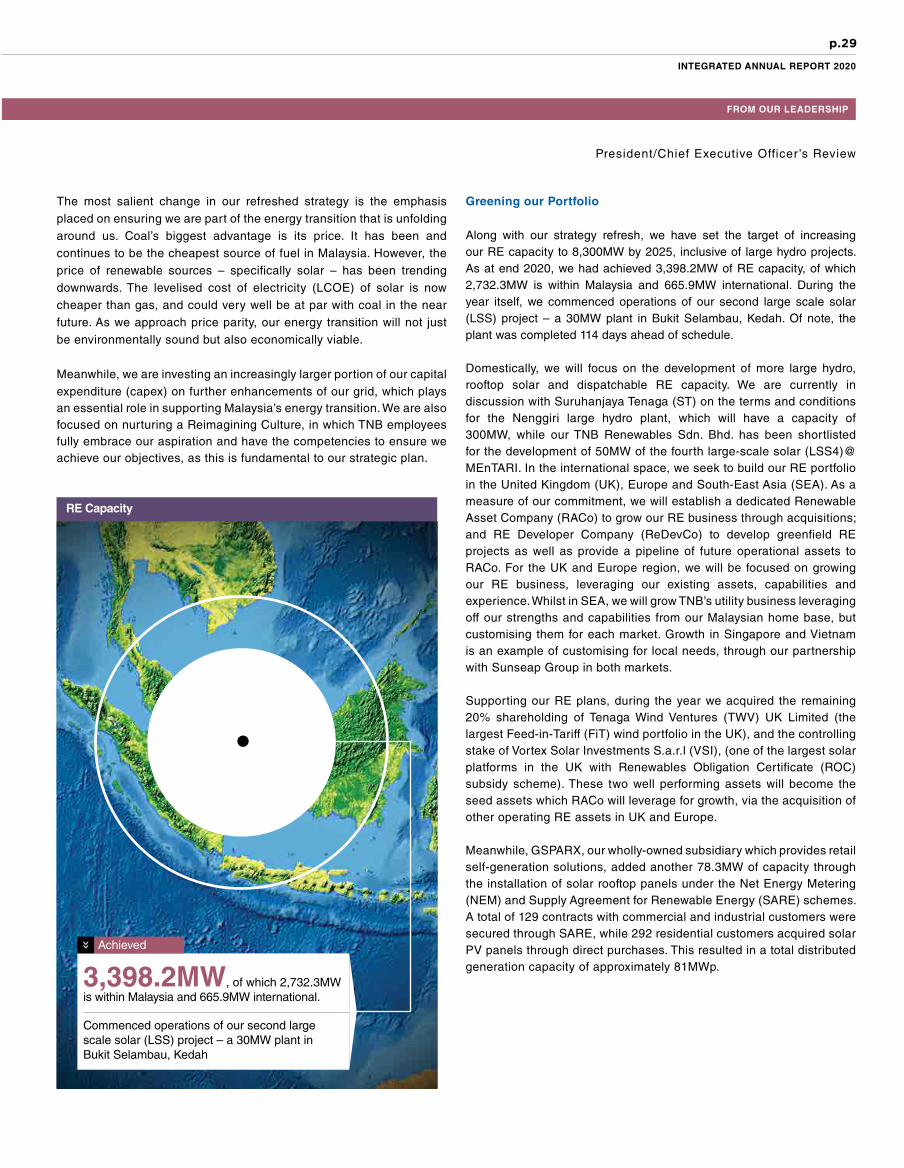
Greening our Portfolio
Along with our strategy refresh, we have set the target of increasing our RE capacity to 8,300MW by 2025, inclusive of large hydro projects. As at end 2020, we had achieved 3,398.2MW of RE capacity, of which 2,732.3MW is within Malaysia and 665.9MW international. During the year itself, we commenced operations of our second large scale solar (LSS) project – a 30MW plant in Bukit Selambau, Kedah. Of note, the plant was completed 114 days ahead of schedule.
Domestically, we will focus on the development of more large hydro, rooftop solar and dispatchable RE capacity. We are currently in discussion with Suruhanjaya Tenaga (ST) on the terms and conditions for the Nenggiri large hydro plant, which will have a capacity of 300MW, while our TNB Renewables Sdn. Bhd. has been shortlisted for the development of 50MW of the fourth large-scale solar (LSS4)@MEnTARI. In the international space, we seek to build our RE portfolio in the United Kingdom (UK), Europe and South-East Asia (SEA). As a measure of our commitment, we will establish a dedicated Renewable Asset Company (RACo) to grow our RE business through acquisitions; and RE Developer Company (ReDevCo) to develop greenfield RE projects as well as provide a pipeline of future operational assets to RACo. For the UK and Europe region, we will be focused on growing our RE business, leveraging our existing assets, capabilities and experience. Whilst in SEA, we will grow TNB’s utility business leveraging off our strengths and capabilities from our Malaysian home base, but customising them for each market. Growth in Singapore and Vietnam is an example of customising for local needs, through our partnership with Sunseap Group in both markets.
Supporting our RE plans, during the year we acquired the remaining 20% shareholding of Tenaga Wind Ventures (TWV) UK Limited (the largest Feed-in-Tariff (FiT) wind portfolio in the UK), and the controlling stake of Vortex Solar Investments S.a.r.l (VSI), (one of the largest solar platforms in the UK with Renewables Obligation Certificate (ROC) subsidy scheme). These two well performing assets will become the seed assets which RACo will leverage for growth, via the acquisition of other operating RE assets in UK and Europe.
Meanwhile, GSPARX, our wholly-owned subsidiary which provides retail self-generation solutions, added another 78.3MW of capacity through the installation of solar rooftop panels under the Net Energy Metering (NEM) and Supply Agreement for Renewable Energy (SARE) schemes. A total of 129 contracts with commercial and industrial customers were secured through SARE, while 292 residential customers acquired solar PV panels through direct purchases. This resulted in a total distributed generation capacity of approximately 81MWp.
RE Capacity
3,398.2MW, of which 2,732.3MW is within Malaysia and 665.9MW international.
Commenced operations of our second large scale solar (LSS) project – a 30MW plant in Bukit Selambau, Kedah
Achieved

p.30
TENAGA NASIONAL BERHAD
As an energy player, the most important aspect of our sustainability agenda is to support global efforts to mitigate
climate change. We recognise this responsibility; and indeed today – as we fully embrace the energy transition – it is
integral to our business aspiration.
Strengthening & Stabilising Our Grid
Our grid is a key enabler to achieving Malaysia’s energy transition. In order to accommodate the injection of RE onto the grid, and its distribution, we need to develop a more advanced and digitalised energy super highway – one that has the flexibility as well as reliability to be able to support bi-directional, intermittent energy flows while preserving voltage stability. Accordingly, we have embarked on a Grid of the Future journey which will enable the system to accommodate innovative energy solutions as these emerge while having inbuilt cybersecurity as well as resilience against the impact of climate change. We have allocated RM9 billion per annum from 2021 to 2024 to upgrade our grid, upon the Government’s approval.
Meanwhile, we have been making good progress in adopting smart grid technologies including distribution automation (DA) and advanced metering infrastructure (AMI), to better serve our customers. In 2020, we installed 1,961 substations with DA systems bringing the total number of enabled substations to 17,965. This means some 1.9 million customers can now enjoy recovery of electricity in as fast as five minutes in the event of outages or breakdowns.We also pushed ahead with the installation of smart meters, bringing the total number deployed to date to 891,294, mainly in Melaka and the Klang Valley. Under our phased plan, we are to deploy a total of 1.5 million meters by 2021 and another 2.1 million by 2024, covering approximately 40% of our customers in Peninsular Malaysia.
Investments into the grid are beginning to gain industry recognition. It was encouraging to score 62.5% in SP Group’s Smart Grid Index 2020, a marked improvement of 10.7% from 51.8% in 2019. SP Group, a Singapore Government-owned electricity and gas distribution company, assesses energy companies’ performance based on seven key smart grid-related dimensions.
Empowering our Customers
Any successful energy transition will necessarily involve the participation of consumers, who need to understand how they are consuming energy and what they can do to reduce their consumption. Smart meters are key towards this end, providing near real-time data through our myTNB web portal and mobile app. During the first Movement Control Orders, digital adoption accelerated resulting in 50% of customers becoming users of myTNB. Customers are increasingly seeking convenience in their digital journeys, driving myTNB to become the No.1 ranked app in June 2020.
As a further means to help consumers reduce their energy consumption, we offer advisory and technical services for the installation of energy efficient (EE) systems via our subsidiaries TNB Energy Services Sdn Bhd (TNBES) and TNB Energy Corporation Sdn Bhd (TNEC). During the year, these companies further expanded their client portfolios to include major organisations such as PETRONAS’ training institute, INSTEP, and the Kuala Lumpur International Airport (KLIA).
We also seek to enable customers to participate in the supply and trading of RE. Other than to generate their own RE, in 2019 we launched myGreen+ and the Malaysian Green Attribute Tracking System (mGATS). myGreen+ allows customers to subscribe to green energy from the grid, facilitated by mGATS, that enables them to purchase Renewable Energy Certificates (REC) directly from RE generators. As of end 2020, we had sold 483,400MWh of RE certificates (RECs) out of 748,904MWh tradable units, while 120 customers had signed up for 190MWh under myGreen+. The choices that we are making available to customers have effectively created more prosumers, who are more empowered and in control of their consumption.
Meanwhile, our high-speed broadband (HSBB) project under Jalinan Digital Negara (JENDELA, previously known as the National Fiberisation & Connectivity Plan) is advancing according to plan. Our wholly-owned subsidiary Allo Technology Sdn. Bhd. has completed the rollout of HSBB in Melaka, and is currently expanding the network to Perak, Penang, Kedah and Johor. The total number of premises passed in the year 2020 was 26,000; and the target is to hit 150,000 by Q2 2021. During the year, Allo also signed agreements with Astro and Digi Telecommunications for the provision of broadband services riding on its infrastructure.
More generally, we seek to establish better engagement with our customers to be able to hear their concerns and ensure these are adequately addressed. We have made available various platforms for customers to provide feedback – for example via myTNB CareLine and face-to-face at our outlets – and are encouraging them to use these communication platforms more proactively.
Sustainability
We believe we have a significant role to play in the Government meeting its objective of reducing the nation’s energy intensity per GDP up to 45% from the 2005 base by the year 2030. Other than promoting RE – both in our own energy mix as well as among our consumers, we have invested and applied energy efficiency initiatives at some of our major buildings, that resulted in marked improvements of up to 5% in annual electricity consumption for these premises. Meanwhile teams at TNB Research Sdn. Bhd. (TNBR) are conducting studies on solar PV cooling technology, biogas source from non-POME (Palm Oil Mill Effluent) organic, and alternative sources for biomass to further explore new RE technologies and innovations.
President/Chief Executive Officer ’s Review

p.31
INTEGRATED ANNUAL REPORT 2020
FROM OUR LEADERSHIP
Acknowledgements
I write this review having only just taken up my new position as President/CEO of TNB, effective 1 March 2021. I feel very honoured by this appointment, and would like to express my gratitude to the Board of Directors for their trust in my ability to lead one of Asia’s leading utility companies. I would also like to thank my predecessor, Datuk Seri Amir Hamzah Azizan, for his significant contributions to TNB and for guiding the Company through our first steps into an exciting energy transition. Datuk Seri Amir, who joins EPF as its CEO, was responsible for our strategy refresh and has laid the foundations for our successful Reimagining transformation.
TNB’s continued relevance in a fast-changing energy industry is due to the support of a large number of stakeholders. I would like to acknowledge the Government and regulators, first and foremost, for their continued collaboration and trust in TNB and other key stakeholders in shaping critical policies related to the industry; our Directors for their unstinting support and counsel; my colleagues on the management team for their dedication to the organisation; and, most of all, the 35,576 employees, who have truly demonstrated what it means to serve the nation.
Accept my humblest gratitude for being given this opportunity to lead an organisation that has played, and continues to play, such a key role in the nation’s development. TNB has an incredibly talented and devoted team. With their continued support, I feel confident that TNB will be able to lead the nation into a brighter, better future.
Datuk Ir. Baharin Bin Din
President/Chief Executive Officer
Supply Industry (MESI) 2.0 Reforms, which have been necessitated by the drastic economic slowdown experienced in 2020. We believe that careful planning and execution of industry reforms would serve as a catalyst in attracting high value, high tech businesses which create multiplier effects, including the transition towards a high-income nation and transformation of human capital in the form of upskilled jobs and better wages for the rakyat.
Meanwhile, having refreshed our 10-year strategic plan, TNB will be focusing our attention on the ongoing energy transition, ensuring that we build our capacities to be able to provide sustainable energy solutions in Malaysia and the international markets we are in. The establishment of separate entities to manage our generation and retail operations will support this aspiration.
We believe, moreover, that investments towards achieving an effective energy transition will contribute positively to the national economy. It is estimated that the RE industry generates 2.5x to 3x more employment per dollar of investment than fossil fuel technologies. Through RE developments, we look forward to playing a key role in the country’s recovery from the pandemic by creating a viable path towards a low-carbon economy.
We also contribute to a low-carbon environment in other ways. For example, we are working with Malaysian Green Technology and Climate Change Centre (MGTC) to set up more electric vehicle charging stations nationwide. As at end of 2020, a total of 73 new ChargEV stations had been installed.
Outlook
We began the year 2021 with a resurgence in COVID-19 cases. However, with appropriate Government intervention, the situation has stabilised. And, with the rollout of vaccines beginning in February, there is good reason to believe that the economy will recover during the year. GDP for 2021 has been anticipated at 6.5%-7.5%. Along with the economic recovery, we expect demand for electricity to also recover, though the pace of recovery is yet uncertain.
Due to the setbacks in 2020, we had suggested an extension of the Regulatory Period 2 (RP2) for a year. This was approved by the Government, hence RP2 will be effective until end 2021. We have submitted our proposal for RP3 to ensure its relevancy to the new normal that has been shaped by the pandemic. We will also be working with the Government and regulators on the review to the Malaysian Electricity
Datuk Ir. Baharin bin Din expresses his gratitude towards his predecessor, Datuk Seri Amir Hamzah bin Azizan for his significant contributions in laying stellar foundations towards energy transition and sustainability.
President/Chief Executive Officer ’s Review


Mapping Our PerformanceAgainst the Capitals
46Financial Capital
48Manufactured Capital
50Natural Capital
52Intellectual Capital
54Human Capital
56Social and Relationship Capital
CreatingContinued Value
34The Market Landscape
36Our Value Creation Model
Achieving OurStrategic Ambitions
38Future Generation Sources
40Grid of the Future
42Winning the Customer
44Future Proof Regulations

p.34
TENAGA NASIONAL BERHAD
The Market Landscape
MALAYSIA ELECTRICITY SUPPLY INDUSTRY (MESI) 2.0
The electricity sector has been on the path to embark on the next phase of electricity industry transformation based on the announced MESI 2.0 Reforms in September 2019.
However, Q1 2020 took a drastic turn globally and to the country, with the spread of the COVID-19 pandemic, the enforced MCO by the Government of Malaysia to curb this and the global oil price crash in March 2020. These unprecedented series of events have raised the need for the Government to recalibrate their position on various targets, plans and programmes, including MESI 2.0 Reforms.
As part of the MESI 2.0 Reforms, there are initiatives introduced to give green generator access to the transmission and distribution infrastructure even though a Third-Party Access (TPA) framework has yet to be established. This is to promote energy transition towards sustainable energy sources. Also, a Green Third-Party Contract (GTPC) which acts as an interim TPA framework is planned to be rolled out in 2021 which gives access to consumers to source green energy directly from green sources; to be treated as a pilot with limited quota.
The Government has indicated that a holistic study will be conducted to review the MESI 2.0 Reform initiatives taking into consideration the current circumstances and economic outlook. The Minister of Energy and Natural Resources (KeTSA) has recently announced that the review will be aimed at future-proofing the industry without structural changes, with emphasis on more people-friendly aspects. The focus would be on preparing MESI to face the challenges from the emergence of disruptive technologies, especially those involving renewable energy sources such as solar. This is in line with the Government’s priorities on reviving the country’s economy impacted by COVID-19 as well as the well-being and interests of the people.
TNB has been the energy provider for the nation for over 71 years.

p.35
INTEGRATED ANNUAL REPORT 2020
CREATING CONTINUED VALUE
The Market Landscape
ENERGY TRANSITION INCENTIVE BASED REGULATION (IBR)
Globally, energy transition trends have been gaining significant momentum, charting new pathways toward transformation of the energy sector to reduce energy-related greenhouse gas emissions in response to growing concerns over climate change and environmental sustainability. Historically, driving energy transition meant facing trade-offs between affordability and environmental sustainability because renewable technologies were much more expensive than traditional fossil fuels. However, the context has changed dramatically over the past decade, due to falling prices of renewable technologies, presenting the opportunity for the country to adopt clean energy in an affordable manner. It is clear that the shift towards renewables is inevitable. In our vision of the future, decarbonisation will be affordable thus enabling greater adoption of renewables in our energy mix.
The Government has indicated its plans to announce a new National Energy Policy in the second quarter of 2021, which aims to ensure energy sector development is in line with global energy transition trends, and bring about improvements to the country’s energy governance structure and MESI. These efforts are timely considering the fast-evolving energy landscape driven by the global energy transition and industry megatrends, which will require us to future-proof the sector. We are fully supportive of the Government’s effort in moving forward with Malaysia’s energy transition and achieving its sustainability aspirations, towards sustainable economic growth and benefits to the rakyat.
Intermittency of renewable technologies such as solar poses new challenges in maintaining energy security that is quite different from an energy system designed to be heavily reliant on fossil fuels. To prepare our electricity system for the future, TNB intends to go beyond traditional investments in grid expansion to fundamentally modernise and shape Malaysia’s Grid of the Future. This includes digitalising the grid to improve operational efficiency, as well as deploying technologies that enable the energy transition including renewable energy, distributed energy resources and the electrification of mobility, appliances, and industry. We believe that the IBR framework already provides a robust platform to plan and prioritise such future investments.
With respect to IBR implementation, the MCO has impacted the process for RP3 determination, whereby the focus was entirely shifted to managing the COVID-19 pandemic and the immediate impacts it brings to public health, the economy and society.
Previously, gas pricing to the Power Sector was based on a two-tier price mechanism, with gas volumes below the threshold quantity of 1000 mmscfd priced at the Regulated Price, and gas volumes above the threshold quantity priced at the ex-Bintulu LNG Price. In May 2017, the Cabinet decided that a single-tier pricing mechanism, called the Reference Market Price (RMP), would be implemented once the Regulated Gas Price reached market parity. The RMP, which served as the applicable gas price for all power plants in the Power Sector that procured gas from PETRONAS Energy & Gas Trading (PEGT), was implemented starting Q1 2020 due to the convergence of the Regulated Gas Price with the RMP at the end of 2019. With the introduction of RMP, the entire Power Sector gas volume will be based on market prices which are dependent on the movement of global oil prices.
As 2020 progressed, the world also saw a significant movement in global fuel price which affected both RMP and Coal prices used as the base for RP3 determination. It was noticed that the movement of fuel price was very fluid, and it was difficult to establish a solid foundation to determine the base price.
In May 2020, the effect of the pandemic and MCO on the electricity industry further unfolded where the demand forecast for the years 2020 and 2021 reduced by 6-7% from the previous forecast. In light of all these extraordinary circumstances, the Government has decided that the tariff review and implementation of RP3 will be delayed by one year, which means that RP3 will only start in 2022. Subsequently, in August 2020, the Energy Commission announced that RP2 will be extended until 31 December 2021 in which the base tariff will be maintained at 39.45 sen/kWh.
Meanwhile, we have completed our RP3 2022–2024 proposal and submitted it to the Government in February 2021 for consideration by the relevant authorities.
We are proud of the substantial improvement in system performance, operational efficiency and customer service and we aspire to do more in empowering the customer through Grid of the Future. The base tariff of 39.45 sen/kWh approved under the IBR framework, coupled with the Government’s continued commitment on the implementation of Imbalance Cost Pass-Through (ICPT) throughout RP2 (2018 - 2021), have been instrumental in enabling us to successfully operate the network efficiently with lower cost to the customer compared to regional peers.

p.36
TENAGA NASIONAL BERHAD
Our Value Creation Model
OUR STRATEGY OUR CAPITALS
Financial Capital
Natural Capital Fuel Use(2)
Intellectual Capital
Human Capital
Social and Relationship Capital
Effective Weighted Average Cost of Funds (%)
Customers Trade Union
GovernmentVendors
Investors
CommunitiesEmployees
FY2020
4.95.1 5.0 5.0
4.7
5.1
FY2019 FY2018 FY2017restated
FY2017 FY2016
FUTURE GENERATION SOURCES
GRID OF THE FUTURE
WINNING THE CUSTOMER
FUTURE PROOF REGULATIONS
Top Priorities
• Growing TNB’s renewable capacity• Expansion of capacity into selected
international strategic markets with strong growth prospects
• Improving performance of existing generation fleet
Top Priorities
• Upgrading existing network infrastructure into a smart, automated and digitally-enabled network
• Optimising network’s productivity, efficiency and reliability
• Leveraging innovation in the network to transform customer experience
Top Priorities
• Enhance experience through all customer journeys for service, interaction, communication channels
• Growth through innovation of new solutions and service offerings
• Strengthen digital presence via digital solutions, interactions and enterprise
Top Priorities
• Working together with key stakeholders towards a stable and sustainable regulatory landscape
Please refer to pages 38-39 for more information
Please refer to pages 40-41 for more information
Please refer to pages 42-43 for more information
Please refer to pages 44-45 for more information
Shareholders’Funds
Employees
TotalBorrowings
million
TNB Group
million RM 57,449.9
35,576
RM 49,452.6
736,283.05
93,526
94,561
Circuit kilometres of transmission and distribution line1
79% MALE
21% FEMALE
Primary and secondary substations1
Primary and secondary transformers1
COAL503,073,775TJ
OIL0TJ
Research and Development
Operational andservice innovations
Technology and business model innovations
GAS173,969,376.47TJ
DISTILLATE4,582,272.48TJ
Employees’Gender
Build Trust
Create Value
NGO
Please refer to pages 46-47 for more information
Please refer to pages 48-49 for more information
Please refer to pages 50-51 for more information
Please refer to pages 52-53 for more information
Please refer to pages 54-55 for more information
Please refer to page 56-57 for more information
Manufactured Capital Oil279.70MW
1.89%
Coal6,819.77MW
45.98%
Renewable366.64MW2.47%
Hydro2,638.83MW
17.79%
Gas 4,728.25MW31.88%

p.37
INTEGRATED ANNUAL REPORT 2020
CREATING CONTINUED VALUE
Our Value Creation Model
VALUES CREATED AND THEIR IMPACT OUTCOMES
Economic
Community
Customers
Environment
Please refer to pages 140-143 for more information
Please refer to pages 160-168 for more information
Please refer to pages 144-146 for more information
Please refer to pages 50-51 for more information
Total Energy Sold by Region
Notes:(1) For operations in Peninsular Malaysia, Sabah and
International only.(2) From power plants in which TNB has controlling
stake for period FY2020.(3) From domestic power plants which TNB has
invested in and has power purchasing agreements for domestic customers.
(4) Units sold by wholly-owned TNB international power plants only.
(5) For TNB operations in Peninsular Malaysia only for the period of FY2020.
Net Profit Attributable to Owners of the Company - RM3,592.7 mil
110,881.8GWh-Peninsular Malaysia(3)
5,325.3GWh-Sabah(3)
981.1GWh-International(4)
Fuel cost
Total Energy Units Sold(3): Customer Accounts:
ShareholdersTotal dividends
Other OperatingCosts
LendersFinancial Cost
million
GWh
million million million RM9,514.4
117,188.2million9.44
million0.64
RM5,235.8RM28,534.9 RM3,668.7
Suppliers and ContractorsFuel and Other Operating Costs
Capital Providers
8AdoptedSchools
7,003Graduate Students
Assisted
7,724Primary and
Secondary Students Assisted
Greenhouse Gas Emissions Intensity(5) Emissions Mitigated(5)
tCO2e/MWh million tCO2e0.57 5.98
Mitigation due to TNB’s use of(1) Renewables, (2) EE solutions,(3) Low-carbon generation, (4) Tree planting
Operating Profit - RM7,358.8 mil
9,07
2.0
FY20
16
9,3
64.0
FY20
17
3,01
4.0
6,87
5.6
8,20
6.8
FPE
201
7*(R
esta
ted
)
7,35
8.8
FY20
20
FY20
19
FY20
18
7,36
7.6
FY20
16
6,90
4.0
FY20
17
2,62
2.3
3,7
23.7 4,
529.
2
FPE
201
7*(R
esta
ted
)
3,59
2.7
FY20
20
FY20
19
FY20
18Peninsular Malaysia Sabah

p.38
TENAGA NASIONAL BERHAD
Future Generation Sources
With the ongoing global Energy Transition, the future energy source is green and renewable as the world seeks to decarbonise in order to mitigate climate change.
Achieving Our Strategic Ambitions
OVERVIEW
TNB’s generation operating segment produced a total of 70,758 GWh of electricity from coal and gas sources, 4,660 GWh from hydro power (with total installed capacity of 2,745 MW), and 129 GWh from renewable sources, primarily solar photovoltaic panels. Our aim is for renewable energy (RE) to make up 40% of our total capacity mix by the year 2025 as we grow our capacity domestically and in selected international markets.
Number of power plants
Total installed capacity
(MW)
Equity capacity
(MW)
Electricity sent out
(GWh)
Capacity under construction
(MW)
100% Owned
Coal 2 4,080.00 4,080.00 25,370,935.30 -
Gas 7 3,926.43 3,926.43 21,719,513.85 -
Non-Carbon 73 2,650.38 2,650.38 4,819,518.77 -
Others - - - - -
Majority-owned
Coal 2 3,474.00 2,284.40 23,645,820.86
Gas 2 690.00 439.76 7,861.75 1,440.00
Non-Carbon 30 446.03 268.01 774.72
Others 50 250.97 208.30 395.35
Minority-owned
Coal 3 1,650.00 455.37 9,701.00 350.00
Gas 2 1,241.00 362.06 4,029.19
Non-Carbon 12 274.96 82.06 775.03 1,380.00
Others 1 1,190.00 71.40 6,849.68
TNB is committed to transitioning towards renewable energy sources as we seek to grow our capacity in select international markets.
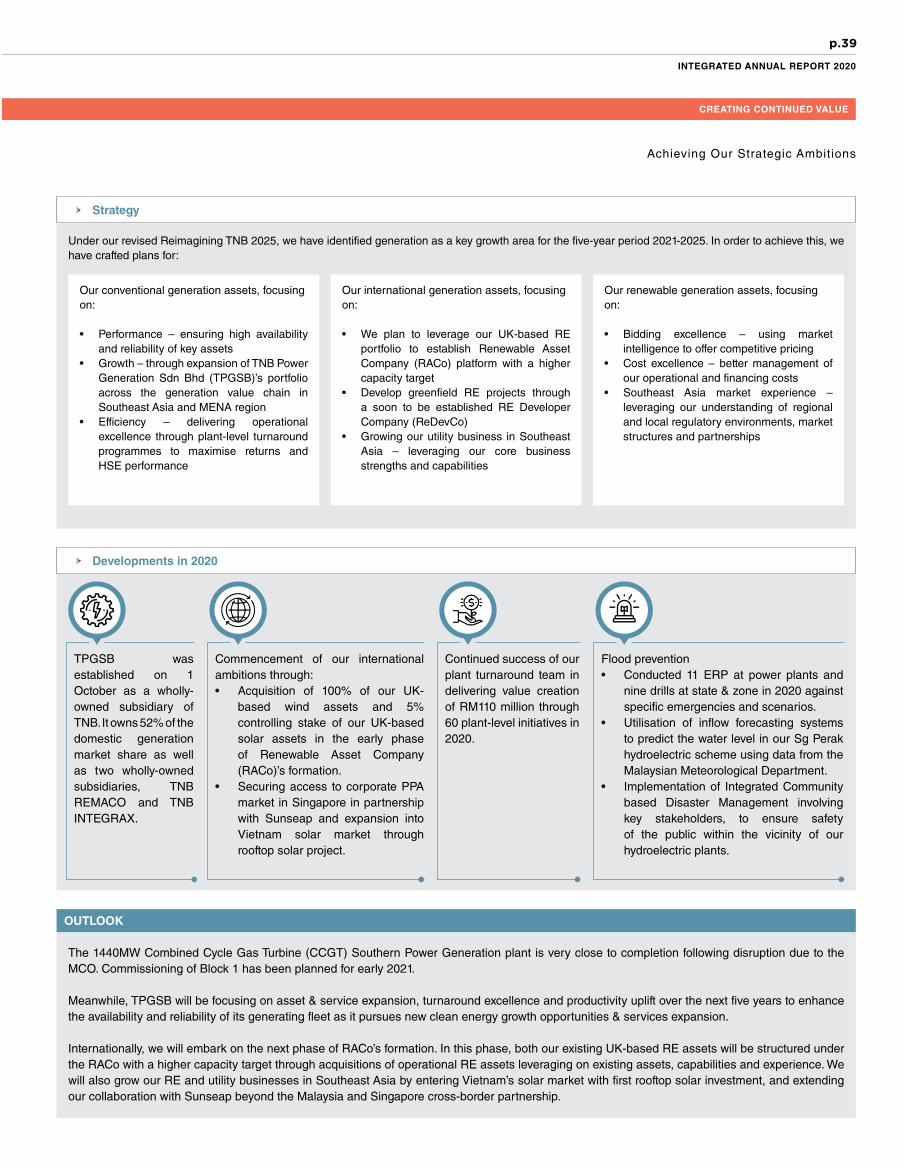
p.39
INTEGRATED ANNUAL REPORT 2020
CREATING CONTINUED VALUE
Under our revised Reimagining TNB 2025, we have identified generation as a key growth area for the five-year period 2021-2025. In order to achieve this, we have crafted plans for:
Our conventional generation assets, focusing on:
• Performance – ensuring high availability and reliability of key assets
• Growth – through expansion of TNB Power Generation Sdn Bhd (TPGSB)’s portfolio across the generation value chain in Southeast Asia and MENA region
• Efficiency – delivering operational excellence through plant-level turnaround programmes to maximise returns and HSE performance
Our international generation assets, focusing on:
• We plan to leverage our UK-based RE portfolio to establish Renewable Asset Company (RACo) platform with a higher capacity target
• Develop greenfield RE projects through a soon to be established RE Developer Company (ReDevCo)
• Growing our utility business in Southeast Asia – leveraging our core business strengths and capabilities
Our renewable generation assets, focusing on:
• Bidding excellence – using market intelligence to offer competitive pricing
• Cost excellence – better management of our operational and financing costs
• Southeast Asia market experience – leveraging our understanding of regional and local regulatory environments, market structures and partnerships
Strategy
Developments in 2020
Achieving Our Strategic Ambitions
OUTLOOK
The 1440MW Combined Cycle Gas Turbine (CCGT) Southern Power Generation plant is very close to completion following disruption due to the MCO. Commissioning of Block 1 has been planned for early 2021.
Meanwhile, TPGSB will be focusing on asset & service expansion, turnaround excellence and productivity uplift over the next five years to enhance the availability and reliability of its generating fleet as it pursues new clean energy growth opportunities & services expansion.
Internationally, we will embark on the next phase of RACo’s formation. In this phase, both our existing UK-based RE assets will be structured under the RACo with a higher capacity target through acquisitions of operational RE assets leveraging on existing assets, capabilities and experience. We will also grow our RE and utility businesses in Southeast Asia by entering Vietnam’s solar market with first rooftop solar investment, and extending our collaboration with Sunseap beyond the Malaysia and Singapore cross-border partnership.
TPGSB was established on 1 October as a wholly-owned subsidiary of TNB. It owns 52% of the domestic generation market share as well as two wholly-owned subsidiaries, TNB REMACO and TNB INTEGRAX.
Commencement of our international ambitions through:• Acquisition of 100% of our UK-
based wind assets and 5% controlling stake of our UK-based solar assets in the early phase of Renewable Asset Company (RACo)’s formation.
• Securing access to corporate PPA market in Singapore in partnership with Sunseap and expansion into Vietnam solar market through rooftop solar project.
Continued success of our plant turnaround team in delivering value creation of RM110 million through 60 plant-level initiatives in 2020.
Flood prevention• Conducted 11 ERP at power plants and
nine drills at state & zone in 2020 against specific emergencies and scenarios.
• Utilisation of inflow forecasting systems to predict the water level in our Sg Perak hydroelectric scheme using data from the Malaysian Meteorological Department.
• Implementation of Integrated Community based Disaster Management involving key stakeholders, to ensure safety of the public within the vicinity of our hydroelectric plants.

p.40
TENAGA NASIONAL BERHAD
Grid of the Future
Grid Statistics
Achieving Our Strategic Ambitions
OVERVIEW
The National Grid supplies 9.44 million homes and businesses along the length and breadth of Peninsular Malaysia. It is interconnected in the north to Thailand’s EGAT grid system and in the south to Singapore Power’s grid system. Its most important function is to keep the lights on by ensuring adequate, secure and reliable supply to meet electricity demand. Equipped with sophisticated energy management systems such as SCADA, our grid has been performing at world-class standards.
Our grid is critical to the success of TNB’s energy transition. We are making significant investments into the national grid in order to enhance its ability to support increasing generation of renewable energy by our prosumers, reliably and efficiently. Fully automated, the grid will also empower customers to better manage their consumption.
Transmission Lines
24,607Circuit-km
Peninsular
2,941Circuit-km
Sabah
Distribution Lines
703,312km
Peninsular
5,423km
Sabah
Transmission Substations
462 substations
Peninsular
48 substations
Sabah
Distribution Substations
85,127substations
Peninsular
8,312substations
Sabah
Electricity Transmitted
123,290GWh
Peninsular
6,392GWh
Sabah
Electricity Distributed
115,779GWh
Peninsular
5.298GWh
Sabah
Peak demand
18,808MWh
Peninsular
987.08MWh
Sabah
To equip our electricity system for the future, TNB intends to go beyond traditional investments in grid expansion to fundamentally modernise and shape Malaysia’s Grid of the Future.

p.41
INTEGRATED ANNUAL REPORT 2020
CREATING CONTINUED VALUE
Strategy
Transmission Network
In ensuring a safe, secure and reliable national grid system, our strategy is to leverage new technology and improve efficiency by creating a self-healing grid, while making greater use of demand management. Under our refreshed strategy, our Grid of the Future programme has been divided into six investment categories:
Achieving Our Strategic Ambitions
OUTLOOK
Capex projects in 2021 will focus on meeting customer demand and ensuring system reinforcement for higher reliability and security of our transmission network. This will include continuation of the 500kV Backbone Projects. We have obtained approval from the regulators to deploy RM6.8 billion worth of regulated network capex projects, of which 58% is to enable supply provision, and 28% to improve systems performance.
Under the ongoing AMI programme approved by the regulators, we will be installing another 600,000 meters in 2021 in the Klang Valley, to bring the total to 1.5 million smart meters.
Distribution Network
We have identified key focus areas to ensure the successful transformation of our distribution grid in order to be able to fulfil its new envisioned roles.
Focus Areas Objectives
Develop Smart Grid • To increase network reliability and grid control in a dynamic and complex distribution system• To increase integration of distributed energy resources• Enable bi-directional power flows which can increase the integration of customer-owned power generation systems,
including renewable energy
Unleash Workforce Capability
• To enhance the technical expertise of DN employees through the establishment of the Distribution Network Academy and the Distribution Network Engineering Centre
• To improve workforce capabilities in customer-facing areas • To improve the quality of customer service and the interactions that customers have with our employees
Excel in IBR Framework • To improve productivity with prudent and efficient investment
Practise High Safety Culture • To build a strong safety culture within DN
Support Government Initiatives
• Supporting Government-led initiatives to help drive the energy transition in Malaysia and move towards customer choice and empowerment
Digitalise Business Interface • Improving business processes through development of digital applications to improve productivity
Provide Network Solutions • Establishment of the official service commitmment (availability, quality and responsibilities) through identified agreements to maintain excellent service delivery to customers and enable more transparent and efficient supply chain management for all identified DN key processes
Create Subsidiary (Strategic Business Unit as Interim)
• To enhance DN’s organisational structure while improving service delivery, efficiency and accountability for managing business operations
Think Business • To introduce activity-based costing for all services offered by DN• To ensure better management of DN’s cost structure• To provide fair pricing under IBR to all customers and industry stakeholders
Please refer to Manufacturing Capital for details on Grid of the Future: Developments in 2020.
New Grid Connection
Transmission development projects relate to expansion and improvement of the transmission system to cater for new generation plant-up, growth in demand, and plant rehabilitation while mitigating system constraints and limitations.
Grid Refurbishment
Grid refurbishment ultilising asset condition and risk based approach includes maintenance activities associated with primary and secondary asset replacement and refurbishment, GIS overhaul and midlife refurbishment.
Safety & Environment Compliance
This mitigates workforce safety-related risks while ensuring a clean environment.
Self-Healing Grid
Self-Healing Grid is to enable support of RE generation, improve network visibility and allow automated operation and control. Investing in a self-healing grid will allow us to maintain our world class availability, system minutes performance and system restoration.
Grid Digital Intelligent Infrastructure
Grid Digital Intelligence Infrastructure (GDII) serves to enhance asset management by leveraging data analytics and digital intelligence to drive operational excellence.
Smart Tools and Equipment
Smart Tools and Equipment enable routine maintenance tasks to be conducted more efficiently, through investment in tools and capabilities that will help automated processes reduce manhours and operation cost.

p.42
TENAGA NASIONAL BERHAD
Winning the Customer
Achieving Our Strategic Ambitions
OVERVIEW
TNB serves over 9.44 million customers across Peninsular Malaysia via our wide network of service, interaction and communication channels encompassing Click, Call and Come-over. Through our Retail Division, we continue to focus on improving our service delivery and taking the customer experience to new heights.
We are ultimately a service provider, and seek to win our customers through an enhanced experience at all touchpoints with TNB as we innovate new solutions and service offerings leveraging digital platforms.
Customers
2020
7,72
8,40
7
2019
7,5
53,
229
2018
7,37
8,42
5
2017
7,18
1,8
46
2016
6,9
84,
36
6
2020
2019
2018
2017
2016
2020
2019
2018
2017
2016
2020
2019
2018
2017
2016
2020
2019
2018
2017
2016
2020
2019
2018
2017
2016
1,000,000
2,000,000
3,000,000
4,000,000
5,000,000
6,000,000
7,000,000
8,000,000
10,000,000
9,000,000
0
Domestic Commercial Industrial Mining Streetlight Others
529,
185
519,
30
8
50
5,23
9
48
8,27
0
471,
94
3
31,6
54
30,
520
29,7
49
28,8
67
28,3
211,
991
1,5
53
1,5
89
1,59
8
1,60
3
77,
991
75,4
63
72,5
54
70,4
02
67,9
44
5,8
24
6,0
42
6,12
9
6,3
35
6,53
5
14,6
35
14,4
59
14,2
61
13,7
33
11,7
21
5353
45
38
34
Peninsular Malaysia Sabah
1,59
0,37
3
1,57
5,19
8
1,5
53,
607
1,51
0,3
41
1,4
53,
80
58
8,81
1
92,
90
6
96,
167
98,
479
99,9
74
TNB encourages customers to download myTNB app on their smartphones to better monitor and manage their energy usage.
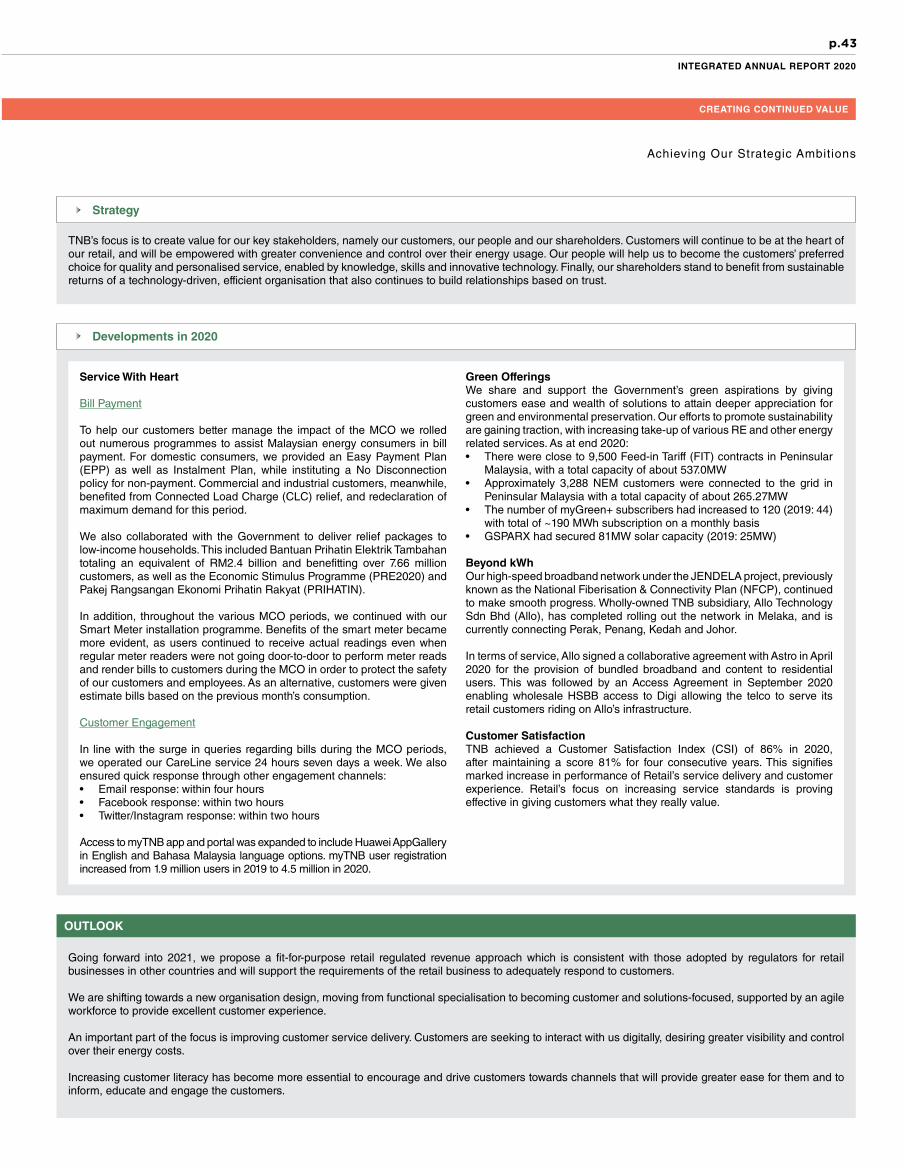
p.43
INTEGRATED ANNUAL REPORT 2020
CREATING CONTINUED VALUE
OUTLOOK
Going forward into 2021, we propose a fit-for-purpose retail regulated revenue approach which is consistent with those adopted by regulators for retail businesses in other countries and will support the requirements of the retail business to adequately respond to customers.
We are shifting towards a new organisation design, moving from functional specialisation to becoming customer and solutions-focused, supported by an agile workforce to provide excellent customer experience.
An important part of the focus is improving customer service delivery. Customers are seeking to interact with us digitally, desiring greater visibility and control over their energy costs.
Increasing customer literacy has become more essential to encourage and drive customers towards channels that will provide greater ease for them and to inform, educate and engage the customers.
Strategy
Developments in 2020
Achieving Our Strategic Ambitions
Service With Heart
Bill Payment
To help our customers better manage the impact of the MCO we rolled out numerous programmes to assist Malaysian energy consumers in bill payment. For domestic consumers, we provided an Easy Payment Plan (EPP) as well as Instalment Plan, while instituting a No Disconnection policy for non-payment. Commercial and industrial customers, meanwhile, benefited from Connected Load Charge (CLC) relief, and redeclaration of maximum demand for this period.
We also collaborated with the Government to deliver relief packages to low-income households. This included Bantuan Prihatin Elektrik Tambahan totaling an equivalent of RM2.4 billion and benefitting over 7.66 million customers, as well as the Economic Stimulus Programme (PRE2020) and Pakej Rangsangan Ekonomi Prihatin Rakyat (PRIHATIN).
In addition, throughout the various MCO periods, we continued with our Smart Meter installation programme. Benefits of the smart meter became more evident, as users continued to receive actual readings even when regular meter readers were not going door-to-door to perform meter reads and render bills to customers during the MCO in order to protect the safety of our customers and employees. As an alternative, customers were given estimate bills based on the previous month’s consumption.
Customer Engagement
In line with the surge in queries regarding bills during the MCO periods, we operated our CareLine service 24 hours seven days a week. We also ensured quick response through other engagement channels:• Email response: within four hours• Facebook response: within two hours• Twitter/Instagram response: within two hours
Access to myTNB app and portal was expanded to include Huawei AppGallery in English and Bahasa Malaysia language options. myTNB user registration increased from 1.9 million users in 2019 to 4.5 million in 2020.
Green OfferingsWe share and support the Government’s green aspirations by giving customers ease and wealth of solutions to attain deeper appreciation for green and environmental preservation. Our efforts to promote sustainability are gaining traction, with increasing take-up of various RE and other energy related services. As at end 2020:• There were close to 9,500 Feed-in Tariff (FIT) contracts in Peninsular
Malaysia, with a total capacity of about 537.0MW• Approximately 3,288 NEM customers were connected to the grid in
Peninsular Malaysia with a total capacity of about 265.27MW• The number of myGreen+ subscribers had increased to 120 (2019: 44)
with total of ~190 MWh subscription on a monthly basis• GSPARX had secured 81MW solar capacity (2019: 25MW)
Beyond kWhOur high-speed broadband network under the JENDELA project, previously known as the National Fiberisation & Connectivity Plan (NFCP), continued to make smooth progress. Wholly-owned TNB subsidiary, Allo Technology Sdn Bhd (Allo), has completed rolling out the network in Melaka, and is currently connecting Perak, Penang, Kedah and Johor.
In terms of service, Allo signed a collaborative agreement with Astro in April 2020 for the provision of bundled broadband and content to residential users. This was followed by an Access Agreement in September 2020 enabling wholesale HSBB access to Digi allowing the telco to serve its retail customers riding on Allo’s infrastructure.
Customer SatisfactionTNB achieved a Customer Satisfaction Index (CSI) of 86% in 2020, after maintaining a score 81% for four consecutive years. This signifies marked increase in performance of Retail’s service delivery and customer experience. Retail’s focus on increasing service standards is proving effective in giving customers what they really value.
TNB’s focus is to create value for our key stakeholders, namely our customers, our people and our shareholders. Customers will continue to be at the heart of our retail, and will be empowered with greater convenience and control over their energy usage. Our people will help us to become the customers’ preferred choice for quality and personalised service, enabled by knowledge, skills and innovative technology. Finally, our shareholders stand to benefit from sustainable returns of a technology-driven, efficient organisation that also continues to build relationships based on trust.

p.44
TENAGA NASIONAL BERHAD
Achieving Our Strategic Ambitions
Future Proof Regulations
The Government has approved Imbalance Cost savings of RM1.14 billion to be passed through as ICPT rebate of 2.00 sen/kWh for all customers, including domestic customers with monthly consumption of less than 300kWh, for the period from 1 January 2021 to 30 June 2021.
This rebate is a result of a reduction in actual fuel costs from July to December 2020, with:
• Average coal price in the global market at USD58/MT compared to the benchmark price set in the base tariff at USD75/MT
• Power sector gas price of RM21/mmbtu compared to the benchmark price set in the base tariff of RM27.20/mmbtu
Balance or excess from the total Imbalance Cost savings for the period will be channelled to the Kumpulan Wang Industri Elektrik (KWIE) which will help stabilise the electricity tariff in the future via gradual build up of the fund.
Imbalance Cost Pass-Through
OVERVIEW
The electricity supply industry, like most others, has been severely impacted by the pandemic. Yet, it has been even more critical to ensure security, reliability and security of supply to keep powering the nation. While ensuring uninterrupted operations, TNB has also provided various relief measures to consumers, acknowledging widespread financial difficulty. This has placed tremendous financial pressure on the utility, and created the need for regulatory policy to support the industry’s sustainability.
As the electricity supply industry is highly regulated, it is imperative for TNB to engage in continuous dialogue and discussion with the Government and relevant regulators. The objective is to collaborate on policies that will help shape the sustainability of an industry that plays a critical role in supporting socio-economic development.
Malaysia Power Sector Fuel Prices (RM/GJ)
LNG Piped Gas RMPCoal
Jan
17
Jan
18
Jan
19
Jan
20
Mar
17
Mar
18
Mar
20
Mar
19
May
17
May
18
May
20
May
19
Jul 1
7
Jul 1
8
Jul 2
0
Jul 1
9
Sep
17
Sep
18
Sep
20
Sep
19
Nov
17
Nov
18
Nov
20
Nov
19
40
35
30
25
20
15
10
5
0
The updated timeline for tariff review and implementation of RP3 will commence in 2022 until 2024.

p.45
INTEGRATED ANNUAL REPORT 2020
CREATING CONTINUED VALUE
Achieving Our Strategic Ambitions
OUTLOOK
We have submitted our proposal for RP3 in February 2021, with negotiation to begin in Q2 2021. We have focused our proposal on efficiency and enhancing the role of both transmission and distribution grid in order to enable Energy Transition for Malaysia.
Asean Connections
The Lao PDR-Thailand-Malaysia Power Interconnection Project (LTM-PIP)
• The Lao PDR-Thailand-Malaysia Power Integration Project (LTM-PIP) is the first multilateral energy trading platform in ASEAN, through which Malaysia purchases electricity power from Lao PDR via Thailand’s existing transmission grid.
• A tripartite Energy Purchase and Wheeling Agreement (EPWA) was signed in September 2017 among Electricite Du Laos (EDL), Electricity Generating Authority of Thailand (EGAT) and TNB for the purchase of up to 100 MW of predominantly hydro energy from EDL, Lao PDR via Thailand’s transmission grid over a 2-year term from 1 January 2018 until 31 December 2019.
• In December 2019, a Supplementary Agreement to EPWA was signed between EDL, EGAT and TNB for the extension of an additional period of two years from 1 January 2020 until 31 December 2021 for the purchase of up to 300 MW and committed energy of 50GWh.
Up to December 2020, TNB has imported 1.72 GWh of hydro energy from Lao PDR.
• In response to the COVID-19 pandemic, the Malaysian Government announced a series of MCOs beginning from 18 March 2020, to stem the spread of the virus.
• As one of the founding members of the Corporate Malaysia Against COVID-19 Action Coalition, TNB was among the earliest organisations to step up and provide both immediate short-term economic relief, in the form of electricity discounts to lessen the rakyat’s burden, and address medium to long-term stimulus support needed to ensure the nation’s recovery post pandemic.
• As the pandemic wore on, TNB realised there was a need to shift our focus from short-term pandemic relief efforts to ensuring sustainable national recovery post-pandemic through structural economic changes. Towards this end, we have been proactively collaborating with the Government on six areas that we believe would help shape a stronger, more resilient economy supported by a future-ready workforce:
Stimulating the Economy Post Pandemic
At the 38th ASEAN Ministers on Energy Meeting in November 2020, it was agreed that member nations should strive for 35% RE in installed power capacity by 2025. This target is set under the ASEAN Plan of Action for Energy Cooperation (APAEC) Phase 2 which will be implemented from 2021 to 2025. It is very much in keeping with the global energy transition, and TNB’s refreshed strategic blueprint to become “a leading provider of sustainable energy solutions in Malaysia and internationally”.
Leading in Malaysia’s Energy Transition
Focus Areas
Catalysing the economy through Grid of the Future
Potential Contribution to GDP
RM20 billion
Potential Job Creation
300,000from 2021-2023
Building a global solar
manufacturing hub for Malaysia
Potential Contribution to GDP
RM6billion
Potential Job Creation
47,000over next 2 years
Raising national competitiveness through energy
efficiency
Potential Contribution to GDP
RM32 billion
Potential Job Creation
140,000over next 3 years
Making Malaysia the electric vehicle
hub for ASEAN
Potential Contribution to GDP
RM55 billion plus RM50 billion in
exports by 2030
Potential Job Creation
323,000by 2030
Advancing connectivity
for our digital economy
Potential Contribution to GDP
RM10 billion
Potential Job Creation
150,000over next 3 years
Reskilling Malaysia by
embracing the future of work
Potential Contribution to GDP
N/A
Potential Job Creation
4.5 millionin higher skilled,
higher waged roles
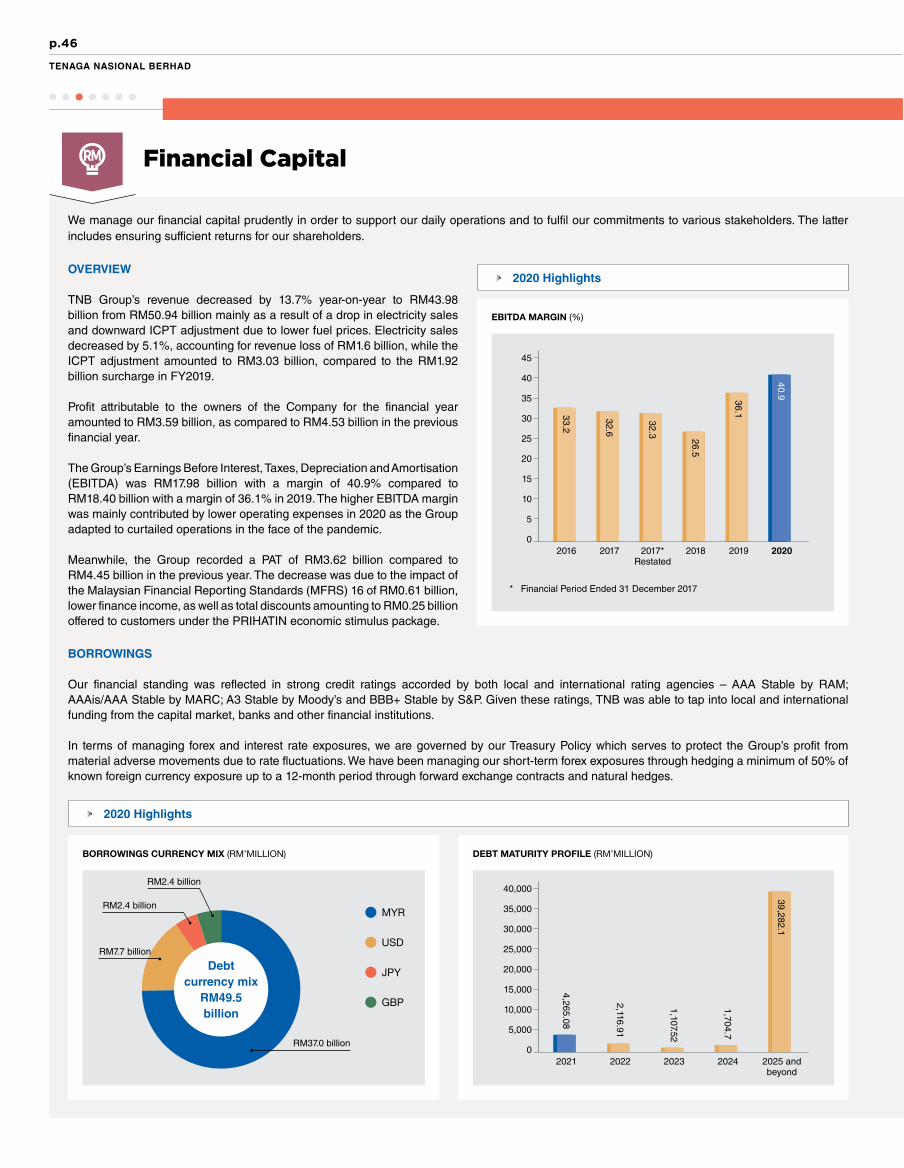
p.46
TENAGA NASIONAL BERHAD
EBITDA MARGIN (%)
2020 Highlights
We manage our financial capital prudently in order to support our daily operations and to fulfil our commitments to various stakeholders. The latter includes ensuring sufficient returns for our shareholders.
Financial Capital
OVERVIEW
TNB Group’s revenue decreased by 13.7% year-on-year to RM43.98 billion from RM50.94 billion mainly as a result of a drop in electricity sales and downward ICPT adjustment due to lower fuel prices. Electricity sales decreased by 5.1%, accounting for revenue loss of RM1.6 billion, while the ICPT adjustment amounted to RM3.03 billion, compared to the RM1.92 billion surcharge in FY2019.
Profit attributable to the owners of the Company for the financial year amounted to RM3.59 billion, as compared to RM4.53 billion in the previous financial year.
The Group’s Earnings Before Interest, Taxes, Depreciation and Amortisation (EBITDA) was RM17.98 billion with a margin of 40.9% compared to RM18.40 billion with a margin of 36.1% in 2019. The higher EBITDA margin was mainly contributed by lower operating expenses in 2020 as the Group adapted to curtailed operations in the face of the pandemic.
Meanwhile, the Group recorded a PAT of RM3.62 billion compared to RM4.45 billion in the previous year. The decrease was due to the impact of the Malaysian Financial Reporting Standards (MFRS) 16 of RM0.61 billion, lower finance income, as well as total discounts amounting to RM0.25 billion offered to customers under the PRIHATIN economic stimulus package.
* Financial Period Ended 31 December 2017
DEBT MATURITY PROFILE (RM’MILLION)
40,000
35,000
30,000
25,000
20,000
15,000
10,000
5,000
02021
4,265.08
2024
1,704.7
2022
2,116.91
2023
1,107.52
2025 and beyond
39,282.1
BORROWINGS CURRENCY MIX (RM’MILLION)
BORROWINGS
Our financial standing was reflected in strong credit ratings accorded by both local and international rating agencies – AAA Stable by RAM; AAAis/AAA Stable by MARC; A3 Stable by Moody’s and BBB+ Stable by S&P. Given these ratings, TNB was able to tap into local and international funding from the capital market, banks and other financial institutions.
In terms of managing forex and interest rate exposures, we are governed by our Treasury Policy which serves to protect the Group’s profit from material adverse movements due to rate fluctuations. We have been managing our short-term forex exposures through hedging a minimum of 50% of known foreign currency exposure up to a 12-month period through forward exchange contracts and natural hedges.
2020 Highlights
MYR
JPY
USD
GBP
Debt currency mix
RM49.5 billion
RM2.4 billion
RM2.4 billion
RM7.7 billion
RM37.0 billion
40
45
35
30
25
20
15
10
5
02016
33.2
2018
26.5
2017
32.6
2019
36.1
2017*Restated
32.3
2020
40.9
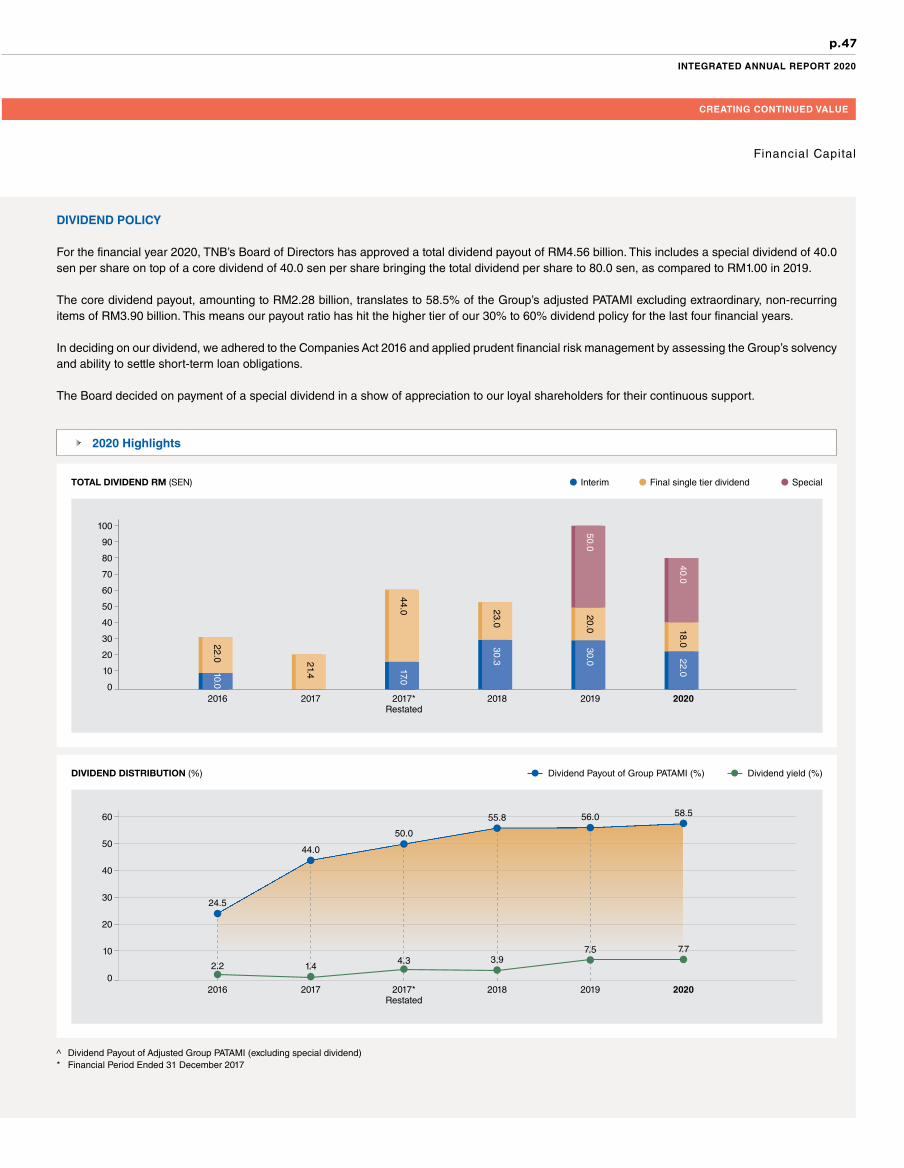
p.47
INTEGRATED ANNUAL REPORT 2020
CREATING CONTINUED VALUE
Financial Capital
DIVIDEND POLICY
For the financial year 2020, TNB’s Board of Directors has approved a total dividend payout of RM4.56 billion. This includes a special dividend of 40.0 sen per share on top of a core dividend of 40.0 sen per share bringing the total dividend per share to 80.0 sen, as compared to RM1.00 in 2019.
The core dividend payout, amounting to RM2.28 billion, translates to 58.5% of the Group’s adjusted PATAMI excluding extraordinary, non-recurring items of RM3.90 billion. This means our payout ratio has hit the higher tier of our 30% to 60% dividend policy for the last four financial years.
In deciding on our dividend, we adhered to the Companies Act 2016 and applied prudent financial risk management by assessing the Group’s solvency and ability to settle short-term loan obligations.
The Board decided on payment of a special dividend in a show of appreciation to our loyal shareholders for their continuous support.
TOTAL DIVIDEND RM (SEN) Interim Final single tier dividend Special
2020 Highlights
^ Dividend Payout of Adjusted Group PATAMI (excluding special dividend)* Financial Period Ended 31 December 2017
DIVIDEND DISTRIBUTION (%) Dividend Payout of Group PATAMI (%) Dividend yield (%)
02016 2017*
Restated2017 2018 2019 2020
60
50
40
20
30
10
24.5
50.0
44.0
55.8 56.0 58.5
7.7
2.24.3
1.43.9
7.5
100
90
80
70
60
50
40
30
20
10
02016 2017*
Restated
22.0
17.044.0
2017 2018 2019
21.4
2020
30.323.0
22.0
30.0
18.0
20.0
40.0
50.0
10.0

p.48
TENAGA NASIONAL BERHAD
Manufactured Capital
We have power and non-power related assets which directly and indirectly impact our ability to operate and keep the lights on efficiently, reliably and safely.
Asset Achievements in 2020 Focus in 2021
Power Generation Assets
Thermal generation plants:• 6 coal fired • 12 gas fired • 18 oil/distillate fired
Non-carbon plants:• 13 large hydro • 95 RE (mini hydro, solar, wind)
• Telom Transfer Tunnel was commissioned 34 days ahead of schedule. This tunnel further increases the water supply for our Ulu Jelai Hydro plant, improving plant firm capacity by 40%
• Improvement in our domestic conventional plants EAF to 87.4% from 81.8% in 2019
• The improved EAF has led to the increase by 85% in our domestic conventional plant’s EBIT for 2020
• TNB Renewables has been shortlisted by the regulator in the recently-held LSS@MeNTARI competitive bidding
• Our international solar portfolio continues to achieve higher year on year generation (2%) whilst maintaining portfolio availability above 95%
• Tenaga Wind Ventures achieved 20% higher generation in 2020 compared to 2019, whilst maintaining portfolio availability at 98%
• Commercialisation of 1,440MW Southern Power Generation plant by January 2021 (Block 1) and February 2021 (Block 2)
• Expand generation related O&M services in SEA and MENA region
• Establish a Renewable Asset Company within UK and Europe and grow its asset base to 1,000MW
• Establish a Renewable Developer platform to capture some of the projected 235GW in renewables to be added to EU and UK grids by 2030
• Explore and venture into renewable energy opportunities in Singapore and Vietnam with Sunseap
Power Network Assets
• 27,548 circuit km of transmission network
• 510 transmission substations• 703,311.61 circuit km of
distribution network• 85,127 distribution substations
• Domestic networks achieved best-ever performance – with transmission system minutes at 0.0806 minutes (2019: 0.27) and SAIDI at 44.95 minutes per customer (2019: 48.13)
• Completed RM5.7 billion worth of domestic network enhancements including:- Automation of 1,961 distribution substations, now
covering 22% of all substations in Peninsular Malaysia, benefiting 1.9 million customers
- Installation of 891,294 smart meters• Completed MV GIS data mapping for all states in
Peninsular Malaysia; and embarked on mobile mapping for LV assets. The programme is to be accelerated with the approval of 18 new vendors
• Phase 1 installation of smart meters completed with 300k meters deployed in Melaka
• 157,723 units of LED lights installed under the streetlight re-lamping project, bringing the cumulative total at year end to 483,776
• Achieve Smart Grid Index scoring of 62.5%, an increase of 10.7 percentage points from 2019
• Completion of RM6.8 billion worth of network enhancements
• 608,706 smart meters to be installed in Klang Valley, bringing the cumulative total to 1.5 million meters
• Completion of LED lighting programme, with targeted cumulative total of 579,080 units
• Recertification of ISO 55001
Non-Power Assets
• 9.36 million sq ft of office (total of 421 buildings) & operational work space
• 18,017 km of fibre optic network
• 4,217 vehicles
• Asset enhancement initiatives for selected Cahaya Resorts & projects planned for 2020 completed 100%
• Big savings on operational expenses totaling of RM44.52 million (3.32 million from facility management and 41.2M from land management)
• Under TNB’s participation in the JENDELA project, 26,800 premises were connected and “Ready for Service” in Melaka (17,000) and Perak (9,800)
• Continuation of TNB’s electric vehicle roadmap with the arrival of two units of electric buses for the purpose of transportation of TNB staff around Klang Valley
• Value unlocking and digitalization of TNB’s real estate assets
• Enhancement of project and facility management systems
• HSBB rollout ongoing in Perak, and to commence in Kedah, Penang and Johor with target of passing 126,000 premises
• Pilot implementation of electric pickup truck and fully electric aerial platform for operational use

p.49
INTEGRATED ANNUAL REPORT 2020
CREATING CONTINUED VALUE
Manufactured Capital
2020 Highlights
EQUIVALENT UNPLANNED OUTAGE FACTOR (EUOF) Peninsular Malaysia Sabah International
EQUIVALENT AVAILABILITY FACTOR (EAF) Peninsular Malaysia Sabah International
SAIDI - PENINSULAR SAIDI - SABAH
SYSTEM MINUTES - PENINSULAR SYSTEM MINUTES - SABAH
100
90
80
70
60
50
40
30
20
10
0FY2018
89.92
73.28
80.69
FY2019
83.35 71.89
93.26
FY2020
87.39
71.29
94.48
14
12
10
8
6
4
2
0FY2018
3.24
10.17
2.88
FY2019
6.63
11.91
1.82
FY2020
7.29
14.36
5.50
50
40
30
20
10
0FY2018 FY2019 FY2020
48.22
48.13
44.95
0.250.300.350.40
0.200.150.100.05
0FY2018 FY2019 FY2020
0.35 0.27 0.08
4550
4035302520151050
FY2018 FY2019 FY2020
42.97 13.41
250
300
200
150
100
50
0FY2018 FY2019 FY2020
267.87 205.31
284.1511.28

p.50
TENAGA NASIONAL BERHAD
Natural Capital
Acknowledging the criticality of global issues such as pollution and climate change, we seek to minimise our environmental footprint while taking proactive steps to protect and preserve the country’s rich biodiversity.
Approach Activities & Achievements in 2020 Focus in 2021
Protect natural heritage through biodiversity-enhancing programmes
• ISO 14001:2015 certification of TNB’s plant optimisation and waste minimisation programmes
• Continued support of our earlier biodiversity preservation programmes at Hulu Terengganu Hydroelectric Station and Sungai Perak Hydroelectric Station (Temenggor Dam and Pergau Dam)
• Following the gazettement of Taman Perlindungan Ekosistem Sultan Ismail Petra (TPESIP) near Pergau Dam as a State Park in March, TNB has been developing a Management Plan and Action Plan for the park in collaboration with various state agencies
• Conducted various programmes to help enhance biodiversity around three hydroelectric stations: Hulu Terengganu, Sg Perak (Temenggor Dam) and Sg Perak (Pergau Dam)
For more information, please refer to the Sustainability Statement section
on page 148 of this IAR.
• Continuous biodiversity enhancement for Sg Perak hydroelectric station (Temengor Dam).
• New initiatives in line with development of Nenggiri hydroelectric station to minimise impacts from hydro dam development towards the surrounding environment.
• Habitat rehabilitation through various tree replanting activities especially at sites affected by TNB operations (example: post construction areas).
Protect the environment through proper effluents & waste management
• Reduced water usage by 3% in FY2020 to 7,065.3 megalitres • Established centralised TNB waste disposal management system For more information, please refer to the Sustainability Statement section
on page 148 of this IAR.
• Generated 32.2% less scheduled waste and recycled 352.2% more scheduled waste as a result of implementation of the centralised waste disposal management system
• Environmental KPIs will be adopted
Adoption of sustainable business practices across our value chain
• GHG emissions intensity is slightly higher compared to FY2019 at 0.57, however total GHG emissions mitigated increased 11.3% from 5.37 million tCO2e to 5.98 million tCO2e as a result of efforts to promote low-carbon generation, RE and EE solutions
• TNB generated 4,821GWh of clean energy in 2020• Reduced energy consumption at 12 TNB buildings by 4.3%, from
23.3 million kWh in 2019 to 22.3 million kWh
• Grow RE assets, domestically and internationally
• Expand Large Scale Solar (LSS) and solar PV rooftop installations to boost the solar manufacturing sector
• Contribute to development of electric vehicle charging infrastructure nationwide
• Strengthen R&D and innovation to roll out technologies that contribute to climate change mitigation & adaptation
• Set targets for GHG emissions Scopes 1 & 2
Contributing to a low-carbon world • Increased total RE generation capacity, including hydro, to 3,398.2MW (2019: 3,287.4MW)
• Enabled the connection of 3,288 distributed generation participants (through the Government’s NEM programme) onto the grid, with total capacity of 265.3MW
• Enabled the connection of small-scale renewables capacity (through the FIT programme) onto the grid, totalling 537MW
Continue to grow our RE generation capacity whilst increasing RE shares of our energy mix in line with our strategic plan

p.51
INTEGRATED ANNUAL REPORT 2020
CREATING CONTINUED VALUE
Natural Capital
5.98 million tCO2e of GHG emissions mitigated in 2020
Total Water Consumption Across All TNB Operations
10,000
8,000
6,000
4,000
2,000
0FY2018 FY2019 FY2020
7,065.3
8,047.9
7,269.3
Megalitres
TNB’s GHG Emissions*
* Total GHG emissions of Scopes 1 and 2.* The data for FY2018 & 2019 are updated using Global Warming Potential (GWP)
from Intergovernmental Panel on Climate Change (IPCC) 5th Assessment Report and respective year of Single Buyer emission factor data.
0.60 40
35
25
15
0.5830
0.56
20
0.54
100.52
5
0.50 0FY2018 FY2019 FY2020
0.57
0.56
0.57
39.2837.19
34.03
tCO2e/MWh million tCO2e
Total Emissions (tCO2e) Emission Intensity (tCO2e/MWh)
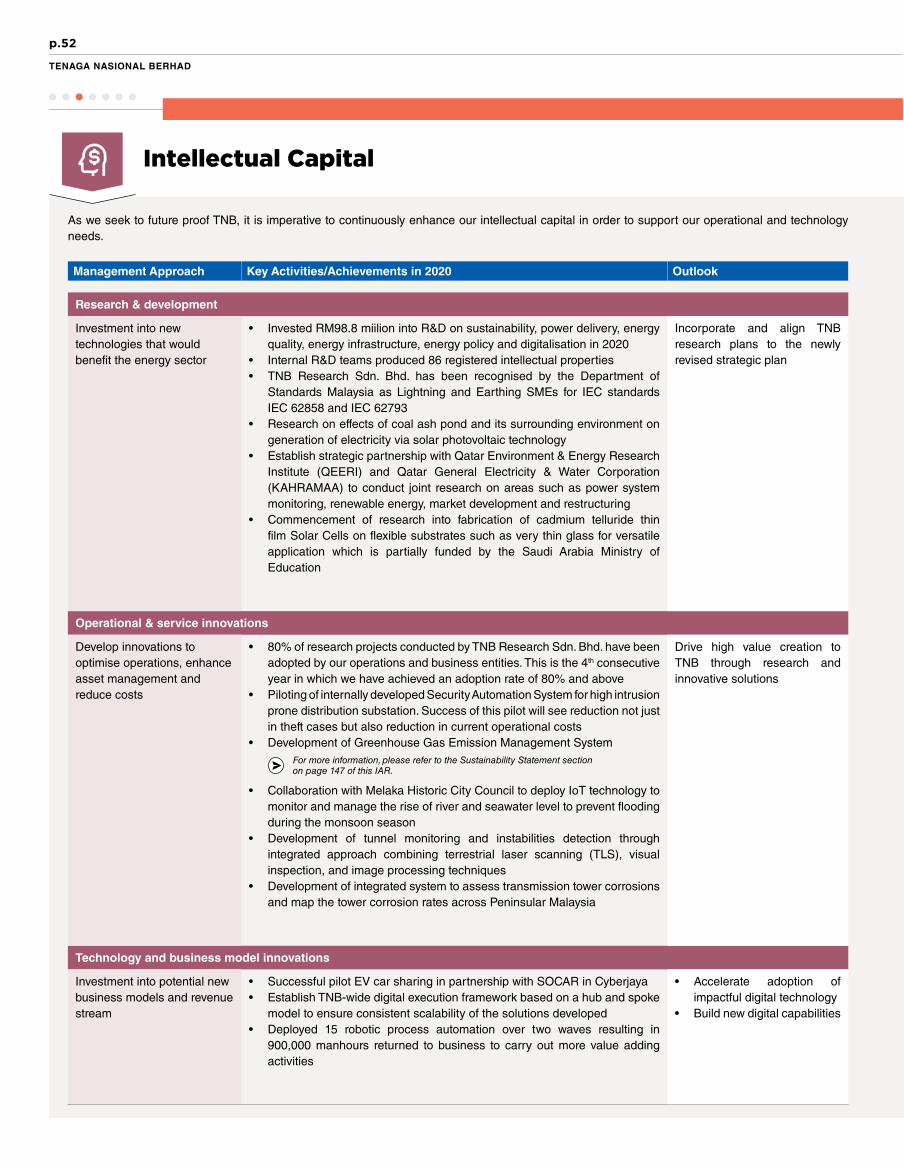
p.52
TENAGA NASIONAL BERHAD
As we seek to future proof TNB, it is imperative to continuously enhance our intellectual capital in order to support our operational and technology needs.
Management Approach Key Activities/Achievements in 2020 Outlook
Research & development
Investment into new technologies that would benefit the energy sector
• Invested RM98.8 miilion into R&D on sustainability, power delivery, energy quality, energy infrastructure, energy policy and digitalisation in 2020
• Internal R&D teams produced 86 registered intellectual properties• TNB Research Sdn. Bhd. has been recognised by the Department of
Standards Malaysia as Lightning and Earthing SMEs for IEC standards IEC 62858 and IEC 62793
• Research on effects of coal ash pond and its surrounding environment on generation of electricity via solar photovoltaic technology
• Establish strategic partnership with Qatar Environment & Energy Research Institute (QEERI) and Qatar General Electricity & Water Corporation (KAHRAMAA) to conduct joint research on areas such as power system monitoring, renewable energy, market development and restructuring
• Commencement of research into fabrication of cadmium telluride thin film Solar Cells on flexible substrates such as very thin glass for versatile application which is partially funded by the Saudi Arabia Ministry of Education
Incorporate and align TNB research plans to the newly revised strategic plan
Operational & service innovations
Develop innovations to optimise operations, enhance asset management and reduce costs
• 80% of research projects conducted by TNB Research Sdn. Bhd. have been adopted by our operations and business entities. This is the 4th consecutive year in which we have achieved an adoption rate of 80% and above
• Piloting of internally developed Security Automation System for high intrusion prone distribution substation. Success of this pilot will see reduction not just in theft cases but also reduction in current operational costs
• Development of Greenhouse Gas Emission Management System For more information, please refer to the Sustainability Statement section
on page 147 of this IAR.
• Collaboration with Melaka Historic City Council to deploy IoT technology to monitor and manage the rise of river and seawater level to prevent flooding during the monsoon season
• Development of tunnel monitoring and instabilities detection through integrated approach combining terrestrial laser scanning (TLS), visual inspection, and image processing techniques
• Development of integrated system to assess transmission tower corrosions and map the tower corrosion rates across Peninsular Malaysia
Drive high value creation to TNB through research and innovative solutions
Technology and business model innovations
Investment into potential new business models and revenue stream
• Successful pilot EV car sharing in partnership with SOCAR in Cyberjaya• Establish TNB-wide digital execution framework based on a hub and spoke
model to ensure consistent scalability of the solutions developed• Deployed 15 robotic process automation over two waves resulting in
900,000 manhours returned to business to carry out more value adding activities
• Accelerate adoption of impactful digital technology
• Build new digital capabilities
Intellectual Capital

p.53
INTEGRATED ANNUAL REPORT 2020
CREATING CONTINUED VALUE
Intellectual Capital
2020 Highlights
We are continuously elevating TNB’s business experiences by enabling multiple new digital initiatives, apart from supporting ~380 business applications.
R&D INVESTMENT (RM MILLION)
140
120
100
80
60
40
20
02015
72.9
2018
117.4
2016
105.7
2019
81.7
2017
117.4
2020
98.8
Generation
Retail
Corporate Divisions
Distribution (Network Services)
GridTNB Wide
Advanced Analytics
Machine Learning
Operating VisualizationDigital Twin
Predictive Asset Monitoring
Grid Project Management System
QR Code Asset TaggingSmart Glass
Asset Investment Planning Management System
Centralised Tripping Information System
Asset Performance Management System (APMS)
Asset Performance Management System (APMS)
Unmanned Aerial Solutions (UAS)
Unmanned Aerial Solutions (UAS)
Advanced Asset Analytics & Internet of Things (IoT)
Integrated Network Expansion Tool (INET)
Smart Meter Contractor Excellence Mobile App
Unified Workforce Management Solution
Analytics for Non-Technical Losses (NTL)
Recruitment Analytics
EnergySense Portal
Intelligent Business Process Management - D2T
Digital Bill Rendering
Stakeholder Management Analytics
myTNB
TNB Enterprise App
Cloud CRM
Integrated Security Management System
TNB Network of the Future (NoTF)
TNB myCloud
TNB Private & Public Cloud
Enterprise Content Management (ECM)
Cybersecurity
Unified Communication
API Management
TNB Data Lake
Business Process Mining Tool
Mobile for Security Asset Surveillance
P2P Reconciliations
Procurement Backbone & Analytics
eHSE WalletContact Center Tech
B2B & B2C Web Portal
Robotics Process Automation (RPA)
BREAKDOWN OF R&D PROJECTS BY RESEARCH AREA
Digitalisation
Energy infrastructure
Energy Policy
RE technology and sustainability
Energy Quality
13.21%
23.87%
16.52%
29.28%
17.12%

p.54
TENAGA NASIONAL BERHAD
Human Capital
Our people are our most valuable asset, and we seek to nurture a safe as well as empowering work environment that enables them to realise their full potential.
Management Approach Key Activities/Achievements in 2020 Outlook
Human Resource Management
Developed new 5-year HR Blueprint (2020-2025)
• Under the Blueprint, Group HR aspires to become a Trusted Strategic Business Driver in catalysing business growth and delivering HR excellence via the following Four Big Audacious Goals:- Create Value Driven HR- Build Organisation Synergy and Agility- Maximise Workforce ROI- Establish Purpose Driven Workforce
Deliberate action to foster collaboration across functions while maximising resource utilisation
Ensure strong governance framework to measure quality, timeliness, and output efficiency
Create a Reimagining Culture
• Input from 20 workshops conducted with 435 employees and company-wide survey attracting 5,036 respondents deliberated and taken into account before launching new TNB Corporate Identity comprising TNB Purpose, Aspiration, Core Values and Behaviours - 35 sessions were held to introduce more than 800 senior leaders to the
Reimagining Culture and guide them to serve as role models- Similar sessions were held with union representatives- Nine roadshows were conducted to share the new culture, reaching 4,859
employees
Culture and Change Management unit to complete the rolldown of TNB’s new identity and culture
An initiative to align the employee experience and policies with the identity is in the pipeline
Safe & Healthy Work Environment
Response to COVID-19 pandemic
On 14 March HR BCM-CRT was activated to enhance TNB’s pandemic preparedness. Initiatives undertaken include: daily crisis meetings (including weekends), escalation of information to GEC and cascading of strategic decisions to relevant parties
The BCM-CRT committee developed Standard Operating Procedures (SOPs), Work From Home circulars and established an ESHD App (Health Declaration), subsequently distributing Return to Work (RTW) kits to staff. They also shared COVID-19 updates & advisory to all staff
Strategic partnership with regulators
Establish working committee key stakeholder - DOSH and DOE. The objectives are: • To build smart partnerships and cooperation • To establish trust, demonstrate trustworthiness, respect stakeholder ideas and abilities• To understand the regulators expectations and treat regulators as customers• To develop and execute strategic engagement programme• To comply with act and regulations with respect to safety and environment
Achieve zero notice, compound and lawsuit issuance by key stakeholders and relevant authorities
Creation of Safety Culture
• Conducted a Safety Culture Assessment, and developed a Safety Culture Masterplan. The objective is to close safety gaps in order to achieve a Generative Safety Culture, defined as one where safety is ingrained in day-to-day operations and activities
• Developed HSE Reward & Recognition programme to motivate safe behaviours
Gauge the progress of safety culture transformation via Safety Culture Assessment
HSE Reward & Recognition promotes practice of safe behaviour towards achieving Generative Safety Culture
Employee health & wellness
Under our Total Wellness Programme, 16 webinars were held in collaboration with the Ministry of Health on topics such as healthy minds, exercising and nutrition while working from home
Talent Management & Development
Training & Development Developed more than 1,400 SMEs through the four technical academies: Generation Academy, Grid Academy, Distribution Network Academy and Retail Academy
Conducted numerous programmes to help reskill/retrain staff in light of changes happening within the industry
Develop 35 procurement SMEs in line with the Procurement Supply Chain 2.0 Transformation Programme
For more information, please refer to the Sustainability Statement section on page 139 of this IAR.
For more information, please refer to the Sustainability Statement section on page 155 of this IAR.
For more information, please refer to the Sustainability Statement section on pages 137 and 156 of this IAR.

p.55
INTEGRATED ANNUAL REPORT 2020
CREATING CONTINUED VALUE
Human Capital
EMPLOYEE BREAKDOWN BY EMPLOYEE CATEGORY Man Women
ANNUAL LTIF
EMPLOYEE BREAKDOWN BY GENERATION Man Women
EMPLOYEE ENGAGEMENT
2020 Highlights
2018 2019 2020
86%89% 89%
score has improved by 3% compared to 2018
20,000
16,000
12,000
8,000
4,000
0Non-
Executives
18,150
3,268 3,758 2,430266 70 14 1
Executives Management Senior Management
15,000
12,000
9,000
6,000
3,000
0Gen Z
1,251 244
14,471
3,764 5,217
1,590 1,249171
Millennials Gen X Baby Boomers
The data above represents annual LTIF for TNB core entities only and not the Group.
At TNB, we strive to establish a diverse and inclusive working environment that creates strong leaders, promotes high performance and develops skilled and adaptable talents.
2.5
2.0
1.5
1.0
0.5
0.02017
1.44
2018
2.08
2019
1.47
2020
1.29
LTIF by business activities
Generation – 0.75Grid – 1.05Distribution – 0.96Retail – 4.27

p.56
TENAGA NASIONAL BERHAD
Social and Relationship Capital
We value all our stakeholders and engage with them regularly to understand their needs as well as expectations of TNB in order to serve their interests in ways that are meaningful.
Management Approach Key Activities/Achievements in 2020 Outlook
Investors
Provide the investment community with transparent, clear and holistic picture of the Group’s performance and prospects through proactive engagements
Continuously create long-term value for shareholders
• Conducted quarterly analyst briefings and one on one/group engagements totaling 586 sessions with members of the investment community
Continue to proactively engage the investment community to address any areas of interests with regards to the Group’s performance and strategy moving forward
Trade Unions
Maintain harmonious relationship with unions and involve leaders in labs, syndications, meetings and field trips
10th Collective Agreements (CA10) between TNB and three Employee Unions (Persatuan Eksekutif TNB, Kesatuan Percantuman Pekerja-Pekerja TNB and Kesatuan Pegawai Perkhidmatan Sokongan TNB) were concluded and signed by both parties on 30 October 2020
There were fewer engagement sessions between Management and the Unions in 2020 following the COVID-19 outbreak. Nevertheless, Union concerns were solicited and addressed prior to the following management decisions:1. Finalisation of Tenaga Power Generation Sdn Bhd2. Design of Reimagining Culture outcomes and recommendations3. Design of our Procurement & Supply Chain transformation programme4. Finalisation of 7th Edition of Disciplinary Procedures5. Finalisation of Life Savings Rule policy6. The way forward on TNB new uniform design
Continue to maintain harmonious relationship between company and employees
Customers
Forge meaningful relationships via increased focus towards customer’s choice and literacy, quality customer service, innovative solutions and effective communication and engagement
• Successfully deployed 891,294 smart meters in Melaka and the Klang Valley • Conducted 16 EE awareness sessions targeting institutions of higher learning • In response to high electricity bills during the MCO, customer service officers
provided one-to-one explanations of the calculations and adjustments via TNB CareLine and TNB Kedai Tenaga
Vendors/Suppliers
We support local businesses as far as possible to spur the local economy
• 98.7% of net procurement spend RM7.06 billion was on local vendors• 38.0% increase in participation in Bumi vendor development programme• Upskilling Programme was specially designed and engineered by TNB to help our
contractors enhance their competencies and deliverables. Technical Qualification Cards (KKT) were given to those who completed training programmes, and made it mandatory for contractors to deploy KKT certificates on-site
Complete PSC 2.0 Transformation Programme
Community
Ensure Malaysians in rural and remote areas have access to electricity
Contribute to higher standard of living by ensuring Malaysians have proper homes to live in
Uplift marginalised communities through education
• Installed electricity in 18 locations nationwide with a total of 291 households under Rural Electrification Programme (BELB)
• Installed 20,634 lights in 6,397 kampung under the Village Street Lighting Project; and installed 157,723 LED lights under the Streetlight Replacement Programme
• Under the Better Bright Shelter Programme, RM687,000 was provided to enhance accommodation space for the families of patients at IJN, Serdang Hospital and Melaka Hospital who have come from outstation
• We built/upgraded 199 homes under the Home for the Needy Programme; and rewired 316 homes under the Home Rewiring Programme
• Assisted 1,735 students embarking on their tertiary education through our foundation Yayasan Tenaga Nasional
• Contributed RM6.4 million to eight schools under the Trust Schools Programme • Provided back-to-school sets worth RM1.36 million to underprivileged students • Assisted B40 students to take up STEM subjects at Malaysian universities through
TNB’s Dermasiswa My Brighter Future programme• Contributed total of more than RM2 million towards hockey development in the country
Continue to give hope and contribute to society at large

p.57
INTEGRATED ANNUAL REPORT 2020
CREATING CONTINUED VALUE
Social and Relationship Capital
2020 Highlights
Our Social Circle
TNB Twitter
24,546 followers
TNB CareLine Facebook
332,858 followers
TNB YouTube
58,500 followers
TNB LinkedIn
189,186 followers
YouTube Works Awards - Best Storytelling for Occasions
Twitter Best of Tweet 2020 at SEA Twitter Awards
TNB Instagram
followers

Creating ValueThrough Strong Governance
59Our Board at a Glance
60Board of Directors’ Profile
72Company Secretary’s Profile
73Organisational Structure
74Senior Management Profile
82Chairman’s Introduction to Corporate Governance
83Principle A: Board Leadership & Effectiveness
103Principle B: Effective Audit and Risk Management
111Principle C: Integrity in Corporate Reporting and Meaningful Relationship with Stakeholders
118Statement on Risk Management and Internal Control
123Additional Compliance Information

p.59
INTEGRATED ANNUAL REPORT 2020
CREATING VALUE THROUGH STRONG GOVERNANCE
Our Board At A Glance
Board Composition
Age Diversity
Board Tenure
Gender Diversity
6
3
1 1
Senior Independent Non-Executive Director
Non-IndependentNon-Executive Directors
(including Chairman)
IndependentNon-Executive
Directors
Non-IndependentExecutive Director
Male Female
Above 60 years old 50 - 60 years old Below 50 years old
4
6
1
Less than 1 year 1 to 3 years More than 3 years
7
4
5 5
1
Board Committees
Chairman of Respective Committee Board Nomination and Remuneration CommitteeNR
Board Audit CommitteeA Board Risk CommitteeR
Board Long Term Incentive Plan CommitteeLBoard Finance and Investment CommitteeF
Board Integrity CommitteeIBoard Tender CommitteeT
Note: The above information disclosed represents the number of Directors, excluding Alternate Director.
Skills And Experience Matrix
Finance & AccountingLegalEngineeringOthers
3
1
3
4

p.60
TENAGA NASIONAL BERHAD
DATO’ SERI MAHDZIR BIN KHALID
Chairman, Non-Independent Non-Executive Director*
*Appointed Director by the Ministerof Finance (Incorporated) (MoF Inc.),the Special Shareholder of TNB
NATIONALITY
Malaysian
GENDER
Male
AGE
60
Date of Appointment12 May 2020
Year(s) of DirectorshipLess than one (1) year
Date of Last Re-Election30 June 2020
Board Meeting Attendance in the Financial Year 8/9
Skills, Experience and Expertise:• Vice President of the United Malays National Organisation
(2018 - Present)• Member of the Malaysian Parliament for Padang Terap
(2013 - Present)• Minister of Education, Malaysia (2015 - 2018) • Deputy Minister of Energy, Green Technology and Water, Malaysia
(2013 - 2015)• Deputy Chairman of Tourism Promotion Malaysia, Ministry of
Tourism, Malaysia (2008 - 2013)• Chairman, Muda Agricultural Development Authority (MADA),
Kedah (2006 - 2013)• Chairman, Lembaga Kemajuan Wilayah Kedah (KEDA), Kedah
(2006 - 2009) • Menteri Besar of Kedah (2005 - 2008) • Political Secretary to Deputy Prime Minister of Malaysia, YAB Dato’
Seri Abdullah bin Haji Ahmad Badawi (2000 - 2004)• Director, Ministry of Land and Cooperative Development
(1998 - 2000)• Special Officer to Menteri Besar of Kedah, YB Dato' Seri Amar
Diraja Tan Sri Dato' Seri Osman bin Haji Aroff (1993 - 1996) • Principal of SMK Gadong, Beaufort, Sabah (1990 - 1993)• Education Officer (1984 - 1990)
Qualification(s):• Bachelor of Arts in Education (Hons.), University of Science, Malaysia
Membership of Board Committee(s):• Nil
Other Directorship(s):
Listed Issuer: • Nil
Public Company:• Yayasan Kemiskinan Darulaman
Board of Directors’ Profile
(since appointment date)

p.61
INTEGRATED ANNUAL REPORT 2020
CREATING VALUE THROUGH STRONG GOVERNANCE
Board of Directors’ Profile
DATUK IR. BAHARIN BIN DIN
President/Chief Executive Officer, Non-Independent Executive Director*
*Appointed Director by MoF Inc.,the Special Shareholder of TNB
NATIONALITY
Malaysian
GENDER
Male
AGE
57
Skills, Experience and Expertise:• President/Chief Executive Officer, TNB (2021 - Present)• Chief Distribution Network Officer, TNB (2018 - 2021)• Vice President (Distribution), TNB (2012 - 2018)• Senior General Manager (Customer Service & Metering),
Distribution Division, TNB (2011 - 2012)• Managing Director, Sabah Electricity Sdn. Bhd. (2007 - 2011)• Seconded to the Ministry of Energy, Green Technology and Water
(KeTTHA), for two and a half years, where he served as the Deputy Director for the Electrical Inspectorate Department in Sabah. He then became the Director for the Electrical Inspectorate Department in Pahang
• Built his career in TNB of which he had served in various engineering and managerial positions within the Company, including Business Development, Network Maintenance, Network Planning, Construction Services, Metering Service and Engineering Services
Qualification(s):• Master of Business Administration - joint MBA programme between
University Tenaga Nasional, Malaysia and Bond University, Australia• Bachelor of Science (Electrical Engineering), Syracuse University,
New York, United States of America • Certified Professional Engineer of Board of Engineers (BEM),
Malaysia• Member of Institution of Engineers, Malaysia• Qualified Competent Engineer (up to 33kV)• Qualified Service Engineer (up to 33kV)
Membership of Board Committee(s):• Attends Board Committees’ Meetings (By Invitation)
Other Directorship(s):
Listed Issuer: • Nil
Public Company:• Nil
Date of Appointment1 March 2021
Year(s) of DirectorshipLess than one (1) year
Board Meeting Attendance in the Financial Year NA

p.62
TENAGA NASIONAL BERHAD
DATO’ ASRI BIN HAMIDIN @ HAMIDON
Non-Independent Non-Executive Director*
*Appointed Director by MoF Inc., the Special Shareholder of TNB
NATIONALITY
Malaysian
GENDER
Male
AGE
55
Date of Appointment1 July 2020
Year(s) of DirectorshipLess than one (1) year
Skills, Experience and Expertise:• Secretary General of Treasury, Ministry of Finance (2020 - Present)• Deputy Secretary General (Policy), Ministry of Finance
(2019 - 2020)• Deputy Secretary General (Investment), Ministry of Finance
(2018 - 2019)• Under-Secretary, Government Investment Companies Division,
Ministry of Finance (2015 - 2018)• Deputy Secretary, Government Investment Companies Division,
Ministry of Finance (2012 - 2015)• Senior Assistant Secretary, Ministry of Finance (2006 - 2012)• Assistant Director, Anti-Corruption Agency (1998 - 2005)• Assistant Director, Economic Planning Unit, Prime Minister’s
Department (1994 - 1998)
Qualification(s):• Master of Economics, Hiroshima University, Japan• Bachelor of Economics (Hons.), University of Malaya, Malaysia• Diploma in Public Administration, National Institute of Public
Administration, Malaysia• Completed Harvard Premier Business Management Programme
Membership of Board Committee(s):
Other Directorship(s):
Listed Issuer: • Bina Darulaman Berhad
Public Companies:• Aset Tanah Nasional Berhad• DanaInfra Nasional Berhad • GovCo Holdings Berhad• Pelaburan Hartanah Berhad• 1Malaysia Development Berhad
NR LT
Board Meeting Attendance in the Financial Year
5/6 (since appointment date)
Board of Directors’ Profile

p.63
INTEGRATED ANNUAL REPORT 2020
CREATING VALUE THROUGH STRONG GOVERNANCE
AMRAN HAFIZ BIN AFFIFUDIN
Non-Independent Non-Executive Director*
*Appointed Director by Khazanah Nasional Berhad, the Major Shareholder of TNB
NATIONALITY
Malaysian
GENDER
Male
AGE
46
Date of Appointment22 June 2017
Year(s) of DirectorshipThree (3) years
Date of Last Re-Election30 June 2020
Board Meeting Attendance in the Financial Year
17/17
Skills, Experience and Expertise:• Executive Director, Head, Energy & Infrastructure, Khazanah
Nasional Berhad (2020 - Present)• Executive Director, Investments, Khazanah Nasional Berhad
(2018 - 2020)• Director, Investments, Khazanah Nasional Berhad (2013 - 2018)• Senior Vice President, Investments (Property/Healthcare),
Khazanah Nasional Berhad (2011 - 2013)• Investment Manager, Ethos Capital Sdn. Bhd. (2009 - 2011)• Principal Consultant/Advisor, Nusa Capital Sdn. Bhd. (2006 - 2009)• Director, Juwana Group of Companies (2005 - 2006)• Senior Vice President, Namirah Ventures Pte. Ltd. (2000 - 2005)• Analyst, Equities Investment, Petroliam Nasional Berhad
(PETRONAS) (1998 - 2000)• Corporate Finance Executive, Group Finance Division, PETRONAS
(1997 - 1998)
Qualification(s):• Bachelor of Science in Commerce (Majoring in Accounting and
Finance), the McIntire School of Commerce, University of Virginia, Charlottesville, United States of America
• Attended executive/professional courses at Harvard Business School and London Business School
Membership of Board Committee(s):
Other Directorship(s):
Listed Issuer: • Nil
Public Company:• Iskandar Investment Berhad
NR L IF T
Board of Directors’ Profile

p.64
TENAGA NASIONAL BERHAD
Board of Directors’ Profile
NORAINI BINTI CHE DAN
Senior Independent Non-Executive Director
NATIONALITY
Malaysian
GENDER
Female
AGE
64
Date of Appointment2 January 2016
Year(s) of DirectorshipFive (5) years
Date of Last Re-Election30 June 2020
Board Meeting Attendance in the Financial Year
Skills, Experience and Expertise:• Has over 30 years of experience in audit and finance• Served Pernas International Holdings Berhad for 15 years in various
capacities including as Group General Manager Finance and Chief Financial Officer
• Head of Finance and Vice President of Finance, MISC Berhad for a total of 10 years
• Former Director, Labuan Reinsurance (L) Ltd.• Senior Auditor in the firm of Hanafiah Raslan & Mohamad
Qualification(s):• Member of Malaysian Institute of Accountants • Member of Malaysian Institute of Certified Public Accountants • Bachelor of Arts (Economics) (Hons.), University of Manchester,
United Kingdom
Membership of Board Committee(s):
Other Directorship(s):
Listed Issuers: • S P Setia Berhad• BIMB Holdings Berhad
Public Company:• Bank Islam Malaysia Berhad
A NR R LF
16/17

p.65
INTEGRATED ANNUAL REPORT 2020
CREATING VALUE THROUGH STRONG GOVERNANCE
Board of Directors’ Profile
JUNIWATI RAHMAT HUSSIN
Independent Non-Executive Director
NATIONALITY
Malaysian
GENDER
Female
AGE
62
Date of Appointment1 June 2017
Year(s) of DirectorshipThree (3) years
Date of Last Re-Election14 May 2019
Board Meeting Attendance in the Financial Year 16/17
Skills, Experience and Expertise:• Member of Yayasan Peneraju Pendidikan Bumiputera Industry Advisory
Council (2021 - 2023)• Vice President & Venture Director, Pengerang Integrated Complex
and Chief Executive Officer, PETRONAS Refinery and Petrochemical Corporation Sdn. Bhd. (2013 - 2016)
• Vice President, Human Resource Management Division, PETRONAS (2010 - 2012)
• Vice President, Education Division, PETRONAS (2009 - 2010)• Chief Executive Officer, Malaysian Philharmonic Orchestra & Dewan
Filharmonik PETRONAS (2005 - 2009)• General Manager (Marketing & Trading-Chemicals), MITCO Sdn. Bhd.
(2003 - 2005)• Senior Manager (Marketing & Trading-Chemicals), MITCO Sdn. Bhd.
(2001 - 2003)• Manager, Human Resource Management, PETRONAS (1997 - 2001)• Manager, Petrochemicals Business Planning Unit, Petrochemical
Division and Manager, Business Evaluation Department, Corporate Planning Division, PETRONAS (1994 - 1997)
• Executive (Analyst), Refining & Marketing Planning Unit, PETRONAS (1991 - 1994)
• Executive (Refinery), PETRONAS Penapisan (Melaka) Sdn. Bhd. (1991)• Production Planner (Refinery), PETRONAS Penapisan (Terengganu)
Sdn. Bhd. (1988 - 1990)• Chemist, Process Engineering & Technical, PETRONAS Penapisan
(Terengganu) Sdn. Bhd. (1982 - 1987)• Chemist, Laboratory Services, PETRONAS (1981 - 1982)• Throughout her career, she has a wide range of hands-on experience in
Refinery Operations, Project Management, Corporate Planning, Human Resource and Marketing & Trading
Qualification(s):• Bachelor of Science (Hons.) in Chemistry, University of Kent, Canterbury,
United Kingdom• Certificate in International Management, GE• Attended the INSEAD Senior Management Development Programme
and Advanced Management Programme• Attended the HENLEY Business School Advanced Management
Programme, United Kingdom
Membership of Board Committee(s):
Other Directorship(s):
Listed Issuer: • Dialog Group Berhad
Public Company:• Nil
NR RL IT

p.66
TENAGA NASIONAL BERHAD
GOPALA KRISHNAN K.SUNDARAM
Independent Non-Executive Director
NATIONALITY
Malaysian
GENDER
Male
AGE
66
Date of Appointment4 July 2018
Year(s) of DirectorshipTwo (2) years
Date of Last Re-Election14 May 2019
Board Meeting Attendance in the Financial Year
Skills, Experience and Expertise:• Partner, Abdullah Chan & Co., Advocates & Solicitors (2012 -
Present)• Consultant, Asian Development Bank (2018 - 2021)• Leading adviser on the Financial Services Act 2013 and Islamic
Financial Services Act 2013• Independent International Consultant, World Bank (2017 - 2018)• Director, Kuwait Finance House (Malaysia) Berhad (2012 - 2016) • Held various positions in Bank Negara Malaysia (Central Bank of
Malaysia) (1982 - 2012):- Project Advisor (2011 - 2012)- Assistant Governor (2006 - 2011)- Assistant Manager/Deputy Director/Director, Legal Department
(1990 - 2006)- Senior Executive/Assistant Manager, Secretary’s Department
(1985 - 1990)- Senior Executive, Banking Department (1982 - 1985)
Qualification(s):• Bachelor in Law LL.B. (Hons.), University of Malaya, Malaysia• Advocate & Solicitor in the High Court of Malaya
Membership of Board Committee(s):
Other Directorship(s):
Listed Issuer: • Nil
Public Company:• Nil
A RI
17/17
Board of Directors’ Profile
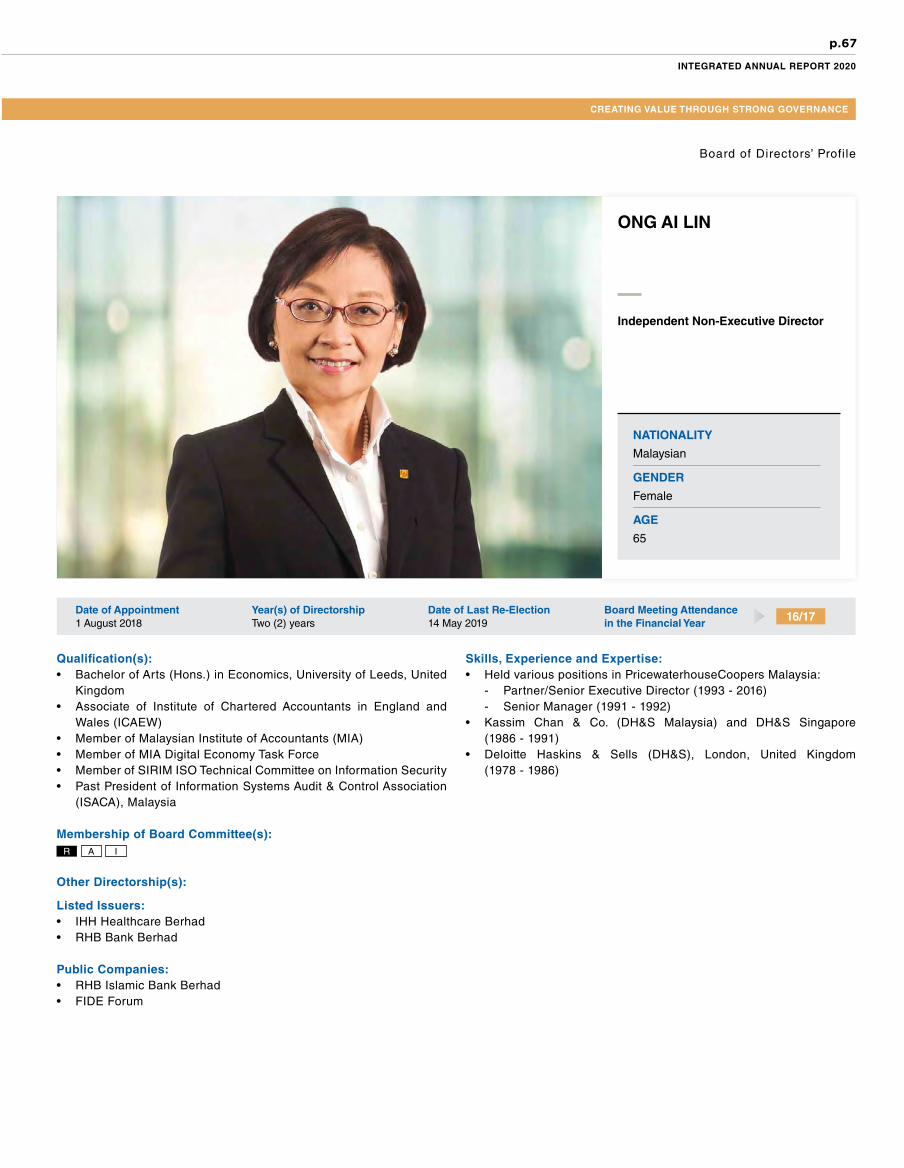
p.67
INTEGRATED ANNUAL REPORT 2020
CREATING VALUE THROUGH STRONG GOVERNANCE
ONG AI LIN
Independent Non-Executive Director
NATIONALITY
Malaysian
GENDER
Female
AGE
65
Date of Appointment1 August 2018
Year(s) of DirectorshipTwo (2) years
Date of Last Re-Election14 May 2019
Board Meeting Attendance in the Financial Year 16/17
Skills, Experience and Expertise:• Held various positions in PricewaterhouseCoopers Malaysia:
- Partner/Senior Executive Director (1993 - 2016)- Senior Manager (1991 - 1992)
• Kassim Chan & Co. (DH&S Malaysia) and DH&S Singapore (1986 - 1991)
• Deloitte Haskins & Sells (DH&S), London, United Kingdom (1978 - 1986)
Qualification(s):• Bachelor of Arts (Hons.) in Economics, University of Leeds, United
Kingdom• Associate of Institute of Chartered Accountants in England and
Wales (ICAEW)• Member of Malaysian Institute of Accountants (MIA)• Member of MIA Digital Economy Task Force• Member of SIRIM ISO Technical Committee on Information Security • Past President of Information Systems Audit & Control Association
(ISACA), Malaysia
Membership of Board Committee(s):
Other Directorship(s):
Listed Issuers: • IHH Healthcare Berhad• RHB Bank Berhad
Public Companies:• RHB Islamic Bank Berhad• FIDE Forum
A IR
Board of Directors’ Profile

p.68
TENAGA NASIONAL BERHAD
Board of Directors’ Profile
DATO’ ROSLINA BINTI ZAINAL
Independent Non-Executive Director
NATIONALITY
Malaysian
GENDER
Female
AGE
58
Date of Appointment(s)• 28 April 2020 (Redesignated as
Independent Non-Executive Director)• 15 March 2019 (Non-Independent
Non-Executive Director)
Year(s) of DirectorshipTwo (2) years
Date of Last Re-Election14 May 2019
Board Meeting Attendance in the Financial Year
Skills, Experience and Expertise:• Senior Fellow, Khazanah Research & Investment Strategy (KRIS)
Division, Khazanah Nasional Berhad (2018 - Present)• Independent Council Member of Oversight Panel, Energy
Commission Malaysia (2016 - Present) • Adjunct Professor, College of Business, Universiti Tenaga Nasional
(2016 - Present)• Vice President (Regulatory Economics & Planning), TNB (2015 -
2018)• Vice President (Planning), TNB (2009 - 2015) • General Manager (VPP/Energy Procurement), Planning Division,
TNB (2008 - 2009)• Had served Lembaga Letrik Negara/TNB for 33 years in various
divisions within TNB such as Distribution, Planning, Business Strategy, Regulations, Transmission and Corporate Planning
• Seconded to Economic Planning Unit of the Prime Minister’s Department (1990 - 1992)
Qualification(s):• Master of Business Administration, University of New England,
New South Wales, Australia• Bachelor of Electrical Engineering, Lakehead University, Canada
Membership of Board Committee(s):
Other Directorship(s):
Listed Issuer: • Nil
Public Company:• Nil
A F T
16/17

p.69
INTEGRATED ANNUAL REPORT 2020
CREATING VALUE THROUGH STRONG GOVERNANCE
Board of Directors’ Profile
Qualification(s):• Master of Engineering Management, Universiti Tenaga Nasional,
Malaysia• Bachelor of Engineering (Electrical), University of Technology,
Malaysia• Member of Institute of Engineers, Malaysia • Registered Professional Engineer with Board of Engineers, Malaysia
Membership of Board Committee(s):
Other Directorship(s):
Listed Issuer: • Nil
Public Company:• Nil
DATO’ IR. NAWAWI BIN AHMAD
Independent Non-Executive Director
NATIONALITY
Malaysian
GENDER
Male
AGE
59
Date of Appointment16 October 2020
Year(s) of DirectorshipLess than one (1) year
Skills, Experience and Expertise:• Chairman, Panorama Sdn. Bhd. [Subsidiary of Langkawi
Development Authority (LADA)] (2017 - 2018)• Chairman, Keretapi Tanah Melayu Berhad (KTMB), Multi Modal and
Freight Sdn. Bhd. (MMF) (Subsidiary of KTMB) and KTM Distribution Sdn. Bhd. (Subsidiary of KTMB) (2014 - 2018)
• Chairman, KTMB MMC Cargo Sdn. Bhd. (JV company of KTMB and MMC Corporation Berhad) (2016 - 2018)
• Director, LADA (2010 - 2018)• Chairman of Advisory Board, Kolej Komuniti Langkawi (2008 - 2018)• Member of Parliament (P.004 Langkawi) (2013 - 2018)• Member of State Assembly (N02 Kuah) (2004 - 2013)• Kedah State Executive Councillor (N02 Kuah) (Energy, Works,
Environment & Tourism) (2004 - 2008)• Senior Engineer, TNB (1984 - 2004)
NR LF
Board Meeting Attendance in the Financial Year 2/2 (since appointment date)

p.70
TENAGA NASIONAL BERHAD
Board of Directors’ Profile
DATUK RAWISANDRAN A/L NARAYANAN
Independent Non-Executive Director
NATIONALITY
Malaysian
GENDER
Male
AGE
57
Skills, Experience and Expertise:• Director (Business Development), C & S Engineering Management
Sdn. Bhd. (2010 - Present) • Secretary of Malaysian Indian Congress (MIC), Selangor (2016 - 2018) • Senator (2007 - 2010) • Member of Kajang Municipal Council (2003 - 2008)• Member of Sepang District Council (1997 - 2003)
Qualification(s):• Professional Diploma in Business Management, Asian Management
Development Academy PLT, Malaysia (Oxford Business College, United Kingdom)
• Diploma in Business Management, Asian Management Development Academy PLT, Malaysia (Oxford Business College, United Kingdom)
Membership of Board Committee(s):
Other Directorship(s):
Listed Issuer: • Nil
Public Company:• Nil
A R
Date of Appointment16 October 2020
Year(s) of DirectorshipLess than one (1) year
Board Meeting Attendance in the Financial Year 2/2 (since appointment date)

p.71
INTEGRATED ANNUAL REPORT 2020
CREATING VALUE THROUGH STRONG GOVERNANCE
Board of Directors’ Profile
Qualification(s):• Master of Science (Quality and Productivity Improvement), Universiti
Kebangsaan Malaysia, Malaysia • Bachelor of Decision Science (Hons.), Universiti Utara Malaysia,
Malaysia • Diploma in Public Administration, National Institute of Public
Administration, Malaysia
Membership of Board Committee(s):• Nil
Other Directorship(s):
Listed Issuer: • Nil
Public Company:• Northport (Malaysia) Bhd.
AZMIN BIN ISHAK*Alternate Director to Dato’ Asri bin Hamidin @ Hamidon
NATIONALITY
Malaysian
GENDER
Male
AGE
38
Date of Appointment1 July 2020
Year(s) of DirectorshipLess than one (1) year
Skills, Experience and Expertise:• Special Officer to Secretary General of Treasury, Ministry of Finance
(2020 - Present)• Principal Assistant Secretary, Government Investment Companies
Division, Ministry of Finance (2018 - 2020)• Assistant Secretary, Government Investment Companies Division,
Ministry of Finance (2016 - 2018)• Assistant Director, Social Services Section, Economic Planning
Unit, Prime Minister’s Department (2012 - 2014)• Assistant Director, Organisational Development Division, Public
Service Department (2008 - 2012)
Board Meeting Attendance in the Financial Year 1/1 (since appointment date)
Declaration by the Board:
(i) Family Relationship with any Director and/or Major Shareholder of TNB: None of the Directors has any family relationship with any Director and/or Major
Shareholder of TNB.
(ii) Conflict of interest with TNB: Save as disclosed above, none of the Directors has any conflict of interest with
TNB.
(iii) Conviction for offences within the past five (5) years and public sanction or penalty imposed by relevant regulatory bodies during the Financial Year under review:
Other than traffic offences, none of the Directors has been convicted for any offences within the past five (5) years nor has been imposed any public sanction or penalty by the relevant regulatory bodies during the Financial Year under review.
Non-Independent Non-Executive Director*

p.72
TENAGA NASIONAL BERHAD
NORAZNI BINTI MOHD ISA
Company Secretary
NATIONALITY
Malaysian
GENDER
Female
AGE
57
Date of Appointment31 May 2012
Skills, Experience and Expertise:• 31 years of vast experience within TNB where she has served in
various positions specifically in legal services, tender & contract management and regulatory management
• Deputy Company Secretary and Joint Company Secretary, TNB (2011 - 2012)
• Head of Tender Management Unit, Procurement Division, TNB (2006 - 2011)
• Manager of Licensing and Compliance Unit, Corporate Communications Department, TNB (2003 - 2006)
• Manager of Contract Management, Procurement Division, TNB (2002 - 2003)
• Legal Executive in Legal Services Department, Company Secretary’s Office, TNB (1990 - 2001)
Qualification(s):• Master of Laws, University of Malaya, Malaysia• Advanced Diploma in Law, MARA Institute of Technology (now
MARA University of Technology), Malaysia• Diploma in Law, MARA Institute of Technology (now MARA
University of Technology), Malaysia
Present Directorship(s):
Listed Issuer: • Nil
Public Company:• Nil
Company Secretary’s Profile

p.73
INTEGRATED ANNUAL REPORT 2020
CREATING VALUE THROUGH STRONG GOVERNANCE
Organisational Structure
PRESIDENT/CHIEF EXECUTIVE OFFICER
BoardCommittees
Core Business Non-Core Business
CompanySecretary
MANAGING DIRECTOR(TNB Power Generation Sdn. Bhd.)
CHIEF GRID OFFICER(Grid Division)
CHIEF RETAIL OFFICER(Retail Division)
CHIEF DISTRIBUTION NETWORK OFFICER(Distribution Network Division)
CHIEF FINANCIAL OFFICER(Group Finance Division)
CHIEF PEOPLE OFFICER(Group Human Resource Division)
CHIEF REGULATORY & STAKEHOLDER MANAGEMENT OFFICER
(Regulatory & Stakeholder Management Division)
CHIEF STRATEGY & VENTURES OFFICER(Strategy & Ventures Division)
CHIEF INFORMATION OFFICER(Information & Communication Technology
Division)
CHIEF CORPORATE SERVICES OFFICER(Corporate Services Division)
CHIEF PROCUREMENT OFFICER(Procurement & Supply Chain Division)
CHIEF INTERNATIONAL OFFICER(International Asset Group Division)
CHIEF SUBSIDIARY MANAGEMENT OFFICER
(Subsidiary Management Division)
CHIEF GLOBAL BUSINESS SOLUTIONS(TNB Global Business Solutions Division)
Single Buyer
Ring-fenced
Grid System OperatorHEAD (Legal Services)
Chief Integrity Development Officer
Chief Risk Officer
Chief Internal Auditor
BOARD OF DIRECTORS

p.74
TENAGA NASIONAL BERHAD
GMTC COMPEC BIC IBRC TMSC CRSCSESB EC R&DGEMC GPC
Date of Appointment:1 August 2018
Directorships In Public Companies and Listed Issuers:• Nil
Management Committee(s):
Qualification(s):• Certified Public Accountant of Malaysian Institute of Certified Public Accountants• Certified Public Accountant of Australian Society of Certified Practising
Accountants• Member of Malaysian Institute of Accountants• Bachelor of Commerce (Accounting), University of Wollongong, Australia
Working Experience:• Prior to joining TNB, Nazmi bin Othman served in various positions in other
companies such as Island & Peninsular Berhad and MRCB as the Financial Controller of Port Dickson Power Sdn. Bhd., an Independent Power Producer.
• In 1998, he joined TNB and served in various positions before becoming the Chief Investment Management Officer in 2014.
• He was appointed as Chief Financial Officer, Group Finance with effect from 1 August 2018. Some of his tasks include monitoring financial related activities, to advise the CEO and the Board of Directors on key financial decisions.
• He leads Group Finance as an active strategic financial partner in driving TNB’s business aspirations, and achieving Group’s objectives. Besides this, he also ensures continuous improvement and review on key financial areas such as finance policies & procedures, system efficiency & processes, strategic financial risks and staff competency.
COMPECGEMC GPC GMTC BIC IBRC TMSC CRSCSESB EC R&D
Senior Management Profile
DATUK IR. BAHARIN BIN DINPresident/Chief Executive Officer
NATIONALITY
Malaysian
GENDER
Male
AGE
57
Date of Appointment:1 March 2021
Directorships In Public Companies and Listed Issuers:• Nil
Management Committee(s):
Qualification(s):• Master of Business Administration – joint MBA programme between Universiti
Tenaga Nasional, Malaysia and Bond University, Australia• Bachelor of Science (Electrical Engineering), Syracuse University, New York,
United States of America• Certified Professional Engineer of the Board of Engineers (BEM), Malaysia• Member of Institution of Engineers, Malaysia• Qualified Competent Engineer (Up to 33kV)• Qualified Service Engineer (Up to 33kV)
Working Experience:• Datuk Ir. Baharin bin Din built his career in TNB serving in various engineering
and managerial positions within the Company, including Business Development, Network Maintenance, Network Planning, Construction Services, Metering Service and Engineering Services.
• He was seconded to the Ministry of Energy, Green Technology and Water (KeTTHA), for two (2) and a half years, where he served as the Deputy Director for the Electrical Inspectorate Department in Sabah. He then became the Director for the Electrical Inspectorate Department in Pahang.
• He was the Managing Director of Sabah Electricity Sdn. Bhd. from 2007 to 2011, and was promoted to Senior General Manager (Customer Service & Metering) of TNB in December 2011.
• Datuk Ir. Baharin was made Vice President, Distribution, in January 2012 until July 2018, and was re-designated as Chief Distribution Network Officer from 1 August 2018.
• He was appointed as President/Chief Executive Officer of TNB on 1 March 2021.
NAZMI BIN OTHMANChief Financial Officer
NATIONALITY
Malaysian
GENDER
Male
AGE
57

p.75
INTEGRATED ANNUAL REPORT 2020
CREATING VALUE THROUGH STRONG GOVERNANCE
GMTC COMPEC BIC TMSC CRSC R&DGEMC GPC
Date of Appointment:1 October 2020
Directorships In Public Companies and Listed Issuers:• TNB Global Ventures Capital Berhad
Management Committee(s):
Qualification(s):• Master of Engineering Management, Universiti Tenaga Nasional, Malaysia• Bachelor of Engineering (Mechanical), University of Strathclyde, Glasgow,
Scotland, United Kingdom• Diploma in Mechanical Engineering, University of Technology, Malaysia
Working Experience:• Dato’ Nor Azman bin Mufti has served for more than 35 years in TNB, holding
various positions in Generation Division portfolios namely Managing Director of TNB REMACO Sdn. Bhd. and Vice President of Energy Ventures Division.
• Prior to the current appointment, he was the Chief Power Generation Officer of Power Generation Division, TNB.
• As the Managing Director of TNB Power Generation Sdn. Bhd., he is responsible to lead and drive GenCo towards new growth, increased efficiencies, business synergies and greater business development.
GEMC GPC
Senior Management Profile
DATO’ NOR AZMAN BIN MUFTIManaging Director, TNB Power Generation Sdn. Bhd.
NATIONALITY
Malaysian
GENDER
Male
AGE
60
DATUK IR. HUSAINI BIN HUSINChief Grid Officer
NATIONALITY
Malaysian
GENDER
Male
AGE
59
Date of Appointment:1 February 2019
Directorships In Public Companies and Listed Issuers:• Nil
Management Committee(s):
Qualification(s):• Master of Business Administration, Ohio University, United States of America• Bachelor of Engineering and Applied Science (Electrical Engineering), Sussex
University, United Kingdom• Diploma in Electrical Engineering, Brighton Technical College, United Kingdom
Working Experience:• Datuk Ir. Husaini bin Husin has served for more than 32 years in TNB, holding
various positions in Transmission Division, now known as Grid Division.• As the Chief Grid Officer of Grid Division, he is responsible for the overall
performance of TNB’s transmission business, which focuses on transporting electricity, managing the division’s assets as well as operating and maintaining transmission network.
GMTC BIC TMSCIBR CRSC R&D
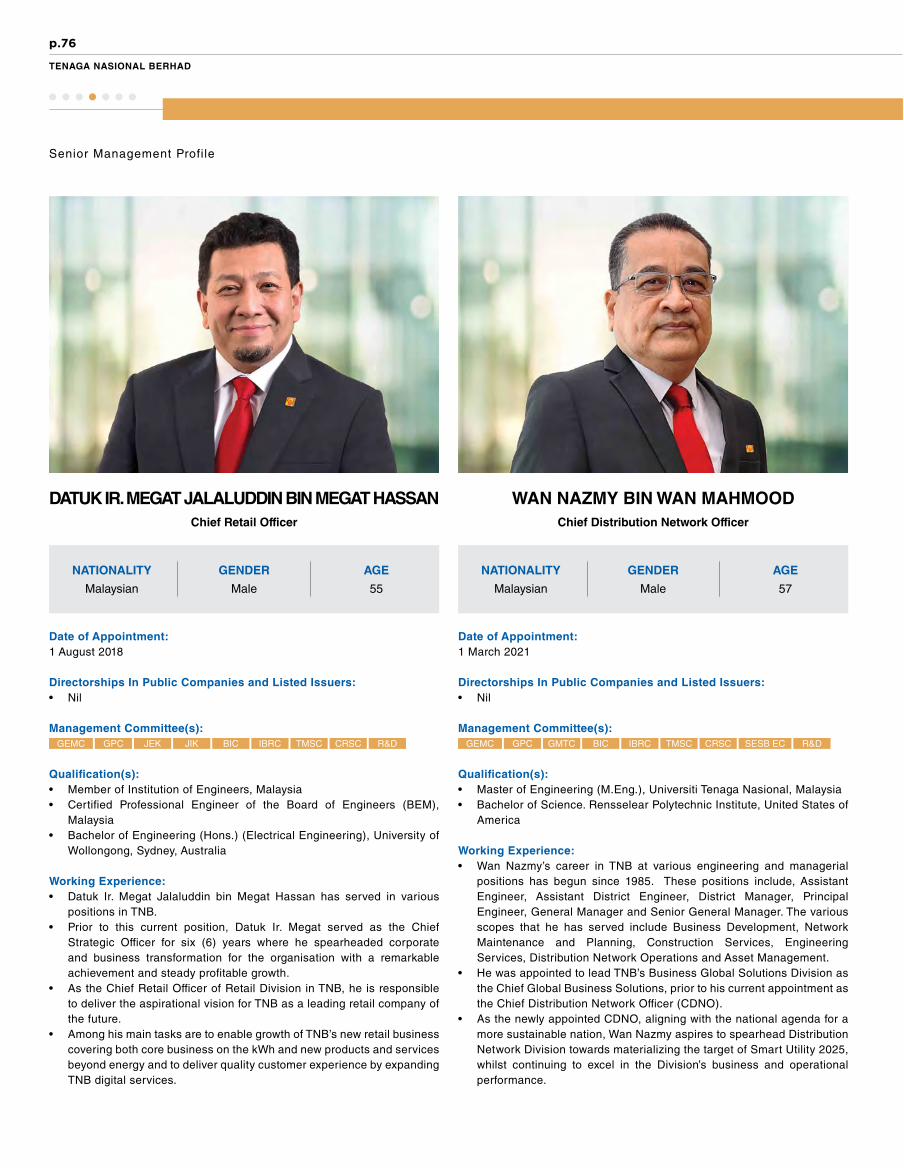
p.76
TENAGA NASIONAL BERHAD
JEK JIK BIC IBRC TMSC CRSC R&D SESB EC R&D
DATUK IR. MEGAT JALALUDDIN BIN MEGAT HASSANChief Retail Officer
NATIONALITY
Malaysian
GENDER
Male
AGE
55
Date of Appointment:1 August 2018
Directorships In Public Companies and Listed Issuers:• Nil
Management Committee(s):
Qualification(s):• Member of Institution of Engineers, Malaysia• Certified Professional Engineer of the Board of Engineers (BEM),
Malaysia• Bachelor of Engineering (Hons.) (Electrical Engineering), University of
Wollongong, Sydney, Australia
Working Experience:• Datuk Ir. Megat Jalaluddin bin Megat Hassan has served in various
positions in TNB.• Prior to this current position, Datuk Ir. Megat served as the Chief
Strategic Officer for six (6) years where he spearheaded corporate and business transformation for the organisation with a remarkable achievement and steady profitable growth.
• As the Chief Retail Officer of Retail Division in TNB, he is responsible to deliver the aspirational vision for TNB as a leading retail company of the future.
• Among his main tasks are to enable growth of TNB’s new retail business covering both core business on the kWh and new products and services beyond energy and to deliver quality customer experience by expanding TNB digital services.
Senior Management Profile
WAN NAZMY BIN WAN MAHMOODChief Distribution Network Officer
NATIONALITY
Malaysian
GENDER
Male
AGE
57
Date of Appointment:1 March 2021
Directorships In Public Companies and Listed Issuers:• Nil
Management Committee(s):
Qualification(s):• Master of Engineering (M.Eng.), Universiti Tenaga Nasional, Malaysia• Bachelor of Science. Rensselear Polytechnic Institute, United States of
America
Working Experience:• Wan Nazmy’s career in TNB at various engineering and managerial
positions has begun since 1985. These positions include, Assistant Engineer, Assistant District Engineer, District Manager, Principal Engineer, General Manager and Senior General Manager. The various scopes that he has served include Business Development, Network Maintenance and Planning, Construction Services, Engineering Services, Distribution Network Operations and Asset Management.
• He was appointed to lead TNB’s Business Global Solutions Division as the Chief Global Business Solutions, prior to his current appointment as the Chief Distribution Network Officer (CDNO).
• As the newly appointed CDNO, aligning with the national agenda for a more sustainable nation, Wan Nazmy aspires to spearhead Distribution Network Division towards materializing the target of Smart Utility 2025, whilst continuing to excel in the Division’s business and operational performance.
GEMC GPC GMTC IBRC CRSCBIC TMSCGEMC GPC
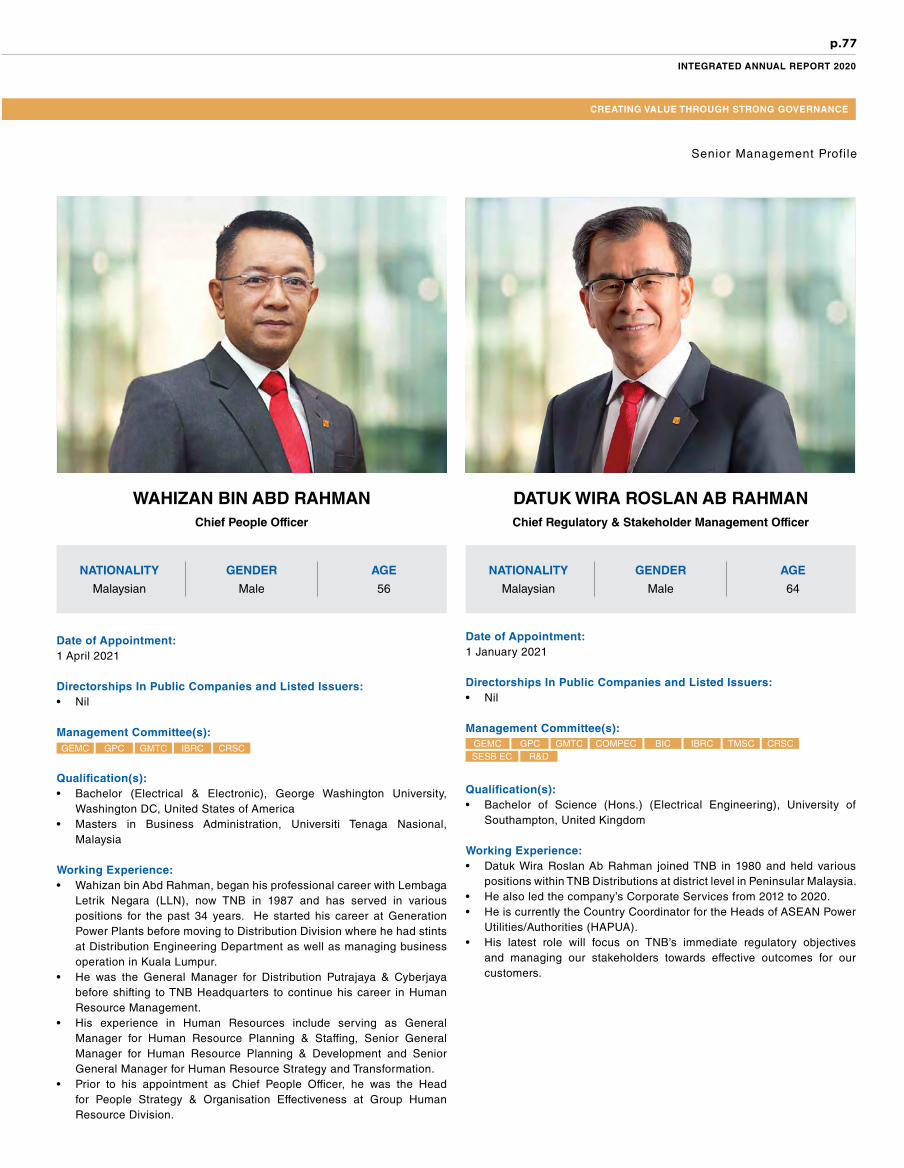
p.77
INTEGRATED ANNUAL REPORT 2020
CREATING VALUE THROUGH STRONG GOVERNANCE
Date of Appointment:1 January 2021
Directorships In Public Companies and Listed Issuers:• Nil
Management Committee(s):
Qualification(s):• Bachelor of Science (Hons.) (Electrical Engineering), University of
Southampton, United Kingdom
Working Experience:• Datuk Wira Roslan Ab Rahman joined TNB in 1980 and held various
positions within TNB Distributions at district level in Peninsular Malaysia.• He also led the company’s Corporate Services from 2012 to 2020.• He is currently the Country Coordinator for the Heads of ASEAN Power
Utilities/Authorities (HAPUA).• His latest role will focus on TNB’s immediate regulatory objectives
and managing our stakeholders towards effective outcomes for our customers.
Senior Management Profile
WAHIZAN BIN ABD RAHMANChief People Officer
NATIONALITY
Malaysian
GENDER
Male
AGE
56
Date of Appointment:1 April 2021
Directorships In Public Companies and Listed Issuers:• Nil
Management Committee(s):
Qualification(s):• Bachelor (Electrical & Electronic), George Washington University,
Washington DC, United States of America• Masters in Business Administration, Universiti Tenaga Nasional,
Malaysia
Working Experience:• Wahizan bin Abd Rahman, began his professional career with Lembaga
Letrik Negara (LLN), now TNB in 1987 and has served in various positions for the past 34 years. He started his career at Generation Power Plants before moving to Distribution Division where he had stints at Distribution Engineering Department as well as managing business operation in Kuala Lumpur.
• He was the General Manager for Distribution Putrajaya & Cyberjaya before shifting to TNB Headquarters to continue his career in Human Resource Management.
• His experience in Human Resources include serving as General Manager for Human Resource Planning & Staffing, Senior General Manager for Human Resource Planning & Development and Senior General Manager for Human Resource Strategy and Transformation.
• Prior to his appointment as Chief People Officer, he was the Head for People Strategy & Organisation Effectiveness at Group Human Resource Division.
GEMC GPC GMTC IBRC CRSC GMTC COMPEC BIC IBRC TMSC CRSCSESB EC R&D
DATUK WIRA ROSLAN AB RAHMANChief Regulatory & Stakeholder Management Officer
NATIONALITY
Malaysian
GENDER
Male
AGE
64
GEMC GPC

p.78
TENAGA NASIONAL BERHAD
Date of Appointment:1 September 2015
Directorships In Public Companies and Listed Issuers:• Nil
Management Committee(s):
Qualification(s):• Master of Business Administration, MBA Ohio University, Athens, United States of
America• Bachelor of Science – BSc. Australian National University, Canberra, Australia,
(Operations Management & Computer Science)
Working Experience:• Datuk Fazil bin Ibrahim started his career with LLN/TNB in 1985, in various roles
within the Group, including Corporate Services, Distribution and Human Resource before being promoted to Head of Corporate Systems & Application Support, ICT Division in 2006.
• He held the position of Senior General Manager for ICT Division from 2012 to August 2015 and subsequently was appointed as Chief Information Officer with effect from 1 September 2015.
• He is responsible for TNB group-wide business information systems & cyber security, technology & digital strategy, delivery of telecommunication & IT infrastructure, major enterprise solutions and other applications.
• He also oversees business continuity planning, coordinating & monitoring of ICT & Digital initiatives within ICT Division, group-wide and with external parties.
GMTC BIC CRSC
Date of Appointment:1 January 2021
Directorships In Public Companies and Listed Issuers:• TNB Global Ventures Capital Berhad
Management Committee(s):
Qualification(s):• Fellow of Association of Chartered Certified Accountants, United Kingdom• Member of Malaysian Institute of Accountants
Working Experience:• Prior to joining TNB, Datuk Fazlur Rahman bin Zainuddin has served in various
positions in other companies such as PricewaterhouseCoopers Malaysia, Shell Malaysia, Telekom Malaysia Berhad and Naza Group.
• He was appointed TNB’s Chief Financial Officer/Vice President, Group Finance in July 2012 and subsequently was re-assigned as Chief Strategy & Regulatory Officer from 1 August 2018.
• From 1 January 2021, he holds the position of Chief Strategy and Ventures Officer. In this current role, he leads the development and implementation of the long-term strategy plan for TNB, incorporating the energy transition trends and the Environmental, Social and Corporate Governance (ESG) agenda. His responsibility also includes searching for, identifying and evaluating new business areas to venture, exploring innovation, and guiding TNB Research Sdn. Bhd., a subsidiary of TNB, to research fields relevant to TNB business.
DATUK FAZIL BIN IBRAHIM Chief Information Officer
NATIONALITY
Malaysian
GENDER
Male
AGE
58
Senior Management Profile
DATUK FAZLUR RAHMAN BIN ZAINUDDIN Chief Strategy & Ventures Officer
NATIONALITY
Malaysian
GENDER
Male
AGE
51
R&DGMTC COMPEC
SESB ECBIC IBRC TMSC CRSCGEMC GPC GEMC GPC
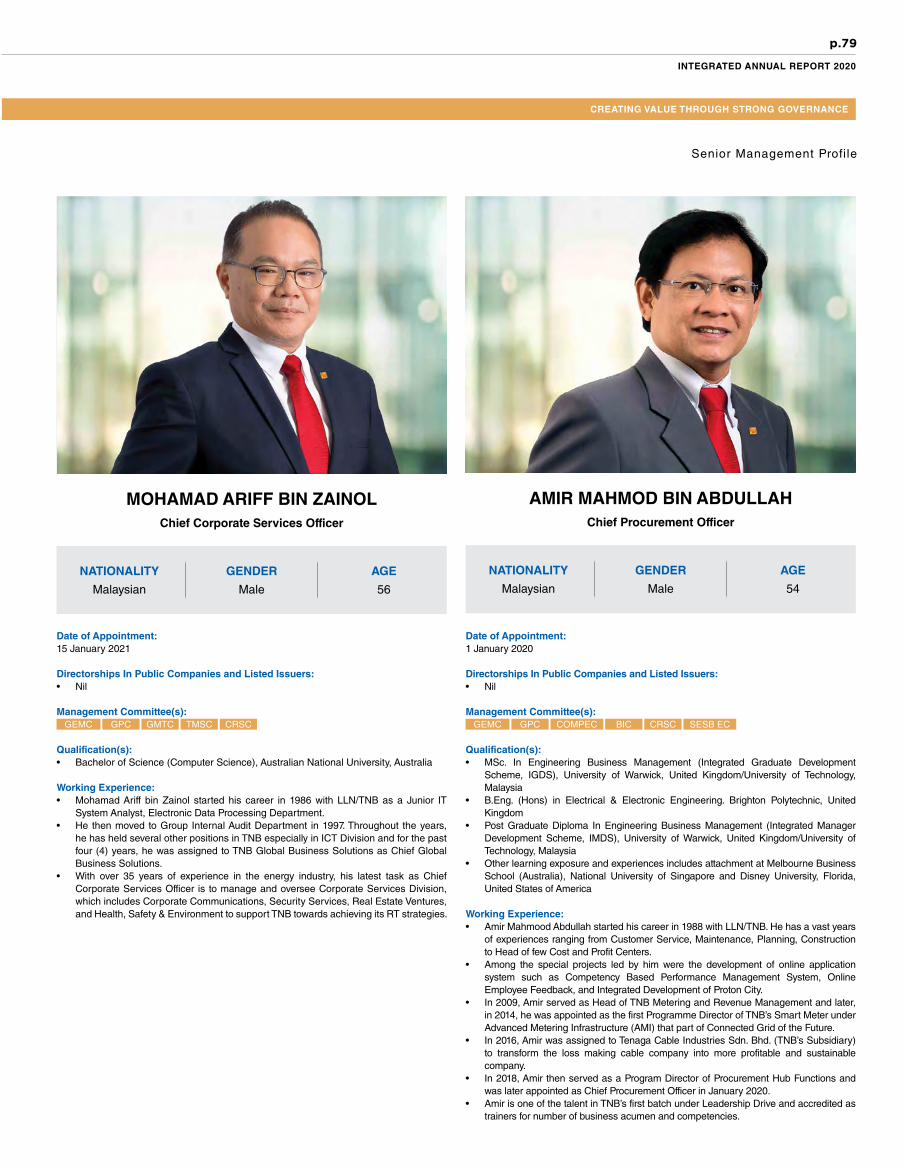
p.79
INTEGRATED ANNUAL REPORT 2020
CREATING VALUE THROUGH STRONG GOVERNANCE
Senior Management Profile
AMIR MAHMOD BIN ABDULLAH Chief Procurement Officer
NATIONALITY
Malaysian
GENDER
Male
AGE
54
Date of Appointment:1 January 2020
Directorships In Public Companies and Listed Issuers:• Nil
Management Committee(s):
Qualification(s):• MSc. In Engineering Business Management (Integrated Graduate Development
Scheme, IGDS), University of Warwick, United Kingdom/University of Technology, Malaysia
• B.Eng. (Hons) in Electrical & Electronic Engineering. Brighton Polytechnic, United Kingdom
• Post Graduate Diploma In Engineering Business Management (Integrated Manager Development Scheme, IMDS), University of Warwick, United Kingdom/University of Technology, Malaysia
• Other learning exposure and experiences includes attachment at Melbourne Business School (Australia), National University of Singapore and Disney University, Florida, United States of America
Working Experience:• Amir Mahmood Abdullah started his career in 1988 with LLN/TNB. He has a vast years
of experiences ranging from Customer Service, Maintenance, Planning, Construction to Head of few Cost and Profit Centers.
• Among the special projects led by him were the development of online application system such as Competency Based Performance Management System, Online Employee Feedback, and Integrated Development of Proton City.
• In 2009, Amir served as Head of TNB Metering and Revenue Management and later, in 2014, he was appointed as the first Programme Director of TNB’s Smart Meter under Advanced Metering Infrastructure (AMI) that part of Connected Grid of the Future.
• In 2016, Amir was assigned to Tenaga Cable Industries Sdn. Bhd. (TNB’s Subsidiary) to transform the loss making cable company into more profitable and sustainable company.
• In 2018, Amir then served as a Program Director of Procurement Hub Functions and was later appointed as Chief Procurement Officer in January 2020.
• Amir is one of the talent in TNB’s first batch under Leadership Drive and accredited as trainers for number of business acumen and competencies.
COMPEC SESB ECBIC CRSC
MOHAMAD ARIFF BIN ZAINOLChief Corporate Services Officer
NATIONALITY
Malaysian
GENDER
Male
AGE
56
Date of Appointment:15 January 2021
Directorships In Public Companies and Listed Issuers:• Nil
Management Committee(s):
Qualification(s):• Bachelor of Science (Computer Science), Australian National University, Australia
Working Experience:• Mohamad Ariff bin Zainol started his career in 1986 with LLN/TNB as a Junior IT
System Analyst, Electronic Data Processing Department.• He then moved to Group Internal Audit Department in 1997. Throughout the years,
he has held several other positions in TNB especially in ICT Division and for the past four (4) years, he was assigned to TNB Global Business Solutions as Chief Global Business Solutions.
• With over 35 years of experience in the energy industry, his latest task as Chief Corporate Services Officer is to manage and oversee Corporate Services Division, which includes Corporate Communications, Security Services, Real Estate Ventures, and Health, Safety & Environment to support TNB towards achieving its RT strategies.
GMTC TMSC CRSCGEMC GPC GEMC GPC

p.80
TENAGA NASIONAL BERHAD
Date of Appointment:• 1 July 2020
Directorships In Public Companies and Listed Issuers:• Nil
Management Committee(s):
Qualification(s):• Certified Fraud Examiner (member # 616936), Non-member Association of
Certified Fraud Examiners• Master of Business Administration Stanford Graduate School of Business
California, USA• B.A. (Honors) in Engineering Science and Honors Economics, Presidential
Scholar, John Davis Scholar Dartmouth College New Hampshire, USA
Working Experience:• Prior to joining TNB, Lim Fu Yen was attached to Ekuiti Nasional Berhad
(Ekuinas) from April 2014 to July 2020.• He has an extensive experience in investment and business negotiations with
his last position as Senior Director (Investment) of Ekuinas.• He joined TNB on 1 July 2020 as the Chief Subsidiary Management Officer
(CSMO). As CSMO, he oversees for performance improvement of 12 TNB subsidiaries.
• These subsidiaries are divided into different sectors, Manufacturing & Services, Power and Telco & Connectivity Solutions (TeCS).
TMSC CRSC SESB ECGEMC GPCBIC CRSCGEMC GPC
Senior Management Profile
LIM FU YENChief Subsidiary Management Officer
NATIONALITY
Malaysian
GENDER
Male
AGE
42
MOHD SHAHAZWAN BIN MOHD HARRIS Chief International Officer
NATIONALITY
Malaysian
GENDER
Male
AGE
49
Date of Appointment:1 July 2019
Directorships In Public Companies and Listed Issuers:• Nil
Management Committee(s):
Qualification(s):• Sloan Fellow Master of Business Administration in Leadership and Innovation,
Massachusetts Institute of Technology, Cambridge MA, United States of America
• Master of Science (MSc) in Advanced Mechanical Engineering – Imperial College of Science, Technology and Medicine, London, United Kingdom
• Bachelor of Engineering (BEng) Degree in Mechanical Engineering – University of Warwick, Coventry, United Kingdom
Working Experience:• Shahazwan Harris has more than 20 years of experience in investments,
mergers and acquisitions, portfolio and asset management, corporate strategy and restructuring.
• He started his career at TNB for four (4) years, before joining PA Consulting Group Kuala Lumpur, Malaysia and Jakarta and then Boston Consulting Group, Kuala Lumpur.
• He then worked at Khazanah Nasional Berhad for 11 years (2005-2016), where he covered investments across Asia and Europe. After Khazanah, he assumed senior advisory roles at Bain & Co (KL/SEA) and Temasek International and remains on the advisory board of Stashaway.
• He held several board positions in companies such as UMW, Edgenta, Opus International (NZ) and Malaysia Airlines. He joined TNB from UEM Edgenta, where he held the position of Chief Strategy Officer.
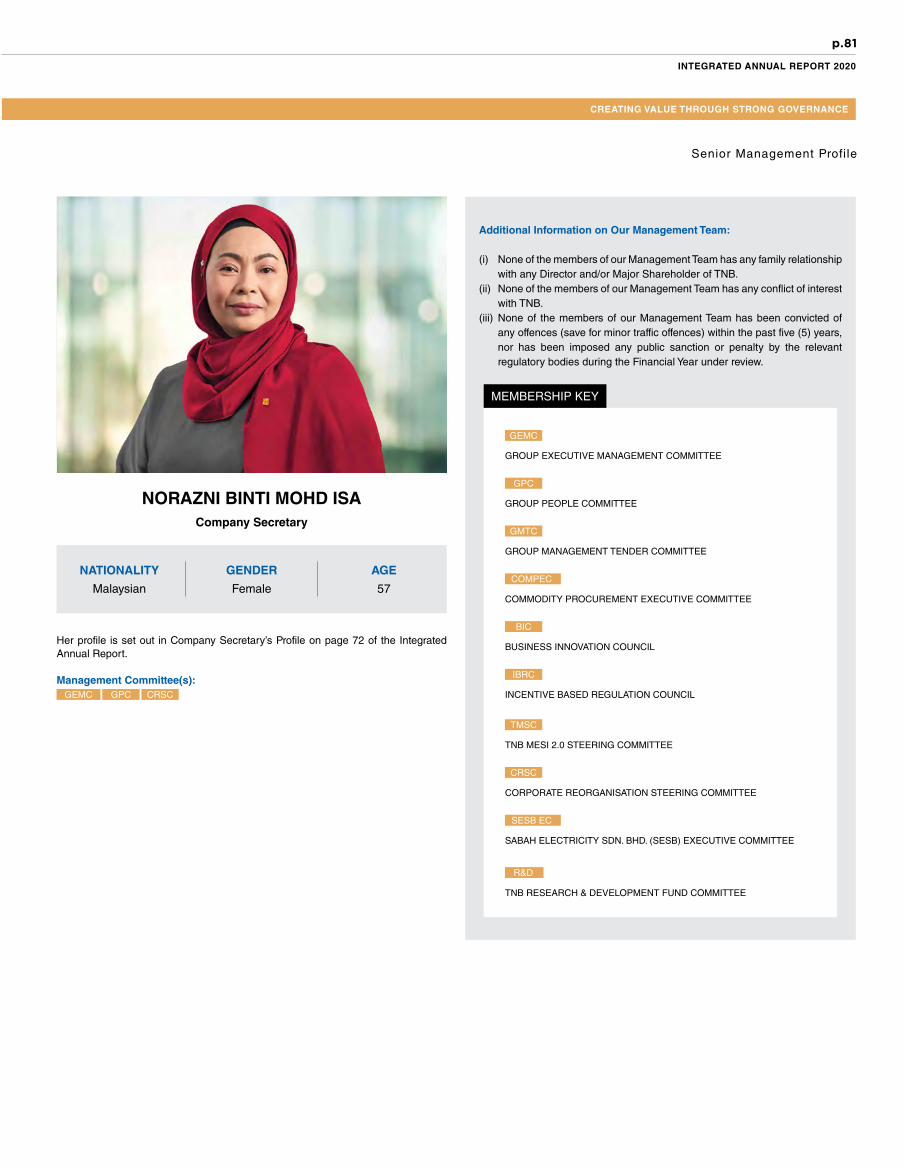
p.81
INTEGRATED ANNUAL REPORT 2020
CREATING VALUE THROUGH STRONG GOVERNANCE
CRSCGEMC GPC
Senior Management Profile
Additional Information on Our Management Team:
(i) None of the members of our Management Team has any family relationship with any Director and/or Major Shareholder of TNB.
(ii) None of the members of our Management Team has any conflict of interest with TNB.
(iii) None of the members of our Management Team has been convicted of any offences (save for minor traffic offences) within the past five (5) years, nor has been imposed any public sanction or penalty by the relevant regulatory bodies during the Financial Year under review.
MEMBERSHIP KEY
GEMC
GROUP EXECUTIVE MANAGEMENT COMMITTEE
GPC
GROUP PEOPLE COMMITTEE
GMTC
GROUP MANAGEMENT TENDER COMMITTEE
COMPEC
COMMODITY PROCUREMENT EXECUTIVE COMMITTEE
SESB EC
SABAH ELECTRICITY SDN. BHD. (SESB) EXECUTIVE COMMITTEE
R&D
TNB RESEARCH & DEVELOPMENT FUND COMMITTEE
BIC
BUSINESS INNOVATION COUNCIL
IBRC
INCENTIVE BASED REGULATION COUNCIL
TMSC
TNB MESI 2.0 STEERING COMMITTEE
CRSC
CORPORATE REORGANISATION STEERING COMMITTEE
NORAZNI BINTI MOHD ISA Company Secretary
NATIONALITY
Malaysian
GENDER
Female
AGE
57
Her profile is set out in Company Secretary’s Profile on page 72 of the Integrated Annual Report.
Management Committee(s):

p.82
TENAGA NASIONAL BERHAD
Strong Governance that Guides A Better, Brighter TomorrowChairman’s Introduction to Corporate Governance
NATIONAL ANNUAL CORPORATE REPORT AWARDS (NACRA) 2020
EXCELLENCE AWARDSCompanies With More Than RM10 Billion In Market Capitalisation
GOLD
34TH ANNUAL REPORTSCOMPETITION (ARC)INTERNATIONAL AWARDS
Non-Traditional Annual Report& Interior Design Categories:Electric Power Company
GOLD
Cover Photo & Design:Electric Power Company
SILVER
MSWG – ASEAN CORPORATE GOVERNANCE AWARDS 2019
INDUSTRY EXCELLENCE AWARD
UTILITIES
2019 ASEAN CORPORATE GOVERNANCE SCORECARD
ASEAN ASSET CLASS PUBLIC LISTED COMPANIES (MALAYSIA)
Dear Shareholders,
This Corporate Governance Overview Statement complements the Corporate Governance Report, which is available online on our website at www.tnb.com.my and further explains how the Board works in support of fulfilling the Group's purpose of coming together to brighten lives through innovative and sustainable solutions for a better tomorrow.
Our leadership role centres on maintaining and overseeing frameworks for strategy, stakeholder engagement, governance, risk management and culture. I hope this overview statement enables shareholders and other stakeholders to assess the effectiveness of these frameworks and the quality of their outcomes.
Listening to our Stakeholders
Engaging goes to the very core of our role; within the Boardroom, across each of our businesses and with shareholders and other stakeholders. COVID-19 has shown that this engagement and our corresponding responses to events must be dynamic. Since March of 2020, the priority of the Board has been TNB’s role in supporting the safe and reliable supply of electricity, while protecting employees and helping customers. Whilst the long-term impacts of the pandemic remain unknown, details of our considerations, approach and mitigations where required, are explained throughout this Report.
Around the Board table, oversight has been varied and broad-ranging, covering many of the strategic, financial and operational deliberations which are discussed in the previous pages, in addition to pertinent matters such as governance developments, our sustainability ambitions, assessing culture and managing risk. To support the related decisions we take, appropriate time has again been spent understanding our operating environment, shareholder and stakeholder views, and the complementary engagement that takes place across the Group.
Evaluating Effectiveness
There is always the ability to improve, and each year we take the Board evaluation as an important opportunity to reflect upon our own performance and agree on meaningful actions to drive positive change. As set out in our Board Nomination and Remuneration Committee Report on page 100, I believe that we continue to maintain a good Board culture of openness, constructive dialogue and inclusion.
The importance of fulfilling TNB’s core purpose is at the heart of the way in which the Board is composed, and the Directors’ individual and collective skills, knowledge and insights must support both this, and progress towards TNB’s aspiration of being a leading provider of sustainable energy solutions in Malaysia and internationally.
Our Board Committees
We continue to be supported by the work of our Committees whose full reports follow across pages 100 and 103 to 107. As noted, key recommendations from the Board Nomination and Remuneration Committee have centred on people, succession and the oversight of alignment between pay and performance. The Board Audit Committee continues to oversee matters relating to: the integrity of Financial Reporting; the relationship with the External Auditor; and the effectiveness of the internal audit function. The Board Risk Committee maintains its role in overseeing the effectiveness of the System of Internal Control and Risk Management. Our other Committees provide effective support to ensure the Board fulfils its full mandate.
A Better, Brighter Tomorrow
I write this at a time of considerable uncertainty as brought about by the COVID-19 pandemic. Ensuring TNB’s response to the challenges is appropriate and effective will be one of the key tasks for the Board in the coming months. I am confident however, that TNB has a corporate culture in and outside of the Boardroom that will result in the right decisions and actions to promote the success of the Group for the long term.
During the Financial Year under review, TNB was recognised with the following awards in demonstrating high standard of governance conduct throughout the Company:
Dato’ Seri Mahdzir bin KhalidChairman

p.83
INTEGRATED ANNUAL REPORT 2020
CREATING VALUE THROUGH STRONG GOVERNANCE
Principle A: Board Leadership & Effectiveness
The Board of Directors of Tenaga Nasional Berhad (TNB or the Company) presents this Corporate Governance Overview Statement that outlines our approach to corporate governance and principal governance practices. These practices are reviewed regularly and revised as appropriate to reflect changes in law and developments in corporate governance.
The Board believes high standards of corporate governance are essential to achieving TNB’s business objectives, which are aimed at creating value and sustainable outcomes for TNB’s shareholders, customers, stakeholders and the communities in which TNB operates.
This overview provides TNB’s application of the three (3) key corporate governance principles as set out in the Malaysian Code on Corporate Governance 2017 (MCCG) which are Principle A: Board Leadership & Effectiveness, Principle B: Effective Audit & Risk Management and Principle C: Integrity in Corporate Reporting and Meaningful Relationship with the Stakeholders.
Our Governance Model
SHAREHOLDERS
Board AuditCommittee
(BAC)
A
Board FinanceAnd Investment
Committee (FIC)
F
Board TenderCommittee
(BTC)
T
Board Nomination
And Remuneration
Committee (BNRC)
NR
Board Long Term
IncentivePlan Committee
(BLTIP)
L
Board IntegrityCommittee
(BIC)
I
Board RiskCommittee
(BRC)
R
AUDIT AND FINANCIAL
GOVERNANCEInternal Audit
External Audit
Financial ControlsSustainability
Integrity
Risk Management
Strategy
BOARD RESERVED AUTHORITIES
DELEGATED AUTHORITY TO MANAGEMENT
PRESIDENT/CHIEF EXECUTIVE OFFICER (President/CEO)
GROUP EXECUTIVE MANAGEMENT COMMITTEE (GEMC)
SDCSustainabilityDevelopmentCommittee
GPCGroupPeople
Committee
COMPECCommodity
ProcurementExecutive Committee
BICBusinessInnovation
Council
ICTGCInformation &
Communication Technology
(ICT) Governance
Council
ESCEnergySupply
Committee
ISCIntegritySteering
Committee
SMSCSmart Meter
SteeringCommittee
IECInvestment
Executive Committee
GMTCGroup ManagementTender Committee
TMSCTNB MESI 2.0 Steering
Committee
CRSCCorporate Reorganisation
Steering Committee
SESB ECSabah Electricity Sdn. Bhd. (SESB)
Executive Committee
IBRCIncentive Based Regulation
(IBR) Council
HSESCHealth, Safety & Environment
Steering Committee
R&DTNB Research &
Development Fund Committee
Temporary Committees
TNB BOARD
The Board of TNB has applied and adopted all practices/recommendations of MCCG except for Step-Up 7.3 on the disclosure of each Senior Management’s remuneration on a named basis. The Board is supported by our Governance Model, which is set out below. The Governance Model comprises the Board, its Committees and the Management Committees.
In line with the MCCG, the Board Charter clearly sets out among others, the roles and responsibilities of the Board, Board Committees, and Directors, which are published on our website at www.tnb.com.my. The Board delegates certain roles and responsibilities to its various Committees. The Committees assist the Board by fulfilling their roles and responsibilities, focusing on their specific activities, reporting to the Board on decisions and actions taken, and making any necessary recommendations to the Board in line with their Terms of Reference (TOR). The Board reviews the TOR of Board Committees, as and when required, which are also available on our corporate website. The Governance Model is also subject to periodic review to ensure that it continues to remain fit for purpose.

p.84
TENAGA NASIONAL BERHAD
BAC Meeting Hours 30.50 FIC Meeting Hours 13.17 BTC Meeting Hours 19.25
Principle A: Board Leadership & Effectiveness
Board Audit Committee (BAC)
To oversee the integrity of the financial statements in compliance with legal and regulatory requirements and applicable accounting standards.
To assess the effectiveness of the Group’s internal control framework as well as internal and external audit functions.
The BAC’s TOR is available on the Company’s website at www.tnb.com.my
To review, monitor and make recommendations to the Board for approval of the annual and supplementary budgets, capital budgets and investments of TNB.
To review and evaluate, as may be appropriate, information relating to the Company’s investable assets, its investment policies, strategies, objectives and activities.
To monitor and review investments in subsidiaries, and associated companies, to evaluate & consider and make appropriate recommendations on proposals for any new investments/divestments proposed by the Management.
To provide input on the valuation of the proposed investment/divestments taking into account compliance with the Investment Policy, risk management analysis, findings of the due diligence and written report from external advisers, as applicable.
To establish the framework of TNB’s Procurement & Supply Chain Policy and Procedures.
To advise the Board regarding the details and implementation of TNB’s Procurement & Supply Chain Policy and Procedures framework.
To assist the Board in regulating the compliance of Top Management and Executive Director with TNB’s Procurement & Supply Chain Policy and Procedures.
To ensure TNB complies with the applicable laws, regulations, rules and guidelines to achieve best business practices in its procurement of equipment, materials, works and services.
Board Finance And InvestmentCommittee (FIC)
Board Tender Committee (BTC)
ChairmanNoraini binti Che Dan Attendance 12/14 (86%)
MembersGopala Krishnan K.SundaramAttendance 14/14 (100%)
Ong Ai LinAttendance 13/14 (93%)
Dato’ Roslina binti ZainalAttendance 14/14 (100%)
Datuk Rawisandran a/l Narayanan7
Attendance 2/2* (100%)
Dato’ Cheok Lay Leng9
Attendance 8/8^ (100%)
ChairmanAmran Hafiz bin Affifudin4
Attendance 10/10 (100%)
MembersNoraini binti Che DanAttendance 9/10 (90%)
Dato’ Roslina binti ZainalAttendance 9/10 (90%)
Dato’ Ir. Nawawi bin Ahmad6
Attendance 2/2* (100%)
Tan Sri Ahmad Badri bin Mohd Zahir12
Attendance 2/2^ (100%)
Dato’ Cheok Lay Leng9
Attendance 5/5^ (100%)
ChairmanDato’ Asri bin Hamidin @ Hamidon3
Attendance 3/6* (50%)
MembersJuniwati Rahmat HussinAttendance 11/11 (100%)
Amran Hafiz bin Affifudin4
Attendance 7/7 (100%)
Dato’ Roslina binti ZainalAttendance 10/11 (91%)
Azmin bin IshakAttendance 3/3 (100%)
Tan Sri Ahmad Badri bin Mohd Zahir12
Attendance 2/2^ (100%)
Datin Rashidah binti Mohd Sies10
Attendance 2/2^ (100%)
Gee Siew Yoong11
Attendance 5/5^ (100%)
Key Roles and Responsibilities
Bo
ard
an
d B
oar
d C
om
mitt
ees
Mee
tin
g C
alen
dar
28 13 20
BOD BNRCBTCApril
17 17 17 17 41725 31
BOD FICBAC BNRC BLTIP BICMarch
328
1428
14 18 325 28
BOD BRC BTCBAC BNRCFeb
20 14 14 17 17
BOD BRC BTC FIC BNRCJan
1728
17 16 16 17 17 1322
BOD BAC BRC BTC BNRC BLTIP BICJuly
15 25925
916 23
919
BOD BAC BTC FIC BNRCJune
18 185 6 8818
818
BOD BAC BRC BTC FIC BNRC BLTIPMay
27 417 27
28
Aug
11 14 27
BOD BAC BRC BTC FIC BLTIP
Sept
10 14 17 17
BRC BTC FIC BNRC
15 6 13 15 14
Oct BOD BAC BTC FIC BNRC
Nov
25 25 10 12 12 9
BOD BAC BRC BTC FIC BIC
Dec
21 2 7 8 1416
BNRCBOD BAC BTC FIC
Board of Directors
Total Board Meetings Attended forFinancial Year 2020
Dato’ Seri Mahdzir bin Khalid1
8/9 89%
Dato’ Asri bin Hamidin @ Hamidon3
83%5/6
Datuk Seri Amir Hamzah bin Azizan2
100%17/17
Amran Hafiz bin Affifudin
100%17/17
Gopala Krishnan K.Sundaram
100%17/17
Noraini binti Che Dan
94%16/17
Juniwati Rahmat Hussin
94%16/17
Ong Ai Lin
94%16/17
Board Roles & Responsibilities
• Provides entrepreneurial leadership of the Company and direction for Management.• Has collective responsibility and accountability to shareholders for the long-term
success of the Group. • Reviews the performance of Management and the operating and financial performance
of the Group. • Sets strategy.• Determines risk appetite.• Ensures that appropriate risk management and internal control systems are in place.• Sets the Company’s culture, values and behaviours.• Ensures good governance.
• Leads the Board. • Ensures an effective Board, including
contribution and challenge from the Directors.
• Ensures that the Group maintains effective communication with its shareholders.
• Has day-to-day responsibility for running the Group’s operations.
• Recommends to the Board and implements Group strategy. • Applies Group policies. • Promotes TNB’s culture and standards. • Ensures the Directors are properly informed and that
sufficient information is provided to the Board to enable the Directors to form appropriate judgements.
President/CEOChairman
The roles of Chairman and President/CEO are held by two (2) separate individuals
Our Board Practices
Prior to each Board meeting, the Board shall receive reports from the Chairman of each Board Committee on their deliberations and recommendations of each Committee. This ensures that each Director is informed of the decisions made including views/comments raised. The Chairman of each Board Committee shall then table to the Board its report and present the Committee’s recommendations for the Board’s approval accordingly at each Board meeting. This permits the Board to raise any comments/views on all deliberations of the Committees.
All deliberations and recommendations must be minuted and approved by each Board Committee and confirmed by the Chairman of each Board Committee at their respective Board Committee meetings.

p.85
INTEGRATED ANNUAL REPORT 2020
CREATING VALUE THROUGH STRONG GOVERNANCE
Principle A: Board Leadership & Effectiveness
To identify and recommend new nominees to the Board, Board Committees and Boards of TNB Group.
To consider/review the Executive Director and Top Management’s succession planning.
To review Board’s required mix of skills, experience and other qualities, including core competencies which Non-Executive Directors should bring to the Board.
To implement the process formulated by the Board to assess the effectiveness of the Board, Board Committees, Self and Peer.
To determine and recommend to the Board the remuneration packages of Non-Executive Directors/Executive Directors/ Top Management. The BNRC’s TOR is available on the Company’s website at www.tnb.com.my
To oversee the establishment and implementation of the risk management framework that is embedded into the culture, processes and structures of the Group and is responsive to changes in the business environment.
To approve the Risk Management Framework and policies on behalf of the Board.
To ensure the principles and requirements of managing risk are consistently communicated and adopted throughout the Company.
To oversee the administration of TNB LTIP and the shares granted (LTIP Shares) subject to the By-Laws.
To approve and determine the manner in which the LTIP Shares are granted and subsequently vested to the selected employees in accordance with the By-Laws, including inter alia, the determination of eligibility, grant level, terms of acceptance of offers, terms of vesting of shares, performance conditions and any other terms and conditions imposed at the discretion of the BLTIP.
To manage disciplinary issues and actions with regard to employees’ misconduct, except for the hearing of appeal of executives of grade M15 and above or equivalent grade with regard to disciplinary cases, for which the power lies with the Board.
To review the disciplinary procedures, whenever applicable, subject to the Board’s approval.
Board Nomination And Remuneration Committee (BNRC)
Board Risk Committee (BRC) Board Long Term IncentivePlan Committee (BLTIP)
Board Integrity Committee (BIC)
ChairmanJuniwati Rahmat HussinAttendance 14/14 (100%)
MembersDato’ Asri bin Hamidin @ Hamidon3
Attendance 2/5* (40%)
Amran Hafiz bin AffifudinAttendance 14/14 (100%)
Noraini binti Che DanAttendance 14/14 (100%)
Dato’ Ir. Nawawi bin Ahmad 6Attendance 2/2* (100%)
Azmin bin Ishak Attendance 3/3 (100%)
Tan Sri Ahmad Badri bin Mohd Zahir12
Attendance 2/4^ (50%)
Datin Rashidah binti Mohd Sies10
Attendance 0/3^ (0%)
ChairmanOng Ai Lin5
Attendance 7/7 (100%)
MembersNoraini binti Che DanAttendance 5/7 (71%)
Juniwati Rahmat HussinAttendance 7/7 (100%)
Gopala Krishnan K.SundaramAttendance 7/7 (100%)
Datuk Rawisandran a/l Narayanan7
Attendance 1/1* (100%)
Gee Siew YoongAttendance 3/3^ (100%)
ChairmanJuniwati Rahmat HussinAttendance 4/4 (100%)
MembersDato’ Asri bin Hamidin @ Hamidon3
Attendance 1/2* (50%)
Amran Hafiz bin AffifudinAttendance 4/4 (100%)
Noraini binti Che DanAttendance 4/4 (100%)
Azmin bin IshakAttendance 1/1 (100%)
Dato’ Ir. Nawawi bin Ahmad6
(No meeting held since his appointment)
Datin Rashidah binti Mohd Sies10
Attendance 0/1^ (0%)
Tan Sri Ahmad Badri bin Mohd Zahir12
(No meeting held during his tenure/service)
ChairmanGopala Krishnan K.SundaramAttendance 4/4 (100%)
MembersJuniwati Rahmat HussinAttendance 4/4 (100%)
Ong Ai LinAttendance 4/4 (100%)
Amran Hafiz bin AffifudinAttendance 4/4 (100%)
BNRC Meeting Hours 19.17 BRC Meeting Hours 19.50 BLTIP Meeting Hours 2.25 BIC Meeting Hours 11.67
Notes:1 Appointed as Chairman w.e.f. 12 May 2020.2 Resigned w.e.f. 28 February 2021.3 Appointed as Director, Chairman of BTC and Member of BNRC & BLTIP w.e.f. 1 July 2020.4 Redesignated as Chairman of FIC and appointed as Member of BTC w.e.f. 12 May 2020 and 1 July 2020 respectively.5 Redesignated as Chairman of BRC w.e.f. 1 July 2020.6 Appointed as Director and Member of FIC, BNRC & BLTIP w.e.f. 16 October 2020.7 Appointed as Director and Member of BAC & BRC w.e.f. 16 October 2020.8 Appointed as Alternate Director to Dato’ Asri bin Hamidin @ Hamidon w.e.f. 1 July 2020.9 Appointed as Director and Member of BAC & FIC w.e.f. 2 March 2020 and 28 April 2020 respectively. Resigned as Director and ceased as Member of BAC & FIC w.e.f.
1 October 2020.10 Appointed as Director, Chairman of BTC and Member of BNRC & BLTIP w.e.f. 1 May 2020. Resigned as Director and ceased as Chairman of BTC and Member of BNRC
& BLTIP w.e.f. 1 July 2020.11 Cessation of office as Director, Chairman of BRC and Member of BTC w.e.f. 30 June 2020.12 Cessation of office as Chairman and Chairman of FIC w.e.f. 11 May 2020. Ceased as Chairman of BTC and Member of BNRC & BLTIP w.e.f. 12 March 2020.^ Reflects the number of meetings attended during the time the Director held office/was Member of Committee. * Reflects the number of meetings since his/her respective appointment to the Board/relevant Board Committee.
Total Hours ofBoard Meetings
36.50Overall Percentage of Board Meetings Attended By Directors
93%Total Hoursof Board & Board CommitteeMeetings
152All Directors have complied with the minimum attendance as stipulated in the MMLR, of which being present not less than 50% of the Board meetings held during the Financial Year.
• Provides a sounding board for the Chairman. • Acts, if necessary, as a focal point and
intermediary for the other Directors.• Ensures that any key issues not addressed
by the Chairman or the Executive Management are taken up.
• Is available to shareholders should they have concerns.
• If necessary, the SID can be emailed at [email protected]
Senior Independent Non-Executive Director (SID)
• Constructively challenge the Management in all areas.
• Scrutinise Management’s performance. • Help develop proposals on strategy. • Satisfy themselves on the integrity
of financial information and on the effectiveness of financial controls and risk management systems.
• Determine appropriate level of remuneration for Senior Management.
Non-Executive Directors
• Has day-to-day responsibility for the management of the finance function.
• Leads the Group’s finance activities, risks and controls.
• Represents TNB externally to stakeholders, shareholders, customers, suppliers, regulatory and Government authorities and the community.
Chief Financial Officer
• Advises the Board on corporate disclosures and compliance with Companies Act 2016, securities regulations and Main Market Listing Requirements of Bursa Malaysia Securities Berhad (MMLR).
• Together with the Chairman, keeps the effectiveness of the Company’s and the Board’s governance processes under review.
• Provides advice on corporate governance issues.
• Facilitates the orientation of new Directors and assists the Directors’ training and development.
Company Secretary
Each Board Committee is entitled to seek information from any employee of the Company and to obtain professional advice as the Board Committee deems appropriate in its discretion.
For this Financial Year under review, based on the Board’s annual evaluation of its Committees, the Board unanimously resolved that each Board Committee and its members has discharged its roles and responsibilities effectively as guided by its respective TOR.
Ad-hoc committees are also convened to consider matters of special importance or to exercise the delegated authority of the Board.
Tan Sri Ahmad Badri bin Mohd Zahir12
88%7/8
Datin Rashidah binti Mohd Sies10
50%2/4
Datuk Rawisandran a/l Narayanan7
100%2/2
Dato’ Ir. Nawawi bin Ahmad6
100%2/2
Azmin bin Ishak(Alternate Director to Dato’ Asri bin Hamidin @ Hamidon)8
100%1/1
Dato’ Roslina binti Zainal
94%16/17
Gee Siew Yoong11
100%11/11
Dato’ Cheok Lay Leng9
100%11/11

p.86
TENAGA NASIONAL BERHAD
Board Activities
Matters Deliberated By The Board And Its Committees During The Financial Year Ended 31 December 2020
The Board and its Committees engage in key strategic, governance and oversight activities each year. The list below is not exhaustive of all Key Areas of Focus/Matters Deliberated by the Board and its Committees throughout the Financial Year, but serves to provide stakeholders with an insight into some of the key matters considered by the Board:
BOARD
• Approval of Refreshed Reimagining TNB Aspiration, Strategic Focus & Way Forward
• Revenue & Capital Expenditure Budget FY2021 & Revised Revenue & Capital Expenditure Budget Financial Year 2020
• Status Approval/Update on TNB potential investments/projects
• Approval/Status Update/Issues Raised on Operational matters
• TNB Organisation Structure & Governance Platform• Quarterly Group Performance• Audited Financial Statements for Financial Year
2019• Quarterly Financial Results• Interim & Final Dividends• Quarterly Risk Dashboard Report• Quarterly Report on Non-Audit Services• Approval of Procurement within its Approving
Authority• TNB Divisions/Departments Risk Profiles &
Convergence Initiatives• Quarterly Report on TNB’s Litigation and Arbitration
Cases• Revision to TNB Limits of Authority• Risk Management & Insurance Update for Financial
Year 2020• Revised TNB Risk Management Framework• 2020 Annual Report Statements• Corporate Governance Report 2020• Appointment and Resignation of Chairman &
Directors• Board Skills Matrix• Board Evaluation Assessment (BEA) for Board of
Directors, Board Committees, Self & Peer• Proposed FY2021 Key Perfomance Indicators
(KPIs) for President/CEO• Business Continuity Management & Crisis
Response for COVID-19 pandemic• Update Progress/Approvals on Matters Related to
Proposed Internal Reorganisation
F
• International Asset Group 5 Years Strategy• Independent Assessment of TNB International Investment• International Asset Group Portfolio Targets & Performance Management
Framework• Potential Proposals of Local and International Investment, With Focus on
Renewable Energy and National Fiberisation & Connectivity Plan• International Asset Group Assessment & Stock Take of Current Investments/
Assets• Status Update & Strategy Refinement of TNB International Investment Portfolio• Reviewed/Evaluated Investments in Subsidiaries and Associated Companies
and Made Appropriate Proposals for any New Investments/Divestments• TNB International Investments’ Quarterly Performance• Quarterly Status Updates on TNB Equity Portfolio Performance• Approval of TNB Hurdle Rates for Local and International Investments
T
• Approval of Procurement within its Approving Authority• Procurement Plan and Strategy• Procurement Issues• Procurement Policies and Procedures• Revision of Procurement Relevant Approving Authority• COVID-19 Pandemic Impact on TNB Procurement & Measures Taken to Assist
Affected Suppliers/Manufacturers/Contractors
L
• Approval on Granting & Vesting of LTIP Shares
I
• Management of Disciplinary Cases• Quarterly Statistics of Disciplinary Cases• Relevant Trainings for Integrity Department Employees• Governing Body Review ISO 37001: Anti-Bribery Management System• Status Fraud/Bribery Risk Register• Semi Annual Reporting to Malaysian Anti-Corruption Commission• Execution of TNB Anti-Bribery Management System Implementation Kit
A NR R
• Summaries of the activities of BAC, BNRC and BRC are available in their respective reports of this Integrated Annual Report
Principle A: Board Leadership & Effectiveness

p.87
INTEGRATED ANNUAL REPORT 2020
CREATING VALUE THROUGH STRONG GOVERNANCE
Link to Strategy
• Grid of the Future
• Future Proof Regulations
• Future Generation Sources
• Winning the Customer
TNB is built on strong foundations and operates with a clear strategic framework comprising a balanced range of businesses in core markets and a commitment to efficient operations and disciplined investment. Some of the matters considered by the Board in relation to these strategic priorities are set out below:
Material Matters Reserved for the Board
Matters Considered by the Board
Formulating, reviewing and approving the Company’s strategic business plan
The Board plays a pivotal role in reviewing the Company’s strategic direction and approving corporate strategic initiatives developed by the Management. The Board deliberates annually the Company’s strategic and business plan as proposed by the Management, including the annual capital and revenue budget for the ensuing year as well as the KPIs. This will ensure that the KPIs correspond with the Company’s annual strategic and business plan. The Board reviews and deliberates on the Management’s views/assumptions in ensuring the best decisions are reached after considering all relevant aspects.
A separate and informal session between the Board and Top Management, known as the Board Breakout Session (BBO), is coordinated by the Company Secretary’s Office, as and when the need arises. The BBO is a platform for the Board and Management to deliberate and exchange views as well as opinions in formulating strategic plans/issues and to chart the direction of the Group, including the reporting of its progress.
During the Financial Year under review and this trying time, a few BBOs which had been arranged were cancelled. Nonetheless the Board and Management managed to hold a BBO session on 24 June 2020 to discuss on Reimagining TNB Strategic Refresh, in line with the Standard Operating Procedures issued by the Government. The BBO was held with the objectives to reflect on Reimagining TNB journey and how it has evolved, to share the portfolio view including the COVID-19 implications, its way forward and to seek guidance from the Board on the refreshed strategy and corporate identity.
The refresh exercise marked the start of TNB new strategic planning process whereby the strategy review will be undertaken annually and shared with the Board as well as to be tied to individual business plans for each business entity and support function, annual budgets, target setting and performance reviews.
With the COVID-19 pandemic, the refresh exercise also identified priority actions and game changers where TNB can both support the nation’s economic recovery while building new growth engines. In return, the Management gained constructive inputs/guidance from the Board on the way forward of the strategic plan process and challenges/impact of COVID-19 towards utility industry in Malaysia. More information on the Strategic Direction is available in Creating Continued Value on pages 34 to 57 of the Integrated Annual Report.
Half-year reviews of the business plan and the budget were conducted whereby comparisons of approved targets against the Company’s actual performance were made.
Following the shareholders’ approval of the Proposed Internal Reorganisation By Way of A Members’ Scheme of Arrangement Under Section 366 of The Companies Act, 2016 (Proposed Internal Reorganisation) at the Court Convened Meeting duly held on 11 February 2020, the transfers by TNB of its domestic power generation and electricity retail businesses to its two (2) wholly-owned subsidiaries, TNB Power Generation Sdn. Bhd. and TNB Retail Sdn. Bhd., were completed on 1 October 2020 and 1 January 2021 respectively. Accordingly, the scheme in relation to the Proposed Internal Reorganisation was also deemed completed on 1 January 2021. The development of the Proposed Internal Reorganisation was announced accordingly and these announcements are available on the Company’s website at www.tnb.com.my besides Bursa Malaysia’s website.
The Proposed Internal Reorganisation is expected to improve the efficiency, agility and performance of the business segments of TNB Group of Companies (TNB Group or Group) and promote ownership, entrepreneurship and innovation within the Group. The Proposed Internal Reorganisation is in line with TNB’s strategic transformation plan, Reimagining TNB, and is envisaged to improve TNB Group’s performance and returns to shareholders in the medium to long term.
Based on the evaluation for the Financial Year under review, the Board collectively concurred that it has reviewed the Company’s strategic and financial plan as well as monitored its implementation, including the setting of suitable KPIs in achieving the Company’s objectives.
Principle A: Board Leadership & Effectiveness

p.88
TENAGA NASIONAL BERHAD
The Board, assisted by BNRC, is responsible for developing plans to identify the necessary and desirable competencies and skills of Directors and succession plans to ensure there is appropriate dynamics of skills, experience, expertise and diversity on the Board. In addition, the Board/BNRC also oversee the appointment as well as succession planning of the Top Management.
During the Financial Year under review, there were several new additions to the Board, duly appointed by the BNRC/Board. With the departure of Tan Sri Ahmad Badri bin Mohd Zahir, Dato’ Seri Mahdzir bin Khalid was appointed as Chairman with effect from 12 May 2020, an Appointed Director of Minister of Finance (Incorporated) (MoF Inc.), the Special Shareholder of TNB.
Dato’ Asri bin Hamidin @ Hamidon was appointed a Non-Independent Non-Executive Director with effect from 1 July 2020, an Appointed Director of MoF Inc. His Alternate Director, Azmin bin Ishak was also appointed on 1 July 2020. Other recent appointments to the Board were Dato’ Ir. Nawawi bin Ahmad and Datuk Rawisandran a/l Narayanan, of whom were appointed as Independent Non-Executive Directors with effect from 16 October 2020.
Their mix of skills, experience, expertise and qualifications are analysed prior to their respective appointments.
The selection of candidates and appointment of Independent Non-Executive Directors by the Board/BNRC are made with the assistance of independent consultant, whenever necessary.
During the Financial Year under review, with the establishment of TNB Subsidiary Management Division as an enhancement of Investment Management Department which previously reports to Group Finance, Lim Fu Yen was appointed as Chief Subsidiary Management Officer with effect from 1 July 2020.
The Board is responsible for ensuring that a sound reporting framework of internal controls and regulatory compliance is in place throughout the Company. Based on the evaluation for the Financial Year under review, the Board collectively concurred that it has discharged its roles through the BRC/BAC whereby regular meetings were held in reviewing the effectiveness of the Company’s internal control system.
The President/CEO is responsible for managing the day-to-day operations of the Company and implementing the Group strategies and policies as agreed by the Board. In doing so, he is well supported by the respective Management Committees. The performance of Management is measured through the Company’s and Group’s quarterly financial performance. The Board, on a continuous basis, is
The Board, through BRC, is responsible for overseeing the effectiveness and adequacy of the Group’s risk management framework and to ensure that it forms part of the Group’s corporate culture. The BRC’s key responsibilities include approving the risk management framework and policies on behalf of the Board and deliberating the Group’s strategic and key operating risks as well as ensuring appropriate mitigations are implemented to manage these risks.
During the Financial Year under review, there were seven (7) BRC sittings. The BRC reviewed the Statement on Risk Management and Internal Control, which summarises the risk management practices and internal controls implemented by Management. It also deliberated on Key Risk Indicators that were developed in alignment with BRC’s and Management’s risk appetite.
Due to the COVID-19 pandemic, for the Financial Year under review, the Top Management Risk Forum was not held.
The BRC is assisted by the Chief Risk Officer and the Risk Management Department (RMD) in discharging its duties and responsibilities.
Principle A: Board Leadership & Effectiveness
Board Activities (Cont’d)
Material Matters Reserved for the Board
Matters Considered by the Board
Identifying and managing principal risks affecting the Company
Reviewing the adequacy and integrity of the Company’s internal control system
Overseeing and evaluating the conduct and performance of the Company’s businesses
Succession Planning

p.89
INTEGRATED ANNUAL REPORT 2020
CREATING VALUE THROUGH STRONG GOVERNANCE
Principle A: Board Leadership & Effectiveness
Iwan Azlan bin Mokhtar was appointed as Chief People Officer with effect from 1 November 2020, to lead the Human Resource Division following the retirement of Dato’ Muhammad Razif bin Abdul Rahman. The Board and BNRC, at their respective meetings on 17 March 2021 and 15 March 2021, approved the appointment of Wahizan bin Abd Rahman as Chief People Officer with effect from 1 April 2021, in place of Iwan Azlan bin Mokhtar following his resignation.
With the completion of Proposed Internal Reorganisation, Dato’ Nor Azman bin Mufti @ Jaafar was made Managing Director, TNB Power Generation Sdn. Bhd., while Ir. Roslan bin Abd Rahman was appointed as Chief Operating Officer, TNB Power Generation Sdn. Bhd. with effect from 1 October 2020.
Datuk Ir. Baharin bin Din was appointed by MoF Inc., the Special Shareholder of TNB, as President/CEO for a period of three (3) years with effect from 1 March 2021 until 29 February 2024 in place of Datuk Seri Amir Hamzah bin Azizan, who resigned following his acceptance of a new appointment by the Minister of Finance.
The Board/BNRC deliberated on the succession planning for critical positions in TNB, intended to surface and manage the development of TNB’s future leaders.
The Board is satisfied that BNRC has efficiently discharged its duties pertaining to the nomination, remuneration and succession management functions as set out in its TOR.
The BNRC annually evaluates the performance of the President/CEO and Top Management, whose remunerations are directly linked to their respective KPIs. The President/CEO’s remuneration package is reviewed by the BNRC to reflect the contributions made towards the Group’s achievements for the year. The BNRC’s views and recommendations on this are submitted to the Board for its decision/approval. Based on the evaluation for the Financial Year under review, the Board collectively concurred that succession planning for the President/CEO and Top Management as well as for the Company’s future leaders has been appropriately developed.
Details of the Company’s internal control system and its effectiveness are provided in the Statement on Risk Management and Internal Control in this Integrated Annual Report.
well informed of the progress of Company’s strategic initiatives and critical operational issues as well as the Group’s performance based on approved KPIs.
Link to Strategy
• Future Proof Regulations
• Future Generation Sources
• Grid of the Future
• Winning the Customer
• Future Proof Regulations
• Grid of the Future• Future Generation
Sources• Winning the
Customer
• Winning the Customer
The RMD is responsible for the effective implementation of TNB Risk Management Framework for informed decision-making. The framework is developed in alignment with ISO 31000:2018.
The BRC continues to diligently exercise its risk oversight responsibilities by ensuring that risk management is an integral part of strategic planning and decision making for the achievement of the Group’s strategic outcomes and long-term objectives.
Based on the evaluation for the Financial Year under review, the Board collectively agreed that it has discharged its roles in identifying principal risks and in ensuring that the Group has put in place an adequate risk management framework to effectively monitor and manage the risks of its operational businesses.
p.90
TENAGA NASIONAL BERHAD
Board Meetings
The Board schedules meetings on a monthly basis. Additional meetings are held to discuss specific issues that require deliberation in between the scheduled meetings. The Board held 17 Board meetings during the Financial Year under review.
The calendar for Board and Board Committees meetings is scheduled well in advance, which include the BBO, Pre-Board meetings and Annual General Meeting (AGM), with dates for the year circulated to the Board in the month of October of the preceding year to give the Directors ample time to plan their attendance. A Pre-Board meeting is held prior to any Board meetings for the Management to provide the Chairman with insights into the papers that will be deliberated.
The agenda of Board meetings is drawn up after consultation between the Chairman, President/CEO and Company Secretary at the Pre-Board meeting. Copies of the agenda and Board papers are circulated to Board Members via an advanced meeting software which allows the Directors to securely access, read and review Board/Committees Documents and collaborate with Directors and Company Secretary electronically or in hard copies at least five (5) working days prior to the meetings. This permits prior review by the Directors and if necessary, the provision of further information for deliberation at the meeting to ensure informed decision-making. Any Director may request matters to be included in the agenda.
2020 has been a difficult and uncertain time for Malaysia and global communities, as we navigate a changed environment in response to the COVID-19 pandemic.
Amid the COVID-19 pandemic that hit the country, the fiduciary duties of the Board remain its utmost priority. The Board and its Committees meetings have been taking place as per normal, albeit virtually. The Directors may participate in the Board/Committees meetings either online or in person to ensure the Company’s business/operations remain uninterrupted. Board meetings across the Group have also been conducted online or in hybrid, whichever is appropriate.
The Top Management and external advisors may be invited to attend Board meetings to advise the Board when matters under their purview are being considered, or as otherwise requested by the Board to enable informed decision-making. In embracing the new norm, the Board
encourages a limited number of attendees to participate in the Board discussions preferably online.
In the event that a Director is unable to attend a meeting, his/her views are sought in advance and put to the meeting to facilitate a comprehensive discussion. Thereupon, each Director makes himself/herself available to fellow Directors and may contribute to all major decisions before the Board.
A comprehensive Board paper comprises of its objectives, background, issues, implications, risks, appropriate analysis/statistics, recommendations and other relevant information is prepared to enable the Board to make informed and effective decisions.
During the Financial Year under review, the Board on 3 March 2020, visited the site of Tuanku Muhriz Power Station at Jimah, Port Dickson following its launch which was officiated by Yang di-Pertuan Besar of Negeri Sembilan, Tuanku Muhriz ibni Almarhum Tuanku Munawir. Other than that, no Board nor Board Committee meeting was held at any business operating unit or site of major/new projects, as per previous practice. Nonetheless the progress reports of major/new projects are circulated by the Management to the Board and its relevant Committees for deliberation and notation.
Decisions of the Board and Board Committees are made by consensus, except under certain circumstances. These decisions and conclusions are recorded in the Board minutes. In the case of a tied vote, the Chairman has a second or casting vote. The Board’s decisions may also be obtained via circulation depending on the urgency and availability of the Directors as well as the nature of the proposal/subject matter.
Minutes of the meetings are circulated earlier to all Directors for their perusal prior to the meetings. The Directors may request for clarification or raise comments on the minutes prior to their confirmation. After the Directors’ confirmation, the Chairman of the meeting signs the minutes as a correct record of the proceedings. The Directors are also informed immediately of announcements made to Bursa Malaysia Securities Berhad for their notification.
Supply of Information and Access To Advice
The Board receives accurate, timely and clear information five (5) working days prior to meetings to enable it to effectively discharge its duties and responsibilities. Thus, it has separate and independent access to information to assist with its deliberations, including the opportunity to request for supplementary or explanatory information from Management. The Management provides information to the Board on an on-going basis to allow the Board to effectively discharge its responsibilities.
The Board recognises the importance of independent judgement and constructive debate on all issues under consideration. Where necessary, the Board collectively and individually is at liberty to obtain external independent or professional advice as deemed appropriate at the Company’s expense to assist with its decision-making process.
Principle A: Board Leadership & Effectiveness

p.91
INTEGRATED ANNUAL REPORT 2020
CREATING VALUE THROUGH STRONG GOVERNANCE
Board Diversity
TNB strongly supports diversity within its Board of Directors, including gender, age, professional diversity as well as diversity of thought. The Board currently comprises of individuals from a diverse range of skills, industries, backgrounds and experience, which enables a broad evaluation of all matters considered by the Board and contributes to collaborative and constructive discussion.
To date, four (4) women Directors remain on the Board, namely Noraini binti Che Dan, Juniwati Rahmat Hussin, Ong Ai Lin and Dato’ Roslina binti Zainal representing 36% of the Board, exceeding the Government’s target of having 30% women on Board. These women Directors hold significant positions on the Board and its Committees whereby Noraini binti Che Dan is the Senior Independent Non-Executive Director and Chairman of BAC, Juniwati Rahmat Hussin is the Chairman of BNRC & BLTIP, Ong Ai Lin is the Chairman of BRC and Dato’ Roslina binti Zainal has brought technical/engineering insights/expertise to the Board gained through her experience and qualifications.
For the Financial Year under review, the gender mix of the Board and throughout the Company is illustrated by the diagram below:
Diversity of the Board
64% 36%
Diversity of the Company
79%
Male Female
21%
Board Composition
TNB Board currently consists of 11 members; one (1) Executive Director and 10 Non-Executive Directors, seven (7) of whom are Independent Directors. The Independent Directors are considered by the Board to be independent of Management and free of any business or other relationship or circumstance that could materially interfere with the exercise of objective, unfettered or independent judgement.
During the Financial Year under review, the Board/BNRC on 28 April 2020 approved the redesignation of Dato’ Roslina binti Zainal from Non-Independent Non-Executive Director to Independent Non-Executive Director with effect from 28 April 2020 being satisfied with her independence test as per Paragraph 1.01 of the MMLR.
Dato’ Roslina binti Zainal is able to bring independent and objective judgement to the Board deliberations as an Independent Non-Executive Director effectively. Her inclusion on the Board has further strengthened the Board’s composition through valuable insights into the Company’s business and the future regulatory landscape of the electricity industry.
With the addition of Dato’ Ir. Nawawi bin Ahmad and Datuk Rawisandran a/l Narayanan as Independent Non-Executive Directors, the Board comprises a majority of Independent Directors. Their expertise/experience further strengthen the Board’s composition and dynamics.
The Board fulfils Practice 4.1 of MCCG for Large Companies having a majority of Independent Directors, with the number exceeding the minimum requirement as prescribed by the MMLR.
Meanwhile Dato’ Asri bin Hamidin @ Hamidon was appointed to the Board as a Non-Independent Non-Executive Director by MoF Inc. with effect from 1 July 2020 and the appointment of his Alternate Director, Azmin bin Ishak took effect on the same day.
The Board recently welcomed Datuk Ir. Baharin bin Din as President/CEO who was appointed to the Board with effect from 1 March 2021 in place of Datuk Seri Amir Hamzah bin Azizan who resigned following his acceptance of new appointment by the Minister of Finance.
The Board shall continue to assess and consider the capabilities, commitment and qualities of candidates to be appointed as Board Members in accordance with TNB’s Constitution, taking into account the required mix of skills, background, experience/expertise/knowledge relevant to the Company’s strategic plan and business/industry.
The Board may appoint a new Director either to fill a casual vacancy or to add to the existing Directors. The MoF Inc., being the Special Shareholder of TNB, possesses the right to appoint up to six (6) Directors. The Company’s Constitution provides that the Company must have at least two (2) Directors but not more than 12 Directors.
The Board believes that it presently has an appropriate balance of skills, experience, knowledge and independence to deliver the Group’s strategy, to enable the Non-Executive Directors to effectively challenge the views of Management and to satisfy the requirements of good governance.
Principle A: Board Leadership & Effectiveness

p.92
TENAGA NASIONAL BERHAD
Board Skills Matrix
The Board/BNRC continuously review the Board Skills Matrix, which serves to identify the skills, knowledge, experience and capabilities desired of the Board to enable it to meet both current and future challenges of the Company. It reflects the appropriate mix of skills, expertise and experience required to address existing and emerging business and governance issues, to enable Directors to effectively review Management’s performance.
The Board Skills Matrix consists of several criteria, namely Leadership/Stewardship, Regulatory Experience & Network, General Management, Sector/Service Experience, Entrepreneurship and Other Factors relevant/tailored to the Company.
The Board, guided by the matrix, approved the BNRC’s recommendation that in order to strengthen the Board’s composition to be more dynamic, the skills and gaps that have been identified as critical and need to be filled are technical experience, international business experience and customer centricity.
The Board agreed that all Directors appointed during the Financial Year under review had met the above required skills.
Re-election of Directors
Juniwati Rahmat Hussin and Gopala Krishnan K.Sundaram, being Directors who are retiring by rotation in accordance with Clause 64(1) of the Company’s Constitution and being eligible, have offered themselves for re-election.
The Directors appointed during the Financial Year, Dato’ Asri bin Hamidin @ Hamidon, Dato’ Ir. Nawawi bin Ahmad, Datuk Rawisandran a/l Narayanan and Datuk Ir. Baharin bin Din, shall retire at the forthcoming AGM in accordance with Clause 63(2) of the Company’s Constitution, and being eligible, have offered themselves for re-election.
The Board recognises that the Directors’ performance is used as a basis in recommending their re-election to the shareholders. This, in turn, is determined through their annual evaluation and independence assessment, which are assessed by the BNRC before any recommendation is made to the Board for deliberation and approval.
Based on the annual independence assessment of all Independent Directors who are retiring specifically Juniwati Rahmat Hussin, Gopala Krishnan K.Sundaram, Dato’ Ir. Nawawi bin Ahmad and Datuk Rawisandran a/l Narayanan, the BNRC/Board are satisfied that these Independent Directors have complied with the independence criteria as set out by the MMLR and continue to bring independent and objective judgement to the Board.
Dato’ Asri bin Hamidin @ Hamidon is an Appointed Director by MoF Inc., representing the interest of TNB’s Special Shareholder. He has exercised the duty of care and diligence as a Director in the best interest of the Company, its shareholders and stakeholders.
All retiring Directors named above, through the BEA including Self and Peer Assessment, have met the performance criteria required of an effective and high performance Board. Having considered their professionalism, vast experience, material relationship, competency, commitment and individual contributions in performing their respective duties, the Board and BNRC are satisfied that all Directors who are seeking re-election at the 31st AGM have met the Board’s expectations by continuously discharging their duties diligently as Directors of the Company.
Following the recent appointment of Datuk Ir. Baharin bin Din as President/CEO with effect from 1 March 2021 by MoF Inc., he shall be applicable for the next BEA for the Financial Year ending 31 December 2021.
With that, the Board and BNRC collectively resolved to recommend the re-election of each Director who is retiring at the upcoming 31st AGM.
Principle A: Board Leadership & Effectiveness
p.93
INTEGRATED ANNUAL REPORT 2020
CREATING VALUE THROUGH STRONG GOVERNANCE
Principle A: Board Leadership & Effectiveness
Independence Assessment of Independent Directors
It is vital for the Board to assess the independence of its Independent Directors. This is done annually with reference to the key criteria developed by the BNRC inclusive of independence from the Management and the absence of any business relationship which could materially interfere with, or could reasonably be perceived to materially interfere with, the Independent Director’s judgement. These Directors are also assessed on their ability to provide strong, valuable contributions to the Board’s deliberations, without interference to and acting in the best interest of TNB.
The BNRC and Board at their meetings on 15 January 2021 and 27 January 2021 respectively, have considered the independence of each Independent Non-Executive Director in office for the Financial Year under review and concluded that each Independent Non-Executive Director has met the independence criteria as set out in the MMLR. The Board is generally satisfied that each Independent Non-Executive Director remains independent in character and judgement and is free from relationships or circumstances which are likely to affect or could appear to affect the Director’s judgement.
In reaching this conclusion, the Board has considered all relevant facts and circumstances, which include whether the Independent Director:
(a) is an executive director of the Company or any related corporation;(b) is and has been within the last three (3) years, an officer (except as an Independent Director) of the Company;(c) is a major shareholder of the Company;(d) is a family member of any executive director, officer or major shareholder of the Company;(e) is acting as a nominee or representative of any executive director or major shareholder of the Company;(f) has been engaged as an adviser by the Company or is presently a partner, director (except an Independent Director) or major shareholder,
as the case may be, of a firm or corporation which provides professional advisory services to the Company; or(g) has engaged in any transaction with the Company or is presently a partner, director or major shareholder, as the case may be, of a firm or
corporation which has engaged in any transaction with the Company.
The Board also concurred that the continuous contributions of these Directors are beneficial to the Board and the Company as a whole.
The independence status of Independent Non-Executive Directors who are standing for re-election is disclosed in the Notice of 31st AGM.
The Board adopts a policy that limits the tenure of its Independent Non-Executive Directors to nine (9) years, pursuant to Step Up 4.3 of MCCG. Currently, none of the Independent Non-Executive Directors has served the Board for more than nine (9) years.
Board Development
The Directors are conscious of the need to keep themselves properly briefed and informed about current issues. The Directors, on a continuous basis, attend internal and external training programmes, in ensuring they remain updated with developments of the Company’s business and industry that may affect their roles and responsibilities.
Induction
Newly-appointed Directors receive appropriate induction and training on the Company’s business, corporate governance and reporting procedures, on which they are continuously updated. In addition, the Directors are advised on policies and procedures of the Board and Board Committees’ meetings and their roles/responsibilities.
Each Director shall receive a comprehensive information pack containing the Board Charter, the Non-Executive Directors’ Handbook, the Company’s Constitution, relevant Acts affecting the Company, the latest Integrated Annual Report, TNB’s Procurement & Supply Chain Policy and Procedures, Procurement Code of Conduct & Code of Ethics and TNB Corporate Integrity Management System (TCIMS) Handbook in order to facilitate the discharge of their duties.
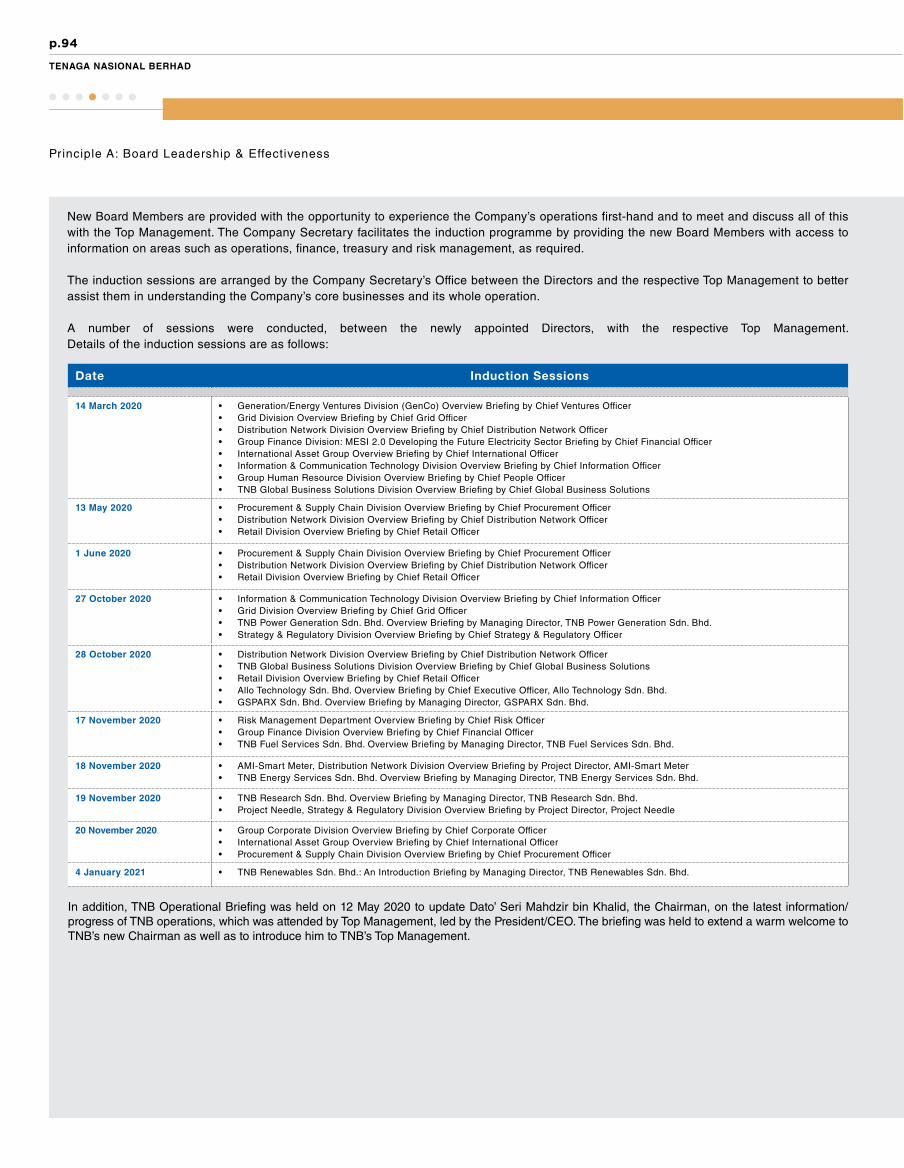
p.94
TENAGA NASIONAL BERHAD
Principle A: Board Leadership & Effectiveness
Date Induction Sessions
14 March 2020 • Generation/Energy Ventures Division (GenCo) Overview Briefing by Chief Ventures Officer• Grid Division Overview Briefing by Chief Grid Officer• Distribution Network Division Overview Briefing by Chief Distribution Network Officer• Group Finance Division: MESI 2.0 Developing the Future Electricity Sector Briefing by Chief Financial Officer• International Asset Group Overview Briefing by Chief International Officer• Information & Communication Technology Division Overview Briefing by Chief Information Officer• Group Human Resource Division Overview Briefing by Chief People Officer• TNB Global Business Solutions Division Overview Briefing by Chief Global Business Solutions
13 May 2020 • Procurement & Supply Chain Division Overview Briefing by Chief Procurement Officer• Distribution Network Division Overview Briefing by Chief Distribution Network Officer• Retail Division Overview Briefing by Chief Retail Officer
1 June 2020 • Procurement & Supply Chain Division Overview Briefing by Chief Procurement Officer• Distribution Network Division Overview Briefing by Chief Distribution Network Officer• Retail Division Overview Briefing by Chief Retail Officer
27 October 2020 • Information & Communication Technology Division Overview Briefing by Chief Information Officer• Grid Division Overview Briefing by Chief Grid Officer• TNB Power Generation Sdn. Bhd. Overview Briefing by Managing Director, TNB Power Generation Sdn. Bhd.• Strategy & Regulatory Division Overview Briefing by Chief Strategy & Regulatory Officer
28 October 2020 • Distribution Network Division Overview Briefing by Chief Distribution Network Officer• TNB Global Business Solutions Division Overview Briefing by Chief Global Business Solutions• Retail Division Overview Briefing by Chief Retail Officer• Allo Technology Sdn. Bhd. Overview Briefing by Chief Executive Officer, Allo Technology Sdn. Bhd.• GSPARX Sdn. Bhd. Overview Briefing by Managing Director, GSPARX Sdn. Bhd.
17 November 2020 • Risk Management Department Overview Briefing by Chief Risk Officer• Group Finance Division Overview Briefing by Chief Financial Officer• TNB Fuel Services Sdn. Bhd. Overview Briefing by Managing Director, TNB Fuel Services Sdn. Bhd.
18 November 2020 • AMI-Smart Meter, Distribution Network Division Overview Briefing by Project Director, AMI-Smart Meter• TNB Energy Services Sdn. Bhd. Overview Briefing by Managing Director, TNB Energy Services Sdn. Bhd.
19 November 2020 • TNB Research Sdn. Bhd. Overview Briefing by Managing Director, TNB Research Sdn. Bhd.• Project Needle, Strategy & Regulatory Division Overview Briefing by Project Director, Project Needle
20 November 2020 • Group Corporate Division Overview Briefing by Chief Corporate Officer• International Asset Group Overview Briefing by Chief International Officer• Procurement & Supply Chain Division Overview Briefing by Chief Procurement Officer
4 January 2021 • TNB Renewables Sdn. Bhd.: An Introduction Briefing by Managing Director, TNB Renewables Sdn. Bhd.
In addition, TNB Operational Briefing was held on 12 May 2020 to update Dato’ Seri Mahdzir bin Khalid, the Chairman, on the latest information/progress of TNB operations, which was attended by Top Management, led by the President/CEO. The briefing was held to extend a warm welcome to TNB’s new Chairman as well as to introduce him to TNB’s Top Management.
New Board Members are provided with the opportunity to experience the Company’s operations first-hand and to meet and discuss all of this with the Top Management. The Company Secretary facilitates the induction programme by providing the new Board Members with access to information on areas such as operations, finance, treasury and risk management, as required.
The induction sessions are arranged by the Company Secretary’s Office between the Directors and the respective Top Management to better assist them in understanding the Company’s core businesses and its whole operation.
A number of sessions were conducted, between the newly appointed Directors, with the respective Top Management. Details of the induction sessions are as follows:

p.95
INTEGRATED ANNUAL REPORT 2020
CREATING VALUE THROUGH STRONG GOVERNANCE
Principle A: Board Leadership & Effectiveness
Professional Training
Directors are encouraged to develop and refresh their knowledge and skills on an ongoing basis with developmental needs reviewed as part of the annual Board evaluation process and the necessary resources made available should any Director request additional training. Topics covered at sessions attended by the Directors during the Financial Year under review were COVID-19 impact on the industry, economics, regulatory developments, risk management, finance, investment, governance, ethics and sustainability that are considered relevant and beneficial for the Directors to discharge their duties efficiently.
Dato’ Seri Mahdzir bin Khalid attended his Mandatory Accreditation Programme for Directors of Public Listed Companies (MAP) on 15 June 2020 until 17 June 2020, whilst Dato’ Ir. Nawawi bin Ahmad and Datuk Rawisandran a/l Narayanan attended their MAP on 30 November 2020 until 2 December 2020. Azmin bin Ishak attended his MAP on 24 February 2021 until 26 February 2021 as prescribed under Paragraph 15.08 by the MMLR. The existing Directors attended their MAPs accordingly.
The Company Secretary’s Office facilitates the Board in organising internal and arranging external programmes, training sessions, briefings, workshops and seminars that are relevant to the Directors. These include the annual Board Development Programme (BDP) which is organised in-house as part of TNB’s Board Continuing Development Programme.
Due to the COVID-19 pandemic, the Board was encouraged to attend the trainings online.
Details of Directors’ Training, including the Company Secretary’s for the Financial Year ended 31 December 2020:
Name of Director Date Conference/Training Attended
Dato’ Seri Mahdzir bin Khalid(Appointed w.e.f. 12 May 2020)
15-17 June 2020 MAP
27 October 2020 How To Be An Effective Non-Executive Director (NED) In A Disruptive World
Dato’ Asri bin Hamidin @ Hamidon(Appointed w.e.f. 1 July 2020)
19-21 January 2020 Majlis Projek Demonstrasi 5G Malaysia
7-9 August 2020 Official Visit By Ministry Of Finance In Conjunction With Budget (Penang)
11 September 2020 Engagement Session With Strategy & Regulatory Division
27-28 September 2020 Board Retreat Johor Corporation
1-4 October 2020 TRXC Brain Storming Session
Amran Hafiz bin Affifudin 3 September 2020 Nordic Smart Cities Conference 2020
22-23 September 2020 Progressive Board Review & Directors Global Masterclass
19-23 October 2020 Virtual Conference: 11th International Greentech & Eco Products Exhibition & Conference Malaysia (IGEM)
27 October 2020 How To Be An Effective NED In A Disruptive World
26-28 October 2020, 2&4 November 2020 Leading Organizations And Change
18-19 November 2020 Virtual Conference: Business Foresight Forum (BFF) 2020, Evolutionary Change To Revolutionary Impact: Reimagining A New World Post COVID-19
26 November 2020 Virtual Roundtable Series: The Role of Governments, Policy Makers And Finance In Building Green Infrastructure
Noraini binti Che Dan 8 January 2020 Islamic Finance For Board Of Directors Programme
5 February 2020 Tabletop Exercise By FireEye (Cyber Security)
12 March 2020 Section 17A Of MACC Act 2020
5 August 2020 Impact Of COVID-19 Pandemic To The Global And Malaysia Economy
7 September 2020 Seminar Liabiliti Korporat Seksyen 17A
15 September 2020 Sharing Session On Property Development And Digital Transformation Journey
7 October 2020 Islamic Finance For Board Of Directors Programme
18-19 November 2020 Virtual Conference: BFF 2020, Evolutionary Change To Revolutionary Impact: Reimagining A New World Post COVID-19
26 November 2020 PNB Knowledge Sharing Initiatives Forum
9 December 2020 Integrity Day: United Against Corruption Speak Up For Integrity
Juniwati Rahmat Hussin 22-23 September 2020 Progressive Board Review & Directors Global Masterclass
23-24 September 2020 Executive Compensation Regional Webinar
27 October 2020 How To Be An Effective NED In A Disruptive World
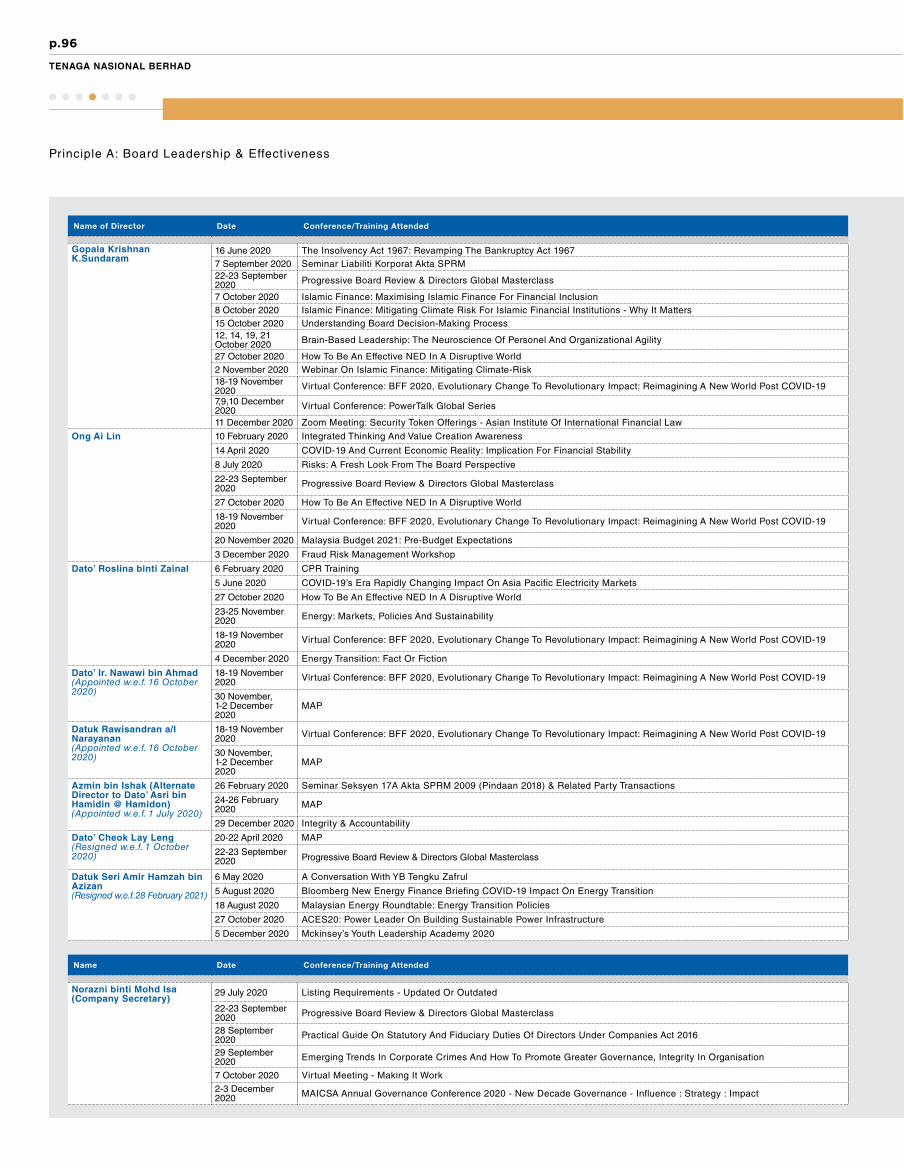
p.96
TENAGA NASIONAL BERHAD
Principle A: Board Leadership & Effectiveness
Name of Director Date Conference/Training Attended
Gopala Krishnan K.Sundaram
16 June 2020 The Insolvency Act 1967: Revamping The Bankruptcy Act 19677 September 2020 Seminar Liabiliti Korporat Akta SPRM22-23 September 2020 Progressive Board Review & Directors Global Masterclass
7 October 2020 Islamic Finance: Maximising Islamic Finance For Financial Inclusion8 October 2020 Islamic Finance: Mitigating Climate Risk For Islamic Financial Institutions - Why It Matters15 October 2020 Understanding Board Decision-Making Process12, 14, 19, 21 October 2020 Brain-Based Leadership: The Neuroscience Of Personel And Organizational Agility
27 October 2020 How To Be An Effective NED In A Disruptive World2 November 2020 Webinar On Islamic Finance: Mitigating Climate-Risk18-19 November 2020 Virtual Conference: BFF 2020, Evolutionary Change To Revolutionary Impact: Reimagining A New World Post COVID-19
7,9,10 December 2020 Virtual Conference: PowerTalk Global Series
11 December 2020 Zoom Meeting: Security Token Offerings - Asian Institute Of International Financial Law
Ong Ai Lin 10 February 2020 Integrated Thinking And Value Creation Awareness
14 April 2020 COVID-19 And Current Economic Reality: Implication For Financial Stability
8 July 2020 Risks: A Fresh Look From The Board Perspective
22-23 September 2020 Progressive Board Review & Directors Global Masterclass
27 October 2020 How To Be An Effective NED In A Disruptive World
18-19 November 2020 Virtual Conference: BFF 2020, Evolutionary Change To Revolutionary Impact: Reimagining A New World Post COVID-19
20 November 2020 Malaysia Budget 2021: Pre-Budget Expectations
3 December 2020 Fraud Risk Management Workshop
Dato’ Roslina binti Zainal 6 February 2020 CPR Training
5 June 2020 COVID-19’s Era Rapidly Changing Impact On Asia Pacific Electricity Markets
27 October 2020 How To Be An Effective NED In A Disruptive World
23-25 November 2020 Energy: Markets, Policies And Sustainability
18-19 November 2020 Virtual Conference: BFF 2020, Evolutionary Change To Revolutionary Impact: Reimagining A New World Post COVID-19
4 December 2020 Energy Transition: Fact Or Fiction
Dato’ Ir. Nawawi bin Ahmad (Appointed w.e.f. 16 October 2020)
18-19 November 2020 Virtual Conference: BFF 2020, Evolutionary Change To Revolutionary Impact: Reimagining A New World Post COVID-19
30 November, 1-2 December 2020
MAP
Datuk Rawisandran a/l Narayanan(Appointed w.e.f. 16 October 2020)
18-19 November 2020 Virtual Conference: BFF 2020, Evolutionary Change To Revolutionary Impact: Reimagining A New World Post COVID-19
30 November, 1-2 December 2020
MAP
Azmin bin Ishak (Alternate Director to Dato’ Asri bin Hamidin @ Hamidon) (Appointed w.e.f. 1 July 2020)
26 February 2020 Seminar Seksyen 17A Akta SPRM 2009 (Pindaan 2018) & Related Party Transactions
24-26 February 2020 MAP
29 December 2020 Integrity & Accountability
Dato’ Cheok Lay Leng (Resigned w.e.f. 1 October 2020)
20-22 April 2020 MAP
22-23 September 2020 Progressive Board Review & Directors Global Masterclass
Datuk Seri Amir Hamzah bin Azizan(Resigned w.e.f. 28 February 2021)
6 May 2020 A Conversation With YB Tengku Zafrul
5 August 2020 Bloomberg New Energy Finance Briefing COVID-19 Impact On Energy Transition
18 August 2020 Malaysian Energy Roundtable: Energy Transition Policies
27 October 2020 ACES20: Power Leader On Building Sustainable Power Infrastructure
5 December 2020 Mckinsey’s Youth Leadership Academy 2020
Name Date Conference/Training Attended
Norazni binti Mohd Isa (Company Secretary)
29 July 2020 Listing Requirements - Updated Or Outdated
22-23 September 2020 Progressive Board Review & Directors Global Masterclass
28 September 2020 Practical Guide On Statutory And Fiduciary Duties Of Directors Under Companies Act 2016
29 September 2020 Emerging Trends In Corporate Crimes And How To Promote Greater Governance, Integrity In Organisation
7 October 2020 Virtual Meeting - Making It Work
2-3 December 2020 MAICSA Annual Governance Conference 2020 - New Decade Governance - Influence : Strategy : Impact

p.97
INTEGRATED ANNUAL REPORT 2020
CREATING VALUE THROUGH STRONG GOVERNANCE
Principle A: Board Leadership & Effectiveness
Board Evaluation
The Board recognises that an objective and well-managed board evaluation process can lead to substantial improvement in Board effectiveness, bringing significant benefits to the Company. This is achieved through annual performance evaluations, induction programmes for new Board members and ongoing Board development activities.
In 2020, the Board with the assistance of BNRC, undertook the annual BEA of its own performance, its Committees and Individual Directors, for the Financial Year under review.
These evaluations were conducted through the BEA questionnaires and the results were subsequently collected and analysed. The BEA questionnaires towards an Effective Board covered the following parameters:
Responsibility and Conduct
• Business Strategy governance and implementation
• Risk management and integrity• Implementation of strategies and
policies
Process and Administration
• Board and Committee Charters• Agenda and frequency of meetings• Sufficient information availability
and on a timely basis
Composition
• Diversity• Competencies of the Members• Board and Committee compositions
2020 Board Evaluation Assessment Results
Based on the 2020 BEA results, it is clear that the effectiveness of both the Chairman and President/CEO is reflective of the Board’s confidence in them, indicating strong and effective leadership in steering the Company’s direction.
With the stewardship portrayed by the Chairman and President/CEO, the effectiveness of both Chairman and President/CEO were recorded as outstanding, on average. The Board agreed that Datuk Seri Amir Hamzah bin Azizan as President/CEO demonstrated good leadership, has clear vision and focused execution plan to ensure the sustainability and competitiveness of TNB internationally as well as upholding the responsibilities entrusted on TNB by the nation.
Overall, the Board of Directors was rated as Exceed Expectations, scoring four (4) on average, whereby it has remained highly effective and has consistently met high performance standards and exceeded expectations.
Whilst the Board Committees and Directors’ Self and Peer were rated as Strongly Agree and Outstanding respectively, of which both scoring five (5) each in average for all assessment. As compared to last year, the Board of Directors Assessment rating remains the same whilst the ratings for Board Committees and Directors’ Self and Peer have improved from four (4) to five (5), indicating that each Individual Director has delivered outstanding performance and performed his/her duties diligently.
Each Board Committee remains highly effective in assisting the Board to carry out its respective duties while the Board Committee Members have fulfilled their roles and responsibilities.
The Board has also identified challenges likely to be faced by the Company for the next financial year. These include the impact of COVID-19 pandemic on the Company’s business/operations and the economy, managing the regulatory outcome and industry reformation, the progress of Reimagining TNB, the succession planning of Board and Top Management, and TNB’s Environmental, Social and Governance issues.
In conclusion, the Board and Board Committees are satisfied with their existing composition and are of the view that, with the current mix of skills, knowledge, experience and strength of the existing Directors, the Board and respective Board Committees are able to discharge their duties effectively.
The performance of each Director retiring at the next AGM is taken into account by the Board in determining whether or not the Board should support the re-election of the Director.
This year’s process
The BEA analysis was presented to the BNRC for deliberation
Each Director completed the BEA for the Board and its respective Committees including Self and Peer
Assessment
A summarised report of BEA was tabled to the Board by the
Chairman of BNRC with a view to discuss areas of
improvement

p.98
TENAGA NASIONAL BERHAD
Non-Executive Directors’ Remuneration
The Board as a whole shall determine and recommend the remuneration of Non-Executive Directors for shareholders’ approval at the AGM. The Non-Executive Directors are remunerated through fixed monthly fees, meeting allowances and benefits-in-kind, inclusive of the reimbursement of utilities bills and business peripherals.
The level of remuneration of Non-Executive Directors reflects the current demanding challenges in discharging their fiduciary duties, roles and responsibilities, whether individually or collectively, as well as the complexity of the Company’s operations and the industry. The Non-Executive Directors’ remuneration/benefits remain unchanged, since the last review in 2013.
Based on the review of Non-Executive Directors’ Remuneration by Willis Towers Watson (WTW) in 2018, overall, TNB is at par with the market for most of the compensation elements that are offered to its Non-Executive Directors. The current remuneration framework of TNB’s Non-Executive Directors has been retained, and suggested to be reviewed in the next one (1) or two (2) years’ time to ensure its market competitiveness.
Principle A: Board Leadership & Effectiveness
Our Remuneration Approach
The overall objectives of the BNRC are to determine an appropriate remuneration policy that aligns remuneration with strategy to drive the long-term success of the Company and ensure that the Company may continue to attract, retain and motivate quality leaders.
The Directors’ Remuneration Policy is shaped by the following underlying principles:
Executive Director And Top Management Remuneration
The remuneration package for the Executive Director is structured to link rewards to corporate and individual performance. It comprises salary, allowances, bonuses and other customary benefits as accorded by comparable companies. A significant portion of an Executive Director’s compensation package has been made variable and is determined by performance during the year against individual KPIs in a scorecard aligned with the corporate objectives as approved by the Board. The Executive Director recuses himself from deliberation and voting on his remuneration at Board meetings.
The BNRC reviews the performance of the Executive Director annually and submits views/recommendations to the Board on adjustments in remuneration and/or rewards to reflect the Executive Director’s contributions towards the Group’s achievements for the year.
The Company adopts Practice 7.2 of MCCG on the disclosure on named basis, the top five (5) Senior Management’s remuneration components including salary, bonus, benefits-in-kind and other emoluments in bands of RM50,000. The said disclosure and further details of the Top Management’s remuneration are available in the TNB Corporate Governance Report 2020.
Alignment with strategy and business objectives
Alignment with shareholders’ interest
Long-term success of the Company
Reward performance with competitive remuneration
Alignment with market/industry practices
Support Company values
Consistency and transparencyRemuneration
policyFixed
RemunerationBenefits-in-kind

p.99
INTEGRATED ANNUAL REPORT 2020
CREATING VALUE THROUGH STRONG GOVERNANCE
Principle A: Board Leadership & Effectiveness
Disclosure on Directors’ Remuneration
Details of each Director’s remuneration for the Financial Year ended 31 December 2020:
Name of DirectorsSalary
(RM)
Director’s Fees Meeting Allowances
Emoluments1
(RM)
Benefits-in-Kind2
(RM)Total(RM)
Company
(RM)
Subsidiaries
(RM)
Company
(RM)
Subsidiaries
(RM)Executive DirectorDatuk Seri Amir Hamzah bin Azizan
(Resigned w.e.f. 28 February 2021) 1,710,000.00 - - - - 2,362,954.50 75,875.84 4,148,830.34
1,710,000.00 - - - - 2,362,954.50 75,875.84 4,148,830.34
Non-Executive DirectorsDato’ Seri Mahdzir bin Khalid
(Appointed w.e.f. 12 May 2020)
- 229,354.83 31,000.003 22,500.00 3,000.003 - 20,625.60 306,480.43
Dato’ Asri bin Hamidin @ Hamidon
(Appointed w.e.f. 1 July 2020)
- 120,000.00 - 20,500.00 - - 263.60 140,763.60
Amran Hafiz bin Affifudin - 240,000.004 - 101,500.004 - - 42,130.25 383,630.25 Noraini binti Che Dan - 240,000.00 - 108,000.00 - - 75,614.74 423,614.74 Juniwati Rahmat Hussin - 240,000.00 - 105,000.00 - - 19,237.70 364,237.70 Gopala Krishnan K.Sundaram - 240,000.00 - 77,500.00 - - 34,811.96 352,311.96Ong Ai Lin - 240,000.00 - 75,000.00 - - 54,375.10 369,375.10 Dato' Roslina binti Zainal - 240,000.00 - 87,000.00 - - 21,419.85 348,419.85 Dato’ Ir. Nawawi bin Ahmad
(Appointed w.e.f. 16 October 2020)
- 50,322.58 - 10,000.00 - - 28,810.59 89,133.17
Datuk Rawisandran a/l Narayanan
(Appointed w.e.f. 16 October 2020)
- 50,322.58 - 8,500.00 - - 22,688.45 81,511.03
Azmin bin Ishak - - - 12,500.00 - - 22,727.00 35,227.00 (Alternate Director to Dato’ Asri bin
Hamidin @ Hamidon)
(Appointed w.e.f. 1 July 2020)Tan Sri Leo Moggie
(Cessation of Office as Chairman
w.e.f. 12 March 2020)
- 70,262.08 15,000.003 9,500.00 1,000.003 2,500,000.00 29,800.60 2,625,562.68
Tan Sri Ahmad Badri bin Mohd Zahir
(Cessation of Office as Chairman
w.e.f. 11 May 2020)
- 107,097.76 - 27,500.00 - 200,000.00 9,010.10 343,607.86
Gee Siew Yoong
(Cessation of Office as Director
w.e.f. 30 June 2020)
- 120,000.00 - 39,500.00 - 200,000.00 24,890.12 384,390.12
Datin Rashidah binti Mohd Sies
(Appointed w.e.f. 1 May 2020)
(Resigned w.e.f. 1 July 2020)
- 40,000.00 - 8,000.00 - 10,000.00 1,972.42 59,972.42
Dato’ Cheok Lay Leng
(Resigned w.e.f. 1 October 2020)
- 139,354.84 - 43,500.00 - 50,000.00 24,438.93 257,293.77
Total 1,710,000.00 2,366,714.67 46,000.00 756,000.00 4,000.00 5,322,954.50 508,692.85 10,714,362.02
Notes1 Contribution to EPF, Bonus, Car Allowance, Flexi Benefits, Ex-Gratia, LTIP and Gratuity.2 Utilities Bills, Business Peripherals, Purchase of Handphone, Club Membership, Medical and Travelling Expenses.3 Payment made by respective subsidiaries.4 Paid to Khazanah Nasional Berhad, in respect of Director's Fees and Meeting Allowances provided for Amran Hafiz bin Affifudin.

p.100
TENAGA NASIONAL BERHAD
Principle A: Board Leadership & Effectiveness
BOARD NOMINATION AND REMUNERATION COMMITTEE REPORT
KEY ROLES & RESPONSIBILITIES
For detailed roles & responsibilities of the Committee, please refer to “Our Board Practices” on page 85.
Chairman
Juniwati Rahmat Hussin
Independent Non-Executive Director
Members
Dato’ Asri bin Hamidin @ Hamidon
Non-Independent Non-Executive Director(Appointed as Member w.e.f. 1 July 2020)
Amran Hafiz bin Affifudin
Non-Independent Non-Executive Director
Noraini binti Che Dan
Senior Independent Non-Executive Director
Dato’ Ir. Nawawi bin Ahmad
Independent Non-Executive Director(Appointed as Member w.e.f. 16 October 2020)
BOARD NOMINATION ANDREMUNERATION COMMITTEE
Key Activities of The Committee
Juniwati Rahmat Hussin chairs the BNRC and is well supported by four (4) Members.
During the Financial Year under review, the BNRC held 14 meetings. The BNRC’s main activities in 2020 included the following:
• Annual Assessment of Independence of Independent Non-Executive Directors;• BEA of the Board of Directors, its Committees, and each Individual Director;• Assessment of ‘fit and proper’ and performance review of Directors for re-appointment/re-election;• Recommendation to the Board with regards to Directors who sought re-election at the AGM;• Assessment of ‘fit and proper’ of potential candidates for proposed appointment as TNB Directors;• Review of Board Skills Matrix, upon any appointment of potential candidates to the Board;• Appointment and Resignation of Chairman;• Appointment and Resignation of Directors;• Review of composition of the Board Committees;• Review of Independence Status and Redesignation of Non-Independent Non-Executive Director to
Independent Non-Executive Director;• Fit and proper assessment of potential candidates for Top Management;• Appointment of Top Management due to establishment of respective Divisions/succession planning;• Appointment of Directors/Top Management of TNB Power Generation Sdn. Bhd. & TNB Retail Sdn. Bhd.
following completion of Proposed Internal Reorganisation;• Review of Non-Executive Directors Remuneration Package for the Board of TNB Power Generation Sdn. Bhd.
& TNB Retail Sdn. Bhd. following completion of Proposed Internal Reorganisation;• Review of composition of the Boards of TNB Group;• Review of succession planning of Top Management;• Assessment and Recommendation to the Board on the promotion and renewal of service contracts of Top
Management;• Review of performance evaluation against assigned KPIs of President/CEO and Top Management;• Proposed Head Positions for Divisions Involved with Changes and Alignment of TNB Macro Organisational
Structure;• Proposed Subsidiary Board Member Approval Governance.
Due to the COVID-19 pandemic, in expressing support and concern for the affected nation and to help the needy, all Non-Executive Directors agreed and deducted 10% from their Board Fixed Allowance from April to June 2020, which was channeled to the COVID-19 assistance fund operated by TNB Pelitawanis.
During the Financial Year under review, the Board/BNRC approved the review of the BNRC TOR following the establishment of Subsidiary Board Member Approval Governance. The Board/BNRC agreed to retain its authority to recommend new Board Members for strategically important and large subsidiaries and delegate its power to Group People Committee/L1 Subsidiary Boards accordingly.
The BNRC annually reviews the size, composition and diversity of the Board as well as the mix of existing and desired competencies of Members, and reports its conclusions to the Board.
Through its annual assessment and recommendations made by the BNRC, the Board believes that its current size and composition is conducive to appropriate decision-making and incorporates a diversity of perspectives and skills in order to represent the best interest of the Company as a whole.
In view of the need to ensure proper processes are in place to manage succession issues at the Board level, an appropriate process for the selection, nomination and appointment of suitable candidates to the Board has been put in place.
The BNRC is entrusted with the responsibility of assessing and considering the capabilities, commitment and qualities of candidates to be appointed as Board Members as well as Committee members, taking into account the required mix of skills, background, experience/expertise/knowledge relevant to the Company’s business, existing commitment and potential conflict of interest prior to recommending to the Board.
Following each appointment, a letter of appointment will be issued and the Company Secretary shall undertake the necessary as authorised by the Board, so as to ensure the appointment is in accordance with the statutory requirements and as prescribed by the MMLR. All necessary information will be obtained from the newly appointed Director for the Company’s records and for meeting the statutory requirements and other applicable rules and regulations.
As part of TNB’s commitment to upholding the highest standard of integrity and ethics, each newly appointed Director is required to undertake an Integrity Pledge.
For the details of meeting attendance of BNRC members, kindly refer to page 85.

p.101
INTEGRATED ANNUAL REPORT 2020
CREATING VALUE THROUGH STRONG GOVERNANCE
Principle A: Board Leadership & Effectiveness
In 2017, TNB became one of the first listed corporations to embark on the ISO 37001:2016 Anti-Bribery Management System (ABMS) certification. Towards achieving the certification, TNB launched the TNB Corporate Integrity Management System (TCIMS) to drive an integrity based culture and a high level of compliance with local and international anti-bribery standards. TNB, on 15 November 2018, was awarded with the ABMS Certification from SIRIM and, further in reinforcing this culture, launched the TCIMS Handbook.
TNB has introduced a new Corporate Identity and Core Values & Behaviours which is publicly available and has been communicated to the workforce. First among the TNB Corporate Identity and Core Values & Behaviours is Integrity. The three (3) Behaviours of Integrity are:
3 BEHAVIOURS OF INTEGRITY
BEHAVIOUR 1We uphold highest ethical standards and do what is right, all the time
BEHAVIOUR 2We are fair, honest and transparent – in everything we do
BEHAVIOUR 3We always seek to achieve mutual benefit for the country, company and customers
The Handbook covers five (5) TCIMS policies, namely Anti-Bribery Policy, Gifts; Hospitality and Related Benefits Policy; Conflicts of Interest Policy; Whistleblowing Policy; and Integrity Pact and Committee Integrity Pledges Policy.
During the Financial Year under review, surveillance audit by SIRIM was conducted involving Retail Division and two (2) wholly owned subsidiaries of TNB, namely Malaysia Transformer Manufacturing Sdn. Bhd. and TNB Fuel Services Sdn. Bhd. whereas Tenaga Cable Industries Sdn. Bhd. has been certified with ISO 37001:2016.
A number of trainings & awareness sessions were conducted during the Financial Year by the Integrity Department to better equip the Company for the implementation of Section 17A of the Malaysian Anti-Corruption Commission (MACC) Act 2009. These included the following:
- Eight (8) sessions of Fraud and Bribery Risk Management Workshops;
- Two (2) sessions of ABMS & Corporate Liability Forum for the Board of Directors and Top Management with MACC;
- Introduction of Integrity E-learning module to all staff;- All staff are required to sign the integrity pledge and declare their
conflict of interest via Employee Self Services On-line System annually;
- ISO 37001 Internal Audit carried out by the identified division/department;
- TNB Integrity Health Index (IHI) has been established to access and capture relevant information on different attributes and dimensions of Integrity Health status and performance of an Integrity Health system;
- IHI score is 78.39%;- 23 sessions of Integrity & TCIMS Training;- Issuance of seven (7) integrity bulletins.
Limits of Authority
The Limits of Authority outlines principles to govern decision making within the Group, including appropriate escalation and reporting to the Board. The Board has also delegated to the President/CEO responsibility to manage the Company’s day-to-day activities. The Limits of Authority encompasses both monetary and non-monetary limits of authority for recommending and approving operational and management decision-making activities prior to its execution. This allows for balanced effective oversight with appropriate empowerment and accountability of the Management.
Code of Ethics
The Board of Directors is guided by a high standard of ethical conduct in accordance with the Code of Ethics for Company Directors as established by the Companies Commission of Malaysia.
Each Non-Executive Director is supplied with the Non-Executive Directors’ Handbook as reference of their responsibilities as well as the terms and conditions of their service. The Non-Executive Directors’ Handbook is updated as and when the need arises to reflect any changes of the applicable rules and regulations as well as in the policies/procedures that govern the conduct of the Directors.
TNB has a Code of Ethics to govern the conduct of its employees. The provisions set out in the Code of Ethics ensure compliance with laws and regulations, sound employment practices, confidentiality and privacy. It also includes provisions on conflicts of interest, giving and accepting business courtesies and the protection and proper use of TNB’s assets and resources.
Ethics, Integrity & Trust

p.102
TENAGA NASIONAL BERHAD
TNB’s Code of Ethics also defines how TNB relates to its shareholders, employees, customers, suppliers and the communities in which it operates. It includes TNB’s general principles on business integrity. All employees are expected to conduct business in accordance with the applicable laws, rules and regulations and in a manner so as to enhance and protect the reputation of TNB.
TNB’s Procurement Code of Conduct guides TNB’s Directors and employees as well as all existing and potential suppliers/contractors including their directors and employees. TNB believes that all supplier/contractor relationships should be based on principles of good governance such as integrity, accountability, fairness and a zero-tolerance rule towards bribery and corruption. These principles are enforced in the Procurement Code of Conduct, which is constantly revised to reflect changes in regulations, reputational demands and business challenges.
The Procurement & Supply Chain Policy and Procedures provides a set of general policy and procedures as guidance in executing procurement within TNB. The Policy and Procedures enables TNB to obtain the best value in procurement, adopt leading business practice, advance TNB’s business priorities, add value to customers and uphold good corporate governance.
TNB’s Code of Ethics and Procurement Code of Conduct are available at their respective sections of the Company’s website at www.tnb.com.my
Conflicts of Interest
To foster ethical and independent decision-making, the Company requires Directors with any direct or indirect interest in a proposal or transaction being considered by the Board or its Committees to declare that interest and recuse himself/herself from the deliberations. The affected Director will take no part in the decision-making.
As initiated by Procurement & Supply Chain Division in collaboration with Integrity Department to further strengthen our integrity and transparency in dealing with the Company’s procurement activities, at each Board Meeting, each Director shall sign an Integrity Pact, declaring his/her interest involving procurement/matters to be discussed at the Meeting, to prevent corruption, conflict of interest and to maintain confidentiality of information.
Whistle Blowing Procedure
The Whistle Blowing Procedure embodies TNB’s commitment to maintaining an open working environment in which employees, contractors and members of the public are able to report instances of unethical, unlawful or undesirable conduct in a confidential manner
without any fear of intimidation or reprisal. An independent investigation team investigates all reported concerns and, where applicable, provides feedback regarding the investigation’s outcomes.
The objectives of the Whistle Blowing Procedure are as follows:• to detect and address unacceptable conduct;• to provide employees and contractors with a supportive working
environment in which they feel able to raise issues of legitimate concern to them and to TNB; and
• to protect people who report unacceptable conduct in good faith.
Reporting Channels:• Online Whistle Blowing Information System (WBIS) - wbis.tnb.com.my• Email to one (1) of the designated officers by using the Whistle
Blowing Complaint Form, available in Malay & English:
NAME DESIGNATION E-MAIL ADDRESS
Noraini binti Che Dan Senior Independent Non-Executive Director
Datuk Lim Tong Kang Chief Risk Officer [email protected]
Norazni binti Mohd Isa
Company Secretary [email protected]
Kalivann Palanivelu Chief Integrity Development Officer
Hasbah binti Hasbullah
Head, Integrity Development & Culture
• Whistle Blowing toll free number: 1-800-888-862
Anti-Bribery Policy
TNB aims to state its position on bribery and related matters and to establish key pillars in its structure to protect the Company against any form of bribery.
Bribery in all its forms related to TNB’s activities is prohibited. It is the responsibility of personnel at all levels to act with integrity. TNB holds a ‘No Gifts’ policy, although certain exceptions are allowed. Integrity Pledges must be signed by personnel on a regular basis, as well as a Conflict of Interest declaration. Business Associates acting on behalf of the Company shall be managed carefully. Reporting of misconduct by personnel or third parties is expected, with protection provided for all disclosers acting in good faith.
TNB is committed to enforcing its position, with the Integrity Department taking on this role. The TCIMS will be assessed and updated on a regular basis to ensure its effectiveness is maintained.
Principle A: Board Leadership & Effectiveness
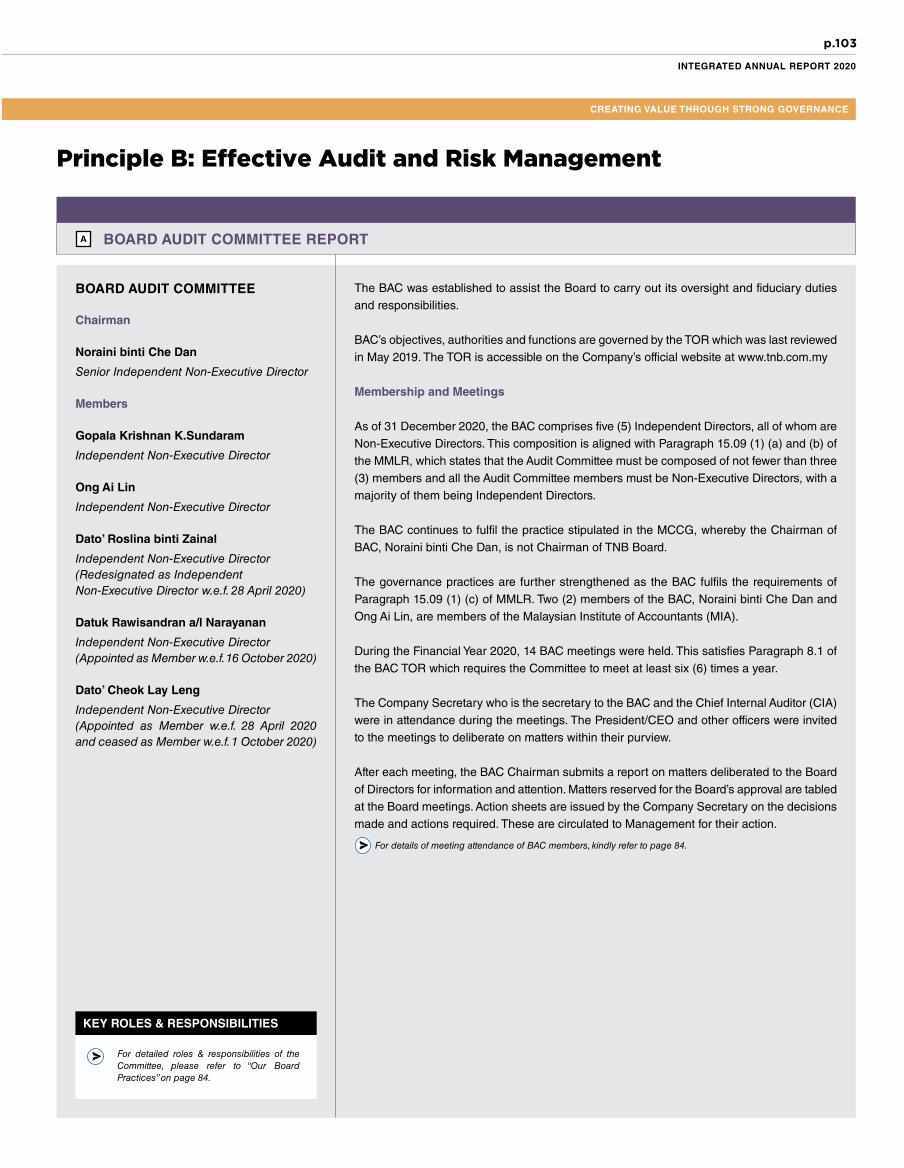
p.103
INTEGRATED ANNUAL REPORT 2020
CREATING VALUE THROUGH STRONG GOVERNANCE
Principle B: Effective Audit and Risk Management
BOARD AUDIT COMMITTEE REPORT
Chairman
Noraini binti Che Dan
Senior Independent Non-Executive Director
Members
Gopala Krishnan K.Sundaram
Independent Non-Executive Director
Ong Ai Lin
Independent Non-Executive Director
Dato’ Roslina binti Zainal
Independent Non-Executive Director(Redesignated as IndependentNon-Executive Director w.e.f. 28 April 2020)
Datuk Rawisandran a/l Narayanan
Independent Non-Executive Director (Appointed as Member w.e.f. 16 October 2020)
Dato’ Cheok Lay Leng
Independent Non-Executive Director (Appointed as Member w.e.f. 28 April 2020 and ceased as Member w.e.f. 1 October 2020)
The BAC was established to assist the Board to carry out its oversight and fiduciary duties and responsibilities.
BAC’s objectives, authorities and functions are governed by the TOR which was last reviewed in May 2019. The TOR is accessible on the Company’s official website at www.tnb.com.my
Membership and Meetings
As of 31 December 2020, the BAC comprises five (5) Independent Directors, all of whom are Non-Executive Directors. This composition is aligned with Paragraph 15.09 (1) (a) and (b) of the MMLR, which states that the Audit Committee must be composed of not fewer than three (3) members and all the Audit Committee members must be Non-Executive Directors, with a majority of them being Independent Directors.
The BAC continues to fulfil the practice stipulated in the MCCG, whereby the Chairman of BAC, Noraini binti Che Dan, is not Chairman of TNB Board.
The governance practices are further strengthened as the BAC fulfils the requirements of Paragraph 15.09 (1) (c) of MMLR. Two (2) members of the BAC, Noraini binti Che Dan and Ong Ai Lin, are members of the Malaysian Institute of Accountants (MIA).
During the Financial Year 2020, 14 BAC meetings were held. This satisfies Paragraph 8.1 of the BAC TOR which requires the Committee to meet at least six (6) times a year.
The Company Secretary who is the secretary to the BAC and the Chief Internal Auditor (CIA) were in attendance during the meetings. The President/CEO and other officers were invited to the meetings to deliberate on matters within their purview.
After each meeting, the BAC Chairman submits a report on matters deliberated to the Board of Directors for information and attention. Matters reserved for the Board’s approval are tabled at the Board meetings. Action sheets are issued by the Company Secretary on the decisions made and actions required. These are circulated to Management for their action.
KEY ROLES & RESPONSIBILITIES
For detailed roles & responsibilities of the Committee, please refer to “Our Board Practices” on page 84.
For details of meeting attendance of BAC members, kindly refer to page 84.
BOARD AUDIT COMMITTEE

p.104
TENAGA NASIONAL BERHAD
Principle B: Effective Audit and Risk Management
BOARD AUDIT COMMITTEE REPORT
Main Activities of BAC
During Financial Year 2020, the BAC executed various actions to discharge its responsibilities as outlined in the TOR. A summary of the principal activities performed by the BAC is as follows:
Internal Audit
i. Internal Audit Reports
· Deliberated on the internal audit reports for TNB and its subsidiaries issued by Group Internal Audit Department (GIA) on the adequacy and effectiveness of governance, risk management, and internal controls, as well as the audit recommendations and management responses towards the issues highlighted in the presence of Management. Amongst the reports presented during the year were corporate governance compliance, smart meter implementation and billing, management of meter replacement, capital expenditure and procurement of advanced metering infrastructure project, fraud and bribery risk (relevant to ISO 37001 certification), implementation of Personal Data Protection Act, operation and maintenance of Billing and Customer Relationship Management (BCRM) system, cloud computing management, ICT management, project management, security management, financial management, product quality, and procurement and contract management.
· Discussed the status of corrective actions (CA) on internal audit issues as well as actions taken by Management on matters arising from previous meetings.
· Reviewed TNB’s State of Internal Controls (SOIC) on a quarterly basis. The SOIC presented reflects the audit reports issued by GIA and coverage includes the following:- Audit completion status against the approved audits- Risks reviewed during audits- Results of internal control assessment covering areas with
critical findings- Status of CA including aging to indicate time taken to
complete the actions
ii. Annual Audit Plan
· Approved GIA’s revised Financial Year 2020 Annual Audit Plan to ensure pertinence in view of changes in business environment/operations due to COVID-19 pandemic and company restructuring as well as to meet requests from BAC and management.
· Approved GIA’s FY2021 Annual Audit Plan and reviewed GIA’s methodology in preparing a risk-based audit plan. In addition to the risks registered in TNB Risk Information System, GIA identified and analysed new and emerging risks that relate to the Company’s strategies and business resilience.
Based on the comprehensive process adopted by GIA, 158 audits were proposed to be conducted in FY2021 comprising 70 full audits, 78 follow-up audits and 10 surprise audits.
The plan was supported with detailed analysis of resource requirements including staffing, competencies as well as budgetary requirements.
iii. Internal Audit Governance
· On a quarterly basis, BAC reviewed the overall performance of GIA related to key audit activities and other achievements which include:- Percentage completion of the audit plan- Cycle time of audit completion- Contribution to the Company in terms of cost saving/recoveries
or business process improvements- Status of initiatives to inculcate high performance culture in the
department- Status of budget utilisation- Summary of trainings attended by auditors- Status of auditors’ professional developments/certifications
· BAC reviewed and endorsed the KPIs for GIA for FY2021 and results for FY2019 which were segmented into four (4) Balanced Scorecard perspectives, i.e. financial, customer, internal process, and learning & growth.
· BAC took note of GIA’s Quality Assurance and Improvement Programme (QAIP) for FY2020 which was established based on the results of internal assessment performed on GIA’s activities and processes. The assessment was conducted to fulfil the requirement stipulated in the Standards of International Professional Practices Framework (IPPF). Based on the assessment, areas for enhancement have been identified for continuous improvement of the internal audit activity.
· BAC took note of GIA’s Charter which was reviewed as part of the annual exercise. There were no changes made to the Internal Audit Charter as the existing Charter is deemed adequate and consistent with IPPF requirements.

p.105
INTEGRATED ANNUAL REPORT 2020
CREATING VALUE THROUGH STRONG GOVERNANCE
Principle B: Effective Audit and Risk Management
External Audit
· Reviewed the overall performance of the external auditor for the period from 1 January 2019 to 31 December 2019.For this purpose, a survey was coordinated by GIA and assessments on the effectiveness of the external auditor were performed by Members of BAC and Management. The external auditor’s (i) quality of service; (ii) sufficiency of resources; (iii) communication and interaction; and (iv) independence, objectivity and professional scepticism were assessed.
· Reviewed audit fees for quarterly review of the unaudited consolidated results and annual statutory audit of TNB and its subsidiaries for Board’s approval.
· BAC assessed the independence and objectivity of the external auditor by reviewing the fees and list of non-audit services provided by the external auditor to TNB and the Group. The non-audit services carried out by the external auditor were within the threshold set in TNB Implementation Guideline on Provision of Services by External Auditors.
· BAC exercised its rights, as stipulated in the TOR, to hold meetings with the external auditor without the presence of Management to enable open discussion with the BAC.
During the year, two (2) meetings were held with the external auditor without Management’s presence i.e. on 28 February 2020 and 27 August 2020.
Financial Results
· Reviewed the quarterly unaudited financial results of the Group and the draft announcements before recommending them for Board’s approval upon taking into account key developments during the year, significant accounting and review matters, and other matters.
· In March 2020, BAC endorsed and recommended the audited financial statement of the Company and Group for Financial Year ended 31 December 2019 for Board’s approval.
Related Party Transactions
· In February 2020, BAC reviewed and recommended to the Board to approve the related party/recurrent related party transactions entered into by TNB Group for the Financial Year ended 31 December 2019.
Annual Reporting
· BAC reviewed and endorsed the (i) BAC Report, (ii) Statement on Internal Audit Function, (iii) Statement of Risk Management and Internal Control, (iv) TNB Sustainability Statement, and (v) Corporate Governance Overview Statement and Corporate Governance Report for Board’s approval.
Others
· Reviewed the proposal for granting and vesting of performance shares as well as restricted shares under the Long Term Incentive Plan (LTIP) for Board’s approval.
· BAC took note of the Integrated Assurance Report for GIA and other assurance functions in TNB for FY2019. The report includes information pertaining to areas of coverage for audits as well as risks and controls covered by all assurance providers within the Company.
· Discussion on other key operational matters, as follows:- Credit management matters and strategies, specifically on
Collection Strategy for Revenue Protection.- Results of ad-hoc reviews performed on TNB’s overseas
investments to identify improvement opportunities in governance and controls.
- Results of strategic review performed on subsidiaries under Subsidiary Management Division intended to improve performance of the subsidiaries.
- Centralisation and enhancement of TNB’s contract documents/agreements storage.
- Summons/compounds imposed on TNB by regulatory authorities.
- Status of action plan on ownership of substation land.
NORAINI BINTI CHE DANChairman, Board Audit Committee Senior Independent Non-Executive Director

p.106
TENAGA NASIONAL BERHAD
Principle B: Effective Audit and Risk Management
BOARD RISK COMMITTEE REPORT
KEY ROLES & RESPONSIBILITIES
For detailed roles & responsibilities of the Committee, please refer to “Our Board Practices” on page 85.
The BRC was established on 5 June 2013 by the Board of Directors (Board) to assist the Board to carry out its responsibilities. The Board, through the BRC, is responsible for overseeing the effectiveness and adequacy of the Group’s risk management framework and to ensure that it forms part of the Group’s corporate culture.
How The Committee Operates
BRC meetings are pre-determined for the following financial year and are thereafter communicated to the members with specific meeting agenda prior to each meeting.
In the Financial Year 2020, there were seven (7) BRC sittings. Several meetings were held in a hybrid manner, i.e., face-to-face and virtually, in view of the COVID-19 pandemic. Prior to the meeting, BRC members were provided with papers approved for tabling and updates of outstanding matters from previous meetings for the members’ perusal.
The Chief Risk Officer and Company Secretary, who is also secretary to the BRC, attended the meetings. Other attendees, internal or external, were invited to deliberate on matters within their purview.
Action sheets were issued by the Company Secretary on decisions made and action required. These were circulated to Management for their further action. The BRC Chairman Reports were tabled at the Board meetings for notification and/or further deliberation on matters within the purview of the Board.
Main Activities of The BRC
Principal activities performed by the BRC during the Financial Year 2020 are summarised below: • Reviewed the Statement of Risk Management and Internal Control, which summarised the
risk management practices and internal controls implemented by Management. Assurances from the President/CEO and Chief Financial Officer were given to the Board that the Group’s risk management and internal control system is operating adequately and effectively, in all material aspects.
• Deliberated the Group’s key operational risks and key controls taken to manage the risks. Additional mitigations to strengthen the management of existing and emerging risks were recommended for further action.
• Reviewed and deliberated Key Risk Indicators (KRIs) that were reported quarterly through the TNB Risk Dashboard. Relevant business entities reported the status of action taken to mitigate potential adverse impacts.
• Reviewed reports on risk incidents and deliberated the adequacy and effectiveness of preventive and corrective action.
Risk Management
The BRC is assisted by the Chief Risk Officer and the Risk Management Department (RMD) in discharging its duties and responsibilities.
Frameworks
The RMD is responsible for the effective implementation of the TNB Risk Management Framework for informed decision-making. The objective of the framework is to set out a structured and consistent approach to risk management across the Group. The framework is developed in alignment with ISO 31000:2018 Risk Management – Guidelines and is subject to the independent assurance and assessment of the Group Internal Audit. The TNB Risk Management Framework consists of seven (7) elements with the purpose of risk management clearly depicted that is to create and protect value.
In addition, the RMD is the custodian of the TNB Business Continuity Management (BCM) Framework that is aligned with ISO 22301:2019 Security And Resilience – Business Continuity
Chairman
Ong Ai Lin
Independent Non-Executive Director(Appointed as Chairman w.e.f. 1 July 2020)
Members
Noraini binti Che Dan
Senior Independent Non-Executive Director
Juniwati Rahmat Hussin
Independent Non-Executive Director
Gopala Krishnan K.Sundaram
Independent Non-Executive Director
Datuk Rawisandran a/l NarayananIndependent Non-Executive Director(Appointed as Member w.e.f. 16 October 2020)
Gee Siew YoongIndependent Non-Executive Director(Ceased as Member w.e.f. 30 June 2020)
For the details of meeting attendance of BRC members, kindly refer to page 85.
BOARD RISK COMMITTEE

p.107
INTEGRATED ANNUAL REPORT 2020
CREATING VALUE THROUGH STRONG GOVERNANCE
Principle B: Effective Audit and Risk Management
Management Systems. The framework provides a structured approach in managing business continuity in the Group that enables prompt, coordinated and effective response to a crisis and maintain continuity of essential activities as well as protecting human life, assets, reputation and the environment. The framework is the focal point of reference for business entities in formulating and implementing BCM strategies and practices tailored to respective objectives and critical functions.
Implementation of the frameworks
The RMD provides advisory and facilitation to the Group in the implementation of the TNB Risk Management and BCM frameworks. The RMD is also committed to fulfilling specific services contracted through Service Level Agreements (SLAs) with business entities in the Group.
In the Financial Year 2020, the RMD continued to provide risk and business continuity management advisory and facilitation services utilising secured online platforms throughout the period of the COVID-19 pandemic and Movement Control Orders instituted by the Government. In spite of challenges in adapting to the ‘new normal’, the RMD successfully conducted meetings and workshops with cooperation from the business entities in the assessment of risks and development of business continuity strategies and plans.
Governance
In accordance with the TNB Risk Management Structure, risk matters are deliberated by the Group Risk Management Working Committee (GRMWC) and Subsidiaries Risk Management Working Committee (SRMWC). These committees function to ensure that a risk environment is firmly established in each business entity and sufficient resources are committed to the effective implementation and integration of risk management in all processes. As secretariats of these committees, the RMD, together with the Subsidiary Management Division, collates and reports the KRIs of the business entities, lessons learned from risk events and emerging risks for the committees’ deliberation.
In the Financial Year 2020, the RMD assessed the risk maturity of six (6) business entities with the objective of gauging the effectiveness of the implementation of the TNB Risk Management Framework and providing value-added recommendations for risk management improvements. In adapting to movement restrictions and standard operating procedures to curtail the spread of COVID-19 infections, the RMD introduced a Desktop Risk Assessment methodology to continue to provide assurance to Management and Board of the robustness of the implementation of the TNB Risk Management Framework. Desktop Risk Assessments for nine (9) business entities were completed by the RMD in the Financial Year 2020.
The effectiveness of the TNB BCM Framework is tested through drills and in the Financial Year 2020, two (2) communication drills and one (1) full-scale drill were carried out at the corporate level with involvement from President/CEO and C-suites, supported by BCM practitioners in the business entities. The full-scale drill was conducted virtually, in view of the COVID-19 pandemic situation. Drills to test preparedness of business entities in crisis scenarios such as floods, pandemic, cyber security intrusions and hydroelectric dam safety, are carried out according to plan and improvements identified in post-mortem reports are implemented to close gaps. In addition, in the Financial Year 2020, a third party was
appointed to provide independent assessment of the effectiveness of BCM implementation in TNB and to benchmark against international standards and practices in the utility and energy industry. Monitoring & Reporting
Risks that are identified or reviewed by business entities are registered and approved by relevant risk owners in the online and real-time TNB Risk Information System (TRIS). The RMD maintains the TRIS, which functions as a platform for monitoring and reporting. The risk registers in TRIS are accessible for viewing by all employees and additional access rights are assigned to relevant parties. These parties, such as risk owners and risk managers, are responsible for ensuring the quality and relevance of the risk information in TRIS.
In the Financial Year 2020, business entities across the Group submitted two (2) half-yearly risk reports to the RMD, reporting their risk profiles, key mitigations, KRIs, lessons learned from risk events and emerging risks unique to their business. The RMD thereafter collates and reports the TNB Half-Year Risk Reports to Management as a holistic perspective of the Group’s strategic, operational and emerging risks.
KRI that provide early warning signals of increasing risk exposures and potential risk events are identified, monitored and reported by the business entities. KRIs are developed in alignment with the risk appetite of the BRC and Management and are monitored and reported to the BRC, GRMWC and SRMWC. KRIs are reviewed annually to ensure relevance to current business objectives, taking into account changes in the internal and external context.
Training
Risk management trainings at fundamental and intermediate levels are conducted by the RMD and administered by TNB Integrated Learning Solution Sdn. Bhd. to increase the risk competency of employees across the Group. In the Financial Year 2020, 152 executives completed the risk management fundamentals training and seven (7) executives the intermediate level.
As training classes and conferences were suspended during the Movement Control Orders in the Financial Year 2020, the RMD held 30-minute webinars with topics ranging from the principles and application of risk management and BCM frameworks, and lessons learned from past risk events and crisis. 16 webinars were successfully conducted and attended by approximately 880 participants.
Conclusion
The BRC continues to diligently exercise its risk oversight responsibilities by ensuring that risk management is an integral part of strategic planning and decision making for the achievement of the Group’s strategic outcomes and long-term objectives.
This statement was made in accordance with the resolution of the Board of Directors dated 26 February 2021.
p.108
TENAGA NASIONAL BERHAD
INTERNAL AUDIT FUNCTION
TNB’s internal audit function, which falls under the purview of the GIA, has been established by the Board to provide independent, objective assurance and consulting services designed to add value and improve TNB’s operations.
GIA is currently headed by Rosli bin Mohd Rose, who is the Chief Internal Auditor (CIA). He joined GIA as the Deputy CIA (Core Business) in 2006 and was appointed as the CIA in 2014. He holds a Degree of Electrical and Electronic Engineering from Brighton Polytechnic (currently known as University of Brighton), United Kingdom and a Master of Engineering from Universiti Tenaga Nasional, Malaysia. Prior to joining GIA, he had extensive experience in various aspects of TNB operations such as operations and maintenance, project management, asset management, human resources, and business development. Additionally, he is an associate member of the Institute of Internal Auditors Malaysia.
Practices and Framework
GIA endeavours to enhance and protect organisational value by providing risk-based and objective assurance, advice and insight. GIA helps TNB to accomplish its objective by bringing a systematic, disciplined approach to evaluate and improve the effectiveness of governance, risk management and control processes.
GIA is guided by the Internal Control Framework of Committee of Sponsoring Organisation of the Treadway Commission (COSO) and Control Objectives for Information and Related Technology (COBIT) in assessing and reporting the adequacy and effectiveness of the design and implementation of the organisation’s overall system of internal control, risk management and governance.
Additionally, to effectively manage its functions and perform the audit engagements, GIA adopts the standards and principles outlined in the IPPF issued by the Institute of Internal Auditors (IIA), which comprises Core Principles for the Professional Practice of Internal Auditing, International Standards for the Professional Practice of Internal Auditing, Definition of Internal Auditing and Code of Ethics.
Scope and Coverage
GIA’s responsibilities and scope of internal audit activities are outlined in the Internal Audit Charter which was approved by the BAC. The Internal Audit Charter is reviewed annually to ensure relevance and alignment with the requirements of IPPF.
GIA continues to formulate the annual audit plan using a risk-based approach, taking into consideration TNB’s risk profile, strategic objectives, regulatory requirements as well as inputs from BAC and Senior Management.
Amongst the key areas reviewed during the Financial Year 2020 were corporate governance compliance, whistleblowing management, operations and maintenance, accounting and financial management, procurement and contract management, project management, smart meter operations, management of meter reading, meter replacement and tampering, supply application, IT security and governance, major initiatives management, application of drone technology, product quality, genset management, asset management, inventory management, disconnection management, workforce planning, and compliance management.
The Financial Year 2020 Annual Audit Plan was also reviewed, considering risks that emerged from the COVID-19 pandemic. Based on the audits carried out in Financial Year 2020, amongst the key risks covered are accident leading to fatality/injuries and property damage, non-compliance with related regulatory requirements and Company policies, fraud & bribery risk, critical equipment failure causing major blackout, poor performance of appointed contractors, loss of business data, slow movement of inventory, cyber security threat, and inability to deliver Company initiatives and targets.
During the Financial Year 2020, GIA issued a total of 167 reports arising from 70 planned audits, one (1) ad-hoc audit, 11 surprise audits, one (1) external assessment on compliance function and 84 follow-up audits. Internal audit reports with significant improvement opportunities were presented to the BAC for deliberation whilst others were reported in the quarterly reporting to BAC. Subsequently, GIA continuously monitored the implementation of corrective actions through an online platform, i.e. Audit Management System, and reported on the status to BAC on a quarterly basis.
In providing value to the Company, the internal auditors’ KPIs include value creation in terms of cost saving/recoveries or business process improvements. BAC reviews the achievements of GIA on a quarterly basis.
In addition to the audit engagement performed, GIA was also actively involved in strengthening the compliance functions in the Company through sharing of best practices and knowledge on internal auditing, risk management and internal controls.
Principle B: Effective Audit and Risk Management
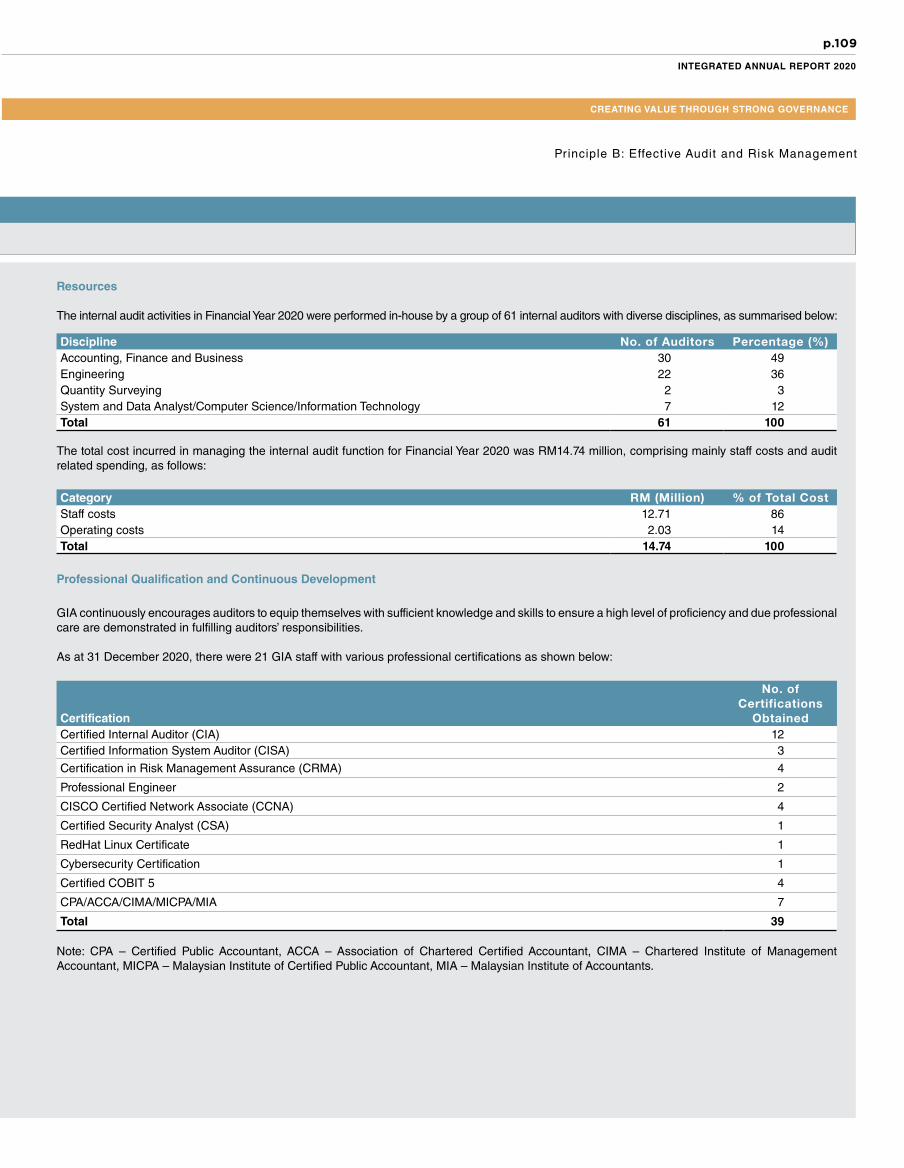
p.109
INTEGRATED ANNUAL REPORT 2020
CREATING VALUE THROUGH STRONG GOVERNANCE
Resources
The internal audit activities in Financial Year 2020 were performed in-house by a group of 61 internal auditors with diverse disciplines, as summarised below:
Discipline No. of Auditors Percentage (%)Accounting, Finance and Business 30 49 Engineering 22 36 Quantity Surveying 2 3System and Data Analyst/Computer Science/Information Technology 7 12Total 61 100
The total cost incurred in managing the internal audit function for Financial Year 2020 was RM14.74 million, comprising mainly staff costs and audit related spending, as follows:
Category RM (Million) % of Total CostStaff costs 12.71 86Operating costs 2.03 14Total 14.74 100
Professional Qualification and Continuous Development
GIA continuously encourages auditors to equip themselves with sufficient knowledge and skills to ensure a high level of proficiency and due professional care are demonstrated in fulfilling auditors’ responsibilities.
As at 31 December 2020, there were 21 GIA staff with various professional certifications as shown below:
Certification
No. of Certifications
ObtainedCertified Internal Auditor (CIA) 12Certified Information System Auditor (CISA) 3
Certification in Risk Management Assurance (CRMA) 4
Professional Engineer 2
CISCO Certified Network Associate (CCNA) 4
Certified Security Analyst (CSA) 1
RedHat Linux Certificate 1
Cybersecurity Certification 1
Certified COBIT 5 4
CPA/ACCA/CIMA/MICPA/MIA 7
Total 39
Note: CPA – Certified Public Accountant, ACCA – Association of Chartered Certified Accountant, CIMA – Chartered Institute of Management Accountant, MICPA – Malaysian Institute of Certified Public Accountant, MIA – Malaysian Institute of Accountants.
Principle B: Effective Audit and Risk Management

p.110
TENAGA NASIONAL BERHAD
In addition to the above, 31% (19 auditors) are in the midst of pursuing their professional certifications at various levels.
GIA commits to ensure that the level of auditors’ skills, knowledge and competencies are maintained as stipulated in GIA’s Charter. These are accomplished through the following:
• Involvement of auditors in conferences and trainings in the area of auditing, strategic initiatives, leadership and communication, business acumen, data analytics, and personal development.
• Conducted in-house briefing session or knowledge sharing on IIA’s Code of Ethics and IPPF to keep auditors updated on the required practices and rules of conduct.
• Promote continuous learning through subscription to online training modules focusing on audit processes, accounting issues, fraud and internal control practices at Gartner’s platform, world’s leading research and advisory company.
• Implemented rotation among auditors at different levels to provide exposure on new audit areas.
As of 31 December 2020, GIA incurred a total cost of RM256,307 on training and conferences.
Summary of GIA’s Activities In FInancial Year 2020
The following were the key activities undertaken by GIA in Financial Year 2020:
• Provided independent and objective assurance on the adequacy of internal controls implemented to mitigate risk exposures. The reports on audits performed, which consist of observations and issues, management responses, deadlines and person in charge for implementation of corrective actions, have been issued to respective auditees, Senior Management and BAC.
• Performed follow-up audits on corrective actions agreed by Management to assess if the actions have been implemented adequately and in a timely fashion. Starting from July 2020, GIA has initiated a Corrective Action League Table that is presented to Top Management on a quarterly basis.
• Presented TNB’s State of Internal Controls to BAC on a quarterly basis and coverage includes the following:- Audit completion status against the approved audits.- Risks reviewed during audits.- Results of internal control assessment covering areas with
critical findings.- Status of corrective actions including aging to indicate time
taken to complete the actions.• Coordinated and attended meetings with RMD to deliberate on
emerging risks and relevant mitigation plans. Coordination meetings were also conducted with the external auditor to discuss audit scope/issues to ensure adequate coverage or minimise duplication of effort.
• Held discussions with heads of divisions/departments to seek their views on areas of concern or risks that could impede the achievement of their business objectives. The input received was incorporated as part of the Annual Audit Plan for Financial Year 2021.
• Developed and maintained a Quality Assurance and Improvement Programme (QAIP), which was established based on the results of internal assessment performed on GIA’s activities and processes. The assessment was conducted to fulfil the requirements stipulated in the Standards of IPPF.
• Initiated the first Integrated Assurance Report whereby the objective is to provide assurance on risks and controls reviewed by internal audit and other assurance providers such as compliance departments and health, safety and environment function. The report was then presented to the BAC and is to be performed biannually.
• Conducted knowledge sharing on data analysis to TNB staff covering introductory to data analytics, examples of analysis, and use of data analytics tools for data visualisation.
• Assisted in transferring auditors to other divisions/departments to support Management in strengthening internal controls by leveraging the knowledge of the auditors.
• Participated in networking sessions with internal audit functions of other Government Linked Companies such as Petronas, Malaysia Airlines Berhad, and Boustead Holdings Berhad.
• Upheld TNB’s value of mindfulness by contributing to needful communities through GIA’s Corporate Social Responsibility (CSR) programme.
ROSLI BIN MOHD ROSE Chief Internal Auditor
NORAINI BINTI CHE DAN Chairman, Board Audit CommitteeSenior Independent Non-Executive Director
Principle B: Effective Audit and Risk Management

p.111
INTEGRATED ANNUAL REPORT 2020
CREATING VALUE THROUGH STRONG GOVERNANCE
Principle C: Integrity in Corporate Reportingand Meaningful Relationship with Stakeholders
Corporate Disclosure Policy
The Corporate Disclosure Policy, as well as associated guidelines,
reinforces TNB’s commitment to continuous disclosure and outlines
Management’s accountabilities and the processes to be followed in
ensuring compliance.
TNB’s practice is to release all price-sensitive information to Bursa
Malaysia Securities Berhad in a timely manner as required under
the MMLR and to the market and community generally through
announcements to Bursa Malaysia Securities Berhad, TNB’s media
releases, website and other appropriate channels.
For disclosure purposes, price-sensitive information is information that
a reasonable person would expect to have material effect on the price
or value of TNB’s securities. The Company Secretary is responsible
for reviewing proposed disclosures and making decisions in relation
to the disclosure of information to the market. Each division in TNB
is required to inform the Company Secretary of any potential price-
sensitive information concerning TNB as soon as this becomes known.
Annual General Meeting
The Board ensures that shareholders are given sufficient notice and
time to consider the resolutions that will be discussed and decided
at the AGM. The AGM Notice includes explanatory notes that contain
further information on the proposed resolutions.
Subsequent to the 30th AGM Notice issued on 10 April 2020, due to
the uncertainty of COVID-19 situation in Malaysia, the Government of
Malaysia’s directive on social distancing and restriction on mass gathering
as well as in ensuring shareholders’ well-being and safety remain the
Company’s priority, the Company’s 30th AGM was held for the first time
fully virtual via Remote Participation and Voting (RPV) on 30 June 2020
at the Broadcast Venue: Dewan Seminar, Kompleks Balai Islam
An-Nur, Ibu Pejabat Tenaga Nasional Berhad, No. 129, Jalan Bangsar,
59200 Kuala Lumpur, Malaysia.
The Notification to Shareholders on the Company’s fully virtual 30th
AGM and amendment to the Company’s 30th AGM Notice & Proxy Form
were issued to shareholders on 29 May 2020, more than 28 days before
the meeting. The Amended Notice of AGM was also published in two
(2) local English and one (1) Malay newspapers, as per earlier notices.
TNB also sent Short Message Service (SMS) and emails to registered
shareholders and additionally, it was made available on TNB’s website
at www. tnb.com.my
It has been the Company’s practice since 2017, to issue the Notice of
AGM at least 28 days prior to the meeting.
TNB’s fully virtual 30th AGM was attended by the Top Management and
Directors excluding Datin Rashidah binti Mohd Sies, who was unable
to attend due to a prior official engagement. A total of 409 shareholders
and proxies representing 3,779,521,696 ordinary shares participated
online as per the Attendance Record issued by TNB’s Share Registrar.
The President/CEO briefed on the Company’s financial and technical/
operational highlights before the responses to the Minority Shareholders
Watch Group queries were shared by himself and the BNRC Chairman.
The Chairman later dealt with the formal business of the Meeting.
During the Meeting, the Chairman encouraged the shareholders to post
questions to the Board and Management on the proposed resolutions
tabled at the AGM.
The President/CEO responded to all questions raised by the
shareholders during the Question & Answer session upon completion
of the remaining business of the AGM.
The 30th AGM was conducted online via BoardRoom’s LUMI AGM.
Shareholders/proxies were able to view the live webcast of the AGM
proceedings, post questions to the Board/Management and submit their
votes in real-time whilst the meeting was in progress. The procedures
for RPV facilities were explained in the Administrative Details of 30th
AGM issued to the shareholders on 29 May 2020.
All resolutions set out in the Amended Notice of the 30th AGM were
tabled and approved by the shareholders. All resolutions were voted by
poll and the results were validated by Boardroom Corporate Services
Sdn. Bhd., the independent scrutineer appointed by the Company. The
outcomes of voting on the proposed resolutions were disclosed to the
market and posted on the Company’s website after the AGM.
The proceedings of the AGM was recorded in the minutes of meeting
and made available on TNB’s website at www.tnb.com.my
The Engagement Partner of Messrs PricewaterhouseCoopers PLT
(PwC) was also in attendance at the AGM to answer shareholders’
questions on the conduct of the audit, the preparation and content of
the audit report, the accounting policies adopted by the Company and
the independence of auditors in the audit process.

p.112
TENAGA NASIONAL BERHAD
Annual General Meetings
10 April 2020
Notice of 30th Annual General Meeting and Issuance of Integrated Annual Report 2019 and Corporate Governance & Financial Statements 2019 for the Financial Year ended 31 December 2019
29 May 2020
Notification to Shareholders on Fully Virtual 30th Annual General Meeting and Amended Notice of Fully Virtual 30th Annual General Meeting & Proxy Form
30 June2020
Fully Virtual 30th Annual General MeetingDividends
30 September 2020
Entitlement Date
14 October 2020
Payment Date
31 March 2021
Entitlement Date
16 April2021
Payment Date
Interim Single-Tier Dividend of 22.0 sen per ordinary share for the Financial Year ended 31 December 2020
Final and Special Single-Tier Dividends of 18.0 sen and40.0 sen per ordinary share respectively for the Financial Year
ended 31 December 2020
Principle C: Integrity in Corporate Repor ting and Meaningful Relationship with Stakeholders
In line with the Group’s commitment to the environment, in promoting sustainable practice as well as to achieve greater cost efficiencies, TNB
encourages its shareholders to go paperless and access the digital copy of TNB’s Integrated Annual Report 2020 for perusal by downloading it from
the Company’s website at www.tnb.com.my
We are also forwarding postcards with QR code, consisting of the Notice of 31st AGM, Administrative Details of the 31st AGM, Integrated Annual Report
2020 and Proxy Form to the shareholders, which are also available at the Company’s website at www.tnb.com.my
Financial Reporting
The Board aims to provide a clear, balanced and comprehensive assessment of the Group’s financial performance and prospects to shareholders,
investors and relevant regulatory authorities via the quarterly financial reports, audited financial statements, annual reports and other reports or
statements as well as through material disclosures made in accordance with the MMLR.
The BAC assists the Board in overseeing the integrity of the Group’s financial reporting, including the operation of the financial reporting processes.
The processes are aimed at providing assurance that the financial statements and related notes are completed in accordance with applicable legal
requirements and accounting standards and give a true and fair view of the Group’s financial position.
Financial Calendar
Announcements of Consolidated Results
28 August 2020
26 November 2020
Unaudited consolidated results for the second (2nd) quarter ended 30 June 2020
Unaudited consolidated results for the third (3rd) quarter ended 30 September 2020
Unaudited consolidated results for the fourth (4th) quarter ended 31 December 2020
10 June 2020
Unaudited consolidated results for the first (1st) quarter ended 31 March 2020
26 February 2021
9 April2021
Notice of Fully Virtual 31st Annual General Meeting and Issuance of Integrated Annual Report and Audited Financial Statements for the Financial Year ended 31 December 2020
Fully Virtual 31st Annual General Meeting10 May2021
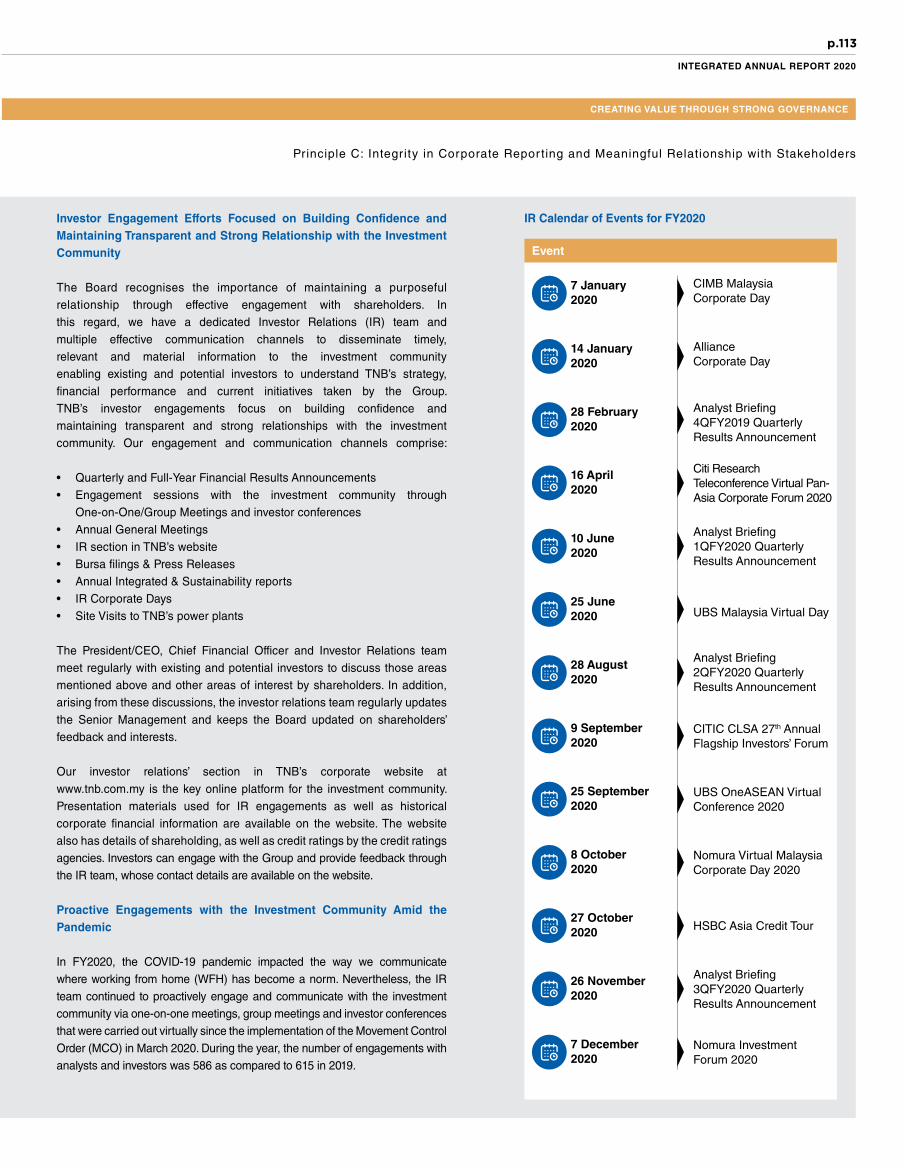
p.113
INTEGRATED ANNUAL REPORT 2020
CREATING VALUE THROUGH STRONG GOVERNANCE
Principle C: Integrity in Corporate Repor ting and Meaningful Relationship with Stakeholders
Event
7 January 2020
10 June 2020
25 September 2020
28 February 2020
28 August 2020
27 October 2020
14 January 2020
25 June 2020
8 October 2020
16 April 2020
9 September 2020
26 November 2020
7 December 2020
CIMB MalaysiaCorporate Day
Analyst Briefing 1QFY2020 Quarterly Results Announcement
CITIC CLSA 27th Annual Flagship Investors’ Forum
Analyst Briefing4QFY2019 Quarterly Results Announcement
Analyst Briefing 2QFY2020 Quarterly Results Announcement
Analyst Briefing 3QFY2020 Quarterly Results Announcement
AllianceCorporate Day
UBS Malaysia Virtual Day
HSBC Asia Credit Tour
Nomura Virtual Malaysia Corporate Day 2020
Citi Research Teleconference Virtual Pan-Asia Corporate Forum 2020
UBS OneASEAN Virtual Conference 2020
Nomura Investment Forum 2020
Investor Engagement Efforts Focused on Building Confidence and Maintaining Transparent and Strong Relationship with the Investment Community
The Board recognises the importance of maintaining a purposeful relationship through effective engagement with shareholders. In this regard, we have a dedicated Investor Relations (IR) team and multiple effective communication channels to disseminate timely, relevant and material information to the investment community enabling existing and potential investors to understand TNB’s strategy, financial performance and current initiatives taken by the Group. TNB’s investor engagements focus on building confidence and maintaining transparent and strong relationships with the investment community. Our engagement and communication channels comprise:
• Quarterly and Full-Year Financial Results Announcements• Engagement sessions with the investment community through
One-on-One/Group Meetings and investor conferences • Annual General Meetings• IR section in TNB’s website• Bursa filings & Press Releases• Annual Integrated & Sustainability reports • IR Corporate Days• Site Visits to TNB’s power plants
The President/CEO, Chief Financial Officer and Investor Relations team meet regularly with existing and potential investors to discuss those areas mentioned above and other areas of interest by shareholders. In addition, arising from these discussions, the investor relations team regularly updates the Senior Management and keeps the Board updated on shareholders’ feedback and interests.
Our investor relations’ section in TNB’s corporate website at www.tnb.com.my is the key online platform for the investment community. Presentation materials used for IR engagements as well as historical corporate financial information are available on the website. The website also has details of shareholding, as well as credit ratings by the credit ratings agencies. Investors can engage with the Group and provide feedback through the IR team, whose contact details are available on the website.
Proactive Engagements with the Investment Community Amid the Pandemic
In FY2020, the COVID-19 pandemic impacted the way we communicate where working from home (WFH) has become a norm. Nevertheless, the IR team continued to proactively engage and communicate with the investment community via one-on-one meetings, group meetings and investor conferences that were carried out virtually since the implementation of the Movement Control Order (MCO) in March 2020. During the year, the number of engagements with analysts and investors was 586 as compared to 615 in 2019.
IR Calendar of Events for FY2020

p.114
TENAGA NASIONAL BERHAD
RESEARCH ANALYSTS/RESEARCH HOUSES
Affin Hwang Investment Bank
AmInvestment Bank
Bank of America Merrill Lynch
CGS-CIMB Securities
Citi Research CLSA
Credit SuisseHong Leong
Investment BankJ.P. Morgan
KAF-Seagroatt & Campbell Securities
Kenanga Investment Bank
Macquarie Capital Securities
Maybank Investment Bank
MIDF Amanah Investment Bank
Morgan Stanley Research
Nomura
Public Investment Bank
RHB TA Securities UBS Global Research
UOB KayHian Securities
AllianceDBS Research
Principle C: Integrity in Corporate Repor ting and Meaningful Relationship with Stakeholders
Investment Community’s Feedback
Based on IR’s engagement sessions with the investment community, the key areas of interest includes:
• Impact of COVID-19 and MCO on energy consumption in Malaysia • Business strategy and performance• Renewable Energy growth opportunities• Environmental, Social and Governance (ESG) and sustainability pathway • Regulatory development – RP2 Extension and RP3• Development on Internal Reorganisation • Earnings and dividend prospects
Building Long-Term Shareholder Value
In 2020, TNB’s Board of Directors approved a final single-tier dividend of 18.0 sen per share, raising the single-tier dividend total to 40.0 sen per share. This translates to a dividend payout ratio of 58.5% from the Group’s Adjusted PATAMI, effectively hitting the higher tier of the company’s 30% to 60% dividend policy consistently for the last four (4) financial years.
In addition, TNB’s Board of Directors also approved a special dividend of 40.0 sen per share, bringing the total dividend per share to 80.0 sen, amounting to RM4.56 billion.
Analyst coverage
As one of the largest companies on Bursa Malaysia by market capitalisation, we have wide coverage from the investment community with a total of 22 sell-side research analysts covering the stock of which 46% are from foreign research houses.
We maintain strong links with our analysts to ensure that all information which flows to the market is accurate and consistent with the Company’s performance and latest developments.

p.115
INTEGRATED ANNUAL REPORT 2020
CREATING VALUE THROUGH STRONG GOVERNANCE
Principle C: Integrity in Corporate Repor ting and Meaningful Relationship with Stakeholders
Share Price Performance
TNB SHARE PRICE, FBM KLCI INDEX AND VOLUME TRADED IN FY2020
Share Price (RM) KLCI Index
14.5
14.0
13.5
13.0
12.5
12.0
11.5
11.0
10.5
10.0
9.5
9.0
1,700.0
1,650.0
1,600.0
1,550.0
1,500.0
1,450.0
1,400.0
1,350.0
1,300.0
1,250.0
1,200.0
Jan
20
Feb
20
Mar
20
Apr
20
May
20
Jun
20
Jul 2
0
Aug
20
Sep
20
Oct
20
Nov
20
Dec
20
Note: AB = Analyst Briefing Results Announcement KLCI TNB Share Price
28 Feb ’20AB 4QFY’19Closing Share Price:RM12.10
10 June ’20AB 1QFY’20Closing Share Price: RM11.96
16 Apr ’20Announcement made to Bursa Malaysia on Final divided date for FY2019
Closing Share Price: RM12.24
14 Oct ’20Announcement made to Bursa Malaysia on interim dividend date Closing Share Price: RM10.08
26 Nov ’20AB 3QFY’20Closing Share Price: RM11.00
28 Aug ’20AB 2QFY’20
Closing Share Price: RM10.86
Volume
90.0
85.0
80.0
75.0
70.0
65.0
60.0
55.0
50.0
45.0
40.0
35.0
30.0
25.0
20.0
15.0
10.0
5.0
0.0
Jan
20
Feb
20
Mar
20
Apr
20
May
20
Jun
20
Jul 2
0
Aug
20
Sep
20
Oct
20
Nov
20
Dec
20
Volume
p.116
TENAGA NASIONAL BERHAD
Principle C: Integrity in Corporate Repor ting and Meaningful Relationship with Stakeholders
Shareholder Information
As at 31 December 2020, Khazanah Nasional Berhad remained as our largest shareholder, with 25.7% of shareholding. Other Government related agencies cumulatively holds 45.0% with Permodalan Nasional Berhad at 18.5%, Employees Provident Fund Board at 17.7%, Kumpulan Wang Persaraan (Diperbadankan) at 7.3% while others at 1.5%. The balance 29.3% are held by other local corporations, Malaysian retail and foreign shareholders.
Based on the geographical spread of our foreign shareholding, the largest shareholding base is North America at 41.3%, followed by our shareholders from Asia (excluding Malaysia) and Europe, which accounted for 38.6% and 20.0% of the shares respectively.
Page 14 for more information.
Relationship with External Auditors
The Board maintains a transparent and professional relationship with the External Auditors, with the BAC responsible for recommending the appointment or removal of the External Auditors, the approval of their remuneration and the terms of their engagement to the Board.
The Board and the BAC are responsible for reviewing, assessing and monitoring the performance, suitability and independence of External Auditors. The Board has set a policy on External Auditors which stipulates the guidelines and procedures for the Board and the BAC to assess and monitor the performance and independence of the External Auditors.
The policy covers Selection and Appointment, Independence, Conflict of Interest, Non-Audit Services, Rotation of Audit Partner (applies to lead audit engagement partner), Annual Reporting, Annual Assessment and Audit Fees.
The appointed Audit Partner by the External Auditors is subject to rotation at least every five (5) financial years.
The External Auditors can also be engaged to perform non-audit services provided such services do not impair either in fact or appearance, the auditors’ objectivity, judgment or independence. The External Auditors are required to provide their written assurance of meeting the independence requirements for each non-audit service undertaken by them for TNB Group.
The prohibition of non-audit services is based on three (3) basic principles, namely that the External Auditors cannot function in the role of Management; cannot audit their own work; and cannot serve in an advocacy role of TNB Group.
The External Auditors shall observe and comply with the By-Laws of MIA in relation to the provision of non-audit services and, if necessary, apply safeguards as stipulated in the By-Laws of MIA.
The BAC assists the Board in assessing whether the independence of External Auditors has been maintained, having regard to any non-audit related services. The BAC considered the provision of non-audit fees by the External Auditors for the non-audit services provided to the Group and the Company during the Financial Year and concluded that the provision of these fees does not compromise or impair the External Auditors’ independence or objectivity.

p.117
INTEGRATED ANNUAL REPORT 2020
CREATING VALUE THROUGH STRONG GOVERNANCE
Principle C: Integrity in Corporate Repor ting and Meaningful Relationship with Stakeholders
The Auditors’ Remuneration including Non-Audit Fees for the Company and the Group for the Financial Year ended 31 December 2020 is as follows:
GroupRM ‘Million
Company RM ‘Million
Statutory Audit 4.8 1.8Audit Related Services 2.2 2.2Total 7.0 4.0Non-Audit Services:- Tax Related Services 0.5 0.0- Other Non-Audit Services 0.2 0.2Total 0.7 0.2
The Non-Audit Fees did not exceed 50% of the Audit Fees for the Financial Year under review, in line with TNB’s External Auditors Policy.
All services were procured competitively in accordance with TNB’s Procurement & Supply Chain Policy and Procedures and External Auditors Policy. Non-audit services can be offered by the External Auditors of the Group if there are clear efficiencies and value added benefits to the Group.
Based on the External Auditors Assessment Results for the Financial Year 2020, overall, the Company was highly satisfied/satisfied by 91.7% with the services provided by PwC in term of quality, sufficiency of resources, communication and interaction and independence, objectivity and professional skepticism. All comments made shall be forwarded to PwC by the Chief Financial Officer and Chief Internal Auditor to further improve their services.
With that, the Board/BAC are satisfied with the quality of service, sufficiency of resources, communication and interaction and independence, objectivity and professional skepticism demonstrated by PwC in carrying out its duties as External Auditors.
Being satisfied with the External Auditors’ performance, the Board recommends their re-appointment for shareholders’ approval at the AGM.
Insider Trading
The Directors and Top Management of TNB are prohibited from trading in securities or any kind of price-sensitive information and knowledge which have not been publicly announced, in accordance with the MMLR and relevant provisions of the Capital Markets & Services Act 2007. Notices on the closed period for trading in TNB’s securities are circulated on a quarterly basis in advance of each closed period, to Directors and Top Management who are deemed to be privy to any price-sensitive information and related actions.
Promoting Sustainability
The Board recognises that the Company’s stakeholders are increasingly interested in understanding its approach and performance in embedding sustainability in the organisation.
For this Financial Year, TNB has published a Sustainability Statement which discloses TNB’s efforts and initiatives in managing its material economic, environmental and social risks and opportunities. The reporting is guided by the Global Reporting Initiative (GRI) standard. The Sustainability Statement is on pages 125 to 168 of the Integrated Annual Report.
RESPONSIBILITY STATEMENT IN RESPECT OF THE FINANCIAL YEAR UNDER REVIEW
The Board is fully accountable for ensuring the Audited Financial Statements are prepared in accordance with the Companies Act 2016 and the applicable approved accounting standards set out by the Malaysian Accounting Standards Board so as to present a true and fair view of the Group’s state of affairs and of the profit or loss and cash flow as at the end of the accounting period.
In preparing the Audited Financial Statements, the Directors are satisfied that the applicable approved accounting standards in Malaysia have been complied with and reasonable and prudent judgements and estimates have been made. The Audited Financial Statements are also prepared on a going concern basis as the Board has a reasonable expectation, after having made enquiries, that the Group has adequate resources to continue its operational existence for the foreseeable future.

p.118
TENAGA NASIONAL BERHAD
Statement on Risk Management and Internal Control
Paragraph 15.26(b) of the MMLR requires a listed issuer to ensure that its board of directors makes a statement in its annual report about the state of internal control of the listed issuer as a group. Accordingly, the TNB Board of Directors is pleased to provide the following statement that has been prepared, and jointly endorsed by the BRC and BAC, for purposes of disclosure, in accordance with the Statement on Risk Management and Internal Control: Guidelines for Directors of Listed Issuers endorsed by Bursa Malaysia Securities Berhad.
This Statement outlines the nature and scope of the risk management and internal control systems within TNB Group during the year under review. The scope of this disclosure excludes associated companies and joint ventures.
The Board affirms its overall responsibility for the adequacy and effectiveness of the Group’s risk management and internal control systems. These systems are designed to manage rather than eliminate risks and therefore provides reasonable rather than absolute assurance against material losses, misstatements or other significantly adverse consequences.
COVID-19 Pandemic
The Group’s risk management and internal control systems were put to test to ensure continuity of operations and effective mitigation of risks in the management of the COVID-19 pandemic. The TNB Business Continuity Management (BCM) Framework provided a structured approach to ensure business continuity by enabling coordinated and prompt responses for continuity of critical operations while protecting human life, assets, brand and reputation.
Preparatory measures have been taken since January 2020 in view of the fast spreading human-to-human transmission of COVID-19 in China and neighbouring countries. A taskforce, led by the Chief People Officer and Chief Risk Officer, was formed to enhance the Group’s preparedness in anticipation of the virus spreading to Malaysia. The corporate BCM secretariat, in collaboration with the Group’s critical operations, had enhanced relevant business continuity plans with the following objectives:
• Ensure availability and reliability of electricity supply to the nation.• Safeguard the safety and health of all employees. • Effective communication of COVID-19 related matters.
In addition, a desktop drill was carried out on 31 January 2020 to test the plans and crisis management team’s response to COVID-19 scenarios. Additional preparatory mitigations include split team arrangement for critical operations, preparations for work from home for non-critical employees, strict access controls with temperature screening, supply of masks and sanitisers to employees serving customers and intensified sanitisation of TNB premises.
Since March 2020, a crisis response team led by Chief People Officer as the crisis commander, has been activated to manage the pandemic and ensure continuity of business, especially during the Movement Control Order implemented nationwide. Decisions were made in relation to providing care to employees and families affected by COVID-19, such as provisions of essential items and groceries while under home quarantine, issuance of guidelines for split teams and working from home
for non-critical employees, enhancement of ICT facilities for continued productivity and internal communication providing advisory, updates and reminders to comply with safety measures. Special management meetings chaired by the President/CEO were held to make strategic decisions and provide direction, as well as communication to the Board and relevant stakeholders.
The Board and Management are committed towards ensuring the availability and reliability of electricity supply to the nation whilst safeguarding the safety and health of employees and their families throughout the pandemic.
Board & Management Committees
The Board and Management continue to ensure the adequacy and effectiveness of the Group’s risk management and internal control systems through various committees executing their responsibilities as stipulated in the terms of reference.
The following Board Committees were established to play oversight roles in promoting governance, transparency and accountability:
• Board Audit Committee• Board Finance and Investment Committee• Board Tender Committee• Board Nomination and Remuneration Committee• Board Risk Committee• Board Long Term Incentive Plan Committee• Board Integrity Committee
Additionally, the following Management Committees are in place to implement and execute the Group’s risk management and internal control systems for the achievement of short-term and long-term business objectives:
• Group Executive Management Committee• Group People Committee• Group Management Tender Committee• Commodity Procurement Executive Committee• Incentive Based Regulation Council • Investment Executive Committee• Information and Communication Technology Governance Council• Health, Safety and Environment Steering Committee• Energy Supply Committee• Sustainability Development Committee
RISK MANAGEMENT
The Group adopts the principles and guidelines set out in ISO 31000:2018, ‘Risk Management – Guidelines’ in the design and implementation of the TNB Risk Management Framework. The framework was approved by the BRC in January 2019 for implementation across the Group.
The objective of the TNB Risk Management Framework is to provide a structured and consistent approach to risk management across the Group for informed decision-making. The purpose of risk management is to create and protect value and this is exemplified through each element in the TNB Risk Management Framework.

p.119
INTEGRATED ANNUAL REPORT 2020
CREATING VALUE THROUGH STRONG GOVERNANCE
The establishment of the BRC reaffirms the Board’s commitment to ensuring that the Group has in place a sound and robust enterprise risk management framework and that such framework has been effectively implemented to enhance the Group’s ability to achieve its strategic objectives. The BRC is supported by Management through the Group Executive Management Committee chaired by the President/CEO, the Group Risk Management Working Committee and the Subsidiaries Risk Management Working Committee, as well as the RMD, which is led by the Chief Risk Officer.
In the year under review, the BRC convened seven (7) sittings to deliberate risk issues and key risk indicators as well as to review the effectiveness of appropriate systems to manage risks. Business entities provided assurance to the BRC of their risk management and internal controls, assisting the Board in its decision-making, especially in the management of potential risks that may prevent TNB from achieving its Reimagining TNB strategies.
Risk Management Policy
The TNB Risk Management Policy is a statement of the overall intention and direction of the Group on risk management. It describes the commitment of the Group to assess risks in alignment with business objectives, integrating risk management in all decision-making processes, anticipating potential risks in response to changes in the internal and external environments and ensuring that risk information is communicated through a clear and robust monitoring and reporting structure.
The policy places emphasis on the role of all TNB employees, who are responsible and accountable to manage risks related to their actions and decisions by taking all reasonable care to minimise loss, maximise opportunities and ensure TNB’s reputation is upheld.
Risk Assessment Process
A structured risk assessment process is in place to guide the Group to identify, analyse, evaluate and treat risks. The business entities apply the process on a systematic, iterative and collaborative manner, drawing on the knowledge and views of stakeholders to develop their respective risk profiles.
In the same manner, six (6) strategic risks that may prevent the Group from achieving the Reimagining TNB strategies have been identified. These risks and key mitigations are described below:
1. Customer expectations change over time due to changes in their values and lifestyles. In striving provide excellent services in relation to electricity supply and new “beyond kWh” businesses, the inability to keep pace with changing customers’ expectations may lead to lost opportunities and deterioration of customer satisfaction. Customer analytics and market intelligence initiatives are in place
TNB Risk Management Framework
TNB Risk Management Structure
Leadership and Commitment
The TNB Risk Management Structure depicts the leadership and commitment of Board and Management in the escalation and cascading of risk information across all levels.
Assurance (Internal and External Audit)
TNB Board Of Directors
Group Executive Management Committee
Group/SubsidiariesRisk Management Working
Committee
Divisions, Departments and Subsidiaries
Risk Manager Risk Owner
ChiefRisk Officer
RiskManagementDepartment
TNB Board Risk Committee
Leadership & Commitment
Business Strategy
Risk Assessment
Review, Monitor & ReportCom
mun
icat
ion
Inte
grat
ion
Culture
Value Creation& Protection
Statement on Risk Management and Internal Control

p.120
TENAGA NASIONAL BERHAD
Statement on Risk Management and Internal Control
to mitigate the risk as well as the implementation of integrated communication plans for targeted customers to shape intended perception. In addition, the nationwide installation of smart meters helps improve efficiency of our services and provide new customer experience through digitalisation.
2. As a leading electricity utility for the past 70 years, the Group has continuously developed employees with the necessary skills and competencies. There is a potential risk of competency mismatch to accelerate planned growth in the Group’s regulated and non-regulated businesses. In order to equip employees with strategic and operational capabilities for the Group to be successful in a competitive global business environment, leadership development programmes are in place and leaders are identified and placed in pivotal positions to drive Reimagining TNB initiatives.
3. In a volatile, uncertain, complex and ambiguous (VUCA) market environment, the inability to be agile in adapting to changes could adversely impact the Group’s performance and have resonating long-term effects. To stay abreast of changes and enhance market intelligence, centralised intelligence information databases are in place and strategic partnerships with relevant sources have been established.
4. In driving the Reimagining TNB strategies, there are opportunities to capitalise and monetise relevant technology and innovations in areas such as repowering of power plants, smart grid and smart cities. Strategic affiliations with industry leaders, reputable utilities and engineering organisations to gain market intelligence on the latest technologies mitigate the risk of the Group’s inability to leverage available and new technology. Additional mitigations in place are implementing appropriate acceptance processes for adoption of new technologies and establishing strategic partnership with the right technology providers.
5. It is vital that stakeholders at all levels, such as the Government, regulators, customers, investors and employees, are engaged and committed to bring about the success of Reimagining TNB strategies. Ineffective engagement and communication to stakeholders could result in failing to win their hearts and minds leading to diminished loyalty and lack of trust. In efforts to mitigate this strategic risk, a comprehensive and integrated strategic communication and engagement plan has been established and implemented, including assessment of the impact and effectiveness of the content of messages communicated and the medium or channel utilised.
6. The Group’s businesses in the local and international fronts are governed by rules and regulations set by respective regulatory bodies. Constraints imposed by regulators may become significant hurdles in the pursuit of growth strategies and regulatory constraints could negatively impact the Group’s performance. Working in tandem with the local Government and regulators, initiatives and
key mitigating actions are implemented towards shaping a stable and sustainable regulatory landscape. Moreover, processes such as red flag monitoring, are established to provide early warning of potential risks related to our international investments.
Review, Monitor and Report
Consequent to the Risk Assessment Process, risks identified are registered and monitored through the TRIS, an online real-time tool and database for risk management that is accessible by all employees. Registered risks are reviewed by respective risk owners with half-year reporting to the Risk Management Department. Consolidated half-year risk reports are deliberated by the Group Risk Management Working Committee.
In the year under review, the RMD assessed the risk maturity of six (6) business entities with the objective of assessing the effectiveness of the implementation of the TNB Risk Management Framework. In addition, due to travelling and movement constraints during the COVID-19 pandemic, the RMD introduced a Desktop Risk Assessment to assess the comprehensiveness of the application of the Risk Assessment Process by the business entities. In the year under review, nine (9) Desktop Risk Assessments were completed.
Key Risk Indicators (KRIs) that provide early warning or signals of increasing risk exposures and potential risk events have been developed by business entities. These KRIs are developed in alignment with the BRC’s and Management’s risk appetite and their status are reported to the BRC on a quarterly basis. The KRIs are reviewed annually for relevancy and adequacy, taking into account business objectives and changes in the internal and external environments.
Communication
Business entities regularly communicate up-to-date risk information to internal and external stakeholders, and timely feedback is collated for opportunities for continual improvement. Adapting to the COVID-19 situation, the RMD engaged and communicated with approximately 880 employees through 16 webinars over a period of six (6) months. The purpose of the webinars was to inculcate a risk-thinking mind-set among employees by applying the TNB Risk Management and BCM frameworks through learning lessons from past risk events.
INTERNAL CONTROL
Group Policies and Procedures
Group-wide policies and procedures have been approved by the Board and Management to ensure ethics and internal control principles and mechanisms are embedded in business operations. These policies and procedures are consistently reviewed to ensure relevance and effectiveness.

p.121
INTEGRATED ANNUAL REPORT 2020
CREATING VALUE THROUGH STRONG GOVERNANCE
Statement on Risk Management and Internal Control
Among others, the Group policies and procedures in place are:
• TNB Code of Ethics• TNB Ethics & Integrity Policy• TNB Risk Management Policy• TNB Confidentiality Policy• TNB Asset Management Policy• TNB Limits of Authority• TNB Procurement and Supply Chain Policy and Procedures • TNB ICT Codes of Practice and Guidelines • TNB Safety & Health Policy• TNB Environmental Policy• TNB Communication Policy• TNB Personal Data Protection Policy • TNB Disciplinary Procedures• TNB Group Financial Policies and Procedures• TNB Group Human Resource circulars and guidelines
Financial and Operational Control Framework
TNB Group Financial Policies and Procedures (GFPP) serves as a compulsory source of reference for the Group in conducting its operations to manage associated risks. The Group has acted in accordance with generally accepted accounting principles and the Malaysian Financial Reporting Standards. Periodic reviews of actual performance versus budgets, targets, and performance in prior periods for key functions and major initiatives are carried out and appropriate mitigating and follow-up actions are taken.
The BAC reviews the Group’s quarterly financial performance together with Management, and these are subsequently reported to the Board. The quarterly reviews enable the BAC to deliberate and assess the Group’s financial results and operational performance.
TNB continues to proactively engage with relevant stakeholders for smooth implementation of the IBR framework and Imbalanced Cost Pass-Through mechanism. The performance of the regulated business is meticulously monitored through the IBR performance indicators and dashboards. These are reported regularly to relevant decision-making councils and committees to ensure effective implementation of the IBR framework as well as to the Energy Commission in compliance with the IBR guidelines.
The procedures for critical functions and key activities are documented, communicated to employees and periodically reviewed. Relevant divisions, departments and subsidiaries have been consistently maintaining their ISO 9001, ISO 14001, ISO 27001, ISO 37001, ISO 45001 and ISO 55001 certifications. Internal audits are conducted to ensure compliance with relevant standards and procedures.
Strategic Planning and Performance Management Cycle
A holistic strategic planning process is integral in providing focus and alignment between aspiration, strategies, performance management and the desired strategic outcomes. In the year under review, a new Strategic
Planning and Performance Management (SPPM) cycle was approved by the Board. This 5-part cycle integrates the current capital and budget allocation process and performance management cycle. It includes the identification of strategy driven KPIs based on long-term business plans and annual operating plans, and are cascaded to all levels of employees. The strategy driven KPI methodology is derived from the Balanced Scorecard concept that focuses on performance measures from four (4) perspectives, which are financial, customer, internal process and learning and growth.
Human Resource Management and Development
Job descriptions and responsibilities of approved positions are clearly defined and communicated through the internal online platform, People Matters. Workforce requirement planning is carried out and led by Group Human Resource, mirroring the budget planning cycle with the aim of optimising staffing levels and increasing productivity. Employee training needs are regularly assessed and various programmes are in place to address competency gaps.
In the year under review, Group Human Resource continued to roll out its Total Wellness Programme aimed at educating and influencing employees towards a healthy lifestyle and work life balance. The “Vibrant Living – Healthier. Together” initiative was implemented across the Group with six (6) main scopes being healthy eating, no smoking, active lifestyle, basic health screening and mental well-being.
TNB Digital Strategy
The TNB Digital Strategy was established to lay the necessary digital foundations and direction in supporting the Reimagining TNB strategies. The digital strategy is implemented through five (5) streams: (i) identifying the digital vision and value levers for 10 key business entities; (ii) developing a clear plan on attracting and developing the right digital talent and for culture change; (iii) enhancing digital architecture readiness to support business imperatives; (iv) establishing a digital operating model, factory and skills hub to host critical in-demand skills; and (v) building a governance and value realisation framework.
Management Information Systems
Leveraging information and communication technology is vital in promoting effective and efficient business operations as well as timely and accurate communication with internal and external stakeholders. Key information systems utilised by the Group for that purpose are:
• Enterprise Resource Management System (ERMS)• Enterprise Human Resources Management System (EHRMS)• Corporate Geospatial Information System (CGIS)• Supervisory Control and Data Acquisition System (SCADA)• TNB Outage Management Systems (TOMS)• Billing Customer Relation Management (BCRM)• Employee Self Service (ESS)

p.122
TENAGA NASIONAL BERHAD
Statement on Risk Management and Internal Control
Super User Privilege Management and Governance, Risk and Compliance systems have been implemented to control and govern access to core systems and servers. This is to ensure that access to critical information systems and confidential information is adequately monitored and controlled. Annual disaster recovery tests are carried out at the data centres and ICT security assessments are regularly carried out on systems at the business entities. In addition, various enhancements are implemented to strengthen cyber security for Information Technology and Operational Technology systems. In the event of system failure, various mitigations are in place to minimise disruption to operations.
Personal Data Protection
TNB is committed to safeguarding customers’ privacy rights and personal data. TNB was an active contributor in the development of The Personal Data Protection Code of Practice for The Utilities Sector (Electricity), which serves as a guide for the processing and handling of customers’ personal data. The code of practice is aligned with the Personal Data Protection Act 2010 (Section 23) (PDPA), which protects personal information of an individual being processed for commercial transaction purposes. Our Legal Services Department is committed to consistently educating and communicating the requirements of the PDPA and the Code of Practice across the Group to heighten awareness and compliance as well as enhance controls.
TNB Corporate Integrity Management System
TNB had embarked on an initiative to embed our core value, “Integrity”, more deeply across the Group through the implementation of the TNB Corporate Integrity Management System (TCIMS). The objective of TCIMS is to improve TNB’s integrity culture, reduce the impact of corruption or mismanagement and position TNB at par internationally through a strategic and structured integrity management system. In addition, TNB is certified with ISO 37001:2016 Anti-Bribery Management Systems and has put in place a management system designed to help prevent, detect and respond to bribery and comply with anti-bribery laws and voluntary commitments applicable to its activities. In the year under review, an online Integrity Pledge and Conflict of Interest declaration was completed by approximately 24,500 employees and 23 integrity engagement and TCIMS awareness sessions were carried out, which were attended by approximately 1,000 employees.
Tenaga Safety Culture
The Tenaga Safety Culture programme aims to inculcate safety as part of the everyday working culture, transforming it from a mere compliance activity. It is based on four (4) core behaviours, which are Assess, Comply, Intervene and Actively Caring. Various initiatives are implemented to instill these core behaviours in each employee, including the Spiritual Hour initiative to align good safety practices with
religious teachings. In addition, a mobile application called HSE Wallet has been developed to facilitate the reporting of potential incidents, notices, compounds or lawsuits by employees. With the convenience of this application in employees’ mobile phones, it encourages employees to proactively observe and report any safety risk or non-compliance as each employee practices the core safety behaviours as a lifestyle.
Customer Experience
With attention to customer centricity, a variety of channels utilising the “Click, Call, Come Over” framework is made available to customers. The framework covers a wide range of touch points that enable quality solutions, services and continuous interaction options to enhance customer experience. A systematic approach is in place for timely resolution of feedback such as service requests, complaints, comments, enquiries and concerns. In addition, the myTNB web portal and free mobile application are available to customers to manage their electricity account(s) in one (1) location. The myTNB web portal includes an express payment feature for customers to pay electricity bills without needing to log in. In the year under review, there had been a significant increase in the number of registered users and transactions in myTNB due to the increased use of digital platforms during the pandemic.
CONCLUSION
The Board has obtained assurances from the President/CEO and Chief Financial Officer that the Group’s risk management and internal control system is operating adequately and effectively, in all material aspects. Where weaknesses were identified, rectification steps have been put in place.
The Board is of the view that the risk management and internal control system in place for the year under review and up to the date of approval of this statement for inclusion into the annual report, is adequate and effective to safeguard shareholders’ investment, the interests of customers, regulators and employees, and the Group’s assets.
REVIEW OF THE STATEMENT BY EXTERNAL AUDITOR
As required by Paragraph 15.23 of the MMLR, the external auditors have reviewed this Statement on Risk Management and Internal Control. Their limited assurance review was performed in accordance with Audit and Assurance Practice Guide (AAPG) 3 issued by the Malaysian Institute of Accountants. AAPG 3 does not require the external auditors to form an opinion on the adequacy and effectiveness of the risk management and internal control systems of the Group.
This statement is made in accordance with the resolution of the Board of Directors dated 26 February 2021.

p.123
INTEGRATED ANNUAL REPORT 2020
CREATING VALUE THROUGH STRONG GOVERNANCE
Additional Compliance Information
(1) UTILISATION OF PROCEEDS RAISED FROM ANY CORPORATE PROPOSAL
Utilisation of Proceeds Raised from Corporate Proposals by the Company during the Financial Year under review:
A Multicurrency Sukuk Issuance Programme of USD2.5 billion (Or its Equivalent In Other Currencies) by TNB GlobalVentures Capital Berhad with TNB as the Obligor
First issuance on 10 October 2016 USD750.0 million
Total utilisation of proceeds as at 31 December 2020 USD693.7 million
Balance of proceeds as at 31 December 2020 USD56.3 million
Second issuance on 1 November 2018 USD750.0 million
Total utilisation of proceeds as at 31 December 2020 USD393.5 million
Balance of proceeds as at 31 December 2020 USD356.5 million
Establishment of Sukuk Wakalah Programme of up to RM5.0 billion by TNB
First issuance on 3 August 2017 RM2.0 billion
Second issuance on 29 August 2018 RM3.0 billion
Utilisation of proceeds as at 31 December 2020 Partly utilised to finance TNB’s capital expenditure, investment, general corporate purposes, working capital requirements and settlement of fees and expenses related to the sukuk programme
Balance of proceeds as at 31 December 2020 - Nil -
Establishment of Sukuk Wakalah Programme of up to RM10.0 billion by TNB
First issuance on 12 August 2020 RM3.0 billion
Total utilisation of proceeds as at 31 December 2020 RM3.0 billion
Balance of proceeds as at 31 December 2020 - Nil -
NORAINI BINTI CHE DANSenior Independent Non-Executive Director
(2) MATERIAL CONTRACTS
There were no material contracts entered into by the Company and its Subsidiaries involving the interest of the Directors or Major Shareholders, either still subsisting at the end of the Financial Year or, if not then subsisting, entered into since the end of the previous Financial Year.
(3) RELATED PARTY TRANSACTIONS
The Group has established appropriate procedures to ensure it complies with the MMLR with regards to related party transactions. All related party transactions are reviewed by the Group Internal Audit Department, following which a Group-Wide Report is submitted to BAC on quarterly basis for monitoring purposes. The Group did not seek any mandate of its shareholders pertaining to related party transactions during the Financial Year under review.
STATEMENT ON COMPLIANCE WITH THE REQUIREMENTS OF BURSA MALAYSIA IN RELATION TO APPLICATION OF PRINCIPLES AND ADOPTION OF BEST PRACTICES LAID DOWN IN THE MALAYSIAN CODE ON CORPORATE GOVERNANCE 2017(Pursuant to paragraph 15.25 of the MMLR)
The Board has reviewed, deliberated and approved this Statement. The Board is pleased to report to its shareholders that to the best of its knowledge, the Company has complied with and shall remain committed to attaining the highest possible standards of corporate governance through the continuous adoption of the principles and best practices of the MCCG and all other applicable laws.
Signed on behalf of the Board of Directors in accordance with their resolution dated 26 February 2021.

SustainabilityStatement
126Sustainability at TNB- TNB’s Sustainability Strategy- Spirit of Responsibility- TNB’s Stakeholder Engagement- What Matters to Us- Linking Performance to Global
Agenda- How TNB is Addressing a Global
Pandemic
140Empowering the Nation- Sustainable Infrastructure and
Ecosystems- Customer Centricity
147Environmental Stewardship- Minimising Environmental
Impacts- Climate Change
153Our People and Their Value- Employment Management and
Relations- Prioritising Health, Safety and
Personal Well-Being
160Contributing to Upliftment of Communities- Community Investments and
Promoting Education
p.125
INTEGRATED ANNUAL REPORT 2020
SUSTAINABILITY STATEMENT
The need to prioritise sustainability has never been more critical for businesses in order to seize opportunities amidst climate change risks, the COVID-19 pandemic, increased digitalisation and a rapidly transforming business landscape. As a responsible organisation, we are committed to embedding sustainability at the core of our decision-making processes and integrating it across our value chain. We aspire to continue driving sustainable development for our stakeholders by delivering reliable and affordable energy, embracing innovation and further empowering our people.
Sustainability Statement
Section in the Statement Key Enhancement
How We Are Governed• Demonstrated clearer integration of sustainability within our Corporate Governance
Model
How TNB Is Addressing a Global Pandemic
• Highlighted TNB’s response and business resilience in light of COVID-19 by showcasing our efforts to help stimulate economic recovery and growth, support our customers and the wider community, and protect our people
Climate Change• Enhanced climate change disclosures with reference to the recommendations of the
TCFD framework
What Matters to Us and Linking Our Performance to Global Agendas
• Detailed the materiality assessment process conducted in FY2020 and the materiality matrix that better reflects our environmental, social and governance & economic (ESG) focus
• Explained the interlinkages of material matters, risks, opportunities and corporate strategy
• Demonstrated our performance against the UN SDGs, targets and commitments
Reporting Frameworks and Boundaries
Our Sustainability Statement provides an account of our commitments, efforts and progress on matters that are material to TNB’s business and stakeholders.
Our sustainability information is disclosed based on Bursa Malaysia’s Main Market Listing Requirements and with reference to the following Malaysian and global disclosure frameworks and benchmarks:
• Bursa Malaysia Sustainability Reporting Guide (2nd Edition)• Global Reporting Initiative (GRI) Standards: Core Option • GRI Electric Utilities Sector Disclosures• Task Force on Climate-related Financial Disclosures (TCFD)
framework• United Nations Sustainable Development Goals (UN SDGs)
This Sustainability Statement contains information for the financial year 2020 (FY2020), from 1 January 2020 to 31 December 2020. The scope and boundary of material disclosures primarily cover our core
and non-core business operations in Peninsular Malaysia under the purview of TNB divisions (“TNB Company”). Where relevant, we have expanded our disclosures to include our subsidiaries (“TNB Group”). Unless otherwise stated, this Statement excludes joint ventures and supplier activities.
While we have not sought external assurance for this Statement, we aspire to follow best practices by seeking external assurance on sustainability disclosures in the future.
Where data for FY2020 is not available, the most recent data is provided. Please refer to our upcoming Sustainability Report 2020 for more information.
Overall, we have improved our Statement by providing a better understanding of the integration of sustainability in TNB and our sustainability performance against commitments and targets. The key enhancements for specific sections of this Statement are highlighted in the table below.

p.126
TENAGA NASIONAL BERHAD
Sustainability at TNB
TNB’s Sustainability Strategy
As the key electricity provider and distributor for the nation, we take our responsibility to ensure reliable supply and fair tariffs seriously, and we continue to delicately balance socio-economic considerations with the need to conserve the environment. This is also in line with our aspiration to stay ahead of industry disruptions which are centred around decarbonisation, decentralisation, digitalisation and deregulation.
Aligned and integrated with TNB's corporate strategy, Reimagining TNB (RT), our sustainability strategy centres on the most material ESG issues and our contributions to the UN SDGs. Through our efforts in relation to the UN SDGs, we continue to play our role in joining both the private and public sec-tors to take urgent action in tackling the challenges in sustainable development. TNB has identified four (4) UN SDGs that are most relevant to how we create value for our business and stakeholders, which are Goal 7 (Affordable and Clean Energy), Goal 8 (Decent Work and Economic Growth), Goal 13 (Climate Action), and Goal 17 (Partnerships for the Goals).
For more information on how we have contributed to the global agenda, please refer to the Linking Our Performance to Global Agenda section on page 136.
Outlines our strategies in relation to renewable and low-carbon sources of energy as stakeholders gravitate towards decarbonisation to mitigate climate change
Envisions the grid of the future as being highly automated and digitalised, supporting distributed generations and greater energy efficiency among consumers
Future Generation Sources
Grid of the Future
For more information on Reimagining TNB strategy, please refer to pages 38-45 of the IAR.
Sustainability Pillars Reimagining TNB
Marks our commitment, driven by our Board, to reinforce ethical business practices and forward looking culture under the theme “Spirit of Responsibility”
Governance
Defines our continued aspiration to provide reliable and efficient energy in the local and international Energy Supply Industry (ESI) for a better and brighter future under the theme “Empowering the Nation”
Economic
Defines our commitment to minimise our environmental impacts and address climate change risks and opportunities under the theme “Environmental Stewardship”
Environmental
Revolves around how we empower our employees under the theme “Our People and their Value” and invest in community development under the theme “Contributing to Upliftment of Communities”
Social
Relates to our commitment to not only provide reliable supply of electricity but to become a customer-centric organisation which offers meaningful customer experience by meeting all our customers’ energy-related needs along with the best service delivery
Winning the Customer
Demonstrates how we protect the interests of all relevant stakeholders – along the value chain to ensure sustainability of the system
Future Proof Regulations
To be a leading provider of sustainable
energy solutions in Malaysia and internationally

p.127
INTEGRATED ANNUAL REPORT 2020
SUSTAINABILITY STATEMENT
Spirit of Responsibility
How We Are Governed
It is our priority to ensure the highest standards of corporate governance and ethics, which is also outlined in one of our material matters, “Responsible and Ethical Business Practices”. TNB’s Governance Model clearly defines the way in which we operate, and the conduct expected from our Board of Directors, Board Committees, employees and external parties when representing the organisation. Under this model, ESG considerations are embedded within TNB’s overall strategies, decision-making processes, and operations.
TNB’s Board oversees the group-wide integration of sustainability and sets the tone from the top regarding the critical role of sustainability in the creation and protection of value for stakeholders.
The Sustainability Development Committee (SDC) and respective Management Committees are responsible for managing sustainability risks and opportunities as well as monitoring the effectiveness and performance of related initiatives. TNB’s Chief Strategy and Ventures Officer leads the SDC whose members comprise the senior management team from core and non-core business and subsidiaries. The SDC evaluates and advises on the strategic direction and implementation of sustainability which are then escalated to other relevant committees and/or the Board of Directors for approval.
The SDC convened twice in FY2020 with the following items discussed:
• Review of key stakeholders, material matters and materiality matrix
• Sustainability targets, strategies and initiatives
• Addressing the interests and concerns of external and internal stakeholders
• Climate change related risks and opportunities
For more information on TNB’s Corporate Governance, please refer to the Creating Value Through Strong Governance section, page 59-123 of this IAR.
Upholding a Strong Sense of Integrity
We are committed to instilling and upholding a high standard of integrity across the Group. Going beyond compliance to create a culture of excellence, integrity has been determined as a Core Value under Reimagining Culture, defined by the three (3) behaviours:
Our approach and key FY2020 highlights:
• Zero-tolerance rule towards bribery and corruption, with avenues to report suspicious unethical conduct outlined in the Whistle Blowing Procedure
• TNB’s Risk Management Framework is in line with the ISO 31000:2018 Risk Management – Guidelines and provides a structured approach to risk management, comprising the assessment of sustainability-related risks for informed decision-making
• ISO 37001:2016 Anti-Bribery Management System (ABMS) certification and implementation of the TNB Corporate Integrity Management System (TCIMS). This year, our Integrity Department distributed the Anti-Bribery Management System Implementation Kit to all subsidiaries
• All employees are required to sign the annual Integrity Pledge, declare any conflict of interest, and complete the Integrity E-Learning Module. Similarly, we have developed an E-Learning Module for our vendors
• 23 Integrity Engagement Programme (IEP) sessions were conducted across the Group and participated by 1,007 employees
• Strategic collaboration was formed with the Malaysian Anti-Corruption Commission (MACC) and consequently, the TNB-MACC Corruption Prevention Programme was launched last year to raise awareness of anti-corruption and shape a high-integrity workforce. Several engagement sessions were conducted under this programme throughout the year, which included two (2) sessions with the senior management team and Board of Directors on corporate liability. The sessions were attended by 276 participants
• Reimagining Culture was introduced this year in light of TNB’s redefined aspirations and refreshed strategy. It serves to institutionalise a culture of excellence among our people by detailing our six (6) Core Values and Behaviours
For more information please refer to pages 101-102 of this IAR.
Uphold the highest ethical standards and do what is right, all the
time
Fair, honest and transparent - in
everything we do
Always seek to achieve mutual benefit for the country, company and
customers
Sustainability at TNB

p.128
TENAGA NASIONAL BERHAD
Sustainability at TNB
TNB’s Stakeholder Engagement
We are dedicated to building strong relationships with key stakeholder groups. Through meaningful interactions with our stakeholders, we can leverage their insights and address any pressing emerging interests or concerns, keeping us focused on key sustainability matters. Ultimately, this will translate into the strategic management of sustainability in delivering long-term value for our stakeholders.
Areas of Interest or Concern
• Accessible and reliable supply of electricity • Affordable tariffs• Energy efficiency• Billing and payment platform• New technologies (e.g. smart meters, smart
solutions and solar solutions)• Customer Service• Green Energy/Renewable Energy (RE)• TNB’s relief packages during COVID-19 crisis
• Regulatory and operational compliance • Changes in the regulatory framework and electricity
supply industry• Disaster and cyber security management • Nation-building initiatives, including community and
capability development• Security and reliability of electricity• Affordable tariffs• Environmental management
Our Response • Sustainable Infrastructure and Ecosystems, page 140
• Social and Relationship Capital, page 56• Customer Centricity, page 144• How TNB Is Addressing a Global Pandemic, page
137
• Creating Value Through Strong Governance, pages 59-123• Manufactured Capital, page 48• Social and Relationship Capital, page 56• How TNB is Addressing a Global Pandemic, page 137• Natural Capital, page 50• How We Are Governed, page 127• Sustainable Infrastructure and Ecosystems, page 140• Minimising Environmental Impacts, page 147• Community Investment and Promoting Education, page
160
Engagement Plaftorm
Customer service outlets
Call centre
myTNB mobile application and online portal
Customer surveys
Social media
Roadshows
Campaigns
Meetings and briefings
Meetings and briefings
Site visits
Round table sessions
One-to-one engagements
Outreach programmes
Summits/conferences
Customers
Our customers comprise domestic, commercial and industrial customers, including Small & Medium-sized Enterprises (SMEs) and large corporations
Government
The Malaysian Federal and State Governments, parliamentarians, municipal councils and regulators
Our Stakeholder
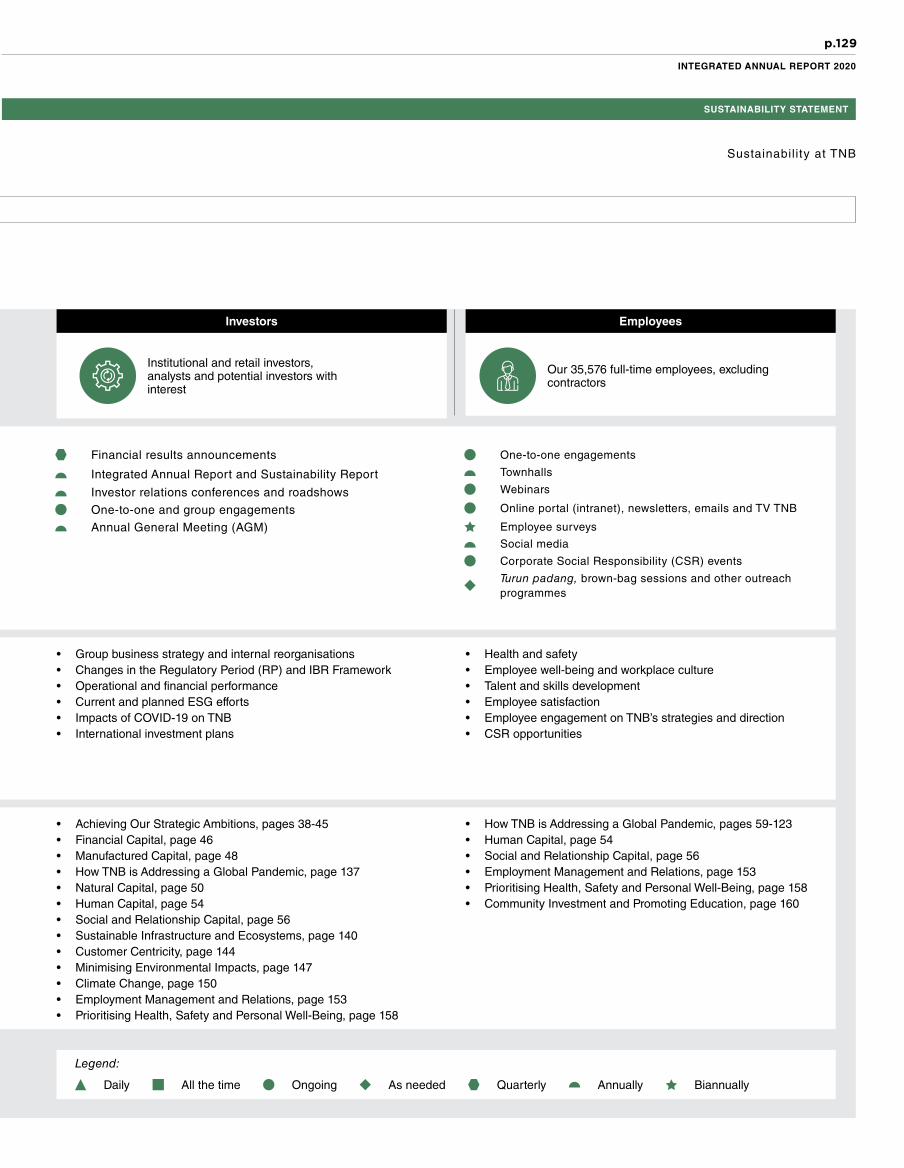
p.129
INTEGRATED ANNUAL REPORT 2020
SUSTAINABILITY STATEMENT
Investors Employees
Sustainability at TNB
Financial results announcements
Integrated Annual Report and Sustainability Report
Investor relations conferences and roadshows
One-to-one and group engagements
Annual General Meeting (AGM)
One-to-one engagements
Townhalls
Webinars
Online portal (intranet), newsletters, emails and TV TNB
Employee surveys
Social media
Corporate Social Responsibility (CSR) events
Turun padang, brown-bag sessions and other outreach programmes
Institutional and retail investors, analysts and potential investors with interest
Our 35,576 full-time employees, excluding contractors
Legend:
Daily All the time Ongoing As needed Quarterly Annually Biannually
• Group business strategy and internal reorganisations• Changes in the Regulatory Period (RP) and IBR Framework• Operational and financial performance • Current and planned ESG efforts• Impacts of COVID-19 on TNB• International investment plans
• Health and safety• Employee well-being and workplace culture• Talent and skills development • Employee satisfaction • Employee engagement on TNB’s strategies and direction• CSR opportunities
• Achieving Our Strategic Ambitions, pages 38-45• Financial Capital, page 46• Manufactured Capital, page 48• How TNB is Addressing a Global Pandemic, page 137• Natural Capital, page 50• Human Capital, page 54• Social and Relationship Capital, page 56• Sustainable Infrastructure and Ecosystems, page 140• Customer Centricity, page 144• Minimising Environmental Impacts, page 147• Climate Change, page 150• Employment Management and Relations, page 153• Prioritising Health, Safety and Personal Well-Being, page 158
• How TNB is Addressing a Global Pandemic, pages 59-123• Human Capital, page 54• Social and Relationship Capital, page 56• Employment Management and Relations, page 153• Prioritising Health, Safety and Personal Well-Being, page 158• Community Investment and Promoting Education, page 160

p.130
TENAGA NASIONAL BERHAD
Sustainability at TNB
TNB’s Stakeholder Engagement (Cont’d)
Trade Unions
• How TNB is Addressing A Global Pandemic, page 137
• Human Capital, page 54• Employment Management and Relations, page
153
• Social and Relationship Capital, page 56• Human Capital, page 54• How TNB is Addressing a Global Pandemic, page 137• Sustainable Infrastructure and Ecosystems, page 140• Prioritising Health, Safety and Personal Well-Being,
page 158
Three (3) registered unions and two (2) workers associations that cover all executive and non-executive employees
Vendors
Joint meetings and engagement sessions
Negotiations and collective agreements
Collective agreements
One-to-one engagements
Engagement sessions with key suppliers
Training and workshops
TNB Vendor Day
TNB Vendor Portal
Engagement Plaftorm
• Employee welfare and issues• Collective bargaining • Employee engagement on TNB’s strategies and
direction
• Capability development and knowledge sharing• Procurement processes • Industry support for business growth• Potential health and safety impacts
Areas of Interest or Concern
Our Response
3,442 contractors and suppliers
Our Stakeholder Engagement Approach:
Enhance the understanding of major issues when engaging with government,
investors, vendors and NGOs
Pursue two-way communication with customers and communities
Align the vision with strategies based on mutual trust with employees and trade
unions
Our Stakeholder

p.131
INTEGRATED ANNUAL REPORT 2020
SUSTAINABILITY STATEMENT
Sustainability at TNB
Communities
• Social and Relationship Capital, page 56• Achieving Our Strategic Ambitions, pages 38-45• How TNB is Addressing a Global Pandemic, page 137• Natural Capital, page 50• Minimising Environmental Impacts, page 147• Community Investment and Promoting Education, page 160
• Achieving Our Strategic Ambitions, pages 38-45• Intellectual Capital, page 52• Natural Capital, page 50• Social and Relationship Capital, page 56• Human Capital, page 54• Sustainable Infrastructure and Ecosystems, page 140• Minimising Environmental Impacts, page 147• How TNB is Addressing a Global Pandemic, page 137
Local communities we engage with, in or near areas where we operate, including those impacted by our operations
Non-Governmental Organisations (NGOs) and Associations
Consumer associations, think thank groups, environmental groups and chamber of commerce
Outreach programmes
CSR events
Townhalls
Dialogue sessions
Sporting events
One-to-one engagements
Outreach programmes
Seminars and knowledge sharing sessions
Collaboration sessions
Social media
• Community development and support • Communication on development plans and projects• Potential health, safety and environmental impacts
• Affordable tariffs• Innovation in technology and RE • Quality of service• Supply reliability• Current and planned ESG efforts
Legend:
Daily All the time Ongoing As needed Quarterly Annually Biannually

p.132
TENAGA NASIONAL BERHAD
Sustainability at TNB
TNB’s material matters reflect the key environmental, social and governance & economic (ESG) topics that significantly impact our business and stakeholders. With an in-depth understanding of our material matters, we can better define our strategies and resource allocation plans, thereby positioning TNB to implement meaningful actions and anticipate sustainability challenges.
We have previously conducted two (2) materiality assessments involving key internal stakeholder workshops since FY2016. We also undertake annual reviews with senior management and the SDC to maintain relevance and alignment to TNB’s corporate strategies, industry developments, emerging risks and opportunities, and stakeholder concerns. This year, we conducted our third materiality assessment through the following process:
What Matters to Us
Identification
1We reviewed our material matters against Bursa’s Sustainability Reporting Guide (2nd Edition) and the GRI Standards. We further analysed industry trends, leading practices from peer benchmarking, media reviews and feedback from divisions that closely engage external stakeholders. As a result, a refreshed inventory list of potential sustainability matters was defined.
Prioritisation
2We circulated an internal survey to our core and non-core business divisions, business units and subsidiaries for the purposes of shortlisting and prioritising the Group’s key stakeholder groups and material matters. Eight (8) key stakeholder groups were identified, while the material matters were prioritised based on TNB’s ESG impacts and the level of influence on the assessments and decisions of stakeholders.
Validation
3The key stakeholder groups and material matters were deliberated at the SDC meeting and discussed with key external stakeholders. These have been further validated by the senior management team and the Board of Directors.
Legend: Governance & Economic Environmental Social
Hig
hLo
w
HighLow TNB’s ESG impacts
Inte
rest
or
Co
nce
rn to
Sta
keh
old
ers
Business and Financial Performance
Reliable Energy and Fair Tariffs
Customer Experience
Energy Transition and Innovation
Climate Change and Energy Efficiency
Safety, Health and Well-being
Environmental ManagementEmployment Culture
Capability Development
Responsible and Ethical Business Practices
Community Development and EducationCyber Security Management
Sustainable Supply Chain
Waste Management
Natural Resource Consumption
Biodiversity Management
Tax
Rights of Indigenous Peoples

p.133
INTEGRATED ANNUAL REPORT 2020
SUSTAINABILITY STATEMENT
Sustainability at TNB
We have prioritised 18 material matters for FY2020 and mapped them to RT and our direct and indirect contributions to the UN SDGs. These matters have also been mapped to our six (6) strategic risks that were identified as having the potential to prevent TNB from achieving our RT and objectives.
Sustainability Pillar Material Matters Link to Strategic Risks Alignment to RT and UN SDGs
GOVERNANCE
Spirit of Responsibility
• Reinforce ethical and safe business culture
Responsible and Ethical Business Practices
Ensuring robust corporate governance in TNB
• Regulatory constraints that can negatively impact TNB business
• Ineffective engagement and communication to stakeholders
ECONOMIC
Empowering the Nation
• Provide reliable and efficient energy for customers
• Supply electricity domestically and internationally
Business and Financial Performance
Measures taken to achieve business and financial growth
• Inability to keep pace with changing customers’ expectations
• Inability to leverage on available and new technology
• Regulatory constraints that can negatively impact TNB business
Reliable Energy and Fair Tariffs
Ensuring the availability, affordability and reliability of electricity in the short, medium and long-term, including in the event of emergencies and crises.
• Inability to keep pace with changing customers’ expectations
• Inability to adapt to changing market environment
• Inability to leverage on available and new technology
• Regulatory constraints that can negatively impact TNB business
Customer Experience
Providing exceptional customer experience by exceeding their expectations and empowering them to become prosumers, while ensuring data security
• Inability to keep pace with changing customers’ expectations
• Inability to adapt to changing market environment
• Inability to leverage on available and new technology
• Regulatory constraints that can negatively impact TNB business
Cyber Security Management
Safeguarding digital systems from cyber security risks, threats and attacks
• Inability to leverage on available and new technology
Sustainable Supply Chain
Engaging in sustainable supply chain practices and strengthening the local energy ecosystem
• Inability to adapt to changing market environment
• Inability to leverage on new technology• Ineffective engagement and communication
to stakeholders
Tax
Contributing to government revenue through transparent tax practices
• Regulatory constraints that can negatively impact TNB business
• Ineffective engagement and communication to stakeholders
Reimagining TNB Pillar:
Future Generation Sources Grid of the Future Winning the Customer Future Proof Regulations
Reimagining TNB Enabler:
Capital Allocation and Value Creation
Corporate and Organisation Structure
Digital and Data Analytics
Legend:
For more information on TNB’s risk management, please refer to the Statement on Risk Management and Internal Control on page 118 of this IAR.
Culture, Capabilities and Performance Management

p.134
TENAGA NASIONAL BERHAD
Sustainability at TNB
Sustainability Pillar Material Matters Link to Strategic Risks Alignment to RT and UN SDGs
ENVIRONMENTAL
Environmental Stewardship
• Support transition to a low-carbon economy
• Minimise environmental impact
Energy Transition and Innovation
Contributing to the national RE target and driving innovation to anticipate changing trends and build business resilience
• Inability to adapt to changing market environment
• Inability to leverage on available and new technology
• Regulatory constraints that can negatively impact TNB business
• Inability to keep pace with changing customers’ expectations
Environmental Management
Ensuring compliance and effective management of environmental impacts
• Regulatory constraints that can negatively impact TNB business
Climate Change and Energy Efficiency
Efforts to address climate change impacts and manage greenhouse gas (GHG) emissions
• Regulatory constraints that can negatively impact TNB business
• Inability to leverage on available and new technology
• Inability to keep pace with changing customers’ expectations
Natural Resource Consumption
Responsible consumption of natural resources including fuel and water
• Inability to leverage on available and new technology
• Regulatory constraints that can negatively impact TNB business
Waste Management
Effective management of waste from business operations
• Inability to leverage on available and new technology
• Regulatory constraints that can negatively impact TNB business
Biodiversity Management
Pursuing environmental conservationefforts and safeguarding biodiversity inour areas of operation
• Inability to leverage on available and new technology
• Regulatory constraints that can negatively impact TNB business
Reimagining TNB Pillar:
Future Generation Sources Grid of the Future Winning the Customer Future Proof Regulations
Reimagining TNB Enabler:
Capital Allocation and Value Creation
Corporate and Organisation Structure
Digital and Data Analytics
Legend:
Culture, Capabilities and Performance Management

p.135
INTEGRATED ANNUAL REPORT 2020
SUSTAINABILITY STATEMENT
Sustainability at TNB
Sustainability Pillar Material Matters Link to Strategic Risks Alignment to RT and UN SDGs
SOCIAL
Our People and Their Value
• Foster a favourable working environment that boosts employee morale and development
• Protect the safety, health and well-being of our employees
Safety, Health and Well-being
Promoting a working culture that upholds high standards of occupational health and safety, and protects employee welfare
• Regulatory constraints that can negatively impact TNB businesses
• Ineffective engagement and communication to stakeholders
Capability Development
Development of technical and leadership skills for a future ready workforce
• Competency mismatch to drive strategy
Employment Culture
Creating a diverse and inclusive culture while closely engaging with our employees
• Ineffective engagement and communication to stakeholders
• Competency mismatch to drive strategy
Contributing to Upliftmentof Communities
• Enrich the lives of communities by driving socioeconomic upliftment
Community Development and Education
Channeling investments to community and educational programmes to advance positive socio-economic impacts
• Ineffective engagement and communication to stakeholders
Rights of Indigenous Peoples
Engaging with Indigenous Peoples and respecting their rights
• Ineffective engagement and communication to stakeholders
Reimagining TNB Pillar:
Future Generation Sources Grid of the Future Winning the Customer Future Proof Regulations
Reimagining TNB Enabler:
Capital Allocation and Value Creation
Corporate and Organisation Structure
Digital and Data Analytics
Legend:
Culture, Capabilities and Performance Management

p.136
TENAGA NASIONAL BERHAD
Linking Performance to Global Agenda
UN SDG 7Affordable and Clean Energy
We prioritise energy efficiency, clean energy technology and related infrastructure.
Target and Initiatives FY2020 Results Focus in FY2021 and Beyond
Increase RE capacity to 8.3GW by 2025, (including large hydro of 2.54GW)
1
Maintain System Average Interruption Duration Index (SAIDI) under 50 minutes/customer/ year through SAIDI 50 initiatives
2
• Renewable energy generation capacity: 3,398.2MW (including large hydro)
• SAIDI in Peninsular Malaysia at 44.95 minutes/customer/year
• System Availability: 99.78%• Equivalent Availability Factor (EAF)
of 87.4% performance for wholly and majority owned power plants in Peninsular Malaysia.
• Transmission system minutes of 0.08 minutes
• Growing RE assets, both domestically and internationally
• Expanding Large Scale Solar (LSS) and solar PV rooftop installations to boost the solar manufacturing sector
• Optimising assets to enhance system and supply reliability which contributes to affordability
• Ensuring stability of grid from increased generation from variable RE sources
• Enabling customers’ participation through digitalisation
Sustain strong revenue growth that subsequently leads to high tax and zakat contributions
1
Install 9 million smart meters across Peninsular Malaysia in phases under Advanced Metering Infrastructure (AMI) initiative by 2026, which provides an avenue for digital upskilling and job creation
2
• Revenue for FY2020: RM43,976.0 million
• Tax and zakat for FY2020: RM619.0 million
• Smart meters installed: 891,294
• Reskilling employees to be well equipped for greater digitalisation and automation
• Enhancing digital connectivity to promote inclusive development
UN SDG 8Decent Work and Economic Growth
We promote sustainable business performance and create employment opportunities.
Improve energy efficiency, which aligns with the Government’s National Energy Efficiency Action Plan
1• Total GHG emissions mitigated:
5.98 million tCO2e• Total GHG emissions (Scope 1 and 2):
39.28 million tCO2e• Energy savings from TNB buildings:
6,389.57MWh• GHG emissions intensity:
0.57 tCO2e/MWh
• Contributing to the deployment of electric vehicle (EV) charging infrastructure nationwide
• Nurturing an ecosystem of energy efficiency
• Expanding on R&D and innovation to roll out technologies that contribute to climate change mitigation and adaptation
• Setting targets for the reduction of GHG emissions (Scope 1 and 2)
UN SDG 13Climate Action
We support Malaysia’s commitment to the Paris Agreement and seek to mitigate our GHG emissions and environmental impacts, as well as adapt to climate risks.
Establish a wide range of partnerships to promote accessible and clean energy as well as the upliftment of communities
1• Total contribution to community
development programmes: RM62.93 million, including RM27.50 million channelled towards donating medical supplies in light of COVID-19
• Partnership with Ministry of Rural Development to provide electricity infrastructure in rural areas
• Partnership with Malaysia Airports Holdings Bhd (MAHB) to supply electricity and cooling at the Kuala Lumpur International Airport (KLIA)
• Partnerships with Government agencies and private companies to create a wider ecosystem for RE and energy efficiency (EE) investments for our customers
• Partnership with Malaysian Green Technology and Climate Change Centre (MGTC) to install electric vehicle (EV) charging stations nationwide
• Strengthening partnerships and collaborations for community development and environmental management
UN SDG 17Partnerships for the Goals
We continue to form partnerships with key stakeholders with the objectives to meet future industry demands and contribute positively to the environment and the community.
Sustainability at TNB

p.137
INTEGRATED ANNUAL REPORT 2020
SUSTAINABILITY STATEMENT
How TNB is Addressing a Global Pandemic
Stimulating Our Business and the Economy
In this time of crisis, Government and industries need to work together to rapidly understand the implications, continue to support lives and livelihoods, and determine actions to mitigate the immediate impacts while charting a course for rapid and sustainable recovery. With an uncertain global outlook, we face a health and economic crisis where recovery may even take over two (2) years.
The immediate focus is undoubtedly to contain the pandemic, however, we also need to quickly move to restart the economy and mitigate financial distress. In relation to the latter, TNB has identified areas of high growth potential where Malaysia can nurture a local industry ecosystem that is globally competitive and improves national productivity. Therefore, we are focusing on the six (6) game changers to proactively support the government in their action plan for Malaysia’s economic recovery.
The world is vulnerable and under great pressure caused by unprecedented challenges arising from the COVID-19 pandemic. Apart from severe health risks, the world is reeling from socio-economic challenges including supply chain disruptions, reducing demands, lockdown, and unemployment.
TNB has the responsibility of powering the nation and ensuring that its critical infrastructure remains running and functioning even amidst a global pandemic. “Keeping the lights on” is always our top priority as we continue to innovate and find effective methods to support our stakeholders in navigating economic recovery.
Our Response to COVID-19:
Stimulating Our Business and the Economy
1Providing Support to Customers and Communities
2 Safeguarding Our Employees3
The Six (6) Game Changers Strategic Direction Value Creation
Catalysing the Economy through Grid of the Future
We aim to invest RM27 billion in “Grid of the Future” technologies, including important core upgrades and expansions, for 2021-2023.
Expected to deliver an estimated GDP impact of RM20 billion as well as create over 300,000 jobs from 2021-2023.
Building a Global Solar Manufacturing Hub for Malaysia
We aim to invest up to 1,400MW in LSS and 75MW in distributed solar generation in Malaysia, to drive the growth of the solar manufacturing sector.
Contributes to the country’s 31% renewable energy target in generation mix by 2025. The hub is expected to generate RM6 billion in GDP and 47,000 jobs over the next two (2) years.
Raising National Competitiveness through Energy Efficiency
We aim to support in achieving at least 8% national energy savings by 2025, focus on immediate economic stimulus agenda and long-term development of energy efficiency in relevant industries.
Supports the Government in refreshing the National Energy Efficiency policy which aims to help combat climate change and reduce Malaysia’s energy per GDP ratio. This is expected to contribute RM32 billion to Malaysia’s GDP and create 140,000 jobs over the next three (3) years.
Making Malaysia the Electric Vehicle Hub for ASEAN
We aim to grow the existing automotive industrial ecosystem as outlined in the National Automotive Policy (NAP) 2020.
Supports Malaysia’s position as the region’s energy-efficient hub, through R&D in areas such as vehicle-grid interoperability and using EV charging systems for various functions. We expect a GDP contribution of RM55 billion plus RM50 billion in exports, and 323,000 new jobs created, both by 2030.
Advancing Connectivity for Our Digital Economy
We aim to play a role in the Pelan Jalinan Digital Negara (JENDELA), formerly known as the National Fiberisation and Connectivity Plan, and 5G rollout by using existing network infrastructures to fast-track adoption.
Expected to contribute RM10 billion to GDP and create over 150,000 jobs over the next three (3) years.
Reskilling Malaysia by Embracing the Future of Work
We will focus on reskilling and upskilling Malaysia’s workforce via various training bodies, including UNITEN and ILSAS. We also aim to play a leading role in coordinating a cross-GLC reskilling initiative for Malaysian workers to be transitioned into new sectors of the economy by 2030. Under TNB’s Reskilling Malaysia Programme itself, we aim to provide training to 5,000 individuals by 2021, and 17,500 in total by 2024.
Prepares Malaysians for future job demands in an evolving economy while boosting the country’s GDP. This is expected to create 4.5 million new jobs in higher skilled and higher waged roles.
Sustainability at TNB
Minister of Energy and Natural Resources, Datuk Seri Dr. Shamsul Anuar bin Nasarah (third left) and Deputy Minister, Datuk Ali Anak Biju (second right) attended a briefing session by Datuk Seri Amir Hamzah bin Azizan (left), alongside Datuk Ir. Baharin bin Din (second left) at our Metro Regional Control Centre (MRCC) building.
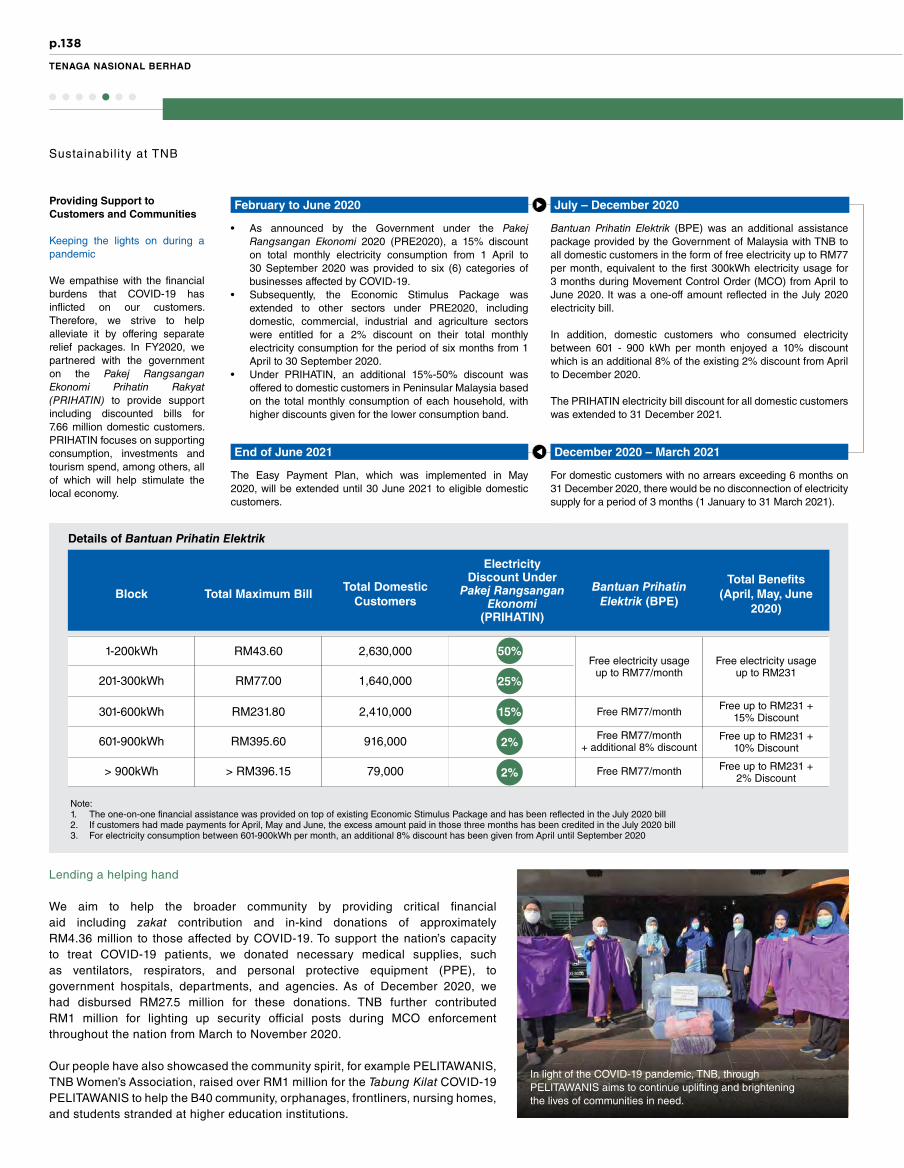
p.138
TENAGA NASIONAL BERHAD
Providing Support to Customers and Communities
Keeping the lights on during a pandemic
We empathise with the financial burdens that COVID-19 has inflicted on our customers. Therefore, we strive to help alleviate it by offering separate relief packages. In FY2020, we partnered with the government on the Pakej Rangsangan Ekonomi Prihatin Rakyat (PRIHATIN) to provide support including discounted bills for 7.66 million domestic customers. PRIHATIN focuses on supporting consumption, investments and tourism spend, among others, all of which will help stimulate the local economy.
Lending a helping hand
We aim to help the broader community by providing critical financial aid including zakat contribution and in-kind donations of approximately RM4.36 million to those affected by COVID-19. To support the nation’s capacity to treat COVID-19 patients, we donated necessary medical supplies, such as ventilators, respirators, and personal protective equipment (PPE), to government hospitals, departments, and agencies. As of December 2020, we had disbursed RM27.5 million for these donations. TNB further contributed RM1 million for lighting up security official posts during MCO enforcement throughout the nation from March to November 2020.
Our people have also showcased the community spirit, for example PELITAWANIS, TNB Women’s Association, raised over RM1 million for the Tabung Kilat COVID-19 PELITAWANIS to help the B40 community, orphanages, frontliners, nursing homes, and students stranded at higher education institutions.
Details of Bantuan Prihatin Elektrik
Block Total Maximum BillTotal Domestic
Customers
Electricity Discount Under
Pakej Rangsangan Ekonomi
(PRIHATIN)
Bantuan Prihatin Elektrik (BPE)
Total Benefits(April, May, June
2020)
1-200kWh
201-300kWh
301-600kWh
601-900kWh
> 900kWh
RM43.60
RM77.00
RM231.80
RM395.60
> RM396.15
2,630,000Free electricity usage
up to RM77/monthFree electricity usage
up to RM2311,640,000
2,410,000
916,000
79,000
Free RM77/month
Free RM77/month+ additional 8% discount
Free RM77/month
Free up to RM231 +15% Discount
Free up to RM231 +10% Discount
Free up to RM231 +2% Discount
50%
25%
15%
2%
2%
Note: 1. The one-on-one financial assistance was provided on top of existing Economic Stimulus Package and has been reflected in the July 2020 bill2. If customers had made payments for April, May and June, the excess amount paid in those three months has been credited in the July 2020 bill3. For electricity consumption between 601-900kWh per month, an additional 8% discount has been given from April until September 2020
• As announced by the Government under the Pakej Rangsangan Ekonomi 2020 (PRE2020), a 15% discount on total monthly electricity consumption from 1 April to 30 September 2020 was provided to six (6) categories of businesses affected by COVID-19.
• Subsequently, the Economic Stimulus Package was extended to other sectors under PRE2020, including domestic, commercial, industrial and agriculture sectors were entitled for a 2% discount on their total monthly electricity consumption for the period of six months from 1 April to 30 September 2020.
• Under PRIHATIN, an additional 15%-50% discount was offered to domestic customers in Peninsular Malaysia based on the total monthly consumption of each household, with higher discounts given for the lower consumption band.
Bantuan Prihatin Elektrik (BPE) was an additional assistance package provided by the Government of Malaysia with TNB to all domestic customers in the form of free electricity up to RM77 per month, equivalent to the first 300kWh electricity usage for 3 months during Movement Control Order (MCO) from April to June 2020. It was a one-off amount reflected in the July 2020 electricity bill.
In addition, domestic customers who consumed electricity between 601 - 900 kWh per month enjoyed a 10% discount which is an additional 8% of the existing 2% discount from April to December 2020.
The PRIHATIN electricity bill discount for all domestic customers was extended to 31 December 2021.
For domestic customers with no arrears exceeding 6 months on 31 December 2020, there would be no disconnection of electricity supply for a period of 3 months (1 January to 31 March 2021).
The Easy Payment Plan, which was implemented in May 2020, will be extended until 30 June 2021 to eligible domestic customers.
February to June 2020
End of June 2021
July – December 2020
December 2020 – March 2021
Sustainability at TNB
In light of the COVID-19 pandemic, TNB, through PELITAWANIS aims to continue uplifting and brighteningthe lives of communities in need.

p.139
INTEGRATED ANNUAL REPORT 2020
SUSTAINABILITY STATEMENT
Safeguarding Our Employees
The occupational health and safety of our employees has been of critical priority at TNB during this pandemic. In response, we had rapidly established the COVID-19 Crisis Response Team (CRT) under Group Human Resources (GHR) Division as part of our Business Continuity Management (BCM). The CRT also falls within the purview of the COVID-19 Executive Committee for sound governance.
TNB’s HR Crisis Command Structure
Planning HR BCM Crisis Response Team Logistic
• Performs regular training and drills based on updated HR BCM guidelines
• Assesses and verifies threat situation with TNB Healthcare
• Alerts the Crisis Commander of potential crisis and notifies all CRT members once the crisis is declared
• Monitors and records key activities and decisions made
• TNB Healthcare• Daily monitoring of the COVID-19
situation• Disseminates information to employees• Liaises with the Ministry of Health
(MOH)• Coordinates all medical-related
activities• CRT Team
• Communicates with affected employees and their families
• Makes the relevant logistical arrangements before, during and after the crisis (e.g. funding, transportation)
• Gathers and disseminates relevant information to the CRT
• Settles any outstanding payments during the recovery period
Communication Safety and Security Operation
• Disseminates information and conducts external communications (e.g. media statements, social media), when necessary
• Advises on proper HSE practices and security controls
• Strategises action plans that serve in the best interest of affected staff
Heads of Divisions/Departments:• Continuously assess the crisis situation
with the Crisis Commander• Gathers and disseminates relevant
information to the Crisis Commander
Crisis Commander (Chief People Officer)
• Assesses the situation upon alert from the Planning team and declares state of crisis• Authorises the action plans during the crisis• Declares when crisis is over
Strategic Actions• Protocols were implemented to monitor employees who tested positive for
COVID-19, while contact-tracing procedures were deployed• Most training programmes have been migrated online to a digital learning
delivery to minimise infection risk• PPE has been made available to TNB employees, with priority given to our
frontliners which include personnel in Kedai Tenaga, meter readers, and security officers at our premises
• Work-from-home initiative has been implemented, where applicable, to safely and remotely continue operations
01
Communicating With Our People• Frequent communication with all employees on COVID-19 information and
safety measures• Access to counselling services for employees who face mental health
challenges and personal struggles during this period• Webinars focused on maintaining mental and physical well-being while
working from home
02
Standard Operating Procedures (SOPs)• TNB has established and launched the Employee Self Health Declaration
(ESHD) portal, a daily health check-in platform to monitor our people’s well-being
• Clear SOPs are consistently communicated to and accessible by all employees to promote good personal hygiene and social distancing
03
As our prime concerns are to safeguard our people and ensure business continuity, we have invested more than RM21.4 million in our COVID-19 Pandemic Management as at 31 December 2020 covering key initiatives including:
Masks, face shields, hand sanitisers
RM1,260,670
Building disinfection and preparatory measures
RM504,650
COVID-19 allowance for TNB frontliners in critical
services (April - June 2020)
RM18,330,750
Employee return-to-work kits
RM815,000
Sustainability at TNB

p.140
TENAGA NASIONAL BERHAD
Sustainable Infrastructure and Ecosystems
Developments in the energy industry landscape, along with the shift towards low-carbon generation and grid digitalisation require TNB to be innovative, cost-effective and efficient to remain competitive.
RELATED MATERIAL MATTER(S):
• Business and Financial Performance • Tax• Energy Transition and Innovation • Reliable Energy and Fair Tariffs• Climate Change and Energy
Efficiency• Cyber Security Management• Sustainable Supply Chain
Generation Fuel Mix
TNB’s generation fuel mix is dependent on the Peninsular Malaysia Generation Development Plan determined by the Planning and Implementation Committee for Electricity Supply and Tariff (JPPPET), which is chaired by the Ministry of Energy and Natural Resources (KeTSA).
Empowering the Nation
Generation Fuel Mix for Peninsular Malaysia for (FY2020)
Coal
Hydro
Gas
Solar
Others
65.84%
3.78%
0.01%0.70%
29.67%
With a total capacity of 30MW, the Large Scale Solar (LSS) plant located in Bukit Selambau, Kedah began operations 114 days ahead of schedule.
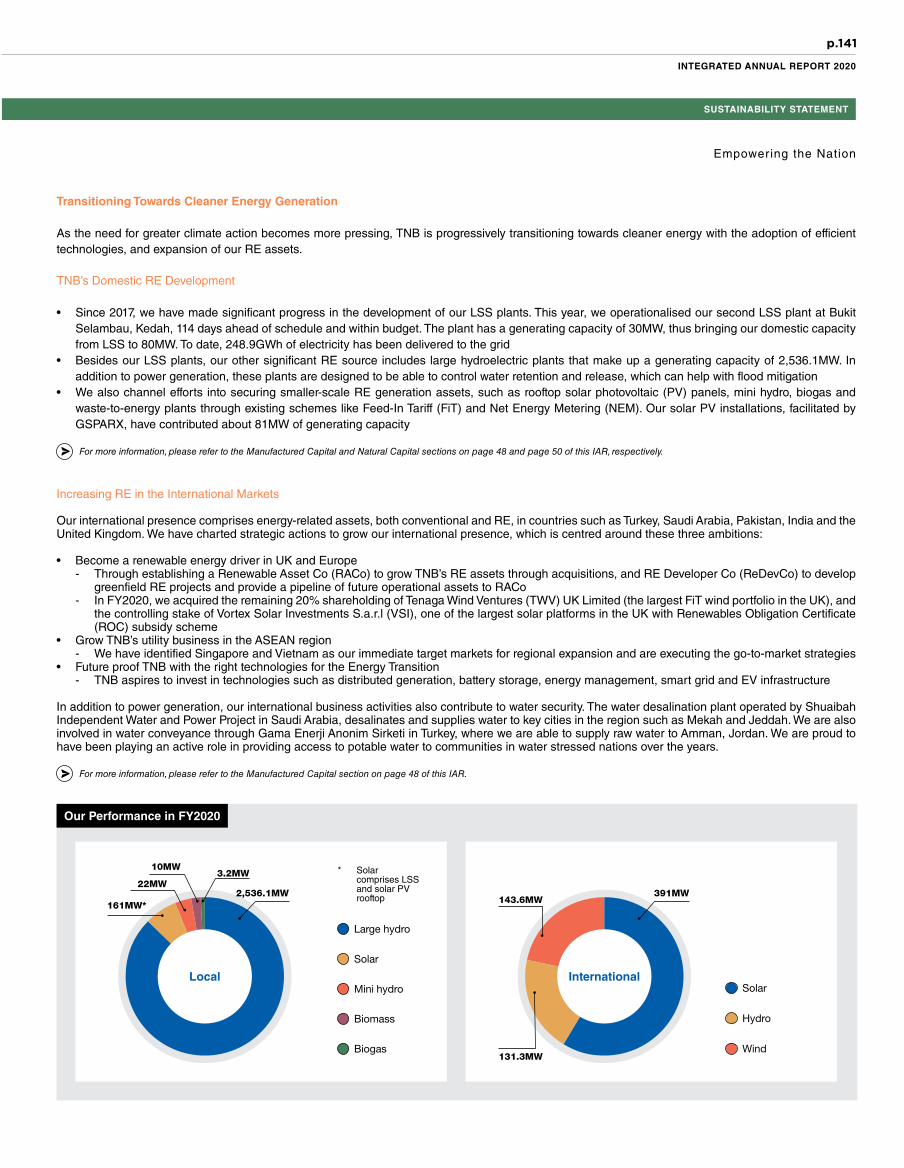
p.141
INTEGRATED ANNUAL REPORT 2020
SUSTAINABILITY STATEMENT
Empowering the Nation
Transitioning Towards Cleaner Energy Generation
As the need for greater climate action becomes more pressing, TNB is progressively transitioning towards cleaner energy with the adoption of efficient technologies, and expansion of our RE assets.
Increasing RE in the International Markets
Our international presence comprises energy-related assets, both conventional and RE, in countries such as Turkey, Saudi Arabia, Pakistan, India and the United Kingdom. We have charted strategic actions to grow our international presence, which is centred around these three ambitions:
• Become a renewable energy driver in UK and Europe- Through establishing a Renewable Asset Co (RACo) to grow TNB’s RE assets through acquisitions, and RE Developer Co (ReDevCo) to develop
greenfield RE projects and provide a pipeline of future operational assets to RACo- In FY2020, we acquired the remaining 20% shareholding of Tenaga Wind Ventures (TWV) UK Limited (the largest FiT wind portfolio in the UK), and
the controlling stake of Vortex Solar Investments S.a.r.l (VSI), one of the largest solar platforms in the UK with Renewables Obligation Certificate (ROC) subsidy scheme
• Grow TNB’s utility business in the ASEAN region- We have identified Singapore and Vietnam as our immediate target markets for regional expansion and are executing the go-to-market strategies
• Future proof TNB with the right technologies for the Energy Transition- TNB aspires to invest in technologies such as distributed generation, battery storage, energy management, smart grid and EV infrastructure
In addition to power generation, our international business activities also contribute to water security. The water desalination plant operated by Shuaibah Independent Water and Power Project in Saudi Arabia, desalinates and supplies water to key cities in the region such as Mekah and Jeddah. We are also involved in water conveyance through Gama Enerji Anonim Sirketi in Turkey, where we are able to supply raw water to Amman, Jordan. We are proud to have been playing an active role in providing access to potable water to communities in water stressed nations over the years.
TNB’s Domestic RE Development
• Since 2017, we have made significant progress in the development of our LSS plants. This year, we operationalised our second LSS plant at Bukit Selambau, Kedah, 114 days ahead of schedule and within budget. The plant has a generating capacity of 30MW, thus bringing our domestic capacity from LSS to 80MW. To date, 248.9GWh of electricity has been delivered to the grid
• Besides our LSS plants, our other significant RE source includes large hydroelectric plants that make up a generating capacity of 2,536.1MW. In addition to power generation, these plants are designed to be able to control water retention and release, which can help with flood mitigation
• We also channel efforts into securing smaller-scale RE generation assets, such as rooftop solar photovoltaic (PV) panels, mini hydro, biogas and waste-to-energy plants through existing schemes like Feed-In Tariff (FiT) and Net Energy Metering (NEM). Our solar PV installations, facilitated by GSPARX, have contributed about 81MW of generating capacity
For more information, please refer to the Manufactured Capital and Natural Capital sections on page 48 and page 50 of this IAR, respectively.
For more information, please refer to the Manufactured Capital section on page 48 of this IAR.
Solar
Wind
Hydro
Large hydro
Mini hydro
Solar
Biomass
Biogas131.3MW
International
143.6MW391MW
* Solar comprises LSS and solar PV rooftop
Local
22MW2,536.1MW
3.2MW10MW
161MW*
Our Performance in FY2020

p.142
TENAGA NASIONAL BERHAD
Continued Reliability of Electricity Supply and Operational Excellence
We are vigilant in safeguarding the supply of electricity, one of our prime responsibilities to the nation. We leverage our Business Continuity Management (BCM), asset optimisation initiatives and innovative technologies to not only ensure the continuity of our services but also deliver operational excellence, encourage business growth and improve energy and cost efficiency.
Focus Our Approach Key FY2020 Activities
Business Continuity Management practices are established to safeguard human lives, assets and the environment in a crisis or disruption, both natural and technological
For more information on TNB’s flood management practices, please refer to the Climate Change section on page 152.
• TNB’s BCM Framework is the basis on which divisions, including power plants, customise and implement their respective business continuity and emergency response plans
• The effectiveness of these plans are tested at each level of the organisation, from corporate headquarters to zones and states. Drills were conducted with various scenarios such as wide-area electricity disruptions, cyber security intrustions, floods and the pandemic
• Our Cyber Security Operating Model, ISO/IEC 27001:2013 certified Information Security Management System, Payment Card Industry Data Security Standard certification for online payments, policies and security controls protect data accessibility and integrity
For more information on how we have responded to the COVID-19 pandemic, please refer to pages 137-139.
• We initiated COVID-19 preparatory measures as early as January 2020 when the virus started spreading rapidly in neighbouring countries. Business continuity plans across the Group were enhanced to ensure availability and reliability of electricity supply to the nation while protecting the safety and health of employees and customers
• We initiated the Stakeholders and Community Engagement for Disaster Risk Reduction of TNB’s Hydro Dams Programme (SEP) in May 2020. The objectives of the SEP are to increase awareness among surrounding communities and encourage the participation of local authorities and agencies in managing potential dam-related disasters
Asset Optimisation is necessary to maintain and protect assets
• TNB’s Asset Management Plan is an effective management system that is ISO 55001:2014 certified. The Plan charts a roadmap to achieve the greatest value from physical assets
• Our Asset Performance Management System focuses on the management of the asset’s entire lifecycle
• Preventive Maintenance and Condition-Based Maintenance ensures assets are in optimal condition
• SAIDI 50 Initiatives focus on reducing frequency and duration of outages
• Generation Turnaround Programme unlocks asset potential and enhances the performance of TNB’s power plants
• Intelligent Predictive and Diagnostic Monitoring System detects anomalies in operations of major assets thus enabling early preventive actions
• Drones enhance land planning functions and Geospatial Information System data, that are needed to manage, operate and analyse TNB’s network assets
• Automatic Fault Analysis and Fault Location Identification System enable faster decision-making by operations and maintenance teams during restoration processes
• Distributed Generation (DG) infrastructure enhances network visibility, transparency and reliability for all DG connection
• Advanced Metering Infrastructure (AMI), including smart meters, enables remote automated meter readings and detailed load profile information for better load management and control of electricity consumption
• Volt-VAr Optimisation enables TNB to perform control and system network optimisation
• Distribution Automation provides real-time management of network operations
• Pelan Jalinan Digital Negara (JENDELA) aims to increase accessibility of high-speed broadband services
• Wide Area Monitoring System (WAMS) enhances the system operators’ real-time “situational awareness” that is vital for a safe and reliable grid
For more information on AMI, please refer to the Customer Centricity section on page 145.
Innovative technologies provide more accessible products and services
• TNB’s initiatives are centred around “Grid of the Future” technologies, including digitalisation of our grid system for increased flexibility
Empowering the Nation

p.143
INTEGRATED ANNUAL REPORT 2020
SUSTAINABILITY STATEMENT
Empowering the Nation
Our Performance in FY2020
Conducted one (1) online cyber drill
that covered critical business operations
Conducted 11 ERP drills at thermal and hydro
power plants and nine (9) flood drills at state
and zone level
Approximately 26,000 premises have been
fiberised under JENDELA
We monitor our performance in terms of energy reliability and operational excellence through EAF, EUOF, SAIDI and System Minutes, which can be found in the Manufactured Capital section on page 49 of this IAR.
Other performance indicators are highlighted below:
Sustainable Supply Chain
We support Malaysia’s business ecosystem by channeling over 95% of our procurement spend on local suppliers. This enables us to promote a responsible supply chain that abides with our business principles and standards of ethics, encapsulated in our Procurement Code of Conduct and Procurement and Supply Chain (P&SC) Policy and Procedures.
Given our large number of suppliers, we will be taking further steps to positively influence their ESG practices, with more focus on occupational health and safety, and human rights. This is reflected in our P&SC 2.0 Transformation Programme launched this year, part of which addresses nation-building through vendor development.
Upskilling Programme for TNB’s Contractors
Our Upskilling Programme is specially designed and engineered by TNB to help our contractors enhance their competencies and deliverables. This programme is intended to be holistic in nature, covering training on street lighting, cabling works, substation, overhead lines and metering. To ensure continuous supply without interruption to customers, TNB has also embarked on the programme of live-line working method trained by TNB’s in-house expert to contractors.
Contractors who have completed these mandatory training programmes will be certified with the Technical Qualification Cards (Kad Kelayakan Teknikal, KKT). Since January 2020, TNB has made it mandatory for our contractors to deploy only KKT certificate holders on-site.
The Upskilling Programme serves as a win-win approach for both TNB and our contractors. TNB will be able to expect higher-quality products and services from contractors that meet our specifications and expectations, while contractors will be given the opportunity to become more competitive and be enlisted as preferred contractors for TNB.
Performance in FY2020 for TNB Group
Local International
Total Spent on Procurement (RM billion) Total Number of Suppliers (No.)
*0.11
*0.10
0.09
FY2018 FY2019 FY2020 FY2020FY2019
*57
52
FY2018
*55
* This data has been restated due to change in methodology
*9.3
9
*9.8
1
7.06
*3,0
67
3,39
0*3,4
02

p.144
TENAGA NASIONAL BERHAD
Customer Centricity
We seek to continually strengthen our customers’ trust by providing exceptional service through effective engagement and offering innovative solutions that empower our customers while ensuring their data privacy.
RELATED MATERIAL MATTER(s):
• Customer Experience• Climate Change and Energy Efficiency
Winning Our Customers
Customer Engagement and Satisfaction
We value the insights, feedback and concerns of our customers obtained through our customer interaction “click, call and come over” platforms.
In FY2020, our Customer Satisfaction Index (CSI) score was 86%, an increase from 81% in the past four (4)consecutive years and the highest in 20 years
Our Customer Feedback Mechanism alerts us on critical issues raised by customers, enabling us to take the necessary actions to resolve them efficiently. This year, we added a Service Request and Complaint (SRC) category in our customer relationship management platform.
In FY2020, we received customer complaints about an increase in electricity bills during the MCO period. Understanding the need to quickly clarify and ease their concerns, we held a press conference and our customer service officers provided one-to-one explanations of the calculations and billing adjustments via the TNB CareLine and TNB Kedai Tenaga. As meter reading activities and issuance of physical bills were suspended during MCO from March to May 2020 to protect the health of our customers and employees, TNB implemented a prorated billing mechanism to ensure customers were not overcharged. This mechanism gives lower and fairer billing charges compared to non-prorated methods as it is based on projections calculated from previous months' usage. However, we found that there was an increased usage of between 20% to 50% for domestic customers due to implementation of work-from-home policies that resulted in higher than normal billing charges.
Cognisant of our customers’ difficulties brought on by COVID-19, we took this opportunity to introduce targeted assistance:• Residential customers: Provided relief programmes since the beginning of the MCO in April 2020
through Easy Payment Plan (EPP), embargo on disconnections and waiver of interest on late payments
• Commercial and industrial customers: Assistance was extended through Deferment of Project Minimum Monthly Charge (PMMC), Waiver for Top-Up and/or Standby Charges for Co-generators, Deferment of Connected Load Charge (CLC) and Waiver of Power Factor penalty for Smart Meter 1 Phase customers
To date, we have had ZERO reported complaints regarding breaches to customer privacy
Safeguarding Customer Privacy
On top of complying with the relevant regulations, particularly the Personal Data Protection Act (PDPA) 2010, we protect customer data privacy and access through our Cyber Security Operating Model, Personal Data Protection Policy and strict security controls. We have implemented several security controls to date to reinforce our online payment systems through the Payment Card Industry Data Security Standard.
For more information on how we are helping our customers during the COVID-19 pandemic, please refer to page 138.
TNB Customer Interaction Channels
Call:• Contact Centre & Interactive
Voice a Response (IVR)
Click:• myTNB Mobile Application• myTNB Portal• Social media (@TNBCareLine)• SMS• Write-in (email)• Web Chat
Come Over:• Kedai Tenaga• Kiosk• 3rd Party Services• Key Account Managers
Empowering the Nation
TNB strives to win customer trust and loyalty over the long-term through effective engagement, quality service and exceptional customer experience.

p.145
INTEGRATED ANNUAL REPORT 2020
SUSTAINABILITY STATEMENT
Beyond kWh Services
We took the initiative to introduce innovative solutions to the market and broadened our portfolio of products and services, transcending ‘beyond kWh services’ to provide more choices and experiences to customers.
Enabling Smarter Choices for Our Customers
We have a wide range of smart, energy-efficient solutions being progressively rolled out to our customers.
Advanced Metering Infrastructure (AMI)
01AMI is an integrated and intelligent system that includes smart meters. Well equipped with digital features, it provides near real-time data through our myTNB web portal and mobile app that customers can use to monitor and manage their electricity usage, thus potentially leading to cost savings. This feature also proved to be beneficial during the MCO period, when customers with smart meters were able to obtain their actual bill instead of the estimated amount.
03Beyond 2021, we target to install 7.5 million smart meters nationwide throughout the Regulatory Period 3 and beyond. We have strategic collaborations with local vendors to develop new technologies and capabilities that will facilitate the expansion of this initiative.
02Even while facing some restrictions during the MCO period, we managed to deploy 300,000 smart meters in Melaka as at August 2020, marking the completion of Phase 1. During the Conditional MCO period, we were permitted to carry out the installation while making sure we followed the COVID-19 SOP Guidelines.
As of December 2020, there were a total of 891,294 smart meters installed primarily in Melaka and Klang Valley. The remaining installation of approximately 600,000 meters will be in Klang Valley and will mark the achievement of our target of 1.5 million smart meters installed by the end of 2021.
Initiative Description and FY2020 Highlights
Energy efficiency (EE) programmes with various stakeholders
• TNB conducted 16 EE awareness programmes
• Due to the COVID-19 pandemic, we utilised digital platform to conduct EE awareness programmes especially with higher learning institutions including Universiti Teknologi Mara (UiTM) and Universiti Kebangsaan Malaysian (UKM)
• EE expertise was shared with Istana Arau Perlis as well as the 11th Infantry Brigade of Malaysia
Making Electricity Visible (MaEVI) and MaEVI-B
• Helps customers monitor their electricity consumption, automate their appliances and improve their home security through a mobile application
Energy Performance Contracts (EPCs)
• An arrangement between energy services companies and facility owners to improve EE through investments in energy-efficient equipment
• To date, about RM5.45 million worth in contract value has been signed between TNB Energy Services Sdn Bhd and facility owners
• The expected annual energy savings from the two new EPC projects this year are approximately 473,402kWh
Empowering the Nation
With the installation of smart meters, customers will be able to enjoy detailed information on their energy consumption.

p.146
TENAGA NASIONAL BERHAD
Promoting RE to Our Customers
We carried out initiatives to promote RE generation and supply among our customer base as a way of supporting the energy transition:
Initiative Description and FY2020 Highlights
Feed-in Tariff (FiT) Programme
• Equips RE asset owners in Peninsular Malaysia with Feed-in Approvals to supply electricity to the grid at a fixed price• To date, 9,478 FiT projects have been commissioned with an installed capacity of 537.02MW
Self-generation from solar PV
myGreen+ and mGATS
• TNB implements beyond-the-meter schemes for Supply Agreement for Renewable Energy (SARE) such as solar leasing, Power Purchase Agreement (PPA) or a hybrid of both schemes
• In FY2020, 129 contracts were secured by commercial and industrial customers through SARE, while 297 residential customers acquired solar PV panels through direct purchases. This resulted in a total RE generating capacity of approximately 81MW
• In September 2019, GSPARX signed a contract with Mydin Mall Manjoi in Ipoh, to install rooftop solar PV with a capacity of 340kWp. Since the completion of its installation in October 2020, RM13,600 in electricity bills have been saved. The project is anticipated to save a total of RM3.24 million over a 25-year period. Following the success of this partnership, the first of its kind for chain retailers in Malaysia, Mydin Holdings has awarded GSPARX contracts for five (5) other branches in Peninsular Malaysia, which is expected to contribute to a total of 8.3MWp
• myGreen+ and mGATS were introduced in FY2019 to promote RE development among customers and allow customers to purchase green energy without having to install RE infrastructure and equipment
• To date, there are 120 subscriptions to myGreen+, resulting in 190MWh of electricity consumption• mGATS provides a platform for customers to purchase Renewable Energy Certificates (REC) and this year, TNB
issued 483,400MWh of RECs
Net Energy Metering (NEM) Scheme
• Allows customers in Peninsular Malaysia to export excess energy produced from their solar PV systems back to the grid• To date, there are 3,288 NEM participants making up a total capacity of 265.27MW
Empowering the Nation
Dato' Nor Azman bin Mufti (seated left) and Datuk Ir. Megat Jalaluddin bin Megat Hassan (seated far right) at a signing ceremony with Mydin mall to install rooftop solar PV at its branches. (Picture taken in September 2019)

p.147
INTEGRATED ANNUAL REPORT 2020
SUSTAINABILITY STATEMENT
Environmental Stewardship
Governing Environmental Matters
Generating electricity unavoidably entails consumption of fuel and water in large quantities, however, TNB strives to ensure that we do not utilise more resources than absolutely required and we implement initiatives to improve operational efficiency. We manage our environmental impacts through optimal waste management, effective biodiversity conservation and reduction of greenhouse gases and pollutants. These commitments and management plans are encapsulated in our Environmental Policy.
In FY2020, six (6) sanctions were recorded, arising from our non-compliance with environmental legal requirement. Our efforts to mitigate this include establishing more stringent scheduled waste management guidelines, conducting regular audits, inspections and awareness sessions, and appointing a scheduled waste coordinator at each state of operations, among others.
RELATED MATERIAL MATTER(s):
• Environmental Management• Biodiversity Management• Natural Resource Consumption• Waste Management• Rights of Indigenous Peoples
Given the nature and scale of our business activities, we place great importance on minimising our environmental footprint across our value chain and assets.
Minimising Environmental Impacts
Our approach and key FY2020 highlights:
• TNB’s Health, Safety and Environmental Management System (HSEMS) outlines environmental standards and strengthens the governance of environmental requirements across all divisions, departments and business units in TNB
• Our environmental performance is under the purview of the Environmental Management Committee, which comprises the Environmental Performance Monitoring Committee and Environmental Regulatory Compliance Monitoring Committee across all relevant divisions, departments and business units in TNB
• The self-monitoring environmental management tool, Guided Self-Regulation (GSR), has been implemented across all relevant divisions and subsidiaries
For more information on our waste management, please refer to page 148.
Besides lighting up homes, we grow green ones too and endeavour to continue our conservation efforts towards improved environmental performance.
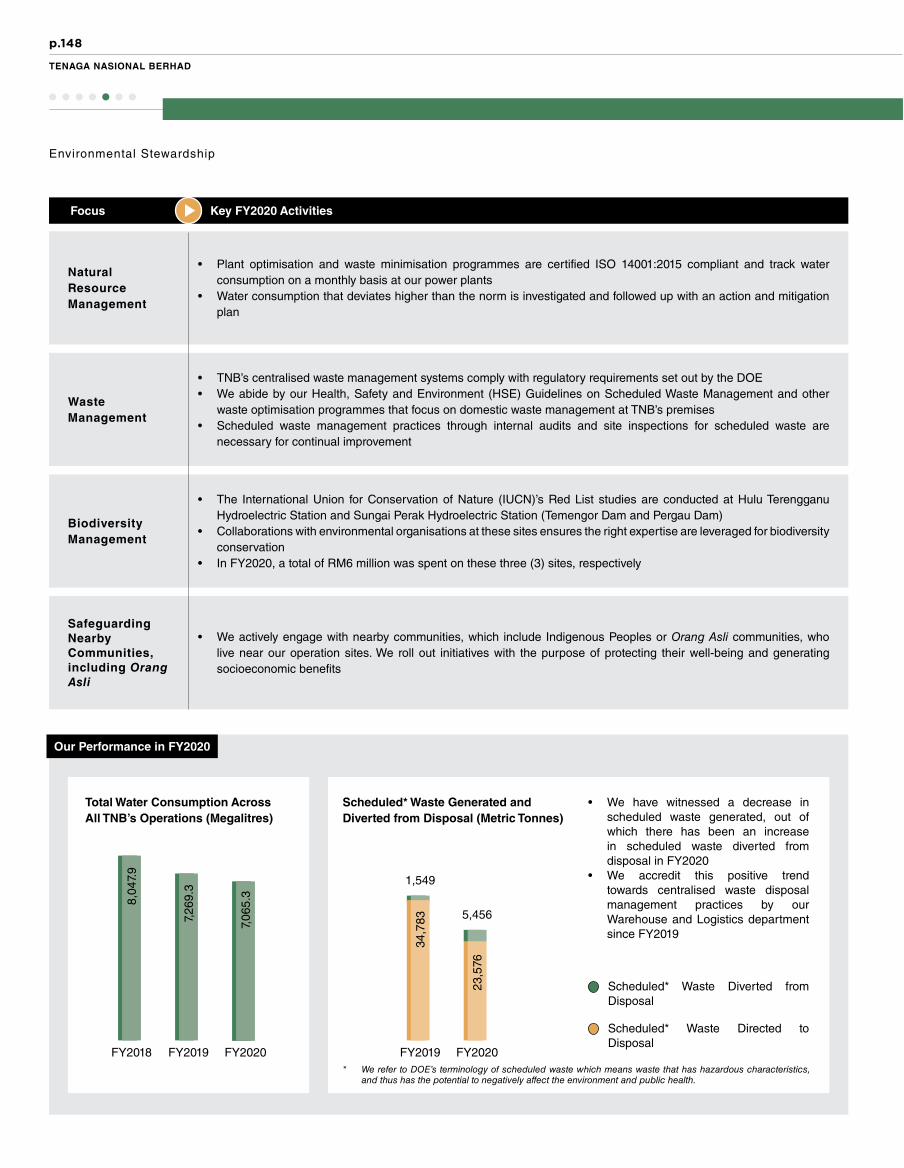
p.148
TENAGA NASIONAL BERHAD
Environmental Stewardship
Focus Key FY2020 Activities
Waste Management
Biodiversity Management
Safeguarding Nearby Communities, including Orang Asli
• TNB’s centralised waste management systems comply with regulatory requirements set out by the DOE• We abide by our Health, Safety and Environment (HSE) Guidelines on Scheduled Waste Management and other
waste optimisation programmes that focus on domestic waste management at TNB’s premises• Scheduled waste management practices through internal audits and site inspections for scheduled waste are
necessary for continual improvement
• The International Union for Conservation of Nature (IUCN)’s Red List studies are conducted at Hulu Terengganu Hydroelectric Station and Sungai Perak Hydroelectric Station (Temengor Dam and Pergau Dam)
• Collaborations with environmental organisations at these sites ensures the right expertise are leveraged for biodiversity conservation
• In FY2020, a total of RM6 million was spent on these three (3) sites, respectively
• We actively engage with nearby communities, which include Indigenous Peoples or Orang Asli communities, who live near our operation sites. We roll out initiatives with the purpose of protecting their well-being and generating socioeconomic benefits
Natural Resource Management
• Plant optimisation and waste minimisation programmes are certified ISO 14001:2015 compliant and track water consumption on a monthly basis at our power plants
• Water consumption that deviates higher than the norm is investigated and followed up with an action and mitigation plan
Our Performance in FY2020
FY2020FY2019FY2018
Total Water Consumption Across All TNB’s Operations (Megalitres)
FY2020FY2019
Scheduled* Waste Generated and Diverted from Disposal (Metric Tonnes)
• We have witnessed a decrease in scheduled waste generated, out of which there has been an increase in scheduled waste diverted from disposal in FY2020
• We accredit this positive trend towards centralised waste disposal management practices by our Warehouse and Logistics department since FY2019
* We refer to DOE’s terminology of scheduled waste which means waste that has hazardous characteristics, and thus has the potential to negatively affect the environment and public health.
Scheduled* Waste Diverted from Disposal
Scheduled* Waste Directed to Disposal
7,26
9.3
8,04
7.9
7,06
5.3
34,7
83
23,5
76
5,456
1,549

p.149
INTEGRATED ANNUAL REPORT 2020
SUSTAINABILITY STATEMENT
Environmental Stewardship
Sungai Perak Hydroelectric Station (Pergau Dam)
• Taman Perlindungan Ekosistem Sultan Ismail Petra (TPESIP) was gazetted as a State Park in March 2020• TNB has developed a Management Plan and Action Plan for TPESIP, and conducted a workshop this year with
various state agencies to review and finalise its contents
Sungai Perak Hydroelectric Station (Temengor Dam)
• Royal Belum State Park formed as part of Temengor catchment and managed by the Perak State Park Cooperation, this site also holds various eco-tourism activities
• With Sungai Tiang being located in the Eco-Cultural Zone of Proposed Eco-Tourism Zone at Royal Belum State Park, eco-tourism activities in the area are managed by Koperasi Orang Asli Kampung Sungai Tiang (KOAST) under a pilot project
• The Orang Asli community is also involved with nature and heritage conservation efforts at Tasik Temengor, an important freshwater ecosystem
Hulu Terengganu Hydroelectric Station
• Forest seedlings from trees and grass were replanted for forest regeneration at sites that have undergone changes in environmental conditions. Forest regeneration will enhance the habitat’s function as a wildlife corridor
• Conservation efforts for fish species are carried out through various eco-tourism activities such as fish sanctuaries (e.g. Kelah Sanctuary), as part of TNBR’s Fish and Fisheries Management, and sport fishing through the catch-and-release methods. These activities also increase tourism in the area, thus enhancing the livelihood of local communities
The IUCN study findings:
Critically Endangered (CE)
Data Deficient
Endangered (EN)
Not Evaluated
Vulnerable (VU) Near Threatened (NT) Least Concern (LC)
Species Group Number of Species Total Spend (RM)
Hulu Terengganu Hydroelectric Station
2.90 million
1.80 million
0.18 million
1.12 million
Fish*
Sungai Perak Hydroelectric Station (Temengor Dam)
Fish*
Sungai Perak Hydroelectric Station (Pergau Dam)
Fish
Terrestrial
Our biodiversity-related initiatives:
Site Initiatives and Highlights in FY2020
0 0 0 0 21 1 1
0 0 0 0 10 1 1
0 1 0 0 33 2 0
1 5 8 6 108 0 0
* There is no quantitative data for terrestrial species in FY2020 as the relevant studies for the site have concluded

p.150
TENAGA NASIONAL BERHAD
Climate Change
We embrace innovative solutions that facilitate our climate change mitigation and adaptation efforts, especially on the reduction of greenhouse gas (GHG) emissions from our operations.
RELATED MATERIAL MATTER(s):
• Climate Change and Energy Efficiency• Energy Transition and Innovation
Addressing Climate Change
In line with UN SDG 13 on Climate Action, we have studied the adoption of the Financial Stability Board’s Task Force on Climate-related Financial Disclosures (TCFD) framework to anticipate and manage the physical and transition risks and opportunities to our business, including a consideration of the financial implications of such risks. We will continue to progressively disclose our efforts with reference to the four core elements recommended by the TCFD framework: Governance, Strategy, Risk Management and Metrics & Targets.
Recommendations of the TCFD Framework
Governance
• Governance of climate-related risks and opportunities
Strategy
• Actual and potential impacts of climate-related risks and opportunities on the business, strategy, and financial planning
Risk Management
• Processes to identify, assess, and manage climate-related risks and opportunities
Metrics & Targets
• Metrics and targets to assess and manage identified climate-related risks and opportunities
Governance
Strategy
Risk Management
Metrics & Targets
Environmental Stewardship
With the ongoing global energy transition, the future energy source is green and renewable as the world seeks to lower its carbon footprint in order to mitigate climate change.

p.151
INTEGRATED ANNUAL REPORT 2020
SUSTAINABILITY STATEMENT
Environmental Stewardship
Strategy • TNB has identified our key climate-related physical risks, including higher occurrence of floods and storms, which informed our strategies and action plans
• Our climate change mitigation strategies and approach are centred around expanding low-carbon generation assets, reducing GHG emissions and managing our energy consumption
• Our low-carbon generation portfolio encompasses both RE assets and conventional assets that have adopted efficient technology
• We manage our energy consumption through initiatives such as EE improvement programmes for our buildings and power plants, retrofitting assets, and conducting EE training for employees
• In the immediate term, the 6 game changers comprise strategies to address climate-related risks, including modernising the grid to be resilient against the impacts of climate change, decarbonising our energy mix through building a global solar manufacturing hub, fostering a local ecosystem of energy efficiency manufacturers, technology and solution providers, and rolling out EV infrastructure to support a shift towards electric automotives
• This year, TNB conducted an “Energy Transition” study to assess different scenarios of the energy landscape of Malaysia by 2030. We then aligned our RT with the scenario that pushes for a green agenda and is driven by national policies and incentives
Governance • All matters pertaining to climate change fall under the purview of the SDC, with oversight by the Board• Principles to guide climate action, particularly on GHG emissions, are covered under our Environmental Policy and
Environmental Management System
For more information, please refer to the Spirit of Responsibility: How We Are Governed section on page 127, and Minimising Environmental Impacts section on page 147.
Metrics & Targets
Risk Management
• TNB has recently developed a Climate Change Risk Assessment Tool and has preliminarily identified and categorised our climate-related risks into market, policy and legal, technology and physical risks
• Climate-related risk has been identified as a strategic risk to TNB and is being addressed within our ERM Framework• Our FY2020 materiality assessment, which is largely stakeholder-led, has similarly determined climate change as a priority
material matter
For more information, please refer to the What Matters to Us section on page 132.
• Our GHG Emissions Management System (GEMS), a web-based data input and procession software, is utilised for regular GHG emissions data collection and analysis
For more information, please refer to pages 39 and 137 of this IAR.
TCFD Core Elements How We Address It
Our Performance in FY2020
FY2020FY2019FY2018
0.19
0.19
0.24
Scope 1 and 2 GHG Emissions*
(million tCO2e)
GHG Emissions Intensity*
(tCO2e/MWh)
GHG Emissions Mitigated*
(million tCO2e)
FY2020FY2019FY2018 FY2020FY2019FY2018
Scope 1 Scope 2
* The data for FY2018 & FY2019 are updated using Global Warming Potential (GWP) from the Intergovernmental Panel on Climate Change (IPCC) 5th Assessment Report and respective year of Single Buyer emission factor data.
39.0
9
33.7
937.0
0
0.57
0.56
0.57
5.98
5.37
5.81
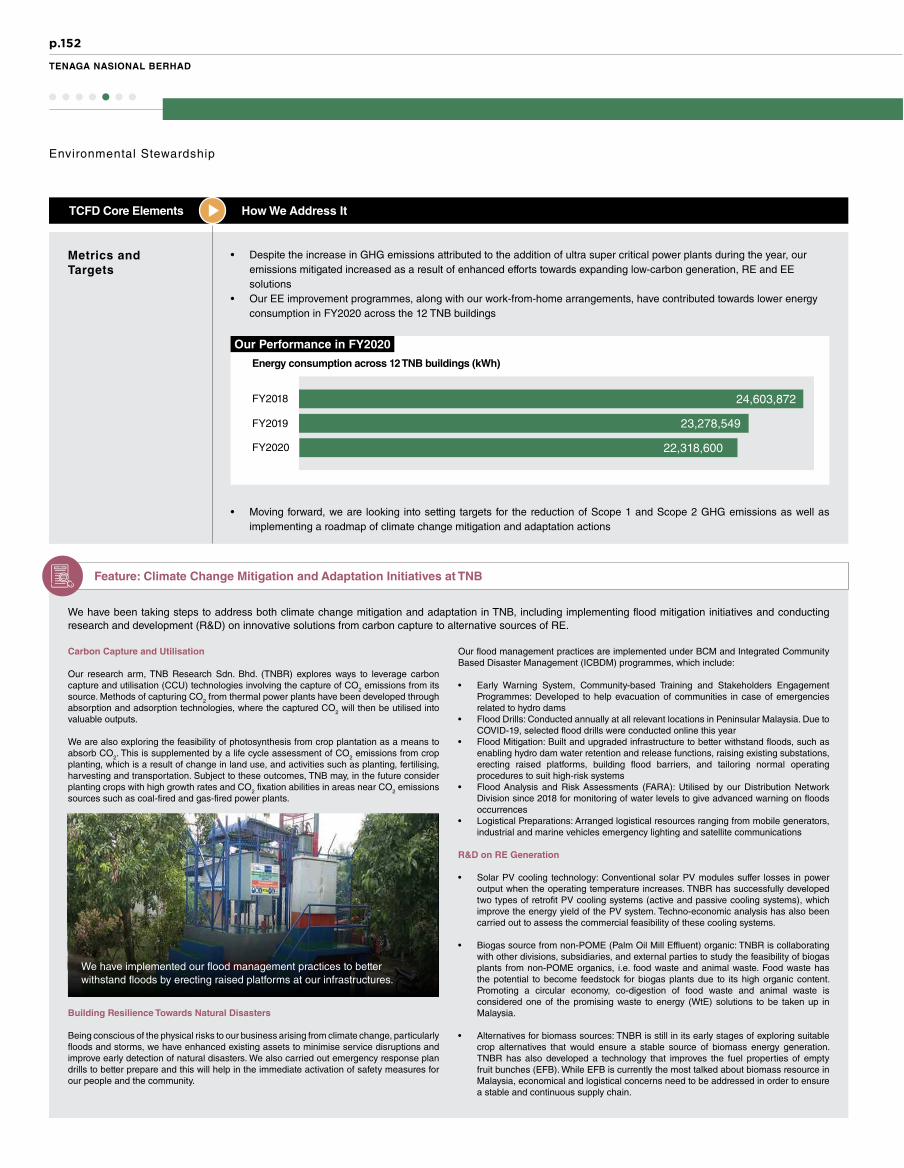
p.152
TENAGA NASIONAL BERHAD
Environmental Stewardship
Metrics and Targets
• Despite the increase in GHG emissions attributed to the addition of ultra super critical power plants during the year, our emissions mitigated increased as a result of enhanced efforts towards expanding low-carbon generation, RE and EE solutions
• Our EE improvement programmes, along with our work-from-home arrangements, have contributed towards lower energy consumption in FY2020 across the 12 TNB buildings
TCFD Core Elements How We Address It
• Moving forward, we are looking into setting targets for the reduction of Scope 1 and Scope 2 GHG emissions as well as implementing a roadmap of climate change mitigation and adaptation actions
Feature: Climate Change Mitigation and Adaptation Initiatives at TNB
We have been taking steps to address both climate change mitigation and adaptation in TNB, including implementing flood mitigation initiatives and conducting research and development (R&D) on innovative solutions from carbon capture to alternative sources of RE.
Carbon Capture and Utilisation
Our research arm, TNB Research Sdn. Bhd. (TNBR) explores ways to leverage carbon capture and utilisation (CCU) technologies involving the capture of CO2 emissions from its source. Methods of capturing CO2 from thermal power plants have been developed through absorption and adsorption technologies, where the captured CO2 will then be utilised into valuable outputs.
We are also exploring the feasibility of photosynthesis from crop plantation as a means to absorb CO2. This is supplemented by a life cycle assessment of CO2 emissions from crop planting, which is a result of change in land use, and activities such as planting, fertilising, harvesting and transportation. Subject to these outcomes, TNB may, in the future consider planting crops with high growth rates and CO2 fixation abilities in areas near CO2 emissions sources such as coal-fired and gas-fired power plants.
Building Resilience Towards Natural Disasters
Being conscious of the physical risks to our business arising from climate change, particularly floods and storms, we have enhanced existing assets to minimise service disruptions and improve early detection of natural disasters. We also carried out emergency response plan drills to better prepare and this will help in the immediate activation of safety measures for our people and the community.
Our flood management practices are implemented under BCM and Integrated Community Based Disaster Management (ICBDM) programmes, which include:
• Early Warning System, Community-based Training and Stakeholders Engagement Programmes: Developed to help evacuation of communities in case of emergencies related to hydro dams
• Flood Drills: Conducted annually at all relevant locations in Peninsular Malaysia. Due to COVID-19, selected flood drills were conducted online this year
• Flood Mitigation: Built and upgraded infrastructure to better withstand floods, such as enabling hydro dam water retention and release functions, raising existing substations, erecting raised platforms, building flood barriers, and tailoring normal operating procedures to suit high-risk systems
• Flood Analysis and Risk Assessments (FARA): Utilised by our Distribution Network Division since 2018 for monitoring of water levels to give advanced warning on floods occurrences
• Logistical Preparations: Arranged logistical resources ranging from mobile generators, industrial and marine vehicles emergency lighting and satellite communications
R&D on RE Generation
• Solar PV cooling technology: Conventional solar PV modules suffer losses in power output when the operating temperature increases. TNBR has successfully developed two types of retrofit PV cooling systems (active and passive cooling systems), which improve the energy yield of the PV system. Techno-economic analysis has also been carried out to assess the commercial feasibility of these cooling systems.
• Biogas source from non-POME (Palm Oil Mill Effluent) organic: TNBR is collaborating with other divisions, subsidiaries, and external parties to study the feasibility of biogas plants from non-POME organics, i.e. food waste and animal waste. Food waste has the potential to become feedstock for biogas plants due to its high organic content. Promoting a circular economy, co-digestion of food waste and animal waste is considered one of the promising waste to energy (WtE) solutions to be taken up in Malaysia.
• Alternatives for biomass sources: TNBR is still in its early stages of exploring suitable crop alternatives that would ensure a stable source of biomass energy generation. TNBR has also developed a technology that improves the fuel properties of empty fruit bunches (EFB). While EFB is currently the most talked about biomass resource in Malaysia, economical and logistical concerns need to be addressed in order to ensure a stable and continuous supply chain.
Our Performance in FY2020
FY2020
FY2019
FY2018
23,278,549
22,318,600
24,603,872
Energy consumption across 12 TNB buildings (kWh)
We have implemented our flood management practices to better withstand floods by erecting raised platforms at our infrastructures.

p.153
INTEGRATED ANNUAL REPORT 2020
SUSTAINABILITY STATEMENT
Our People and Their Value
Employment Management and Relations
Our people are essential to TNB’s success. We strive to establish a diverse and inclusive working environment that creates strong leaders, promotes high performance and develops skilled and adaptable talent.
RELATED MATERIAL MATTER(s):
• Employment Culture• Capability Building
Conducive Workplace
Our Human Resources (HR) strategy comprises HR Leap 6 and HR Guiding Principles to ensure a robust talent pipeline and promote a culture of high performance. In FY2020, we further launched Reimagining Culture to redefine our core values to drive our business transformation. We catalysed culture shifts, imperative for our people to thrive in our rapidly evolving business landscape. A series of workshops and roadshows were conducted for employees as part of our change management initiatives and to obtain their views on TNB’s identity and culture.
Our six (6) core values that form the cornerstone of Reimagining Culture are:
Integrity Collaborative Professionalism
HR Leap 6 Implements the HR Guiding Principles
HR Guiding Principles
HR Leap 6: HR policies and process categorised into 6 pillars
Business Driven
Agile Workforce
Learning Organisation
Total Motivation
Adaptive Mindset
Legacy
RECRUIT
DEVELOP
EXIT
PLAN
RETAIN
GROW
Focused on People with Care
Clarity of Actions with Knowledge
Simplicity of Processes with Trust
Customer Centricity Forward Thinking Mindfulness
Gearing towards stronger growth together, Reimagining Culture redefines our core values, grounding our people with these cornerstones to thrive in our rapidly evolving business landscape and dynamic transformation. (Picture taken in February 2020)

p.154
TENAGA NASIONAL BERHAD
Our approach and key FY2020 highlights:
01Talent attraction, recruitment and retention strategies are necessary to build a strong pipeline.
• Physical and virtual recruitment initiatives were organised to attract talented individuals who share our values
Nine (9) Key Recruitment Initiatives in FY2020
• Yes2Work with JPA Scholars, designed to empower participants by providing them with necessary exposure and development to increase employability
• KBS Virtual Career Fair, a 5-day online event that focuses on live engagements between employers and participants, which was attended by 531 participants
• Talentbank Digital Career Festival 1&2, a digital career fair held for 60 days to boost employer branding, promote internships, and graduate employment opportunities, which attracted 7,152 participants
• MDEC Digital Jobs Expo, a 5-day online event that features a series of webinars on digital economy jobs, which had 2,233 visitors
• Tenaga XP Hi-Tea Session, an engagement session with 12 experienced hires with a background in Cyber Security and Digital Innovation
• ALL4YOUTH Programme with GLCs, a collaboration which aims to identify and promote solutions that will increase youth employment and employability
• UNITEN Career Fair Week, a platform for companies to showcase diverse career opportunities
• Elevate Your Potential with TNB, a collaboration with student associations to organise career-related webinar sessions
• Collaboration with Malaysia Student Association Japan (MSAJ) to organise a webinar session with Malaysian students in Japan
02Employee benefits are important in ensuring a sense of security in their well-being.
• We offer competitive remuneration and benefits that support work-life balance, including for employees with families, as well as mental and physical healthcare
Employee Benefits
• Competitive benefits packages• Childcare facilities and nurseries• Housing accommodation and quarters for employees• Counselling services• Sports and recreational facilities• Career and development opportunities
03Listening to our people means having open conversations and encouraging an exchange of ideas.
• Employees have access to various platforms to encourage two-way communication• Through our biannual Engagement Pulse Survey, we are able to obtain views on what it is like to work at
TNB which gives us an understanding of our strengths and areas of improvement• The EPS conducted in January and July 2020 received a score of 90% and 89% respectively (as compared
to 88% and 90% last year). Overall, the results demonstrate that employees feel positive about working in TNB, despite the challenging year
• To further improve connectivity of all divisions across TNB, we have appointed 46 Engagement Champions to monitor implementation of employee engagement activities
• Our grievance policy outlines grievance mechanisms and our whistleblowing channel serves as a safe platform for employees to express their concerns
• As a testament to our continuous efforts, we have maintained a relatively low turnover rate of 3.9%
Awards Won
Bronze - Best HR CommunicationStrategyHuman Resources Asia Recruitment Awards 2020
Gold - Excellence in Crisis Management and RecoveryHuman Resources Excellence Awards 2020
Runner-upGraduates’ Choice Award 2020
Our People and Their Value
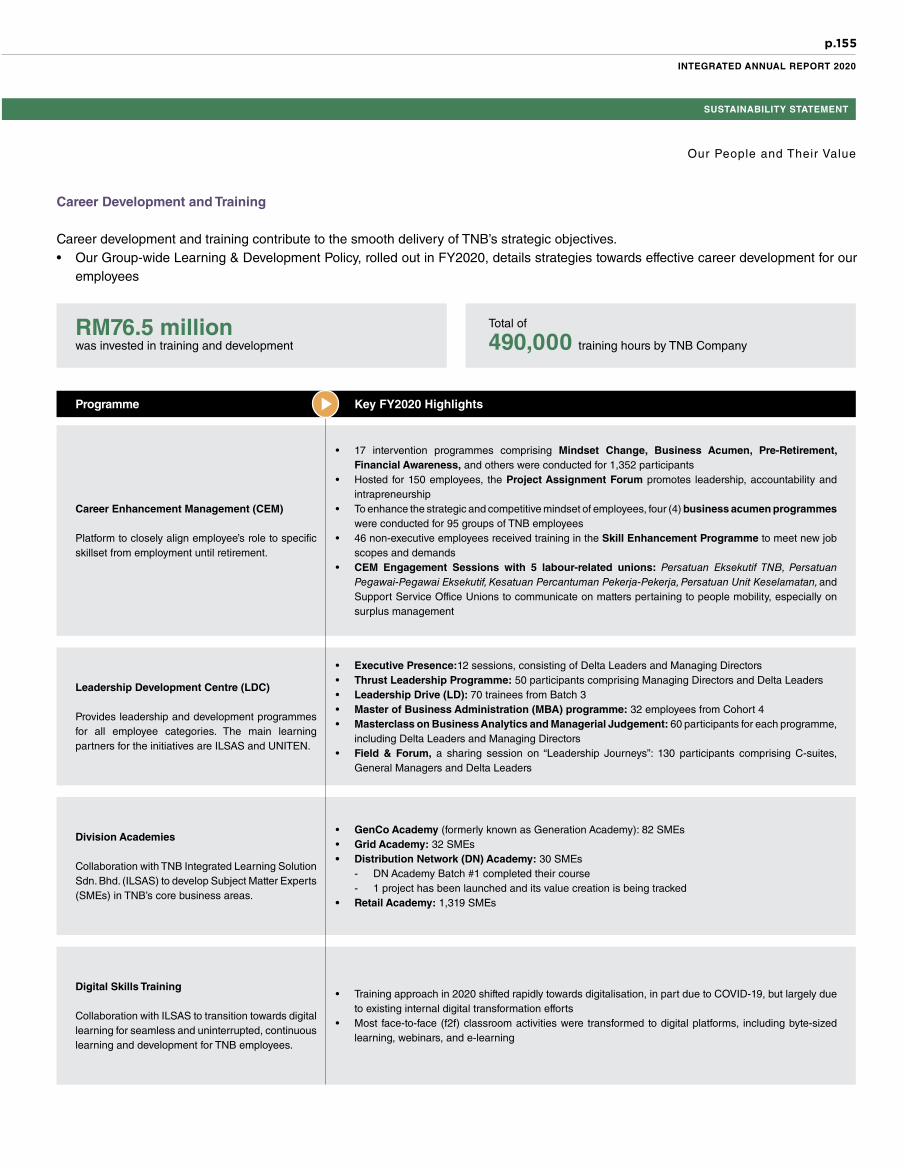
p.155
INTEGRATED ANNUAL REPORT 2020
SUSTAINABILITY STATEMENT
Our People and Their Value
490,000 training hours by TNB Company
Total ofRM76.5 millionwas invested in training and development
Career Development and Training
Career development and training contribute to the smooth delivery of TNB’s strategic objectives.• Our Group-wide Learning & Development Policy, rolled out in FY2020, details strategies towards effective career development for our
employees
Leadership Development Centre (LDC)
Provides leadership and development programmes for all employee categories. The main learning partners for the initiatives are ILSAS and UNITEN.
• Executive Presence:12 sessions, consisting of Delta Leaders and Managing Directors• Thrust Leadership Programme: 50 participants comprising Managing Directors and Delta Leaders• Leadership Drive (LD): 70 trainees from Batch 3• Master of Business Administration (MBA) programme: 32 employees from Cohort 4• Masterclass on Business Analytics and Managerial Judgement: 60 participants for each programme,
including Delta Leaders and Managing Directors• Field & Forum, a sharing session on “Leadership Journeys”: 130 participants comprising C-suites,
General Managers and Delta Leaders
Division Academies
Collaboration with TNB Integrated Learning Solution Sdn. Bhd. (ILSAS) to develop Subject Matter Experts (SMEs) in TNB’s core business areas.
• GenCo Academy (formerly known as Generation Academy): 82 SMEs• Grid Academy: 32 SMEs• Distribution Network (DN) Academy: 30 SMEs
- DN Academy Batch #1 completed their course- 1 project has been launched and its value creation is being tracked
• Retail Academy: 1,319 SMEs
Digital Skills Training
Collaboration with ILSAS to transition towards digital learning for seamless and uninterrupted, continuous learning and development for TNB employees.
• Training approach in 2020 shifted rapidly towards digitalisation, in part due to COVID-19, but largely due to existing internal digital transformation efforts
• Most face-to-face (f2f) classroom activities were transformed to digital platforms, including byte-sized learning, webinars, and e-learning
Career Enhancement Management (CEM)
Platform to closely align employee’s role to specific skillset from employment until retirement.
• 17 intervention programmes comprising Mindset Change, Business Acumen, Pre-Retirement, Financial Awareness, and others were conducted for 1,352 participants
• Hosted for 150 employees, the Project Assignment Forum promotes leadership, accountability and intrapreneurship
• To enhance the strategic and competitive mindset of employees, four (4) business acumen programmes were conducted for 95 groups of TNB employees
• 46 non-executive employees received training in the Skill Enhancement Programme to meet new job scopes and demands
• CEM Engagement Sessions with 5 labour-related unions: Persatuan Eksekutif TNB, Persatuan Pegawai-Pegawai Eksekutif, Kesatuan Percantuman Pekerja-Pekerja, Persatuan Unit Keselamatan, and Support Service Office Unions to communicate on matters pertaining to people mobility, especially on surplus management
Programme Key FY2020 Highlights

p.156
TENAGA NASIONAL BERHAD
TNB Reskilling Malaysia Programme
Conducted by ILSAS and partially funded by TNB, this is part of our six (6) game changers to assist Malaysians, especially unemployed individuals and retrenched workers, gain employment by participating in training courses required for selected industries. All courses under this Programme are applicable and open to non-TNB employees.
• ILSAS will seek out prospective trainees, identify suitable jobs and then equip them with the necessary skills to perform new types of roles that are increasingly in demand. This programme intends to deliver a seamless end-to-end journey for prospective trainees. The courses include:- Installation, operation and maintenance of grid connected PV system- Installation of smart meters- Operation and maintenance of power systems- Maintenance of low voltage electrical facilities- Maintenance of medium voltage electrical facilities- Other industrial based reskilling courses
• These courses for solar installers, smart meter installers and electricians, were selected based on three criteria:- Significant job demand within Malaysia’s power sector- Ability to train workers in a relatively short time frame (for example, two weeks)- Minimal entry requirements (trainees need only an SPM qualification)
Programme Key FY2020 Highlights
Diversity and Inclusiveness
We aim to provide equal opportunities and ensure that all Warga TNB, regardless of their age, gender, religious affiliation and disability are treated fairly and feel valued at work.
Our approach and key FY2020 highlights:
• In FY2020, diversity and inclusivity were highlighted in the recently revised TNB Core Values, which was deliberated under the Collaborative value - We embrace diversity and inclusivity, and we value outside in perspectives
• We do not tolerate any form of harassment at the workplace, whether verbal, physical, sexual or visual, including discriminatory comments as outlined in our Code of Ethics
• This year, there has been about a 14% increase of women in senior management roles for TNB Group, from 83 people in FY2019 to 95 people in FY2020
• As shown on the next page, there is a decrease in employee turnover from 1,594 in FY2018 to 1,305 in FY2020. This downward trend is attributed to higher morale and employee engagement
• We continue to provide employment opportunities for Persons with Disabilities (PWD). Our inclusive and accessible workplace has fostered year-on-year growth in the number of employees with disabilities at TNB, with an increase of 14% in FY2020
Performance in FY2020 for TNB Group
Employee Breakdown by Gender (%) Employee Breakdown by Age Group (%)
WomenMen > 50 years old 35-50 years old < 35 years old
2018 2019 2020 2018 2019 2020
Our People and Their Value
21.1
%
79.0
%
79.0
%
21.0
%
21.0
%
78.9
%
16.0
%34
.0%
50.0
%
14.3
%36
.6%
49.1
%
13.6
%41
.3%
45.1
%

p.157
INTEGRATED ANNUAL REPORT 2020
SUSTAINABILITY STATEMENT
Performance in FY2020 for TNB Group
35-50 years old> 50 years old
< 35 years oldWomen Men Women Men
Women in Senior Management Roles (%)
PWD Employed by Gender (No.) Employees Turnover by Gender (No.) Employees Turnover by Age Group (No.)
20202018 2019 20202018 2019 20202018 201920202018 2019
100
111113
Our People and Their Value19
.7%
18.4
%
21.7
%
496
597
770
1,05
425
1
1,23
123
1
1,40
624
5
1,07
746
1
457
876
873
322
We constantly empower our staff by providing various trainings, educating them with the right skills and competencies to ensure the workforce is well-equipped with the skills necessary for the electricity supply industry.

p.158
TENAGA NASIONAL BERHAD
Prioritising Health, Safety and Personal Well-Being
As a responsible employer, we prioritise the occupational health and safety, and welfare of our employees and workers, recognising their inherent human rights, beyond being vital to our operations.
RELATED MATERIAL MATTER(s):
• Safety, Health and Well-being
Promoting Occupational Healthand Safety Practices
We uphold strong safety standards to prevent work-related injuries and illnesses and seek ways to achieve our target of having zero fatality at the workplace and maintaining our Lost Time Injury Frequency (LTIF) at below 1.0.
Our approach and key FY2020 highlights:
01
• HSEMS has been progressively implemented across divisions and subsidiaries since 2019
• Progressive transition from OHSAS 18001:2007 to ISO 45001:2018 Occupational Health
• In FY2020, our Distribution Network Division was ISO 45001:2018 certified
Health Safety & Environmental Management System (HSEMS) 02
• Our Fleet Management Division collaborated with GRAB Business to provide alternative modes of transportation for official travel within TNB premises in the Klang Valley. This initiative is aligned with our prohibition of motorcycle use for any official business travel
• Introduced the Construction Work Permit (CWP) under Grid Development in November 2020 to minimise safety risks at grid construction sites
• Distribution Network Division introduced “Nampak Dengar & Rasa Selamat (NDRS)” programmes to enhance awareness on early detection/symptoms of incidents
• HSE Corporate audits are conducted to measure compliance with HSEMS elements
Accident Reduction Programme 03
• We have progressively developed modules since 2018, in preparation for the full implementation of our eHSE online system in 2022. The most recent modules include:- Establishing the SHC
online system to improve its effectiveness
- Developing the online Chemical Register & Legal Compliances module to improve regulatory compliance
HSE Digitalisation (eHSE online system)
Our People and Their Value
Our implemented policies and management systems are complemented by efforts to instil a safety culture that encourages shared responsibility values in our employees, workers, suppliers and surrounding communities.
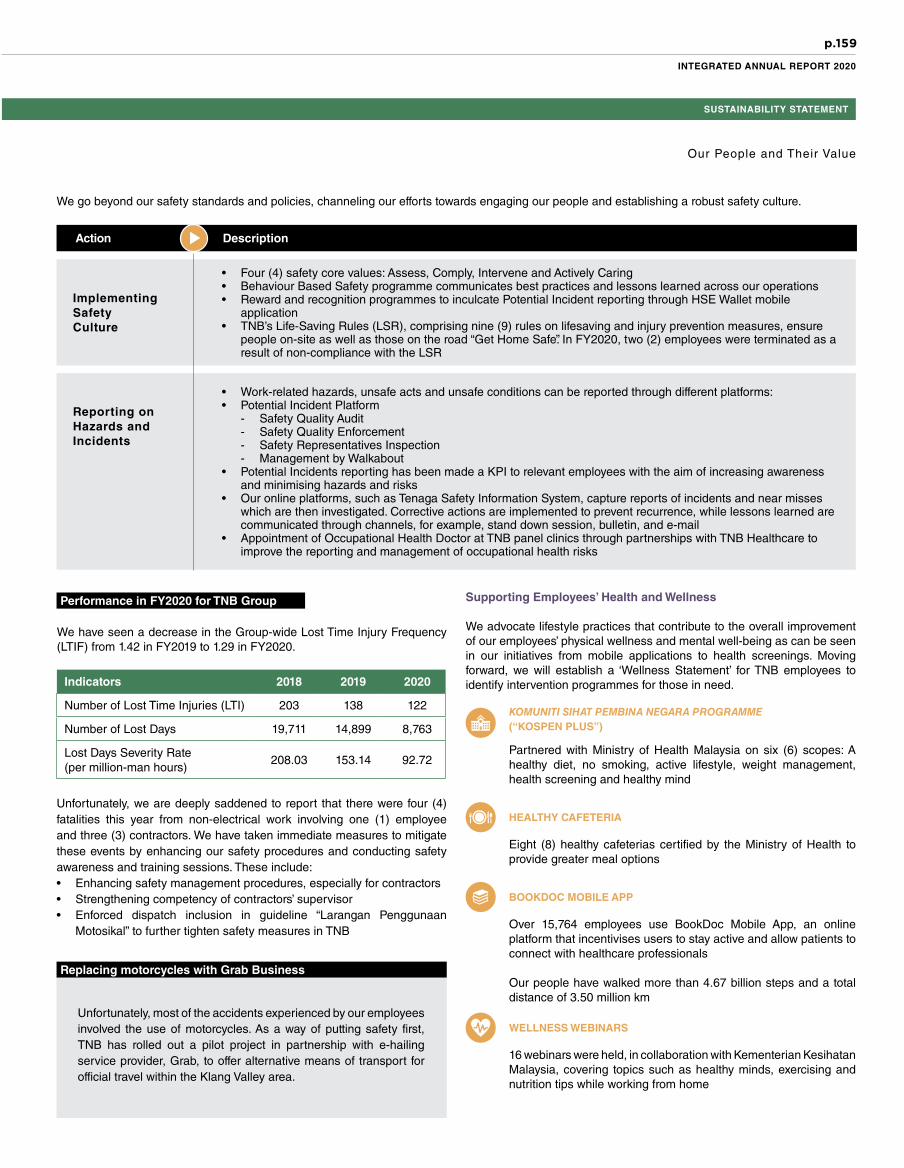
p.159
INTEGRATED ANNUAL REPORT 2020
SUSTAINABILITY STATEMENT
Our People and Their Value
Supporting Employees’ Health and Wellness
We advocate lifestyle practices that contribute to the overall improvement of our employees’ physical wellness and mental well-being as can be seen in our initiatives from mobile applications to health screenings. Moving forward, we will establish a ‘Wellness Statement’ for TNB employees to identify intervention programmes for those in need.
KOMUNITI SIHAT PEMBINA NEGARA PROGRAMME (“KOSPEN PLUS”)
Partnered with Ministry of Health Malaysia on six (6) scopes: A healthy diet, no smoking, active lifestyle, weight management, health screening and healthy mind
Eight (8) healthy cafeterias certified by the Ministry of Health to provide greater meal options
HEALTHY CAFETERIA
BOOKDOC MOBILE APP
Over 15,764 employees use BookDoc Mobile App, an online platform that incentivises users to stay active and allow patients to connect with healthcare professionals
Our people have walked more than 4.67 billion steps and a total distance of 3.50 million km
16 webinars were held, in collaboration with Kementerian Kesihatan Malaysia, covering topics such as healthy minds, exercising and nutrition tips while working from home
WELLNESS WEBINARS
We have seen a decrease in the Group-wide Lost Time Injury Frequency (LTIF) from 1.42 in FY2019 to 1.29 in FY2020.
Performance in FY2020 for TNB Group
Replacing motorcycles with Grab Business
Unfortunately, most of the accidents experienced by our employees involved the use of motorcycles. As a way of putting safety first, TNB has rolled out a pilot project in partnership with e-hailing service provider, Grab, to offer alternative means of transport for official travel within the Klang Valley area.
Implementing SafetyCulture
• Four (4) safety core values: Assess, Comply, Intervene and Actively Caring• Behaviour Based Safety programme communicates best practices and lessons learned across our operations• Reward and recognition programmes to inculcate Potential Incident reporting through HSE Wallet mobile
application• TNB’s Life-Saving Rules (LSR), comprising nine (9) rules on lifesaving and injury prevention measures, ensure
people on-site as well as those on the road “Get Home Safe”. In FY2020, two (2) employees were terminated as a result of non-compliance with the LSR
Reporting on Hazards and Incidents
• Work-related hazards, unsafe acts and unsafe conditions can be reported through different platforms:• Potential Incident Platform
- Safety Quality Audit - Safety Quality Enforcement - Safety Representatives Inspection- Management by Walkabout
• Potential Incidents reporting has been made a KPI to relevant employees with the aim of increasing awareness and minimising hazards and risks
• Our online platforms, such as Tenaga Safety Information System, capture reports of incidents and near misses which are then investigated. Corrective actions are implemented to prevent recurrence, while lessons learned are communicated through channels, for example, stand down session, bulletin, and e-mail
• Appointment of Occupational Health Doctor at TNB panel clinics through partnerships with TNB Healthcare to improve the reporting and management of occupational health risks
Action Description
We go beyond our safety standards and policies, channeling our efforts towards engaging our people and establishing a robust safety culture.
Unfortunately, we are deeply saddened to report that there were four (4) fatalities this year from non-electrical work involving one (1) employee and three (3) contractors. We have taken immediate measures to mitigate these events by enhancing our safety procedures and conducting safety awareness and training sessions. These include: • Enhancing safety management procedures, especially for contractors• Strengthening competency of contractors’ supervisor• Enforced dispatch inclusion in guideline “Larangan Penggunaan
Motosikal” to further tighten safety measures in TNB
Indicators 2018 2019 2020
Number of Lost Time Injuries (LTI) 203 138 122
Number of Lost Days 19,711 14,899 8,763
Lost Days Severity Rate (per million-man hours)
208.03 153.14 92.72
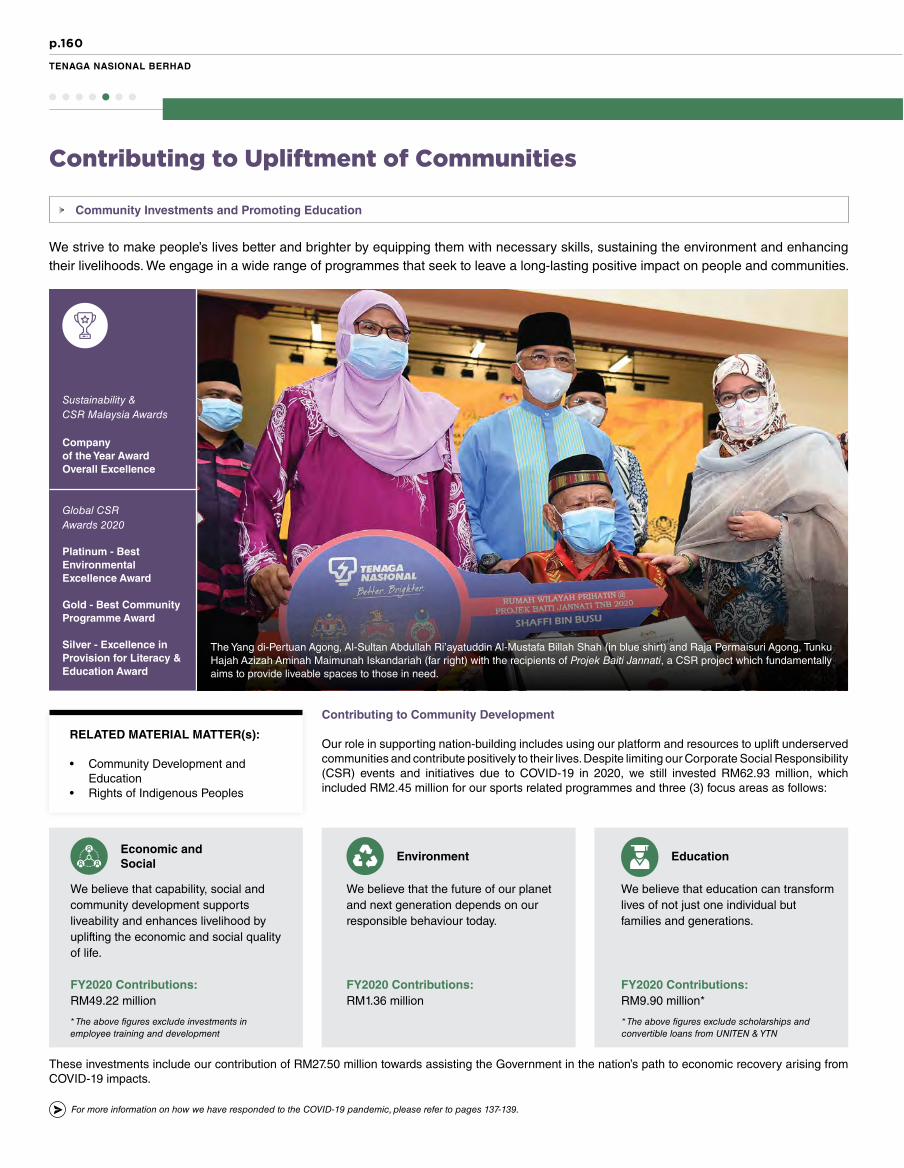
p.160
TENAGA NASIONAL BERHAD
Community Investments and Promoting Education
We strive to make people’s lives better and brighter by equipping them with necessary skills, sustaining the environment and enhancing their livelihoods. We engage in a wide range of programmes that seek to leave a long-lasting positive impact on people and communities.
RELATED MATERIAL MATTER(s):
• Community Development and Education
• Rights of Indigenous Peoples
Contributing to Community Development
Our role in supporting nation-building includes using our platform and resources to uplift underserved communities and contribute positively to their lives. Despite limiting our Corporate Social Responsibility (CSR) events and initiatives due to COVID-19 in 2020, we still invested RM62.93 million, which included RM2.45 million for our sports related programmes and three (3) focus areas as follows:
These investments include our contribution of RM27.50 million towards assisting the Government in the nation’s path to economic recovery arising from COVID-19 impacts.
For more information on how we have responded to the COVID-19 pandemic, please refer to pages 137-139.
We believe that capability, social and community development supports liveability and enhances livelihood by uplifting the economic and social quality of life.
FY2020 Contributions:RM49.22 million
We believe that education can transform lives of not just one individual but families and generations.
FY2020 Contributions:RM9.90 million*
Economic and Social
We believe that the future of our planet and next generation depends on our responsible behaviour today.
FY2020 Contributions:RM1.36 million
Environment Education
Contributing to Upliftment of Communities
* The above figures exclude scholarships and convertible loans from UNITEN & YTN
* The above figures exclude investments in employee training and development
Sustainability &CSR Malaysia Awards
Companyof the Year Award Overall Excellence
Global CSRAwards 2020
Platinum - Best Environmental Excellence Award
Gold - Best Community Programme Award
Silver - Excellence in Provision for Literacy & Education Award
The Yang di-Pertuan Agong, Al-Sultan Abdullah Ri’ayatuddin Al-Mustafa Billah Shah (in blue shirt) and Raja Permaisuri Agong, Tunku Hajah Azizah Aminah Maimunah Iskandariah (far right) with the recipients of Projek Baiti Jannati, a CSR project which fundamentally aims to provide liveable spaces to those in need.

p.161
INTEGRATED ANNUAL REPORT 2020
SUSTAINABILITY STATEMENT
Contributing to Upliftment of Communities
Economic and Social Transformation
We not only advocate for the equal access to electricity, recognising that it is a basic need for daily life and socioeconomic growth, but we also seek to improve communities through providing livable spaces with proper sanitation and opening up opportunities to earn a livelihood. We are proud to collaborate with the Government in achieving these ambitions, from ensuring electricity supply in rural areas to building homes for those in need.
Rural Development
Promoting Energy Efficiency
LED Streetlight Replacement Programme
The LED Streetlight Replacement programme, established since 2018, replaces High-Pressure Sodium Vapour streetlights with LED lights which enable both cost and energy efficiency in all state capital cities. The lower wattage from LED lights results in an estimated kWh and cost savings of about 30%-40%. Currently, 483,776 lights have been installed across Peninsular Malaysia, an increase from 326,053 in FY2019.
Home Rewiring Programme
We have progressed with our Home Rewiring Programme to refurbish and rewire underprivileged homes in Peninsular Malaysia. Our target is to rewire 1,000 homes, and to date, 316 homes have been rewired with a total contribution of RM141,915 in FY2020.
BELB Programme
With the support of the Kementerian Pembangunan Luar Bandar (KPLB) through the Rural Electrification Programme (BELB), we supply power to rural areas such as villages and Orang Asli settlements that are not within the operational area of local authorities. We connect these villages to TNB’s grid lines, where possible. For settlements too remote to be connected to our grid lines, we utilise off-grid alternatives such as solar hybrids, generator sets, and mini hydro. To date, we have improved connectivity in 30 villages.
LJK Programme
The Government has established the Village Street Lighting (LJK) programme since 2002 with the purpose to ensure public areas in remote villages are well lit at night thus facilitating community safety. TNB is collaborating on the implementation of LJK and this year, we installed 20,634 streetlights in 6,397 villages.
Desa Harapan Programme
Initiated by KPLB since 2019, this programme involves the participation of government bodies and corporations to contribute to socioeconomic development in rural areas through various donations. Villages will be selected based on certain criteria and supported for two (2) years.
This year, TNB donated RM277,000 to two (2) villages, Kampung Kuala Temonyong and Kampung Weng, in Kedah for various projects that would help improve the residents’ job prospects and income, thus enhance their standard of living.

p.162
TENAGA NASIONAL BERHAD
Environmental Sustenance Programmes
We recognise the importance of protecting our natural heritage that holds multiple benefits for our planet and its inhabitants. In addition to our environmental initiatives, we also conduct programmes that contribute not only to preserving and conserving the environment, but also generate benefits to the surrounding communities.
Mangrove Planting Programme
A significant initiative under our reforestation efforts is our annual mangrove planting that was implemented Group-wide to improve the protection of coastal environments as well as encourage sustainable fisheries in the Janamanjung vicinity. In FY2020, 10,600 mangrove saplings were planted in Sungai Limau, Manjung with a total spend of RM250,000. This year’s initiative was in collaboration with an NGO, Global Environmental Centre and the Manjung District Office, along with the involvement of the Sungai Limau community, Sahabat Hutan Bakau Kuala Gula and Sahabat Hutan Bakau Lekir Sitiawan.
Providing Homes for Community Well-being
Home for the Needy Programme
In partnership with State Governments, we help refurbish and build new homes through the “Home for the Needy” programme targeted mainly for single parents, senior citizens and individuals with disabilities. This programme is carried out under two concurrent projects namely, Projek Baiti Jannati (PBJ), and Program Mesra Rakyat (PMR). In FY2020, this programme helped 199 families, which includes 168 families from PBJ, and 31 families from PMR, with a total contribution of RM9.9 million for both programmes.
Contr ibuting to Upliftment of Communities
Fireflies Conservation Project
We continued to conserve Malaysia’s firefly colonies by carrying out conservation efforts in areas like Kampung Kuantan, which has one of the largest firefly colonies in Southeast Asia, as well as Kampung Yak Yah, Kemaman, Terengganu; Kampung Sungai Timun, Rembau, Negeri Sembilan; and Kampung Dew, Taiping, Perak. In FY2020, we spent RM36,000 on infrastructure, community development and promotion & publicity. We also spent RM986,000 on R&D for majority of these areas. Our efforts to boost eco-tourism, which involved donating new boats and conducting language classes for local boatmen have created socioeconomic benefits for the local communities.
Tourism was severely affected due to COVID-19, which resulted in significant financial distress to those reliant on it as their main source of income. This year’s contribution was RM33,500 for 76 boatmen across all four (4) firefly colonies. Comprising RM25,500 to 36 boatmen from the Kampung Kuantan Fireflies Park, RM4,000 to 20 boatmen from Kampung Dew, RM2,800 to 14 boatmen from Kampung Sungai Timun and RM1,200 for 6 boatmen from Kampung Yak Yah.
Better Brighter Shelter (BBS) Programme
TNB’s Better Brighter Shelter (BBS) programme aims to provide accommodation, such as dormitories and transit homes, for families whose members are undergoing medical treatments. This service is provided to underserved communities from rural areas or the outskirts of Kuala Lumpur. Serdang Hospital and National Heart Institute (IJN) have been linked to this programme since its launch in 2018. Partnerships have also been established with Yayasan Kebajikan Negara (YKN) and IJN Foundation, and in FY2019, with Melaka Hospital. Total allocation for this programme was RM5.1 million with a breakdown of IJN - RM2.4 million, Serdang Hospital - RM1.5 million and Melaka Hospital - RM1.2 million. In FY2020, the total spend amounted to RM687,000.

p.163
INTEGRATED ANNUAL REPORT 2020
SUSTAINABILITY STATEMENT
Research Highlights
• 33 research projects undertaken with the aim of promoting current developments such as low-carbon technologies, sustainable energy management framework, cybersecurity, electricity optimisation using deep learning, IoT and happiness measurement algorithm
UNITEN Research Hub and URND conduct research focusing on the well-being of society
Transforming Lives Through Education
At TNB, our commitment to provide access to education is clearly demonstrated through significant investments in our key educational institutions – UNITEN, LDC and TNB ILSAS, our foundation Yayasan Tenaga Nasional (YTN) – as well as our community programmes.
UNITEN – The Energy University
UNITEN is a private university offering courses in the fields of engineering, computing and informatics, energy economics, business management and accounting. UNITEN is gaining traction as an energy research hub, facilitated by TNB’s respected industry standing. UNITEN also provides various funding and scholarships to its students such as:
UNITEN FUNDING AND SCHOLARSHIPS
Dana Pendidikan UNITEN
Biasiswa & Danasiswa Tabung
Amanah Zakat UNITEN (TAZU)
Danasiswa Pensijilan Tahfiz TAZU - MARA
DermasiswaYayasan Canselor
UNITEN (YCU)
DermasiswaB40 JPA
in cooperationwith YCU
Smart UniverCity
• UNITEN received a smart street lighting system with 197 smart lanterns
• A new Control Management System (CMS) and Internet of Things (IoT) communication network for Smart Street Lighting System (SSLS) was implemented
A joint initiative between UNITEN and TNB to roll out features that will transform UNITEN into a living lab for smart city solutions
Key Activities Description Key FY2020 Highlights
UNITEN Performance in FY2020
1,651graduates
1st in the world for percentage of highly cited papers among top 1% most cited in Engineering in the U.S. News & World Report Best Global Universities for Engineering 2021
5 StarMalaysia Research Assessment (MyRA) 2020
168th in the QS Asia UniversityRankings 2021
93%employability rate within 6 months of graduation
9th in Malaysia in the Times Higher Education WorldUniversity Rankings 2021
Three (3) researchers were ranked among the World’s Top 2% Scientists by Stanford University, USA
5 StarRating System for Malaysian Higher Education (SETARA) 2018/2019
Contributing to Upliftment of Communities

p.164
TENAGA NASIONAL BERHAD
Trainings related to AMI and Advanced Distribution Management System (ADMS)
A change management programme for TNB’s employees involved with ADMS to ensure that they are ready to support and operationalise the new system and embrace the new way of working
• Smart meter installers, contractors • TNB frontliners from Distribution Network
Division• TNB Retail Division• TNB Distribution Network system operator
Development of Safety Documents and Safety Trainings for GSPARX
Drives all contractors and owners of premises to take the necessary safety precautions before, during and after solar PV system installations
• GSPARX and its contractors
TNB Global Business Solutions (TGBS) Culture Transformation
This project is designed to promote a high-performance culture that enables the optimum implementation of the TGBS function as a customer-driven, intelligent solutions provider
• TGBS employees
Intelligent Monitoring System Using Smart Glasses
Provides a solution that enables effective repair and maintenance by reducing costs, downtime and accidents through a smart glass gadget. A pilot project has been successfully conducted by the Grid Division and is ready to be deployed on a small scale
• Grid Division employees and contractors
Solar Aerial Vehicle Competition 2020
In partnership with the Jabatan Pendidikan Politeknik & Kolej Komuniti (JPPKK), it is a competition to develop a concept for a flying vehicle that uses solar energy. This will help promote new courses in RE and EE at selected polytechnic universities, thus spark interest among the students
• Polytechnic universities
Programme in FY2020 Description Target Participant
TNB Integrated Learning Solution Sdn. Bhd. (ILSAS)
ILSAS is not only the official training institute for TNB employees, but it is also considered a premier institution for professionals in the wider power and utility industry. With the adoption of internationally recognised frameworks including ISO 9001:2015 Quality Management System and the United Kingdom Accreditation Service (UKAS) standards as well as multiple certifications by renowned organisations, ILSAS is demonstrably committed to offering high quality training.
ILSAS certifications and accreditations include:
• Accredited by the Energy Commission (EC) to carry out competency courses • Approved as a City and Guilds (UK) Centre• Certified as an Institute of Leadership Management (ILM) (UK) Centre• Certified as a Department of Occupational Safety and Health (DOSH) Examination Centre• Authorised Centre for Sustainable Energy Development Authority (SEDA)• Approved solar PV training and examination centre by the Department of Skills Malaysia
ILSAS aims to be the Global Leader Learning Solution Provider and has formulated its business plan for 2019 to 2023 based on three (3) pillars – ILSAS Vision, ILSAS Mission, and ILSAS Aspiration with the following strategic objectives:
• To build capabilities for current and future organisational strategies by providing learning solutions to increase individual, team and organisational performance and productivity
• To rapidly respond to growth and embed innovation in products and services• To position ILSAS for a quantum leap growth as a business entity that is cash positive and sustainable
Contr ibuting to Upliftment of Communities

p.165
INTEGRATED ANNUAL REPORT 2020
SUSTAINABILITY STATEMENT
ILSAS Key FY2020 Highlights
315employees with 199 trainers
RM55.3 millionin revenue
20,936individuals trained
4th ILSAS International Conference on Learning and Development (ICLAD) was conducted virtually using 3D image technology, which generated commendable feedback from participants
Yayasan Tenaga Nasional
YTN’s main objective is to provide Malaysians from all backgrounds with equal opportunities to obtain higher education qualifications. Governed by a Board of Trustees and an organisation committee, YTN has been providing financial assistance since 1993 by awarding scholarships and study loans to deserving candidates in pursuit of tertiary education locally and abroad. With the mission to transform lives through excellent education opportunities, we have invested over RM1.2 billion in scholarships and helped over 18,000 students since YTN’s incorporation.
Financial aid totaling
RM37.1 million for YTN scholars678YTN scholarships recipients
YTN Key FY2020 Highlights
Contributing to Upliftment of Communities
Dato’ Seri Mahdzir bin Khalid awarding a certificate to a Yayasan Tenaga Nasional (YTN) scholar a at the Majlis Penganugerahan Biasiswa YTN 2020 in Bangi.

p.166
TENAGA NASIONAL BERHAD
Key FY2020 Highlights
5,268students benefited from the MyBF scholarships
Note of Understanding for
MyBF programme was signed between YTN and Ministry of Higher Education Malaysia (MOHE)
10 engagement sessions were conducted with MyBF sponsored students
RM40.4 million of financial aid provided to MyBF scholar
“Prime - My Care” Programme was implemented to enhance the competencies of MyBF sponsored students through social responsibility activities within the local community
MyBF Video Creating Competition was organised to raise TNB’s brand reputation
Dermasiswa My Brighter Future (MyBF)
MyBF Scholarship was founded by YTN to uplift marginalised youth and promote equitable access to tertiary education, particularly for families in the B40 bracket registered under the eKasih scheme. The scholarship covers tuition fees, boarding and living expenses of recipients pursuing tertiary education in Science, Technology, Engineering & Mathematics (STEM) and Technical & Vocational Education & Training (TVET) at any of selected seven (7) public universities, community colleges and polytechnic institutions in Malaysia.
Student development programmes are conducted by YTN for MyBF recipients throughout the year to help the scholars develop their professional and entrepreneurial skills, as well as facilitate networking sessions with industry leaders.
Contr ibuting to Upliftment of Communities
Our Prime Minister, Tan Sri Muhyiddin bin Mohd Yassin, presented a Dermasiswa My Brighter Future scholarship award to a recipient, witnessed by Minister of Higher Education, Datuk Seri Dr. Noraini binti Ahmad (left), Datuk Seri Dr. Shamsul Anuar bin Nasarah (third right) and Dato’ Seri Mahdzir bin Khalid (right).

p.167
INTEGRATED ANNUAL REPORT 2020
SUSTAINABILITY STATEMENT
Educational Development Programmes
We typically conduct annual educational development programmes, however, most of our activities for FY2020 were postponed for the safety of the community and our volunteers due to COVID-19. Mindful of the current restrictions, we continued to assist the community mainly by providing financial assistance.
Promoting Equal Opportunities to High-Quality and Well-Rounded Education
Trust Schools Programme
Our Trust Schools Programme is a public-private partnership between the Ministry of Education (MoE) and Yayasan AMIR, a non-profit foundation established in 2011 by Khazanah Nasional Berhad. The aim is to improve the delivery of curriculum and enhance the management of eight (8) schools for 5 years from 2017 to 2021. Since 2017, TNB has contributed RM25.6 million to the Trust Schools Programme with an annual allocation of RM6.4 million to the following schools:
Ceria Ke Sekolah Programme
Our Ceria ke Sekolah programme is conducted prior to the start of the school year to provide school supplies, such as uniforms, bags, shoes and stationeries to primary school students from low-income families. In FY2020, we funded RM1.36 million for this programme, which benefitted 6,850 students.
B40 Programme
Since the launch of the B40 programme in 2018, we have supported 450 secondary school students from B40 families enrolled at the three (3) schools in Kuala Lumpur: Sekolah Menengah Kebangsaan Bukit Bandaraya, Sekolah Menengah Kebangsaan Bangsar and Sekolah Menengah Kebangsaan Seri Pantai. Annually, we channel RM225,000 to fund 150 students, along with sponsorships to attend self-development programmes such as motivational camps and outreach programmes organised by TNB. To date, we have contributed RM675,000 towards this programme.
Sekolah Menengah Kebangsaan Seri Samudera, Perak
Sekolah Kebangsaan Seri Samudera, Perak
Sekolah Menengah Kebangsaan Kg. Jawa, Selangor
Sekolah Kebangsaan Kg. Jawa, Selangor
Sekolah Menengah Kebangsaan Seri Paka, Terengganu
Sekolah Kebangsaan Paka 111, Terengganu
Sekolah Menengah Kebangsaan Jeli, Kelantan
Sekolah Kebangsaan Jeli 1, Kelantan
Contr ibuting to Upliftment of Communities
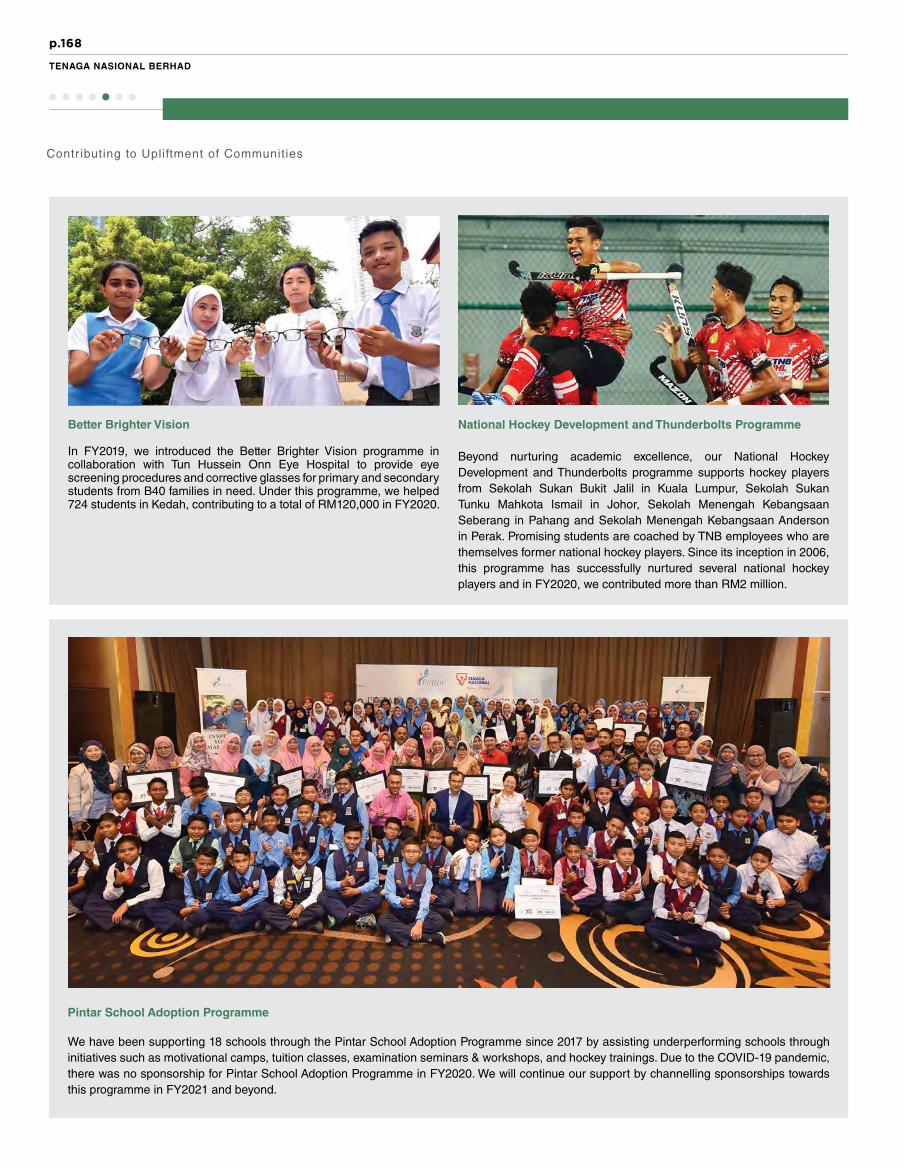
p.168
TENAGA NASIONAL BERHAD
Contributing to Upliftment of Communities
National Hockey Development and Thunderbolts Programme
Beyond nurturing academic excellence, our National Hockey Development and Thunderbolts programme supports hockey players from Sekolah Sukan Bukit Jalil in Kuala Lumpur, Sekolah Sukan Tunku Mahkota Ismail in Johor, Sekolah Menengah Kebangsaan Seberang in Pahang and Sekolah Menengah Kebangsaan Anderson in Perak. Promising students are coached by TNB employees who are themselves former national hockey players. Since its inception in 2006, this programme has successfully nurtured several national hockey players and in FY2020, we contributed more than RM2 million.
Better Brighter Vision
In FY2019, we introduced the Better Brighter Vision programme in collaboration with Tun Hussein Onn Eye Hospital to provide eye screening procedures and corrective glasses for primary and secondary students from B40 families in need. Under this programme, we helped 724 students in Kedah, contributing to a total of RM120,000 in FY2020.
Pintar School Adoption Programme
We have been supporting 18 schools through the Pintar School Adoption Programme since 2017 by assisting underperforming schools through initiatives such as motivational camps, tuition classes, examination seminars & workshops, and hockey trainings. Due to the COVID-19 pandemic, there was no sponsorship for Pintar School Adoption Programme in FY2020. We will continue our support by channelling sponsorships towards this programme in FY2021 and beyond.

FinancialStatements170 Directors’ Report
175 Consolidated Statement of Financial Position
177 Consolidated Statement of Profit or Loss
178 Consolidated Statement of Comprehensive Income
179 Consolidated Statement of Changes in Equity
182 Consolidated Statement of Cash Flows
186 Notes to the Financial Statements
338 Statement by Directors
338 Statutory Declaration
339 Independent Auditors’ Report
Note 1: General Information
Note 2: Basis of Preparation
Note 3: Summary of Significant Accounting Policies
Note 4: Critical Accounting Estimates and Judgements
Note 5: Property, Plant and Equipment (‘PPE’)
Note 6: Right-of-Use (‘ROU’) Assets
Note 7: Subsidiaries
Note 8: Joint Arrangements
Note 9: Associates
Note 10: Goodwill on Consolidation
Note 11: Investment in Unquoted Debt Securities
Note 12: Deferred Taxation
Note 13: Long Term Receivables
Note 14: Amounts Due From/(To) Subsidiaries
Note 15: Leases
Note 16: Financial Assets at FVOCI
Note 17: Financial Assets at FVTPL
Note 18: Inventories
Note 19: Receivables, Deposits and Prepayments
Note 20: Contract Balances
Note 21: Deposits, Bank and Cash Balances
Note 22: Assets Classified as Held For Sale and Liabilities Directly Associated with the Assets Held For Sale
Note 23: Payables
Note 24: Derivative Financial Instruments
Note 25: Employee Benefits
Note 26: Consumer Deposits
Note 27: Short Term Borrowings
Note 28: Borrowings
Note 29: Government Development Grants
Note 30: Other Liabilities
Note 31: Share Capital
Note 32: Other Reserves
Note 33: Revenue
Note 34: Operating Expenses
Note 35: Staff Cost
Note 36: Other Operating Income
Note 37: Foreign Exchange Gain/(Loss)
Note 38: Finance Income/Cost and Fair Value Changes of Financial Instruments
Note 39: Taxation and Zakat
Note 40: Earnings Per Share (‘EPS’)
Note 41: Dividends
Note 42: Commitments
Note 43: Contingent Liabilities
Note 44: Significant Related Party Disclosures
Note 45: Segmental Reporting
Note 46: Financial Instruments
Note 47: Capital Risk Management
Note 48: Significant Acquisitions During The Financial Year
Note 49: Significant Event During The Financial Year
Note 50: Event After Reporting Period

p.170
TENAGA NASIONAL BERHAD
Directors’ Report
The Directors hereby submit their report and the audited financial statements of the Group and of the Company for the financial year ended 31 December 2020.
PRINCIPAL ACTIVITIES
The Group and Company are primarily involved in the business of the generation, transmission, distribution and sales of electricity and those tabulated in Note 7 to the financial statements, which also includes the details of the subsidiaries of the Group.
There have been no significant changes in these activities during the financial year.
FINANCIAL RESULTS
GroupRM’million
CompanyRM’million
Profit for the financial year attributable to:
- Owners of the Company 3,592.7 2,675.3
- Non-controlling interests 23.7 0
Profit for the financial year 3,616.4 2,675.3
DIVIDENDS
The dividends paid or declared since the previous financial year ended 31 December 2019 were as follows:
RM’million
In respect of the financial year ended 31 December 2019:
Final single tier dividend of 20.0 sen and a special single tier dividend of 50.0 sen per ordinary share, paid on 16 April 2020 3,980.8
In respect of the financial year ended 31 December 2020:
Interim single tier dividend of 22.0 sen per ordinary share, paid on 14 October 2020 1,255.0
The Directors have approved a final single tier dividend of 18.0 sen per share and a special single tier dividend of 40.0 sen per share on 5,704,653,871 ordinary shares in respect of the financial year ended 31 December 2020 amounting to a total of RM3,308.7 million. The dividends will be paid on 16 April 2021.
RESERVES AND PROVISIONS
All material transfers to or from reserves and provisions during the financial year are shown in the financial statements.
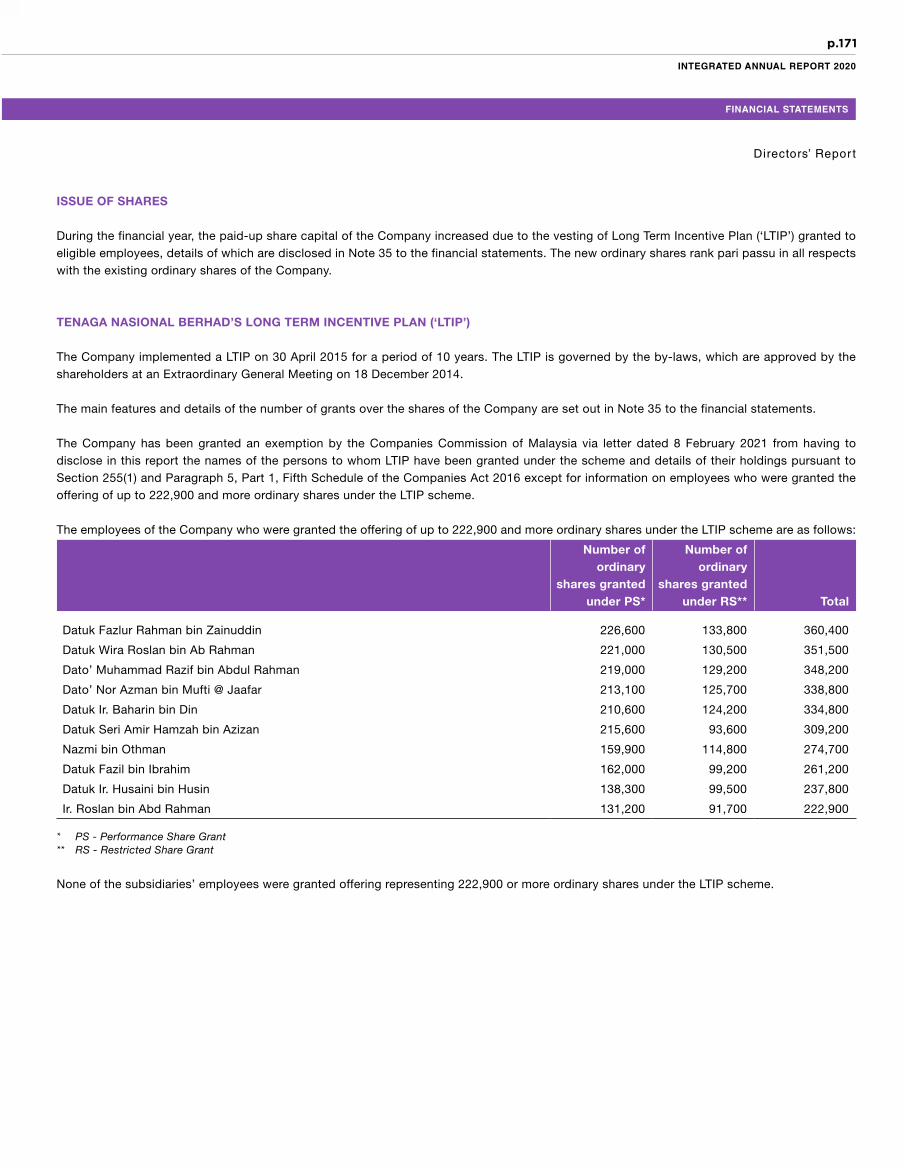
p.171
INTEGRATED ANNUAL REPORT 2020
FINANCIAL STATEMENTS
Directors’ Repor t
ISSUE OF SHARES
During the financial year, the paid-up share capital of the Company increased due to the vesting of Long Term Incentive Plan (‘LTIP’) granted to eligible employees, details of which are disclosed in Note 35 to the financial statements. The new ordinary shares rank pari passu in all respects with the existing ordinary shares of the Company.
TENAGA NASIONAL BERHAD’S LONG TERM INCENTIVE PLAN (‘LTIP’)
The Company implemented a LTIP on 30 April 2015 for a period of 10 years. The LTIP is governed by the by-laws, which are approved by the shareholders at an Extraordinary General Meeting on 18 December 2014.
The main features and details of the number of grants over the shares of the Company are set out in Note 35 to the financial statements.
The Company has been granted an exemption by the Companies Commission of Malaysia via letter dated 8 February 2021 from having to disclose in this report the names of the persons to whom LTIP have been granted under the scheme and details of their holdings pursuant to Section 255(1) and Paragraph 5, Part 1, Fifth Schedule of the Companies Act 2016 except for information on employees who were granted the offering of up to 222,900 and more ordinary shares under the LTIP scheme.
The employees of the Company who were granted the offering of up to 222,900 and more ordinary shares under the LTIP scheme are as follows:
Number of ordinary
shares grantedunder PS*
Number of ordinary
shares grantedunder RS** Total
Datuk Fazlur Rahman bin Zainuddin 226,600 133,800 360,400
Datuk Wira Roslan bin Ab Rahman 221,000 130,500 351,500
Dato’ Muhammad Razif bin Abdul Rahman 219,000 129,200 348,200
Dato’ Nor Azman bin Mufti @ Jaafar 213,100 125,700 338,800
Datuk Ir. Baharin bin Din 210,600 124,200 334,800
Datuk Seri Amir Hamzah bin Azizan 215,600 93,600 309,200
Nazmi bin Othman 159,900 114,800 274,700
Datuk Fazil bin Ibrahim 162,000 99,200 261,200
Datuk Ir. Husaini bin Husin 138,300 99,500 237,800
Ir. Roslan bin Abd Rahman 131,200 91,700 222,900
* PS - Performance Share Grant** RS - Restricted Share Grant
None of the subsidiaries’ employees were granted offering representing 222,900 or more ordinary shares under the LTIP scheme.

p.172
TENAGA NASIONAL BERHAD
Directors’ Repor t
DIRECTORS
The Directors who have held office during the financial year and during the period from the end of the financial year to the date of the report are:
Dato’ Seri Mahdzir bin Khalid Appointed as Chairman w.e.f. 12 May 2020Datuk Ir. Baharin bin Din Appointed w.e.f. 1 March 2021Dato’ Asri bin Hamidin @ Hamidon Appointed w.e.f. 1 July 2020Amran Hafiz bin AffifudinNoraini binti Che Dan Juniwati Rahmat HussinGopala Krishnan a/l K.SundaramOng Ai LinDato’ Roslina binti ZainalDato’ Ir. Nawawi bin Ahmad Appointed w.e.f. 16 October 2020Datuk Rawisandran a/l Narayanan Appointed w.e.f. 16 October 2020Azmin bin Ishak (Alternate Director to Dato’ Asri bin Hamidin @ Hamidon) Appointed w.e.f. 1 July 2020Tan Sri Ahmad Badri bin Mohd Zahir Cessation of Office as Chairman w.e.f. 11 May 2020Gee Siew Yoong Cessation of Office as Director w.e.f. 30 June 2020 Datin Rashidah binti Mohd Sies Appointed w.e.f. 1 May 2020 & Resigned w.e.f. 1 July 2020Dato’ Cheok Lay Leng Resigned w.e.f. 1 October 2020Datuk Seri Amir Hamzah bin Azizan Resigned w.e.f. 28 February 2021
The Directors of subsidiaries who have held office during the financial year and during the period from the end of the financial year to the date of the report are set out in the respective subsidiary’s statutory accounts and the said information is deemed incorporated herein by such reference and made part thereof.
DIRECTORS’ BENEFITS
During and at the end of the financial year, no arrangements subsisted to which the Company is a party, being arrangements with the object or objects of enabling Directors of the Company to acquire benefits by means of the acquisition of shares in or debentures of the Company or any other body corporate, other than as disclosed in the Directors’ interests in shares and debentures.
Since the end of the previous financial year, no Director has received or become entitled to receive a benefit (other than benefits shown under Directors’ Remuneration below and in Note 34 to the financial statements) by reason of a contract made by the Company or a related corporation with the Director or with a firm of which the Director is a partner, or with a company in which the Director has a substantial financial interest.
INDEMNITY AND INSURANCE COSTS
TNB Group and Company have their own Directors and Officers Liability Insurance at a premium of RM375,000 to cover the liability of Directors and Officers in discharging their duties for the period of 1 November 2020 until 31 October 2021.

p.173
INTEGRATED ANNUAL REPORT 2020
FINANCIAL STATEMENTS
DIRECTORS’ INTERESTS IN SHARES AND DEBENTURES
According to the Register of Directors’ Shareholdings required to be kept under Section 59 of the Companies Act 2016, none of the Directors who held office at the end of the financial year held any shares or debentures in the Company or its subsidiaries during the financial year except as follows:
Number of ordinary shares
As at1.1.2020
Vested/Acquired (Disposed)
As at31.12.2020
Datuk Seri Amir Hamzah bin Azizan 15,000 42,200* 0 57,200
Dato’ Roslina binti Zainal 18,400 0 0 18,400
* 12,200 shares were vested pursuant to vesting of shares under LTIP. The remaining 30,000 shares were acquired through nominees of Cimsec Nominees (Tempatan) Sdn. Bhd.
DIRECTORS’ REMUNERATION
Group Company
2020RM
2019RM
2020RM
2019RM
Non-Executive Directors’ fees 2,412,715 2,566,968 2,366,715 2,230,968
Non-Executive Directors’ other emoluments 4,152,817 983,959 4,148,817 916,559
Executive Directors’ remuneration and other emoluments 4,148,830 7,833,669 4,148,830 7,833,669
10,714,362 11,384,596 10,664,362 10,981,196
In respect of the Directors or past Directors of the Company, there were benefits receivable by the Directors from the Company and its subsidiaries as Directors’ other emoluments for their services. The estimated monetary value of benefits received by the Directors was RM3,412,000 (2019: RM240,459) for the Group and Company.
Directors’ Repor t
p.174
TENAGA NASIONAL BERHAD
STATUTORY INFORMATION ON THE FINANCIAL STATEMENTS
(a) Before the financial statements of the Group and of the Company were prepared, the Directors took reasonable steps:
(i) to ascertain that proper action had been taken in relation to the writing off of bad debts and the making of provision for doubtful debts and satisfied themselves that all known bad debts had been written off and that adequate provision had been made for doubtful debts; and
(ii) to ensure that any current assets, which were unlikely to be realised in the ordinary course of business, including the values of current assets as shown in the accounting records of the Group and of the Company had been written down to an amount which the current assets might be expected so to realise.
(b) At the date of this report, the Directors are not aware of any circumstances:
(i) which would render the amount written off for bad debts or the amount of the provision for doubtful debts inadequate to any substantial extent; or
(ii) which would render the values attributed to current assets in the financial statements of the Group and of the Company misleading; or(iii) which have arisen and would render adherence to the existing method of valuation of assets or liabilities of the Group and of the
Company misleading or inappropriate.
(c) At the date of this report:
(i) there are no charges on the assets of the Group and of the Company which have arisen since the end of the financial year which secures the liabilities of any other person; and
(ii) there are no contingent liabilities in the Group and in the Company which have arisen since the end of the financial year.
(d) No contingent or other liability of any company in the Group has become enforceable or is likely to become enforceable within the period of twelve months after the end of the financial year which, in the opinion of the Directors, will or may affect the ability of the Group and its subsidiaries to meet their obligations when they fall due.
(e) At the date of this report, the Directors are not aware of any circumstances not otherwise dealt with in this report or the financial statements of the Group and of the Company which would render any amount stated in the respective financial statements misleading.
(f) In the opinion of the Directors:
(i) the results of the operations of the Group and of the Company during the financial year were not substantially affected by any item, transaction or event of a material and unusual nature, except as disclosed in Notes 48 and 49 to the financial statements; and
(ii) there has not arisen in the interval between the end of the financial year and the date of this report any item, transaction or event of a material and unusual nature likely to affect substantially the results of the operations of the Group and of the Company for the financial year in which this report is made, except as disclosed in Note 50 to the financial statements.
AUDITORS
The auditors, PricewaterhouseCoopers PLT (LLP0014401-LCA & AF 1146), have expressed their willingness to accept re-appointment as auditors.
Details of the auditors’ remuneration are set out in Note 34 to the financial statements.
This report was approved by the Board of Directors on 17 March 2021. Signed on behalf of the Board of Directors:
DATO’ SERI MAHDZIR BIN KHALID DATUK IR. BAHARIN BIN DINCHAIRMAN PRESIDENT/CHIEF EXECUTIVE OFFICER
Directors’ Repor t

p.175
INTEGRATED ANNUAL REPORT 2020
FINANCIAL STATEMENTS
Group Company
Note 2020RM’million
2019RM’million
2020RM’million
2019RM’million
NON-CURRENT ASSETS
Property, plant and equipment 5 112,596.1 109,966.0 69,528.7 71,345.7
Right-of-use assets 6 34,906.3 38,264.0 67,082.9 70,806.3
Subsidiaries 7 0 0 822.8 6,796.9
Joint ventures 8(a) 200.6 177.4 0 0
Associates 9 1,138.6 1,264.0 75.7 50.6
Goodwill on consolidation 10 434.0 241.3 0 0
Investment in unquoted debt securities 11 265.8 331.8 265.8 12.0
Tax recoverable 3,522.4 1,765.1 3,522.4 1,765.1
Deferred tax assets 12 131.0 124.3 0 0
Long term receivables 13 227.8 740.0 51.7 71.7
Amounts due from subsidiaries 14(a) 0 0 11,873.2 645.6
Finance lease receivables 15(a) 10.1 11.9 0 0
Financial assets at fair value through other comprehensive income (‘FVOCI’) 16 57.6 58.9 56.9 58.2
Financial assets at fair value through profit or loss (‘FVTPL’) 17 140.5 149.1 82.3 86.3
153,630.8 153,093.8 153,362.4 151,638.4
CURRENT ASSETS
Inventories 18 1,583.8 1,925.3 376.5 491.9
Receivables, deposits and prepayments 19 6,893.7 4,760.5 5,383.7 3,127.4
Contract assets 20(b) 3,197.8 3,508.2 3,084.5 3,356.8
Contract cost assets 20(a) 125.3 10.5 0 0
Tax recoverable 1,765.5 1,129.9 1,432.5 794.2
Finance lease receivables 15(a) 1.1 1.0 0 0
Amounts due from subsidiaries 14(b) 0 0 1,898.5 2,957.5
Amounts due from joint ventures 8(a) 19.4 10.6 0 0
Amounts due from associates 9 183.5 155.8 3.4 2.6
Financial assets at FVTPL 17 6,973.9 7,959.9 5,244.3 7,248.1
Deposits, bank and cash balances 21 6,441.5 6,291.7 2,395.0 2,747.3
27,185.5 25,753.4 19,818.4 20,725.8
Assets classified as held for sale 22 617.0 0 0 0
27,802.5 25,753.4 19,818.4 20,725.8
Consolidated Statement of Financial PositionAs at 31 December 2020

p.176
TENAGA NASIONAL BERHAD
Group Company
Note 2020RM’million
2019RM’million
2020RM’million
2019RM’million
CURRENT LIABILITIES
Payables 23 (10,534.1) (9,220.3) (7,908.4) (6,085.6)
Contract liabilities 20(c) (420.5) (354.4) (259.3) (281.1)
Derivative financial instruments 24 (1.3) (8.6) (1.3) (0.2)
Lease liabilities 15(b) (3,257.8) (3,403.3) (5,611.4) (4,904.5)
Amounts due to subsidiaries 14(b) 0 0 (1,411.9) (867.7)
Amounts due to associates 9 (237.8) (286.6) (228.1) (278.6)
Amount due to joint venture 8(a) 0 (0.1) 0 0
Current tax liabilities (44.8) (70.2) (30.1) (43.3)
Employee benefits 25 (783.8) (758.2) (764.5) (739.0)
Consumer deposits 26 (6,606.0) (6,220.9) (6,263.1) (5,880.5)
Short term borrowings 27 (6,409.1) (3,479.3) (3,492.2) (999.7)
(28,295.2) (23,801.9) (25,970.3) (20,080.2)
Liabilities directly associated with assets classified as held for sale 22 (506.1) 0 0 0
(28,801.3) (23,801.9) (25,970.3) (20,080.2)
NET CURRENT (LIABILITIES)/ASSETS (998.8) 1,951.5 (6,151.9) 645.6
TOTAL ASSETS LESS CURRENT LIABILITIES 152,632.0 155,045.3 147,210.5 152,284.0
NON-CURRENT LIABILITIES
Borrowings 28 (43,043.5) (41,932.4) (18,599.1) (18,488.4)
Derivative financial instruments 24 (175.7) (37.2) 0 0
Contract liabilities 20(c) (3,753.7) (3,430.0) (3,020.9) (2,709.0)
Government development grants 29 (961.2) (1,031.3) 0 0
Lease liabilities 15(b) (25,471.0) (27,902.8) (59,907.7) (62,534.4)
Deferred tax liabilities 12 (7,805.8) (7,783.0) (6,006.9) (6,486.4)
Other liabilities 30 (902.3) (979.9) (606.3) (657.0)
Employee benefits 25 (13,068.9) (12,666.6) (12,314.6) (11,914.1)
(95,182.1) (95,763.2) (100,455.5) (102,789.3)
TOTAL NET ASSETS 57,449.9 59,282.1 46,755.0 49,494.7
EQUITY
Share capital 31 11,675.2 11,446.1 11,675.2 11,446.1
Other reserves 32 (8,242.7) (7,763.8) (6,918.6) (6,510.3)
Retained profits 52,400.7 54,299.5 41,998.4 44,558.9
CAPITAL AND RESERVES ATTRIBUTABLE TO OWNERS OF THE COMPANY 55,833.2 57,981.8 46,755.0 49,494.7
NON-CONTROLLING INTERESTS (‘NCI’) 1,616.7 1,300.3 0 0
TOTAL EQUITY 57,449.9 59,282.1 46,755.0 49,494.7
Consolidated Statement of Financial PositionAs at 31 December 2020
The notes set out on pages 186 to 337 form an integral part of these consolidated financial statements.
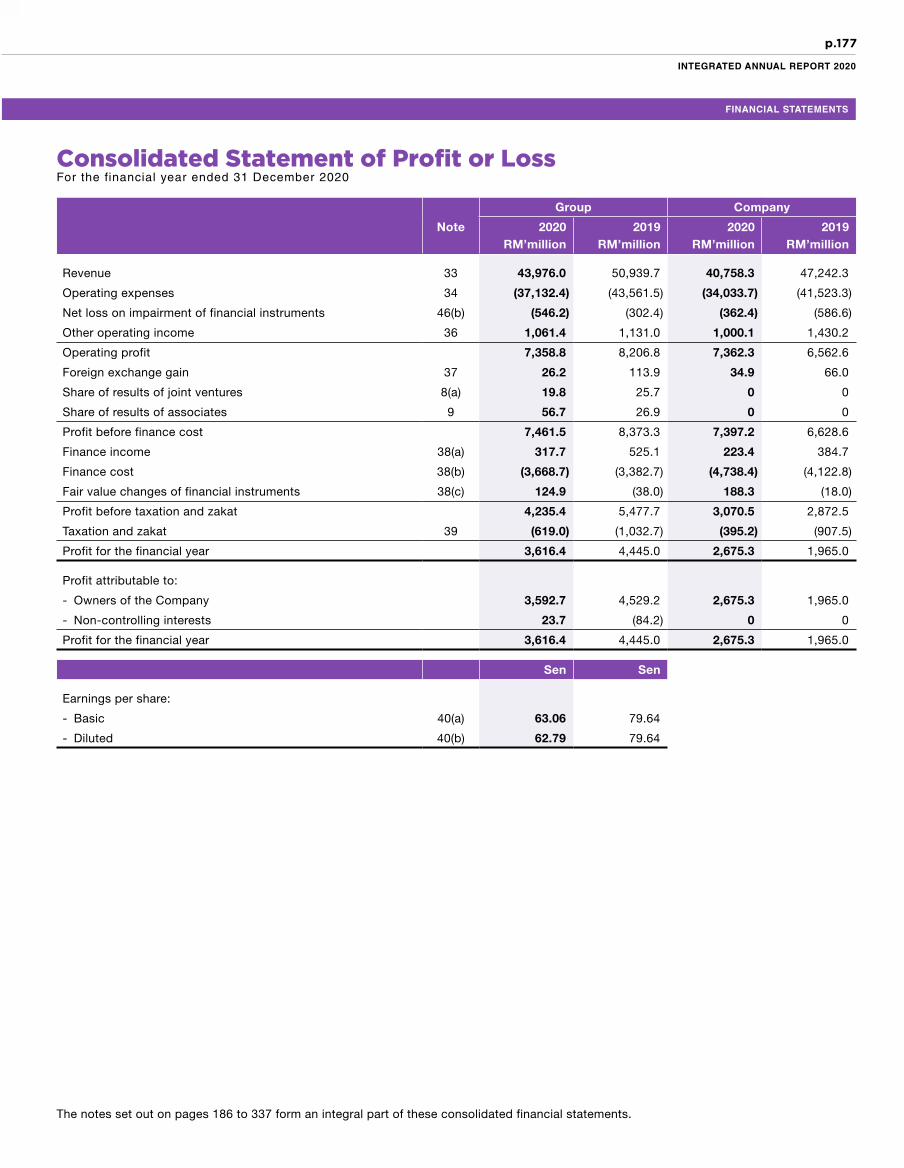
p.177
INTEGRATED ANNUAL REPORT 2020
FINANCIAL STATEMENTS
Group Company
Note 2020RM’million
2019RM’million
2020RM’million
2019RM’million
Revenue 33 43,976.0 50,939.7 40,758.3 47,242.3
Operating expenses 34 (37,132.4) (43,561.5) (34,033.7) (41,523.3)
Net loss on impairment of financial instruments 46(b) (546.2) (302.4) (362.4) (586.6)
Other operating income 36 1,061.4 1,131.0 1,000.1 1,430.2
Operating profit 7,358.8 8,206.8 7,362.3 6,562.6
Foreign exchange gain 37 26.2 113.9 34.9 66.0
Share of results of joint ventures 8(a) 19.8 25.7 0 0
Share of results of associates 9 56.7 26.9 0 0
Profit before finance cost 7,461.5 8,373.3 7,397.2 6,628.6
Finance income 38(a) 317.7 525.1 223.4 384.7
Finance cost 38(b) (3,668.7) (3,382.7) (4,738.4) (4,122.8)
Fair value changes of financial instruments 38(c) 124.9 (38.0) 188.3 (18.0)
Profit before taxation and zakat 4,235.4 5,477.7 3,070.5 2,872.5
Taxation and zakat 39 (619.0) (1,032.7) (395.2) (907.5)
Profit for the financial year 3,616.4 4,445.0 2,675.3 1,965.0
Profit attributable to:
- Owners of the Company 3,592.7 4,529.2 2,675.3 1,965.0
- Non-controlling interests 23.7 (84.2) 0 0
Profit for the financial year 3,616.4 4,445.0 2,675.3 1,965.0
Sen Sen
Earnings per share:
- Basic 40(a) 63.06 79.64
- Diluted 40(b) 62.79 79.64
Consolidated Statement of Profit or LossFor the financial year ended 31 December 2020
The notes set out on pages 186 to 337 form an integral part of these consolidated financial statements.

p.178
TENAGA NASIONAL BERHAD
Group Company
Note 2020RM’million
2019RM’million
2020RM’million
2019RM’million
Profit for the financial year 3,616.4 4,445.0 2,675.3 1,965.0
Other comprehensive (expense)/income
Items that will not be reclassified subsequently to profit or loss:
- Defined benefit plan actuarial loss (402.0) (1,303.6) (403.1) (1,179.4)
Items that may be reclassified subsequently to profit or loss:
- Foreign currency translation differences (34.3) (101.5) 0 0
- Financial assets at FVOCI (1.3) (17.5) (1.3) (17.5)
- Share of other comprehensive income (‘OCI’) of associates accounted for using the equity method 9 (38.7) 19.8 0 0
Total other comprehensive expense (476.3) (1,402.8) (404.4) (1,196.9)
Total comprehensive income for the financial year 3,140.1 3,042.2 2,270.9 768.1
Attributable to:
- Owners of the Company 3,117.7 3,147.5 2,270.9 768.1
- Non-controlling interests 22.4 (105.3) 0 0
Total comprehensive income for the financial year 3,140.1 3,042.2 2,270.9 768.1
Consolidated Statement of Comprehensive IncomeFor the financial year ended 31 December 2020
The notes set out on pages 186 to 337 form an integral part of these consolidated financial statements.

p.179
INTEGRATED ANNUAL REPORT 2020
FINANCIAL STATEMENTS
Note
Attributable to owners of the Company Non-controlling
interestsRM’million
Totalequity
RM’million
Ordinaryshares
RM’million
Otherreserves
RM’million
Retainedprofits
RM’million
Group
At 1 January 2020 11,446.1 (7,763.8) 54,299.5 1,300.3 59,282.1
Profit for the financial year 0 0 3,592.7 23.7 3,616.4
Foreign currency translation reserve 32 0 (33.6) 0 (0.7) (34.3)
Fair value changes of financial assets at OCI 32 0 (1.3) 0 0 (1.3)
Share of OCI of associates accounted for using the equity method 32 0 (38.7) 0 0 (38.7)
Employee benefits reserve 32 0 (401.4) 0 (0.6) (402.0)
Total comprehensive (expense)/income for the financial year 0 (475.0) 3,592.7 22.4 3,140.1
LTIP:
- Share-based payment expense 32 0 272.2 0 0 272.2
- Reversal of share-based payment expense 32 0 (47.0) 0 0 (47.0)
- Shares issued 32 229.1 (229.1) 0 0 0
Dividends paid:
- Final dividend for FY2019 41 0 0 (1,137.4) 0 (1,137.4)
- Special dividend for FY2019 41 0 0 (2,843.4) 0 (2,843.4)
- Interim dividend for FY2020 41 0 0 (1,255.0) 0 (1,255.0)
Dividend paid to NCI 0 0 0 (2.8) (2.8)
Acquisition of shares from NCI 7 0 0 (11.4) 9.5 (1.9)
Acquisition of Redeemable Preference Shares from NCI 7 0 0 (244.3) (36.8) (281.1)
Subscription of Redeemable Preference Shares by NCI 7 0 0 0 225.3 225.3
Acquisition of new subsidiary 7 0 0 0 98.8 98.8
Total transactions with owners 229.1 (3.9) (5,491.5) 294.0 (4,972.3)
At 31 December 2020 11,675.2 (8,242.7) 52,400.7 1,616.7 57,449.9
Consolidated Statement of Changes in EquityFor the financial year ended 31 December 2020
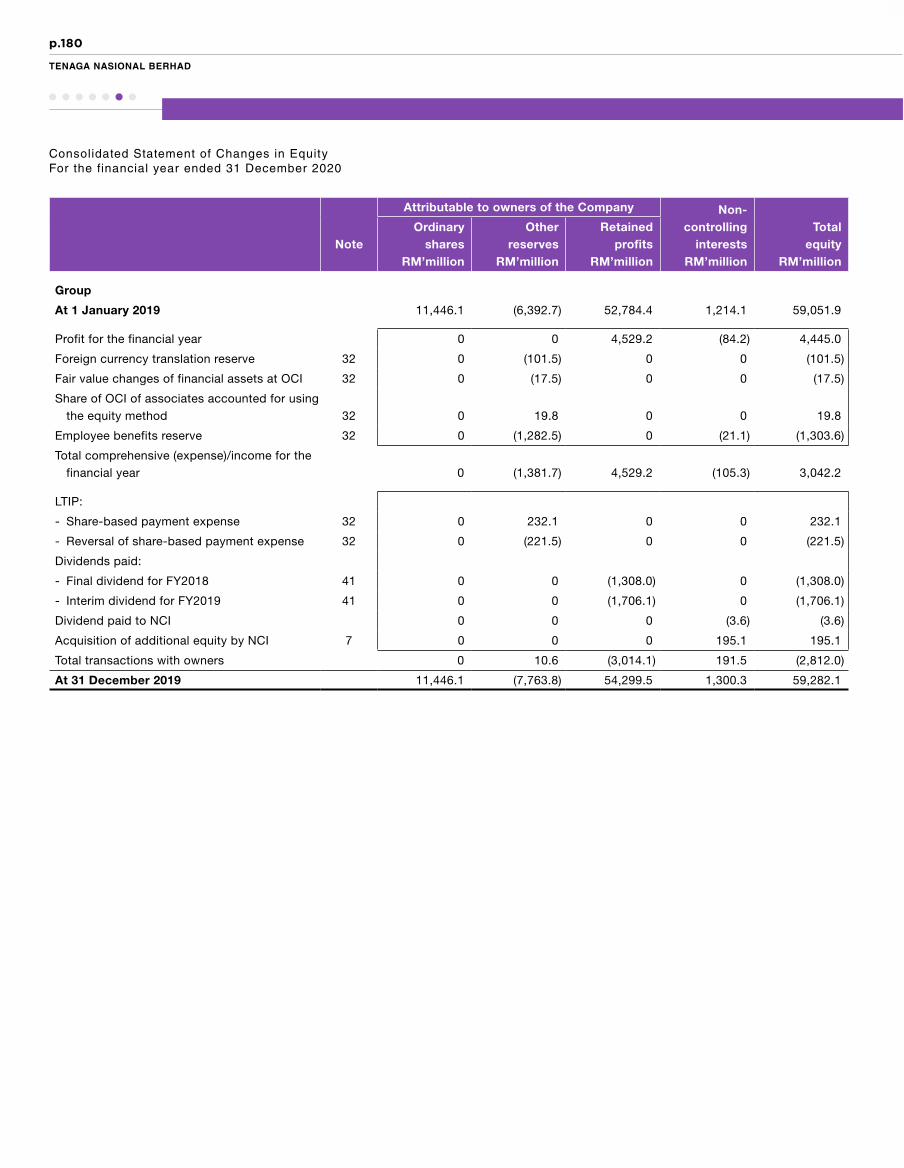
p.180
TENAGA NASIONAL BERHAD
Attributable to owners of the Company Non-controlling
interestsRM’million
Totalequity
RM’millionNote
Ordinaryshares
RM’million
Otherreserves
RM’million
Retainedprofits
RM’million
Group
At 1 January 2019 11,446.1 (6,392.7) 52,784.4 1,214.1 59,051.9
Profit for the financial year 0 0 4,529.2 (84.2) 4,445.0
Foreign currency translation reserve 32 0 (101.5) 0 0 (101.5)
Fair value changes of financial assets at OCI 32 0 (17.5) 0 0 (17.5)
Share of OCI of associates accounted for using the equity method 32 0 19.8 0 0 19.8
Employee benefits reserve 32 0 (1,282.5) 0 (21.1) (1,303.6)
Total comprehensive (expense)/income for the financial year 0 (1,381.7) 4,529.2 (105.3) 3,042.2
LTIP:
- Share-based payment expense 32 0 232.1 0 0 232.1
- Reversal of share-based payment expense 32 0 (221.5) 0 0 (221.5)
Dividends paid:
- Final dividend for FY2018 41 0 0 (1,308.0) 0 (1,308.0)
- Interim dividend for FY2019 41 0 0 (1,706.1) 0 (1,706.1)
Dividend paid to NCI 0 0 0 (3.6) (3.6)
Acquisition of additional equity by NCI 7 0 0 0 195.1 195.1
Total transactions with owners 0 10.6 (3,014.1) 191.5 (2,812.0)
At 31 December 2019 11,446.1 (7,763.8) 54,299.5 1,300.3 59,282.1
Consolidated Statement of Changes in EquityFor the financial year ended 31 December 2020
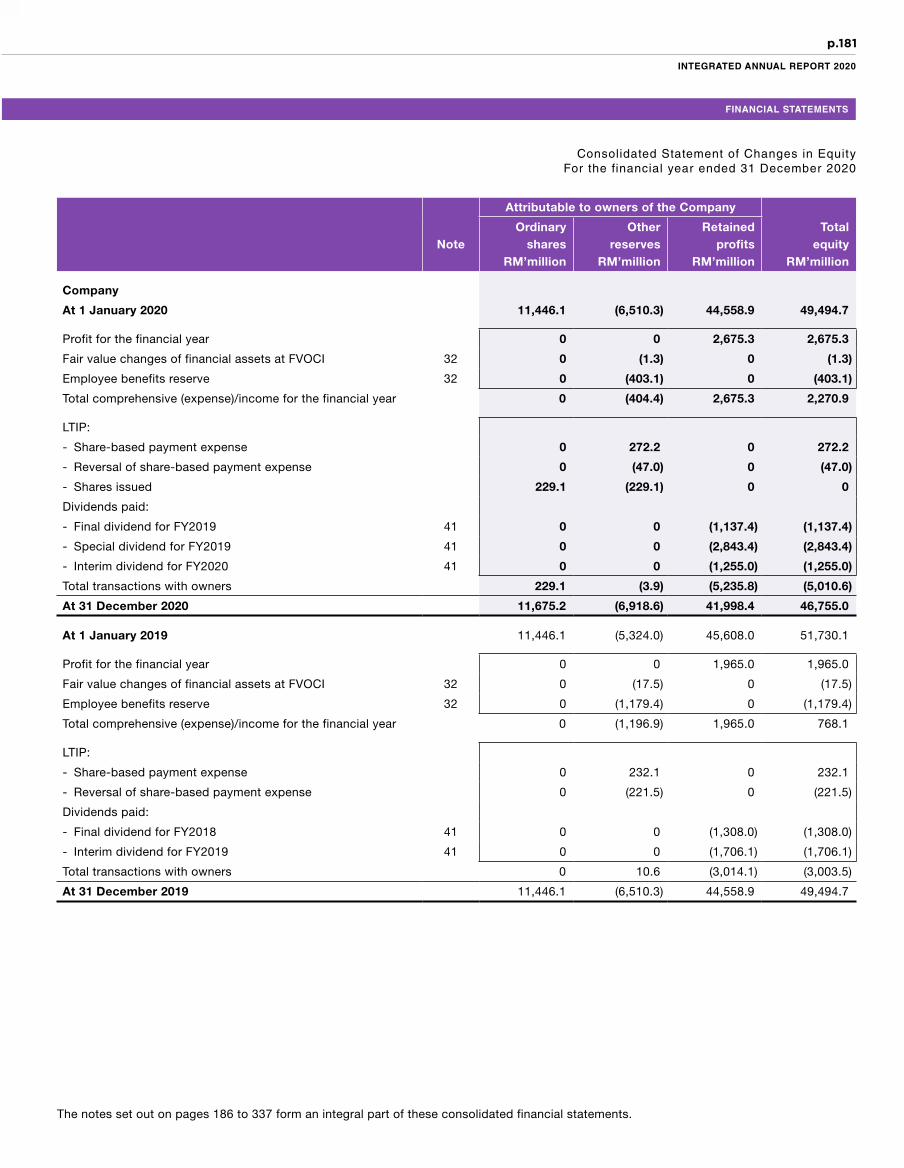
p.181
INTEGRATED ANNUAL REPORT 2020
FINANCIAL STATEMENTS
Attributable to owners of the Company
Totalequity
RM’millionNote
Ordinary shares
RM’million
Otherreserves
RM’million
Retainedprofits
RM’million
Company
At 1 January 2020 11,446.1 (6,510.3) 44,558.9 49,494.7
Profit for the financial year 0 0 2,675.3 2,675.3
Fair value changes of financial assets at FVOCI 32 0 (1.3) 0 (1.3)
Employee benefits reserve 32 0 (403.1) 0 (403.1)
Total comprehensive (expense)/income for the financial year 0 (404.4) 2,675.3 2,270.9
LTIP:
- Share-based payment expense 0 272.2 0 272.2
- Reversal of share-based payment expense 0 (47.0) 0 (47.0)
- Shares issued 229.1 (229.1) 0 0
Dividends paid:
- Final dividend for FY2019 41 0 0 (1,137.4) (1,137.4)
- Special dividend for FY2019 41 0 0 (2,843.4) (2,843.4)
- Interim dividend for FY2020 41 0 0 (1,255.0) (1,255.0)
Total transactions with owners 229.1 (3.9) (5,235.8) (5,010.6)
At 31 December 2020 11,675.2 (6,918.6) 41,998.4 46,755.0
At 1 January 2019 11,446.1 (5,324.0) 45,608.0 51,730.1
Profit for the financial year 0 0 1,965.0 1,965.0
Fair value changes of financial assets at FVOCI 32 0 (17.5) 0 (17.5)
Employee benefits reserve 32 0 (1,179.4) 0 (1,179.4)
Total comprehensive (expense)/income for the financial year 0 (1,196.9) 1,965.0 768.1
LTIP:
- Share-based payment expense 0 232.1 0 232.1
- Reversal of share-based payment expense 0 (221.5) 0 (221.5)
Dividends paid:
- Final dividend for FY2018 41 0 0 (1,308.0) (1,308.0)
- Interim dividend for FY2019 41 0 0 (1,706.1) (1,706.1)
Total transactions with owners 0 10.6 (3,014.1) (3,003.5)
At 31 December 2019 11,446.1 (6,510.3) 44,558.9 49,494.7
Consolidated Statement of Changes in EquityFor the financial year ended 31 December 2020
The notes set out on pages 186 to 337 form an integral part of these consolidated financial statements.

p.182
TENAGA NASIONAL BERHAD
Group Company
2020RM’million
2019RM’million
2020RM’million
2019RM’million
CASH FLOWS FROM OPERATING ACTIVITIES
Profit for the financial year 3,616.4 4,445.0 2,675.3 1,965.0
Adjustments for:
Taxation and zakat 619.0 1,032.7 395.2 907.5
Property, plant and equipment:
- Depreciation 6,997.3 6,421.7 4,758.5 4,611.0
- Written off 27.3 69.3 27.3 69.3
- Gain on disposals (8.2) (213.3) (6.5) (213.3)
- Abandoned projects 30.8 0.2 30.8 0.2
Right-of-use (‘ROU’) assets:
- Depreciation 3,625.1 3,767.2 5,465.5 5,093.6
- Gain on disposals (0.1) (1.2) (0.1) (1.2)
Provision for post-employment benefits 686.7 725.7 634.7 673.9
LTIP:
- Share-based payment expense 272.2 232.1 177.8 182.4
- Reversal of share-based payment expense (47.0) (221.5) (31.5) (174.8)
Foreign exchange translation gain (71.6) (200.6) (72.7) (118.6)
Remeasurement gain on previously held interest in an associate (231.3) 0 0 0
Gain on redemption of redeemable preference shares in subsidiaries 0 0 (110.8) (378.4)
Loss on modification of Preferred Equity Certificate (‘PEC’) 0 13.4 0 0
Share of results of joint ventures (19.8) (25.7) 0 0
Share of results of associates (56.7) (26.9) 0 0
Dividend income (3.1) 0 (175.6) (90.3)
Finance income (317.7) (525.1) (223.4) (384.7)
Finance cost on:
- Borrowings 1,924.1 1,487.7 721.5 706.4
- Lease liabilities 1,587.9 1,727.2 3,864.9 3,270.3
- Consumer deposits 158.7 153.1 151.9 145.0
- Others 19.5 47.0 0.1 1.1
Release of:
- Customers’ contributions (283.0) (271.5) (237.0) (229.3)
- Deferred income (265.8) (330.4) 0 0
Government development grants:
- Other operating income (66.8) (59.9) 0 0
- Finance cost (21.5) (32.3) 0 0
Impairment losses on:
- Receivables 623.7 306.1 405.9 240.4
- Contract assets 43.8 56.6 36.7 44.0
- Amounts due from subsidiaries 0 0 290.0 538.7
- Amounts due from joint ventures 28.4 0 0 0
- Amounts due from associates 0.2 0 0.2 0
- Financial guarantees 0 134.6 0 135.1
- Investment in unquoted debt securities 37.6 0 37.6 0
Consolidated Statement of Cash FlowsFor the financial year ended 31 December 2020

p.183
INTEGRATED ANNUAL REPORT 2020
FINANCIAL STATEMENTS
Group Company
2020RM’million
2019RM’million
2020RM’million
2019RM’million
CASH FLOWS FROM OPERATING ACTIVITIES (CONTINUED)
Adjustments for: (continued)
Reversal of impairment losses on:
- Receivables (133.4) (105.0) (64.3) (34.2)
- Contract assets (50.5) (89.8) (44.0) (78.4)
- Amounts due from subsidiaries 0 0 (299.1) (258.9)
- Amounts due from joint ventures (3.6) 0 0 0
- Amounts due from associates 0 (0.1) 0 (0.1)
- Financial guarantees 0 0 (0.6) 0
Impairment losses on investment in:
- Subsidiaries 0 0 164.5 1,355.0
- Joint ventures 0 0.5 0 0
- Associates 51.6 198.3 0 0
Inventories:
- Provision for obsolescence 163.7 122.9 105.6 116.7
- Write back of obsolescence (117.9) (89.2) (117.9) (89.2)
- Written off 82.5 38.4 78.2 37.8
Changes in fair value of financial instruments (124.9) 38.0 (188.3) 18.0
Cash from operations before working capital changes 18,773.6 18,825.2 18,450.4 18,060.0
Inventories 216.0 (701.5) 49.5 (263.2)
Receivables (2,380.4) 2,829.0 (2,570.0) 1,629.8
Contract balances 203.8 (103.9) 279.6 (117.4)
Payables 1,508.8 300.8 1,671.6 920.6
Subsidiaries balances 0 0 (733.4) 566.9
Associates balances (76.7) 99.7 (51.5) (102.6)
Joint ventures balances (33.7) (0.2) 0 0
Lease liabilities (125.8) (738.3) (374.4) (1,248.7)
Cash generated from operations 18,085.6 20,510.8 16,721.8 19,445.4
Post-employment benefits paid (787.5) (885.7) (757.0) (868.3)
Contract liabilities received 938.6 1,136.0 527.1 636.6
Consumer deposits received 226.4 306.2 230.7 293.1
Taxation and zakat paid (2,944.5) (1,609.6) (2,735.5) (1,243.7)
Net cash flows generated from operating activities 15,518.6 19,457.7 13,987.1 18,263.1
Consolidated Statement of Cash FlowsFor the financial year ended 31 December 2020

p.184
TENAGA NASIONAL BERHAD
Group Company
2020RM’million
2019RM’million
2020RM’million
2019RM’million
CASH FLOWS FROM INVESTING ACTIVITIES
Acquisition of subsidiaries net of cash and cash equivalent 66.9 0 0 0
Deferred consideration paid (68.3) 0 0 0
Additional investments in:
- Subsidiaries 0 0 (882.6) 0
- Unquoted debt securities (104.9) 0 (104.9) 0
- Financial assets at FVTPL (68,925.1) (73,111.7) (66,420.0) (72,976.0)
- Joint venture (3.4) (1.4) 0 0
- Associate (25.1) 0 (25.1) 0
Proceeds from redemptions:
- Redeemable preference shares in subsidiaries 0 0 329.3 1,293.3
- Redeemable preference shares in associates 42.8 40.4 0 9.3
Disposals of financial assets at FVTPL 70,050.6 74,593.5 68,563.0 71,037.0
Dividend income received 63.7 57.3 172.5 90.3
Finance income received 130.8 226.0 47.2 95.2
Property, plant and equipment:
- Additions (6,909.7) (10,759.5) (5,165.0) (7,499.6)
- Proceeds from disposals 188.6 51.7 186.9 36.4
Right-of-use assets:
- Proceeds from disposals 0.1 1.2 0.1 1.2
Advances granted to subsidiaries 0 0 (200.6) (62.4)
Net cash flows used in investing activities (5,493.0) (8,902.5) (3,499.2) (7,975.3)
CASH FLOWS FROM FINANCING ACTIVITIES
Government development grants received 9.3 8.6 0 0
Long term borrowings:
- Drawdowns 3,112.6 246.9 3,000.0 0
- Repayments (911.3) (2,853.7) (105.5) (1,990.5)
Short term borrowings:
- Drawdowns 3,341.9 866.4 2,490.0 0
- Repayments (3,538.7) (903.2) (2,740.0) 0
Finance cost paid:
- Borrowings (2,224.8) (2,310.1) (940.3) (971.3)
- Others 0 (0.6) 0 (0.6)
Repayments of lease obligations:
- Principal (2,738.5) (3,762.2) (3,514.8) (4,561.5)
- Interest (1,597.4) (1,209.8) (3,783.8) (2,830.5)
Consolidated Statement of Cash FlowsFor the financial year ended 31 December 2020

p.185
INTEGRATED ANNUAL REPORT 2020
FINANCIAL STATEMENTS
Group Company
2020RM’million
2019RM’million
2020RM’million
2019RM’million
CASH FLOWS FROM FINANCING ACTIVITIES (CONTINUED)
Dividends paid to shareholders (5,235.8) (3,014.1) (5,235.8) (3,014.1)
Dividends paid to NCI (2.8) (3.6) 0 0
Acquisition of PEC from NCI (32.4) 0 0 0
Subscription of Redeemable Preference Shares by NCI 225.3 0 0 0
Acquisition of Redeemable Preference Shares from NCI (281.1) 0 0 0
Acquisition of shares from NCI (1.9) 0 0 0
Net decrease in debt reserve accounts 4.1 104.8 0 0
Net increase in cash at bank, held in trust (34.1) (118.2) 0 0
Net increase in restricted cash (84.6) (6.3) 0 0
Net decrease/(increase) in deposits maturing more than 90 days 2,547.0 (2,759.0) 2,200.2 (2,200.2)
Net cash flows used in financing activities (7,443.2) (15,714.1) (8,630.0) (15,568.7)
NET INCREASE/(DECREASE) IN CASH AND CASH EQUIVALENTS 2,582.4 (5,158.9) 1,857.9 (5,280.9)
EFFECTS OF CHANGES IN FOREIGN CURRENCY (0.2) 1.1 (10.0) (24.4)
CASH AND CASH EQUIVALENTS AT THE BEGINNING OF THE FINANCIAL YEAR 2,440.8 7,598.6 547.1 5,852.4
CASH AND CASH EQUIVALENTS AT THE END OF THE FINANCIAL YEAR (NOTE 21) 5,023.0 2,440.8 2,395.0 547.1
The changes in liabilities arising from financing activities have been disclosed in Notes 15, 28 and 29 respectively.
Consolidated Statement of Cash FlowsFor the financial year ended 31 December 2020
The notes set out on pages 186 to 337 form an integral part of these consolidated financial statements.

p.186
TENAGA NASIONAL BERHAD
1 GENERAL INFORMATION
The Group and Company are primarily involved in the business of the generation, transmission, distribution and sales of electricity and those tabulated in Note 7 to these financial statements, which also includes the details of the subsidiaries of the Group.
There have been no significant changes in these activities of the Group and Company during the financial year other than as disclosed in Note 49.
The Company follows the Incentive Based Regulation (‘IBR’) principles for the regulated business.
The Company is a public limited liability company, incorporated and domiciled in Malaysia and is listed on the Main Market of Bursa Malaysia Securities Berhad.
The address of the registered office of the Company is Pejabat Setiausaha Syarikat, Tingkat 2, Ibu Pejabat Tenaga Nasional Berhad, No. 129, Jalan Bangsar, 59200 Kuala Lumpur, Malaysia.
2 BASIS OF PREPARATION
The financial statements of the Group and Company have been prepared in accordance with the provisions of the Malaysian Financial Reporting Standards (‘MFRS’), International Financial Reporting Standards (‘IFRS’) and the requirements of the Companies Act 2016 in Malaysia. The Group has taken into consideration the COVID-19 (Coronavirus) impact and the current economic environment on the basis of preparation of this financial statements. The Directors continue to consider it appropriate to adopt the going concern basis of accounting in preparing the financial statements.
The financial statements have been prepared under the historical cost convention, except as disclosed in Note 3 and respective notes in the financial statements.
The preparation of financial statements in conformity with MFRS requires the use of certain critical accounting estimates and assumptions that affect the reported amounts of assets and liabilities and disclosure of contingent assets and liabilities at the date of the financial statements, and the reported amounts of revenues and expenses during the reported period. It also requires Directors to exercise their judgement in the process of applying the Group and Company’s accounting policies. Although these estimates and judgements are based on the Directors’ best knowledge of current events and actions, actual results may differ. The areas involving a higher degree of judgement or complexity, or areas where assumptions and estimates are significant to the financial statements are disclosed in Note 4.
(a) Amendments to published standards that are effective and applicable to the Group and Company.
The Group and Company have applied the following amendments to the published standards that are applicable to the Group and Company for the first time for the financial year beginning on 1 January 2020:
(i) Amendments to MFRS 3 ‘Business Combinations’ (‘MFRS 3’) on Definition of a Business (ii) Amendments to MFRS 7 ‘Financial Instruments: Disclosures’ (‘MFRS 7’) on Interest Rate Benchmark Reform(iii) Amendments to MFRS 9 ‘Financial Instruments’ (‘MFRS 9’) on Interest Rate Benchmark Reform(iv) Amendments to MFRS 101 ‘Presentation of Financial Statements’ (‘MFRS 101’) on Definition of Material(v) Amendments to MFRS 108 ‘Accounting Policies, Changes in Accounting Estimates and Errors’ (‘MFRS 108’) on Definition of
Material
Notes to the Financial Statements31 December 2020

p.187
INTEGRATED ANNUAL REPORT 2020
FINANCIAL STATEMENTS
Notes to the Financial Statements31 December 2020
2 BASIS OF PREPARATION (CONTINUED)
(a) Amendments to published standards that are effective and applicable to the Group and Company. (continued)
(vi) Amendments to References to the Conceptual Framework in MFRS Standards
- Amendments to MFRS 2 ‘Share-Based Payment’ (‘MFRS 2’)- Amendments to MFRS 101- Amendments to MFRS 108 - Amendments to MFRS 134 ‘Interim Financial Reporting’ (‘MFRS 134’)- Amendment to MFRS 137 ‘Provisions, Contingent Liabilities and Contingent Assets’ (‘MFRS 137’)- Amendment to MFRS 138 ‘Intangible Assets’ (‘MFRS 138’)- Amendment to IC Interpretation 19 ‘Extinguishing Financial Liabilities with Equity Instruments’ (‘IC 19’)- Amendment to IC Interpretation 22 ‘Foreign Currency Transactions and Advance Consideration’ (‘IC 22’)- Amendments to IC Interpretation 132 ‘Intangible Assets - Web Site Costs’ (‘IC 132’)
The amendments listed above did not have any significant impact on the amounts recognised in prior periods and are not expected to significantly affect the current or future periods.
(b) New standard and amendments to the published standards that are applicable to the Group and Company but not yet effective.
The Group and Company will apply the new standard and amendments to the published standards in the following periods:
(i) Financial year beginning on or after 1 January 2021
• Interest Rate Benchmark Reform – Phase 1 and Phase 2
Phase 1 of the Interest Rate Benchmark Reform (Amendments to MFRS 7 and MFRS 9) issued on 31 October 2019 is applicable for financial year beginning 1 January 2020.
Phase 2 of the Interest Rate Benchmark Reform will be applicable for financial year beginning 1 January 2021 to address the issues arising post-implementation of Phase 1. The amendments provide better insights on the effects of interest rate benchmark reform on the Group’s financial instruments and risk management strategy.
Amendments to MFRS 7 require disclosures of the Group’s progress in managing the transition to alternative benchmark rates at the reporting date, the quantitative information about derivatives and non-derivatives that yet to transition to the alternative rate and description of changes in Group’s risk management strategy due to the risks of transition to alternative benchmark rates.
Amendments to MFRS 9 require a change in the basis of determining ‘highly probable’ contractual cash flows of a financial asset or financial liability if both criteria are met: (i) the change is necessary as a direct consequence of the interest rate benchmark reform; and (ii) the new basis is economically equivalent to the previous basis.
Amendments to MFRS 9 also require to reinstate a discontinued hedging relationship if and only if: (i) the hedging relationship was discontinued due to the interest benchmark reform and the entity would continue with the hedging relationship if these amendments had been applied at that time; and (ii) at the beginning of reporting period of initial application, that discontinued hedging relationship meets the criteria for hedge accounting.
Amendments to MFRS 16 require a lease modification due to the interest rate benchmark reform if the following conditions are met:
1) the modification is necessary as the direct consequence of interest rate benchmark reform; and2) the new basis for determining the lease payments is economically equivalent to the previous basis.
These amendments are effective for annual periods beginning on or after 1 January 2021. Earlier application is permitted and should be disclosed.
These amendments should be applied retrospectively in accordance to MFRS 108, unless given exception by the Standards.

p.188
TENAGA NASIONAL BERHAD
Notes to the Financial Statements31 December 2020
2 BASIS OF PREPARATION (CONTINUED)
(b) New standard and amendments to the published standards that are applicable to the Group and Company but not yet effective. (continued)
(i) Financial year beginning on or after 1 January 2021 (continued)
• Amendments to MFRS 16 on COVID-19 Related Rent Concessions grant exemption for lessees (but not lessors) from assessing whether a rent concession is a lease modification under MFRS 16. The exemption only applies to rent concessions that are directly impacted by COVID-19 pandemic and only if all of the following conditions are met:
1) the change in lease payments results in substantially revised consideration that is either the same as, or less than, the consideration for the lease preceding the change;
2) any reduction in lease payments affects only payments due on or before 30 June 2021; and3) there is no substantive change to other terms and conditions of the lease.
These amendments should be applied retrospectively. Earlier application is permitted and should be disclosed.
(ii) Financial year beginning on or after 1 January 2022
• Amendments to MFRS 3 on Reference to the Conceptual Framework are to update the references, wordings and numbering. The Conceptual Framework defines a liability as ‘a present obligation of the entity to transfer an economic resource as a result of past events’.
• Amendments to MFRS 9 in Annual Improvements to MFRS Standards 2018 - 2020 state that the terms of financial liability considered substantially different if the difference between the financial liability’s discounted present value of cash flows under new terms compared against the original terms is at least 10%. The discounted cash flows should include the net of related fees paid and received.
• Amendments to MFRS 116 give broader example for cost of testing to include assessment costs of whether the technical and physical performance of the asset is capable of being used in production or supply of goods and services, for rental to others, or for administrative purposes.
In the event when there is an item produced by the property, plant and equipment (‘PPE’) before its intended use, which are not the ordinary output of the entity’s activities, the amounts of proceeds and costs are to be included in the profit or loss instead of being capitalised as the costs of PPE.
Earlier retrospective application of these amendments is permitted and should be disclosed.
• Amendments to MFRS 137 ‘Provisions, Contingent Liabilities and Contingent Assets’ (‘MFRS 137’) on Onerous Contracts – Cost of Fulfilling a Contract clarify that, costs relate directly to a contract comprise the incremental cost and the allocation of other costs that relate directly to fulfilling the contract. Examples of direct cost are direct labour and material while an example of allocation cost is depreciation charge of PPE used in fulfilling the contract.
The cumulative effect of the amendments is recognised as an adjustment to the opening balance of retained profits or other components of equity at the date of initial application.
Earlier application of these amendments is permitted and should be disclosed.

p.189
INTEGRATED ANNUAL REPORT 2020
FINANCIAL STATEMENTS
Notes to the Financial Statements31 December 2020
2 BASIS OF PREPARATION (CONTINUED)
(b) New standard and amendments to the published standards that are applicable to the Group and Company but not yet effective. (continued)
(iii) Financial year beginning on or after 1 January 2023
• MFRS 17 introduces consistent accounting for all insurance contracts based on a current measurement model. MFRS 17 requires entities that issue insurance contracts to recognise and measure a group of insurance contracts at: (i) a risk-adjusted present value of future cash flows that incorporates information that is consistent with observable market information; plus (ii) an amount representing the unearned profit in the group of contracts. Profits from the group of insurance contracts are recognised over the insurance coverage period. MFRS 17 requires separate presentation in the statement of financial position on the carrying amount of portfolios of insurance contracts issued that are assets and those that are liabilities rather than groups of insurance.
For insurance contracts with coverage period of one year or less, MFRS 17 allows an entity to measure the amount relating to remaining service by allocating the premium over the coverage period.
MFRS 17 shall be applied with transitional reliefs available. If MFRS 17 is applied earlier, that fact should be disclosed as initial application of MFRS 17.
• Amendments to MFRS 101 on Classification of Liabilities as Current or Non-current state that an entity shall recognise a liability as current liability when:
(a) the liability is expected to be settled in its normal operating cycle;(b) the liability is held primarily for its purpose of trading;(c) the liability is due to be settled within twelve months after the reporting period; or(d) the liability at the end of the reporting period, does not have the right to defer settlement for at least twelve months
after the reporting period.
An entity shall classify all other liabilities as non-current.
Earlier retrospective application is permitted and should be disclosed.
• Amendments to MFRS 101 on Disclosure of Accounting Policies state that an entity shall disclose material accounting policy information which is expected to influence the decisions of the primary users of the financial statements.
Earlier application is permitted and should be disclosed.
• Amendments to MFRS 108 on Definition of Accounting Estimates redefine accounting estimates as monetary amounts in financial statements that are subject to measurement uncertainty.
Earlier application is permitted.
(iv) Effective date yet to be determined by Malaysian Accounting Standards Board
• Amendments to MFRS 10 ‘Consolidated Financial Statements’ (‘MFRS 10’) and MFRS 128 on Sale or Contribution of Assets between an Investor and its Associate or Joint Venture.
The adoption of the above applicable new standards, amendments to published standards, interpretations and improvements to existing standards are not expected to have a material impact on the financial statements of the Group and Company.
There are no other standards, amendments and improvements to published standards and interpretations to existing standards that are not effective that would be expected to have a material impact on the Group and Company.
p.190
TENAGA NASIONAL BERHAD
Notes to the Financial Statements31 December 2020
3 SUMMARY OF SIGNIFICANT ACCOUNTING POLICIES
Unless otherwise stated, the following accounting policies have been applied consistently in dealing with items that are considered material in relation to the financial statements. These policies have been consistently applied to all the years presented, unless otherwise stated.
(a) Subsidiaries and basis of consolidation
(i) Subsidiaries
Subsidiaries are all entities (including structured entities) over which the Group has control. The Group controls an entity when the Group is exposed to, or has rights to, variable returns from its involvement with the entity and has the ability to affect those returns through its power to direct the relevant activities of the entity. The existence and effect of potential voting rights are considered only when such rights are substantive when assessing control.
The amounts due from subsidiaries of which the Company does not expect repayment in the foreseeable future are considered as part of the Company’s investment in subsidiaries.
In the Company’s separate financial statements, investments in subsidiaries are stated at cost less accumulated impairment losses. On disposal of such investments, the difference between net disposal proceeds and their carrying amounts is included in the statement of profit or loss.
(ii) Basis of consolidation
The consolidated financial statements comprise the financial statements of the Company and its subsidiaries. The financial statements of the subsidiaries are prepared for the same reporting date as the Company.
Subsidiaries are consolidated from the date on which the Group obtains control, and continue to be consolidated until the date that such control ceases. In preparing the consolidated financial statements, intragroup balances, transactions and unrealised gains or losses are eliminated in full. Uniform accounting policies are adopted in the consolidated financial statements for like transactions and events in similar circumstances.
The Group applies the acquisition method to account for business combinations. The consideration transferred for acquisition of a subsidiary is the fair values of the assets transferred, the liabilities incurred and the equity interests issued by the Group. The consideration transferred includes the fair value of any asset or liability resulting from a contingent consideration arrangement and fair value of any pre-existing equity interest in the subsidiary. Acquisition-related costs are expensed as incurred. Identifiable assets acquired, liabilities and contingent liabilities assumed in a business combination are, with limited exceptions, measured initially at their fair values at the acquisition date.
In a business combination achieved in stages, the carrying value of the acquirer’s previously held equity interest in the acquiree is remeasured at its acquisition date, fair value and the resulting gain or loss is recognised in the statement of profit or loss.
The excess of the consideration transferred, the amount of any NCI in the acquiree and the acquisition-date fair value of any previous
equity interest in the acquiree over the fair value of the Group share of the identifiable net assets acquired is recorded as goodwill. If this is less than the fair value of the net assets of the subsidiary acquired in the case of a bargain purchase, the gain is recognised in the statement of profit or loss. Refer to Note 10 for accounting policy on goodwill.
NCI is the equity in a subsidiary not attributable, directly or indirectly, to a parent. On an acquisition-by-acquisition basis, the Group measures any NCI in the acquiree either at fair value or at the NCI’s proportionate share of the acquiree’s identifiable net assets. At the end of reporting period, NCI consists of amount calculated on the date of combinations and its share of changes in the subsidiary’s equity since the date of combination.
All earnings and losses of the subsidiary are attributed to the parent and the NCI, even if the attribution of losses to the NCI results in a debit balance in the shareholders’ equity.

p.191
INTEGRATED ANNUAL REPORT 2020
FINANCIAL STATEMENTS
Notes to the Financial Statements31 December 2020
3 SUMMARY OF SIGNIFICANT ACCOUNTING POLICIES (CONTINUED)
(a) Subsidiaries and basis of consolidation (continued)
(iii) Changes in ownership interest
When the Group ceases to consolidate because of a loss of control, any retained interest in the entity is remeasured to its fair value with the change in carrying amount recognised in the statement of profit or loss. This fair value becomes the initial carrying amount for the purposes of subsequently accounting for the retained interest as an associate, joint venture or financial asset. In addition, any amounts previously recognised in OCI in respect of that entity are accounted for as if the Group had directly disposed of the related assets or liabilities. This may mean that amounts previously recognised in OCI are recognised in the statement of profit or loss. Gains or losses on the disposal of subsidiaries include the carrying amount of goodwill relating to the subsidiaries sold.
(b) Transactions with NCI
Transactions with NCI that do not result in loss of control are accounted for as transactions with equity owners of the Group. A change in ownership interest results in an adjustment between the carrying amounts of the controlling and NCI to reflect their relative interests in the subsidiary. Any differences between the amount of the adjustment to NCI and any consideration paid or received are recognised in equity attributable to owners of the Group.
(c) Impairment of non-financial assets
Assets that are subject to amortisation are reviewed for impairment losses whenever events or changes in circumstances indicate that the carrying amount may not be recoverable. Impairment loss is recognised in the statement of profit or loss for the amount by which the carrying amount of the asset exceeds its recoverable amount. The recoverable amount is the higher of fair value less cost to sell and its value in use (‘VIU’). The VIU is the net present value of the projected future cash flows derived from that asset discounted at an appropriate discount rate. Projected future cash flows are based on the Group and Company’s estimates calculated based on historical, sector and industry trends, general market and economic conditions, changes in technology and other available information.
For the purpose of assessing impairment, assets are grouped at the lowest levels for which there are separately identifiable cash flows which are largely independent of the cash inflows from other assets or groups of assets (cash-generating units). Non-financial assets other than goodwill previously impaired are reviewed for possible reversal of the impairment at each reporting date. Any subsequent increase in recoverable amount is recognised in the statement of profit or loss.
(d) Research and development
Expenditure on research activities, undertaken with the prospect of gaining new scientific or technical knowledge and understanding, is recognised in the statement of profit or loss as an expense as incurred.
Expenditure on development activities, whereby the application research findings are applied to a plan or design for the production of new or substantially improved products and processes, is capitalised only when all the following criteria are fulfilled:
(i) it is technically feasible to complete the intangible asset such that it will be available for use or sale;(ii) management intends to complete the intangible asset and use or sell it;(iii) there is an ability to use or sell the intangible asset;(iv) it can be demonstrated how the intangible asset will generate probable future economic benefits;(v) adequate technical, financial and other resources to complete the development and to use or sell the intangible asset are available; and(vi) the expenditure attributable to the intangible asset during its development can be reliably measured.
Capitalised development costs are recognised as intangible assets and amortised from the point at which the asset is ready for use on a straight line method over its useful life.
The expenditure capitalised includes the cost of materials, direct labour and overheads costs that are directly attributable in preparing the assets for its intended use. Other development expenditure is recognised in the statement of profit or loss as incurred. Development costs previously recognised as an expense are not recognised as an asset in a subsequent period.
All other significant accounting policies are disclosed in their respective notes.

p.192
TENAGA NASIONAL BERHAD
Notes to the Financial Statements31 December 2020
4 CRITICAL ACCOUNTING ESTIMATES AND JUDGEMENTS
Estimates and judgements are continuously evaluated by the Directors and are based on historical experience and other factors, including expectations of future events that are believed to be reasonable under the circumstances.
The Group and Company make estimates and assumptions concerning the future. The resulting accounting estimates will, by definition, rarely equate to the related actual results. To enhance the information content of the estimates, certain key variables that are anticipated to have a material impact on the Group and Company’s results and financial position are tested for sensitivity to changes in the underlying parameters.
The estimates and assumptions that have a significant risk of causing a material adjustment to the carrying amounts of assets and liabilities are outlined below:
(a) Revenue recognition
Revenue for electricity supply activities includes an assessment of electricity supplied to customers between the date of the last meter reading and the financial year end of the Group and Company (unread and unbilled). An assessment is also made on any factors that are likely to materially affect the ultimate economic benefits which will flow to the Group and Company, including bill cancellations and adjustments. These assessments will have a corresponding adjustment to trade receivables. To the extent that the economic benefits are not expected to flow to the Group and Company, the value of that revenue is not recognised.
Included in the receivables, deposits and prepayments balance is the estimated under/over-recovery of costs under the Imbalance Cost Pass-Through (‘ICPT’) mechanism. The Group and Company continuously assess the balances by considering factors such as changes in the applicable regulatory implementation guidelines and political environment, the ability to recover costs through regulated rates and the status of any pending or potential deregulation legislation. Based on this continuous assessment, the Company believes the existing balances reflect the best estimates of the Company’s receivable/payable from the Government of Malaysia (‘Government’). This assessment reflects the current political and regulatory climate, and may be subject to change in the future.
(b) Estimated useful lives of PPE
The Group and Company regularly reviewed the estimated useful lives of PPE based on factors such as business plans and strategies, expected level of usage and future technological developments. Future results of operations could be materially affected by changes in these estimates brought about by changes in the factors mentioned above. A reduction in the estimated useful lives of PPE would increase the recorded depreciation and decrease the net book value (‘NBV’) of PPE.
(c) Impairment of PPE and right-of-use (‘ROU’) assets
The Group and Company assess impairment of assets whenever the events or changes in circumstances indicate that the carrying amount of an asset may not be recoverable, i.e., the carrying amount of the asset is more than the recoverable amount. Recoverable amount is measured at the higher of the fair value less cost to sell for that asset and its VIU.
(d) Impairment of subsidiaries and associates
The Group and Company assess impairment of its investment in subsidiaries and associates whenever the events or changes in circumstances indicate that the carrying amount may not be recoverable i.e. the carrying amount is more than the recoverable amount. Recoverable amount is measured at the higher of the fair value less cost to sell and its VIU. The assumptions used, results and sensitivity of the impairment assessments are disclosed in Note 7 and 9.
(e) Impairment of goodwill
The Group tests goodwill for impairment annually in accordance with its accounting policy and whenever events or change in circumstances indicate that this is necessary within the financial period. This requires an estimation of the VIU of the Group as the cash generating unit to which the goodwill is allocated. The assumptions used, results and sensitivity of the impairment assessment of goodwill are disclosed in Note 10 to the financial statements.

p.193
INTEGRATED ANNUAL REPORT 2020
FINANCIAL STATEMENTS
Notes to the Financial Statements31 December 2020
4 CRITICAL ACCOUNTING ESTIMATES AND JUDGEMENTS (CONTINUED)
The estimates and assumptions that have a significant risk of causing a material adjustment to the carrying amounts of assets and liabilities are outlined below: (continued)
(f) Measurement of expected credit loss (‘ECL’) allowance for financial assets
The ECL allowances for financial assets are based on assumptions about risk of default and expected loss rates. The Group and Company use judgements in making these assumptions and selecting the inputs to the impairment calculation, based on the Group and Company’s past history, existing market conditions as well as forward looking estimates at the end of each reporting period. The Group and Company reasonably could have used different estimates in current reporting period as future events often vary and therefore the estimates require adjustments.
The assumptions and estimates in assessing the ECL on trade receivables have been updated due to the adverse impact of the COVID-19 pandemic. The estimates are based on existing knowledge and best information available and applied scenarios assuming the impact of the current COVID-19 pandemic is one-off.
Details of key assumptions and inputs used are disclosed in Note 46.
(g) Lease accounting
A contract is, or contains, a lease if the contract conveys a ROU of an identified asset for a period of time in exchange for consideration. Details of key assumptions and inputs used are disclosed in Note 15.
In determining the lease term, management considers all facts and circumstances that create an economic incentive to exercise an extension option, or not exercise a termination option. Extension options (or periods after termination options) are only included in the lease term if the lease is reasonably certain to be extended (or not terminated).
The following factors are normally the most relevant:
• If there are significant penalties to terminate (or not extend), the Group and Company are typically reasonably certain to extend (or terminate)
• The Group and Company consider other factors including historical lease durations and the costs and business disruption required to replace the leased asset
The lease term is reassessed if an option is actually exercised (or not exercised) or the Group and Company become obliged to exercise (or not exercise) it. The assessment of reasonable certainty is only revised if a significant event or a significant change in circumstances occurs, which affects the assessment, and that is within the control of the lessee.
For certain contracts, there are obligations to remove the assets after the end of the contract and restore the sites to its original condition. The estimates of the restoration costs are based on quotation from the contractor for a particular asset. The ratio of this restoration costs to the construction costs of that asset is then applied to the total construction costs of the asset involved. The restoration cost is recognised as part of the ROU assets value and amortised over the useful life.
(h) Fair value of derivatives and other financial instruments
Certain financial instruments such as investments and derivative financial instruments are carried on the statement of financial position at fair value, with changes in fair value reflected in the statement of profit or loss.
Fair values are estimated by reference in part to the published price quotations and in part by using valuation techniques. The fair value of financial instruments that are not traded in an active market (for example, over-the-counter derivatives) is determined by using valuation techniques.
The Group and Company use its judgement to select a variety of methods and make assumptions that are mainly based on market conditions existing at the end of each reporting periods, as disclosed in Note 46 to the financial statements.

p.194
TENAGA NASIONAL BERHAD
Notes to the Financial Statements31 December 2020
4 CRITICAL ACCOUNTING ESTIMATES AND JUDGEMENTS (CONTINUED)
The estimates and assumptions that have a significant risk of causing a material adjustment to the carrying amounts of assets and liabilities are outlined below: (continued)
(i) Estimation of income taxes
(i) Income tax
Income tax is estimated based on the rules governed under the Income Tax Act, 1967.
Differences in determining the capital allowances, deductibility of certain expenses and subsequent utilisation of reinvestment allowance may arise during the estimation of the provision for income tax between tax calculated at the statement of financial position date, and the final submission to the tax authority as a result of obtaining further detailed information that may become available subsequent to the statement of financial position date.
Where the final tax outcome of these matters is different from the amounts that were initially recognised, such differences will impact the income tax provisions and deferred tax balance in the period in which such determination is made.
The Group and Company have recorded tax recoverable for which the Group and Company believe that there is a reasonable basis for recognition. Where the final tax outcome of this matter is different from the amount that was initially recorded, such difference may cause a material adjustment to the carrying amount of the tax recoverable balance recorded in the period in which such determination is made.
On 23 November 2015, the Inland Revenue Board (‘IRB’) had disallowed the Company’s reinvestment allowance (‘RIA’) claims
for the Years of Assessment 2013 and 2014, and had issued notices of additional assessments (‘Notices’) of RM2,068.2 million to the Company. The Company had filed an appeal to the Special Commissioners of the Income Tax (‘SCIT’) against the Notices.
On 28 November 2019, the IRB had also disallowed the Company’s RIA claims for the Years of Assessment 2015, 2016 and 2017 by issuing Notices of RM3,977.9 million to the Company. The Company had commenced judicial review application against the said Notices and the leave application was heard by the High Court on 5 October 2020. Subsequently, the Company was granted an interim stay against the payment of the disputed tax.
On 13 July 2020, the IRB had also disallowed the Company’s RIA claims for the Years of Assessment 2018 by issuing notice of additional assessment of RM1,812.5 million to the Company. The Company had commenced judicial review application against the said Notices and the leave application was heard by the High Court on 21 September 2020 and the High Court had granted leave to the Company to commence judicial review proceedings against the IRB on 30 September 2020.
On 30 December 2020, the Company and the IRB recorded a consent order in relation to the judicial review filed for the Years of Assessment 2015, 2016 and 2017. Pursuant to the consent order, the Court had granted a stay of proceedings against the enforcement of the IRB’s notices of additional assessment and leave to commence judicial review. Subsequently, the High Court fixed the hearing for the substantive stage on 15 June 2021.
On 21 January 2021, the Company and the IRB recorded a consent order in relation to the judicial review filed for the Year of Assessment 2018. Pursuant to the consent order, the High Court has granted a stay of proceedings against the enforcement of the IRB’s notice of additional assessment. The substantive hearing for the judicial review commenced for the Year of Assessment 2018 will be fixed during the case management before the High Court on 31 March 2021.
As at 31 December 2020, the Group and Company recorded a tax recoverable of RM3,522.4 million from the IRB arising from the resubmission of tax computations for the Years of Assessment 2003 to 2006 and 2008 to 2012 pursuant to the explicit approval given by the IRB on 21 January 2013 on the eligibility of the Company in claiming the RIA and the payment of RM1,757.3 million which had been made to IRB in December 2020 in respect of Years of Assessments 2016 and 2017.
In addition, the Group and Company have not recorded the potential additional tax liability arising from the tax impact if the RIA claimed is disallowed and the Company loses its appeal. The realisation of this tax recoverable and the potential tax liability is dependent on the outcome of judgement on the RIA claims by the SCIT and by the Kuala Lumpur High Court, including if there is a subsequent appeal by either party, as disclosed in Note 43 to the financial statements.
p.195
INTEGRATED ANNUAL REPORT 2020
FINANCIAL STATEMENTS
Notes to the Financial Statements31 December 2020
4 CRITICAL ACCOUNTING ESTIMATES AND JUDGEMENTS (CONTINUED)
The estimates and assumptions that have a significant risk of causing a material adjustment to the carrying amounts of assets and liabilities are outlined below: (continued)
(i) Estimation of income taxes (continued)
(i) Income tax (continued)
The Directors have performed an assessment on the tax recoverable of RM3,522.4 million and the potential tax liability based on legal view obtained from external legal counsel and the facts surrounding its RIA claims. The Directors have exercised judgement that there is sufficient evidence and case law to support the Company’s appeal against the Notices.
(ii) Deferred tax assets
Deferred tax assets are recognised to the extent that it is probable that taxable profit will be available against which the deductible temporary differences or unused tax losses can be utilised. This involves judgement regarding the future financial performance of the particular entity in which the deferred tax asset has been recognised.
(j) Post-employment employee benefits
The Group and Company provide both Retirement Benefit Plan and Post-Retirement Medical Plan for certain employees. The present value of the employee benefits obligations depends on a number of factors that are determined on an actuarial basis using certain assumptions. The key assumptions used in determining the net cost/(income) for the employee benefits include discount rate, medical claim inflation rate and salary increment rate. Any changes in these assumptions will impact the carrying amount of employee benefits obligations, as disclosed in Note 25.
• Discount rate
The Group and Company determine the appropriate discount rate at the end of each financial period. This is the interest rate that should be used to determine the present value of estimated future cash outflows expected to be required to settle the pension obligations. In determining the appropriate discount rate, the Group and Company consider the interest rates of high-quality corporate bonds that are denominated in the currency in which the benefits will be paid and that have terms to maturity approximating the terms of the related employee benefits obligation.
• Medical claim inflation rate
The medical claim inflation rate for general practitioner, hospitalisation, specialist and dialysis medical claims, as determined by the Group and Company are based on the annualised increase in average claims over the past 3 years.
• Salary increment rate
The salary increment rate for employees receiving the Retirement Benefit Plan as determined by the Group and Company is based on the average salary increment rate for the past 11 years and considerations for price inflation, real salary increase, promotions and Collective Agreement (‘CA’) negotiation.
(k) Fair value of LTIP
The Group introduced an equity-settled share-based compensation plan under which the entity receives services from employees as consideration for equity instruments of the Group.
The Group and Company measure the equity-settled share-based payments by reference to the fair value of the equity instruments at the date which they are granted, and revise the estimated number of shares that are expected to vest at the reporting period.
Estimating fair value for share-based payment transactions requires determining the most appropriate valuation model (i.e. Monte Carlo simulation model). The estimate requires determining the most appropriate inputs to the valuation model including the expected life of the share scheme, volatility and dividend yield and making assumptions about them, as disclosed in Note 35 to the financial statements.
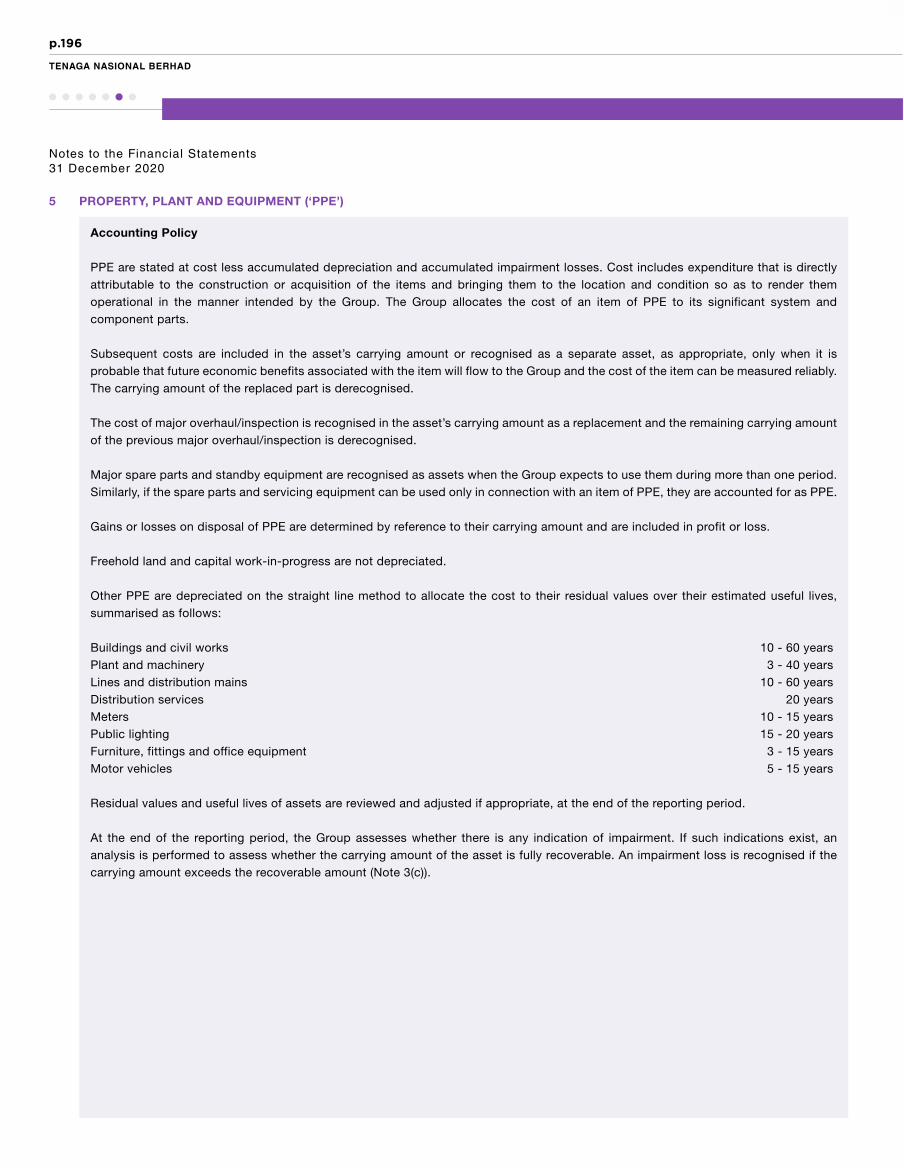
p.196
TENAGA NASIONAL BERHAD
Notes to the Financial Statements31 December 2020
5 PROPERTY, PLANT AND EQUIPMENT (‘PPE’)
Accounting Policy
PPE are stated at cost less accumulated depreciation and accumulated impairment losses. Cost includes expenditure that is directly attributable to the construction or acquisition of the items and bringing them to the location and condition so as to render them operational in the manner intended by the Group. The Group allocates the cost of an item of PPE to its significant system and component parts.
Subsequent costs are included in the asset’s carrying amount or recognised as a separate asset, as appropriate, only when it is probable that future economic benefits associated with the item will flow to the Group and the cost of the item can be measured reliably. The carrying amount of the replaced part is derecognised.
The cost of major overhaul/inspection is recognised in the asset’s carrying amount as a replacement and the remaining carrying amount of the previous major overhaul/inspection is derecognised.
Major spare parts and standby equipment are recognised as assets when the Group expects to use them during more than one period. Similarly, if the spare parts and servicing equipment can be used only in connection with an item of PPE, they are accounted for as PPE.
Gains or losses on disposal of PPE are determined by reference to their carrying amount and are included in profit or loss.
Freehold land and capital work-in-progress are not depreciated.
Other PPE are depreciated on the straight line method to allocate the cost to their residual values over their estimated useful lives, summarised as follows:
Buildings and civil works 10 - 60 yearsPlant and machinery 3 - 40 yearsLines and distribution mains 10 - 60 yearsDistribution services 20 yearsMeters 10 - 15 yearsPublic lighting 15 - 20 yearsFurniture, fittings and office equipment 3 - 15 yearsMotor vehicles 5 - 15 years
Residual values and useful lives of assets are reviewed and adjusted if appropriate, at the end of the reporting period.
At the end of the reporting period, the Group assesses whether there is any indication of impairment. If such indications exist, an analysis is performed to assess whether the carrying amount of the asset is fully recoverable. An impairment loss is recognised if the carrying amount exceeds the recoverable amount (Note 3(c)).

p.197
INTEGRATED ANNUAL REPORT 2020
FINANCIAL STATEMENTS
Notes to the Financial Statements31 December 2020
5 PROPERTY, PLANT AND EQUIPMENT (‘PPE’) (CONTINUED)
As at1.1.2020
RM’million
Exchangerate
adjustmentsRM’million
Acquisitionof
subsidiaryRM’million
Assetclassified asheld for sale
RM’millionAdditions
RM’millionDisposals
RM’million
Transfers/Adjustments/
Reclassi-fication/
Write offsRM’million
As at31.12.2020RM’million
2020
Group
Cost
Freehold land 2,509.3 0 0 (1.3) 336.1 (0.5) 0 2,843.6
Buildings and civil works 24,309.5 (0.1) 0 (2.1) 7.9 (173.9) (65.6) 24,075.7
26,818.8 (0.1) 0 (3.4) 344.0 (174.4) (65.6) 26,919.3
Plant and machinery 83,494.7 (32.2) 2,540.5 (504.6) 129.4 (114.6) 3,270.9 88,784.1
Lines and distribution mains 49,192.0 0 0 0 31.8 (18.4) 3,041.8 52,247.2
Distribution services 4,856.4 0 0 0 9.1 0 233.8 5,099.3
Meters 3,270.0 0 0 0 2.9 (20.8) 352.0 3,604.1
Public lighting 1,164.8 0 0 0 0 0.4 511.4 1,676.6
Furniture, fittings and office equipment 3,029.4 (0.4) 0 (6.0) 484.1 (85.7) 6.1 3,427.5
Motor vehicles 728.0 (0.1) 0 (1.2) 57.8 (13.7) 16.2 787.0
172,554.1 (32.8) 2,540.5 (515.2) 1,059.1 (427.2) 7,366.6 182,545.1
Capital work-in-progress 15,863.1 0 0 (28.5) 6,084.6 (139.3) (6,907.9) 14,872.0
188,417.2 (32.8) 2,540.5* (543.7)# 7,143.7 (566.5) 458.7 197,417.1
As at1.1.2020
RM’million
Exchangerate
adjustmentsRM’million
Assetclassified asheld for sale
RM’million
Chargedfor the
financial yearRM’million
Released ondisposals/Transfers/Write offs
RM’million
As at31.12.2020RM’million
2020
Group
Accumulated depreciation
Buildings and civil works 7,509.7 0 (2.0) 627.4 22.6 8,157.7
Plant and machinery 36,309.6 2.3 11.8 3,773.8 (142.6) 39,954.9
Lines and distribution mains 25,816.8 0 0 1,781.0 (14.5) 27,583.3
Distribution services 3,021.7 0 0 186.1 0 3,207.8
Meters 2,093.4 0 0 172.4 (16.2) 2,249.6
Public lighting 465.8 0 0 93.2 0.4 559.4
Furniture, fittings and office equipment 2,279.6 0 (5.2) 326.3 (82.7) 2,518.0
Motor vehicles 569.0 0 (1.2) 37.1 (14.6) 590.3
78,065.6 2.3 3.4# 6,997.3 (247.6) 84,821.0
Accumulated impairment losses
Plant and machinery 385.6 0 (385.6)# 0 0 0

p.198
TENAGA NASIONAL BERHAD
Notes to the Financial Statements31 December 2020
5 PROPERTY, PLANT AND EQUIPMENT (‘PPE’) (CONTINUED)
As at1.1.2019
RM’million
Exchangerate
adjustmentsRM’million
AdditionsRM’million
DisposalsRM’million
Transfers/Adjustments/
Reclassi-fication/
Write offsRM’million
As at31.12.2019RM’million
2019
Group
Cost
Freehold land 1,883.0 (0.2) 630.2 (29.1) 25.4 2,509.3
Buildings and civil works 22,068.2 (0.3) 20.4 (145.3) 2,366.5 24,309.5
23,951.2 (0.5) 650.6 (174.4) 2,391.9 26,818.8
Plant and machinery 72,074.6 9.3 253.4 (1,123.6) 12,281.0 83,494.7
Lines and distribution mains 46,513.8 0 252.2 (83.5) 2,509.5 49,192.0
Distribution services 4,630.7 0 12.8 0 212.9 4,856.4
Meters 2,979.5 0 4.1 (8.1) 294.5 3,270.0
Public lighting 903.6 0 0 (0.4) 261.6 1,164.8
Furniture, fittings and office equipment 2,601.7 (0.9) 423.6 (8.3) 13.3 3,029.4
Motor vehicles 654.8 (0.2) 90.2 (15.9) (0.9) 728.0
154,309.9 7.7 1,686.9 (1,414.2) 17,963.8 172,554.1
Capital work-in-progress 23,324.1 0 9,486.0 (0.3) (16,946.7) 15,863.1
177,634.0 7.7 11,172.9 (1,414.5) 1,017.1 188,417.2
As at1.1.2019
RM’million
Exchangerate
adjustmentsRM’million
Chargedfor the
financial yearRM’million
Released ondisposals/Transfers/Write offs
RM’million
As at31.12.2019RM’million
2019
Group
Accumulated depreciation
Buildings and civil works 6,966.1 0 635.0 (91.4) 7,509.7
Plant and machinery 33,882.9 (0.1) 3,351.2 (924.4) 36,309.6
Lines and distribution mains 24,156.3 0 1,726.8 (66.3) 25,816.8
Distribution services 2,840.0 0 181.7 0 3,021.7
Meters 1,934.6 0 164.4 (5.6) 2,093.4
Public lighting 402.7 0 63.5 (0.4) 465.8
Furniture, fittings and office equipment 2,027.1 0 260.2 (7.7) 2,279.6
Motor vehicles 545.9 0 38.9 (15.8) 569.0
72,755.6 (0.1) 6,421.7 (1,111.6) 78,065.6
Accumulated impairment losses
Plant and machinery 385.6 0 0 0 385.6#

p.199
INTEGRATED ANNUAL REPORT 2020
FINANCIAL STATEMENTS
Notes to the Financial Statements31 December 2020
5 PROPERTY, PLANT AND EQUIPMENT (‘PPE’) (CONTINUED)
As at1.1.2020
RM’millionAdditions
RM’millionDisposals
RM’million
Transfers/Adjustments/
Reclassi-fication/
Write offsRM’million
As at31.12.2020RM’million
2020
Company
Cost
Freehold land 2,512.1 317.8 (0.5) (270.9) 2,558.5
Buildings and civil works 18,156.7 0 (173.4) (2,725.3) 15,258.0
20,668.8 317.8 (173.9) (2,996.2) 17,816.5
Plant and machinery 45,156.6 0 (92.8) (1,574.1) 43,489.7
Lines and distribution mains 46,373.2 0 (18.3) 3,034.4 49,389.3
Distribution services 4,528.6 0 0 233.8 4,762.4
Meters 3,158.3 0 (20.6) 357.4 3,495.1
Public lighting 1,164.7 0 0.4 510.4 1,675.5
Furniture, fittings and office equipment 2,632.9 457.4 (84.7) (102.5) 2,903.1
Motor vehicles 588.6 43.2 (12.3) (6.2) 613.3
124,271.7 818.4 (402.2) (543.0) 124,144.9
Capital work-in-progress 9,967.6 5,331.0 (54.8) (7,347.6) 7,896.2
134,239.3 6,149.4 (457.0) (7,890.6)^ 132,041.1
As at 1.1.2020
RM’million
Charged for the
financial yearRM’million
Released ondisposals/Transfers/Write offs
RM’million
As at31.12.2020RM’million
2020
Company
Accumulated depreciation
Buildings and civil works 6,005.5 420.7 (1,630.1) 4,796.1
Plant and machinery 24,380.2 1,913.8 (3,271.6) 23,022.4
Lines and distribution mains 24,771.8 1,674.4 (14.5) 26,431.7
Distribution services 2,824.4 169.7 0 2,994.1
Meters 2,018.1 170.5 (16.2) 2,172.4
Public lighting 465.8 93.2 (0.4) 558.6
Furniture, fittings and office equipment 1,967.5 290.4 (171.8) 2,086.1
Motor vehicles 460.3 25.8 (35.1) 451.0
62,893.6 4,758.5 (5,139.7)^ 62,512.4

p.200
TENAGA NASIONAL BERHAD
Notes to the Financial Statements31 December 2020
5 PROPERTY, PLANT AND EQUIPMENT (‘PPE’) (CONTINUED)
As at1.1.2019
RM’millionAdditions
RM’millionDisposals
RM’million
Transfers/Adjustments/
Reclassi-fication/
Write offsRM’million
As at31.12.2019RM’million
2019
Company
Cost
Freehold land 1,885.6 630.2 (29.1) 25.4 2,512.1
Buildings and civil works 17,273.1 0 (145.2) 1,028.8 18,156.7
19,158.7 630.2 (174.3) 1,054.2 20,668.8
Plant and machinery 44,114.4 0 (1,046.9) 2,089.1 45,156.6
Lines and distribution mains 44,234.0 0 (83.3) 2,222.5 46,373.2
Distribution services 4,315.8 0 0 212.8 4,528.6
Meters 2,871.9 0 (8.0) 294.4 3,158.3
Public lighting 903.5 0 (0.4) 261.6 1,164.7
Furniture, fittings and office equipment 2,247.8 384.0 (3.5) 4.6 2,632.9
Motor vehicles 526.4 79.0 (15.7) (1.1) 588.6
118,372.5 1,093.2 (1,332.1) 6,138.1 124,271.7
Capital work-in-progress 9,198.4 6,793.3 (0.3) (6,023.8) 9,967.6
127,570.9 7,886.5 (1,332.4) 114.3 134,239.3
As at 1.1.2019
RM’million
Charged for the
financial yearRM’million
Released ondisposals/Transfers/Write offs
RM’million
As at31.12.2019RM’million
2019
Company
Accumulated depreciation
Buildings and civil works 5,709.1 452.9 (156.5) 6,005.5
Plant and machinery 23,507.9 1,885.5 (1,013.2) 24,380.2
Lines and distribution mains 23,210.0 1,628.1 (66.3) 24,771.8
Distribution services 2,658.6 165.8 0 2,824.4
Meters 1,866.3 157.4 (5.6) 2,018.1
Public lighting 402.7 63.5 (0.4) 465.8
Furniture, fittings and office equipment 1,739.9 231.3 (3.7) 1,967.5
Motor vehicles 449.8 26.5 (16.0) 460.3
59,544.3 4,611.0 (1,261.7) 62,893.6
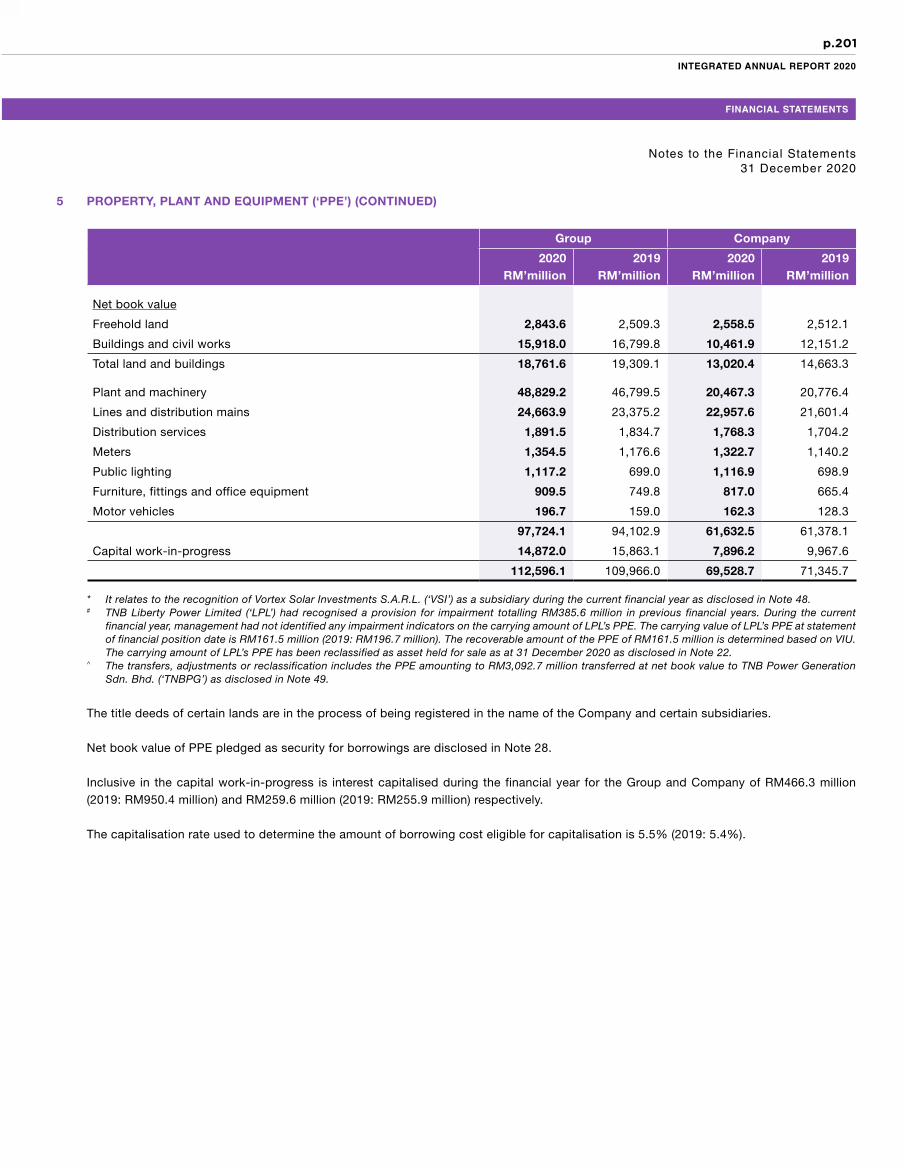
p.201
INTEGRATED ANNUAL REPORT 2020
FINANCIAL STATEMENTS
Notes to the Financial Statements31 December 2020
5 PROPERTY, PLANT AND EQUIPMENT (‘PPE’) (CONTINUED)
Group Company
2020RM’million
2019RM’million
2020RM’million
2019RM’million
Net book value
Freehold land 2,843.6 2,509.3 2,558.5 2,512.1
Buildings and civil works 15,918.0 16,799.8 10,461.9 12,151.2
Total land and buildings 18,761.6 19,309.1 13,020.4 14,663.3
Plant and machinery 48,829.2 46,799.5 20,467.3 20,776.4
Lines and distribution mains 24,663.9 23,375.2 22,957.6 21,601.4
Distribution services 1,891.5 1,834.7 1,768.3 1,704.2
Meters 1,354.5 1,176.6 1,322.7 1,140.2
Public lighting 1,117.2 699.0 1,116.9 698.9
Furniture, fittings and office equipment 909.5 749.8 817.0 665.4
Motor vehicles 196.7 159.0 162.3 128.3
97,724.1 94,102.9 61,632.5 61,378.1
Capital work-in-progress 14,872.0 15,863.1 7,896.2 9,967.6
112,596.1 109,966.0 69,528.7 71,345.7
* It relates to the recognition of Vortex Solar Investments S.A.R.L. (‘VSI’) as a subsidiary during the current financial year as disclosed in Note 48.# TNB Liberty Power Limited (‘LPL’) had recognised a provision for impairment totalling RM385.6 million in previous financial years. During the current
financial year, management had not identified any impairment indicators on the carrying amount of LPL’s PPE. The carrying value of LPL’s PPE at statement of financial position date is RM161.5 million (2019: RM196.7 million). The recoverable amount of the PPE of RM161.5 million is determined based on VIU. The carrying amount of LPL’s PPE has been reclassified as asset held for sale as at 31 December 2020 as disclosed in Note 22.
^ The transfers, adjustments or reclassification includes the PPE amounting to RM3,092.7 million transferred at net book value to TNB Power Generation Sdn. Bhd. (‘TNBPG’) as disclosed in Note 49.
The title deeds of certain lands are in the process of being registered in the name of the Company and certain subsidiaries.
Net book value of PPE pledged as security for borrowings are disclosed in Note 28.
Inclusive in the capital work-in-progress is interest capitalised during the financial year for the Group and Company of RM466.3 million (2019: RM950.4 million) and RM259.6 million (2019: RM255.9 million) respectively.
The capitalisation rate used to determine the amount of borrowing cost eligible for capitalisation is 5.5% (2019: 5.4%).

p.202
TENAGA NASIONAL BERHAD
Notes to the Financial Statements31 December 2020
6 RIGHT-OF-USE (‘ROU’) ASSETS
Accounting Policy
A lease is a contract, or part of a contract, whereby the lessor conveys to the lessee the right to control the use of an identified asset for a period of time in exchange for consideration.
To assess whether a contract conveys the right to control the use of an identified asset, the Group and Company assess whether:
• The contract involves the use of an identified asset – this may be specified explicitly or implicitly, and should be physically distinct or represent substantially all of the capacity of a physically distinct asset. If the supplier (‘lessor’) has a substantive substitution right, then the asset is not identified;
• The customer (‘lessee’) has the right to obtain substantially all of the economic benefits from use of the asset throughout the period of use; and
• The customer (‘lessee’) has the right to direct the use of the asset. In rare cases where the decision about how and for what purpose the asset is used is predetermined, the customer (‘lessee’) has the right to direct the use of the asset if either the customer (‘lessee’) has the right to operate the asset; or the customer designed the asset in a way that predetermines how and for what purpose it will be used.
(a) The Group and Company as lessees
(i) Initial recognition
The Group and Company recognise a ROU asset and a lease liability for all leases conveying the right to control the use of an identified asset for a period of time.
The ROU assets recognised by the Group and Company are initially recorded at cost, which comprise the following:
• The amount of the initial measurement of the lease liability;• Any lease payments made on or before the commencement date of the lease, less any lease incentives received;• Any initial direct costs incurred by the Group and Company; and• An estimate of costs to be incurred by the Group and Company in dismantling and removing the underlying asset,
restoring the site on which it is located or restoring the underlying asset to the condition required by the lessor.
The Group and Company lease various buildings, plant and machinery, furniture and fittings, office equipment and motor vehicles. These leases have tenures between 1 and 25 years. Lease terms are generally negotiated on an individual basis. As for leasehold land, the remaining period of the respective leases ranges from 4 to 99 years.
The lease liability is initially measured at the present value of the lease payments that are not paid at that date. The lease payments are discounted using the Group’s incremental borrowing rate.
Assets and liabilities arising from a lease are initially measured on a present value basis. Lease liabilities include the net present value of the following lease payments:
• Fixed payments (including in-substance fixed payments), less any lease incentives receivable;• Variable lease payments that are based on an index or a rate;• Amounts expected to be payable by the lessee under residual value guarantees;• The exercise price of a purchase option if the lessee is reasonably certain to exercise that option; and• Payments of penalties for terminating the lease, if the lease term reflects the lessee exercising that option.
The Group and Company have elected to recognise ROU assets and lease liabilities for short-term leases that have a lease term of 12 months or less. The Group and Company have elected not to recognise ROU assets and lease liabilities for leases of low-value assets.

p.203
INTEGRATED ANNUAL REPORT 2020
FINANCIAL STATEMENTS
Notes to the Financial Statements31 December 2020
6 RIGHT-OF-USE (‘ROU’) ASSETS (CONTINUED)
Accounting Policy (continued)
(a) The Group and Company as lessees (continued)
(ii) Subsequent measurement
After initial recognition, the Group and Company measure ROU assets at cost:
• Less any accumulated depreciation;• Less any accumulated impairment losses; and• Adjusted for any remeasurement of the lease liabilities.
A ROU asset and its corresponding lease liability are recognised at the date the leased asset is available for use by the Group and Company. Each lease payment is allocated between the principal and finance cost. The finance cost is charged to profit or loss over the lease period so as to produce a constant periodic rate of interest on the remaining balance of the liability for each period.
The ROU asset is depreciated over the shorter of the asset’s useful life and the lease term on a straight-line basis. The Group and Company recognise the lease payments associated with these leases as an expense on a straight-line basis over the lease terms.
The Group and Company measure the lease liability by increasing the carrying amount to reflect interest on the lease liability, reducing the carrying amount to reflect lease payments made, and remeasuring the carrying amount to reflect any reassessment or lease modifications.
(iii) Extension and termination options
Extension and termination options are included in a number of property and equipment leases across the Group. In determining the lease term, management considers all facts and circumstances that create an economic incentive to exercise an extension option, or not exercise a termination option. Extension options (or periods after termination options) are only included in the lease term if the lease is reasonably certain to be extended (or not terminated).
The assessment of reasonable certainty is reviewed if a significant event or a significant change in circumstances occurs which affects this assessment and that is within the control of the lessee.
(b) The Group and Company as lessors
The accounting policy for lessors are disclosed in Note 15. At the end of the reporting period, the Group assesses whether there is any indication of impairment. If such indications exist, an analysis is performed to assess whether the carrying amount of the asset is fully recoverable. An impairment loss is recognised if the carrying amount exceeds the recoverable amount (Note 3(c)).
If an arrangement contains lease and non-lease components, the Group and Company apply MFRS 15 to allocate the consideration in the contract based on the stand-alone selling prices.

p.204
TENAGA NASIONAL BERHAD
Notes to the Financial Statements31 December 2020
6 RIGHT-OF-USE (‘ROU’) ASSETS (CONTINUED)
As at1.1.2020
RM’million
Exchange rate
adjustmentsRM’million
Acquisitionof
subsidiaryRM’million
ROUclassified
as heldfor sale
RM’millionAdditions
RM’million
Transfers/Adjustments/
Reclassi-fication
RM’million
As at31.12.2020RM’million
2020
Group
Cost
Long leasehold land 2,389.4 (0.7) 175.0 (0.1) 18.8 (40.8) 2,541.6
Short leasehold land 24.7 0 0 0 0 0 24.7
Buildings 107.1 0 0 (1.7) 22.1 1.9 129.4
2,521.2 (0.7) 175.0 (1.8) 40.9 (38.9) 2,695.7
Plant and machinery 42,846.5 0 0 0 100.0 (10.8) 42,935.7
Furniture, fittings and office equipment 41.4 0 0 0 0.4 0.3 42.1
Motor vehicles 1.1 0 0 0 0.3 0 1.4
45,410.2 (0.7) 175.0* (1.8)# 141.6 (49.4) 45,674.9
As at1.1.2020
RM’million
Exchangerate
adjustmentsRM’million
ROUclassified
as heldfor sale
RM’million
Charged for the
financial yearRM’million
Transfers/Adjustments/
Reclassi-fication
RM’million
As at31.12.2020RM’million
2020
Group
Accumulated depreciation
Long leasehold land 493.0 0.1 0 32.7 0.3 526.1
Short leasehold land 14.0 0 0 0.7 0 14.7
Buildings 43.1 0 (0.1) 38.1 0.4 81.5
550.1 0.1 (0.1) 71.5 0.7 622.3
Plant and machinery 6,579.7 0 0 3,537.9 (3.5) 10,114.1
Furniture, fittings and office equipment 15.8 0 0 15.1 0.1 31.0
Motor vehicles 0.6 0 0 0.6 0 1.2
7,146.2 0.1 (0.1)# 3,625.1 (2.7) 10,768.6

p.205
INTEGRATED ANNUAL REPORT 2020
FINANCIAL STATEMENTS
Notes to the Financial Statements31 December 2020
6 RIGHT-OF-USE (‘ROU’) ASSETS (CONTINUED)
As at1.1.2019
RM’millionAdditions
RM’million
Transfers/Adjustments/
Reclassi-fication
RM’million
As at31.12.2019RM’million
2019
Group
Cost
Long leasehold land 2,213.5 23.6 152.3 2,389.4
Short leasehold land 189.7 0 (165.0) 24.7
Buildings 103.0 4.1 0 107.1
2,506.2 27.7 (12.7) 2,521.2
Plant and machinery 42,835.4 0 11.1 42,846.5
Furniture, fittings and office equipment 41.4 0.1 (0.1) 41.4
Motor vehicles 1.0 0.1 0 1.1
45,384.0 27.9 (1.7) 45,410.2
As at1.1.2019
RM’million
Chargedfor the
financial yearRM’million
Transfers/Adjustments/
Reclassi-fication
RM’million
As at31.12.2019RM’million
2019
Group
Accumulated depreciation
Long leasehold land 348.9 35.8 108.3 493.0
Short leasehold land 124.2 0.3 (110.5) 14.0
Buildings 0 43.1 0 43.1
473.1 79.2 (2.2) 550.1
Plant and machinery 2,905.6 3,671.6 2.5 6,579.7
Furniture, fittings and office equipment 0 15.8 0 15.8
Motor vehicles 0 0.6 0 0.6
3,378.7 3,767.2 0.3 7,146.2

p.206
TENAGA NASIONAL BERHAD
Notes to the Financial Statements31 December 2020
6 RIGHT-OF-USE (‘ROU’) ASSETS (CONTINUED)
As at1.1.2020
RM’millionAdditions
RM’million
Transfers/Adjustments/
Reclassi-fication
RM’million
As at31.12.2020RM’million
2020
Company
Cost
Long leasehold land 1,452.5 17.1 (233.4) 1,236.2
Short leasehold land 4.5 0 0 4.5
Buildings 91.1 17.3 0 108.4
1,548.1 34.4 (233.4) 1,349.1
Plant and machinery 84,900.7 1,871.5 0 86,772.2
Furniture, fittings and office equipment 37.4 0.3 0 37.7
Motor vehicles 0.4 0.3 (0.2) 0.5
86,486.6 1,906.5 (233.6)^ 88,159.5
As at1.1.2020
RM’million
Chargedfor the
financial yearRM’million
Transfers/ Adjustments/
Reclassi-fication
RM’million
As at31.12.2020RM’million
2020
Company
Accumulated depreciation
Long leasehold land 359.9 19.9 (69.2) 310.6
Short leasehold land 2.9 0.1 0 3.0
Buildings 36.1 32.1 0 68.2
398.9 52.1 (69.2) 381.8
Plant and machinery 15,267.1 5,399.5 0 20,666.6
Furniture, fittings and office equipment 14.0 13.7 0 27.7
Motor vehicles 0.3 0.2 0 0.5
15,680.3 5,465.5 (69.2)^ 21,076.6

p.207
INTEGRATED ANNUAL REPORT 2020
FINANCIAL STATEMENTS
Notes to the Financial Statements31 December 2020
6 RIGHT-OF-USE (‘ROU’) ASSETS (CONTINUED)
As at1.1.2019
RM’millionAdditions
RM’million
Transfers/Adjustments/
Reclassi-fication
RM’million
As at31.12.2019RM’million
2019
Company
Cost
Long leasehold land 1,458.1 1.3 (6.9) 1,452.5
Short leasehold land 4.5 0 0 4.5
Buildings 89.9 1.2 0 91.1
1,552.5 2.5 (6.9) 1,548.1
Plant and machinery 71,369.5 13,531.2 0 84,900.7
Furniture, fittings and office equipment 37.4 0 0 37.4
Motor vehicles 0.4 0 0 0.4
72,959.8 13,533.7 (6.9) 86,486.6
As at 1.1.2019
RM’million
Charged for the
financial yearRM’million
As at31.12.2019RM’million
2019
Company
Accumulated depreciation
Long leasehold land 340.2 19.7 359.9
Short leasehold land 2.7 0.2 2.9
Buildings 0 36.1 36.1
342.9 56.0 398.9
Plant and machinery 10,243.8 5,023.3 15,267.1
Furniture, fittings and office equipment 0 14.0 14.0
Motor vehicles 0 0.3 0.3
10,586.7 5,093.6 15,680.3
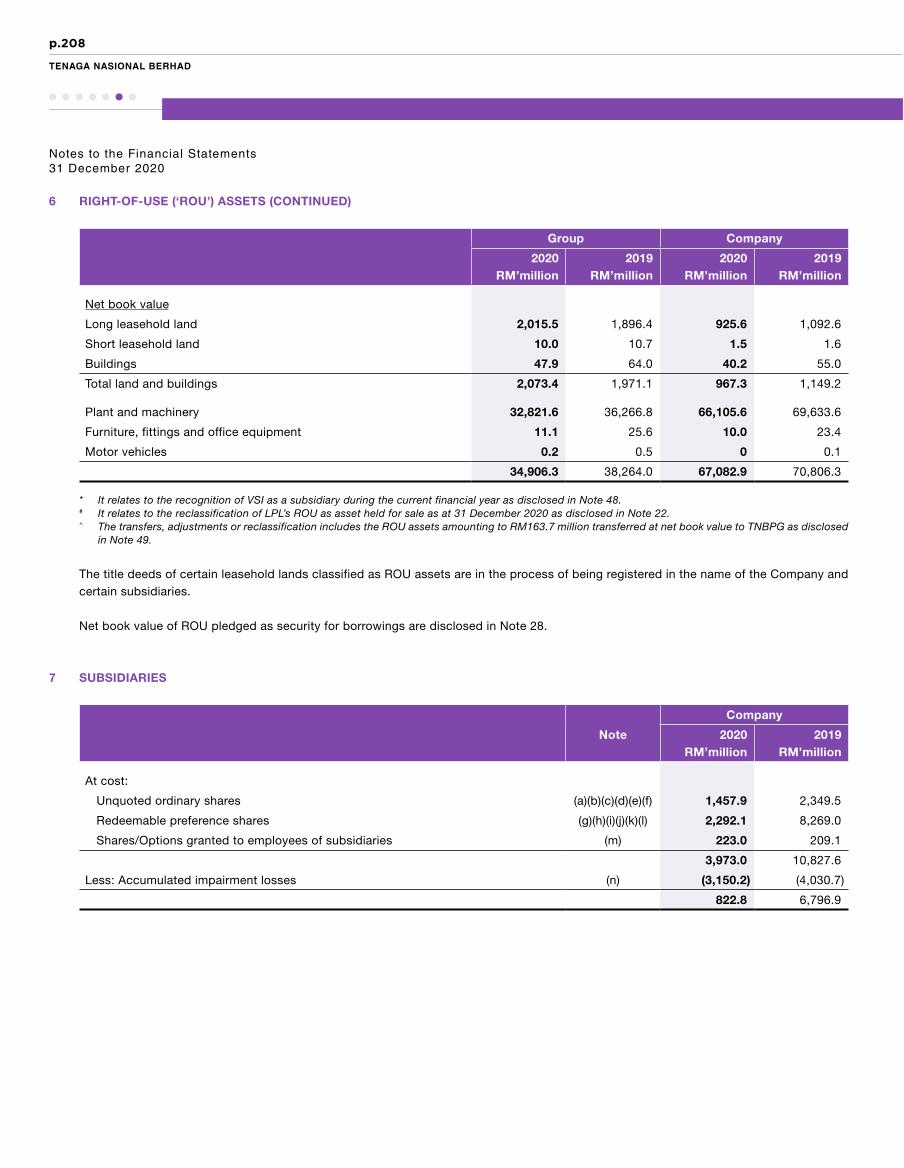
p.208
TENAGA NASIONAL BERHAD
Notes to the Financial Statements31 December 2020
6 RIGHT-OF-USE (‘ROU’) ASSETS (CONTINUED)
Group Company
2020RM’million
2019RM’million
2020RM’million
2019RM’million
Net book value
Long leasehold land 2,015.5 1,896.4 925.6 1,092.6
Short leasehold land 10.0 10.7 1.5 1.6
Buildings 47.9 64.0 40.2 55.0
Total land and buildings 2,073.4 1,971.1 967.3 1,149.2
Plant and machinery 32,821.6 36,266.8 66,105.6 69,633.6
Furniture, fittings and office equipment 11.1 25.6 10.0 23.4
Motor vehicles 0.2 0.5 0 0.1
34,906.3 38,264.0 67,082.9 70,806.3
* It relates to the recognition of VSI as a subsidiary during the current financial year as disclosed in Note 48.# It relates to the reclassification of LPL’s ROU as asset held for sale as at 31 December 2020 as disclosed in Note 22.^ The transfers, adjustments or reclassification includes the ROU assets amounting to RM163.7 million transferred at net book value to TNBPG as disclosed
in Note 49.
The title deeds of certain leasehold lands classified as ROU assets are in the process of being registered in the name of the Company and certain subsidiaries.
Net book value of ROU pledged as security for borrowings are disclosed in Note 28.
7 SUBSIDIARIES
Company
Note 2020RM’million
2019RM’million
At cost:
Unquoted ordinary shares (a)(b)(c)(d)(e)(f) 1,457.9 2,349.5
Redeemable preference shares (g)(h)(i)(j)(k)(l) 2,292.1 8,269.0
Shares/Options granted to employees of subsidiaries (m) 223.0 209.1
3,973.0 10,827.6
Less: Accumulated impairment losses (n) (3,150.2) (4,030.7)
822.8 6,796.9
p.209
INTEGRATED ANNUAL REPORT 2020
FINANCIAL STATEMENTS
Notes to the Financial Statements31 December 2020
7 SUBSIDIARIES (CONTINUED)
Movement in investments in subsidiaries:
(a) On 23 April 2020, the Company subscribed to 2 new ordinary shares in REV Property Holdings Sdn. Bhd. (‘REVPH’), a wholly-owned subsidiary of the Company, for RM2.
On 21 December 2020, the Company subscribed to additional 2 new ordinary shares in REVPH, for RM2.
(b) On 21 September 2020, the Company subscribed to additional 99,998 new ordinary shares in TNBPG, for RM99,998.
(c) On 28 September 2020, the Company acquired additional 1,900,000 new ordinary shares of Southern Power Generation Sdn. Bhd. (‘SPG’) from a NCI, for cash amounting to RM1.9 million, which had increased the Company’s shareholding in SPG from 51.0% to 70.0% (Note 48).
(d) Upon completion of the approved internal reorganisation, the Company’s ordinary shares held in domestic power generation subsidiaries amounting to RM1,014.2 million had been transferred to TNBPG on 1 October 2020.
(e) On 21 October 2020, the Company subscribed to additional 99,998 new ordinary shares in TNB Retail Sdn. Bhd., for RM99,998.
(f) On 31 December 2020, the Company subscribed to additional 30,000,000 new ordinary shares issued by TNB Power Daharki Ltd.(‘TPD’) by conversion of amounts due from TPD amounting to RM120.5 million.
(g) On 27 April 2020, TNB Pasir Gudang Energy Sdn. Bhd. redeemed 1,100,000 units of Redeemable Preference Shares (‘RPS’) from the Company for RM48.4 million.
(h) On 13 August 2020, Power and Energy International (Mauritius) Ltd. (‘PEIM’) redeemed 25,000 units of RPS from the Company for RM50.9 million (USD12.2 million).
(i) On 28 September 2020, TNB Janamanjung Sdn. Bhd. redeemed 1,597,223 units of RPS from the Company for RM230.0 million.
(j) On 28 September 2020, the Company subscribed to 599,374,717 new RPS issued by SPG for cash amounting to RM599.4 million. The Company also acquired additional 36,790,000 RPS for total consideration of RM281.1 million.
(k) Upon completion of the approved internal reorganisation, the Company’s RPS held in domestic power generation subsidiaries amounting to RM6,823.5 million had been transferred to TNBPG on 1 October 2020.
(l) On 21 December 2020, the Company subscribed to 181,999,998 new RPS issued by REVPH, a wholly-owned subsidiary of the Company for RM182.0 million.
(m) Upon completion of the approved internal reorganisation, the Company’s shares/options granted to employees of domestic power generation subsidiaries amounting to RM65.0 million had been transferred to TNBPG on 1 October 2020.

p.210
TENAGA NASIONAL BERHAD
Notes to the Financial Statements31 December 2020
7 SUBSIDIARIES (CONTINUED)
Movement in investments in subsidiaries: (continued)
(n) Movement in accumulated impairment losses for investments in subsidiaries:
(i) Impairment assessments for TNB Prai Sdn. Bhd. (‘PRAI’) and TNB Connaught Bridge Sdn. Bhd. (‘TNBCB’)
During financial year 2019, the Company had undertaken the impairment assessments of its investments in PRAI and TNBCB. The assessments were triggered as the power plants in PRAI and TNBCB continued to unable to reach the level of efficiency as stated in the PPA and expected to generate lower profits due to their contractual obligation to deliver energy at the set tariff.
Based on the impairment assessments, the carrying amount of the Company’s investments in PRAI and TNBCB as at 31 December 2019 exceeded its recoverable amount by RM987.1 million and RM178.4 million respectively, hence impairment losses were recognised. Following the transfer of the domestic generation business to TNBPG on 1 October 2020 as disclosed in Note 49, the Company had transferred its ownership and investments in certain subsidiaries including PRAI and TNBCB to TNBPG at net carrying amounts which were inclusive of the accumulated impairment losses amounting to RM1,165.5 million stated above.
(ii) Impairment assessment for TNB Power Daharki Ltd. (‘TPD’)
The investment in TPD which was by conversion of amount due from TPD amounting to RM120.5 million had been fully impaired by the Company during previous financial year.
(iii) Impairment assessment for Power and Energy International (Mauritius) Ltd. (‘PEIM’)
During the financial year, the Company had undertaken the impairment assessment of its investment in PEIM, an investment holding company. The assessment was triggered by the changes in economic outlook due to COVID-19 experienced by PEIM’s associate, GMR Energy Limited (‘GEL’), which led to an impairment loss recognised at the Group level (Note 9(b)). Based on the impairment assessment, the carrying amount of the Company’s investment in PEIM as at 31 December 2020 exceeded its recoverable amount, hence additional impairment loss of RM149.0 million (2019: RM189.7 million) was recognised in the current financial year.
Key assumptions used
The recoverable amount was determined based on VIU calculations, which applied a discounted cash flow model of PEIM for the period of the remaining useful lives of the respective power plants of GEL Group ranging between 15 to 40 years. The cash flows used in the calculations are the most recent forecasts and projections approved by the management of PEIM.

p.211
INTEGRATED ANNUAL REPORT 2020
FINANCIAL STATEMENTS
Notes to the Financial Statements31 December 2020
7 SUBSIDIARIES (CONTINUED)
Movement in investments in subsidiaries: (continued)
(n) Movement in accumulated impairment losses for investments in subsidiaries: (continued)
(iii) Impairment assessment for Power and Energy International (Mauritius) Ltd. (‘PEIM’) (continued)
The key assumptions used in determining the VIU were:
2020%
2019%
Average Plant Availability Factor 53.7 51.2
Average Plant Load Factor 50.0 – 85.0 50.0 – 85.0
Cost of equity 11.2 – 14.7 11.2 – 15.5
The cash flows were discounted using cost of equity based on the risk specific to the investments. The key assumptions take into account the macroeconomic environment in India.
The Company’s review includes impact assessment of changes in key assumptions. The effects of the movement in the key assumptions to the recoverable amount are as follows:
Changes inassumptions
%
Impact onrecoverable amount
IncreaseRM’million
DecreaseRM’million
2020
Plant Availability Factor 5.0 8.8 (8.9)
Plant Load Factor 10.0 154.0 (134.1)
Discount rate 1.0 (48.2) 55.9
2019
Plant Availability Factor 5.0 11.9 (12.1)
Plant Load Factor 10.0 116.1 (121.5)
Discount rate 1.0 (36.0) 41.3

p.212
TENAGA NASIONAL BERHAD
Notes to the Financial Statements31 December 2020
7 SUBSIDIARIES (CONTINUED)
The details of the subsidiaries are as follows:
Name of subsidiary
Group’seffective interest
Principal activitiesCountry ofincorporation2020 2019
Allo Technology Sdn. Bhd. 100% 100% Information technology related services Malaysia
Aruna Servicios Integrales S.L.U.* 100% 100% Investment holding Spain
Malaysia Transformer Manufacturing Sdn. Bhd.
100% 100% Principally engaged in the business of manufacturing, selling and repairing distribution, power and earthing transformers
Malaysia
Orion Mission Sdn. Bhd.* (In members’ voluntary winding up)
100% 100% Investment holding Malaysia
Power and Energy International (Mauritius) Ltd. (‘PEIM’)*
100% 100% Investment holding Mauritius
REV Property Holdings Sdn. Bhd. 100% - Investment holding company, property asset management and property facility management
Malaysia
Sabah Electricity Sdn. Bhd. (‘SESB’) 83% 83% Business of generation, transmission, distribution and sale of electricity and services in Sabah and the Federal Territory of Labuan
Malaysia
Sepang Power Sdn. Bhd. 70% 70% Dormant Malaysia
Tenaga Switchgear Sdn. Bhd. 60% 60% Principally engaged in the business of assembling and manufacturing of high voltage switchgears and contracting of turnkey transmission substations
Malaysia
TNB Capital (L) Ltd. 100% 100% Investment holding company Malaysia
TNB Distribution Sdn. Bhd. 100% 100% Dormant Malaysia
TNB Energy Services Sdn. Bhd. 100% 100% Generating, distributing, supplying, dealing, selling of different kinds of energy sources and related technical services
Malaysia
TNB Engineering Corporation Sdn. Bhd.
100% 100% Principally engaged as turnkey contractors, energy project development specialising in district cooling system and co-generation including operation and maintenance works
Malaysia
TNB Engineers Sdn. Bhd. 100% 100% Dormant Malaysia
TNB Fuel Services Sdn. Bhd. 100% 100% Supplying fuel and coal for power generation Malaysia
TNB Generation Sdn. Bhd. 100% 100% Dormant Malaysia
TNB Global Captive (L) Ltd. 100% 100% Insurance and reinsurance related business Malaysia
TNB Global Ventures Capital Berhad 100% 100% Investment holding company Malaysia
TNB Hidro Sdn. Bhd. 100% 100% Dormant Malaysia

p.213
INTEGRATED ANNUAL REPORT 2020
FINANCIAL STATEMENTS
Notes to the Financial Statements31 December 2020
7 SUBSIDIARIES (CONTINUED)
The details of the subsidiaries are as follows: (continued)
Name of subsidiary
Group’seffective interest
Principal activitiesCountry ofincorporation2020 2019
TNB Integrated Learning Solution Sdn. Bhd.
100% 100% Providing training courses Malaysia
TNB International Sdn. Bhd. 100% 100% Investment holding company Malaysia
TNB Power Daharki Ltd.# 100% 100% Investment holding company Mauritius
TNB Power Generation Sdn. Bhd. 100% 100% To operate generation facilities that produce electric energy
Malaysia
TNB Properties Sdn. Bhd. 100% 100% Dormant Malaysia
TNB Renewables Sdn. Bhd. 100% 100% Investment and development of Renewable Energy (‘RE’) projects as well as RE related business
Malaysia
TNB Research Sdn. Bhd. 100% 100% Research and development, consultancy and other services
Malaysia
TNB Retail Sdn. Bhd. 100% 100% Managing customer relationships and responsible for sale of electricity and beyond
Malaysia
TNB Risk Management Sdn. Bhd. 100% 100% Dormant Malaysia
TNB Topaz Energy Sdn. Bhd. 100% 100% Investment holding for developing and investing in overseas power generation projects
Malaysia
TNB Transmission Network Sdn. Bhd. 100% 100% Dormant Malaysia
TNB Ventures Sdn. Bhd. 100% 100% Investment holding company Malaysia
TNB-IT Sdn. Bhd. 100% 100% Provision of telecommunication and IT infrastructure solutions and operation and maintenance services on the telecommunication equipment and data centre
Malaysia
TNBX Sdn. Bhd. 100% 100% To act as the single-fronting Malaysia entity for customers to purchase/obtain solutions beyond the meter. The solutions comprise non-regulated products and services such as energy efficiency, renewable energy and smart cities
Malaysia
Universiti Tenaga Nasional Sdn. Bhd. 100% 100% Providing higher education Malaysia
Yayasan Tenaga Nasional - - A trust established under the provision of Trustees (Incorporation) Act 1952 (Act 258), for promotion and advancement of education and for charitable purposes
Malaysia

p.214
TENAGA NASIONAL BERHAD
Notes to the Financial Statements31 December 2020
7 SUBSIDIARIES (CONTINUED)
The details of the subsidiaries are as follows: (continued)
Name of subsidiary
Group’seffective interest
Principal activitiesCountry ofincorporation2020 2019
Subsidiary of Aruna Servicios Integrales S.L.U.
Global Power Enerjî Sanayî Ve Tîcaret Anonîm îrketî*
100% 100% To engage in activities related to building and operating electricity production facilities, producing electricity and/or capacity and distributing the generated electricity and/or capacity to customers and/or to legal entities with wholesale trade licences or retail sale licences and to free consumers
Turkey
Subsidiary of Orion Mission Sdn. Bhd.
Lahad Datu Holdings Sdn. Bhd.* (In members’ voluntary winding up)
100% 100% Investment holding company Malaysia
Subsidiary of Lahad Datu Holdings Sdn. Bhd.
Lahad Datu Energy Sdn. Bhd.* (In members’ voluntary winding up)
100% 100% Dormant Malaysia
Subsidiary of Power and Energy International (Mauritius) Ltd. (‘PEIM’)
Independent Power International Ltd.* 100% 100% Investment holding Mauritius
Subsidiary of REV Property Holdings Sdn. Bhd.
REV Horizon Sdn. Bhd. 100% - Property asset management, property project management and facility and property maintenance
Malaysia
Subsidiary of Sabah Electricity Sdn. Bhd.
Elopura Power Sdn. Bhd. 83% 83% Dormant Malaysia
Subsidiaries of Tenaga Switchgear Sdn. Bhd.
PT. Tenaga Nusa Bakti* 57% 57% Dormant Indonesia
TSG Ormazabal Sdn. Bhd. 36%
36% Assembling, manufacture, test, reconditioning, distribution and other sources of medium voltage switchgear and control gear for transmission and distribution of electric power
Malaysia

p.215
INTEGRATED ANNUAL REPORT 2020
FINANCIAL STATEMENTS
Notes to the Financial Statements31 December 2020
7 SUBSIDIARIES (CONTINUED)
The details of the subsidiaries are as follows: (continued)
Name of subsidiary
Group’seffective interest
Principal activitiesCountry ofincorporation2020 2019
Subsidiaries of TNB Energy Services Sdn. Bhd.
MAEVI Sdn. Bhd. 70% 70% Providing infrastructure for hosting, data processing services and related activities research and development on engineering and technology, export and import of electrical and electronic goods
Malaysia
Tenaga E Mobility Solutions Sdn. Bhd. 100% 100% Operation of parking facilities for motor vehicles (parking lots), operation of generation facilities that produce electric energy and engineering services
Malaysia
Subsidiaries of TNB Engineering Corporation Sdn. Bhd.
Bangsar Energy Systems Sdn. Bhd. 100% 100% Operating an integrated district cooling system for air conditioning systems of office buildings
Malaysia
Cooling Energy Supply Sdn. Bhd. 70% - Operation of the concession to operate, maintain and upgrade an existing district cooling co-generation plant and to supply electricity and chilled water to customer
Malaysia
TNEC Construction Sdn. Bhd. 100% 100% Dormant Malaysia
TNEC Operations And Maintenance Sdn. Bhd.
100% 100% The company ceased business and has remained as investment holding company
Malaysia
Subsidiary of Bangsar Energy Systems Sdn. Bhd.
Selesa Energy Systems Sdn. Bhd. 70% 70% Dormant Malaysia
Subsidiary of TNEC Operations And Maintenance Sdn. Bhd.
Tomest Energy Management Sdn. Bhd.* (In members’ voluntary winding up)
51% 51% Operating an integrated district cooling system for air conditioning buildings
Malaysia
Subsidiaries of TNB International Sdn. Bhd.
Tenaga Investments UK Ltd.# 100% 100% Investment holding company United Kingdom
Vortex Solar Investments S.A.R.L.*^ 55% 50% Investment holding company Luxembourg
Subsidiary of Tenaga Investments UK Ltd.
Tenaga Wind Ventures UK Ltd.# 100% 100% Investment holding company United Kingdom

p.216
TENAGA NASIONAL BERHAD
Notes to the Financial Statements31 December 2020
7 SUBSIDIARIES (CONTINUED)
The details of the subsidiaries are as follows: (continued)
Name of subsidiary
Group’seffective interest
Principal activitiesCountry ofincorporation2020 2019
Subsidiaries of Tenaga Wind Ventures UK Ltd.
Bluemerang Capital Ltd.# 100% 100% Direct investment holding company of assets involved in generation and sale of power through renewable energy (wind turbines) in the UK
United Kingdom
GVO Wind Limited# 100% 100% Direct investment holding company of assets involved in generation and sale of power through renewable energy (wind turbines) in the UK
United Kingdom
Subsidiaries of Bluemerang Capital Ltd.
BCL Caslterigg Limited# 100% 100% Operation of wind assets for the generation and sale of electricity in the UK
United Kingdom
BCL Gwynt Limited# 100% 100% Operation of wind assets for the generation and sale of electricity in the UK
United Kingdom
BCL Harmeston Limited# 100% 100% Operation of wind assets for the generation and sale of electricity in the UK
United Kingdom
BCL Murex Bennacott Ltd# 100% 100% Operation of wind assets for the generation and sale of electricity in the UK
United Kingdom
BLC Hunday Limited# 100% 100% Operation of wind assets for the generation and sale of electricity in the UK
United Kingdom
Ili (Wellgreen) Limited# 100% 100% Operation of wind assets for the generation and sale of electricity in the UK
United Kingdom
LE18 Limited# 100% 100% Operation of wind assets for the generation and sale of electricity in the UK
United Kingdom
LE19 Limited# 100% 100% Operation of wind assets for the generation and sale of electricity in the UK
United Kingdom
Murex Bennacott Limited# 100% 100% Operation of wind assets for the generation and sale of electricity in the UK
United Kingdom
Subsidiaries of GVO Wind Limited
Boghead WT Limited# 100% 100% Operation of wind assets for the generation and sale of electricity in the UK
United Kingdom
Durpley WT Limited# 100% 100% Operation of wind assets for the generation and sale of electricity in the UK
United Kingdom
GVO Wind F-1 Limited# 100% 100% Operation of wind assets for the generation and sale of electricity in the UK
United Kingdom

p.217
INTEGRATED ANNUAL REPORT 2020
FINANCIAL STATEMENTS
Notes to the Financial Statements31 December 2020
7 SUBSIDIARIES (CONTINUED)
The details of the subsidiaries are as follows: (continued)
Name of subsidiary
Group’seffective interest
Principal activitiesCountry ofincorporation2020 2019
Subsidiaries of GVO Wind Limited (continued)
GVO Wind No. 1 Limited# 100% 100% Operation of wind assets for the generation and sale of electricity in the UK
United Kingdom
GVO Wind No. 2 Limited# 100% 100% Operation of wind assets for the generation and sale of electricity in the UK
United Kingdom
GVO Wind No. 3 Limited# 100% 100% Operation of wind assets for the generation and sale of electricity in the UK
United Kingdom
GVO Wind No. 4 Limited# 100% 100% Operation of wind assets for the generation and sale of electricity in the UK
United Kingdom
GVO Wind No. 5 Limited# 100% 100% Operation of wind assets for the generation and sale of electricity in the UK
United Kingdom
GVO Wind No. 6 Limited# 100% 100% Operation of wind assets for the generation and sale of electricity in the UK
United Kingdom
GVO Wind No. 7 Limited# 100% 100% Operation of wind assets for the generation and sale of electricity in the UK
United Kingdom
GVO Wind No. 9 Limited# 100% 100% Operation of wind assets for the generation and sale of electricity in the UK
United Kingdom
GVO Wind No. 10 Limited# 100% 100% Operation of wind assets for the generation and sale of electricity in the UK
United Kingdom
GVO Wind No. 11 Limited# 100% 100% Operation of wind assets for the generation and sale of electricity in the UK
United Kingdom
GVO Wind No. 12 Limited# 100% 100% Operation of wind assets for the generation and sale of electricity in the UK
United Kingdom
GVO Wind No. 13 Limited# 100% 100% Operation of wind assets for the generation and sale of electricity in the UK
United Kingdom
GVO Wind No. 14 Limited# 100% 100% Operation of wind assets for the generation and sale of electricity in the UK
United Kingdom
GVO Wind No. 16 Limited# 100% 100% Operation of wind assets for the generation and sale of electricity in the UK
United Kingdom
GVO Wind No. 20 Limited# 100% 100% Operation of wind assets for the generation and sale of electricity in the UK
United Kingdom
GVO Wind No. 21 Limited# 100% 100% Operation of wind assets for the generation and sale of electricity in the UK
United Kingdom

p.218
TENAGA NASIONAL BERHAD
Notes to the Financial Statements31 December 2020
7 SUBSIDIARIES (CONTINUED)
The details of the subsidiaries are as follows: (continued)
Name of subsidiary
Group’seffective interest
Principal activitiesCountry ofincorporation2020 2019
Subsidiaries of GVO Wind Limited (continued)
GVO Wind No. 22 Limited# 100% 100% Operation of wind assets for the generation and sale of electricity in the UK
United Kingdom
GVO Wind No. 23 Limited# 100% 100% Operation of wind assets for the generation and sale of electricity in the UK
United Kingdom
GVO Wind No. 24 Limited# 100% 100% Operation of wind assets for the generation and sale of electricity in the UK
United Kingdom
GVO Wind No. 25 Limited# 100% 100% Operation of wind assets for the generation and sale of electricity in the UK
United Kingdom
GVO Wind No. 27 Limited# 100% 100% Operation of wind assets for the generation and sale of electricity in the UK
United Kingdom
GVO Wind No. 28 Limited# 100% 100% Operation of wind assets for the generation and sale of electricity in the UK
United Kingdom
GVO Wind No. 29 Limited# 100% 100% Operation of wind assets for the generation and sale of electricity in the UK
United Kingdom
GVO Wind No. 30 Limited# 100% 100% Operation of wind assets for the generation and sale of electricity in the UK
United Kingdom
GVO Wind No. 31 Limited# 100% 100% Operation of wind assets for the generation and sale of electricity in the UK
United Kingdom
GVO Wind No. 32 Limited# 100% 100% Operation of wind assets for the generation and sale of electricity in the UK
United Kingdom
GVO Wind No. 35 Limited# 100% 100% Operation of wind assets for the generation and sale of electricity in the UK
United Kingdom
GVO Wind No. 36 Limited# 100% 100% Operation of wind assets for the generation and sale of electricity in the UK
United Kingdom
GVO Wind No. 39 Limited# 100% 100% Operation of wind assets for the generation and sale of electricity in the UK
United Kingdom
GVO Wind No. 40 Limited# 100% 100% Operation of wind assets for the generation and sale of electricity in the UK
United Kingdom
GVO Wind No. 41 Limited# 100% 100% Operation of wind assets for the generation and sale of electricity in the UK
United Kingdom
GVO Wind No. 42 Limited# 100% 100% Operation of wind assets for the generation and sale of electricity in the UK
United Kingdom

p.219
INTEGRATED ANNUAL REPORT 2020
FINANCIAL STATEMENTS
Notes to the Financial Statements31 December 2020
7 SUBSIDIARIES (CONTINUED)
The details of the subsidiaries are as follows: (continued)
Name of subsidiary
Group’seffective interest
Principal activitiesCountry ofincorporation2020 2019
Subsidiaries of GVO Wind Limited (continued)
GVO Wind No. 43 Limited# 100% 100% Operation of wind assets for the generation and sale of electricity in the UK
United Kingdom
GVO Wind No. 44 Limited# 100% 100% Operation of wind assets for the generation and sale of electricity in the UK
United Kingdom
GVO/CME Wind No. 17 Limited# 100% 100% Operation of wind assets for the generation and sale of electricity in the UK
United Kingdom
GVO/CME Wind No. 18 Limited# 100% 100% Operation of wind assets for the generation and sale of electricity in the UK
United Kingdom
OGPW No.1 Limited# 100% 100% Operation of wind assets for the generation and sale of electricity in the UK
United Kingdom
Warren WT Limited# 100% 100% Operation of wind assets for the generation and sale of electricity in the UK
United Kingdom
Weston Town WT Limited# 100% 100% Operation of wind assets for the generation and sale of electricity in the UK
United Kingdom
Subsidiary of Vortex Solar Investments S.A.R.L.
Vortex Solar UK4 Limited*^ 55% 50% Intermediate holding company England and Wales
Subsidiaries of Vortex Solar
UK4 Limited
TerraForm UK2 Intermediate Holdings, Ltd*^
55% 50% Intermediate holding company England and Wales
TerraForm UK3 Intermediate Holdings Limited*^
55% 50% Intermediate holding company England and Wales
Vortex Solar UK Limited*^
55%
50% Direct investment holding company of assets
involved in generation and sale of power through renewable energy (solar) in the UK
England and Wales
Vortex Solar UK2 Limited*^ 55% 50% Intermediate holding company England and Wales
Vortex Solar UK3 Limited*^ 55% 50% Intermediate holding company England and Wales
p.220
TENAGA NASIONAL BERHAD
Notes to the Financial Statements31 December 2020
7 SUBSIDIARIES (CONTINUED)
The details of the subsidiaries are as follows: (continued)
Name of subsidiary
Group’seffective interest
Principal activitiesCountry ofincorporation2020 2019
Subsidiaries of TerraForm UK3 Intermediate Holdings Limited
Cambridge Solar Power Limited*^ 55% 50% Operation of solar assets for the generation and sale of electricity in the UK
England and Wales
SunE Green Holdco2 Ltd*^
55%
50%
Direct investment holding company of assets
involved in generation and sale of power through renewable energy (solar) in the UK
England and Wales
SunE Green Holdco3 Limited*^
55% 50% Direct investment holding company of assets
involved in generation and sale of power through renewable energy (solar) in the UK
England and Wales
SunE Green Holdco4 Limited*^
55% 50% Direct investment holding company of assets involved in generation and sale of power through renewable energy (solar) in the UK
England and Wales
SunE Green Holdco5 Limited*^
55% 50% Direct investment holding company of assets
involved in generation and sale of power through renewable energy (solar) in the UK
England and Wales
SunE Green Holdco7 Limited*^
55% 50% Direct investment holding company of assets involved in generation and sale of power through renewable energy (solar) in the UK
England and Wales
SunE Green Holdco9 Limited*^
55% 50% Direct investment holding company of assets
involved in generation and sale of power through renewable energy (solar) in the UK
England and Wales
SunE Green Holdco13 Limited*^
55% 50% Direct investment holding company of assets
involved in generation and sale of power through renewable energy (solar) in the UK
England and Wales
SunE Hill Farm Solar Limited*^
55% 50% Operation of solar assets for the generation and
sale of electricity in the UKEngland and
Wales
SunE Sundorne Grove Solar Limited*^ 55% 50% Operation of solar assets for the generation and sale of electricity in the UK
England and Wales
Sunsave 11 (Wrockwardine Farm) Limited*^
55% 50% Operation of solar assets for the generation and sale of electricity in the UK
England and Wales
Sunsave 17 (Castle Combe) Limited*^ 55% 50% Operation of solar assets for the generation and sale of electricity in the UK
England and Wales
Sunsave 31 (Horam) Limited*^ 55% 50% Operation of solar assets for the generation and sale of electricity in the UK
England and Wales

p.221
INTEGRATED ANNUAL REPORT 2020
FINANCIAL STATEMENTS
Notes to the Financial Statements31 December 2020
7 SUBSIDIARIES (CONTINUED)
The details of the subsidiaries are as follows: (continued)
Name of subsidiary
Group’seffective interest
Principal activitiesCountry ofincorporation2020 2019
Subsidiaries of SunE Green Holdco2 Ltd
AEE Renewables UK 31 Limited*^ 55% 50% Operation of solar assets for the generation and sale of electricity in the UK
England and Wales
SunE Project1 Ltd*^ 55% 50% Operation of solar assets for the generation and sale of electricity in the UK
England and Wales
Subsidiaries of SunE Green Holdco3 Limited
Sunsave 10 (Fareham) Ltd*^ 55% 50% Operation of solar assets for the generation and sale of electricity in the UK
England and Wales
Sunsave 15 (Westwood) Limited*^ 55% 50% Operation of solar assets for the generation and sale of electricity in the UK
England and Wales
Sunsave 20 (KnowIton) Limited*^ 55% 50% Operation of solar assets for the generation and sale of electricity in the UK
England and Wales
Subsidiaries of SunE Green Holdco4 Limited
Boyton Solar Park Limited*^ 55% 50% Operation of solar assets for the generation and sale of electricity in the UK
England and Wales
KS SPV 24 Limited*^ 55% 50% Operation of solar assets for the generation and sale of electricity in the UK
England and Wales
Sunsave 6 (Manston) Ltd*^ 55% 50% Operation of solar assets for the generation and sale of electricity in the UK
England and Wales
Subsidiaries of SunE Green Holdco5 Limited
MSP Fairwind Limited*^ 55% 50% Operation of solar assets for the generation and sale of electricity in the UK
England and Wales
Sunsave 14 (Fenton) Limited*^ 55% 50% Operation of solar assets for the generation and sale of electricity in the UK
England and Wales
Subsidiary of SunE Green Holdco6 Limited
Sunsave 43 (Epwell) Limited*^ 55%
50% Operation of solar assets for the generation and sale of electricity in the UK
England and Wales

p.222
TENAGA NASIONAL BERHAD
Notes to the Financial Statements31 December 2020
7 SUBSIDIARIES (CONTINUED)
The details of the subsidiaries are as follows: (continued)
Name of subsidiary
Group’seffective interest
Principal activitiesCountry ofincorporation2020 2019
Subsidiaries of SunE Green Holdco7 Limited
Brynteg Solar Limited*^ 55% 50% Operation of solar assets for the generation and sale of electricity in the UK
England and Wales
Daisy No. 1 Limited*^ 55% 50% Operation of solar assets for the generation and sale of electricity in the UK
England and Wales
SE Bury Lane Solar Limited*^ 55% 50% Operation of solar assets for the generation and sale of electricity in the UK
England and Wales
SunE Green Energy Ltd*^
55% 50% Operation of solar assets for the generation and
sale of electricity in the UKEngland and
Wales
SunE Green Holdco6 Limited*^
55% 50% Direct investment holding company of assets
involved in generation and sale of power through renewable energy (solar) in the UK
England and Wales
Subsidiaries of SunE Green Holdco9 Limited
SunE Burthy Farm Solar Limited*^
55%
50% Operation of solar assets for the generation and
sale of electricity in the UKEngland and
Wales
SunE Little Neath Solar Limited*^
55% 50% Operation of solar assets for the generation and
sale of electricity in the UKEngland and
Wales
Subsidiary of SunE Green Holdco13 Limited
SunE Prestop Park Limited*^ 55% 50% Operation of solar assets for the generation and sale of electricity in the UK
England and Wales
Subsidiary of TNB Power Daharki Ltd.
TNB Liberty Power Limited# 100% 100% Operation of power plant and generation of electricity
Pakistan
Subsidiaries of TNB Power Generation Sdn. Bhd.
Integrax Berhad& 100% 100% Investment holding company Malaysia
Jimah East Power Sdn. Bhd. (‘JEP’)& 70% 70% Involved in power generation Malaysia
Kapar Energy Ventures Sdn. Bhd. (‘KEV’)&
60% 60% Generate and deliver electricity energy and generating capacity to TNB
Malaysia
Manjung Island Energy Berhad& - - Special purpose company to raise Islamic securities under the Islamic Securities Programme
Malaysia

p.223
INTEGRATED ANNUAL REPORT 2020
FINANCIAL STATEMENTS
Notes to the Financial Statements31 December 2020
7 SUBSIDIARIES (CONTINUED)
The details of the subsidiaries are as follows: (continued)
Name of subsidiary
Group’seffective interest
Principal activitiesCountry ofincorporation2020 2019
Subsidiaries of TNB Power Generation Sdn. Bhd. (continued)
Southern Power Generation Sdn. Bhd.&
70% 51% Generate and deliver electricity and maintain generating capacity to TNB
Malaysia
TNB Bukit Selambau Solar Sdn. Bhd.& 100% 100% Operation of generation facilities that produce electric energy
Malaysia
TNB Connaught Bridge Sdn. Bhd.& 100% 100% Generate and deliver electricity energy and maintain generating capacity to TNB
Malaysia
TNB Janamanjung Sdn. Bhd.& 100% 100% Generate and deliver electricity energy and maintain generating capacity to TNB
Malaysia
TNB Manjung Five Sdn. Bhd.& 100% 100% Generate and deliver electricity energy and maintain generating capacity to TNB
Malaysia
TNB Pasir Gudang Energy Sdn. Bhd.& 100% 100% Carry business of any matter relating to electricity especially the business of generation and supply of electricity for any purpose in Malaysia
Malaysia
TNB Prai Sdn. Bhd.& 100% 100% Generate and deliver electricity energy and maintain generating capacity to TNB
Malaysia
TNB Repair And Maintenance Sdn. Bhd.&
100% 100% Providing repair and maintenance services to heavy industries and other related services
Malaysia
TNB Sepang Solar Sdn. Bhd.& 100% 100% Operation of generation facilities that produce electric energy
Malaysia
Subsidiaries of Integrax Berhad
LBT Two Sdn. Bhd. 100% 100% Dormant Malaysia
Pelabuhan Lumut Sdn. Bhd. 100% 100% Investment holding Malaysia
Segmen Kembara Sdn. Bhd.* (Dissolved w.e.f. 5.5.2020)
- 100% Dormant Malaysia
Trek Kembara Sdn. Bhd.* (Dissolved w.e.f. 19.5.2020)
- 100% Dormant Malaysia
Subsidiary of Pelabuhan Lumut Sdn. Bhd.
Lekir Bulk Terminal Sdn. Bhd. 100% 100% Development, ownership and management of a dry bulk terminal
Malaysia

p.224
TENAGA NASIONAL BERHAD
Notes to the Financial Statements31 December 2020
7 SUBSIDIARIES (CONTINUED)
The details of the subsidiaries are as follows: (continued)
Name of subsidiary
Group’seffective interest
Principal activitiesCountry ofincorporation2020 2019
Subsidiary of TNB Manjung Five Sdn. Bhd.
TNB Western Energy Berhad 100% 100% Principally engaged in the construction of 1,000MW coal fired power plant in Lumut, Perak, Malaysia
Malaysia
Subsidiary of TNB Prai Sdn. Bhd.
TNB Northern Energy Berhad 100% 100% Principally to construct a 1,071MW gas fired power plant in Seberang Perai Tengah, Seberang Perai, Pulau Pinang, Malaysia
Malaysia
Subsidiaries of TNB Repair And Maintenance Sdn. Bhd.
Tenaga WHR 1 Sdn. Bhd. 100% 100% To carry on the business of establishing, constructing, commissioning, setting up, operating and maintaining electric power generation systems, transmission systems/networks, power systems, generating stations/plants based on waste heat recovery and/or power efficiency technology
Malaysia
TNB Operations & Maintenance International Ltd.
100% 100% Investment holding Mauritius
TNB REMACO Pakistan (Private) Limited#
100% 100% Providing repair and maintenance services to heavy industries and other related services
Pakistan
Trichy Energy Limited* 100% 100% Dormant India
Trichy Power Limited* 100% 100% Dormant India
Subsidiary of TNB Operations & Maintenance International Ltd.
Oasis Parade Sdn. Bhd. 100% 100% Investment company Malaysia
Subsidiary of TNB Properties Sdn. Bhd.
TNP Construction Sdn. Bhd. 100% 100% Dormant Malaysia
Subsidiary of TNB Renewables Sdn. Bhd.
GSPARX Sdn. Bhd. 100% 100% Invest and develop RE projects for self-consumption/self-generation and its related business
Malaysia

p.225
INTEGRATED ANNUAL REPORT 2020
FINANCIAL STATEMENTS
Notes to the Financial Statements31 December 2020
7 SUBSIDIARIES (CONTINUED)
The details of the subsidiaries are as follows: (continued)
Name of subsidiary
Group’seffective interest
Principal activitiesCountry ofincorporation2020 2019
Subsidiary of TNB Research Sdn. Bhd.
TNB LABS Sdn. Bhd. 100% 100% Technical and laboratory services, consultancy and other services
Malaysia
Subsidiary of TNB Ventures Sdn. Bhd.
Tenaga Cable Industries Sdn. Bhd. 76% 76% Manufacturing and distribution of power and general cables, aluminium rods and related activities
Malaysia
Subsidiaries of Universiti Tenaga Nasional Sdn. Bhd.
UNITEN R&D Sdn. Bhd. 100% 100% Providing research and development in areas related to engineering, information technology, business, accountancy, liberal studies and other services
Malaysia
Yayasan Canselor Universiti Tenaga Nasional
- - A trust established under the provision of Trustees (Incorporation) Act 1952 (Act 258) to receive and administer funds for educational and charitable purposes
Malaysia
# Audited by a member firm of PricewaterhouseCoopers International Limited which is a separate and independent legal entity from PricewaterhouseCoopers PLT, Malaysia.
* Not audited by PricewaterhouseCoopers PLT.^ Vortex Solar Investments S.A.R.L. (‘VSI’) was previously recognised as an associate of TNB International Sdn. Bhd. (‘TNBI’) with a shareholding of 50.0%.
TNBI further acquired an additional 5.0% equity interest in VSI on 1 September 2020 which changed the controlling interest from an associate to a subsidiary of the Group (Note 48). As at 31 December 2020, VSI and its subsidiaries have been disclosed as the subsidiaries of the Group.
& Upon completion of the approved internal reorganisation, the Company’s net cost of investment in domestic power generation subsidiaries amounting to RM6,737.2 million were transferred to TNBPG on 1 October 2020 (Note 49).
Capital and other commitments for the subsidiaries are disclosed in Note 42. There are no material contingent liabilities relating to the subsidiaries.

p.226
TENAGA NASIONAL BERHAD
Notes to the Financial Statements31 December 2020
7 SUBSIDIARIES (CONTINUED)
The NCI is not material to the financial performance, financial position and cash flows of the Group. The NCI information for SPG, SESB and JEP, which contribute to substantial portion of total NCI is set out below:
SPG SESB JEPOther individually
immaterial NCI Total
2020RM’million
2019RM’million
2020RM’million
2019RM’million
2020RM’million
2019RM’million
2020RM’million
2019RM’million
2020RM’million
2019RM’million
Carrying amount of NCI 237.0^ 33.3 270.2 224.8 922.7 904.5* 186.8** 137.7 1,616.7 1,300.3
Total comprehensive income/(expenses) allocated to NCI 5.7 (5.5) 45.4 (6.7) 18.2 20.8 (46.9) (113.9) 22.4 (105.3)
* Included in the carrying amount of NCI in JEP for financial year 2019 is a subscription of RPS by NCI via conversion of amount due to NCI amounting to RM195.1 million.
** NCI in relation to the acquisition and recognition of a subsidiary, VSI amounting to RM98.8 million (Note 48).^ The carrying amount of SPG’s NCI includes subscription of RPS by the NCI amounting to RM225.3 million and purchase of ordinary shares from the NCI
by the Company of RM27.3 million.
The summarised financial information of SPG, SESB and JEP before inter-company eliminations are as follows:
SPG SESB JEP
2020RM’million
2019RM’million
2020RM’million
2019RM’million
2020RM’million
2019RM’million
Summarised statement of financial position
Non-current assets 4,069.2 3,624.9 8,369.4 8,650.3 11,246.1 11,747.6
Current assets 618.4 155.4 2,018.2 1,910.9 1,462.3 816.0
Non-current liabilities (3,681.4) (3,679.0) (7,284.8) (7,616.7) (8,931.9) (9,111.6)
Current liabilities (140.5) (67.2) (1,999.6) (2,114.1) (780.7) (516.7)
Net assets 865.7 34.1 1,103.2 830.4 2,995.8 2,935.3
Summarised statement of comprehensive income
Revenue 0 0 2,227.7 2,321.4 2,706.6 586.9
Profit/(Loss) after tax 5.7 (11.2) 266.8 233.0 60.5 69.3
Other comprehensive expense 0 0 (3.6) (122.2) 0 0
Total comprehensive income/(expense) 5.7 (11.2) 263.2 110.8 60.5 69.3
Summarised statement of cash flows
Net cash flows (used in)/generated from operating activities (73.8) 144.4 1,140.2 1,103.5 1,278.4 (118.5)
Net cash flows (used in)/generated from investing activities (544.4) 44.4 (327.5) (556.6) (69.8) 23.9
Net cash flows generated from/(used in) financing activities 631.2 (193.5) (873.4) (663.1) (619.3) 154.1
Net increase/(decrease) in cash and cash equivalents 13.0 (4.7) (60.7) (116.2) 589.3 59.5

p.227
INTEGRATED ANNUAL REPORT 2020
FINANCIAL STATEMENTS
Notes to the Financial Statements31 December 2020
8 JOINT ARRANGEMENTS
Accounting Policy
A joint arrangement is an arrangement over which there is contractually agreed sharing of control by the Group with one or more parties where decisions about the relevant activities relating to the joint arrangement require unanimous consent of the parties sharing control. The classification of a joint arrangement as a joint operation or a joint venture depends upon the rights and obligations of the parties to the arrangement. A joint venture is a joint arrangement whereby the joint venturers have rights to the net assets of the arrangement. Joint operations are joint arrangements whereby the Company has the rights to the assets and obligations for the liabilities. In respect of its interests in joint operations, the Company shall recognise in its financial statements the assets that it controls and the expenses and liabilities that it incurs and its share of the income that it earns from the sale of goods or services.
The Group’s interest in joint ventures is accounted for in the consolidated financial statements using the equity method of accounting.
Equity accounting involves recognising in the consolidated statement of profit or loss, consolidated statement of OCI and consolidated statement of changes in equity, the Group’s share of profits less losses of the joint ventures based on the latest audited financial statements or management accounts of the joint ventures, made up to the financial year end of the Group. Where necessary, adjustments are made to the results and net assets of the joint ventures to ensure consistency of accounting policies with those of the Group. The Group’s investments in joint ventures are recorded at cost inclusive of goodwill and adjusted thereafter for accumulated impairment losses and the post-acquisition change in the Group’s share of net assets of the joint ventures.
Unrealised gains on transactions between the Group and its joint ventures are eliminated to the extent of the Group’s interest in joint ventures. Unrealised losses are also eliminated on the same basis but only to the extent of the costs that can be recovered, and the balances that provide evidence of reduction in net realisable value or an impairment of the asset transferred are recognised in the consolidated statement of profit or loss.
(a) Joint ventures
Group Company
2020RM’million
2019RM’million
2020RM’million
2019RM’million
Unquoted shares 87.5 84.1 7.9 7.9
Share of post-acquisition results and reserves 121.5 101.7 0 0
209.0 185.8 7.9 7.9
Less: Accumulated impairment losses (8.4) (8.4) (7.9) (7.9)
200.6 177.4 0 0
Share of net assets of joint ventures 200.6 177.4
p.228
TENAGA NASIONAL BERHAD
Notes to the Financial Statements31 December 2020
8 JOINT ARRANGEMENTS (CONTINUED)
(a) Joint ventures (continued)
None of the joint ventures are material individually to the financial position, financial performance and cash flows of the Group.
The aggregated financial information of the Group’s joint ventures is as follows:
2020RM’million
2019RM’million
Group’s share of results:
Profit after tax and total comprehensive income 19.8 25.7
Dividend received 0 15.2
Amounts due from/(to) joint ventures
Amounts due from joint ventures* 44.2 10.6
Less: Accumulated impairment losses (24.8) 0
19.4 10.6
Amount due to joint venture 0 (0.1)
* The Group’s credit policy provides amounts due from joint ventures with a 30 days (2019: 30 days) credit period.
The details of the Group’s joint ventures are as follows:
Name of joint venture
Group’s effective interest
Principal activitiesCountry ofincorporation2020 2019
Seatrac Sdn. Bhd. 50% 50% Dormant Malaysia
Joint ventures of TNB Energy Services Sdn. Bhd.
FTJ Bio Power Sdn. Bhd.
40% 40% Generation and distribution of electricity using palm empty fruit bunches as its main fuel source
Malaysia
Metrosphere Hydro Tersat Sdn. Bhd. 49% 49% Business related in hydro power plant and general trading
Malaysia
Joint venture of TNB Engineering Corporation Sdn. Bhd.
Airport Cooling Energy Supply Sdn. Bhd.
77% 77% To develop, design, engineer, procure, construct, finance district cooling projects in the airport sector, to undertake the comprehensive operational maintenance of district cooling projects in the airport sector and to carry on the business of producing, distributing, applying, dealing and selling of chilled water
Malaysia

p.229
INTEGRATED ANNUAL REPORT 2020
FINANCIAL STATEMENTS
Notes to the Financial Statements31 December 2020
8 JOINT ARRANGEMENTS (CONTINUED)
(a) Joint ventures (continued)
The details of the Group’s joint ventures are as follows: (continued)
Name of joint venture
Group’seffective interest
Principal activitiesCountry ofincorporation2020 2019
Joint venture of TNB Repair And Maintenance Sdn. Bhd.
GMR Tenaga Operations And Maintenance Private Limited
50% 50% Operation and maintenance of power plants India
(b) Joint operations
The details of the Group’s joint operations are as follows:
Name of joint operation
Group’seffective interest
Principal activitiesPrincipal place of business2020 2019
Joint operations of TNB Engineering Corporation Sdn. Bhd.
TNB Engineering Scale Corporation Sdn. Bhd. & ERS Energy Sdn. Bhd. (‘TNEC-ERS’)
60% 60% To carry out design, engineering, procurement, manufacture, construction, installation, testing, commissioning and completion works for a 29MWac Large Scale Solar Photovoltaic Plant at Kuala Muda, Kedah
Malaysia
Joint operations of TNB Repair And Maintenance Sdn. Bhd.
TNB Repair And Maintenance Sdn. Bhd. & Al-Dhow Engineering (‘TNB REMACO & Al-Dhow JV’)
50% 50% Maintenance works for instrumental & control systems and mechanical equipment services
Kuwait
TNB Repair And Maintenance Sdn. Bhd. & Kharafi National (‘TNB REMACO & KN JV’)
50% 50% Operation and maintenance services to heavy industries and other related services
Kuwait
The impact of the Group’s joint operations to the Group is immaterial.

p.230
TENAGA NASIONAL BERHAD
Notes to the Financial Statements31 December 2020
9 ASSOCIATES
Accounting Policy
Associates are all entities over which the Group has significant influence but not control or joint control, generally accompanying a shareholding of between 20.0% and 50.0% of the voting rights.
Investments in associates are accounted for in the consolidated financial statements using the equity method of accounting and are initially recognised at cost. Equity accounting is discontinued when the Group ceases to have significant influence over the associates.
The Group’s share of its associates’ post-acquisition profits or losses is recognised in the statement of profit or loss, and its share of post-acquisition movements is recognised in OCI. The cumulative post-acquisition movements are adjusted against the carrying amount of the investment. When the Group’s share of losses in an associate equals or exceeds its interests in the associate, including any long term interests that, in substance, form part of the Group’s net investment in the associate, the Group does not recognise further losses, unless it has incurred legal or constructive obligations or made payments on behalf of the associate. If the associate subsequently reports profits, the Group resumes recognising its share of those profits only after its share of the profits equals the share of losses not recognised. The Group’s investments in associates include goodwill identified on acquisition, net of any accumulated impairment losses (Note 3(c)).
Profits and losses resulting from upstream and downstream transactions between the Group and its associates are recognised in the Group’s financial statements only for the unrelated investor’s interests in the associates. The accounting policies of associates have been changed where necessary to ensure consistency with the policies adopted by the Group.
Dilution of gains and losses in associates are recognised in the consolidated statement of profit or loss.
If the ownership interest in an associate is reduced but significant influence is retained, only a proportionate share of the amounts previously recognised in OCI is reclassified to profit or loss where appropriate.
Group Company
Note 2020RM’million
2019RM’million
2020RM’million
2019RM’million
Unquoted shares (a) 2,761.5 2,736.4 75.7 50.6
Share of post-acquisition results and reserves (536.1) (533.1) 0 0
Redeemable preference shares 18.9 61.7 0 0
2,244.3 2,265.0 75.7 50.6
Less: Accumulated impairment losses (b) (1,052.6) (1,001.0) 0 0
Less: Deemed disposal of an associate (c) (53.1) 0 0 0
1,138.6 1,264.0 75.7 50.6
Share of net assets of associates 1,138.6 1,264.0

p.231
INTEGRATED ANNUAL REPORT 2020
FINANCIAL STATEMENTS
Notes to the Financial Statements31 December 2020
9 ASSOCIATES (CONTINUED)
(a) In July 2020, the Company had acquired additional 5.0% equity interest in Jimah Energy Ventures Holdings Sdn. Bhd. (‘JEV’) from Menteri Besar Negeri Sembilan (‘MBNS’) (Incorporation) for RM25.1 million, increasing the total equity held by the Company in JEV to 25.0%. The classification of JEV as an associate remains unchanged.
(b) Impairment assessment for GEL
During the financial year, the Group had undertaken the impairment assessment of its investment in GEL mainly attributable to the changes in economic outlook for GEL due to COVID-19. Based on the impairment assessment, the carrying value of the Group’s interest in GEL as at 31 December 2020 exceeded its recoverable amount by RM51.6 million (2019: RM198.3 million), hence additional impairment loss had been recognised.
Key assumptions used
The recoverable amount was determined based on VIU calculations, which apply a discounted cash flow model of GEL Group for the period of the remaining useful lives of the respective power plants of GEL Group which range between 15 to 40 years. The cash flows used in the calculations are the most recent forecasts and projections approved by the Board of Directors and management of GEL.
The key assumptions used in determining the VIU were:
2020%
2019%
Average Plant Availability Factor 53.7 51.2
Average Plant Load Factor 50.0 – 85.0 50.0 – 85.0
Cost of equity 11.2 – 14.7 11.2 – 15.5
The cash flows were discounted using cost of equity based on the risk specific to the investments. The key assumptions take into account the macroeconomic environment in India.
The Group’s review includes impact assessment of changes in key assumptions. The effects of the movement in the key assumptions to the recoverable amount are as follows:
Changes inassumptions
%
Impact onrecoverable amount
IncreaseRM’million
DecreaseRM’million
2020
Plant Availability Factor 5.0 8.8 (8.9)
Plant Load Factor 10.0 154.0 (134.1)
Discount rate 1.0 (48.2) 55.9
2019
Plant Availability Factor 5.0 11.9 (12.1)
Plant Load Factor 10.0 116.1 (121.5)
Discount rate 1.0 (36.0) 41.3

p.232
TENAGA NASIONAL BERHAD
Notes to the Financial Statements31 December 2020
9 ASSOCIATES (CONTINUED)
(c) During the current financial year, the Group acquired an additional 5.0% equity interest in VSI for a consideration of GBP5.1 million (RM28.4 million). Consequently, the investment in VSI as an associate was deemed disposed resulting in a remeasurement gain of GBP41.9 million (RM231.3 million) (Note 36). VSI has became a subsidiary of the Group with 55.0% equity interest (Note 7 and 48).
The aggregated financial information of the Group’s associates is as follows:
2020RM’million
2019RM’million
Group’s share of results:
- Profit after tax 56.7 26.9
- Total OCI (38.7) 19.8
Dividend received 63.7 42.1
Foreign exchange gain/(loss) 42.7 (45.6)
Amounts due from/(to) associates
Group Company
2020RM’million
2019RM’million
2020RM’million
2019RM’million
Amounts due from associates* 190.8 162.9 3.6 2.6
Less: Loss allowances (7.3) (7.1) (0.2) 0
183.5 155.8 3.4 2.6
Amounts due to associates (237.8) (286.6) (228.1) (278.6)
* The Group and Company’s credit policy provides amounts due from associates with a 30 days (2019: 30 days) credit period.
The Group has not recognised share of loss amounting to RM251.8 million (2019: profit of RM36.6 million) and cumulative losses of RM395.3 million (2019: RM143.5 million) in the current financial year for Gama Enerji Anonîm îrketî (‘Gama Enerji’), as the investment in that associate has been fully written down by the Group.

p.233
INTEGRATED ANNUAL REPORT 2020
FINANCIAL STATEMENTS
Notes to the Financial Statements31 December 2020
9 ASSOCIATES (CONTINUED)
In the opinion of the Directors, the associates that are material to the Group are Lumut Maritime Terminal Sdn. Bhd. (‘LMTSB’), JEV and GEL. The following summarises the financial information of the associates and reconcile the information to the carrying amount of the Group’s interest in those associates.
(i) The summarised statement of comprehensive income:
LMTSB JEV GEL
2020RM’million
2019RM’million
2020RM’million
2019RM’million
2020RM’million
2019RM’million
Revenue 114.2 119.4 2,227.9 2,914.9 1,002.7 1,177.5
Profit/(Loss) after tax from:
- Continued operation 15.0 29.6 307.6 217.4 (215.4) (172.4)
- Discontinued operation 0 0 0 0 (0.3) 23.6
Other comprehensive (expense)/income 0 0 0 0 (0.3) 3.8
Total comprehensive income/(expense) 15.0 29.6 307.6 217.4 (216.0) (145.0)
(ii) The summarised statement of financial position:
LMTSB JEV GEL
2020RM’million
2019RM’million
2020RM’million
2019RM’million
2020RM’million
2019RM’million
Non-current assets 340.5 351.1 3,119.9 3,111.1 4,453.1 4,565.7
Current assets 221.7 200.1 1,128.9 1,352.3 637.4 851.7
Non-current liabilities (49.1) (41.5) (1,296.6) (1,272.2) (2,350.8) (2,218.0)
Current liabilities (37.6) (39.2) (1,990.9) (2,500.7) (1,432.0) (1,610.7)
Less: NCI 0 0 0 0 (91.2) (96.7)
475.5 470.5 961.3 690.5 1,216.5 1,492.0
(iii) Reconciliation of the summarised financial information:
LMTSB JEV GEL
2020RM’million
2019RM’million
2020RM’million
2019RM’million
2020RM’million
2019RM’million
Group’s share of net assets 237.8 235.3 240.3 138.1 365.0 447.6
Goodwill 37.8 37.8 0 0 482.9 504.6
Less: Accumulated impairment losses 0 0 0 0 (554.6) (503.0)
Foreign exchange 0 0 0 0 7.1 0
Carrying amount 275.6 273.1 240.3 138.1 300.4 449.2

p.234
TENAGA NASIONAL BERHAD
Notes to the Financial Statements31 December 2020
9 ASSOCIATES (CONTINUED)
Individually immaterial associates:
2020RM’million
2019RM’million
Aggregate carrying amount of individually immaterial associates 322.3 403.6
Aggregate amounts of the Group’s share of profit:
- Profit after tax 37.0 13.2
- Other comprehensive (expense)/income (38.6) 18.7
The details of the Group’s associates are as follows:
Name of associate
Group’s effective interest
Principal activitiesCountry ofincorporation2020 2019
Fibrecomm Network (M) Sdn. Bhd. 49% 49% Provision of fibre optic transmission network services
Malaysia
GB3 Sdn. Bhd. 20%
20% Design, construction, operation and maintenance of a combined cycle power plant, generation and sale of electrical energy and generating capacity of the power plant
Malaysia
Jimah Energy Ventures Holdings Sdn. Bhd.
25% 20% Investment holding Malaysia
Teknologi Tenaga Perlis Consortium Sdn. Bhd.
20% 20% Operating and maintaining an electricity generating plant owned by the Company
Malaysia
Associate of Global Power Enerjî Sanayî Ve Tîcaret Anonîm îrketî
Gama Enerji Anonîm îrketî 30% 30% To enter into commitments related to energy investments and to carry out industrial, commercial and business activities
Turkey
Associate of Independent Power International Ltd.
Malaysian Shoaiba Consortium Sdn. Bhd.
20% 20% Acquiring and hold for investment, shares, stocks, debentures in Malaysia or elsewhere
Malaysia
Associate of Oasis Parade Sdn. Bhd.
Saudi Malaysia Operation and Maintenance Services Company Limited
30% 30% Operation and maintenance of electricity generation stations and water desalination plants
Kingdom of Saudi Arabia
p.235
INTEGRATED ANNUAL REPORT 2020
FINANCIAL STATEMENTS
Notes to the Financial Statements31 December 2020
9 ASSOCIATES (CONTINUED)
The details of the Group’s associates are as follows: (continued)
Name of associate
Group’s effective interest
Principal activitiesCountry ofincorporation2020 2019
Associate of Orion Mission Sdn. Bhd.
Eastern Sabah Power Consortium Sdn. Bhd. (In members’ voluntary winding up)*
50% 50% To develop, construct and operate a gas-fired power plant and to generate and sell electricity. The company has not commenced its operation since the date of incorporation
Malaysia
Associate of Pelabuhan Lumut Sdn. Bhd.
Lumut Maritime Terminal Sdn. Bhd. 50% less1 share
50% less1 share
Development of an integrated privatised project encompassing ownership and operations of multi-purpose port facilities, operation and maintenance of a bulk terminal, sales and rental of port related land and other ancillary activities
Malaysia
Associate of Power and Energy International (Mauritius) Ltd.
GMR Energy Limited 30% 30% Development, operation and maintenance of power generation projects and sale of power to off-takers
India
Associates of TNB Energy Services Sdn. Bhd.
Jana Landfill Sdn. Bhd. 20% 20% Generation and distribution of heat and electricity using methane gas from landfill sites
Malaysia
SD Plantation TNBES Renewable Energy Sdn. Bhd.
49% 49% To develop, set up, construct, install, operate and maintain renewable energy or biogas power plant which uses the palm oil mill effluent as its main source of fuel
Malaysia
Associate of TNB Engineering Corporation Sdn. Bhd.
Abraj Cooling LLC 49% 49% Contracting works for the construction of district cooling plants
United Arab Emirates
Associate of TNB Properties Sdn. Bhd.
KM Metro-TNB Properties Sdn. Bhd. 40% 40% Dormant Malaysia
Associate of TNB Research Sdn. Bhd.
Gunung Tenaga Sdn. Bhd. 40% 40% Environmental services and research Malaysia

p.236
TENAGA NASIONAL BERHAD
Notes to the Financial Statements31 December 2020
9 ASSOCIATES (CONTINUED)
The list of contingent liabilities of material associates are as follows:
Potential exposure
2020RM’million
2019RM’million
GEL
(a) Corporate guarantees 329.9 344.8
(b) Bank guarantees outstanding/Letter of credit outstanding 340.9 298.7
(c) Claims against the GEL Group not acknowledged as debts 337.8 1,162.8
(d) Matters relating to income tax under dispute 4.6 50.7
(e) Disputed entry tax liabilities 81.1 84.7
(f) Disputed demand for deposit of fund setup by Water Resource Department 28.8 30.1
(g) Matters related to indirect taxes duty under disputes 32.8 34.0
(h) Dispute on relinquishment charges for modification of transmission lines granted under long term access
1.5 0
(i) Custom duties refunds 33.1 34.0
In 2010, a subsidiary of GEL was granted a refund of customs duty which was paid earlier towards the import of plant and machinery. In 2011, the subsidiary received an intimation from the Office of the Joint Director General of Foreign Trade (‘DGFT’) for cancellation of duty drawback refund order granted thereby seeking refund of the amount that has been received earlier.
In the opinion of experts, the management is confident that the duty drawback refund granted earlier was appropriate and that the cancellation of the duty drawback refund is not tenable. During the financial year ended 31 March 2015, the matter has been transferred to the Hon‘ble Supreme Court of India and will be concluded along with other similar cases and is pending finalisation.
(j) Payment of electricity duty towards Chief Electrical Inspectorate, Government of Andhra Pradesh (‘GoAP’)
42.7 44.6
The associate and a subsidiary received demands from the Chief Electrical Inspectorate, GoAP for electricity duties on generation and sale of electrical energy since the commencement of commercial operations date of its plants.
Based on internal assessment and expert legal opinion, the management of GEL is confident that the provisions of Electricity Duty Act and Rules, 1939 in respect of payment of electricity duty are not applicable to GEL.
(k) Appeals and disputes 162.8 170.2
GEL is in dispute with its fuel supplier which is currently being heard at the District Civil Court of Bangalore.
Based on independent legal opinion and internal assessment, the management of GEL is confident that it has a strong defense against these claims.
(l) Amount payable to vendors 35.4 38.5
GEL Group has an amount payable in foreign currency to certain vendors, which is outstanding for more than 3 years. The GEL Group has applied for condonation of delay with the Reserve Bank of India.
(m) General Electric International Inc (‘GE’) Arbitration 5.1 0
GEL has a remaining amount payable in foreign currency to GE for the outstanding invoices for scheduled maintenance of gas turbines. GEL is in the process of filing the application for condonation of delay with the Reserve Bank of India.
Total exposure 1,436.5 2,293.1
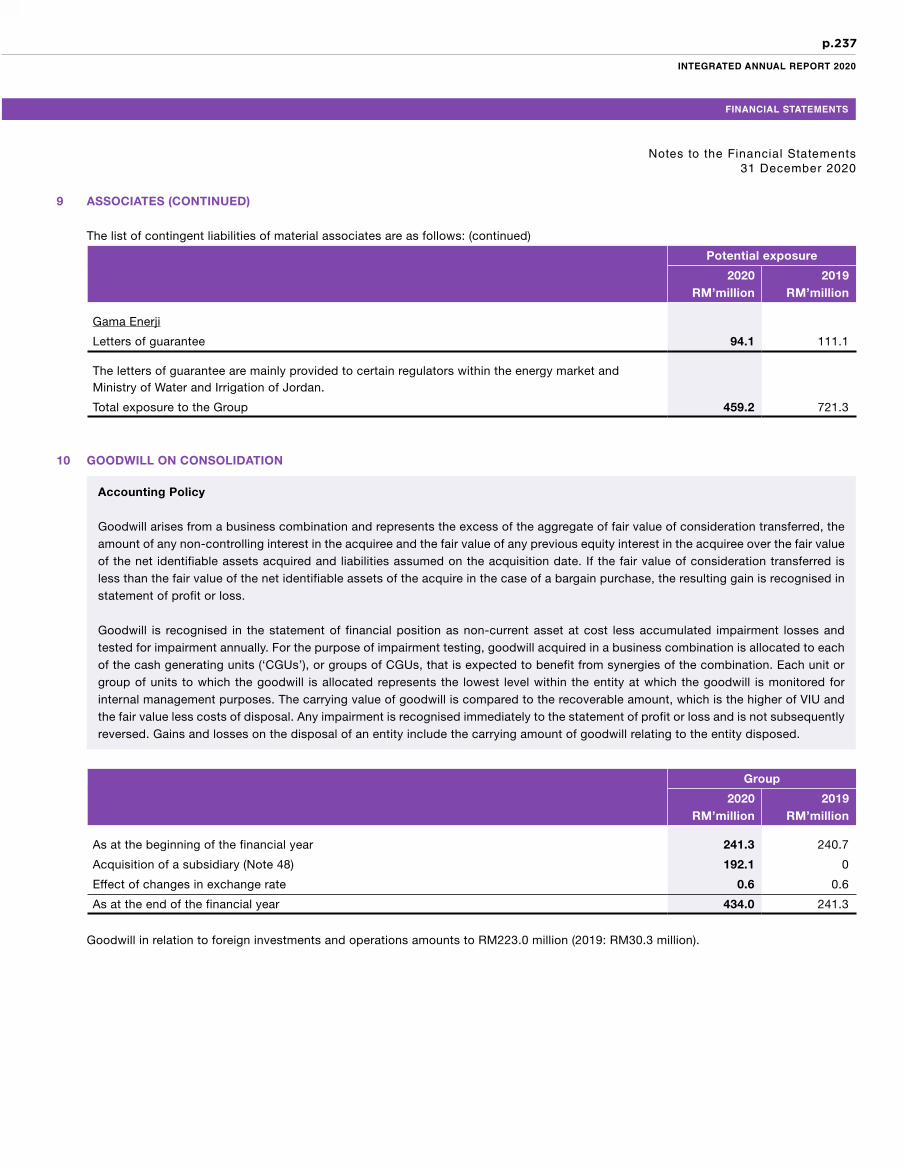
p.237
INTEGRATED ANNUAL REPORT 2020
FINANCIAL STATEMENTS
Notes to the Financial Statements31 December 2020
9 ASSOCIATES (CONTINUED)
The list of contingent liabilities of material associates are as follows: (continued)
Potential exposure
2020RM’million
2019RM’million
Gama Enerji
Letters of guarantee 94.1 111.1
The letters of guarantee are mainly provided to certain regulators within the energy market and Ministry of Water and Irrigation of Jordan.
Total exposure to the Group 459.2 721.3
10 GOODWILL ON CONSOLIDATION
Accounting Policy
Goodwill arises from a business combination and represents the excess of the aggregate of fair value of consideration transferred, the amount of any non-controlling interest in the acquiree and the fair value of any previous equity interest in the acquiree over the fair value of the net identifiable assets acquired and liabilities assumed on the acquisition date. If the fair value of consideration transferred is less than the fair value of the net identifiable assets of the acquire in the case of a bargain purchase, the resulting gain is recognised in statement of profit or loss.
Goodwill is recognised in the statement of financial position as non-current asset at cost less accumulated impairment losses and tested for impairment annually. For the purpose of impairment testing, goodwill acquired in a business combination is allocated to each of the cash generating units (‘CGUs’), or groups of CGUs, that is expected to benefit from synergies of the combination. Each unit or group of units to which the goodwill is allocated represents the lowest level within the entity at which the goodwill is monitored for internal management purposes. The carrying value of goodwill is compared to the recoverable amount, which is the higher of VIU and the fair value less costs of disposal. Any impairment is recognised immediately to the statement of profit or loss and is not subsequently reversed. Gains and losses on the disposal of an entity include the carrying amount of goodwill relating to the entity disposed.
Group
2020RM’million
2019RM’million
As at the beginning of the financial year 241.3 240.7
Acquisition of a subsidiary (Note 48) 192.1 0
Effect of changes in exchange rate 0.6 0.6
As at the end of the financial year 434.0 241.3
Goodwill in relation to foreign investments and operations amounts to RM223.0 million (2019: RM30.3 million).

p.238
TENAGA NASIONAL BERHAD
Notes to the Financial Statements31 December 2020
10 GOODWILL ON CONSOLIDATION (CONTINUED)
Impairment assessment for goodwill
Goodwill is tested for impairment on annual basis. The carrying value of goodwill is allocated to the Group’s CGUs. The recoverable amount of the CGU including goodwill, is determined based on its VIU. This VIU calculation applies a discounted cash flow model using cash flow projections based on forecast approved by management. The forecasts reflect management’s expectations of revenue growth, operating costs and margins for the CGUs based on current assessment of market share, expectations of market and industry growth.
The discount rate applied to the cash flow forecast refers to the industry’s pre-tax Weighted Average Cost of Capital (‘WACC’).
(i) Local investments and operations goodwill
The discounted cash flow model used cash flow projections which covered a five-year period and cash flows beyond the projection years are extrapolated using an estimated terminal growth rate.
The following key assumptions have been applied in the VIU calculation:
2020%
2019%
Revenue growth rate 3.3 2.6
Pre-tax discount rate 7.1 9.9
Terminal growth rate 3.3 2.6
Based on the Group’s assessment, no impairment losses were required as at 31 December 2020 as the recoverable amount exceeded the carrying amount.
The Group’s review includes an impact assessment of changes in key assumptions used. Based on the sensitivity analysis performed, it was concluded that no reasonable change in the base case assumptions would cause the carrying amount of the CGU to exceed its recoverable amount.
(ii) Foreign investments and operations goodwill
The discounted cash flow model used cash flow projections which covered a thirty-year period.
The following key assumptions has been applied in the VIU calculation:
2020%
Revenue growth rate (0.8)
Pre-tax discount rate 5.8
Based on the Group’s assessment, no impairment losses were required as at 31 December 2020 as the recoverable amount exceeded the carrying amount.
The Group’s review includes an impact assessment of changes in key assumptions used. The effects of the movement in the key assumptions to the recoverable amount are as follows:
Changes inassumptions
Impact on recoverable amount
IncreaseRM’million
DecreaseRM’million
2020
Revenue growth rate 1.0% 37.8 (37.8)
Pre-tax discount rate 1.0% (227.4) 262.4

p.239
INTEGRATED ANNUAL REPORT 2020
FINANCIAL STATEMENTS
Notes to the Financial Statements31 December 2020
11 INVESTMENT IN UNQUOTED DEBT SECURITIES
Accounting Policy
Investment in unquoted debt securities are financial instruments and the accounting policy is disclosed in Note 46.
Group Company
Note 2020RM’million
2019RM’million
2020RM’million
2019RM’million
Unsecured Loan Notes 253.4 12.0 253.4 12.0
Less: Loss allowance (37.6) 0 (37.6) 0
(a) 215.8 12.0 215.8 12.0
Sukuk Prihatin (b) 50.0 0 50.0 0
Preferred Equity Certificate (‘PEC’) (c) 0 319.8 0 0
Total 265.8 331.8 265.8 12.0
(a) The Unsecured Loan Notes primarily related to the Islamic Medium Term Notes (‘MTN’) facility subscription with a maturity period of 14 years and mature on 5 May 2034.
(b) The Sukuk Prihatin, issued by the Government, is a Commodity Murabahah (via Tawarruq) with a maturity period of 2 years and mature on 22 September 2022. The profit rate is fixed at 2.0% per annum.
(c) Upon acquisition of additional 5.0% equity interest in VSI, the Group obtained control of VSI and therefore the PEC which was previously held by the Group as an investment in unquoted debt securities was eliminated during the current financial year. The PEC bears an interest of 8.0% per annum and has a maturity period of 30 years up to year 2047.
Credit risks relating to debt instruments above are disclosed in Note 46(b) of the financial statements.
12 DEFERRED TAXATION
Accounting Policy
Deferred tax is recognised on temporary difference arising between the tax bases of assets and liabilities and their carrying amounts in the financial statements including those arising from business combinations. Deferred tax is not recognised on goodwill and those arising from initial recognition of an asset or liability which at the time of the transaction affects neither accounting nor taxable profit or loss.
Deferred tax assets are recognised to the extent that it is probable that taxable profit will be available against which the deductible temporary differences, unused tax losses and unutilised tax credits can be utilised. Deferred tax is recognised on temporary differences arising on investment in subsidiaries, joint ventures and associates except where the timing of the reversal of the temporary difference can be controlled and it is probable that the temporary differences will not reverse in the foreseeable future.
Tax benefit from reinvestment allowance is recognised when the tax credit is utilised and no deferred tax asset is recognised when the tax credit is receivable.
Deferred tax is measured at the tax rates (and laws) that have been enacted or substantially enacted at the end of the reporting period and are expected to apply when the related deferred tax asset is realised or the deferred tax liability is settled.

p.240
TENAGA NASIONAL BERHAD
Notes to the Financial Statements31 December 2020
12 DEFERRED TAXATION (CONTINUED)
Deferred tax assets and liabilities are offset when there is a legally enforceable right to set off current tax assets against current tax liabilities and when the deferred taxes relate to the same tax authority. The following amounts, determined after appropriate offsetting, are shown in the statement of financial position:
Group Company
2020RM’million
2019RM’million
2020RM’million
2019RM’million
Deferred tax assets:
- Deferred tax assets to be realised after more than 12 months 50.1 84.3 0 0
- Deferred tax assets to be realised within 12 months 80.9 40.0 0 0
131.0 124.3 0 0
Deferred tax liabilities:
- Deferred tax liabilities to be settled after more than 12 months (7,203.8) (7,353.0) (5,429.0) (6,034.5)
- Deferred tax liabilities to be settled within 12 months (602.0) (430.0) (577.9) (451.9)
(7,805.8) (7,783.0) (6,006.9) (6,486.4)
Deferred tax assets 131.0 124.3 0 0
Deferred tax liabilities (7,805.8) (7,783.0) (6,006.9) (6,486.4)
Net total (7,674.8) (7,658.7) (6,006.9) (6,486.4)
The movements during the financial year relating to deferred tax are as follows:
Group Company
2020RM’million
2019RM’million
2020RM’million
2019RM’million
As at the beginning of the financial year (7,658.7) (7,921.6) (6,486.4) (6,665.4)
(Charged)/Credited to statement of profit or loss: (Note 39)
- Property, plant and equipment (2,214.6) (874.3) (495.4) (358.4)
- Provisions and allowances 1,802.6 488.2 42.8 (12.9)
- Contract assets 45.1 (16.7) 45.1 (16.7)
- Lease liabilities 269.5 292.7 345.4 194.5
(97.4) (110.1) (62.1) (193.5)
Credited to OCI:
- Provisions and allowances 127.3 373.0 127.3 372.5
Transfer as part of internal reorganisation 0 0 414.3 0
Acquisition of a subsidiary (Note 48) (46.0) 0 0 0
As at the end of the financial year (7,674.8) (7,658.7) (6,006.9) (6,486.4)
Subject to income tax
Deferred tax assets (before offsetting):
- Provisions and allowances 7,402.3 5,472.4 3,765.7 3,595.6
- Lease liabilities 15.9 0 0 0
- Property, plant and equipment 68.8 56.5 0 0
Offsetting (7,356.0) (5,404.6) (3,765.7) (3,595.6)
Deferred tax assets (after offsetting) 131.0 124.3 0 0

p.241
INTEGRATED ANNUAL REPORT 2020
FINANCIAL STATEMENTS
Notes to the Financial Statements31 December 2020
12 DEFERRED TAXATION (CONTINUED)
The movements during the financial year relating to deferred tax are as follows: (continued)
Group Company
2020RM’million
2019RM’million
2020RM’million
2019RM’million
Deferred tax liabilities (before offsetting):
- Property, plant and equipment (13,756.5) (11,483.6) (8,545.2) (8,464.1)
- Contract assets (759.6) (804.7) (759.6) (804.7)
- Lease liabilities (645.7) (899.3) (467.8) (813.2)
Offsetting 7,356.0 5,404.6 3,765.7 3,595.6
Deferred tax liabilities (after offsetting) (7,805.8) (7,783.0) (6,006.9) (6,486.4)
The amount of deductible temporary differences, unused tax losses, reinvestment allowance and investment tax allowance for which no deferred tax assets are recognised in the statement of financial position are as follows:
Group Company
2020RM’million
2019RM’million
2020RM’million
2019RM’million
Deductible temporary differences 924.3 1,215.4 0 0
Tax losses* 2,316.9 1,408.6 0 0
Reinvestment allowance and investment tax allowance 5,350.4 5,328.9 0 0
No deferred tax assets are recognised from the above due to uncertainty of their recoverability. The unabsorbed capital allowances and investment tax allowance do not expired under current tax legislation.
* The unutilised tax losses arising from a year of assessment (‘YA’) are allowed to be carried forward for utilisation up to 7 consecutive YAs from that YA. In addition, any accumulated unabsorbed tax losses brought forward from YA2018 can only be utilised until YA2025.
13 LONG TERM RECEIVABLES
Accounting Policy
Long term receivables is a financial instrument and the accounting policy is disclosed in Note 46.
Group Company
Note 2020RM’million
2019RM’million
2020RM’million
2019RM’million
Financial asset
- Other receivables (a) 89.2 115.6 68.2 95.5
Less: Loss allowances (16.5) (23.8) (16.5) (23.8)
72.7 91.8 51.7 71.7
Non-financial assets
- Advance payment to contractors (b) 0.3 14.6 0 0
- Indirect tax (c) 154.8 619.6 0 0
- Prepayment 0 14.0 0 0
227.8 740.0 51.7 71.7
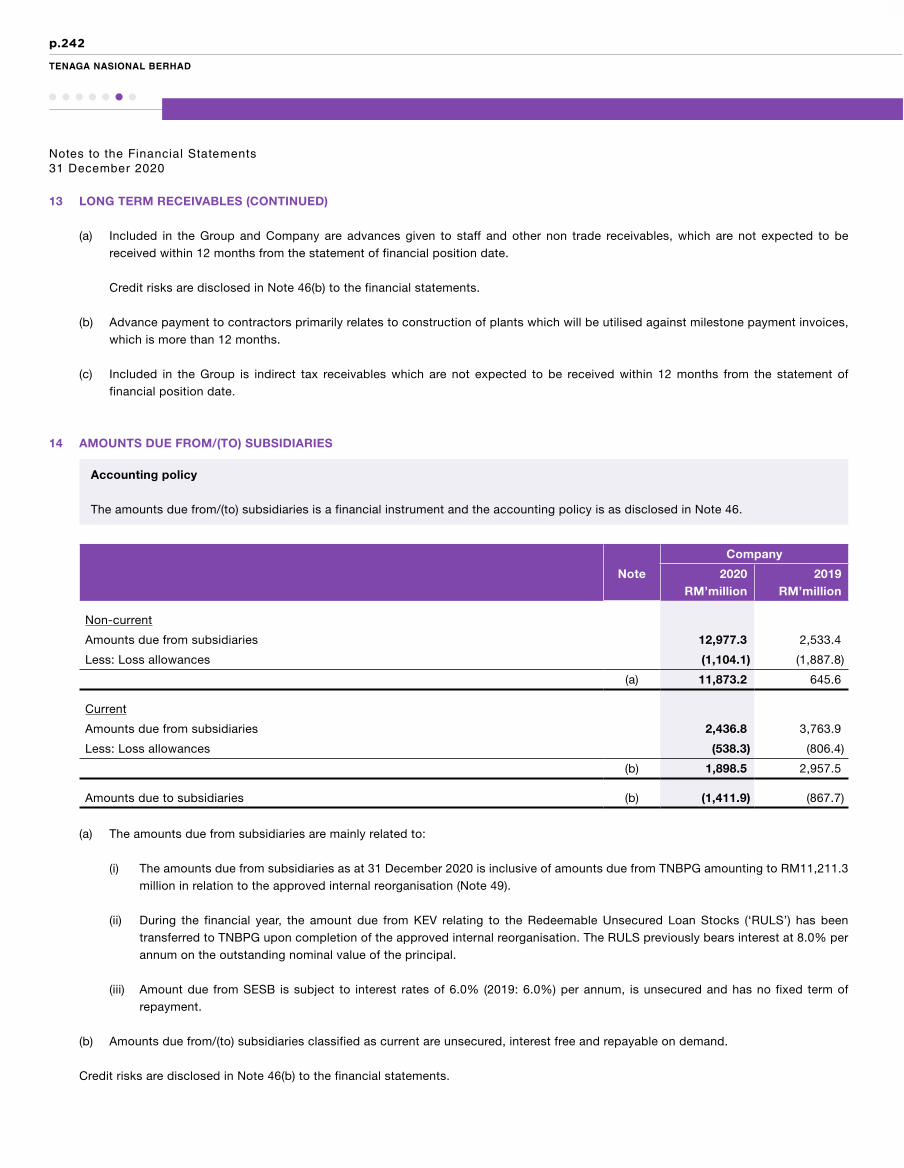
p.242
TENAGA NASIONAL BERHAD
Notes to the Financial Statements31 December 2020
13 LONG TERM RECEIVABLES (CONTINUED)
(a) Included in the Group and Company are advances given to staff and other non trade receivables, which are not expected to be received within 12 months from the statement of financial position date.
Credit risks are disclosed in Note 46(b) to the financial statements.
(b) Advance payment to contractors primarily relates to construction of plants which will be utilised against milestone payment invoices, which is more than 12 months.
(c) Included in the Group is indirect tax receivables which are not expected to be received within 12 months from the statement of financial position date.
14 AMOUNTS DUE FROM/(TO) SUBSIDIARIES
Accounting policy
The amounts due from/(to) subsidiaries is a financial instrument and the accounting policy is as disclosed in Note 46.
Company
Note 2020RM’million
2019RM’million
Non-current
Amounts due from subsidiaries 12,977.3 2,533.4
Less: Loss allowances (1,104.1) (1,887.8)
(a) 11,873.2 645.6
Current
Amounts due from subsidiaries 2,436.8 3,763.9
Less: Loss allowances (538.3) (806.4)
(b) 1,898.5 2,957.5
Amounts due to subsidiaries (b) (1,411.9) (867.7)
(a) The amounts due from subsidiaries are mainly related to:
(i) The amounts due from subsidiaries as at 31 December 2020 is inclusive of amounts due from TNBPG amounting to RM11,211.3 million in relation to the approved internal reorganisation (Note 49).
(ii) During the financial year, the amount due from KEV relating to the Redeemable Unsecured Loan Stocks (‘RULS’) has been transferred to TNBPG upon completion of the approved internal reorganisation. The RULS previously bears interest at 8.0% per annum on the outstanding nominal value of the principal.
(iii) Amount due from SESB is subject to interest rates of 6.0% (2019: 6.0%) per annum, is unsecured and has no fixed term of repayment.
(b) Amounts due from/(to) subsidiaries classified as current are unsecured, interest free and repayable on demand.
Credit risks are disclosed in Note 46(b) to the financial statements.

p.243
INTEGRATED ANNUAL REPORT 2020
FINANCIAL STATEMENTS
Notes to the Financial Statements31 December 2020
15 LEASES
Accounting Policy
(a) The Group and Company as lessors
When the Group and Company act as lessors, they determine at lease inception whether each lease is a finance lease or an operating lease.
To classify each lease, the Group and Company make an overall assessment of whether the lease transfers substantially all of the risks and rewards incidental to ownership of the underlying asset. If this is the case, then the lease is a finance lease; otherwise, then it is an operating lease.
Operating leases Leases where the Group and Company retain substantially all the risks and rewards of ownership of the leased assets are
classified as operating leases. The Group and Company recognise lease payments received under operating leases as operating income on a straight-line basis over the lease term.
Finance leases If the Group and Company transfer substantially all the risks and rewards incidental to ownership of the leased assets, leases are
classified as finance leases. The Group and Company derecognise the leased assets and recognise the net investment in the lease as a receivable. The difference between the gross receivable and the present value of the receivable is recognised as unearned finance income. Lease income is recognised over the term of the lease using the net investment method, which reflects a constant periodic rate of return.
(b) The Group and Company as lessees
The accounting policy on ROU assets and lease liabilities for lessees are disclosed in Note 6.
(a) Finance lease receivables
The Group’s finance lease receivables arise predominantly from Cooling Energy Supply Agreement (‘CESA’) and Energy Performance Contract (‘EPC’).
Group
Minimum lease paymentsPresent value of minimum
lease payments
2020RM’million
2019RM’million
2020RM’million
2019RM’million
Within 1 year 2.2 2.4 1.1 1.0
After 1 year and not later than 2 years 2.5 2.7 1.4 1.5
After 2 years and not later than 3 years 2.0 2.6 1.2 1.7
After 3 years and not later than 4 years 2.0 2.1 1.3 1.3
After 4 years and not later than 5 years 2.0 2.0 1.5 1.3
After 5 years 5.7 7.5 4.7 6.1
14.2 16.9 10.1 11.9
16.4 19.3 11.2 12.9
Less: Unearned finance income (5.2) (6.4)
Present value of minimum lease payment receivable 11.2 12.9
The effective interest rate implicit in the finance lease is approximately 9.5% (2019: 9.5%). The carrying amount of the finance lease receivables approximate to their fair value.

p.244
TENAGA NASIONAL BERHAD
Notes to the Financial Statements31 December 2020
15 LEASES (CONTINUED)
(b) Lease liabilities
Group Company
Note 2020RM’million
2019RM’million
2020RM’million
2019RM’million
Lease liabilities (i) 28,728.4 31,303.8 65,519.1 67,438.9
Hire purchase creditors (ii) 0.4 2.3 0 0
28,728.8 31,306.1 65,519.1 67,438.9
(i) The Group and Company’s obligations under lease liabilities arise predominantly from the power purchase agreements with several Independent Power Producers (‘IPP’).
Group Company
2020RM’million
2019RM’million
2020RM’million
2019RM’million
Minimum lease payments:
- Within 1 year 4,689.8 4,968.8 9,300.5 8,734.2
- After 1 year and not later than 2 years 3,848.0 4,076.5 7,450.9 7,453.1
- After 2 years and not later than 3 years 3,628.6 3,886.2 6,428.1 6,992.1
- After 3 years and not later than 4 years 2,985.0 3,372.7 6,281.2 6,229.5
- After 4 years and not later than 5 years 2,837.9 2,985.0 6,069.7 6,106.5
- After 5 years 21,543.3 24,385.3 69,923.9 75,370.8
34,842.8 38,705.7 96,153.8 102,152.0
Total minimum lease payments 39,532.6 43,674.5 105,454.3 110,886.2
Future finance charges (10,804.2) (12,370.7) (39,935.2) (43,447.3)
28,728.4 31,303.8 65,519.1 67,438.9
Amount payable under lease liabilities:
- Within 1 year 3,257.4 3,401.3 5,611.4 4,904.5
- After 1 year and not later than 2 years 2,547.6 2,645.2 3,999.2 3,835.9
- After 2 years and not later than 3 years 2,452.4 2,585.7 3,169.9 3,588.5
- After 3 years and not later than 4 years 1,919.5 2,196.4 3,196.6 3,007.1
- After 4 years and not later than 5 years 1,869.8 1,919.5 3,155.3 3,049.7
- After 5 years 16,681.7 18,555.7 46,386.7 49,053.2
25,471.0 27,902.5 59,907.7 62,534.4
28,728.4 31,303.8 65,519.1 67,438.9
The weighted average effective interest rate applicable to the lease liabilities as at the financial year end for Group and Company is 5.3% (2019: 5.5%) and 5.9% (2019: 5.9%) per annum respectively. The carrying amounts of the lease liabilities approximate to their fair values.

p.245
INTEGRATED ANNUAL REPORT 2020
FINANCIAL STATEMENTS
Notes to the Financial Statements31 December 2020
15 LEASES (CONTINUED)
(b) Lease liabilities (continued)
(ii) This represents future instalments under hire purchase of motor vehicles, repayable as follows:
Group
2020RM’million
2019RM’million
Minimum lease payments:
- Within 1 year 0.4 2.0
- After 1 year and not later than 2 years 0 0.4
Total minimum lease payments 0.4 2.4
Future finance charges 0 (0.1)
0.4 2.3
Amount payable under hire purchase:
- Within 1 year 0.4 2.0
- After 1 year and not later than 2 years 0 0.3
0.4 2.3
Hire purchase creditors are effectively secured as the rights to the leased assets revert to the lessors in the event of default.
The weighted average effective interest rate applicable to the hire purchase creditors as at the financial year end is 5.0% (2019: 5.1%) per annum and interest for the financial year is at 2.7% (2019: 2.7%) per annum for the Group. The carrying amounts of the hire purchase payables approximate to their fair values.
Reconciliation of lease liabilities during the financial year is as follows:
Group Company
2020RM’million
2019RM’million
2020RM’million
2019RM’million
As at the beginning of the financial year 31,306.1 34,577.6 67,438.9 58,169.3
Cash flows (4,335.9) (4,972.0) (7,298.6) (7,392.0)
Non-cash changes
- Additional lease 120.4 4.4 1,888.3 13,532.4
- Acquisition of subsidiary (Note 48) 175.0 0 0 0
- Transfer to payables (123.3) (31.1) (374.4) (141.1)
- Finance charges (Note 38(b)) 1,587.9 1,727.2 3,864.9 3,270.3
- Reclassification of liabilities directly associated with assets classified as held for sale (Note 22) (1.4) 0 0 0
As at the end of the financial year 28,728.8 31,306.1 65,519.1 67,438.9

p.246
TENAGA NASIONAL BERHAD
Notes to the Financial Statements31 December 2020
15 LEASES (CONTINUED)
The statement of profit or loss includes the following amounts relating to leases:
Group Company
2020RM’million
2019RM’million
2020RM’million
2019RM’million
Depreciation charge of ROU assets (Note 6) 3,625.1 3,767.2 5,465.5 5,093.6
Finance charges (Note 38(b)) 1,587.9 1,727.2 3,864.9 3,270.3
Expense relating to leases of low-value assets (Note 34) 25.3 17.3 24.4 16.8
Expense relating to variable lease payments not included in lease liabilities 231.5 720.0 139.2 24.1
The Group and Company’s total cash outflows for leases were RM4,335.9 million (2019: RM4,972.0 million) and RM7,298.6 million (2019: RM7,392.0 million) respectively.
16 FINANCIAL ASSETS AT FVOCI
Accounting Policy
Financial assets at FVOCI are financial instruments and the accounting policy is disclosed in Note 46.
Group Company
2020RM’million
2019RM’million
2020RM’million
2019RM’million
Financial assets at FVOCI 57.6 58.9 56.9 58.2
The Group and Company have irrevocably elected non-trading equity securities above at initial recognition to present its fair value changes in OCI. The Group and Company consider this classification to be more relevant as these instruments are strategic investments of the Group and Company and not held for trading purposes.
During the financial year, no dividend income was recognised and no investment was disposed. The details of the financial assets at FVOCI are as follows:
Group Company
2020RM’million
2019RM’million
2020RM’million
2019RM’million
Labuan Reinsurance (L) Ltd. 56.9 58.2 56.9 58.2
Al-Imtiaz Operation and Maintenance Company Ltd. 0.4 0.4 0 0
Club Memberships
- Sultan Salahuddin Abdul Aziz Shah Club 0.1 0.1 0 0
- Glenmarie Gold Country Club 0.1 0.1 0 0
- Leisure Holidays Bhd 0.1 0.1 0 0

p.247
INTEGRATED ANNUAL REPORT 2020
FINANCIAL STATEMENTS
Notes to the Financial Statements31 December 2020
17 FINANCIAL ASSETS AT FVTPL
Accounting Policy
Financial assets at FVTPL are financial instruments and the accounting policy is disclosed in Note 46.
Group Company
2020RM’million
2019RM’million
2020RM’million
2019RM’million
Financial assets at FVTPL 7,114.4 8,109.0 5,326.6 7,334.4
Current 6,973.9 7,959.9 5,244.3 7,248.1
Non-current 140.5 149.1 82.3 86.3
7,114.4 8,109.0 5,326.6 7,334.4
Financial assets at FVTPL mainly represent investments in unit trusts and students’ loan.
Credit risks relating to financial assets at FVTPL are disclosed in Note 46(b) to the financial statements.
18 INVENTORIES
Accounting Policy
Inventories are stated at the lower of cost and net realisable value.
Cost of work-in-progress and finished goods comprise raw materials, direct labour and a proportion of the production overheads. Cost is determined on the weighted average basis and comprises all costs of purchase and other costs incurred in bringing the inventories to their present location and condition.
Net realisable value is the estimated selling price in the ordinary course of business, less the costs of completion and selling expenses.
Group Company
2020RM’million
2019RM’million
2020RM’million
2019RM’million
Fuel and consumables 1,559.8 1,885.6 376.5 491.9
Work-in-progress 14.0 23.7 0 0
Finished goods 10.0 16.0 0 0
1,583.8 1,925.3 376.5 491.9

p.248
TENAGA NASIONAL BERHAD
Notes to the Financial Statements31 December 2020
19 RECEIVABLES, DEPOSITS AND PREPAYMENTS
Accounting Policy
Trade and other receivables are amounts due from customers for goods sold or services performed in the ordinary course of business. Other receivables generally arise from transactions outside the usual operating activities of the Group and Company. If collection is expected in one year or less (or in the normal operating cycle of the business if longer), they are classified as current assets. If not, they are presented as non-current assets.
Trade and other receivables are recognised initially at fair value, which is the amount of consideration that is unconditional unless they contain significant financing components. The Group and Company hold the trade receivables with the objective to collect the contractual cash flows and therefore measures them subsequently at amortised cost less accumulated impairment losses. The impairment is determined based on the ECL model and is further disclosed in Note 46.
Group Company
Note 2020RM’million
2019RM’million
2020RM’million
2019RM’million
Trade receivables 5,450.7 5,181.5 4,563.5 3,861.4
Staff advances/loans 58.5 49.9 42.9 44.1
Deposits and prepayments (a) 1,825.2 590.9 1,586.6 406.4
Other receivables 416.8 400.3 20.4 256.1
Rechargeable job orders debtors (b) 1,452.3 392.9 1,296.0 319.7
Partial payment to contractors 21.0 39.6 0 16.3
9,224.5 6,655.1 7,509.4 4,904.0
Impairment losses on:
- Trade receivables (Note 46 (b)(i)) (2,139.5) (1,766.0) (2,011.2) (1,677.8)
- Others (Note 46 (b)(iii)) (191.3) (128.6) (114.5) (98.8)
(2,330.8) (1,894.6) (2,125.7) (1,776.6)
6,893.7 4,760.5 5,383.7 3,127.4
The Group and Company’s credit policies provide trade receivables with a range between 30 days to 90 days (2019: 30 days to 90 days) credit period.
Credit risks relating to receivables are disclosed in Note 46(b)(i) to the financial statements.
(a) Included in deposits and prepayments of the Group and Company is the recoverable amount of contractual obligation of RM1,161.4 million (2019: RM Nil) on the shortfall of committed gas volume to be consumed by the power sector under the Gas Framework Agreement, which can be utilised to offset against future purchases of gas over and above the committed volume.
(b) Included in rechargeable job orders debtors of the Group and Company is an amount due from the Government amounting to RM1,084.0 million (2019: RM Nil) for the sales discount given to the customers.
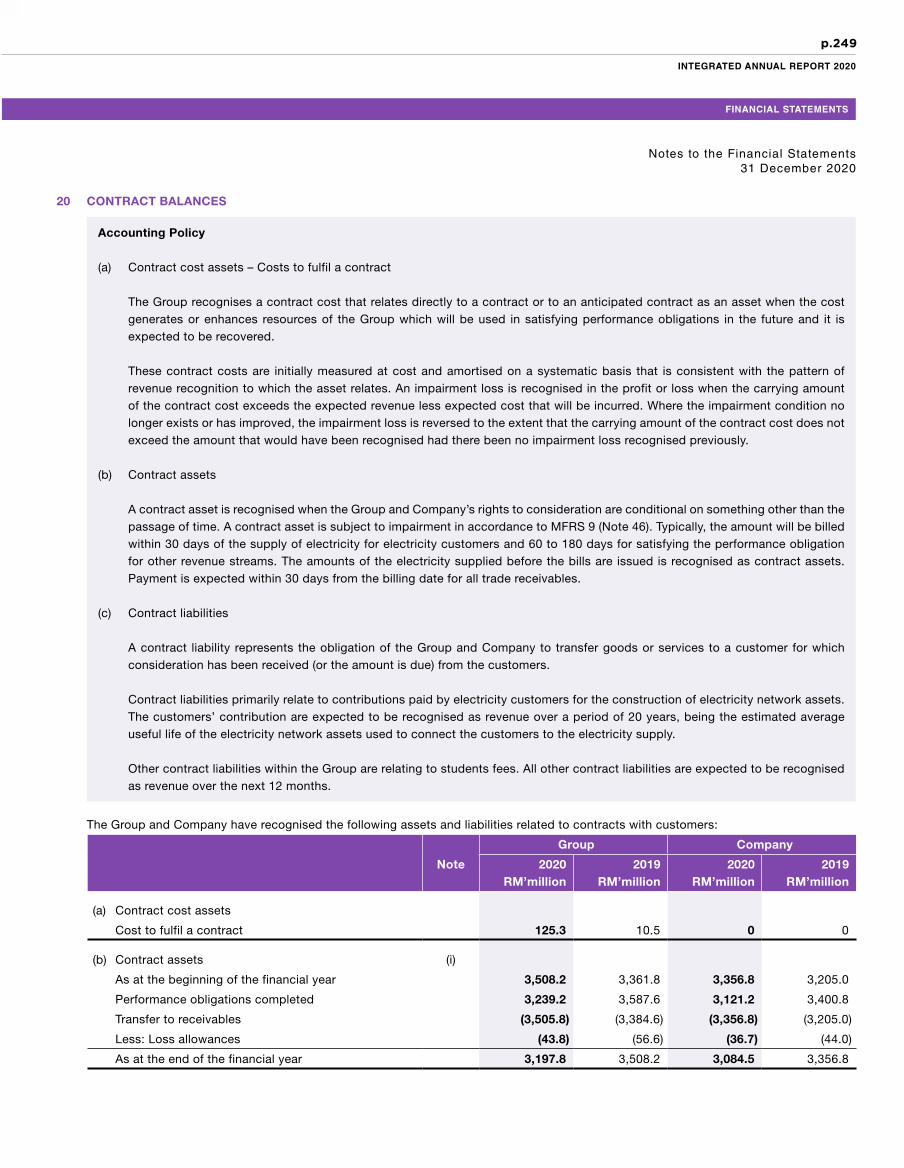
p.249
INTEGRATED ANNUAL REPORT 2020
FINANCIAL STATEMENTS
Notes to the Financial Statements31 December 2020
20 CONTRACT BALANCES
Accounting Policy
(a) Contract cost assets – Costs to fulfil a contract
The Group recognises a contract cost that relates directly to a contract or to an anticipated contract as an asset when the cost generates or enhances resources of the Group which will be used in satisfying performance obligations in the future and it is expected to be recovered.
These contract costs are initially measured at cost and amortised on a systematic basis that is consistent with the pattern of revenue recognition to which the asset relates. An impairment loss is recognised in the profit or loss when the carrying amount of the contract cost exceeds the expected revenue less expected cost that will be incurred. Where the impairment condition no longer exists or has improved, the impairment loss is reversed to the extent that the carrying amount of the contract cost does not exceed the amount that would have been recognised had there been no impairment loss recognised previously.
(b) Contract assets
A contract asset is recognised when the Group and Company’s rights to consideration are conditional on something other than the passage of time. A contract asset is subject to impairment in accordance to MFRS 9 (Note 46). Typically, the amount will be billed within 30 days of the supply of electricity for electricity customers and 60 to 180 days for satisfying the performance obligation for other revenue streams. The amounts of the electricity supplied before the bills are issued is recognised as contract assets. Payment is expected within 30 days from the billing date for all trade receivables.
(c) Contract liabilities
A contract liability represents the obligation of the Group and Company to transfer goods or services to a customer for which consideration has been received (or the amount is due) from the customers.
Contract liabilities primarily relate to contributions paid by electricity customers for the construction of electricity network assets. The customers’ contribution are expected to be recognised as revenue over a period of 20 years, being the estimated average useful life of the electricity network assets used to connect the customers to the electricity supply.
Other contract liabilities within the Group are relating to students fees. All other contract liabilities are expected to be recognised as revenue over the next 12 months.
The Group and Company have recognised the following assets and liabilities related to contracts with customers:
Group Company
Note 2020RM’million
2019RM’million
2020RM’million
2019RM’million
(a) Contract cost assets
Cost to fulfil a contract 125.3 10.5 0 0
(b) Contract assets (i)
As at the beginning of the financial year 3,508.2 3,361.8 3,356.8 3,205.0
Performance obligations completed 3,239.2 3,587.6 3,121.2 3,400.8
Transfer to receivables (3,505.8) (3,384.6) (3,356.8) (3,205.0)
Less: Loss allowances (43.8) (56.6) (36.7) (44.0)
As at the end of the financial year 3,197.8 3,508.2 3,084.5 3,356.8

p.250
TENAGA NASIONAL BERHAD
Notes to the Financial Statements31 December 2020
20 CONTRACT BALANCES (CONTINUED)
The Group and Company have recognised the following assets and liabilities related to contracts with customers: (continued)
Group Company
Note 2020RM’million
2019RM’million
2020RM’million
2019RM’million
(c) Contract liabilities (i),(ii)
As at the beginning of the financial year 3,784.4 3,250.3 2,990.1 2,582.8
Received during the financial year 938.6 1,136.0 527.1 636.6
Release to statement of profit or loss:
- Customers’ contribution (283.0) (271.5) (237.0) (229.3)
- Deferred income (265.8) (330.4) 0 0
As at the end of the financial year 4,174.2 3,784.4 3,280.2 2,990.1
Group Company
2020RM’million
2019RM’million
2020RM’million
2019RM’million
Contract liabilities can be analysed as follows:
- Realised within 12 months 420.5 354.4 259.3 281.1
- Realised after 12 months 3,753.7 3,430.0 3,020.9 2,709.0
4,174.2 3,784.4 3,280.2 2,990.1
(i) Significant changes in contract assets and liabilities
Contract assets have increased as the Group and Company have provided more services ahead of the agreed payment schedules for fixed-price contracts. The Group and Company also recognised a loss allowance for contract assets.
Contract liabilities have increased for the Group and Company due to larger prepayments or contributions received from customers.
(ii) Revenue recognised in relation to contract liabilities
The following table shows how much of the revenue recognised in the current financial year relates to carried-forward contract liabilities and how much relates to performance obligations that were satisfied in a prior financial year:
Group Company
2020RM’million
2019RM’million
2020RM’million
2019RM’million
Revenue recognised, included in the contract liabilities balances in relation to preceding year (369.4) (375.0) (229.2) (222.3)
Revenue recognised, included in the contract liabilities balances in relation to current year (179.4) (226.9) (7.8) (7.0)
(548.8) (601.9) (237.0) (229.3)

p.251
INTEGRATED ANNUAL REPORT 2020
FINANCIAL STATEMENTS
Notes to the Financial Statements31 December 2020
20 CONTRACT BALANCES (CONTINUED)
(iii) Unsatisfied performance obligations in long term contracts
The following table shows unsatisfied performance obligations resulting from long term contracts:
Group Company
2020RM’million
2019RM’million
2020RM’million
2019RM’million
Aggregate amount of the transaction price allocated to contracts that are partially or fully unsatisfied 4,174.2 3,784.4 3,280.2 2,990.1
Management expects 7.9% (2019: 9.4%) of the transaction price allocated to the unsatisfied contracts will be recognised as revenue during the next financial year. The remaining 92.1% (2019: 90.6%) will be recognised from financial years 2021 to 2040.
In respect of the supply of electricity, the Group and Company applied the practical expedient to not disclose information related to the transaction price allocated to the remaining performance obligations, on the basis that revenue is recognised from the satisfaction of the performance obligations upon the consumption of electricity by the customers.
All contracts for period of one year or less are billed based on services provided. The transaction price allocated to these unsatisfied contracts is not disclosed.
21 DEPOSITS, BANK AND CASH BALANCES
Accounting Policy
For the purpose of the consolidated statement of cash flows, cash equivalents are held for the purpose of meeting short term cash commitments rather than for investment or other purposes. Cash and cash equivalents comprise cash in hand, deposits held at call with financial institutions, other short term investments with original maturity of 3 months or less that are readily convertible to known amounts of cash and which are subject to an insignificant risk of changes in value, and bank overdrafts. In the statement of financial position, bank overdrafts are shown within borrowings in current liabilities.
Group Company
2020RM’million
2019RM’million
2020RM’million
2019RM’million
Cash in hand and at bank 2,520.1 1,943.4 350.8 277.1
Deposits with licensed banks and financial institution 3,921.4 4,348.3 2,044.2 2,470.2
6,441.5 6,291.7 2,395.0 2,747.3
The interest rates per annum of bank balances and deposits with licensed banks that were effective as at the end of the reporting date were as follows:
Group Company
2020%
2019%
2020%
2019%
Bank balances 0.1 – 1.7 0.1 – 3.3 0.1 – 1.7 0.1 – 3.3
Deposits with licensed banks and financial institution 0.1 – 3.2 0.6 – 3.7 0.1 – 2.3 0.6 – 2.9
Deposits with licensed banks have maturity periods ranging from 1 to 365 days (2019: 1 to 365 days) for the Group and 1 to 90 days (2019: 1 to 336 days) for the Company.
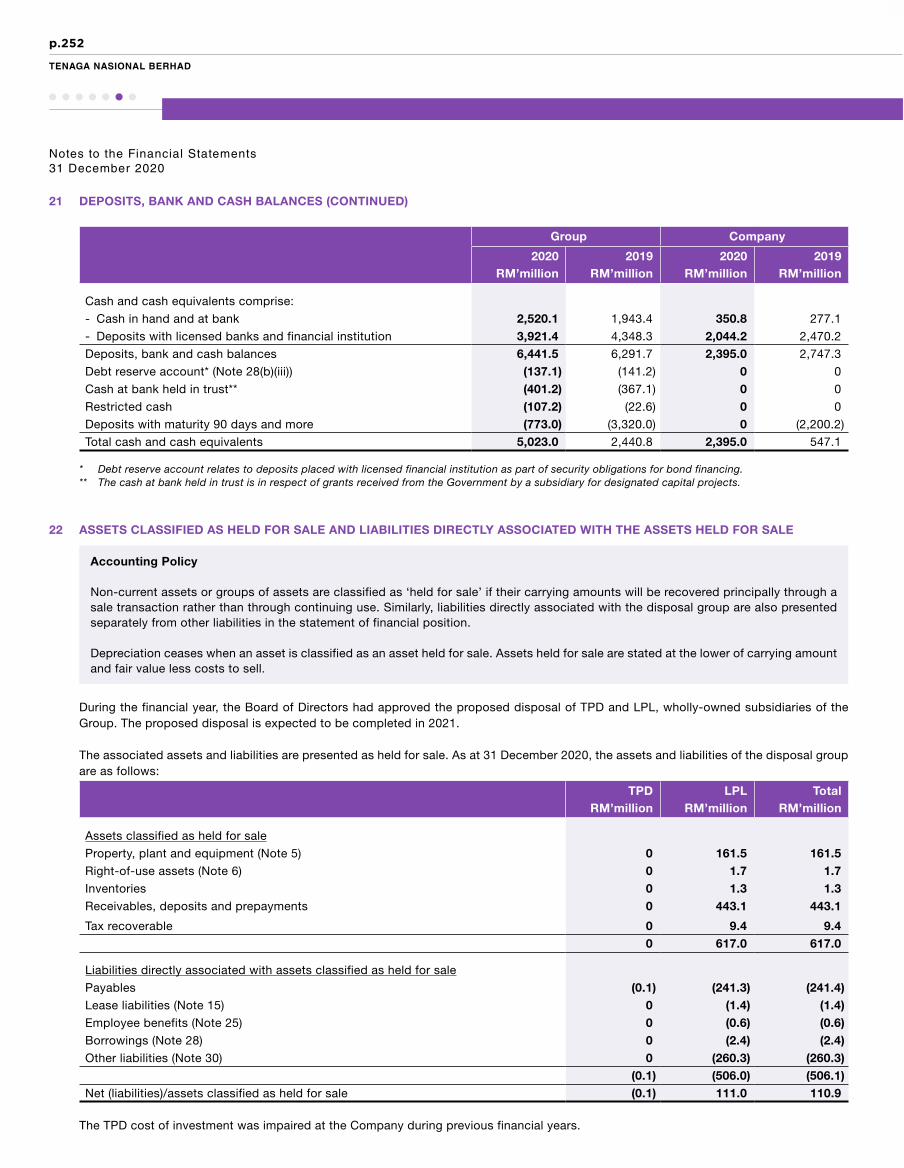
p.252
TENAGA NASIONAL BERHAD
Notes to the Financial Statements31 December 2020
21 DEPOSITS, BANK AND CASH BALANCES (CONTINUED)
Group Company
2020RM’million
2019RM’million
2020RM’million
2019RM’million
Cash and cash equivalents comprise:
- Cash in hand and at bank 2,520.1 1,943.4 350.8 277.1
- Deposits with licensed banks and financial institution 3,921.4 4,348.3 2,044.2 2,470.2
Deposits, bank and cash balances 6,441.5 6,291.7 2,395.0 2,747.3
Debt reserve account* (Note 28(b)(iii)) (137.1) (141.2) 0 0
Cash at bank held in trust** (401.2) (367.1) 0 0
Restricted cash (107.2) (22.6) 0 0
Deposits with maturity 90 days and more (773.0) (3,320.0) 0 (2,200.2)
Total cash and cash equivalents 5,023.0 2,440.8 2,395.0 547.1
* Debt reserve account relates to deposits placed with licensed financial institution as part of security obligations for bond financing.** The cash at bank held in trust is in respect of grants received from the Government by a subsidiary for designated capital projects.
22 ASSETS CLASSIFIED AS HELD FOR SALE AND LIABILITIES DIRECTLY ASSOCIATED WITH THE ASSETS HELD FOR SALE
Accounting Policy
Non-current assets or groups of assets are classified as ‘held for sale’ if their carrying amounts will be recovered principally through a sale transaction rather than through continuing use. Similarly, liabilities directly associated with the disposal group are also presented separately from other liabilities in the statement of financial position.
Depreciation ceases when an asset is classified as an asset held for sale. Assets held for sale are stated at the lower of carrying amount and fair value less costs to sell.
During the financial year, the Board of Directors had approved the proposed disposal of TPD and LPL, wholly-owned subsidiaries of the Group. The proposed disposal is expected to be completed in 2021.
The associated assets and liabilities are presented as held for sale. As at 31 December 2020, the assets and liabilities of the disposal group are as follows:
TPDRM’million
LPLRM’million
TotalRM’million
Assets classified as held for sale
Property, plant and equipment (Note 5) 0 161.5 161.5Right-of-use assets (Note 6) 0 1.7 1.7Inventories 0 1.3 1.3Receivables, deposits and prepayments 0 443.1 443.1
Tax recoverable 0 9.4 9.40 617.0 617.0
Liabilities directly associated with assets classified as held for sale
Payables (0.1) (241.3) (241.4)Lease liabilities (Note 15) 0 (1.4) (1.4)Employee benefits (Note 25) 0 (0.6) (0.6)Borrowings (Note 28) 0 (2.4) (2.4)Other liabilities (Note 30) 0 (260.3) (260.3)
(0.1) (506.0) (506.1)Net (liabilities)/assets classified as held for sale (0.1) 111.0 110.9
The TPD cost of investment was impaired at the Company during previous financial years.

p.253
INTEGRATED ANNUAL REPORT 2020
FINANCIAL STATEMENTS
Notes to the Financial Statements31 December 2020
23 PAYABLES
Accounting Policy
Trade and other payables are obligations to pay for goods or services that have been acquired in the ordinary course of business from suppliers. Other payables generally arise from transactions outside the usual operating activities of the Group and Company. Trade and other payables are classified as current liabilities if payment is due within one year or less (or in the normal operating cycle of the business if longer). If not, they are presented as non-current liabilities.
Trade and other payables are recognised initially at fair value and subsequently measured at amortised cost, which is the fair value of the consideration to be paid in the future for the goods and services received.
Provisions are recognised when the Group and Company have a present legal or constructive obligations as a result of past events, it is probable that an outflow of resources will be required to settle the obligations and reliable estimates of the amounts can be made. Where the Group and Company expect a provision to be reimbursed by another party, the reimbursement is recognised as a separate asset but only when the reimbursement is virtually certain. Provisions are not recognised for future operating losses. Where there are a number of similar obligations, the likelihood that an outflow will be required in settlement is determined by considering the class of obligations as a whole. A provision is recognised even if the likelihood of an outflow with respect to any one item included in the same class of obligations may be small.
Group Company
Note 2020RM’million
2019RM’million
2020RM’million
2019RM’million
Trade payables (a) 7,188.0 5,763.2 5,688.4 3,942.5
Payroll liabilities 1,538.0 1,547.9 1,379.6 1,426.3
Deposits 28.1 19.1 10.3 10.2
Provisions 285.6 717.4 139.0 154.0
Financial guarantee contracts 282.9 282.9 285.2 285.8
Prepayment by lessee 0 28.4 0 0
Other payables and accruals 1,211.5 861.4 405.9 266.8
10,534.1 9,220.3 7,908.4 6,085.6
(a) Included in trade payables of the Group and Company are obligations amounting to RM3,448.8 million (2019: RM1,385.0 million), relating to the Electricity Industry Fund under IBR mechanism and contractual obligation amounting to RM1,161.4 million (2019: RM Nil), relating to shortfall of committed gas volume to be consumed by the power sector under the Gas Framework Agreement.
Credit terms of trade payables of the Group and Company vary from 30 to 60 days (2019: 30 to 60 days) depending on the terms of the contracts.
The loss allowance on financial guarantee contracts are mainly arising from financial guarantees provided by the Company to an associate arising from the ECL model (Note 46(b)(iv)).

p.254
TENAGA NASIONAL BERHAD
Notes to the Financial Statements31 December 2020
23 PAYABLES (CONTINUED)
The movements in provisions during the financial year are as follows:
Group Company
2020RM’million
2019RM’million
2020RM’million
2019RM’million
As at the beginning of the financial year 717.4 562.5 154.0 121.2
Provisions during the financial year 169.6 976.0 123.9 90.1
Utilitised during the financial year (601.4) (821.1) (138.9) (57.3)
As at the end of the financial year 285.6 717.4 139.0 154.0
The provisions are mainly in respect of development cost of Eleventh Malaysia Plan (‘RMK-11’), Cess fund contributed for Electricity Supplies Industry Trust Account (‘AAIBE’) and levy tax.
24 DERIVATIVE FINANCIAL INSTRUMENTS
Accounting Policy
Derivatives are initially recognised at fair value on the date a derivative contract is entered into and are subsequently remeasured at their fair value at the end of each reporting period.
Fair value changes on derivatives that are not designated or do not qualify for hedge accounting are recognised in the statement of profit or loss when the changes arise.
NoteNotionalamount
RM’millionLiabilities
RM’million
Non-hedge accounting qualified derivative financial instruments:
Group
2020
Current liability
Outstanding foreign currency contracts
Forward foreign currency contracts (a) 93.3 (1.3)
Non-current liabilities
Outstanding foreign currency contracts
Interest rate swap contracts (b) 1,746.1 (150.2)
Profit rate swap contracts (c) 361.3 (25.5)
2,107.4 (175.7)

p.255
INTEGRATED ANNUAL REPORT 2020
FINANCIAL STATEMENTS
Notes to the Financial Statements31 December 2020
24 DERIVATIVE FINANCIAL INSTRUMENTS (CONTINUED)
NoteNotionalamount
RM’millionLiabilities
RM’million
Non-hedge accounting qualified derivative financial instruments: (continued)
Group
2019
Current liabilities
Outstanding foreign currency contracts
Spot foreign currency contracts 18.7 0
Forward foreign currency contracts (a) 154.2 (8.6)
172.9 (8.6)
Non-current liabilities
Outstanding foreign currency contracts
Interest rate swap contracts (b) 604.5 (29.7)
Profit rate swap contracts (c) 134.7 (7.5)
739.2 (37.2)
Company
2020
Current liability
Outstanding foreign currency contracts
Forward foreign currency contracts (a) 93.3 (1.3)
2019
Current liabilities
Outstanding foreign currency contracts
Spot foreign currency contracts 18.7 0
Forward foreign currency contracts (a) 11.0 (0.2)
29.7 (0.2)
(a) The Group entered into forward foreign currency contracts with forward rates ranging from RM4.0520 to RM4.1075 (2019: RM4.0602 to RM4.4100) for 1 US Dollar, RM3.9630 (2019: RM3.6600 to RM3.8600) for 100 Japanese Yen.
(b) The Group entered into two Interest Rate Swap (‘IRS’) contracts that entitled the Group to receive interest at floating rates and obliged to pay interest at fixed rate of 1.3% per annum and 1.7% per annum on aggregate notional principal of GBP30.7 million and GBP89.3 million respectively.
The Group had an additional IRS contract during the current financial year through VSI, which became a subsidiary of the Group on 1 September 2020 (Note 48). In June 2017, Vortex Solar UK Limited, a wholly-owned subsidiary of VSI has entered into an IRS contract that entitled the Group to receive interest at floating rates and obligated it to pay interest at fixed rate of 1.37% per annum on aggregate notional amount principal of GBP212.1 million.
p.256
TENAGA NASIONAL BERHAD
Notes to the Financial Statements31 December 2020
24 DERIVATIVE FINANCIAL INSTRUMENTS (CONTINUED)
(c) The Group entered into Profit Rate Swap (‘PRS’) contract that entitled TNB Bukit Selambau Solar Sdn. Bhd. to receive profit at floating rates and obliged to pay profit at fixed rate of 4.31% per annum on aggregate notional principal of RM134.7 million.
In addition, the Group entered into PRS contract with effect from 13 February 2020 that entitled TNB Sepang Solar Sdn. Bhd. to receive profit at floating rates and obliged to pay profit at fixed rate of 3.15% per annum on aggregate notional principal of RM236.2 million.
Credit risks relating to derivative financial instruments are disclosed in Note 46(b) to the financial statements.
25 EMPLOYEE BENEFITS
Accounting Policy
(a) Short term employee benefits
Wages, salaries, paid annual leave, bonuses, and non-monetary benefits that are expected to be settled wholly within 12 months after the end of the period in which the employees render the related services are recognised in respect of employees’ services up to the end of the reporting period and are measured at the amounts expected to be paid when the liabilities are settled.
(b) Post-employment benefits
The Group and Company have various post-employment benefit schemes which are either defined contribution or defined benefit plans. A defined contribution plan is a pension plan under which the Group and Company pay fixed contributions into a separate entity (a fund) on a mandatory, contractual or voluntary basis and the Group and Company have no legal or constructive obligations to pay further contributions if the fund does not hold sufficient assets to pay all employees benefits relating to employee services in the current and prior periods.
Defined contribution plans
The Group and Company’s contributions to the defined contribution plans are charged to the statement of profit or loss in the financial year to which they relate. Once the contributions have been paid, the Group and Company have no further payment obligations.
Defined benefit plans
The Group and Company make contributions to the Company’s Retirement Benefit Plan, a defined benefit plan and an approved fund independent of the Company’s finances. A book provision is also provided by the Group and Company as the contribution rate required to fund the benefits under the said plan is in excess of the Inland Revenue maximum limit. The Group and Company also provided for a Post-Retirement Medical Plan for certain employees, which is unfunded.

p.257
INTEGRATED ANNUAL REPORT 2020
FINANCIAL STATEMENTS
Notes to the Financial Statements31 December 2020
25 EMPLOYEE BENEFITS (CONTINUED)
Accounting Policy (continued)
(b) Post-employment benefits (continued)
Defined benefit plans (continued)
The liability in respect of a defined benefit plan is the present value of the defined benefit obligation at the statement of financial position date minus the fair value of plan assets. The Group and Company determine the present value of the defined benefit obligation and the fair value of any plan assets with sufficient regularity such that the amounts recognised in the financial statements do not differ materially from the amounts that would be determined at the end of the reporting date.
The defined benefit obligation, calculated using the Projected Unit Credit Method, is determined by an independent actuarial firm, considering the estimated future cash outflows using market yields at the statement of financial position date of high-quality corporate bonds which have currency and terms to maturity approximating the terms of the related liability.
The current service cost of the defined benefit plan reflects the increase in the defined benefit obligation resulting from employee services in the current year. It is recognised in the statement of profit or loss as employee benefits expense.
The net interest cost is calculated by applying the discount rate to the net balance of the defined benefits obligation and the fair value of plan assets. This cost is included in employee benefit expense in the statement of profit or loss. Actuarial gains and losses arising from experience adjustments and changes in actuarial assumptions are recognised directly to the OCI in the period in which they arise. The actuarial gains and losses are not subsequently reclassified to the statement of profit or loss.
(i) Retirement Benefit Trust Fund (‘RBTF’)
The Group and Company operate a final salary defined benefit plan. The benefit is made as lump sum payment at retirement or earlier exits due to death and early retirement. The RBTF has been closed to new entrants since January 2008. Currently, there is no minimum funding requirement under the law.
The RBTF exposes the Group and Company to risks from interest rates from defined benefit being greater than expected due to assumptions such as salary increment or turnover rates not being borne out. The RBTF is also exposed to investment risks in relation to the assets of the plan.
The funding of the RBTF is based on recommendation of the actuary and approved by the Group and Company. The contributions by the Group and Company are based on 7.0% (2019: 7.0%) of the annual basic salaries of the members. The employees are not required to contribute to the plan.
The Group and Company expect to contribute 6.0% (2019: 6.0%) of the annual basic salaries of members to the plan in the next financial year.
(ii) Post-Retirement Medical Benefit Scheme (‘PRMBS’)
The Group and Company operate a post-retirement medical benefits plan in Malaysia. The PRMBS is closed to new entrants. There is no minimum funding requirement under the current law. The PRMBS is unfunded.
The PRMBS exposes the Group and Company to risk from interest rates and from defined benefit being greater than expected due to assumptions such as projection of medical benefit costs and mortality not being borne out.
There has not been any settlement or curtailment during the current financial year.

p.258
TENAGA NASIONAL BERHAD
Notes to the Financial Statements31 December 2020
25 EMPLOYEE BENEFITS (CONTINUED)
The movements in the financial statements are as follows:
RBTF PRMBS Total
Definedbenefit
obligationRM’million
Fair valueof plan
assetRM’million
Net definedbenefitliability
RM’million RM’million RM’million
Group
At 1 January 2020 2,653.5 (1,700.9) 952.6 12,472.2 13,424.8
Included in profit or loss
Current service costs 108.3 0 108.3 0 108.3
Interest cost/(income) 100.9 (72.9) 28.0 550.4 578.4
209.2 (72.9) 136.3 550.4 686.7
Included in OCI
Remeasurement of loss (Note 39):
- Actuarial (gain)/loss arising from:
- financial assumptions (66.5) 0 (66.5) 677.7 611.2
- experience assumptions 48.7 0 48.7 (26.1) 22.6
- Return on plan assets excluding interest income 0 (104.5) (104.5) 0 (104.5)
(17.8) (104.5) (122.3) 651.6 529.3
Others
Contribution paid by the employer 0 (295.1) (295.1) 0 (295.1)
Benefits paid (307.9) 296.1 (11.8) (480.6) (492.4)
Reclassification of liabilities directly associated with assets classified as held for sale (Note 22) (0.6) 0 (0.6) 0 (0.6)
(326.3) (103.5) (429.8) 171.0 (258.8)
At 31 December 2020 2,536.4 (1,877.3) 659.1 13,193.6 13,852.7
Current 268.8 515.0 783.8
Non-current 390.3 12,678.6 13,068.9
659.1 13,193.6 13,852.7
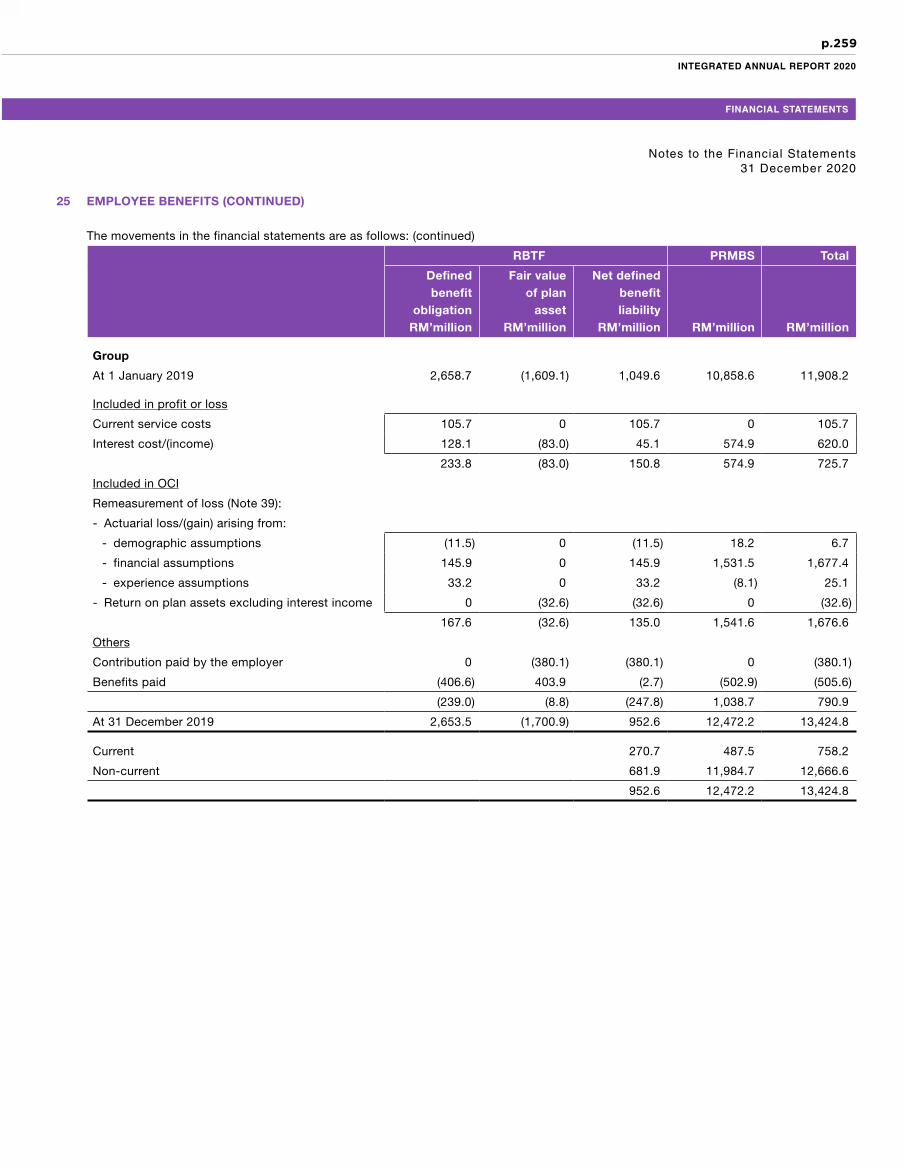
p.259
INTEGRATED ANNUAL REPORT 2020
FINANCIAL STATEMENTS
Notes to the Financial Statements31 December 2020
25 EMPLOYEE BENEFITS (CONTINUED)
The movements in the financial statements are as follows: (continued)
RBTF PRMBS Total
Definedbenefit
obligationRM’million
Fair valueof plan
assetRM’million
Net definedbenefitliability
RM’million RM’million RM’million
Group
At 1 January 2019 2,658.7 (1,609.1) 1,049.6 10,858.6 11,908.2
Included in profit or loss
Current service costs 105.7 0 105.7 0 105.7
Interest cost/(income) 128.1 (83.0) 45.1 574.9 620.0
233.8 (83.0) 150.8 574.9 725.7
Included in OCI
Remeasurement of loss (Note 39):
- Actuarial loss/(gain) arising from:
- demographic assumptions (11.5) 0 (11.5) 18.2 6.7
- financial assumptions 145.9 0 145.9 1,531.5 1,677.4
- experience assumptions 33.2 0 33.2 (8.1) 25.1
- Return on plan assets excluding interest income 0 (32.6) (32.6) 0 (32.6)
167.6 (32.6) 135.0 1,541.6 1,676.6
Others
Contribution paid by the employer 0 (380.1) (380.1) 0 (380.1)
Benefits paid (406.6) 403.9 (2.7) (502.9) (505.6)
(239.0) (8.8) (247.8) 1,038.7 790.9
At 31 December 2019 2,653.5 (1,700.9) 952.6 12,472.2 13,424.8
Current 270.7 487.5 758.2
Non-current 681.9 11,984.7 12,666.6
952.6 12,472.2 13,424.8

p.260
TENAGA NASIONAL BERHAD
Notes to the Financial Statements31 December 2020
25 EMPLOYEE BENEFITS (CONTINUED)
The movements in the financial statements are as follows: (continued)
RBTF PRMBS Total
Definedbenefit
obligationRM’million
Fair valueof plan
assetRM’million
Net definedbenefitliability
RM’million RM’million RM’million
Company
At 1 January 2020 2,613.3 (1,703.8) 909.5 11,743.6 12,653.1
Included in profit or loss
Current service costs 83.6 0 83.6 0 83.6
Interest cost/(income) 106.0 (72.9) 33.1 518.0 551.1
189.6 (72.9) 116.7 518.0 634.7
Charged to subsidiaries 17.9 0 17.9 0 17.9
207.5 (72.9) 134.6 518.0 652.6
Included in OCI
Remeasurement of loss (Note 39):
- Actuarial (gain)/loss arising from:
- financial assumptions (66.5) 0 (66.5) 663.9 597.4
- experience assumptions 48.7 0 48.7 (15.9) 32.8
- Return on plan assets excluding interest income 0 (99.8) (99.8) 0 (99.8)
(17.8) (99.8) (117.6) 648.0 530.4
Others
Contribution paid by the employer 0 (295.1) (295.1) 0 (295.1)
Benefits paid (296.1) 296.1 0 (461.9) (461.9)
(313.9) (98.8) (412.7) 186.1 (226.6)
At 31 December 2020 2,506.9 (1,875.5) 631.4 12,447.7 13,079.1
Current 268.8 495.7 764.5
Non-current 362.6 11,952.0 12,314.6
631.4 12,447.7 13,079.1

p.261
INTEGRATED ANNUAL REPORT 2020
FINANCIAL STATEMENTS
Notes to the Financial Statements31 December 2020
25 EMPLOYEE BENEFITS (CONTINUED)
The movements in the financial statements are as follows: (continued)
RBTF PRMBS Total
Definedbenefit
obligationRM’million
Fair valueof plan
assetRM’million
Net definedbenefitliability
RM’million RM’million RM’million
Company
At 1 January 2019 2,619.9 (1,609.5) 1,010.4 10,269.4 11,279.8
Included in profit or loss
Current service costs 86.8 0 86.8 0 86.8
Interest cost/(income) 127.1 (83.0) 44.1 543.0 587.1
213.9 (83.0) 130.9 543.0 673.9
Charged to subsidiaries 15.8 0 15.8 0 15.8
229.7 (83.0) 146.7 543.0 689.7
Included in OCI
Remeasurement of loss (Note 39):
- Actuarial loss/(gain) arising from:
- demographic assumptions (11.5) 0 (11.5) 10.2 (1.3)
- financial assumptions 145.9 0 145.9 1,427.4 1,573.3
- experience assumptions 33.2 0 33.2 (18.2) 15.0
- Return on plan assets excluding interest income 0 (35.1) (35.1) 0 (35.1)
167.6 (35.1) 132.5 1,419.4 1,551.9
Others
Contribution paid by the employer 0 (380.1) (380.1) 0 (380.1)
Benefits paid (403.9) 403.9 0 (488.2) (488.2)
(236.3) (11.3) (247.6) 931.2 683.6
At 31 December 2019 2,613.3 (1,703.8) 909.5 11,743.6 12,653.1
Current 270.7 468.3 739.0
Non-current 638.8 11,275.3 11,914.1
909.5 11,743.6 12,653.1

p.262
TENAGA NASIONAL BERHAD
Notes to the Financial Statements31 December 2020
25 EMPLOYEE BENEFITS (CONTINUED)
The latest actuarial revaluation for RBTF and PRMBS was carried out in February 2021. The principal actuarial assumptions used in respect of defined benefit plans are as follows:
Group Company
RBTF%
PRMBS%
RBTF%
PRMBS%
2020
Discount rates 3.7 - 4.5 4.1 3.7 4.1
Salary increment rate 5.0 - 6.0 N/A 6.0 N/A
Medical cost inflation:
- Inpatient N/A 5.5 N/A 5.5
- Outpatient N/A 4.5 N/A 4.5
Others:
- Specialist N/A 4.5 N/A 4.5
- Dialysis N/A 5.5 N/A 5.5
2019
Discount rates 4.3 - 11.3 4.5 4.3 4.5
Salary increment rate 5.0 - 11.3 N/A 7.0 N/A
Medical cost inflation:
- Inpatient N/A 5.5 N/A 5.5
- Outpatient N/A 4.5 N/A 4.5
Others:
- Specialist N/A 4.5 N/A 4.5
- Dialysis N/A 5.5 N/A 5.5
The effect of a 1.0% movement in the key assumptions to the defined benefit obligation balances are as follows:
RBTF PRMBS
IncreaseRM’million
DecreaseRM’million
IncreaseRM’million
DecreaseRM’million
Group
2020
Medical cost trend rate N/A N/A 1,840.4 (1,536.2)
Discount rate (149.6) 166.6 (1,584.1) 1,942.5
Salary increment rate 180.6 (164.9) N/A N/A
2019
Medical cost trend rate N/A N/A 1,737.9 (1,450.5)
Discount rate (161.2) 180.3 (1,490.5) 1,826.5
Salary increment rate 192.2 (174.8) N/A N/A

p.263
INTEGRATED ANNUAL REPORT 2020
FINANCIAL STATEMENTS
Notes to the Financial Statements31 December 2020
25 EMPLOYEE BENEFITS (CONTINUED)
The effect of a 1.0% movement in the key assumptions to the defined benefit obligation balances are as follows: (continued)
RBTF PRMBSIncrease
RM’millionDecrease
RM’millionIncrease
RM’millionDecrease
RM’million
Company2020Medical cost trend rate N/A N/A 1,711.2 (1,432.0)Discount rate (149.6) 166.6 (1,477.4) 1,807.1Salary increment rate 180.6 (164.9) N/A N/A
2019
Medical cost trend rate N/A N/A 1,610.2 (1,347.6)
Discount rate (161.2) 180.3 (1,385.5) 1,693.1
Salary increment rate 192.2 (174.8) N/A N/A
The sensitivity analysis have been provided based on membership data as at 31 December 2020 and considered a change of each principal assumption in isolation. The method and types of assumptions used in preparing the sensitivity analysis did not change compared to the previous period.
The weighted average duration of the Group and Company’s liabilities are estimated at approximately 7 and 14 years for RBTF and PRMBS respectively.
Plan assets for RBTF comprise:
Group and Company2020
%2019
%
Equity instruments - quoted 53.0 50.7
Debt instruments - quoted 20.8 21.7
- unquoted 17.8 21.0
Others 8.4 6.6
100.0 100.0
The plan assets for RBTF did not include any ordinary share of the Company.
The Group and Company’s RBTF are conditional on future employment of the members of the plan. The Group and Company’s PRMBS are not conditional on future employment and has been fully vested as at 31 December 2020.
26 CONSUMER DEPOSITS
Consumers (with the exception of employees and government departments/agencies) are required to deposit a sum sufficient to cover charges for two months supply of electricity as allowed under the regulation of the Licensee Supply (Amendment) Regulations 2002. In default of payment of the deposit within the time specified, the supply to the consumer’s installation may be disconnected, subject to certain conditions laid out in the regulations.
An interest of 2.5% per annum is credited to the consumer’s cash deposit.
Consumer deposits are classified as current liabilities as the amounts shall be refunded within 30 days upon request for termination of electricity supply by the consumer.

p.264
TENAGA NASIONAL BERHAD
Notes to the Financial Statements31 December 2020
27 SHORT TERM BORROWINGS
Accounting Policy
Borrowings are recognised initially at fair value, net of transaction costs incurred. In subsequent periods, borrowings are stated at amortised cost using the effective interest method, any differences between proceeds (net of transaction costs) and the redemption value are recognised in the statement of profit or loss over the period of the borrowings.
Borrowings are classified as current liabilities unless the Group and Company have an unconditional right to defer settlement of the liability for at least 12 months after the statement of financial position date.
Fees paid on the establishment of loan facilities are recognised as transaction costs of the loan to the extent that it is probable that some or all of the facilities will be drawdown. In this case, the fee is deferred until the drawdown occurs. The transaction costs are amortised over the tenure of the loan and recognised in the statement of profit or loss.
Borrowing costs directly attributable to the acquisition, construction or production of qualifying assets, which are assets that necessarily take a substantial period of time to get ready for their intended use or sale, are added to the cost of those assets, until such time as the assets are substantially ready for their intended use or sale. All other borrowing costs are recognised in the statement of profit or loss in the period in which they are incurred.
As for Government loans at an interest rate which is below the market rate of interest, the differential between the initial carrying value of the loan based on market rate and the Government rate is recognised as a deferred income and is credited to the statement of profit or loss over the period necessary to match the interest costs.
Investment income earned on the temporary investment of specific borrowings pending their expenditure on qualifying assets is deducted from the borrowing costs eligible for capitalisation.
Group Company
2020RM’million
2019RM’million
2020RM’million
2019RM’million
Portion of borrowings due within 1 year (Note 28):
- Secured 1,796.2 1,460.7 0 0
- Unsecured 3,674.9 1,595.8 3,041.6 999.7
5,471.1 3,056.5 3,041.6 999.7
Short term loans:
- Secured 652.0 254.8 450.6 0
- Unsecured 237.6 99.6 0 0
Bankers’ acceptances (unsecured) 48.4 68.4 0 0
6,409.1 3,479.3 3,492.2 999.7
The short term borrowings carry interest at rates ranging from 0.8% to 8.0% (2019: 0.8% to 15.8%) per annum for the Group and from 0.8% to 9.4% (2019: 0.8% to 9.4%) per annum for the Company.
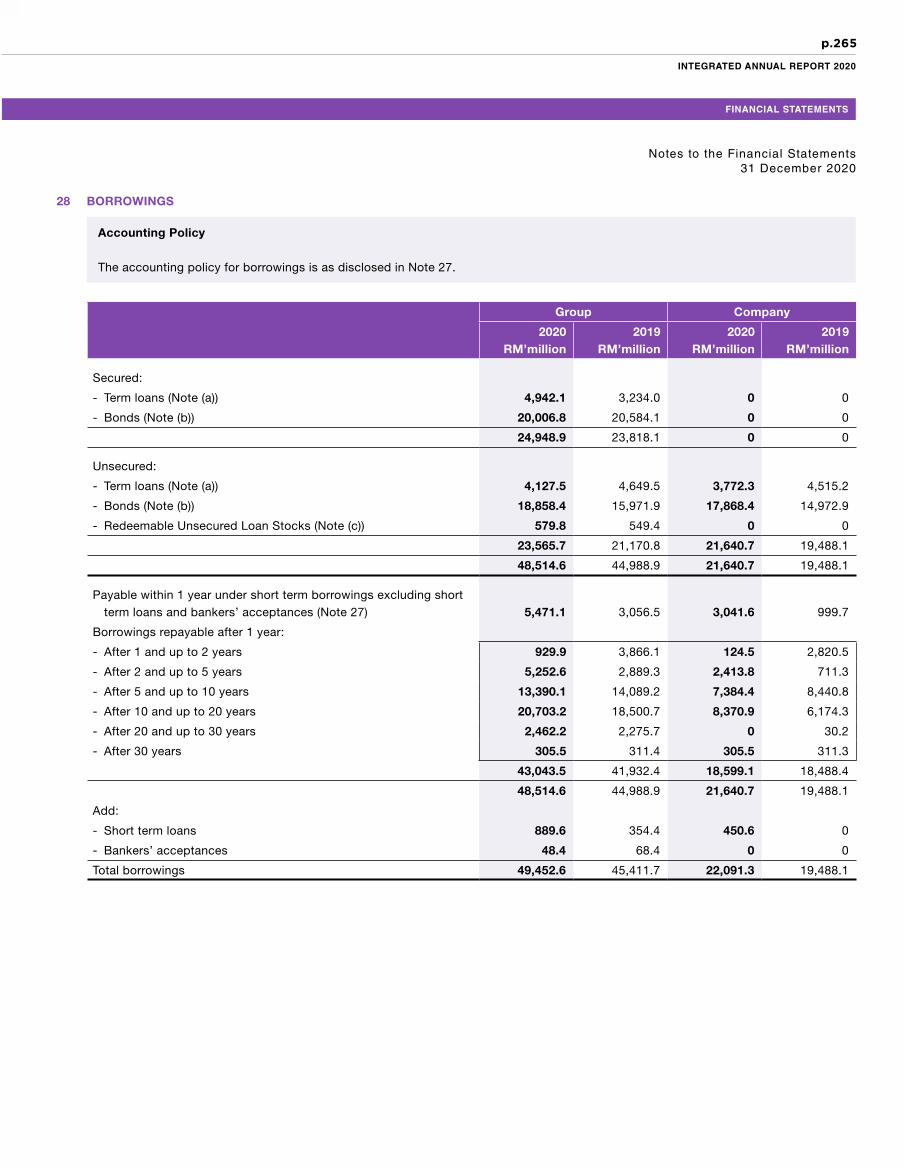
p.265
INTEGRATED ANNUAL REPORT 2020
FINANCIAL STATEMENTS
Notes to the Financial Statements31 December 2020
28 BORROWINGS
Accounting Policy
The accounting policy for borrowings is as disclosed in Note 27.
Group Company
2020RM’million
2019RM’million
2020RM’million
2019RM’million
Secured:
- Term loans (Note (a)) 4,942.1 3,234.0 0 0
- Bonds (Note (b)) 20,006.8 20,584.1 0 0
24,948.9 23,818.1 0 0
Unsecured:
- Term loans (Note (a)) 4,127.5 4,649.5 3,772.3 4,515.2
- Bonds (Note (b)) 18,858.4 15,971.9 17,868.4 14,972.9
- Redeemable Unsecured Loan Stocks (Note (c)) 579.8 549.4 0 0
23,565.7 21,170.8 21,640.7 19,488.1
48,514.6 44,988.9 21,640.7 19,488.1
Payable within 1 year under short term borrowings excluding short term loans and bankers’ acceptances (Note 27) 5,471.1 3,056.5 3,041.6 999.7
Borrowings repayable after 1 year:
- After 1 and up to 2 years 929.9 3,866.1 124.5 2,820.5
- After 2 and up to 5 years 5,252.6 2,889.3 2,413.8 711.3
- After 5 and up to 10 years 13,390.1 14,089.2 7,384.4 8,440.8
- After 10 and up to 20 years 20,703.2 18,500.7 8,370.9 6,174.3
- After 20 and up to 30 years 2,462.2 2,275.7 0 30.2
- After 30 years 305.5 311.4 305.5 311.3
43,043.5 41,932.4 18,599.1 18,488.4
48,514.6 44,988.9 21,640.7 19,488.1
Add:
- Short term loans 889.6 354.4 450.6 0
- Bankers’ acceptances 48.4 68.4 0 0
Total borrowings 49,452.6 45,411.7 22,091.3 19,488.1

p.266
TENAGA NASIONAL BERHAD
Notes to the Financial Statements31 December 2020
28 BORROWINGS (CONTINUED)
Group
2020RM’million
2019RM’million
Net book values of assets pledged as security for borrowings:
Machinery, lines and equipment 29,534.2 26,211.0
Buildings 2,793.8 3,455.2
Land 528.7 367.7
32,856.7 30,033.9
(a) Term loans
(i) Term Loan – SESB Federal Government Loans
The Federal Government loans obtained by SESB are secured by the following:
• A debenture creating:- a first fixed charge over all present and future freehold and leasehold properties including all buildings and fixtures;
and- a first floating charge over all present and future assets of SESB not effectively charged by way of the fixed charge.
• A deed of assignment transferring all SESB’s present and future rights and interests in all sales proceeds or revenue derived from the sale of electricity generated from the projects funded.
• A deed of assignment transferring all SESB’s present and future rights and interests in the bank accounts in which the loan proceeds are credited.
The tenure of the loans ranges from 20 to 25 years with a fixed interest rate applicable during the financial year ranging from 0% to 4.0% per annum.
(ii) Term Loan - TNB Engineering Corporation Sdn. Bhd. (‘TNEC’)
On 20 December 2010, TNEC entered into a 15-year RM73.3 million secured loan, bearing interest at a fixed rate of 5.9% per annum. The loan will mature on 24 December 2025. The principal is payable in 12 annual instalments.
The term loan is secured by a corporate guarantee from the Company. The term loan also requires TNEC to comply with certain affirmative and restrictive non-financial covenants.
(iii) Term Loan - Malaysia Transformer Manufacturing Sdn. Bhd. (‘MTM’)
On 2 May 2017, Malaysia Transformer Manufacturing Sdn. Bhd. (‘MTM’) entered into a RM25.0 million financing facilities under Commodity Murabahah Financing-i with a floating profit rate of 1.6% plus prevailing Kuala Lumpur Interbank Offered Rate (‘KLIBOR’) per annum and RM50.0 million under Revolving Financing-i with floating profit rate of 0.75% plus prevailing KLIBOR per annum to partly finance the construction and development of a new plant at Kapar, Klang. The loan will mature on 29 May 2023.
In addition, on 28 August 2017, MTM obtained a RM35.0 million Commodity Murabahah Flexi Term Financing-i for the purpose of part financing the new factory in Kapar, Klang. The loan will mature on 1 November 2023.

p.267
INTEGRATED ANNUAL REPORT 2020
FINANCIAL STATEMENTS
Notes to the Financial Statements31 December 2020
28 BORROWINGS (CONTINUED)
(a) Term loans (continued)
(iv) Term Loan - TNB Sepang Solar Sdn. Bhd. (‘TSS’)
On 19 July 2017, TSS entered into a 20-year secured Term Loan (known as Istisna’ Term Financing-i) for a maximum principal of RM280.0 million with a KLIBOR floating rate plus prevailing margin of 1.2% per annum (pre-commercial operation date (‘COD’)) and 1.3% per annum (post-COD) to finance the construction of a 50MW solar power plant at Kuala Langat.
The borrowings which are repayable from six months after the COD are required to be settled in full by the final maturity date of 30 June 2037.
(v) Term Loan - TNB Bukit Selambau Solar Sdn. Bhd. (‘TNBBSS’)
On 13 December 2018, TNBBSS obtained a RM135.0 million Islamic Facility Agreement from MUFG Bank (Malaysia) Berhad to finance the construction of a 30MW solar power plant. The tenure of the facility agreement is up to 20 years with a profit rate for pre-COD (KLIBOR+1.0%) and post-COD (KLIBOR+0.75%) per annum.
The borrowings are repayable from six months after the COD and is required to be settled in full by the final maturity date of 10 December 2038.
(vi) Term Loan - Tenaga Wind Ventures UK Ltd (‘TWV’)
On 28 March 2018, TWV obtained bank loans and overdrafts which are secured by a fixed and floating charges over the assets held by TWV. TWV entered into a new debt facility of GBP120.0 million for the purpose of refinancing the senior debt facility held by GVO Wind Limited (‘GVO’) and Bluemerang Capital Limited (‘BCL’). The rate of interest is at a margin of 1.6% over London Inter-bank Offered Rate (‘LIBOR’) per annum for the short term facility and 1.85% over LIBOR per annum for the long term facility. The tenure of the loan is for 15 years.
(vii) Term Loan - Vortex Solar Investments S.A.R.L. (‘VSI’)
On 22 June 2017, Vortex Solar UK4 Limited (‘VSUK’), wholly-owned subsidiary of VSI obtained a bank loan which is secured by a fixed and floating charges over the assets held by VSUK for the purpose of refinancing the senior debt facility held by Terraform UK3 Intermediate Holdings Ltd. VSUK entered into a loan agreement with the total of eight (8) lenders including Santander UK Plc (‘Santander’) acting as the facility agent for an amount of GBP337.0 million, that will mature in March 2035. The facility bears interest at a rate per annum equal to LIBOR plus an applicable margin of 1.9% for the first 3 years, 2.1% for subsequent 3 years, 2.3% for subsequent 3 years and thereafter at 2.5% until maturity.
(b) Bonds or Sukuk
(i) Sukuk - TNB Janamanjung Sdn. Bhd. (‘TNBJ’)
On 25 November 2011, TNBJ obtained a RM4.9 billion Islamic Securities Programme to finance the construction of a 1,010MW coal-fired power plant. The tenure of the Islamic Securities Programme ranges from 5 to 20 years with profit rates between 3.8% and 4.9% per annum.
The Islamic Securities Programme was issued by Manjung Island Energy Berhad (‘MIEB’) which is a special purpose vehicle company incorporated in Malaysia with a paid up capital of RM2.00 ordinary share. All of the issued shares of MIEB are held by Equity Trust (Malaysia) Berhad as share trustee for the benefit of certain specified charities, under the terms of a declaration of trust.

p.268
TENAGA NASIONAL BERHAD
Notes to the Financial Statements31 December 2020
28 BORROWINGS (CONTINUED)
(b) Bonds or Sukuk (continued)
(i) Sukuk - TNB Janamanjung Sdn. Bhd. (‘TNBJ’) (continued)
The Islamic Securities Programme consists of 2 series and the details of the series are as follows:
• Series 1 consists of 15 tranches, with tenures ranging from 5 to 19 years.• Series 2 consists of 1 tranche, with a tenure of 20 years.
(ii) Sukuk - TNB Northern Energy Berhad (‘TNEB’)
On 22 May 2013, TNEB entered into a RM1.6 billion sukuk facility agreement to finance the construction of a 1,071MW gas-fired power plant. The tenure of the facility agreement is 23 years with profit rates between 3.6% and 4.8% per annum. The sukuk facility agreement consists of 39 tranches with tenures ranging from 4 to 23 years.
(iii) Sukuk - Kapar Energy Ventures Sdn. Bhd. (‘KEV’)
On 5 July 2013, KEV issued a sukuk facility based on the Shariah principles of Ijarah (‘Sukuk Ijarah’) of RM2.0 billion in nominal value. The tenure of the sukuk ranging from 1 to 13 years with profit rates of 3.8% to 5.0% per annum. The Sukuk proceeds were utilised for Shariah-compliant purposes, which include refinancing the outstanding Bai’ Bithaman Ajil Islamic Debt Securities (‘BaIDS’), payment of fees and expenses in relation to the Sukuk Ijarah facility and to meet the general working capital purposes of KEV.
(iv) Sukuk - TNB Western Energy Berhad (‘TWEB’)
On 24 January 2014, TWEB entered into a RM3.7 billion sukuk facility agreement to finance the construction of a 1,000MW coal-fired power plant. The sukuk facility agreement consists of 20 tranches with tenures ranging from 10 to 20 years with profit rates ranging from 5.1% and 5.8% per annum.
(v) Sukuk - Jimah East Power Sdn. Bhd. (‘JEP’)
On 4 December 2015, JEP issued a Sukuk Murabahah of RM9.0 billion in nominal value. The proceeds from the Sukuk Murabahah were utilised by JEP for shariah-compliant purposes in connection with the financing, design, engineering, procurement, construction, installation, testing, commissioning, ownership, operation and maintenance of a 2,000MW coal-fired power plant and associated facilities, including the transmission line and interconnection facilities. The tenure of the facility agreement is 23 years with profit rates between 5.0% and 6.8% per annum. The sukuk facility agreement consists of 36 tranches with tenures ranging from 6 to 23 years.
(vi) Sukuk - Southern Power Generation Sdn. Bhd. (‘SPG’)
On 31 October 2017, SPG issued a Sukuk Wakalah of RM3.7 billion in nominal value. The proceeds from the Sukuk Wakalah were utilised for the following shariah-compliant purposes in connection with the financing, design, engineering, procurement, construction, installation, testing, commissioning, ownership, operation and maintenance of a 1,440MW gas-fired power plant and associated facilities, including the interconnection facilities.
The tenure of the facility agreement is 18 years with profit rates between 4.7% and 5.6% per annum. The sukuk facility agreement consists of 28 tranches with tenures ranging from 4.5 years to 18 years.
p.269
INTEGRATED ANNUAL REPORT 2020
FINANCIAL STATEMENTS
Notes to the Financial Statements31 December 2020
28 BORROWINGS (CONTINUED)
(b) Bonds or Sukuk (continued)
(vii) Sukuk - TNB Global Ventures Capital Berhad (‘TGVC’)
On 4 October 2016, TGVC established a USD2.5 billion Multi-Currency Medium Term Note Sukuk Programme to provide flexibility to Tenaga Nasional Berhad’s fund raising exercise for its future investments.
The Sukuk Programme is unsecured and has the benefit of unconditional and irrecoverable guarantee from Tenaga Nasional Berhad, to meet the payment obligations of TGVC.
On 19 October 2016, the Company issued a USD750.0 million sukuk for a tenure of 10 years with profit rate of 3.2% per annum.
On 1 November 2018, the Company had a second issuance of USD750.0 million for a tenure of 10 years with a profit rate of 4.9%.
(viii) Sukuk - Islamic Medium Term Note Sukuk Wakalah
On 6 July 2017, the Company established a RM5.0 billion Islamic Medium Term Note Sukuk Wakalah to finance capital expenditure, investment, general corporate purpose, working capital requirements and/or refinance any existing financing facilities of the Issuer and/or its subsidiaries and to defray any fees and expenses of the Sukuk Programme.
On 3 August 2017, the Company issued RM2.0 billion comprise RM500.0 million with 15 years tenure and RM1.5 billion with 20
years tenure, with profit rates of 5.0% and 5.2% respectively.
On 29 August 2018, the Company issued RM3.0 billion comprise RM1.0 billion Sukuk Wakalah with 15 years tenure and RM2.0 billion with 20 years tenure, with profit rates of 4.8% and 5.0% per annum respectively.
(viiii) Sukuk - Islamic Medium Term Note Sukuk Wakalah
On 30 June 2020, the Company established a RM10.0 billion Islamic Medium Term Note Sukuk Wakalah to finance capital expenditure, investment, general corporate purposes, working capital requirement and/or refinance any existing financing facilities of the Company and/or subsidiaries and to defray any fees and expenses of Sukuk Wakalah Programme.
On 12 August 2020, the Company issued RM3.0 billion comprises RM750.0 million with 10 years tenure, RM750.0 million with 15 years tenure and RM1.5 billion with 20 years tenure, with profit rates of 2.9%, 3.3% and 3.6% per annum respectively.
(c) Redeemable Unsecured Loan Stock (‘RULS’) - KEV
On 29 June 2004, KEV issued RM957.6 million of RULS to the Company and Malakoff Corporation Berhad to finance the acquisition of Stesen Janaelektrik Sultan Salahuddin Abdul Aziz, Kapar.
The main features of the RULS are as follows:
• The RULS bear an interest of 8.0% per annum on the outstanding nominal value of the RULS. The interest is repayable semi-annually on the last day of the relevant six months period from the issue date of RULS. The charge in the compounding interest rate of 0% has been approved by the Board of Directors on 31 October 2016.
• The RULS are repayable from the third year from the issue date of RULS as stipulated in the agreement dated 29 June 2004. The RULS have to be settled in full by the final maturity date of 8 July 2029.

p.270
TENAGA NASIONAL BERHAD
Notes to the Financial Statements31 December 2020
28 BORROWINGS (CONTINUED)
(d) Preferred Equity Certificates (‘PEC’)
On 22 December 2017, Kumpulan Wang Persaraan (‘KWAP’) had provided a shareholder loan of GBP46.2 million to VSI through the subscription of PEC. The financial instrument bears a fixed interest rate of 8.0% per annum and will mature in 2047.
Reconciliation of borrowings from financing activities during the financial year is as follows:
Group Company
2020RM’million
2019RM’million
2020RM’million
2019RM’million
As at the beginning of the financial year 45,411.7 47,832.4 19,488.1 21,637.0
Cash flows:
- Drawdowns 6,454.5 1,113.3 5,490.0 0
- Repayments (4,450.0) (3,756.9) (2,845.5) (1,990.5)
- Finance cost paid (2,224.8) (2,310.1) (940.3) (971.3)
Non-cash changes:
- Finance cost (Note 38(b)) 2,393.4 2,482.5 981.1 962.3
- Translation gain - foreign term loans (Note 37) (82.1) (149.4) (82.1) (149.4)
- Transfer from payables 75.4 199.9 0 0
- Acquisition of a subsidiary 1,876.9 0 0 0
- Reclassification of liabilities directly associated with assets classified as held for sale (Note 22) (2.4) 0 0 0
As at the end of the financial year 49,452.6 45,411.7 22,091.3 19,488.1
29 GOVERNMENT DEVELOPMENT GRANTS
Accounting Policy
Grants from the government are recognised at their fair values where there is a reasonable assurance that the grants will be received and the Group will comply with all attached conditions.
Government grants relating to costs are deferred and recognised in the statement of profit or loss over the period necessary to match them with the costs they are intended to compensate.
Government grants relating to construction of PPE are included in non-current liabilities as deferred income and are credited to the statement of profit or loss on the straight line method over the expected lives of the related assets.
A subsidiary of the Group obtained Government loans at an interest rate which is below the market rate of interest. The differential between the initial carrying value of the loan based on market rate and the Government rate is recognised as a deferred income and is credited to the statement of profit or loss over the period necessary to match the interest costs.

p.271
INTEGRATED ANNUAL REPORT 2020
FINANCIAL STATEMENTS
Notes to the Financial Statements31 December 2020
29 GOVERNMENT DEVELOPMENT GRANTS (CONTINUED)
Group
2020RM’million
2019RM’million
As at the beginning of the financial year 1,031.3 1,005.0
Reclassification made to contract liabilities 0 (0.8)
Received during the financial year:
- Cash 9.3 8.6
- Assets 7.4 90.8
- Government loans 1.5 19.9
Released to statement of profit or loss:
- Other operating income (Note 36) (66.8) (59.9)
- Finance cost (Note 38(b)) (21.5) (32.3)
As at the end of the financial year 961.2 1,031.3
The government development grants are provided by the Government mainly for the construction of PPE of RM723.0 million (2019: RM768.2 million) and the Government loan below market interest rate is RM211.9 million (2019: RM231.9 million).
30 OTHER LIABILITIES
Group Company
Note 2020RM’million
2019RM’million
2020RM’million
2019RM’million
Payable to State Government 16.4 19.6 0 19.6
Prepayment by lessee (a) 0 161.0 0 0
Retention monies (b) 590.0 649.9 603.5 634.6
Others (c) 295.9 149.4 2.8 2.8
902.3 979.9 606.3 657.0
(a) The prepayment by lessee amounting to RM129.1 million and provisions for sales tax and liquidated damages amounting to RM131.2 million have been classified as liabilities directly associated with assets classified as held for sale during the financial year as disclosed in Note 22.
(b) Retention monies primarily relates to the vendor retention monies for projects with completion period of more than 12 months.
(c) Included in Others is the provision for restoration cost for certain assets for which there is an obligation to dismantle, remove and restore the sites at the end of their useful lives amounting RM293.1 million (2019: RM145.6 million).

p.272
TENAGA NASIONAL BERHAD
Notes to the Financial Statements31 December 2020
31 SHARE CAPITAL
Accounting Policy
(a) Classification
Ordinary shares and non-redeemable preference shares with dividends are classified as equity. Other shares are classified as equity and/or liability according to the economic substance of the particular instrument.
Distributions to holders of a financial instrument classified as an equity instrument are charged directly to equity.
(b) Share issue costs
Incremental external costs directly attributable to the issuance of new shares or options are shown in equity as a deduction, net of tax, from the proceeds.
(c) Dividends to shareholders of the Company
Dividends are recognised as liability in the period in which they are declared.
Note
Group and Company
2020 2019
Issued and fully paid:
- Ordinary shares 5,704,653,871 5,686,888,771
- Special Rights Redeemable Preference Share (a) 1 1
Total share capital issued and fully paid 5,704,653,872 5,686,888,772
Group and Company
Note
Number ofshares
2020Million
Amount2020
RM’million
Number ofshares
2019Million
Amount2019
RM’million
Issued and fully paid:
Ordinary shares
As at the beginning of the financial year 5,686.9 11,446.1 5,686.9 11,446.1
LTIP shares issued during the financial year (b) 17.8 229.1 0 0
As at the end of the financial year 5,704.7 11,675.2 5,686.9 11,446.1
(a) Special Rights Redeemable Preference Share (‘Special Share’)
(i) The Special Share would enable the Government through the Minister of Finance Incorporated (‘MOF Incorporated’) to ensure that certain major decisions affecting the operations of the Company are consistent with the Government’s policies. The Special Shareholder, which may only be the Government or any representative or person acting on its behalf, is entitled to receive notices of meetings but not to vote at such meetings of the Company. However, the Special Shareholder is entitled to attend and speak at such meetings.
The Special Shareholder has the right to appoint any person, but not more than six at any time, to be a member of the Board of Directors of the Company.

p.273
INTEGRATED ANNUAL REPORT 2020
FINANCIAL STATEMENTS
Notes to the Financial Statements31 December 2020
31 SHARE CAPITAL (CONTINUED)
(a) Special Rights Redeemable Preference Share (‘Special Share’) (continued)
(ii) Certain matters, in particular the alteration of the Articles of Association of the Company relating to the rights of the Special Shareholder, creation and issue of additional shares which carry different voting rights, the dissolution of the Company, substantial disposal of assets, amalgamations, merger and takeover, require the prior consent of the Special Shareholder.
(iii) The Special Shareholder does not have any right to participate in the capital or profits of the Company.
(iv) The Special Shareholder has the right to require the Company to redeem the Special Share, at par, at any time.
(b) The Company issued and allotted 17,708,000 on 5 June 2020, 12,200 on 13 July 2020 and 44,900 on 9 September 2020 ordinary shares in the Company to eligible executives or eligible employees, pursuant to the letter of offer dated 28 March 2017, 18 April 2018, 30 April 2019 and 6 July 2020 respectively in accordance with the by-laws of the LTIP scheme of the Company during financial year ended 31 December 2020.
32 OTHER RESERVES
The Company and Group’s other reserves comprise:
(a) LTIP reserve
LTIP reserve relates to reserve created from the corresponding increase in equity from expenses recognised in profit or loss over the vesting period of the equity-settled shares based compensation plan for the Group’s employees as disclosed in Note 35.
(b) Employee benefits reserve
Arising from the remeasurements of the net defined employee benefit liability.
(c) Foreign currency translation reserve
Foreign exchange reserve is used to record exchange differences arising from the translation of the financial statements of foreign operations whose functional currencies are different from that of the Group’s presentation currency.
(d) FVOCI reserve
Arising from changes in fair value of financial assets at FVOCI.
Group Company
2020RM’million
2019RM’million
2020RM’million
2019RM’million
LTIP reserve 315.4 319.3 315.4 319.3
Employee benefits reserve (7,718.7) (7,317.3) (7,252.9) (6,849.8)
Foreign currency translation reserve (859.0) (786.7) 0 0
FVOCI reserve 19.6 20.9 18.9 20.2
(8,242.7) (7,763.8) (6,918.6) (6,510.3)
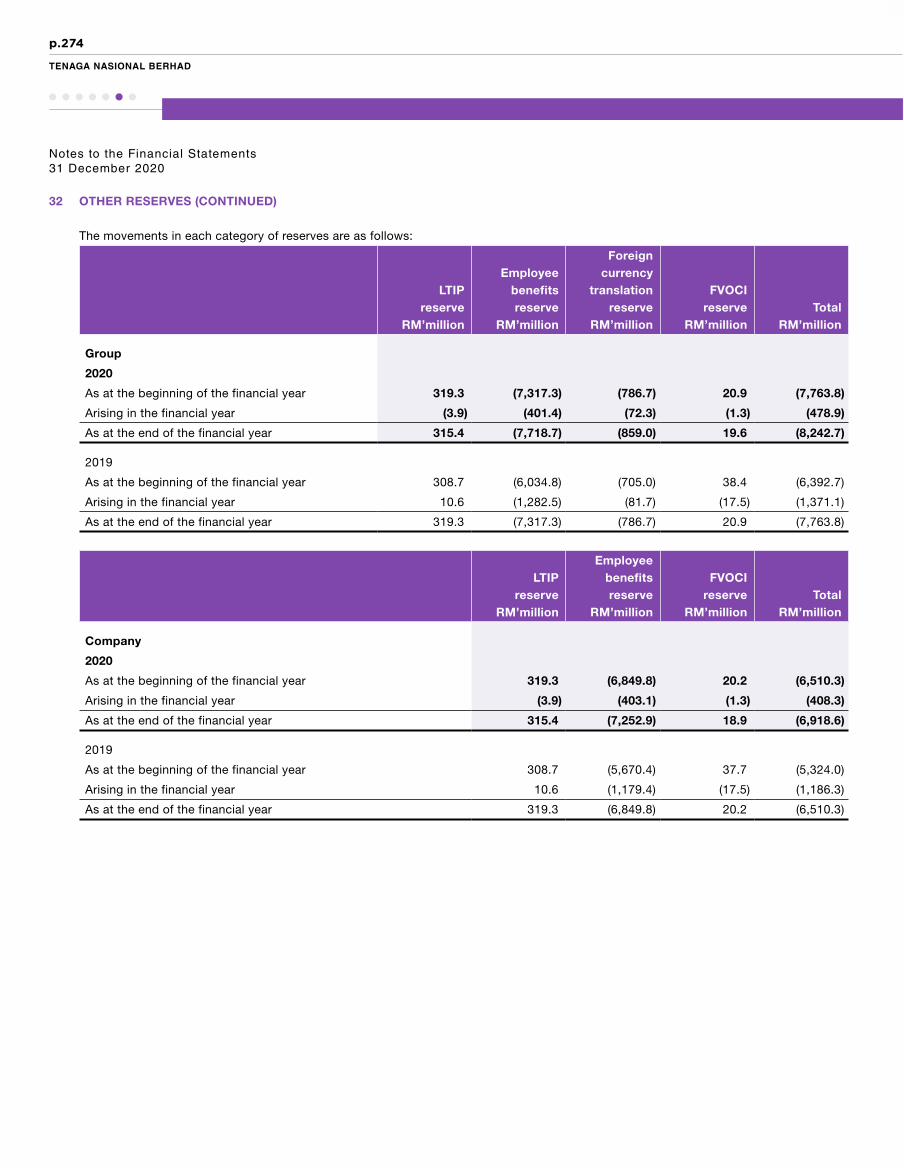
p.274
TENAGA NASIONAL BERHAD
Notes to the Financial Statements31 December 2020
32 OTHER RESERVES (CONTINUED)
The movements in each category of reserves are as follows:
LTIPreserve
RM’million
Employeebenefitsreserve
RM’million
Foreigncurrency
translationreserve
RM’million
FVOCIreserve
RM’millionTotal
RM’million
Group
2020
As at the beginning of the financial year 319.3 (7,317.3) (786.7) 20.9 (7,763.8)
Arising in the financial year (3.9) (401.4) (72.3) (1.3) (478.9)
As at the end of the financial year 315.4 (7,718.7) (859.0) 19.6 (8,242.7)
2019
As at the beginning of the financial year 308.7 (6,034.8) (705.0) 38.4 (6,392.7)
Arising in the financial year 10.6 (1,282.5) (81.7) (17.5) (1,371.1)
As at the end of the financial year 319.3 (7,317.3) (786.7) 20.9 (7,763.8)
LTIPreserve
RM’million
Employeebenefitsreserve
RM’million
FVOCIreserve
RM’millionTotal
RM’million
Company
2020
As at the beginning of the financial year 319.3 (6,849.8) 20.2 (6,510.3)
Arising in the financial year (3.9) (403.1) (1.3) (408.3)
As at the end of the financial year 315.4 (7,252.9) 18.9 (6,918.6)
2019
As at the beginning of the financial year 308.7 (5,670.4) 37.7 (5,324.0)
Arising in the financial year 10.6 (1,179.4) (17.5) (1,186.3)
As at the end of the financial year 319.3 (6,849.8) 20.2 (6,510.3)

p.275
INTEGRATED ANNUAL REPORT 2020
FINANCIAL STATEMENTS
Notes to the Financial Statements31 December 2020
33 REVENUE
Accounting Policy
Revenue which represents income arising in the course of the Group and Company’s ordinary activities is recognised by reference to each distinct performance obligation promised in the contracts with customers. Revenue from contracts with customers is measured at its transaction price, being the amount of consideration which the Group and Company expect to be entitled in exchange for transferring promised goods or services to a customer, net of goods and service tax, returns, rebates and discounts. Transaction price is allocated to each performance obligation on the basis of the relative stand-alone selling prices of each distinct good or services promised in the contract. Depending on the substance of the respective contract with the customer, revenue is recognised when the performance obligation is satisfied, which may be at a point in time or over time.
The Group and Company do not expect any contracts where the period between the transfer of the promised goods or services to the customer and payment by the customer exceeds one year. As a consequence, the Group and Company do not adjust any of the transaction prices for the time value of money.
(a) Electricity revenue
Revenue from the supply of electricity in Peninsular Malaysia is regulated based on certain formulae and parameters as set out in the regulatory implementation guidance under the IBR framework and as agreed with the regulators.
The contract with customers is for the supply of electricity based on tariff rates as set out in the provision of the Electricity Supply Act 1990. Collection of the contract consideration from customers is considered probable.
The promise to supply electricity represents a promise to transfer a series of distinct goods that are substantially the same and that have the same pattern of transfer to the customer. The performance obligation to deliver electricity is satisfied over time as the customers simultaneously received and consumed the benefits provided by the Group and Company’s performance. Hence, electricity revenue is recognised over time by the Group and Company when electricity is consumed by customers.
Generally, customers are billed on a monthly basis. As the amount at which the Group and Company have a right to invoice corresponds directly with the value to the customer, the revenue from electricity sales is also recognised on a monthly basis. Payment should be made by customers within 30 days from the date the bill is issued. An interest charge will be imposed if payment is made later than 30 days after the bill date.
Electricity revenue includes an estimated value of the electricity consumed by customers from the date of their last meter reading and the reporting period end. Accrued unbilled revenues recognised as contract assets are reversed in the following month when actual billings occur.
ICPT, a mechanism established under the IBR allows the Company to pass through the volatility in fuel and other generation specific costs (termed as the ‘Single Buyer Generation Cost’) to the consumers, such that the Company remains financially neutral. The Company’s claims and undertakings under the ICPT mechanism are such that any over or under-recovery of costs would be payable to or reimbursable from the Government, and would be recognised as part of revenue in the period the costs are incurred. Actual base tariff billed to the customers remains unchanged.

p.276
TENAGA NASIONAL BERHAD
Notes to the Financial Statements31 December 2020
33 REVENUE (CONTINUED)
Accounting Policy (continued)
(a) Electricity revenue (continued)
Included in the revenue, is the Annual Regulatory Adjustment (‘ARA’) for the over recovery of revenue and other income earned during the year. The Company has taken into account the principles laid out in the Guidelines on Electricity tariff Determination under the IBR for Peninsular Malaysia 2018, where the allowed revenue in each year is calculated as the sum of actual revenue earned and any applicable adjustments, such as those related to the revenue-cap, price-cap and other income adjustment mechanisms as described in the Guidelines. Other income which is earned from services not directly related to electricity supply, but which are provided using the assets and/or staff of a licensee is deducted from the revenues to be earned from regulated tariffs.
(b) Goods and services
(i) Sale of goods
Sale of goods is recognised when control of the products has transferred, being when the products are delivered to the customer and there is no unfulfilled obligation that could affect the customer’s acceptance of the products. Delivery occurs when the products have been transported to the specific location, the risks of obsolescence and loss have been transferred to the customer, and either the customer has accepted the products in accordance with the sales contract, the acceptance provisions have lapsed, or the Group has objective evidence that all criteria for acceptance have been satisfied.
Revenue from these sales is recognised based on the price specified in the contract, net of the estimated discounts. Accumulated experience is used to estimate and provide for the discounts, using the expected value method, and revenue is only recognised to the extent that it is highly probable that a significant reversal will not occur. No element of financing is deemed present as the sales are made with a credit term of an average between 30 to 60 days, which is consistent with market practice. The Group’s obligation to repair or replace faulty products under the standard warranty terms is recognised as a provision.
A receivable is recognised when the goods are delivered as this is the point in time that the consideration is unconditional because only the passage of time is required before the payment is due.
(ii) Rendering of services
Revenue from providing services is recognised over the period in which the services are rendered. Revenue is recognised based on the actual service provided to the end of the reporting period as a proportion of the total services to be provided because the customer received and uses the benefits simultaneously.
In cases of fixed-price contracts, the customer pays the fixed amount based on a payment schedule. If the services rendered exceed the payments, a contract asset is recognised. If the payments exceed the services rendered, a contract liability is recognised.
If the contract includes hourly fees, revenue is recognised at the amount to which the Group has a right to invoice. The amounts are billed within 60 to 180 days from satisfying the performance obligations and payment is expected within 30 days from the billing date.
p.277
INTEGRATED ANNUAL REPORT 2020
FINANCIAL STATEMENTS
Notes to the Financial Statements31 December 2020
33 REVENUE (CONTINUED)
Accounting Policy (continued)
(c) Construction contracts
Revenue from construction contracts is recognised over time or at a point in time in accordance with performance obligations being satisfied. Where revenue is recognised over time, the satisfaction of performance obligation is by reference to the stage of completion which is assessed by reference to the contract costs incurred over the total estimated costs for each contract as at the reporting date. Otherwise, revenue is recognised at a point in time when the customer obtains control of the assets. The related costs are recognised in profit or loss when they are incurred.
Where the contracts include multiple performance obligations, the transaction price will be allocated to each performance obligation based on the stand-alone selling prices. Where these are not directly observable, they are estimated based on expected cost plus margin. If contracts include sale of goods as a separate performance obligation, revenue from this sale is recognised at a point in time when the goods are delivered, the legal title has passed and the customer has accepted the goods.
When the consideration of a construction contract cannot be estimated reliably, contract revenue is recognised only to the extent of contract costs incurred that are likely to be recoverable. An expected loss on a contract is recognised immediately in the statement of profit or loss.
Estimates of revenues, costs or extent of progress toward completion are revised if circumstances change. Any resulting increases or decreases in estimated revenues or costs are reflected in profit or loss in the period in which the circumstances that give rise to the revision become known by management.
The amounts will be billed within 60 to 180 days from satisfying the performance obligations and payment is expected within 30 days from billing date. Advances received are included in contract liabilities.
(d) Customers’ contributions
Contributions received from customers consist of cash and assets in the form of PPE. It is a capital contributions for the construction of assets, used to connect the customers to a network or to provide them with the service.
The customers’ contributions are viewed as indirectly related to the promise of providing supply of electricity to the customers. Supply of electricity and customers’ contributions are not distinct because the customers cannot benefit from these two services on their own. The connection infrastructures are to fulfil the obligation to supply electricity to the customers. Both the supply of electricity and customers’ contributions are substantially the same, and have the same pattern of transfer to the customers.
Therefore, connection and the supply of electricity are one performance obligation. It is considered as part of the transaction price for the overall service provided to the customers and is recognised over time. The customers’ contributions are deferred and recognised over the period the constructed assets are used to provide electricity to the customers. The contributions are recognised as contract liabilities and amortised over 20 years, being the estimated average useful life of the assets.

p.278
TENAGA NASIONAL BERHAD
Notes to the Financial Statements31 December 2020
33 REVENUE (CONTINUED)
Disaggregation of revenue from contracts with customers for the Group and Company are categorised as follows:
Group Company
2020RM’million
2019RM’million
2020RM’million
2019RM’million
Sales:
- Electricity* 43,203.3 49,912.2 40,521.3 47,013.0
- Goods and services 440.4 694.6 0 0
Construction contracts 49.3 61.4 0 0
Customers’ contributions 283.0 271.5 237.0 229.3
43,976.0 50,939.7 40,758.3 47,242.3
Over time 43,273.6 50,675.1 40,758.3 47,242.3
At a point in time 702.4 264.6 0 0
43,976.0 50,939.7 40,758.3 47,242.3
* Included in the sales of electricity are over-recovery of ICPT amounting to RM3,034.4 million (2019: under-recovery of RM1,917.9 million), other regulatory adjustments of RM621.0 million (2019: RM1,364.1 million) and SESB’s tariff support subsidy of RM367.9 million (2019: RM362.9 million).
The revenue of the Group and Company are predominantly derived in Malaysia.
34 OPERATING EXPENSES
Group Company
2020RM’million
2019RM’million
2020RM’million
2019RM’million
Cost of sales:
- Energy cost 23,787.3 30,638.0 23,288.7 29,553.9
- Transmission cost 1,881.6 1,908.5 1,739.4 1,753.4
- Distribution cost 6,420.5 6,377.0 6,091.4 6,037.9
32,089.4 38,923.5 31,119.5 37,345.2
Administrative expenses 2,915.3 2,561.9 1,764.6 1,751.7
Other operating expenses 2,127.7 2,076.1 1,149.6 2,426.4
37,132.4 43,561.5 34,033.7 41,523.3

p.279
INTEGRATED ANNUAL REPORT 2020
FINANCIAL STATEMENTS
Notes to the Financial Statements31 December 2020
34 OPERATING EXPENSES (CONTINUED)
Operating expenses include the following items:
Group Company2020
RM’million2019
RM’million2020
RM’million2019
RM’million
Purchases from Independent Power Producers (‘IPPs’)^ 8,271.3 13,564.6 15,572.8 21,474.7
Fuel costs 9,514.4 10,847.9 1,498.1 2,030.3
Directors’ remuneration:
- Fees and allowances 3.2 3.4 3.1 3.0
- Other emoluments 3.4 0.2 3.4 0.2
Auditors’ remuneration:
- PricewaterhouseCoopers PLT, Malaysia
- Statutory audit 3.7 3.4 1.8 1.5
- Audit related services 2.2 2.2 2.2 2.1
- Member firm of PricewaterhouseCoopers International Limited
- Statutory audit 1.1 0.9 0 0
- Others
- Statutory audit 1.1 0 0 0
- Non-audit services
- Tax related services 0.5 0.2 0 0.1
- Other non-audit services 0.2 2.9 0.2 2.9
Staff costs (Note 35)* 3,825.8 3,747.7 2,771.6 2,782.2
Property, plant and equipment:
- Depreciation 6,997.3 6,421.7 4,758.5 4,611.0
- Written off 27.3 69.3 27.3 69.3
- Abandoned projects 30.8 0.2 30.8 0.2
Right-of-use assets:
- Depreciation 3,625.1 3,767.2 5,465.5 5,093.6
Impairment losses on investment in:
- Subsidiaries 0 0 164.5 1,355.0
- Joint ventures 0 0.5 0 0
- Associates 51.6 198.3 0 0
Inventories:
- Provision for obsolescence 163.7 122.9 105.6 116.7
- Write back of obsolescence (117.9) (89.2) (117.9) (89.2)
- Written off 82.5 38.4 78.2 37.8
Telecommunication expenses 78.1 69.2 77.9 67.4
Expenses arising from leases:
- Low-value assets (Note 15) 25.3 17.3 24.4 16.8
Research and development expenses 88.3 129.4 81.5 129.4
Receipt of Government subsidies# (200.6) (270.1) 0 0
^ These include amounts related to the Electricity Industry Fund amounting to RM23.7 million (2019: RM55.8 million).* This includes the remuneration of the Executive Directors amounting to RM4.1 million (2019: RM7.8 million) for the Group and Company.# This represents the subsidies that SESB received for diesel and medium fuel oil from the Government. The total amount credited in the current year has
been offsetted against energy cost.
The estimated monetary value of benefits received by the Directors was RM3.4 million (2019: RM0.2 million) for the Group and Company.
All non-audit services were procured competitively in accordance with TNB Procurement Policies and Procedures. Non-audit services can be offered by the external auditors of the Group if there are clear efficiencies and value added benefits to the Group.

p.280
TENAGA NASIONAL BERHAD
Notes to the Financial Statements31 December 2020
35 STAFF COST
Group Company
2020RM’million
2019RM’million
2020RM’million
2019RM’million
Wages, salaries and bonuses 2,212.1 2,274.7 1,446.0 1,528.4
Defined contribution retirement plan 403.0 395.0 311.0 308.3
Long Term Incentive Plan 225.2 10.6 146.3 7.6
Retirement Benefit Plan 136.3 150.8 116.7 130.9
Post-Retirement Medical Plan 550.4 574.9 518.0 543.0
Other employee benefits 298.8 341.7 233.6 264.0
3,825.8 3,747.7 2,771.6 2,782.2
Details of the retirement benefit and post-retirement medical plans of the Group and Company are set out in Note 25 to the financial statements.
Long Term Incentive Plan (‘LTIP’)
The Group operates an equity-settled share-based compensation plan under which the entity receives services from employees as consideration for equity instruments of the Group.
The fair value of the employee services received in exchange for the grant of the Company’s shares is recognised as an expense in the statement of profit or loss over the vesting period of the grant, with a corresponding increase in share-based payment reserve in equity.
The total amount to be expensed over the vesting period is determined by reference to the fair value of the shares granted.
Non-market vesting conditions are included in the assumptions to arrive at the number of shares that are expected to vest. At the end of the reporting period, the Group and Company revise its estimate of the number of shares that are expected to vest. The impact of the revision of original estimates, if any, is recognised in the statement of profit or loss, with a corresponding adjustment to share-based payment reserve in equity.
The fair value of shares granted to employees of subsidiaries is allocated to the subsidiaries.
The Company implemented a LTIP on 30 April 2015 for a period of 10 years. The LTIP is governed by the by-laws, which was approved by the shareholders at an Extraordinary General Meeting on 18 December 2014. LTIP is intended to allow the Company to award the grant of new shares to be vested to selected employees for the attainment of identified performance objectives.

p.281
INTEGRATED ANNUAL REPORT 2020
FINANCIAL STATEMENTS
Notes to the Financial Statements31 December 2020
35 STAFF COST (CONTINUED)
Long Term Incentive Plan (‘LTIP’) (continued)
(a) The main features of the LTIP
The LTIP comprises a Restricted Share Grant (‘RS Grant’) and a Performance Share Grant (‘PS Grant’). The main difference in the features of the RS Grant and the PS Grant is the eligibility of the selected employees in terms of their job grades in the Group and the performance targets and/or performance conditions to be met prior to the offer and vesting of the grant to the selected employees.
The details of the grant are as follows:
(i) RS Grant
The RS Grant is a restricted share grant for all eligible employees selected on a basis designated by the LTIP Committee. The RS Grant will be awarded annually to the selected employees to be vested over a period of 3 years on pro-rata basis and after fulfilment of individual performance targets based on the Group’s performance management system (such as individual performance rating) and certain performance conditions (such as financial targets) as determined by the LTIP Committee from time to time at its discretion in accordance with the terms and conditions of the LTIP.
(ii) PS Grant
The PS Grant is a performance share grant for senior executives of the Group and Executive Director as well as key employees of the Group selected on a basis designated by the LTIP Committee. The PS Grant will be awarded annually to the selected employees to be vested at the end of the 3-year period and after fulfilment of certain performance targets and/or conditions at the time of grant and vesting, which may include, among other factors, total shareholders’ return and the long term financial performance targets/ratios of the Group as determined by the LTIP Committee from time to time at its discretion in accordance with the terms and conditions of the LTIP. At the point of vesting, the final award of the PS Grant is based on a multiple of the initial grant whereby the multiple is determined according to the performance targets and/or conditions. In the event the performance targets and/or conditions are not met by the selected employees, the grant will not be vested to them at the end of the performance period.
The new ordinary shares to be allotted and issued upon the vesting of the ordinary shares pursuant to the RS Grant and PS Grant will not be subjected to any retention period or restriction on transfer.
In implementing the LTIP, the grant will be satisfied by way of allotment and issuance of new ordinary shares to the respective RS and PS grantees upon vesting of the grant.
The LTIP Committee shall decide from time to time at its discretion to determine or vary the terms and conditions of the offer, such as the eligibility criteria and allocation in each grant, the timing and frequency of the award of the grant, the performance targets and/or performance conditions to be met prior to the offer and vesting of the grant and the vesting period.
(b) Maximum number of new ordinary shares available under the LTIP
The maximum number of new ordinary shares which may be made available under the LTIP and/or allotted and issued upon vesting of the new ordinary shares under the LTIP shall not be more than 10.0% of the issued and paid-up ordinary share capital of the Company (excluding treasury shares) at any point in time during the duration of the LTIP.

p.282
TENAGA NASIONAL BERHAD
Notes to the Financial Statements31 December 2020
35 STAFF COST (CONTINUED)
Long Term Incentive Plan (‘LTIP’) (continued)
(c) Basis of allocation and maximum allowable allotment
The total number of new ordinary shares that may be offered to any one of the selected employees and/or to be vested in any one of the grantees under the LTIP at any time shall be at the discretion of the LTIP Committee (subject to the by-laws and any applicable law).
(d) Eligibility
Employees of the Group and Company (including the Executive Director) who meet the following criteria as at the date of offer shall be eligible to be considered as an eligible employee to participate in the LTIP:
(i) Has attained the age of 18 years;(ii) Has entered into a full-time or fixed-term contract of employment with, and is on the payroll of any company within the Group
and has not served a notice of resignation or received a notice of termination;(iii) Whose service/employment has been confirmed in writing;(iv) Is not a non-executive or independent director of the Company; and(v) Has fulfilled any other eligibility criteria which has been determined by the LTIP Committee at its discretion from time to time, as
the case may be.
The LTIP Committee may determine any other eligibility criteria for the purpose of selecting an eligible employee at any time and from time to time, at its discretion.
(e) Ranking of the new ordinary shares
The new ordinary shares to be allotted and issued pursuant to the LTIP shall, upon allotment and issuance, rank equally in all respects with the then existing issued ordinary shares.
The new ordinary shares to be allotted and issued pursuant to the vesting of the grant under the LTIP shall not be entitled to any dividends, rights, allotments and/or any other distributions, for which the entitlement date is prior to the date on which the new ordinary shares are credited into the Central Depository System (‘CDS’) accounts of the respective grantees upon vesting of the grant under the LTIP.
(f) Alteration of share capital and adjustment
If the LTIP Committee so decides (but not otherwise), in the event of any alteration in the capital structure of the Company during the duration of LTIP, which expires on 29 April 2025, such corresponding alterations (if any) may be made to the LTIP in:
(i) The number of unvested new ordinary shares comprised in a grant; and/or(ii) The method and/or manner in the vesting of the new ordinary shares comprised in a grant.

p.283
INTEGRATED ANNUAL REPORT 2020
FINANCIAL STATEMENTS
Notes to the Financial Statements31 December 2020
35 STAFF COST (CONTINUED)
Long Term Incentive Plan (‘LTIP’) (continued)
The movement in the total number of share grants during the financial year is as follows:
Group CompanyAt
1.1.2020‘000
Granted‘000
Transferred*‘000
Forfeited‘000
Vested‘000
At31.12.2020
‘000
At1.1.2020
‘000Granted
‘000Transferred*
‘000Forfeited
‘000Vested
‘000
At31.12.2020
‘000
2020LTIP 3
RS Grant 5,092.4 0 0 (666.3) (4,426.1) 0 3,740.0 0 0 (360.3) (3,379.7) 0PS Grant 1,576.9 0 0 (1,576.9) 0 0 1,387.4 0 0 (1,387.4) 0 0
LTIP 4
RS Grant 10,282.4 0 0 (972.6) (5,040.4) 4,269.4 7,704.9 0 (557.8) (537.9) (3,949.9) 2,659.3PS Grant 1,634.8 0 0 (250.8) 0 1,384.0 1,450.1 0 (321.9) (183.3) 0 944.9
LTIP 5
RS Grant 24,783.1 0 0 (1,723.5) (8,286.4) 14,773.2 19,198.4 0 (1,465.7) (1,133.4) (6,606.9) 9,992.4PS Grant 2,575.3 0 0 (316.3) 0 2,259.0 2,298.8 0 (433.9) (257.5) 0 1,607.4
LTIP 5 Special Grant
RS Grant 0 36.6 0 0 (12.2) 24.4 0 36.6 0 0 (12.2) 24.4PS Grant 0 83.4 0 0 0 83.4 0 83.4 0 0 0 83.4
LTIP 6
RS Grant 0 29,755.5 0 (563.5) 0 29,192.0 0 23,662.1 (3,357.4) (409.4) 0 19,895.3PS Grant 0 3,262.2 0 (131.8) 0 3,130.4 0 2,983.4 (548.5) (113.5) 0 2,321.4
Group CompanyAt
1.1.2019‘000
Granted‘000
Forfeited‘000
At31.12.2019
‘000
At1.1.2019
‘000Granted
‘000Forfeited
‘000
At31.12.2019
‘000
2019
LTIP 2
RS Grant 4,565.5 0 (4,565.5) 0 3,573.3 0 (3,573.3) 0
PS Grant 1,600.9 0 (1,600.9) 0 1,429.2 0 (1,429.2) 0
LTIP 3
RS Grant 11,828.0 0 (6,735.6) 5,092.4 8,820.7 0 (5,080.7) 3,740.0
PS Grant 1,913.9 0 (337.0) 1,576.9 1,673.1 0 (285.7) 1,387.4
LTIP 4
RS Grant 18,030.9 0 (7,748.5) 10,282.4 13,685.1 0 (5,980.2) 7,704.9
PS Grant 1,984.7 0 (349.9) 1,634.8 1,758.8 0 (308.7) 1,450.1
LTIP 5
RS Grant 0 25,443.7 (660.6) 24,783.1 0 19,712.3 (513.9) 19,198.4
PS Grant 0 2,704.3 (129.0) 2,575.3 0 2,400.2 (101.4) 2,298.8
* It relates to transfer of shares from the Company to TNBPG.

p.284
TENAGA NASIONAL BERHAD
Notes to the Financial Statements31 December 2020
35 STAFF COST (CONTINUED)
Long Term Incentive Plan (‘LTIP’) (continued)
The fair value of the share granted is estimated using the Monte Carlo Simulation Model with the following inputs:
Group and Company
LTIP 2 LTIP 3 LTIP 4
RS Grant PS Grant RS Grant PS Grant RS Grant PS Grant
Fair value at grant date RM12.87 -RM13.53
RM12.04^ RM12.33 -RM13.21
RM11.67^ RM13.96 -RM15.21
RM12.60^
Share price at grant date RM13.88 RM13.88 RM13.74 RM13.74 RM15.92 RM15.92
Expected volatility* 18.9% 18.9% 16.5% 16.5% 13.3% 13.3%
Expected dividend yield 2.5% 2.5% 3.6% 3.6% 4.4% 4.4%
Risk-free interest rate** 3.0% 3.3% 3.5% 3.6% 3.4% 3.5%
Grant date 1 April 2016 1 April 2016 28 March 2017 28 March 2017 18 April 2018 18 April 2018
Vesting date 30 April 2019 30 April 2020 30 April 2021
- Tranche 1 2 May 2017 N/A 30 April 2018 N/A 30 April 2019 N/A
- Tranche 2 30 April 2018 N/A 30 April 2019 N/A 5 June 2020 N/A
- Tranche 3 30 April 2019 N/A 5 June 2020 N/A 30 April 2021 N/A
Group and Company
LTIP 5 LTIP 5 (Special Grant) LTIP 6
RS Grant PS Grant RS Grant PS Grant RS Grant PS Grant
Fair value at grant date RM11.24 -RM12.18
RM10.20^ RM10.00 -RM11.62
RM9.49^ RM10.08 - RM10.99
RM9.08^
Share price at grant date RM12.28 RM12.28 RM11.64 RM11.64 RM11.34 RM11.34
Expected volatility* 14.3% 14.3% 19.3% 19.3% 19.5% 19.5%
Expected dividend yield 4.1% 4.1% 8.6% 8.6% 4.5% 4.5%
Risk-free interest rate** 3.4% 3.4% 2.2% 2.4% 1.7% 2.1%
Grant date 30 April 2019 30 April 2019 6 July 2020 6 July 2020 27 July 2020 27 July 2020
Vesting date 30 April 2022 30 April 2022 28 April 2023
- Tranche 1 5 June 2020 N/A 13 July 2020 N/A 28 April 2021 N/A
- Tranche 2 30 April 2021 N/A 30 April 2021 N/A 28 April 2022 N/A
- Tranche 3 30 April 2022 N/A 30 April 2022 N/A 28 April 2023 N/A
^ Market considerations have been included in the consideration of fair value.* Expected volatility is based on TNB’s 3 year average daily historical volatility.** Risk-free interest is based on Malaysian Government Securities yield.

p.285
INTEGRATED ANNUAL REPORT 2020
FINANCIAL STATEMENTS
Notes to the Financial Statements31 December 2020
36 OTHER OPERATING INCOME
Accounting Policy
Other operating income are the non-core revenue received for sales of goods and services rendered by the Group and Company. Leasing income is accrued, unless collectability is in doubt. Dividend income is recognised when the shareholders’ rights to receive payment is established. Interest on late payments is the 1.0% late payment interest charge imposed if payment of electricity bill is made later than 30 days after the bill date in accordance with the Licensee Supply Regulations 1990. Accounting policy on gain on disposals of PPE are disclosed in Note 5. All others are recognised upon completion of the rendering of services or sales of goods not in the ordinary course of the Group and Company’s business.
Group Company
2020RM’million
2019RM’million
2020RM’million
2019RM’million
Dividend income from:
- Quoted shares 3.1 0 3.1 0
- Subsidiaries 0 0 114.9 59.3
- Associates 0 0 57.6 31.0
Leasing income 32.9 34.4 29.0 33.7
Rental income 11.1 12.4 38.7 34.0
Release of Government development grants (Note 29) 66.8 59.9 0 0
Gain on disposals of PPE 8.2 213.3 6.5 213.3
Gain on disposals of ROU 0.1 1.2 0.1 1.2
Interest on late payments 263.2 184.8 207.6 181.9
Minimum charges 47.5 42.9 47.5 42.9
Gain on redemption of redeemable preference shares in subsidiaries 0 0 110.8 378.4
Sundry receipts 100.2 40.2 185.3 130.9
Project management and consultancy 0 0 0 11.9
Theft of electricity 47.5 234.9 43.6 233.0
Liquidated damages 56.3 154.8 56.3 9.3
Remeasurement gain on previously held interest in an associate (Note 9) 231.3 0 0 0
Insurance recoveries 42.4 0 0 0
Other income 150.8 152.2 99.1 69.4
1,061.4 1,131.0 1,000.1 1,430.2
Other income comprises primarily income from sales of scrap and rechargeable works.

p.286
TENAGA NASIONAL BERHAD
Notes to the Financial Statements31 December 2020
37 FOREIGN EXCHANGE GAIN/(LOSS)
Accounting Policy
(a) Functional and presentation currency
Items included in the financial statements of each of the Group’s entities are measured using the currency of the primary economic environment in which the entity operates (the ‘functional currency’). The financial statements are presented in Ringgit Malaysia (‘RM’), which is the Company’s functional and presentation currency.
(b) Transactions and balances
Foreign currency transactions are translated into the functional currency using the exchange rates prevailing at the dates of the transactions or valuation where items are remeasured. Foreign exchange gains and losses resulting from the settlement of such transactions and from the translation at year end exchange rates of monetary assets and liabilities denominated in foreign currencies are recognised in the statement of profit or loss. However, exchange differences are deferred in OCI when they are attributable to items that form part of the net investment in a foreign operation.
(c) Group companies
The results and financial positions of the Group’s entities (none of which has the currency of a hyperinflationary economy) that have functional currencies which are different from the presentation currency are translated into the presentation currency as follows:
(i) Assets and liabilities for each statement of financial position presented are translated at the closing rate at the date of that statement of financial position;
(ii) Income and expenses for each statement of profit or loss and OCI are translated at average exchange rates (unless this average is not a reasonable approximation of the cumulative effect of the rates prevailing on the transaction dates, in which case income and expenses are translated at the rate on the dates of the transactions); and
(iii) All resulting exchange differences are recognised as a separate component of equity.
Goodwill and fair value adjustments arising on the acquisition of a foreign operation are treated as assets and liabilities of the foreign operation and translated at the closing rate. Exchange differences arising on these items are recognised in OCI.
On consolidation, exchange differences arising from the translation of the net investment in foreign operations are taken to shareholders’ equity.
On the disposal of a foreign operation (that is, a disposal of the Group’s entire interest in a foreign operation, or a disposal involving loss of control over a subsidiary that includes a foreign operation, a disposal involving loss of joint control over a joint venture that includes a foreign operation, or a disposal involving loss of significant influence over an associate that includes a foreign operation), the cumulative amount of the exchange differences relating to that foreign operation recognised in OCI, and accumulated in the separate component of equity, are reclassified from equity to profit or loss, as part of the gain or loss on disposal.
In the case of a partial disposal that does not result in the Group losing control over a subsidiary that includes a foreign operation, the proportionate share of accumulated exchange differences recognised in OCI are re-attributed to NCI in that foreign operation, and are not recognised in profit or loss. For all other partial disposals (that is, reductions in the Group’s ownership interest in associates or joint ventures that do not result in the Group losing significant influence or joint control) the proportionate share of the accumulated exchange difference is reclassified to profit or loss.

p.287
INTEGRATED ANNUAL REPORT 2020
FINANCIAL STATEMENTS
Notes to the Financial Statements31 December 2020
37 FOREIGN EXCHANGE GAIN/(LOSS) (CONTINUED)
Group Company
2020RM’million
2019RM’million
2020RM’million
2019RM’million
Foreign exchange gain/(loss) comprises:
Translation gain - foreign term loans 82.1 149.4 82.1 149.4
Translation (loss)/gain - others (10.5) 51.2 (9.4) (30.8)
Total foreign exchange translation gain 71.6 200.6 72.7 118.6
Transaction loss - foreign term loans (20.6) (54.1) (20.6) (54.1)
Transaction (loss)/gain - others (24.8) (32.6) (17.2) 1.5
26.2 113.9 34.9 66.0
38 FINANCE INCOME/COST AND FAIR VALUE CHANGES OF FINANCIAL INSTRUMENTS
Accounting Policy
Finance income are interests and dividends received from investments or financial instruments.
Investment income earned on the temporary investment of specific borrowing pending their expenditure on qualifying assets is deducted from the borrowing costs eligible for capitalisation.
Finance income is calculated by applying the effective interest method to the gross carrying amount of a financial asset except for financial assets that subsequently become credit-impaired. For credit-impaired financial assets the effective interest rate is applied to the net carrying amount of the financial assets (after deduction of the loss allowances). The accounting policy on fair value changes are as per disclosed in Note 46.
General and specific borrowing costs that are directly attributable to the acquisition, construction or production of a qualifying asset are capitalised during the period of time that is required to complete and prepare the asset for its intended use. Qualifying assets are assets that necessarily takes substantial period of time to get ready for their intended use. Other borrowing costs are expensed in the period in which they are incurred.
Accounting policy on finance charges for lease liabilities and government grants are disclosed in Note 15 and Note 29, respectively.

p.288
TENAGA NASIONAL BERHAD
Notes to the Financial Statements31 December 2020
38 FINANCE INCOME/COST AND FAIR VALUE CHANGES OF FINANCIAL INSTRUMENTS (CONTINUED)
Group Company
2020RM’million
2019RM’million
2020RM’million
2019RM’million
(a) Finance income:
Interest from subsidiaries 0 0 40.3 45.1
Interest from deposits, staff loans and associates 320.7 569.5 183.1 339.6
Less: Reduction of borrowing costs capitalised into PPE (3.0) (44.4) 0 0
317.7 525.1 223.4 384.7
(b) Finance cost:
Finance cost on:
- Borrowings 2,393.4 2,482.5 981.1 962.3
- Lease liabilities (Note 15) 1,587.9 1,727.2 3,864.9 3,270.3
- Consumer deposits 158.7 153.1 151.9 145.0
- Others 19.5 47.0 0.1 1.1
Release of government grants (Note 29) (21.5) (32.3) 0 0
Less: Amount capitalised into PPE (469.3) (994.8) (259.6) (255.9)
3,668.7 3,382.7 4,738.4 4,122.8
(c) Fair value changes of financial instruments:
Gain/(Loss) on changes in fair value of financial assets 206.0 3.6 189.4 (17.9)
Loss on changes in fair value of financial liabilities (81.1) (41.6) (1.1) (0.1)
124.9 (38.0) 188.3 (18.0)
39 TAXATION AND ZAKAT
Accounting Policy
(a) Income tax
Current tax expense is determined by the expected income taxes payable in respect of the taxable profit for the financial year and is measured using the applicable tax rates according to the tax laws of the countries in which the Company and its subsidiaries operate and generate the taxable profits.
Management periodically evaluates positions taken in tax returns with respect to situations in which applicable tax regulations are subject to interpretation. Provisions are established where appropriate on the basis of amounts expected to be paid to the tax authorities.
Tax is recognised in the profit or loss except to the extent that it relates to items recognised directly in OCI. In this case, the item is recognised in OCI, net of tax.
(b) Zakat
The Group and Company recognise its obligation towards the payment of zakat on business income in the statement of profit or loss. Zakat payment is an obligation and is accrued based on 2.5% of profit before tax and determined according to the percentage of Muslim shareholding in the Company.

p.289
INTEGRATED ANNUAL REPORT 2020
FINANCIAL STATEMENTS
Notes to the Financial Statements31 December 2020
39 TAXATION AND ZAKAT (CONTINUED)
The taxation and zakat for the Group and Company comprise:
Group Company
Note 2020RM’million
2019RM’million
2020RM’million
2019RM’million
Current tax:
- Malaysian corporate income tax 498.8 903.4 310.3 694.8
Deferred tax 12 97.4 110.1 62.1 193.5
Tax expense 596.2 1,013.5 372.4 888.3
Zakat 22.8 19.2 22.8 19.2
619.0 1,032.7 395.2 907.5
The analysis of the tax expense is as follows:
Current tax:
- Current financial year 475.1 1,136.2 297.9 929.0
- Under/(Over) accrual in prior financial years 23.7 (232.8) 12.4 (234.2)
498.8 903.4 310.3 694.8
Deferred tax:
- Origination and reversal of temporary differences 12 97.4 110.1 62.1 193.5
596.2 1,013.5 372.4 888.3
The explanation of the relationship between tax expense and profit before taxation and zakat is as follows:
Group Company
2020RM’million
2019RM’million
2020RM’million
2019RM’million
Profit before taxation and zakat 4,235.4 5,477.7 3,070.5 2,872.5
Tax calculated at the Malaysian corporate income tax rate of 24% (2019: 24%) 1,016.5 1,314.6 736.9 689.4
Tax effects of:
- Share of results of associates and joint ventures (18.3) (12.6) 0 0
- Income not subject to tax (308.7) (379.0) (228.6) (314.3)
- Expenses not deductible for tax purposes 560.1 489.2 402.1 802.8
- Expenses qualifying for double deduction (19.6) (43.7) (16.0) (43.7)
- Current financial year unrecognised temporary differences and unused tax losses 0 6.9 0 0
- Foreign jurisdictions 11.9 (16.5) 0 0
Under/(Over) accrual of tax in prior financial years 23.7 (232.3) 12.4 (234.2)
Recognition and utilisation of previously unrecognised temporary differences (152.5) (113.1) (17.5) (11.7)
Zakat 22.8 19.2 22.8 19.2
Utilisation of reinvestment allowance* (516.9) 0 (516.9) 0
Tax and zakat charge 619.0 1,032.7 395.2 907.5
Average effective tax rate (%) 14.6 18.9 12.9 31.6
* The reinvestment allowance incentive was enacted by the Government through the Finance Act 2020.

p.290
TENAGA NASIONAL BERHAD
Notes to the Financial Statements31 December 2020
39 TAXATION AND ZAKAT (CONTINUED)
The tax charge relating to components of OCI is as follows:
2020 2019
Before taxRM’million
Tax chargedRM’million
After taxRM’million
Before taxRM’million
Tax chargedRM’million
After taxRM’million
Group
Defined benefit plan actuarial loss (Note 25) (529.3) 127.3 (402.0) (1,676.6) 373.0 (1,303.6)
Foreign currency translation differences (34.3) 0 (34.3) (101.5) 0 (101.5)
Financial assets at FVOCI (1.3) 0 (1.3) (17.5) 0 (17.5)
Share of OCI of associates accounted for using the equity method (38.7) 0 (38.7) 19.8 0 19.8
(603.6) 127.3 (476.3) (1,775.8) 373.0 (1,402.8)
Company
Defined benefit plan actuarial loss (Note 25) (530.4) 127.3 (403.1) (1,551.9) 372.5 (1,179.4)
Financial assets at FVOCI (1.3) 0 (1.3) (17.5) 0 (17.5)
(531.7) 127.3 (404.4) (1,569.4) 372.5 (1,196.9)
40 EARNINGS PER SHARE (‘EPS’)
(a) Basic earnings per share
Basic earnings per share is calculated by dividing the profit attributable to owners of the Company for the financial year by the weighted average number of ordinary shares issued during the financial year.
Group
2020 2019
Profit attributable to owners of the Company (RM’million) 3,592.7 4,529.2
Weighted average number of ordinary shares in issue (’000) 5,697,069 5,686,889
Basic earnings per share (sen) 63.06 79.64
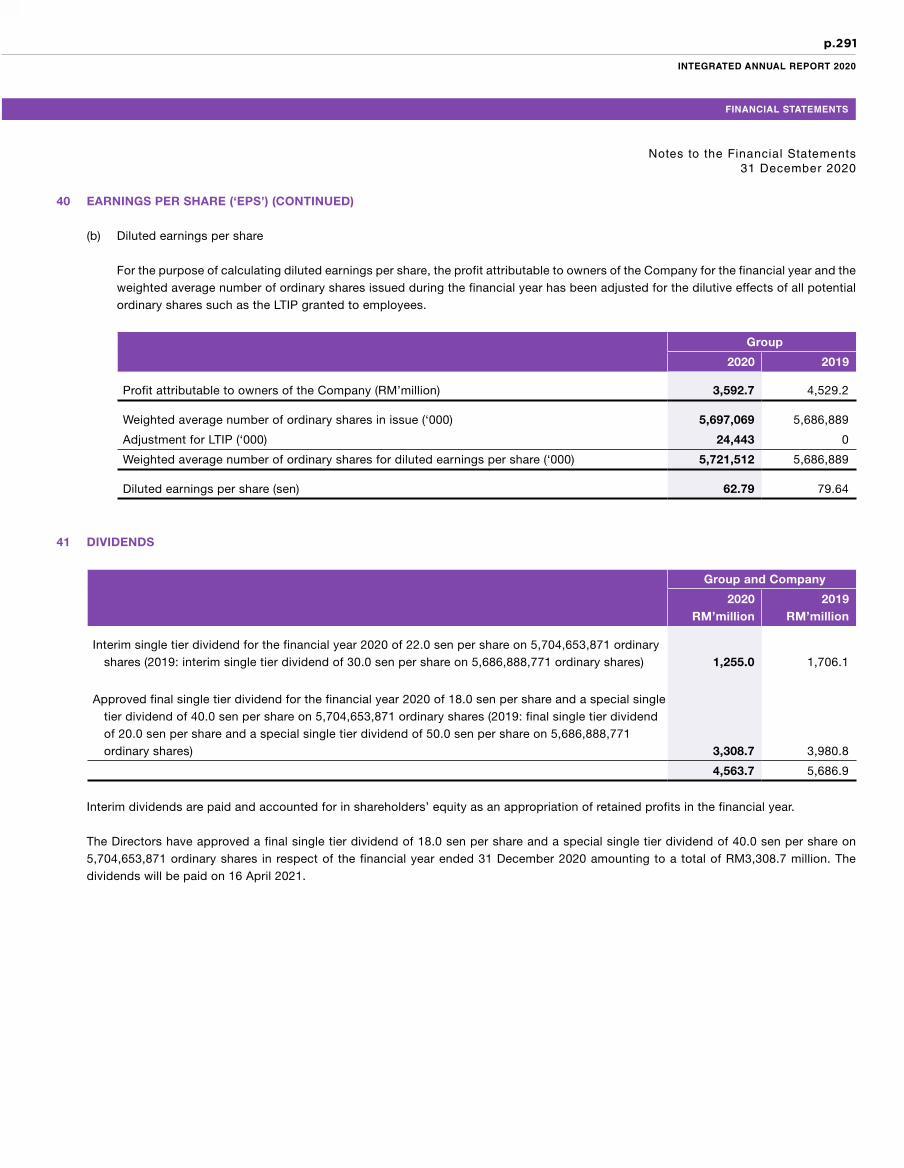
p.291
INTEGRATED ANNUAL REPORT 2020
FINANCIAL STATEMENTS
Notes to the Financial Statements31 December 2020
40 EARNINGS PER SHARE (‘EPS’) (CONTINUED)
(b) Diluted earnings per share
For the purpose of calculating diluted earnings per share, the profit attributable to owners of the Company for the financial year and the weighted average number of ordinary shares issued during the financial year has been adjusted for the dilutive effects of all potential ordinary shares such as the LTIP granted to employees.
Group
2020 2019
Profit attributable to owners of the Company (RM’million) 3,592.7 4,529.2
Weighted average number of ordinary shares in issue (‘000) 5,697,069 5,686,889
Adjustment for LTIP (‘000) 24,443 0
Weighted average number of ordinary shares for diluted earnings per share (‘000) 5,721,512 5,686,889
Diluted earnings per share (sen) 62.79 79.64
41 DIVIDENDS
Group and Company
2020RM’million
2019RM’million
Interim single tier dividend for the financial year 2020 of 22.0 sen per share on 5,704,653,871 ordinary shares (2019: interim single tier dividend of 30.0 sen per share on 5,686,888,771 ordinary shares) 1,255.0 1,706.1
Approved final single tier dividend for the financial year 2020 of 18.0 sen per share and a special single tier dividend of 40.0 sen per share on 5,704,653,871 ordinary shares (2019: final single tier dividend of 20.0 sen per share and a special single tier dividend of 50.0 sen per share on 5,686,888,771 ordinary shares) 3,308.7 3,980.8
4,563.7 5,686.9
Interim dividends are paid and accounted for in shareholders’ equity as an appropriation of retained profits in the financial year.
The Directors have approved a final single tier dividend of 18.0 sen per share and a special single tier dividend of 40.0 sen per share on 5,704,653,871 ordinary shares in respect of the financial year ended 31 December 2020 amounting to a total of RM3,308.7 million. The dividends will be paid on 16 April 2021.

p.292
TENAGA NASIONAL BERHAD
Notes to the Financial Statements31 December 2020
42 COMMITMENTS
(a) Capital commitments for 5 years
Group Company
2020RM’million
2019RM’million
2020RM’million
2019RM’million
Authorised capital expenditure not provided in the financial statements:
Property, plant and equipment
- Contracted 988.5 607.8 637.1 277.1
- Not contracted 55,365.5 53,056.4 44,093.3 46,546.5
56,354.0 53,664.2 44,730.4 46,823.6
(b) Operating lease commitments - as lessor
The Group and Company lease out its plant and equipment under non-cancellable operating leases. The lessees are required to pay absolute fixed lease payments during the lease period. Total future minimum lease receivables under non-cancellable operating leases contracted for at the reporting date but not recognised as receivables, are as follows:
Group Company
2020RM’million
2019RM’million
2020RM’million
2019RM’million
Receivable not later than 1 year 23.5 67.0 61.5 72.0
Receivable later than 1 year and not later than 2 years 0.9 67.0 34.5 47.7
Receivable later than 2 years and not later than 3 years 0.9 67.0 34.3 47.7
Receivable later than 3 years and not later than 4 years 0.7 67.0 21.5 47.7
Receivable later than 4 years and not later than 5 years 0.3 67.0 21.4 47.7
Receivable more than 5 years 0.7 68.1 122.8 133.1
27.0 403.1 296.0 395.9
Excluded in non-cancellable operating leases contracted for during the current financial year is operating lease of a subsidiary amounting to RM224.4 million, which has reclassified as liabilities directly associated with assets classified as held for sale.

p.293
INTEGRATED ANNUAL REPORT 2020
FINANCIAL STATEMENTS
Notes to the Financial Statements31 December 2020
43 CONTINGENT LIABILITIES
Accounting Policy
The Group and Company do not recognise contingent assets and liabilities other than those arising from business combinations, but disclose its existence in the financial statements. A contingent liability is a possible obligation that arises from past events whose existence will be confirmed by the occurrence or non-occurrence of one or more uncertain future events beyond the control of the Group and Company or a present obligation that is not recognised because it is not probable that an outflow of resources will be required to settle the obligation. A contingent liability also arises in the extremely rare case where there is a liability that cannot be recognised because it cannot be measured reliably. However, contingent liabilities do not include financial guarantee contracts. A contingent asset is a possible asset that arises from past events whose existence will be confirmed by the occurrence or non-occurrence of one or more uncertain future events beyond the control of the Group and Company. The Group and Company do not recognise contingent assets but disclose its existence where inflows of economic benefits are probable, but not certain.
Determination of the treatment of contingent liabilities is based on the Group and Company’s view of the expected outcome of the contingencies after consulting legal counsel for litigation cases and internal and external experts to the Group and Company for matters in the ordinary course of business.
Group Company
2020RM’million
2019RM’million
2020RM’million
2019RM’million
Claims by third parties:
- Contractors 87.0 84.0 87.0 81.1
- Customers 15.7 18.0 15.7 18.0
- Others 145.0 123.2 116.3 113.6
247.7 225.2 219.0 212.7
Trade guarantees and performance bonds 26.2 21.3 0 0
273.9 246.5 219.0 212.7
All third party claims are being resolved and the Directors are of the opinion that their outcomes will not have a material adverse effect on the financial positions of both the Group and Company.
On 7 December 2016, the Company and the Inland Revenue Board (‘IRB’) entered into a consent judgement before the Kuala Lumpur High Court to substitute the judicial review proceedings with regard to the notices of additional assessment (‘Notices’) dated 23 November 2015 for the Years of Assessment 2013 and 2014 arising from the disallowance of the Company’s reinvestment allowance claims by filing an appeal to the Special Commisioners of Income Tax (‘SCIT’). The consent judgement also provides that the IRB will not commence any proceedings relating to the Notices until this matter is determined by the SCIT and by the High Court, if there is a subsequent appeal by either party. On 15 December 2016, the Company filed notices of appeal against the Notices to the SCIT according to Section 99(1) of the Income Tax Act 1967. The appeals have since been registered before the SCIT.
Meanwhile, for the Notices issued for Years of Assessment 2015, 2016 and 2017, on 30 December 2020, both TNB and IRB have recorded a Consent Order. Pursuant to the Consent Order, the Court has granted a stay of proceedings against the enforcement of the IRB’s notices of additional assessment and leave to commence judicial review. Subsequently, the High Court has fixed the hearing for the substantive stage on 15 June 2021.

p.294
TENAGA NASIONAL BERHAD
Notes to the Financial Statements31 December 2020
43 CONTINGENT LIABILITIES (CONTINUED)
With regards to the notice of additional assessment for the Year of Assessment 2018, on 21 January 2021, both the Company and IRB have recorded a Consent Order. Pursuant to the Consent Order, the High Court has granted a stay of proceedings against the enforcement of the IRB’s notice of additional assessment. The High Court has fixed a case management on 31 March 2021 to receive further instructions from the Court with regards to the substantive stage.
The Company has obtained legal advice from its tax solicitors on the merits of the cases mentioned above and on this basis, the Directors are of the opinion that no provision is required in the financial statements for the potential tax liability up to the reporting date.
44 SIGNIFICANT RELATED PARTY DISCLOSURES
For the purposes of these financial statements, parties are considered to be related to the Group or the Company if the Group or the Company has the ability, directly or indirectly, to control the party or exercise significant influence over the party in making financial and operating decisions, or vice versa, or where the Group or the Company and the party are subject to common control or common significant influence.
The related parties of the Group and Company are:
(a) Subsidiary companies
Details of the subsidiary companies are shown in Note 7.
(b) Associate companies
Associate companies are those entities in which the Group has significant influence but not control as disclosed in Note 9.
(c) Key Management Personnel (‘KMP’)
KMP are defined as those persons having authority and responsibility for planning, directing and controlling the activities of the Group and Company either directly or indirectly. The KMP of the Group or of the Company includes Executive Directors and Non-Executive Directors of the Company and certain members of senior management of the Company.
Whenever exist, related party transactions also include transactions with entities that are controlled, jointly controlled or significantly influenced directly or indirectly by any key management personnel or their close family members.
(d) Government-related entities
Government-linked corporations are related to the Group and Company by virtue of the substantial shareholdings of Khazanah Nasional Berhad (‘KNB’), with 25.7% (2019: 27.3%) equity interest. KNB is a wholly-owned entity of MoF Incorporated which is in turn owned by the Ministry of Finance. KNB and entities directly controlled by the Government are collectively referred to as government-related entities to the Group and Company.
The Government and bodies controlled or jointly controlled by the Government of Malaysia are related parties of the Group and Company. The Group and Company enter into transactions with many of these bodies, which include but are not limited to purchasing of goods, including use of public utilities and amenities, and the placing of bank deposits.
All the transactions entered into by the Group and Company with the government-related entities are conducted in the ordinary course of the Group and Company’s businesses on negotiated terms or terms comparable to those with other entities that are not government-related, except otherwise disclosed elsewhere in the financial statements.

p.295
INTEGRATED ANNUAL REPORT 2020
FINANCIAL STATEMENTS
Notes to the Financial Statements31 December 2020
44 SIGNIFICANT RELATED PARTY DISCLOSURES (CONTINUED)
The Group and Company are principally involved in the provision of electricity as part of their ordinary operations. These services are carried out generally on commercial terms that are consistently applied to all customers. These transactions have been established on terms and conditions that are not materially different from those obtainable in transactions with unrelated parties.
Apart from the individually significant transactions and balances as disclosed elsewhere in the financial statements, the Group and Company have collectively, but not individually significant transactions with related parties.
In addition to the transactions detailed elsewhere in the financial statements, the Group and Company had the following significant transactions with the following related parties based on agreed terms during the financial year:
Associate companies KMP
2020RM’million
2019RM’million
2020RM’million
2019RM’million
Group
Income:
- Sales of electricity 1.3 1.2 0 0
- Interest income 9.9 27.6 0 0
- Dividend income 63.7 42.1 0 0
- Leasing income 24.0 25.7 0 0
Expenses:
- Purchase of electricity 2,956.6 3,795.4 0 0
- Finance cost on lease liabilities 364.0 414.3 0 0
- Key management compensations:
- Salaries, allowances and bonuses 0 0 27.9 23.7
- Benefits-in-kind 0 0 3.4 0.2
- Defined contribution retirement plan 0 0 3.6 2.7
- Other staff benefits 0 0 0.4 0.5
- LTIP expense/(reversal) 0 0 8.5 (0.2)
- Leasing expense 18.9 20.9 0 0
Amounts due from 183.5 155.8
Amounts due to (237.8) (286.6)
Investment in unquoted debt securities 215.8 331.8

p.296
TENAGA NASIONAL BERHAD
Notes to the Financial Statements31 December 2020
44 SIGNIFICANT RELATED PARTY DISCLOSURES (CONTINUED)
In addition to the transactions detailed elsewhere in the financial statements, the Group and Company had the following significant transactions with the following related parties based on agreed terms during the financial year: (continued)
Subsidiary companies Associate companies KMP
2020RM’million
2019RM’million
2020RM’million
2019RM’million
2020RM’million
2019RM’million
Company
Income:
- Sales of electricity 33.4 46.6 1.3 1.2 0 0
- Interest income 33.5 44.1 9.9 6.0 0 0
- Dividend income 114.9 59.3 57.6 31.0 0 0
- Rental income 35.3 25.3 0 0 0 0
- Leasing income 1.0 1.2 24.0 25.7 0 0
- Redemption of RPS 110.8 378.4 0 0 0 0
- Project management and consultancy 0 11.9 0 0 0 0
Expenses:
- Purchase of electricity 11,759.1 11,553.9 2,956.6 3,795.4 0 0
- Training fees 4.2 11.8 0 0 0 0
- Finance cost on lease liabilities 2,546.8 1,850.3 364.0 414.3 0 0
- Key management compensations:
- Salaries, allowances and bonuses 0 0 0 0 27.9 23.3
- Benefits-in-kind 0 0 0 0 3.4 0.2
- Defined contribution retirement plan 0 0 0 0 3.6 2.7
- Other staff benefits 0 0 0 0 0.4 0.5
- LTIP expense/(reversal) 0 0 0 0 8.5 (0.2)
- Leasing expense 0 0 18.9 20.9 0 0
Amounts due from 13,771.7 3,603.1 3.4 2.6
Amounts due to (1,411.9) (867.7) (228.1) (278.6)
Investment in unquoted debt securities 0 0 215.8 12.0
45 SEGMENTAL REPORTING
Segmental reporting is not presented as the Group is principally engaged in the generation, transmission, distribution and sales of electricity and the provision of other related services, which are substantially within a single business segment and this is consistent with the current practice of internal reporting. The Group operates primarily in Malaysia.

p.297
INTEGRATED ANNUAL REPORT 2020
FINANCIAL STATEMENTS
Notes to the Financial Statements31 December 2020
46 FINANCIAL INSTRUMENTS
Accounting Policy
Financial instruments comprise financial assets and financial liabilities. The financial assets and liabilities are offset and presented as net amount in the statement of financial position. Financial guarantees are part of the financial liabilities and recognised at fair value.
Financial assets
(a) Classification
The Group and Company classify its financial assets in the following categories: at amortised cost (‘AC’), at FVOCI or FVTPL. The classification depends on the entity’s business model for managing the financial assets and the contractual terms of the cash flows.
(i) Financial assets at AC:
• The asset is held within a business model whose objective is to collect the contractual cash flows; and• The contractual terms give rise to cash flows that are solely payments of principal and interest.
(ii) Financial assets at FVOCI:
• Equity securities which are not held for trading, and which the Group and Company have irrevocably elected at initial recognition to recognise in this category. These are strategic investments and the Group and Company consider this classification to be more relevant; and
• Debt securities where the contractual cash flows are solely principal and interest and the objective of the Group and Company’s business model is achieved both by collecting cash flows and selling financial assets.
(iii) Financial assets at FVTPL:
• Debt instruments that do not qualify for measurement at either AC or FVOCI;• Equity instruments that are held for trading; and• Equity instruments for which the Group and Company have not elected to recognise fair value gains and losses through
OCI.
The Group and Company reclassify debt instruments when and only when its business model for managing those assets changes.
(b) Recognition and derecognition
Regular purchases and sales of financial assets are recognised on the trade-date, the date on which the Group and Company commit to purchase or sell the assets. Financial assets are derecognised when the rights to receive cash flows from the financial assets have expired or have been transferred and the Group and Company have transferred substantially all the risks and rewards of ownership.
p.298
TENAGA NASIONAL BERHAD
Notes to the Financial Statements31 December 2020
46 FINANCIAL INSTRUMENTS (CONTINUED)
Accounting Policy (continued)
Financial assets (continued)
(c) Measurement
(i) Initial recognition
At initial recognition, the Group and Company measure a financial asset at its fair value plus, in the case of a financial asset not at FVTPL, transaction costs that are directly attributable to the acquisition of the financial asset. Transaction costs of financial assets carried at FVTPL are expensed in the statement of profit or loss.
Financial assets with embedded derivatives are considered in their entirety when determining whether their cash flows are solely payment of principal and interest.
(ii) Subsequent measurement
• Debt instruments
Subsequent measurement of debt instruments depends on the Group and Company’s business model for managing the asset and the cash flow characteristics of the asset. There are three measurement categories into which the Group and Company classify its debt instruments:
- AC: Interest income from financial assets at AC is included in finance income using the effective interest rate method. Any gain or loss arising on derecognition is recognised directly in profit or loss and presented in other gains/(losses) together with foreign exchange gains and losses. Impairment losses are presented as a separate line item in the statement of profit or loss.
- FVOCI: Movements in the carrying amount of debt instruments classified under FVOCI are taken through OCI. Upon derecognition of the assets, the cumulative gain or loss previously recognised in OCI is recognised to the statement of profit or loss. The interest income from these financial assets is included in the finance income using the effective interest rate method. The foreign exchange gains and losses are presented in other gains/(losses) and impairment expenses are presented as a separate line item in the statement of profit or loss.
- FVTPL: Financial assets that do not meet the criteria for AC or FVOCI are measured at FVTPL. A gain or loss on debt instruments which are measured at FVTPL are recognised in the profit or loss.
• Equity instruments
The Group and Company have elected to present fair value gains and losses on equity instruments in OCI. The fair value gains and losses of these instruments will not be reclassified subsequently to the profit or loss. Dividends from such investments are recognised in the statement of profit or loss as other income. Impairment losses (and reversal of impairment losses) on equity instruments measured at FVOCI are also reported as other changes in fair value.

p.299
INTEGRATED ANNUAL REPORT 2020
FINANCIAL STATEMENTS
Notes to the Financial Statements31 December 2020
46 FINANCIAL INSTRUMENTS (CONTINUED)
Accounting Policy (continued)
Financial assets (continued)
(d) Impairment
The Group and Company assess on a forward looking basis the expected credit losses associated with its debt instruments carried at AC and FVOCI. The impairment methodology applied depends on whether there has been a significant increase in credit risk.
The Group and Company have the following financial instruments that are subject to the ECL model:
(i) Trade receivables(ii) Contract assets(iii) Non trade receivables
• intercompany balances• amounts due from associates/joint ventures• rechargeable job orders (‘RJO’) debtors • sundry deposits for rental spaces• rental receivables• staff loans/advances• investment in unquoted debt securities
(iv) Financial guarantee contracts issued
While cash and cash equivalents are also subject to the impairment requirements of MFRS 9, the identified impairment loss was immaterial.
ECL represents a probability-weighted estimate of the difference between the present value of the cash flows according to the contract and present value of the cash flows the Group and Company are expected to receive, over the remaining life of the financial instruments. For financial guarantee contracts, the ECL is the difference between the expected payments to be reimbursed to the holder of the guaranteed debt instrument less any amounts that the Company expects to receive from the holder, the debtor or any other party.
The measurement of ECL reflects:(i) An unbiased and probability-weighted amount that is determined by evaluating a range of possible outcomes;(ii) The time value of money; and (iii) Reasonable and supportable information that is available without undue cost or effort at the reporting date about past
events, current conditions and forecasts of future economic conditions.
For trade receivables, the Group and Company apply the MFRS 9 simplified approach, which requires expected lifetime losses to be recognised from initial recognition of the receivables, except for those which are in default or credit impaired are assessed individually.
For non trade receivables, at each reporting date the Group and Company measure ECL through a loss allowance at an amount equal to 12 months ECL if credit risk on a financial instrument or a group of financial instruments has not increased significantly since initial recognition.

p.300
TENAGA NASIONAL BERHAD
Notes to the Financial Statements31 December 2020
46 FINANCIAL INSTRUMENTS (CONTINUED)
Accounting Policy (continued)
Financial assets (continued)
(d) Impairment (continued)
The Group and Company use the three-stage approach for non trade receivables which reflect their credit risks and how the loss allowances are determined for each of those stages. Summary of the assumptions underpinning the Group and Company’s ECL model for non trade receivables are as follows:
Types of non tradereceivables
Stage 1Low credit risk(12 months ECL Model)
Stage 2 Significant increase in credit risk (Lifetime ECL Model)
Stage 3Credit impaired(Lifetime ECL Model)
• Intercompany balances Positive operating cash flows/Net tangible assets (Total Assets - Total Liabilities)/Subsidiaries with assets under construction having guaranteed long term revenue contract and agents
Negative operating cash flows and net tangible liabilities (Total Assets - Total Liabilities)/without defaulting on loan repayments
Dormant/History of default
• Amounts due from associates/joint ventures/ investment in unquoted debt securities
Positive operating cash flows/Net tangible assets (Total Assets - Total Liabilities)
Negative operating cash flows and net tangible liabilities (Total Assets - Total Liabilities)/No current default
History of default and currently defaulted
• RJO debtors Covered by indent/ downpayment/Letter of Undertaking (‘LOU’)
No indent/downpayment/LOU
Accident cases
• Sundry deposits for rental spaces
Active contracts Inactive contracts and amounts outstanding less or equal to 12 months
Inactive contracts and amounts outstanding more than 12 months
• Rental receivables (net deposits)
Active contracts and amounts outstanding less or equal to 3 months
Active contracts and amounts outstanding more than 3 months
Inactive contracts
• Staff loans/advances Current employees Ex-employees with no default in payment
Ex-employees with default in payment
p.301
INTEGRATED ANNUAL REPORT 2020
FINANCIAL STATEMENTS
Notes to the Financial Statements31 December 2020
46 FINANCIAL INSTRUMENTS (CONTINUED)
Accounting Policy (continued)
Financial assets (continued)
(d) Impairment (continued)
When determining whether the credit risk of a financial asset has increased significantly since initial recognition and when estimating ECL, the Group and Company consider reasonable and supportable information that is relevant and available without undue cost or effort. This includes both quantitative and qualitative information and analysis, based on the Group and Company’s historical experience and informed credit assessment including forward-looking information, where available. Regardless of the analysis above, a significant increase in credit risk is presumed if the financial asset is past due in making a contractual payment.
The gross carrying amount of a financial asset is written off (either partially or fully) to the extent that there is no realistic prospect of recovery. This is generally the case when either the Group or Company determines that the debtor does not have assets or sources of income that could generate sufficient cash flows to repay the amounts subjected to the write off. However, financial assets that are written off could still be subject to enforcement activities in order to comply with the Group or Company’s procedures for recovery of amounts due.
Financial liabilities
The Group and Company classify its financial liabilities in the following categories: at AC or at FVTPL.
Offsetting financial instruments
Financial assets and liabilities are offset and the net amount presented in the statement of financial position (‘SOFP’) when there is a legally enforceable right to offset the recognised amounts and there is an intention to settle on a net basis, or realise the asset and settle the liability simultaneously. The legally enforceable right must not be contingent on future events and must be enforceable in the normal course of business and in the event of default, insolvency or bankruptcy.
Financial guarantee contracts
Financial guarantee contracts are contracts that require the Group or the Company to make specified payments to reimburse the holder for a loss it incurs because a specified debtor fails to make payments when due, in accordance with the terms of a debt instrument.
Financial guarantee contracts are recognised as a financial liability at the time the guarantee is issued. The liability is initially measured at fair value and subsequently at the higher of;(i) The amount determined in accordance with the ECL model; and(ii) The amount initially recognised less, where appropriate, the cumulative amount of income recognised in accordance with the
principles of MFRS 15.
The fair value of financial guarantees is determined as the present value of the difference in net cash flows between the contractual payments under the debt instrument and the payments that would be required without the guarantee, or the estimated amount that would be payable to a third party for assuming the obligations.
Where guarantees in relation to loans or other payables of associates are provided for no compensation, the fair values are accounted for as contributions and recognised as part of the cost of the investment.

p.302
TENAGA NASIONAL BERHAD
Notes to the Financial Statements31 December 2020
46 FINANCIAL INSTRUMENTS (CONTINUED)
(a) Categories of financial instruments
The financial instruments are categorised as follows:
(i) Financial assets and financial liabilities at AC;(ii) Financial assets and financial liabilities at FVTPL; and(iii) Financial assets at FVOCI.
Carrying amount
RM’millionAC
RM’millionFVTPL
RM’millionFVOCI
RM’million
2020
Group
Financial assets
Investment in unquoted debt securities 265.8 265.8 0 0
Long term receivables 72.7 72.7 0 0
Finance lease receivables 11.2 11.2 0 0
Financial assets at FVOCI 57.6 0 0 57.6
Trade receivables 3,311.2 3,311.2 0 0
Non trade receivables 908.2 908.2 0 0
Amounts due from joint ventures 19.4 19.4 0 0
Amounts due from associates 183.5 183.5 0 0
Financial assets at FVTPL 7,114.4 0 7,114.4 0
Deposits, bank and cash balances 6,441.5 6,441.5 0 0
18,385.5 11,213.5 7,114.4 57.6
Company
Financial assets
Investment in unquoted debt securities 265.8 265.8 0 0
Long term receivables 51.7 51.7 0 0
Financial assets at FVOCI 56.9 0 0 56.9
Trade receivables 2,552.3 2,552.3 0 0
Non trade receivables 178.1 178.1 0 0
Amounts due from subsidiaries 13,771.7 13,771.7 0 0
Amounts due from associates 3.4 3.4 0 0
Financial assets at FVTPL 5,326.6 0 5,326.6 0
Deposits, bank and cash balances 2,395.0 2,395.0 0 0
24,601.5 19,218.0 5,326.6 56.9

p.303
INTEGRATED ANNUAL REPORT 2020
FINANCIAL STATEMENTS
Notes to the Financial Statements31 December 2020
46 FINANCIAL INSTRUMENTS (CONTINUED)
(a) Categories of financial instruments (continued)
Carrying amount
RM’millionAC
RM’millionFVTPL
RM’millionFVOCI
RM’million
2019
Group
Financial assets
Investment in unquoted debt securities 331.8 331.8 0 0
Long term receivables 91.8 91.8 0 0
Finance lease receivables 12.9 12.9 0 0
Financial assets at FVOCI 58.9 0 0 58.9
Trade receivables 3,415.5 3,415.5 0 0
Non trade receivables 686.6 686.6 0 0
Amounts due from joint ventures 10.6 10.6 0 0
Amounts due from associates 155.8 155.8 0 0
Financial assets at FVTPL 8,109.0 0 8,109.0 0
Deposits, bank and cash balances 6,291.7 6,291.7 0 0
19,164.6 10,996.7 8,109.0 58.9
Company
Financial assets
Investment in unquoted debt securities 12.0 12.0 0 0
Long term receivables 71.7 71.7 0 0
Financial assets at FVOCI 58.2 0 0 58.2
Trade receivables 2,183.6 2,183.6 0 0
Non trade receivables 308.7 308.7 0 0
Amounts due from subsidiaries 3,603.1 3,603.1 0 0
Amounts due from associates 2.6 2.6 0 0
Financial assets at FVTPL 7,334.4 0 7,334.4 0
Deposits, bank and cash balances 2,747.3 2,747.3 0 0
16,321.6 8,929.0 7,334.4 58.2
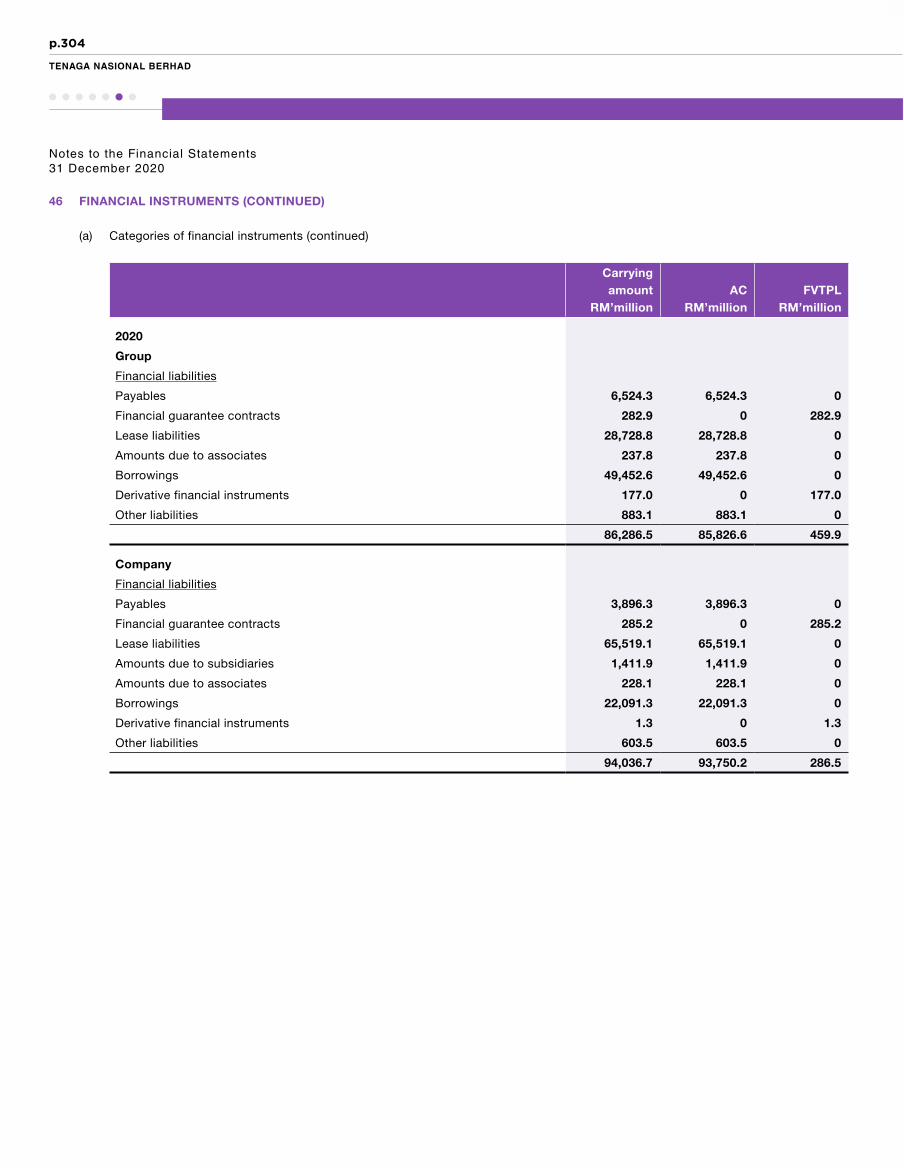
p.304
TENAGA NASIONAL BERHAD
Notes to the Financial Statements31 December 2020
46 FINANCIAL INSTRUMENTS (CONTINUED)
(a) Categories of financial instruments (continued)
Carrying amount
RM’millionAC
RM’millionFVTPL
RM’million
2020
Group
Financial liabilities
Payables 6,524.3 6,524.3 0
Financial guarantee contracts 282.9 0 282.9
Lease liabilities 28,728.8 28,728.8 0
Amounts due to associates 237.8 237.8 0
Borrowings 49,452.6 49,452.6 0
Derivative financial instruments 177.0 0 177.0
Other liabilities 883.1 883.1 0
86,286.5 85,826.6 459.9
Company
Financial liabilities
Payables 3,896.3 3,896.3 0
Financial guarantee contracts 285.2 0 285.2
Lease liabilities 65,519.1 65,519.1 0
Amounts due to subsidiaries 1,411.9 1,411.9 0
Amounts due to associates 228.1 228.1 0
Borrowings 22,091.3 22,091.3 0
Derivative financial instruments 1.3 0 1.3
Other liabilities 603.5 603.5 0
94,036.7 93,750.2 286.5

p.305
INTEGRATED ANNUAL REPORT 2020
FINANCIAL STATEMENTS
Notes to the Financial Statements31 December 2020
46 FINANCIAL INSTRUMENTS (CONTINUED)
(a) Categories of financial instruments (continued)
Carrying amount
RM’millionAC
RM’millionFVTPL
RM’million
2019
Group
Financial liabilities
Payables 7,233.9 7,233.9 0
Financial guarantee contracts 282.9 0 282.9
Lease liabilities 31,306.1 31,306.1 0
Amounts due to associates 286.6 286.6 0
Amounts due to joint ventures 0.1 0.1 0
Borrowings 45,411.7 45,411.7 0
Derivative financial instruments 45.8 0 45.8
Other liabilities 649.9 649.9 0
85,217.0 84,888.3 328.7
Company
Financial liabilities
Payables 4,124.7 4,124.7 0
Financial guarantee contracts 285.8 0 285.8
Lease liabilities 67,438.9 67,438.9 0
Amounts due to subsidiaries 867.7 867.7 0
Amounts due to associates 278.6 278.6 0
Derivative financial instruments 0.2 0 0.2
Borrowings 19,488.1 19,488.1 0
Other liabilities 634.6 634.6 0
93,118.6 92,832.6 286.0
(b) Financial risk management
The Group and Company have exposure to the following risks embedded in its financial instruments:
• Credit risk;• Liquidity risk; and• Market risk.
Credit risk
Credit risk is the risk of a financial loss to the Group and Company if a customer or counterparty to a financial instrument fails to meet its contractual obligations. The Group and Company’s exposures to credit risk arise principally from its receivables from customers, investment in unquoted debt securities, deposits, bank and cash balances and derivative financial instruments. In addition, the Company’s exposure to credit risk arises principally from loans and advances to subsidiaries and financial guarantees given to banks in respect of banking facilities granted to certain subsidiaries and an associate.

p.306
TENAGA NASIONAL BERHAD
Notes to the Financial Statements31 December 2020
46 FINANCIAL INSTRUMENTS (CONTINUED)
(b) Financial risk management (continued)
Credit risk (continued)
Net loss on impairment of financial instruments are mainly from:
Group Company
2020RM’million
2019RM’million
2020RM’million
2019RM’million
Net (losses)/gains on:
Trade receivables
- recognised in profit or loss (576.4) (274.2) (388.8) (222.1)
- reversed 109.5 84.6 55.6 24.1
Contract assets
- recognised in profit or loss (43.8) (56.6) (36.7) (44.0)
- reversed 50.5 89.8 44.0 78.4
Investment in unquoted debt securities
- recognised in profit or loss (37.6) 0 (37.6) 0
Intercompany balances
- recognised in profit or loss 0 0 (290.0) (538.7)
- reversed 0 0 299.1 258.9
Other non trade receivables
- recognised in profit or loss (47.3) (31.9) (17.1) (18.3)
- reversed 23.9 20.4 8.7 10.1
Amounts due from associates
- recognised in profit or loss (0.2) 0 (0.2) 0
- reversed 0 0.1 0 0.1
Amounts due from joint ventures
- recognised in profit or loss (28.4) 0 0 0
- reversed 3.6 0 0 0
Financial guarantee contracts
- recognised in profit or loss 0 (134.6) 0 (135.1)
- reversed 0 0 0.6 0
(546.2) (302.4) (362.4) (586.6)

p.307
INTEGRATED ANNUAL REPORT 2020
FINANCIAL STATEMENTS
Notes to the Financial Statements31 December 2020
46 FINANCIAL INSTRUMENTS (CONTINUED)
(b) Financial risk management (continued)
Credit risk (continued)
(i) Trade receivables and contract assets
Risk management objectives, policies and processes for managing the risk
The Group and Company have a credit policy in place and the exposures to credit risk are monitored on an ongoing basis. Normally, financial guarantees given by banks, shareholders or directors of customers are obtained, and credit evaluations are performed on customers requiring credit over a certain amount.
Exposure to credit risk, credit quality and collateral
The Group and Company’s credit policy provide trade receivables with a 30 to 90 days (2019: 30 to 90) credit period. The Group and Company have no major significant concentration of credit risk due to their diverse customer base. An impairment has been made for estimated unrecoverable amounts, determined by reference to past default experience of individual debtors and collection portfolios.
The total trade receivables and contract assets and the impairment provided are as follows:
Group Company
2020RM’million
2019RM’million
2020RM’million
2019RM’million
Trade receivables 5,450.7 5,181.5 4,563.5 3,861.4
Less: Loss allowances (2,139.5) (1,766.0) (2,011.2) (1,677.8)
3,311.2 3,415.5 2,552.3 2,183.6
Contract assets 3,241.6 3,564.8 3,121.2 3,400.8
Less: Loss allowances (43.8) (56.6) (36.7) (44.0)
3,197.8 3,508.2 3,084.5 3,356.8
Given the varied nature of the Group and Company’s customer base, the following analysis of trade receivables by type of customer is considered the most appropriate disclosure of credit concentration.
Group Company
2020RM’million
2019RM’million
2020RM’million
2019RM’million
Industrial 1,263.3 1,043.9 1,249.9 1,027.4
Commercial 1,814.8 1,550.3 1,725.8 1,485.0
Domestic 1,655.8 1,389.1 1,517.7 1,284.7
Specific agriculture 13.8 12.4 13.8 12.4
Mining 3.4 3.0 3.4 3.0
Public lighting 60.9 55.4 52.9 48.9
Others 638.7 1,127.4 0 0
Trade receivables 5,450.7 5,181.5 4,563.5 3,861.4
Contract assets 3,241.6 3,564.8 3,121.2 3,400.8

p.308
TENAGA NASIONAL BERHAD
Notes to the Financial Statements31 December 2020
46 FINANCIAL INSTRUMENTS (CONTINUED)
(b) Financial risk management (continued)
Credit risk (continued)
(i) Trade receivables and contract assets (continued)
Impairment losses
The loss allowance for the trade receivables and the contract assets are as follows:
GrossRM’million
IndividualimpairmentRM’million
Expectedloss rate
%
CollectiveimpairmentRM’million
NetRM’million
2020
Group
Not past due 1,396.2 (44.3) 0.7 (9.0) 1,342.9
Past due 0-30 days 385.9 (6.9) 0.9 (3.5) 375.5
Past due 31-120 days 888.7 (113.7) 4.4 (34.3) 740.7
Past due 121-240 days 564.9 (96.4) 9.8 (45.9) 422.6
Past due 241-365 days 355.1 (76.5) 62.8 (174.9) 103.7
Past due more than 365 days 1,859.9 (1,099.5) 57.2 (434.6) 325.8
Trade receivables 5,450.7 (1,437.3) (702.2) 3,311.2
Contract assets 3,241.6 (9.0) 1.1 (34.8) 3,197.8
Company
Not past due 1,146.4 (44.1) 0.6 (6.4) 1,095.9
Past due 0-30 days 289.6 (6.7) 1.0 (2.8) 280.1
Past due 31-120 days 743.9 (113.5) 3.0 (19.1) 611.3
Past due 121-240 days 483.5 (96.3) 8.6 (33.3) 353.9
Past due 241-365 days 303.2 (76.4) 67.4 (152.9) 73.9
Past due more than 365 days 1,596.9 (1,093.4) 72.8 (366.3) 137.2
Trade receivables 4,563.5 (1,430.4) (580.8) 2,552.3
Contract assets 3,121.2 (9.0) 0.9 (27.7) 3,084.5

p.309
INTEGRATED ANNUAL REPORT 2020
FINANCIAL STATEMENTS
Notes to the Financial Statements31 December 2020
46 FINANCIAL INSTRUMENTS (CONTINUED)
(b) Financial risk management (continued)
Credit risk (continued)
(i) Trade receivables and contract assets (continued)
Impairment losses (continued)
The loss allowance for the trade receivables and the contract assets are as follows: (continued)
GrossRM’million
IndividualimpairmentRM’million
Expectedloss rate
%
CollectiveimpairmentRM’million
NetRM’million
2019
Group
Not past due 1,552.6 (41.9) 0.5 (7.0) 1,503.7
Past due 0-30 days 410.7 (2.8) 4.0 (16.3) 391.6
Past due 31-120 days 837.1 (97.5) 7.4 (54.8) 684.8
Past due 121-240 days 446.9 (42.9) 23.4 (94.5) 309.5
Past due 241-365 days 291.0 (51.6) 57.8 (138.3) 101.1
Past due more than 365 days 1,643.2 (417.9) 65.3 (800.5) 424.8
Trade receivables 5,181.5 (654.6) (1,111.4) 3,415.5
Contract assets 3,564.8 (8.5) 1.4 (48.1) 3,508.2
Company
Not past due 1,240.8 (41.6) 0.6 (6.8) 1,192.4
Past due 0-30 days 325.9 (2.7) 4.1 (13.4) 309.8
Past due 31-120 days 582.1 (97.5) 9.7 (47.2) 437.4
Past due 121-240 days 322.9 (42.6) 31.1 (87.2) 193.1
Past due 241-365 days 207.0 (51.6) 86.0 (133.7) 21.7
Past due more than 365 days 1,182.7 (411.8) 96.2 (741.7) 29.2
Trade receivables 3,861.4 (647.8) (1,030.0) 2,183.6
Contract assets 3,400.8 (8.5) 1.0 (35.5) 3,356.8
p.310
TENAGA NASIONAL BERHAD
Notes to the Financial Statements31 December 2020
46 FINANCIAL INSTRUMENTS (CONTINUED)
(b) Financial risk management (continued)
Credit risk (continued)
(i) Trade receivables and contract assets (continued)
Impairment losses (continued)
The Group and Company apply MFRS 9 simplified approach to measure expected credit losses which uses a lifetime expected loss allowance for all trade receivables and contract assets.
For certain large customers with high risk of default, the Group and Company assessed the risk of loss of each customer individually based on their financial information, past trend of payments and external credit ratings, where applicable.
To measure the expected credit losses, trade receivables and contract assets have been grouped based on shared credit risk characteristics and the days past due. The contract assets that relate to unbilled customers are substantially having the same risk characteristics as the trade receivables for the same types of contracts. The Group and Company have therefore concluded that the expected loss rates for trade receivables are a reasonable approximation of the loss rates of the contract assets.
The expected loss rates are based on the payment profiles of sales over a period of 2 to 10 years and the corresponding historical credit losses experienced within this period. The historical loss rates are adjusted to reflect current and forward-looking information on macroeconomic factors affecting the ability of the customers to settle the receivables. The Group and Company have identified growth rates of real Gross Domestic Product (‘GDP’) of Malaysia to be the most relevant factor, and accordingly, adjusts the historical loss rates based on the expected changes in this factor. As at 31 December 2020, for non-government customers, a combination of growth rates of real GDP and inflation rates were identified as the most relevant factors.
During the current financial year, as a result of COVID-19, the Group and Company have considered initiatives such as moratorium period, suspension of disconnection activities, waiver for interest on late payment and some other relief packages introduced by the Government in assessing the ECL.
On that basis, the loss allowance was determined for both trade receivables and contract assets as reflected in the tables above.

p.311
INTEGRATED ANNUAL REPORT 2020
FINANCIAL STATEMENTS
Notes to the Financial Statements31 December 2020
46 FINANCIAL INSTRUMENTS (CONTINUED)
(b) Financial risk management (continued)
Credit risk (continued)
(i) Trade receivables and contract assets (continued)
Impairment losses (continued)
The opening loss allowances for trade receivables and contract assets reconcile to the closing loss allowances are as follows:
Trade receivables
Group Company
2020RM’million
2019RM’million
2020RM’million
2019RM’million
As at the beginning of the financial year (1,766.0) (1,640.1) (1,677.8) (1,471.8)
Impairment loss recognised (576.4) (274.2) (388.8) (222.1)
Impairment loss reversed 109.5 84.6 55.6 24.1
Impairment written off/(write back) 93.4 63.7 (0.2) (8.0)
As at the end of the financial year (Note 19) (2,139.5) (1,766.0) (2,011.2) (1,677.8)
Contract assets
Group Company
2020RM’million
2019RM’million
2020RM’million
2019RM’million
As at the beginning of the financial year (56.6) (83.7) (44.0) (78.4)
Impairment loss recognised (43.8) (56.6) (36.7) (44.0)
Impairment loss reversed 50.5 89.8 44.0 78.4
Impairment written off/(write back) 6.1 (6.1) 0 0
As at the end of the financial year (Note 20(b)) (43.8) (56.6) (36.7) (44.0)

p.312
TENAGA NASIONAL BERHAD
Notes to the Financial Statements31 December 2020
46 FINANCIAL INSTRUMENTS (CONTINUED)
(b) Financial risk management (continued)
Credit risk (continued)
(i) Trade receivables and contract assets (continued)
Impairment losses (continued)
Trade receivables are secured by deposits in the form of cash and bank guarantees. ECL is not provided on receivable balances fully secured by deposits. The deposit amounts are reviewed on an individual basis periodically.
Individual receivables which were known to be uncollectible were written off by reducing the carrying amount directly.
Impairment losses on trade receivables and contract assets are presented as net impairment losses within operating profit. Subsequent recoveries of amounts previously written off are credited against the same line item.
(ii) Investment in unquoted debt securities, deposits, bank and cash balances, derivative financial instruments and financial assets at FVTPL
Risk management objectives, policies and processes for managing the risk
Investments, deposits, bank and cash balances, derivative financial instruments and financial assets measured at FVTPL are liquid securities and mainly with reputable financial institutions.
Investment in unquoted debt securities are investment in an associate’s financial instruments. The credit risk of this associate is monitored on a quarterly basis and the loss allowances are provided for accordingly.
Exposure to credit risk, credit quality and collateral
The maximum exposure to credit risk is represented by the carrying amounts in the statement of financial position.
In view of the sound credit rating of counterparties, the Group and Company do not expect any counterparty to fail to meet its obligations. The Group and Company do not have overdue investments that have not been impaired.
The investments, deposits, cash and bank balances and derivative financial instruments are unsecured.

p.313
INTEGRATED ANNUAL REPORT 2020
FINANCIAL STATEMENTS
Notes to the Financial Statements31 December 2020
46 FINANCIAL INSTRUMENTS (CONTINUED)
(b) Financial risk management (continued)
Credit risk (continued)
(ii) Investment in unquoted debt securities, deposits, bank and cash balances, derivative financial instruments and financial assets at FVTPL (continued)
Exposure to credit risk, credit quality and collateral (continued)
Bank and cash balances are held with banks and financial institutions which have lower credit risks. In addition, some of the bank balances are insured by Government agencies. Consequently, the Group and Company are of the view that the loss allowance is not material and hence, it is not provided for.
The total investment in unquoted debt securities and the impairment provided are as follows:
Group Company
2020RM’million
2019RM’million
2020RM’million
2019RM’million
Investment in unquoted debt securities 303.4 331.8 303.4 12.0
Less: Loss allowances (37.6) 0 (37.6) 0
265.8 331.8 265.8 12.0
Impairment losses
The impairment for the remaining investment in unquoted debt securities, deposits, bank and cash balances, derivative financial instruments and financial assets at FVTPL during the financial year and previous financial year was insignificant.
The loss allowances for investment in unquoted debt securities for the Group and Company using the general 3-stage approach reconcile to the opening loss allowances for that provision are as follows:
Stage 1RM’million
Stage 2RM’million
Stage 3RM’million
TotalRM’million
2020
As at the beginning of the financial year 0 0 0 0
Impairment loss recognised (37.6) 0 0 (37.6)
As at the end of the financial year (37.6) 0 0 (37.6)
The impact on the carrying value of the investment in unquoted debt securities presented by the stages are as follows:
Stage 1RM’million
Stage 2RM’million
Stage 3RM’million
TotalRM’million
2020
Gross carrying amount 303.4 0 0 303.4
Less: Loss allowances (37.6) 0 0 (37.6)
Net carrying amount 265.8 0 0 265.8

p.314
TENAGA NASIONAL BERHAD
Notes to the Financial Statements31 December 2020
46 FINANCIAL INSTRUMENTS (CONTINUED)
(b) Financial risk management (continued)
Credit risk (continued)
(iii) Non trade receivables
• Intercompany balances
Risk management objectives, policies and processes for managing the risk
The Company provides unsecured loans and advances to subsidiaries. The Company monitors the results of the subsidiaries regularly.
Exposure to credit risk, credit quality and collateral
At the end of the financial year, the maximum exposure to credit risk is represented by their carrying amounts in the statement of financial position.
The total amounts due from subsidiaries and impairment provided are as follows:
Company
2020RM’million
2019RM’million
Amounts due from subsidiaries 15,414.1 6,297.3
Less: Loss allowances (1,642.4) (2,694.2)
13,771.7 3,603.1
Impairment losses
Generally, the Company considers loans and advances to subsidiaries having low credit risk. The Company assumes that there is a significant increase in credit risk when a subsidiary’s financial position deteriorates significantly based on stages determined in the accounting policy part (d) of this note. As the Company is able to determine the timing of payments of the subsidiaries’ balances when they are payable, the Company considers the amount payable to be in default when the subsidiaries are not able to pay when demanded. The Company considers a subsidiary’s balances to be impaired when:
- The subsidiary is unlikely to repay its payables to the Company in full; - The subsidiary is having negative operating cash flows and is in net tangible liabilities position; or- The subsidiary is a dormant entity or has a history of default.
At the end of the financial year, there was no indication that the amounts due from the subsidiaries are not recoverable other than those which have already been impaired. The Company does not specifically monitor the ageing of advances to the subsidiaries.

p.315
INTEGRATED ANNUAL REPORT 2020
FINANCIAL STATEMENTS
Notes to the Financial Statements31 December 2020
46 FINANCIAL INSTRUMENTS (CONTINUED)
(b) Financial risk management (continued)
Credit risk (continued)
(iii) Non trade receivables (continued)
• Intercompany balances (continued)
Impairment losses (continued)
The loss allowances for intercompany balances using the general 3-stage approach reconcile to the opening loss allowances for that provision are as follows:
Stage 1RM’million
Stage 2RM’million
Stage 3RM’million
TotalRM’million
2020
As at the beginning of the financial year (261.1) (1,151.5) (1,281.6) (2,694.2)
Impairment loss recognised (155.4) (63.0) (71.6) (290.0)
Impairment loss reversed 19.9 0.5 278.7 299.1
Impairment loss transferred 88.4 800.4 153.9 1,042.7
As at the end of the financial year (308.2) (413.6) (920.6) (1,642.4)
2019
As at the beginning of the financial year (347.0) (96.0) (1,971.4) (2,414.4)
Impairment loss recognised 165.4 (2,032.2) 1,328.1 (538.7)
Impairment loss reversed (79.5) 976.7 (638.3) 258.9
As at the end of the financial year (261.1) (1,151.5) (1,281.6) (2,694.2)
The impact on the carrying value of the intercompany balances presented by the stages are as follows:
Stage 1RM’million
Stage 2RM’million
Stage 3RM’million
TotalRM’million
2020
Gross carrying amount 13,841.4 652.1 920.6 15,414.1
Less: Loss allowances (308.2) (413.6) (920.6) (1,642.4)
Net carrying amount 13,533.2 238.5 0 13,771.7
2019
Gross carrying amount 3,210.3 1,805.4 1,281.6 6,297.3
Less: Loss allowances (261.1) (1,151.5) (1,281.6) (2,694.2)
Net carrying amount 2,949.2 653.9 0 3,603.1
p.316
TENAGA NASIONAL BERHAD
Notes to the Financial Statements31 December 2020
46 FINANCIAL INSTRUMENTS (CONTINUED)
(b) Financial risk management (continued)
Credit risk (continued)
(iii) Non trade receivables (continued)
• Other non trade receivables, amounts due from associates and joint ventures
Risk management objectives, policies and processes for managing the risk
Credit risk on other non trade receivables are mainly arising from RJO debtors which are receivables from specific works requested by customers.
Credit risk also arises from sundry deposits for rental of office spaces from third parties and rental receivables. The Company manages the credit risk together with the specific leasing arrangements.
Staff advances and staff loans have low credit risk as these are mostly provided to existing staff. These balances are managed on a monthly basis.
Amounts due from associates and joint ventures are mostly due to transactions within the Group and have a low credit risks. These balances are managed on a monthly basis.
Exposure to credit risk, credit quality and collateral
At the end of the financial year, the maximum exposure to credit risk is represented by their carrying amounts in the statement of financial position.
The Company receives down payments, LOU or indents for RJO debtors where works are requested by customers.
The Company receives deposits from third parties for rental of office spaces. For staff loans and staff advances, any repayment is done through monthly payroll deductions.
In cases of RJO debtors arising from accidental damages to the Company’s assets whereby the third party is identifiable, these amounts are fully impaired as there is very low prospect of recovery.

p.317
INTEGRATED ANNUAL REPORT 2020
FINANCIAL STATEMENTS
Notes to the Financial Statements31 December 2020
46 FINANCIAL INSTRUMENTS (CONTINUED)
(b) Financial risk management (continued)
Credit risk (continued)
(iii) Non trade receivables (continued)
• Other non trade receivables, amounts due from associates and joint ventures (continued)
The total other non trade receivables, amounts due from associates and amounts due from joint ventures and impairments provided are as follows:
Group Company
2020RM’million
2019RM’million
2020RM’million
2019RM’million
Other non trade receivables 1,188.7 930.8 360.8 503.0
Less: Loss allowances (207.8) (152.4) (131.0) (122.6)
980.9 778.4 229.8 380.4
Amounts due from associates 190.8 162.9 3.6 2.6
Less: Loss allowances (7.3) (7.1) (0.2) 0
183.5 155.8 3.4 2.6
Amounts due from joint ventures 44.2 10.6 0 0
Less: Loss allowances (24.8) 0 0 0
19.4 10.6 0 0
Impairment losses
Generally, the Group and Company consider other non trade receivables as having low credit risk. The Company assumes that there is a significant increase in credit risk when there is a history of default in payments.
The loss allowances for other non trade receivables using the general 3-stage approach reconcile to the opening loss allowances for that provision are as follows:
Stage 1RM’million
Stage 2RM’million
Stage 3RM’million
TotalRM’million
Group
2020
As at the beginning of the financial year (19.3) (0.8) (132.3) (152.4)
Impairment loss recognised (6.0) (0.2) (41.1) (47.3)
Impairment loss reversed 3.0 0.1 20.8 23.9
Impairment loss write back (4.1) (0.2) (27.7) (32.0)
As at the end of the financial year (26.4) (1.1) (180.3) (207.8)
2019
As at the beginning of the financial year (23.5) (1.0) (161.1) (185.6)
Impairment loss recognised 11.7 0.5 (44.1) (31.9)
Impairment loss reversed (7.5) (0.3) 28.2 20.4
Impairment loss written off 0 0 44.7 44.7
As at the end of the financial year (19.3) (0.8) (132.3) (152.4)

p.318
TENAGA NASIONAL BERHAD
Notes to the Financial Statements31 December 2020
46 FINANCIAL INSTRUMENTS (CONTINUED)
(b) Financial risk management (continued)
Credit risk (continued)
(iii) Non trade receivables (continued)
• Other non trade receivables, amounts due from associates and joint ventures (continued)
Impairment losses (continued)
The loss allowances for other non trade receivables using the general 3-stage approach reconcile to the opening loss allowances for that provision are as follows: (continued)
Stage 1RM’million
Stage 2RM’million
Stage 3RM’million
TotalRM’million
Company
2020
As at the beginning of the financial year (17.6) (0.4) (104.6) (122.6)
Impairment loss recognised (1.1) (0.2) (15.8) (17.1)
Impairment loss reversed 8.7 0 0 8.7
As at the end of the financial year (10.0) (0.6) (120.4) (131.0)
2019
As at the beginning of the financial year (21.5) (0.8) (92.1) (114.4)
Impairment loss recognised 8.7 0.9 (27.9) (18.3)
Impairment loss reversed (4.8) (0.5) 15.4 10.1
As at the end of the financial year (17.6) (0.4) (104.6) (122.6)

p.319
INTEGRATED ANNUAL REPORT 2020
FINANCIAL STATEMENTS
Notes to the Financial Statements31 December 2020
46 FINANCIAL INSTRUMENTS (CONTINUED)
(b) Financial risk management (continued)
Credit risk (continued)
(iii) Non trade receivables (continued)
• Other non trade receivables, amounts due from associates and joint ventures (continued)
Impairment losses (continued)
The loss allowances for amounts due from associates using the general 3-stage approach reconcile to the opening loss allowances for that provision are as follows:
Stage 1RM’million
Stage 2RM’million
Stage 3RM’million
TotalRM’million
Group
2020
As at the beginning of the financial year (7.1) 0 0 (7.1)
Impairment loss recognised (0.2) 0 0 (0.2)
As at the end of the financial year (7.3) 0 0 (7.3)
2019
As at the beginning of the financial year (7.2) 0 0 (7.2)
Impairment loss reversed 0.1 0 0 0.1
As at the end of the financial year (7.1) 0 0 (7.1)
Company
2020
As at the beginning of the financial year 0 0 0 0
Impairment loss recognised (0.2) 0 0 (0.2)
As at the end of the financial year (0.2) 0 0 (0.2)
2019
As at the beginning of the financial year (0.1) 0 0 (0.1)
Impairment loss reversed 0.1 0 0 0.1
As at the end of the financial year 0 0 0 0

p.320
TENAGA NASIONAL BERHAD
Notes to the Financial Statements31 December 2020
46 FINANCIAL INSTRUMENTS (CONTINUED)
(b) Financial risk management (continued)
Credit risk (continued)
(iii) Non trade receivables (continued)
• Other non trade receivables, amounts due from associates and joint ventures (continued)
Impairment losses (continued)
The loss allowances for amounts due from joint ventures using the general 3-stage approach reconcile to the opening loss allowances for that provision are as follows:
Stage 1RM’million
Stage 2RM’million
Stage 3RM’million
TotalRM’million
Group
2020
As at the beginning of the financial year 0 0 0 0
Impairment loss recognised (28.4) 0 0 (28.4)
Impairment loss reversed 3.6 0 0 3.6
As at the end of the financial year (24.8) 0 0 (24.8)
There was no loss allowances for amounts due from joint ventures in previous financial year.
The impact on the carrying value of other non trade receivables presented by the stages are as follows:
Stage 1RM’million
Stage 2RM’million
Stage 3RM’million
TotalRM’million
Group
2020
Gross carrying amount 932.0 65.9 190.8 1,188.7
Less: Loss allowances (26.4) (1.1) (180.3) (207.8)
Net carrying amount 905.6 64.8 10.5 980.9
2019
Gross carrying amount 729.8 51.6 149.4 930.8
Less: Loss allowances (19.3) (0.8) (132.3) (152.4)
Net carrying amount 710.5 50.8 17.1 778.4
Company
2020
Gross carrying amount 196.3 39.2 125.3 360.8
Less: Loss allowances (10.0) (0.6) (120.4) (131.0)
Net carrying amount 186.3 38.6 4.9 229.8
2019
Gross carrying amount 350.0 43.3 109.7 503.0
Less: Loss allowances (17.6) (0.4) (104.6) (122.6)
Net carrying amount 332.4 42.9 5.1 380.4

p.321
INTEGRATED ANNUAL REPORT 2020
FINANCIAL STATEMENTS
Notes to the Financial Statements31 December 2020
46 FINANCIAL INSTRUMENTS (CONTINUED)
(b) Financial risk management (continued)
Credit risk (continued)
(iii) Non trade receivables (continued)
• Other non trade receivables, amounts due from associates and joint ventures (continued)
Impairment losses (continued)
The impact on the carrying value of amounts due from associates presented by the stages are as follows:
Stage 1RM’million
Stage 2RM’million
Stage 3RM’million
TotalRM’million
Group
2020
Gross carrying amount 190.8 0 0 190.8
Less: Loss allowances (7.3) 0 0 (7.3)
Net carrying amount 183.5 0 0 183.5
2019
Gross carrying amount 162.9 0 0 162.9
Less: Loss allowances (7.1) 0 0 (7.1)
Net carrying amount 155.8 0 0 155.8
Company
2020
Gross carrying amount 3.6 0 0 3.6
Less: Loss allowances (0.2) 0 0 (0.2)
Net carrying amount 3.4 0 0 3.4
2019
Gross carrying amount 2.6 0 0 2.6
Less: Loss allowances 0 0 0 0
Net carrying amount 2.6 0 0 2.6

p.322
TENAGA NASIONAL BERHAD
Notes to the Financial Statements31 December 2020
46 FINANCIAL INSTRUMENTS (CONTINUED)
(b) Financial risk management (continued)
Credit risk (continued)
(iii) Non trade receivables (continued)
• Other non trade receivables, amounts due from associates and joint ventures (continued)
Impairment losses (continued)
The impact on the carrying value of amounts due from joint ventures presented by the stages are as follows:
Stage 1RM’million
Stage 2RM’million
Stage 3RM’million
TotalRM’million
Group
2020
Gross carrying amount 44.2 0 0 44.2
Less: Loss allowances (24.8) 0 0 (24.8)
Net carrying amount 19.4 0 0 19.4
2019
Gross carrying amount 10.6 0 0 10.6
Less: Loss allowances 0 0 0 0
Net carrying amount 10.6 0 0 10.6
(iv) Financial guarantees
Risk management objectives, policies and processes for managing the risk
The Company provides financial guarantees to banks in respect of banking facilities granted to certain subsidiaries and an associate. The Company monitors the ability of the subsidiaries and the associate to service their loans on an individual basis annually.
Exposure to credit risk, credit quality and collateral
The maximum exposure to the Company amounts to RM2,663.5 million (2019: RM3,298.8 million) representing banking facilities utilised by the subsidiaries and an associate as at the end of the financial year.
The financial guarantees are provided as credit enhancements to the subsidiaries’ and associate’s secured loans.

p.323
INTEGRATED ANNUAL REPORT 2020
FINANCIAL STATEMENTS
Notes to the Financial Statements31 December 2020
46 FINANCIAL INSTRUMENTS (CONTINUED)
(b) Financial risk management (continued)
Credit risk (continued)
(iv) Financial guarantees (continued)
Exposure to credit risk, credit quality and collateral (continued)
The total financial guarantees and loss allowances provided are as follows:
Group Company
2020RM’million
2019RM’million
2020RM’million
2019RM’million
Financial guarantees 282.9 282.9 2,663.5 3,298.8
Less: Loss allowances (282.9) (282.9) (285.2) (285.8)
0 0 2,378.3 3,013.0
Impairment losses
The Company assumes that there is a significant increase in credit risk when a subsidiary or associate has indication of defaulting on its banking facilities. The Company considers a financial guarantee to be credit impaired when the subsidiary or associate is unlikely to repay its credit obligation to the bank in full.
The Company determines the probability of default of the guaranteed loans individually using internal information available.
Loss allowance has been recognised mainly arising from the financial guarantee provided by the Group in 2016 to support the loan facility offered to Anadolu Do algaz Elektrik Üretim ve Ticaret A. . (‘ICAN’), a subsidiary of Gama Enerji. The ECL is determined based on an internal assessment of Gama Enerji’s debt servicing ability taking into account of the current adverse macroeconomic conditions in Turkey.
The movement in the loss allowances of financial guarantees during the financial year was:
Group Company
2020RM’million
2019RM’million
2020RM’million
2019RM’million
As at the beginning of the financial year (282.9) (270.3) (285.8) (272.7)
Impairment loss recognised 0 (134.6) 0 (135.1)
Impairment loss reversed 0 0 0.6 0
Crystallisation of financial guarantees 0 122.0 0 122.0
As at the end of the financial year (Note 23) (282.9) (282.9) (285.2) (285.8)

p.324
TENAGA NASIONAL BERHAD
Notes to the Financial Statements31 December 2020
46 FINANCIAL INSTRUMENTS (CONTINUED)
(b) Financial risk management (continued)
Liquidity risk
Liquidity risk is the risk that the Group and Company will not be able to meet its financial obligations as they fall due. The Group and Company’s exposures to liquidity risk arise principally from its various payables, loans and borrowings. The Group and Company monitor rolling forecasts of the Group and Company’s liquidity requirements.
As of 31 December 2020, the Group and Company’s current liabilities exceeded their current assets by RM998.8 million and RM6,151.9 million respectively.
Cash flow forecasts have been prepared for the next 12 months for both the Group and Company taking into account the expected revenue growth rates, past performance and one-off transactions expected within the next 12 months. Based on the cash flow forecasts, the Group and Company are able to generate sufficient internal cash flows from operations for the next 12 months from the reporting date to meet operational and financing needs as and when they fall due.
In addition, as at 31 December 2020, the Group and Company have undrawn borrowing facilities amounting to RM16,902.0 million and RM15,612.0 million respectively to support any cash shortfall while maintaining sufficient headroom on its undrawn borrowing facilities at all times to ensure the Group and Company have the financial flexibility.
Surplus cash of the Group and Company is invested in profit bearing current accounts, money market deposits and other instruments with appropriate maturities and sufficient liquidity level to provide sufficient headroom as determined by the cash flow forecasts and to enable the Group and Company to discharge liabilities in the normal course of business.
Hence, as at 31 December 2020, the Group and Company have sufficient financial capacity and available facility to meet its obligations as and when they fall due within 12 months from the financial statement date.

p.325
INTEGRATED ANNUAL REPORT 2020
FINANCIAL STATEMENTS
Notes to the Financial Statements31 December 2020
46 FINANCIAL INSTRUMENTS (CONTINUED)
(b) Financial risk management (continued)
Liquidity risk (continued)
The table below summarises the maturity profiles of the Group and Company’s financial liabilities as at the end of the financial year based on the undiscounted contractual payments:
Carryingamount
RM’million
Contractualcash flowsRM’million
Below 1 year
RM’million1-2 years
RM’million3-5 years
RM’million
More than 5 years
RM’million
2020
Group
Non-derivative financial liabilities
Payables 6,524.3 6,524.3 6,524.3 0 0 0
Lease liabilities 28,728.8 39,504.9 4,690.2 3,848.0 9,423.4 21,543.3
Amounts due to associates 237.8 237.8 237.8 0 0 0
Borrowings 49,452.6 63,295.0 6,505.3 2,505.3 8,123.8 46,160.6
Financial guarantee contracts 282.9 282.9 282.9 0 0 0
Other financial liabilities at AC 883.1 890.5 291.2 294.6 7.5 297.2
86,109.5 110,735.4 18,531.7 6,647.9 17,554.7 68,001.1
Derivative financial liabilities
Interest rate swaps 150.2 1,746.1 0 95.2 1,650.9 0
Profit rate swap contracts 25.5 361.3 0 0 361.3 0
Forward exchange contracts (gross settled):
- Outflows 1.3 93.3 93.3 0 0 0
86,286.5 112,936.1 18,625.0 6,743.1 19,566.9 68,001.1
Company
Non-derivative financial liabilities
Payables 3,896.3 3,896.3 3,896.3 0 0 0
Lease liabilities 65,519.1 105,454.3 9,300.5 7,450.9 18,779.0 69,923.9
Amounts due to subsidiaries 1,411.9 1,411.9 1,411.9 0 0 0
Amounts due to associates 228.1 228.1 228.1 0 0 0
Borrowings 22,091.3 30,039.7 4,224.3 881.3 2,558.8 22,375.3
Financial guarantee contracts 285.2 2,663.5 2,663.5 0 0 0
Other financial liabilities at AC 603.5 611.0 297.8 301.3 7.7 4.2
94,035.4 144,304.8 22,022.4 8,633.5 21,345.5 92,303.4
Derivative financial liability
Forward exchange contracts (gross settled):
- Outflows 1.3 93.3 93.3 0 0 0
94,036.7 144,398.1 22,115.7 8,633.5 21,345.5 92,303.4

p.326
TENAGA NASIONAL BERHAD
Notes to the Financial Statements31 December 2020
46 FINANCIAL INSTRUMENTS (CONTINUED)
(b) Financial risk management (continued)
Liquidity risk (continued)
The table below summarises the maturity profiles of the Group and Company’s financial liabilities as at the end of the financial year based on the undiscounted contractual payments: (continued)
Carryingamount
RM’million
Contractualcash flowsRM’million
Below 1 year
RM’million1-2 years
RM’million3-5 years
RM’million
More than 5 years
RM’million
2019
Group
Non-derivative financial liabilities
Payables 7,233.9 7,233.9 7,233.9 0 0 0
Lease liabilities 31,306.1 43,676.9 4,970.8 4,076.9 10,243.9 24,385.3
Amounts due to associates 286.6 286.6 286.6 0 0 0
Amounts due to joint ventures 0.1 0.1 0.1 0 0 0
Borrowings 45,411.7 71,443.1 6,041.6 7,544.1 11,175.9 46,681.5
Financial guarantee contracts 282.9 282.9 282.9 0 0 0
Other financial liabilities at AC 649.9 669.0 326.4 331.2 7.9 3.5
85,171.2 123,592.5 19,142.3 11,952.2 21,427.7 71,070.3
Derivative financial liabilities
Interest rate swap 29.7 604.5 0 0 604.5 0
Spot foreign currency contracts 0 18.7 18.7 0 0 0
Profit rate swap contracts 7.5 134.7 0 0 134.7 0
Forward exchange contracts (gross settled):
- Outflows 8.6 154.2 154.2 0 0 0
85,217.0 124,504.6 19,315.2 11,952.2 22,166.9 71,070.3
Company
Non-derivative financial liabilities
Payables 4,124.7 4,124.7 4,124.7 0 0 0
Lease liabilities 67,438.9 110,886.2 8,734.2 7,453.1 19,328.1 75,370.8
Amounts due to subsidiaries 867.7 867.7 867.7 0 0 0
Amounts due to associates 278.6 278.6 278.6 0 0 0
Borrowings 19,488.1 27,491.7 1,704.3 3,665.8 2,112.0 20,009.6
Financial guarantee contracts 285.8 3,298.8 3,298.8 0 0 0
Other financial liabilities at AC 634.6 653.6 318.8 323.6 7.8 3.4
93,118.4 147,601.3 19,327.1 11,442.5 21,447.9 95,383.8
Derivative financial liabilities
Spot foreign currency contracts 0 18.7 18.7 0 0 0
Forward exchange contracts (gross settled):
- Outflows 0.2 11.0 11.0 0 0 0
93,118.6 147,631.0 19,356.8 11,442.5 21,447.9 95,383.8

p.327
INTEGRATED ANNUAL REPORT 2020
FINANCIAL STATEMENTS
Notes to the Financial Statements31 December 2020
46 FINANCIAL INSTRUMENTS (CONTINUED)
(b) Financial risk management (continued)
Market risk
Market risk is the risk that changes in market prices, such as foreign exchange rates, interest rates and other prices will affect the Group and Company’s financial positions or cash flows.
(i) Foreign currency risk
The Group and Company are exposed to foreign currency risk on sales, purchases and borrowings that are denominated in currencies other than the respective functional currencies of the Group and Company. The currencies giving rise to this risk are primarily USD, JPY, GBP and PKR.
Risk management objectives, policies and processes for managing the risk
The Group and Company are required to hedge a minimum of 50.0% of TNB’s known foreign currency exposure up to 12 months period. The Group and Company use forward exchange contracts and maintain foreign currency floats to hedge its foreign currency risk.
Exposure to foreign currency risk
The currency exposure of financial assets and financial liabilities of the Group and Company at the end of the financial year, expressed in MYR (if not defined, Malaysian Ringgit) currency units, are as follows:
USDRM’million
JPYRM’million
GBPRM’million
OthersRM’million
2020
Group
Financial assets
Financial assets at FVOCI 0 0 0 0.4
Receivables 8.4 0 1.2 0.8
Deposits, bank and cash balances 2,057.4 0 257.7 3.6
2,065.8 0 258.9 4.8
Financial liabilities
Payables 12.0 0.7 31.0 3.8
Borrowings 7,729.5 2,372.1 2,390.9 0
7,741.5 2,372.8 2,421.9 3.8
Company
Financial assets
Amounts due from subsidiaries 104.7 0 0 0
Deposits, bank and cash balances 2,054.5 0 0 0
2,159.2 0 0 0
Financial liability
Borrowings 7,729.5 2,372.1 0 0

p.328
TENAGA NASIONAL BERHAD
Notes to the Financial Statements31 December 2020
46 FINANCIAL INSTRUMENTS (CONTINUED)
(b) Financial risk management (continued)
Market risk (continued)
(i) Foreign currency risk (continued)
Exposure to foreign currency risk (continued)
The currency exposure of financial assets and financial liabilities of the Group and Company at the end of the financial year, expressed in MYR (if not defined, Malaysian Ringgit) currency units, are as follows: (continued)
USDRM’million
JPYRM’million
GBPRM’million
PKRRM’million
OthersRM’million
2019
Group
Financial assets
Financial assets at FVOCI 0 0 0 0 0.4
Receivables 0.4 0 0 0 0.4
Deposits, bank and cash balances 2,386.9 0 96.6 0 4.8
2,387.3 0 96.6 0 5.6
Financial liabilities
Payables 11.7 3.7 0 0 6.3
Borrowings 7,873.2 2,414.8 598.7 52.9 0
7,884.9 2,418.5 598.7 52.9 6.3
Company
Financial assets
Amounts due from subsidiaries 104.6 0 0 0 0
Deposits, bank and cash balances 2,375.8 0 96.6 0 0
2,480.4 0 96.6 0 0
Financial liability
Borrowings 7,873.2 2,414.8 0 0 0

p.329
INTEGRATED ANNUAL REPORT 2020
FINANCIAL STATEMENTS
Notes to the Financial Statements31 December 2020
46 FINANCIAL INSTRUMENTS (CONTINUED)
(b) Financial risk management (continued)
Market risk (continued)
(i) Foreign currency risk (continued)
Currency risk sensitivity analysis
A 10.0% strengthening of the foreign currencies against RM at the end of the financial year would have decreased post-tax profit or loss by the amounts shown below. This analysis assumes that all other variables, in particular interest rates, remained constant and ignores any impact of forecasted sales and purchases.
Profit or loss/equity
2020RM’million
2019RM’million
Group
USD (682.3) (547.0)
JPY (151.1) (241.3)
GBP (218.3) (10.1)
Company
USD (669.6) (536.5)
JPY (151.1) (240.9)
A 10.0% weakening of the foreign currencies against RM at the end of the financial year would have had equal but opposite effect on the above currencies to the amounts shown above, on the basis that all other variables remained constant.
Foreign currency risk for the Group and Company which have a functional currency other than USD, JPY and GBP are not material and hence, sensitivity analysis is not presented.
(ii) Interest rate risk
The Group and Company’s investments in fixed rate debt securities and its fixed rate borrowings are not exposed to a significant risk of change in their fair values due to changes in interest rates. The Group and Company’s variable rate borrowings are exposed to a risk of change in cash flows due to changes in interest rates. Investment in equity securities and short term receivables and payables are not significantly exposed to interest rate risk.
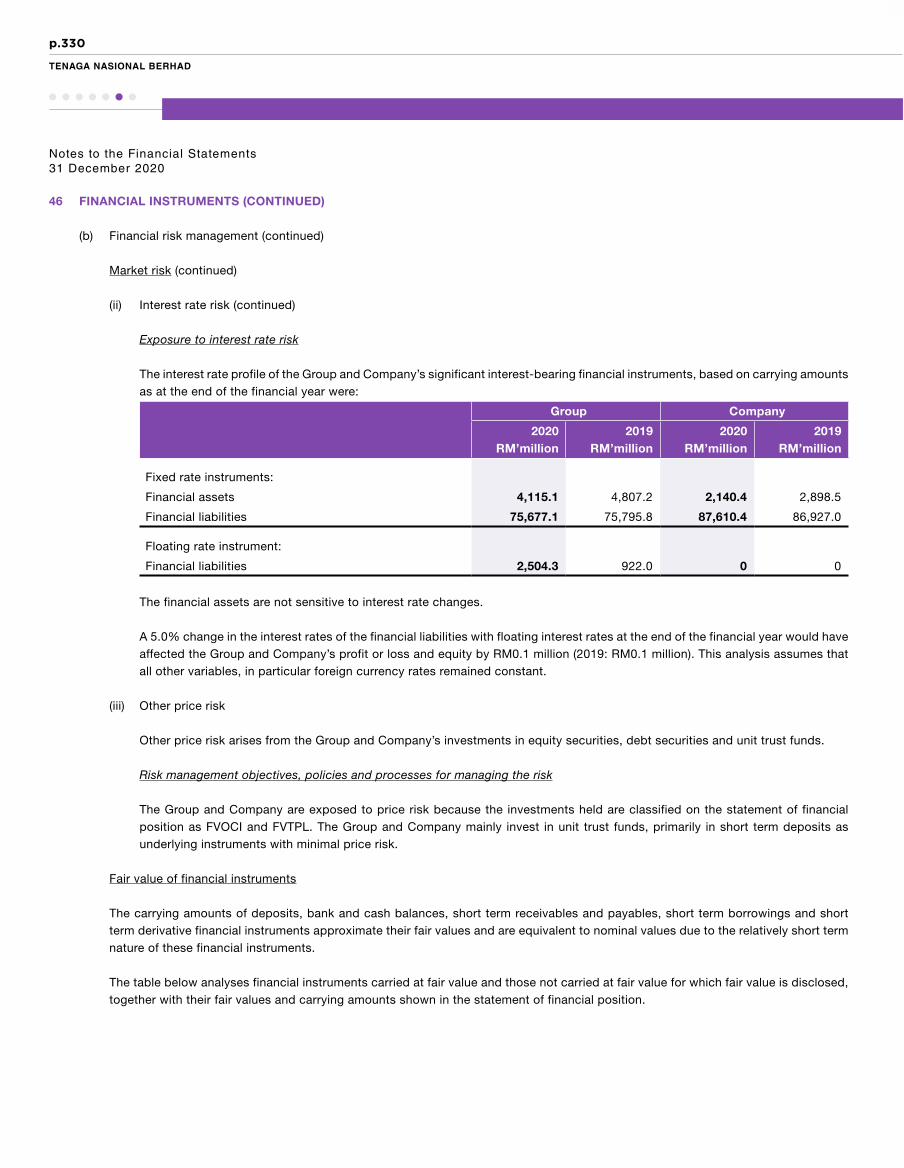
p.330
TENAGA NASIONAL BERHAD
Notes to the Financial Statements31 December 2020
46 FINANCIAL INSTRUMENTS (CONTINUED)
(b) Financial risk management (continued)
Market risk (continued)
(ii) Interest rate risk (continued)
Exposure to interest rate risk
The interest rate profile of the Group and Company’s significant interest-bearing financial instruments, based on carrying amounts as at the end of the financial year were:
Group Company
2020RM’million
2019RM’million
2020RM’million
2019RM’million
Fixed rate instruments:
Financial assets 4,115.1 4,807.2 2,140.4 2,898.5
Financial liabilities 75,677.1 75,795.8 87,610.4 86,927.0
Floating rate instrument:
Financial liabilities 2,504.3 922.0 0 0
The financial assets are not sensitive to interest rate changes.
A 5.0% change in the interest rates of the financial liabilities with floating interest rates at the end of the financial year would have affected the Group and Company’s profit or loss and equity by RM0.1 million (2019: RM0.1 million). This analysis assumes that all other variables, in particular foreign currency rates remained constant.
(iii) Other price risk
Other price risk arises from the Group and Company’s investments in equity securities, debt securities and unit trust funds.
Risk management objectives, policies and processes for managing the risk
The Group and Company are exposed to price risk because the investments held are classified on the statement of financial position as FVOCI and FVTPL. The Group and Company mainly invest in unit trust funds, primarily in short term deposits as underlying instruments with minimal price risk.
Fair value of financial instruments
The carrying amounts of deposits, bank and cash balances, short term receivables and payables, short term borrowings and short term derivative financial instruments approximate their fair values and are equivalent to nominal values due to the relatively short term nature of these financial instruments.
The table below analyses financial instruments carried at fair value and those not carried at fair value for which fair value is disclosed, together with their fair values and carrying amounts shown in the statement of financial position.

p.331
INTEGRATED ANNUAL REPORT 2020
FINANCIAL STATEMENTS
Notes to the Financial Statements31 December 2020
46 FINANCIAL INSTRUMENTS (CONTINUED)
(b) Financial risk management (continued)
Fair value of financial instruments (continued)
The classifications in the fair value hierarchy of the Group and Company’s assets and liabilities measured at fair value are summarised in the table below:
Fair value of financial instruments
carried at fair value
Fair value of financial instruments
not carried at fair value Total
fair value
RM’million
Carrying
amount
RM’million
Level 1
RM’million
Level 2
RM’million
Level 3
RM’million
Total
RM’million
Level 1
RM’million
Level 2
RM’million
Level 3
RM’million
Total
RM’million
2020
Group
Financial assets
Investment in unquoted
debt securities 0 0 0 0 0 265.8 0 265.8 265.8 265.8
Long term receivables 0 0 0 0 0 81.6 0 81.6 81.6 72.7
Financial assets at FVOCI 0 57.6 0 57.6 0 0 0 0 57.6 57.6
Financial assets at FVTPL 6,942.5 171.9 0 7,114.4 0 0 0 0 7,114.4 7,114.4
6,942.5 229.5 0 7,172.0 0 347.4 0 347.4 7,519.4 7,510.5
Financial liabilities
Lease liabilities 0 0 0 0 0 25,471.0 0 25,471.0 25,471.0 25,471.0
Borrowings 0 0 0 0 2,164.2 51,194.1 0 53,358.3 53,358.3 49,452.6
Other financial liabilities
at AC 0 0 0 0 0 838.8 0 838.8 838.8 883.1
Derivative financial
instruments 0 177.0 0 177.0 0 0 0 0 177.0 177.0
0 177.0 0 177.0 2,164.2 77,503.9 0 79,668.1 79,845.1 75,983.7
Company
Financial assets
Investment in unquoted
debt securities 0 0 0 0 0 265.8 0 265.8 265.8 265.8
Long term receivables 0 0 0 0 0 72.4 0 72.4 72.4 51.7
Financial assets at FVOCI 0 56.9 0 56.9 0 0 0 0 56.9 56.9
Amounts due from
subsidiaries 0 0 0 0 0 12,108.8 0 12,108.8 12,108.8 11,873.2
Financial assets at FVTPL 5,217.2 109.4 0 5,326.6 0 0 0 0 5,326.6 5,326.6
5,217.2 166.3 0 5,383.5 0 12,447.0 0 12,447.0 17,830.5 17,574.2
Financial liabilities
Lease liabilities 0 0 0 0 0 59,907.7 0 59,907.7 59,907.7 59,907.7
Borrowings 0 0 0 0 2,164.2 22,006.9 0 24,171.1 24,171.1 22,091.3
Other financial liabilities
at AC 0 0 0 0 0 601.5 0 601.5 601.5 603.5
Derivative financial
instruments 0 1.3 0 1.3 0 0 0 0 1.3 1.3
0 1.3 0 1.3 2,164.2 82,516.1 0 84,680.3 84,681.6 82,603.8

p.332
TENAGA NASIONAL BERHAD
Notes to the Financial Statements31 December 2020
46 FINANCIAL INSTRUMENTS (CONTINUED)
(b) Financial risk management (continued)
Fair value of financial instruments (continued)
The classifications in the fair value hierarchy of the Group and Company’s assets and liabilities measured at fair value are summarised in the table below: (continued)
Fair value of financial instruments
carried at fair value
Fair value of financial instruments
not carried at fair value Total
fair value
RM’million
Carrying
amount
RM’million
Level 1
RM’million
Level 2
RM’million
Level 3
RM’million
Total
RM’million
Level 1
RM’million
Level 2
RM’million
Level 3
RM’million
Total
RM’million
2019
Group
Financial assets
Investment in unquoted
debt securities 0 0 0 0 0 331.8 0 331.8 331.8 331.8
Long term receivables 0 0 0 0 0 99.2 0 99.2 99.2 91.8
Financial assets at FVOCI 0 58.9 0 58.9 0 0 0 0 58.9 58.9
Financial assets at FVTPL 7,937.3 171.7 0 8,109.0 0 0 0 0 8,109.0 8,109.0
7,937.3 230.6 0 8,167.9 0 431.0 0 431.0 8,598.9 8,591.5
Financial liabilities
Lease liabilities 0 0 0 0 0 27,902.8 0 27,902.8 27,902.8 27,902.8
Borrowings 0 0 0 0 2,098.8 46,354.4 0 48,453.2 48,453.2 45,411.7
Other financial liabilities
at AC 0 0 0 0 0 658.7 0 658.7 658.7 649.9
Derivative financial
instruments 0 45.8 0 45.8 0 0 0 0 45.8 45.8
0 45.8 0 45.8 2,098.8 74,915.9 0 77,014.7 77,060.5 74,010.2
Company
Financial assets
Investment in unquoted
debt securities 0 0 0 0 0 12.0 0 12.0 12.0 12.0
Long term receivables 0 0 0 0 0 88.4 0 88.4 88.4 71.7
Financial assets at FVOCI 0 58.2 0 58.2 0 0 0 0 58.2 58.2
Amounts due from
subsidiaries 0 0 0 0 0 652.8 0 652.8 652.8 645.6
Financial assets at FVTPL 7,225.3 109.1 0 7,334.4 0 0 0 0 7,334.4 7,334.4
7,225.3 167.3 0 7,392.6 0 753.2 0 753.2 8,145.8 8,121.9
Financial liabilities
Lease liabilities 0 0 0 0 0 62,534.4 0 62,534.4 62,534.4 62,534.4
Borrowings 0 0 0 0 2,098.8 19,055.8 0 21,154.6 21,154.6 19,488.1
Other financial liabilities
at AC 0 0 0 0 0 643.3 0 643.3 643.3 634.6
Derivative financial
instruments 0 0.2 0 0.2 0 0 0 0 0.2 0.2
0 0.2 0 0.2 2,098.8 82,233.5 0 84,332.3 84,332.5 82,657.3

p.333
INTEGRATED ANNUAL REPORT 2020
FINANCIAL STATEMENTS
Notes to the Financial Statements31 December 2020
46 FINANCIAL INSTRUMENTS (CONTINUED)
(b) Financial risk management (continued)
Fair value of financial instruments (continued)
(i) Policy on transfer between levels
The fair value of an asset to be transferred between levels is determined as of the date of the event or change in circumstances that caused the transfer.
There were no transfer between levels during the financial year.
(ii) Level 1 fair value
Level 1 fair value is derived from quoted prices (unadjusted) in active markets for identical assets or liabilities that the entity can access at the measurement date.
(iii) Level 2 fair value
Level 2 fair value is estimated using inputs other than quoted prices included within Level 1 that are observable for the financial assets or liabilities, either directly or indirectly.
Derivative financial instruments
The fair value is estimated by the difference between the contractual forward price and the current forward price for the residual maturity of the contract.
Non-derivative financial instruments
Fair value, which is determined for disclosure purpose, is calculated based on the present value of future principal and interest cash flows, discounted at the market rate of interest at the end of the reporting period.
(iv) Level 3 fair value
Level 3 fair values for the financial assets and liabilities are estimated using unobservable inputs.
(v) Interest rates used to determine fair value
The interest rates used to discount estimated cash flows, when applicable, ranging between 0.1% to 8.0% (2019: 0.1% to 15.9%).
Although the Group and Company believe that their estimates of fair value are appropriate, the use of different methodologies or assumptions could lead to different measurements of fair value.
The favourable and unfavourable effects of using reasonably possible alternative assumptions have been calculated by recalibrating the model values using expected cash flows and risk-adjusted discount rates based on the probability weighted average of the Group and Company’s ranges of possible outcomes.

p.334
TENAGA NASIONAL BERHAD
Notes to the Financial Statements31 December 2020
46 FINANCIAL INSTRUMENTS (CONTINUED)
(c) Offsetting of financial assets and financial liabilities
The following financial assets and financial liabilities are subject to offsetting arrangements based on Group policies and procedures:
Group Company
Gross amounts
recognisedRM’million
Gross amountsset-off in the SOFP
RM’million
Net amounts
presented inthe SOFP
RM’million
Gross amounts
recognisedRM’million
Gross amountsset-off inthe SOFP
RM’million
Net amounts
presented inthe SOFP
RM’million
Financial assets
2020
Amounts due from associates 183.5 0 183.5 3.4 0 3.4
Amounts due from subsidiaries 0 0 0 13,883.3 (111.6) 13,771.7
2019
Amounts due from associates 155.8 0 155.8 2.6 0 2.6
Amounts due from subsidiaries 0 0 0 3,962.7 (359.6) 3,603.1
Financial liabilities
2020
Amounts due to associates (237.8) 0 (237.8) (228.1) 0 (228.1)
Amounts due to subsidiaries 0 0 0 (1,728.7) 316.8 (1,411.9)
2019
Amounts due to associates (286.6) 0 (286.6) (278.6) 0 (278.6)
Amounts due to subsidiaries 0 0 0 (1,477.8) 610.1 (867.7)
47 CAPITAL RISK MANAGEMENT
The Group and Company’s main objective of capital management is to safeguard the Group and Company’s ability to continue as a going concern in order to provide returns for shareholders and benefits for other stakeholders. The Group and Company will also strive to maintain an optimal capital structure to reduce the cost of capital.
For the purpose of sustaining or changing the capital structure, the Group and Company may adjust the amount of dividends paid to shareholders, issue new shares or return capital to shareholders.
In order to be consistent with industry norms, the Group and Company monitor its capital structure on the basis of the gearing ratio. This ratio is calculated as total borrowings divided by capital employed. Total borrowings include non-current borrowings, current borrowings and hire purchase as shown in the consolidated statement of financial position. Capital employed is the summation of total equity and total borrowings.

p.335
INTEGRATED ANNUAL REPORT 2020
FINANCIAL STATEMENTS
Notes to the Financial Statements31 December 2020
47 CAPITAL RISK MANAGEMENT (CONTINUED)
The gearing ratios are as follows:
Group Company
2020RM’million
2019RM’million
2020RM’million
2019RM’million
Total borrowings 49,453.0 45,414.0 22,091.3 19,488.1
Total equity 57,449.9 59,282.1 46,755.0 49,494.7
Total capital employed 106,902.9 104,696.1 68,846.3 68,982.8
Gearing ratios 0.46 0.43 0.32 0.28
The Group and Company have met all externally imposed capital requirements.
48 SIGNIFICANT ACQUISITIONS DURING THE FINANCIAL YEAR
(a) Subsidiaries acquired by the Group during the financial year ended 31 December 2020 are as follows:
NotePurchase
considerationRM’million
Group’seffectiveinterest
acquired
Effectiveacquisition
date
Name of subsidiaries
Vortex Solar Investments S.A.R.L (‘VSI’) (i) 28.4 55.0% 1 September 2020
Southern Power Generation Sdn. Bhd. (‘SPG’) (ii) 283.0 70.0% 28 September 2020
(i) TNB International Sdn. Bhd. (‘TNBI’), a wholly-owned subsidiary of the Company previously acquired 50.0% of the share capital of VSI and categorised VSI as an associate. On 1 September 2020, TNBI completed the acquisition of additional 5.0% equity interest in VSI and subsequently obtained control of VSI resulting in deemed disposal of VSI as an associate (Note 9) and recognition as a subsidiary of the Group (Note 7). TNBI’s effective interest in VSI as at 31 December 2020 is 55.0%. The remaining 45.0% stake in VSI owned by KWAP. VSI is an investment holding company and the principal activities of its subsidiary companies are as disclosed in Note 7.
Refer to 48(b) for details of the effects of the recognition of VSI as a subsidiary of the Group.
The Group’s profit after tax for the financial year ended 31 December 2020 would have been estimated at RM3,576.5 million if VSI had been consolidated at the beginning of the financial year ended 31 December 2020. From the acquisition date up to 31 December 2020, VSI contributed a loss after tax of RM40.3 million.
(ii) On 28 September 2020, the Company acquired an additional 19.0% equity interest in its subsidiary, SPG and 13.0% Class B RPS from SIPP Energy Sdn. Bhd. for a total consideration of RM283.0 million.
SPG was incorporated on 12 August 2016 as a special purpose vehicle company for the development of a Combined Cycle Gas Turbine Power Plant in Pasir Gudang, Johor. Previously, the Company owned 51.0% equity interest in SPG. Upon completion of the acquisition, the Company holds 70.0% equity interest in SPG and SPG remains as a subsidiary of the Group. The principal activities of SPG is as disclosed in Note 7.

p.336
TENAGA NASIONAL BERHAD
Notes to the Financial Statements31 December 2020
48 SIGNIFICANT ACQUISITIONS DURING THE FINANCIAL YEAR (CONTINUED)
(b) Details of the assets, liabilities and net cash inflow as at the date of the acquisition of these subsidiaries by the Group during the financial year ended 31 December 2020 are as follows:
VSI
Book valueRM’million
Fair valueRM’million
Recognised amounts of identifiable assets acquired and liabilities assumed:
- Property, plant and equipment (Note 5) 2,375.6 2,540.5
- Right-of-use assets (Note 6) 145.0 175.0
- Receivables, deposits and prepayments 122.8 122.8
- Deposits, bank and cash balances 95.3 95.3
- Inventories 4.1 4.1
- Payables (22.3) (22.3)
- Short term borrowings (90.7) (90.7)
- Borrowings (2,141.8) (2,141.8)
- Deferred tax liabilities (Note 12) (14.6) (46.0)
- Derivative financial instruments (93.3) (93.3)
- Other liabilities (144.3) (149.1)
- Lease liabilities (Note 15) (147.9) (175.0)
Total identifiable net assets 87.9 219.5
Non-controlling interests (98.8)
Goodwill on consolidation (Note 10) 192.1
Total 312.8
Cash consideration paid 28.4
Acquisition-date fair value of previously held equity 284.4
Total purchase consideration 312.8
Cash consideration paid (28.4)
Cash and cash equivalents assumed 95.3
Net cash inflow on acquisition 66.9

p.337
INTEGRATED ANNUAL REPORT 2020
FINANCIAL STATEMENTS
Notes to the Financial Statements31 December 2020
49 SIGNIFICANT EVENT DURING THE FINANCIAL YEAR
On 29 July 2019, the Board of Directors of the Company had approved a proposed internal reorganisation by way of a members’ scheme of arrangement under Section 366 of the Companies Act 2016. The proposed internal reorganisation was undertaken to reorganise the Company’s domestic power generation under a new company, TNB Power Generation Sdn. Bhd. (‘TNBPG’). This is in line with the Company’s strategic transformation plan, Reimagining TNB, which aims to prepare the Company for the upcoming reforms in the electricity supply industry in Malaysia.
On 1 October 2020, the Company transferred assets, liabilities and business undertakings (including shares held in certain of its subsidiaries) to TNBPG for a purchase consideration of RM11,211.3 million. The Company has recognised the purchase consideration as part of amounts due from subsidiaries in non-current assets as at 31 December 2020.
This transaction has no impact to the financial statements of the Group.
50 EVENT AFTER REPORTING PERIOD
On 27 January 2021, the Board of Directors had approved the conversion of the amounts due from a subsidiary in respect of TNBPG totalling RM11,211.3 million, into 60.0% equity and 40.0% shareholder loan. The equity comprises RM225.0 million ordinary shares and RM6,495.0 million RPS.
In February 2021, the Company had finalised and agreed on the terms of reference of the shareholder loan amounting to RM4,491.3 million, based on the Islamic financing structure, for a profit rate of 3.75% per annum repayable over 15 years.

p.338
TENAGA NASIONAL BERHAD
Statement by DirectorsPURSUANT TO SECTION 251(2) OF THE COMPANIES ACT 2016
Statutory DeclarationPURSUANT TO SECTION 251(1) OF THE COMPANIES ACT 2016
We, Dato’ Seri Mahdzir bin Khalid and Datuk Ir. Baharin bin Din, the Directors of Tenaga Nasional Berhad, do hereby state that, in the opinion of the Directors, the financial statements set out on pages 175 to 337 are drawn up so as to give a true and fair view of the financial position of the Group and of the Company as at 31 December 2020 and financial performance of the Group and of the Company for the financial year ended 31 December 2020 in accordance with Malaysian Financial Reporting Standards, International Financial Reporting Standards and the requirements of the Companies Act 2016 in Malaysia.
Signed on behalf of the Board of Directors, in accordance with a resolution dated 17 March 2021.
DATO’ SERI MAHDZIR BIN KHALID DATUK IR. BAHARIN BIN DINCHAIRMAN PRESIDENT/CHIEF EXECUTIVE OFFICER
I, Nazmi bin Othman, the Officer primarily responsible for the financial management of Tenaga Nasional Berhad, do solemnly and sincerely declare that the financial statements set out on pages 175 to 337 are, in my opinion, correct and I make this solemn declaration conscientiously believing the same to be true, and by virtue of the provisions of the Statutory Declarations Act, 1960.
NAZMI BIN OTHMAN
Subscribed and solemnly declared by the abovenamed Nazmi bin Othman at Kuala Lumpur, Malaysia on 17 March 2021, before me.
COMMISSIONER FOR OATHS

p.339
INTEGRATED ANNUAL REPORT 2020
FINANCIAL STATEMENTS
REPORT ON THE AUDIT OF THE FINANCIAL STATEMENTS
Our opinion
In our opinion, the financial statements of Tenaga Nasional Berhad (“the Company”) and its subsidiaries (“the Group”) give a true and fair view of the financial position of the Group and of the Company as at 31 December 2020, and of their financial performance and their cash flows for the financial year then ended in accordance with Malaysian Financial Reporting Standards, International Financial Reporting Standards and the requirements of the Companies Act 2016 in Malaysia.
What we have audited
We have audited the financial statements of the Group and of the Company, which comprise the statements of financial position as at 31 December 2020 of the Group and of the Company, and the statements of profit or loss, statements of comprehensive income, statements of changes in equity and statements of cash flows of the Group and of the Company for the financial year then ended, and notes to the financial statements, including a summary of significant accounting policies, as set out on pages 175 to 337.
Basis for opinion
We conducted our audit in accordance with approved standards on auditing in Malaysia and International Standards on Auditing. Our responsibilities under those standards are further described in the “Auditors’ responsibilities for the audit of the financial statements” section of our report.
We believe that the audit evidence we have obtained is sufficient and appropriate to provide a basis for our opinion.
Independence and other ethical responsibilities
We are independent of the Group and of the Company in accordance with the By-Laws (on Professional Ethics, Conduct and Practice) of the Malaysian Institute of Accountants (“By-Laws”) and the International Ethics Standards Board for Accountants’ International Code of Ethics for Professional Accountants (including International Independence Standards) (“IESBA Code”), and we have fulfilled our other ethical responsibilities in accordance with the By-Laws and the IESBA Code.
Our audit approach
As part of designing our audit, we determined materiality and assessed the risks of material misstatement in the financial statements of the Group and of the Company. In particular, we considered where the Directors made subjective judgements; for example, in respect of significant accounting estimates that involved making assumptions and considering future events that are inherently uncertain. As in all of our audits, we also addressed the risk of management override of internal controls, including among other matters, consideration of whether there was evidence of bias that represented a risk of material misstatement due to fraud.
We tailored the scope of our audit in order to perform sufficient work to enable us to provide an opinion on the financial statements as a whole, taking into account the structure of the Group and of the Company, the accounting processes and controls, and the industry in which the Group and the Company operate.
Independent Auditors’ ReportTO THE MEMBERS OF TENAGA NASIONAL BERHAD (INCORPORATED IN MALAYSIA) (COMPANY NO.199001009294(200866-W))

p.340
TENAGA NASIONAL BERHAD
REPORT ON THE AUDIT OF THE FINANCIAL STATEMENTS (CONTINUED)
Key audit matters
Key audit matters are those matters that, in our professional judgement, were of most significance in our audit of the financial statements of the Group and of the Company for the current financial year. These matters were addressed in the context of our audit of the financial statements of the Group and of the Company as a whole, and in forming our opinion thereon, and we do not provide a separate opinion on these matters.
Key audit matters How our audit addressed the key audit matters
Revenue recognition for sales of electricity
Refer to Note 4 – Critical Accounting Estimates and Judgements and Note 33 – Revenue
Sales of electricity of RM43,203.3 million and RM40,521.3 million is the most significant component of the Group’s and Company’s revenue respectively for the financial year ended 31 December 2020.
Revenue from sales of electricity is based on the end customers’ consumption and the related tariff rates, which are governed by the Incentive Based Regulations imposed by the Suruhanjaya Tenaga.
We focused on the revenue recognition for sales of electricity as it involves the use of complex billing and accounting systems to process large volumes of data with different tariffs based on respective customer categories and consumption.
We performed the following audit procedures:
• Tested the overall information technology general controls of the billing and accounting systems recording the revenue transactions.
• Tested the application controls within the billing systems over the:
- maintenance of tariff rates in the billing systems;- accuracy of calculation of amounts billed to customers; and- recording of revenue transactions.
• Tested the billings and revenue adjustments on a sampling basis to assess whether the revenue recognised and revenue adjustments are valid and recorded accurately.
Based on the above procedures performed, we did not find any material exceptions.
Reinvestment allowance (‘RIA’) claims
Refer to Note 4 – Critical Accounting Estimates and Judgements and Note 43 – Contingent Liabilities
On 23 November 2015, Inland Revenue Board (‘IRB’) had disallowed the Company’s RIA claims for the Years of Assessment 2013 and 2014 and had issued notices of additional assessments (‘Notices’) of RM2,068.2 million to the Company. The Company had filed an appeal to the Special Commissioners of the Income Tax (‘SCIT’) against the Notices.
On 28 November 2019, the IRB had also disallowed the Company’s RIA claims for the Years of Assessment 2015, 2016 and 2017 by issuing Notices of RM3,977.9 million to the Company. On 5 October 2020, the Company had commenced judicial review application against the said Notices. On 30 December 2020, the Company and the IRB recorded a consent order in relation to the judicial review filed and the Court had granted a stay of proceedings against the enforcement of the IRB’s notices of additional assessment and leave to commence judicial review. Subsequently, the High Court fixed the hearing for the substantive stage on 15 June 2021.
We evaluated the Directors’ assessment on the basis of recoverability of the tax recoverable of RM3,522.4 million and the potential tax liability by assessing the independent legal confirmation obtained from management’s external legal counsel.
Examined the correspondence between the Company and the tax authority and assessed the matters in dispute based on advice received from our own tax experts to review the basis of application of the relevant tax laws.
Based on the procedures performed above, we did not find any material exceptions to the Directors’ judgement in the treatment of the tax recoverable balance and the potential tax liability.
Independent Auditors’ Repor t

p.341
INTEGRATED ANNUAL REPORT 2020
FINANCIAL STATEMENTS
REPORT ON THE AUDIT OF THE FINANCIAL STATEMENTS (CONTINUED) Key audit matters (continued)
Key audit matters How our audit addressed the key audit matters
On 13 July 2020, the IRB had also disallowed the Company’s RIA claims for the Years of Assessment 2018 by issuing notice of additional assessment of RM1,812.5 million to the Company. The Company had commenced judicial review application against the said Notices and the leave application was heard by the High Court on 21 September 2020 and the High Court had granted leave to the Company to commence judicial review proceedings against the IRB on 30 September 2020.
As at 31 December 2020, the Group and Company recorded a tax recoverable of RM3,522.4 million from IRB arising from the resubmission of tax computations for the Years of Assessment 2003 to 2006 and 2008 to 2012 of RM1,765.1 million, pursuant to the explicit approval given by the IRB on 21 January 2013 on the eligibility of the Company in claiming the RIA and the payment of RM1,757.3 million, which had been made to IRB in December 2020 in respect of Years of Assessment 2016 and 2017, based on a legal view obtained from external legal counsel.
In addition, the Group and Company have not recorded the potential tax liability arising from the tax impact if the RIA claimed is disallowed and the Company loses its appeal.
We focused on this area due to the inherent uncertainties involved in the outcome of judgement on the RIA claims by the SCIT and by the Kuala Lumpur High Court, including if there is a subsequent appeal by either party.
Assessment on carrying value of post-employment benefits
Refer to Note 4 – Critical Accounting Estimates and Judgements and Note 25 – Employee Benefits
As at 31 December 2020, the Group and Company recorded post-employment benefits of RM13,852.7 million and RM13,079.1 million respectively.
Management assessed the present value of post-employment benefit plans by relying on the actuarial valuation reports from an actuary. The actuarial valuation reports estimated the present value of post-employment benefit plans based on key assumptions that comprised expected rate of salary increases, medical cost inflation and discount rates.
We focused on this area because of the significant estimates made by management in determining the present value of post-employment benefit plans.
We performed the following audit procedures:
• Obtained an understanding of the terms and conditions of the post-employment benefit plans.
• Tested the present value of post-employment benefit plans based on the actuarial valuation reports by performing the following:
- Discussed with actuary the valuation method used and checked that the valuation method is acceptable in accordance with MFRS 119 ‘Employee Benefits’;
- Discussed with actuary on the key assumptions used in the actuarial valuation and checked the reasonableness by comparing to historical data;
- Checked the reasonableness of the discount rates with the assistance of our valuation experts by comparing to market yields of high quality government securities at reporting date;
- Checked the membership data used in the actuarial models through inspection of payroll personnel files and other supporting documents; and
- Compared the fair value of plan assets based on the actuary report against the trustee’s report.
Based on the procedures performed above, we did not find any material exceptions to the Director’s estimates of the post-employment benefits carrying value.
Independent Auditors’ Repor t

p.342
TENAGA NASIONAL BERHAD
REPORT ON THE AUDIT OF THE FINANCIAL STATEMENTS (CONTINUED) Key audit matters (continued)
Key audit matters How our audit addressed the key audit matters
Impairment assessments of non-current assets other than goodwill
Refer to Note 4 – Critical Accounting Estimates and Judgements and Note 7 – Subsidiaries
Management performed impairment assessments of certain non-current assets of the Company, other than goodwill, which had impairment indicators. As a result, impairment losses totaling RM149.0 million at TNB Company in respect of the Company’s investment in Power and Energy International (Mauritius) Ltd. was recognised during the financial year ended 31 December 2020.
We focused on this area as the recoverable amounts of the non-current assets are determined based on discounted cash flows projections, which require judgement on the part of management on the future financial performance and the key assumptions used, in particular, gas price, plant load factor, plant availability factor and terminal growth rate.
We have assessed management’s impairment assessments. Our procedures in relation to management’s impairment assessment includes the following:
• We assessed the reliability of management’s forecast through the review of past trends of actual financial performances against previous forecasted results;
• We assessed the key assumptions used by management in the discounted future cash flows projections, in particular, gas price, plant load factor, plant availability factor and terminal growth rate, by comparing with historical results and market outlook;
• We performed sensitivity analysis on discount rates, gas price, plant load factor and plant availability factor and terminal growth rate used to evaluate the impact on the impairment assessment; and
• We assessed the adequacy and reasonableness of the disclosures in the financial statements.
Based on the procedures performed, we noted no significant exceptions.
Information other than the financial statements and auditors’ report thereon
The Directors of the Company are responsible for the other information. The other information comprises the Directors’ Report, Statement on Risk Management and Internal Control and the Board Risk Committee Report, which we obtained prior to the date of this auditors’ report, and the remaining Integrated Annual Report 2020 of Tenaga Nasional Berhad, which is expected to be made available to us after that date. Other information does not include the financial statements of the Group and of the Company and our auditors’ report thereon.
Our opinion on the financial statements of the Group and of the Company does not cover the other information and we do not express any form of assurance conclusion thereon.
In connection with our audit of the financial statements of the Group and of the Company, our responsibility is to read the other information and, in doing so, consider whether the other information is materially inconsistent with the financial statements of the Group and of the Company or our knowledge obtained in the audit or otherwise appears to be materially misstated.
If, based on the work we have performed on the other information that we obtained prior to the date of this auditors’ report, we conclude that there is a material misstatement of this other information, we are required to report that fact. We have nothing to report in this regard.
Responsibilities of the Directors for the financial statements
The Directors of the Company are responsible for the preparation of the financial statements of the Group and of the Company that give a true and fair view in accordance with Malaysian Financial Reporting Standards, International Financial Reporting Standards and the requirements of the Companies Act 2016 in Malaysia. The Directors are also responsible for such internal control as the Directors determine is necessary to enable the preparation of financial statements of the Group and of the Company that are free from material misstatement, whether due to fraud or error.
In preparing the financial statements of the Group and of the Company, the Directors are responsible for assessing the Group’s and the Company’s ability to continue as a going concern, disclosing, as applicable, matters related to going concern and using the going concern basis of accounting unless the Directors either intend to liquidate the Group or the Company or to cease operations, or have no realistic alternative but to do so.
Independent Auditors’ Repor t

p.343
INTEGRATED ANNUAL REPORT 2020
FINANCIAL STATEMENTS
REPORT ON THE AUDIT OF THE FINANCIAL STATEMENTS (CONTINUED)
Auditors’ responsibilities for the audit of the financial statements
Our objectives are to obtain reasonable assurance about whether the financial statements of the Group and of the Company as a whole are free from material misstatement, whether due to fraud or error, and to issue an auditors’ report that includes our opinion. Reasonable assurance is a high level of assurance, but is not a guarantee that an audit conducted in accordance with approved standards on auditing in Malaysia and International Standards on Auditing will always detect a material misstatement when it exists. Misstatements can arise from fraud or error and are considered material if, individually or in the aggregate, they could reasonably be expected to influence the economic decisions of users taken on the basis of these financial statements.
As part of an audit in accordance with approved standards on auditing in Malaysia and International Standards on Auditing, we exercise professional judgement and maintain professional scepticism throughout the audit. We also:
(a) Identify and assess the risks of material misstatement of the financial statements of the Group and of the Company, whether due to fraud or error, design and perform audit procedures responsive to those risks, and obtain audit evidence that is sufficient and appropriate to provide a basis for our opinion. The risk of not detecting a material misstatement resulting from fraud is higher than for one resulting from error, as fraud may involve collusion, forgery, intentional omissions, misrepresentations, or the override of internal control.
(b) Obtain an understanding of internal control relevant to the audit in order to design audit procedures that are appropriate in the circumstances, but not for the purpose of expressing an opinion on the effectiveness of the Group’s and of the Company’s internal control.
(c) Evaluate the appropriateness of accounting policies used and the reasonableness of accounting estimates and related disclosures made by the Directors.
(d) Conclude on the appropriateness of the Directors’ use of the going concern basis of accounting and, based on the audit evidence obtained, whether a material uncertainty exists related to events or conditions that may cast significant doubt on the Group’s or on the Company’s ability to continue as a going concern. If we conclude that a material uncertainty exists, we are required to draw attention in our auditors’ report to the related disclosures in the financial statements of the Group and of the Company or, if such disclosures are inadequate, to modify our opinion. Our conclusions are based on the audit evidence obtained up to the date of our auditors’ report. However, future events or conditions may cause the Group or the Company to cease to continue as a going concern.
(e) Evaluate the overall presentation, structure and content of the financial statements of the Group and of the Company, including the disclosures, and whether the financial statements of the Group and of the Company represent the underlying transactions and events in a manner that achieves fair presentation.
(f) Obtain sufficient appropriate audit evidence regarding the financial information of the entities or business activities within the Group to express an opinion on the financial statements of the Group. We are responsible for the direction, supervision and performance of the group audit. We remain solely responsible for our audit opinion.
We communicate with the Directors regarding, among other matters, the planned scope and timing of the audit and significant audit findings, including any significant deficiencies in internal control that we identify during our audit.
We also provide the Directors with a statement that we have complied with relevant ethical requirements regarding independence, and to communicate with them all relationships and other matters that may reasonably be thought to bear on our independence, and where applicable, actions taken to eliminate threats or safeguards applied.
From the matters communicated with the Directors, we determine those matters that were of most significance in the audit of the financial statements of the Group and of the Company for the current financial year and are therefore the key audit matters. We describe these matters in our auditors’ report unless law or regulation precludes public disclosure about the matter or when, in extremely rare circumstances, we determine that a matter should not be communicated in our report because the adverse consequences of doing so would reasonably be expected to outweigh the public interest benefits of such communication.
Independent Auditors’ Repor t

p.344
TENAGA NASIONAL BERHAD
REPORT ON OTHER LEGAL AND REGULATORY REQUIREMENTS
In accordance with the requirements of the Companies Act 2016 in Malaysia, we report that the subsidiaries of which we have not acted as auditors, are disclosed in Note 7 to the financial statements.
OTHER MATTERS
This report is made solely to the members of the Company, as a body, in accordance with Section 266 of the Companies Act 2016 in Malaysia and for no other purpose. We do not assume responsibility to any other person for the content of this report.
PRICEWATERHOUSECOOPERS PLT AZIZAN BIN ZAKARIALLP0014401-LCA & AF 1146 02930/05/2022 JChartered Accountants Chartered Accountant
Kuala Lumpur17 March 2021
Independent Auditors’ Repor t

AdditionalInformation
346Corporate Information
347Statistics of Shareholdings
350Net Book Value ofLand & Buildings
351Notice of The 31st
Annual General Meeting
354Statement Accompanying Notice of The 31st Annual General Meeting
• Proxy Form

p.346
TENAGA NASIONAL BERHAD
Corporate Information
BOARD OF DIRECTORS
DATO’ SERI MAHDZIR BIN KHALIDChairmanNon-Independent Non-Executive Director(Appointed w.e.f. 12 May 2020)
DATUK IR. BAHARIN BIN DINPresident/Chief Executive OfficerNon-Independent Executive Director(Appointed w.e.f. 1 March 2021)
DATO’ ASRI BIN HAMIDIN @ HAMIDONNon-Independent Non-Executive Director(Appointed w.e.f. 1 July 2020)
AMRAN HAFIZ BIN AFFIFUDINNon-Independent Non-Executive Director
NORAINI BINTI CHE DANSenior Independent Non-Executive Director
JUNIWATI RAHMAT HUSSINIndependent Non-Executive Director
TAN SRI AHMAD BADRI BIN MOHD ZAHIRChairmanNon-Independent Non-Executive Director(Cessation of Office as Chairman w.e.f. 11 May 2020)
GEE SIEW YOONGIndependent Non-Executive Director(Cessation of Office as Director w.e.f. 30 June 2020)
DATIN RASHIDAH BINTI MOHD SIESNon-Independent Non-Executive Director(Appointed w.e.f. 1 May 2020)(Resigned w.e.f. 1 July 2020)
DATO’ CHEOK LAY LENGIndependent Non-Executive Director(Resigned w.e.f. 1 October 2020)
DATUK SERI AMIR HAMZAH BIN AZIZANPresident/Chief Executive OfficerNon-Independent Executive Director(Resigned w.e.f. 28 February 2021)
GOPALA KRISHNAN K.SUNDARAMIndependent Non-Executive Director
ONG AI LINIndependent Non-Executive Director
DATO’ ROSLINA BINTI ZAINALIndependent Non-Executive Director(Redesignated as Independent Director w.e.f. 28 April 2020)
DATO’ IR. NAWAWI BIN AHMADIndependent Non-Executive Director(Appointed w.e.f. 16 October 2020)
DATUK RAWISANDRAN A/L NARAYANANIndependent Non-Executive Director(Appointed w.e.f. 16 October 2020)
AZMIN BIN ISHAK(Alternate Director to Dato’ Asri bin Hamidin @ Hamidon)Non-Independent Non-Executive Director (Appointed w.e.f. 1 July 2020)
SENIOR INDEPENDENTNON-EXECUTIVE DIRECTORNoraini binti Che DanEmail : [email protected]
COMPANY SECRETARYNorazni binti Mohd Isa (LS 0009635)(SSM Practicing Certificate No. 201908000492)
SHARE REGISTRARBoardroom Share Registrars Sdn. Bhd. 199601006647 (378993-D)11th Floor, Menara SymphonyNo. 5, Jalan Prof. Khoo Kay KimSeksyen 1346200 Petaling JayaSelangor Darul EhsanMalaysia
Telephone : +603-7890 4700Facsimile : +603-7890 4670Website : www.boardroomlimited.myEmail : [email protected]
DIVIDEND SERVICE PROVIDERBursa Malaysia Depository Sdn. Bhd.198701006854 (165570-W)10th Floor, Exchange SquareBukit Kewangan50200 Kuala LumpurMalaysia
Telephone : +603-2034 7751Facsimile : +603-2026 3712
PRINCIPAL BANKERMalayan Banking Berhad 196001000142 (3813-K)
EXTERNAL AUDITORSMessrs PricewaterhouseCoopers PLT (LLP0014401-LCA & AF 1146)Chartered AccountantsLevel 10, 1 Sentral Jalan Rakyat Kuala Lumpur SentralP.O. Box 1019250706 Kuala LumpurMalaysia
Telephone : +603-2173 1188Facsimile : +603-2173 1288
REGISTERED OFFICE Tenaga Nasional Berhad199001009294 (200866-W)Pejabat Setiausaha Syarikat, Tingkat 2Ibu Pejabat Tenaga Nasional BerhadNo. 129, Jalan Bangsar 59200 Kuala LumpurMalaysia
Telephone : +603-2296 5566Facsimile : +603-2283 3686Website : www.tnb.com.myTNB Careline : 15454 (for power outage or TNB street light malfunction) : 1-300-88-5454 (for billing and account enquiries)Online Whistle : wbis.tnb.com.myBlowingInformationSystemToll Free : 1-800-888-862
INVESTOR RELATIONSCoE Investor RelationsGroup Finance DivisionTenaga Nasional Berhad4th Floor, TNB HeadquartersNo. 129, Jalan Bangsar59200 Kuala LumpurMalaysia
Telephone : +603-2296 5566Facsimile : +603-2108 2034Email : [email protected]
STOCK EXCHANGE LISTINGMain Market of Bursa Malaysia Securities Berhad (Listed since 28 May 1992)
AMERICAN DEPOSITORY RECEIPTS PROGRAMME (ADR)ADR Level 1
AGM HELP DESKTelephone : +603-2107 4515/4517 (Share Administration Section Company Secretary’s Office Tenaga Nasional Berhad)

p.347
INTEGRATED ANNUAL REPORT 2020
ADDITIONAL INFORMATION
Statistics of ShareholdingsAs at 26 February 2021
SHARE CAPITAL
Issued Shares : 5,704,653,871 Ordinary Shares One (1) Special Rights Redeemable Preference Share
Voting Right : One (1) vote per ordinary share
ANALYSIS BY SIZE OF SHAREHOLDINGS
Size of Shareholdings
No. of
Shareholders
Total No. of
Shareholders
No. of
Issued Shares
Total No. of
Issued Shares
Malaysian Foreigner No. % Malaysian Foreigner No. %
1 - 99 1,900 35 1,935 2.16 59,931 1,073 61,004 0.00
100 - 1,000 44,523 318 44,841 50.12 24,073,753 181,957 24,255,710 0.43
1,001 - 10,000 36,965 444 37,409 41.81 116,934,474 1,877,875 118,812,349 2.08
10,001 - 100,000 3,962 375 4,337 4.85 99,400,680 15,695,483 115,096,163 2.02
100,001 - less than 5% of issued shares 510 437 947 1.06 1,443,080,710 705,797,438 2,148,878,148 37.67
5% and above of issued shares 4 0 4 0.00 3,297,550,497 0 3,297,550,497 57.80
Total 87,864 1,609 89,473 100.00 4,981,100,045 723,553,826 5,704,653,871 100.00
ANALYSIS OF EQUITY STRUCTURE
No. Category of ShareholdersNo. of Shareholders No. of Issued Shares % of Issued Shares
Malaysian Foreigner Malaysian Foreigner Malaysian Foreigner
1. Individuals 70,417 556 199,553,791 3,225,513 3.50 0.05
2. Body Corporate
a. Banks/Finance Companies 108 1 1,671,104,986 46 29.30 0.00
b. Investment Trusts/Foundation/Charities 6 0 257,862 0 0.00 0.00
c. Other Type of Companies 601 16 1,495,946,585 11,959,237 26.22 0.21
3. Government Agencies/Institutions 18 0 21,116,662 0 0.37 0.00
4. Nominees 16,714 1,036 1,593,120,159 708,369,030 27.93 12.42
5. Others 0 0 0 0 0 0
Total 87,864 1,609 4,981,100,045 723,553,826 87.32 12.68

p.348
TENAGA NASIONAL BERHAD
Statistics of ShareholdingsAs at 26 February 2021
DIRECTORS’ SHAREHOLDINGS
No. Name of Directors No. of Shares
Direct Interest %
1. Dato' Seri Mahdzir bin Khalid (Appointed w.e.f. 12 May 2020) 0 0.00
2. Datuk Seri Amir Hamzah bin Azizan *62,800 0.00
3. Dato' Asri bin Hamidin @ Hamidon (Appointed w.e.f. 1 July 2020) 0 0.00
4. Amran Hafiz bin Affifudin 0 0.00
5. Noraini binti Che Dan 0 0.00
6. Juniwati Rahmat Hussin 0 0.00
7. Gopala Krishnan K.Sundaram 0 0.00
8. Ong Ai Lin 0 0.00
9. Dato' Roslina binti Zainal 18,400 0.00
10. Dato' Ir. Nawawi bin Ahmad (Appointed w.e.f. 16 October 2020) 0 0.00
11. Datuk Rawisandran a/l Narayanan (Appointed w.e.f. 16 October 2020) 0 0.00
12. Azmin bin Ishak (Appointed w.e.f. 1 July 2020) (Alternate Director to Dato’ Asri bin Hamidin @ Hamidon)
0 0.00
* Registered with CIMSEC Nominees (Tempatan) Sdn. Bhd.
SUBSTANTIAL SHAREHOLDERS ACCORDING TO THE REGISTER OF SUBSTANTIAL SHAREHOLDERS
No. Name of Substantial Shareholders No. of Shares %
1. Khazanah Nasional Berhad* 1,465,432,404 25.69
2. Employees Provident Fund Board** 1,019,865,782 17.88
3. Amanah Saham Bumiputera*** 557,399,500 9.77
4. Kumpulan Wang Persaraan (Diperbadankan)**** 417,400,925 7.31
Total 3,460,098,611 60.65
Notes:* Khazanah Nasional Berhad - Registered with Citigroup Nominees (Tempatan) Sdn. Bhd. (4,911,590) - Registered with CGS - CIMB Nominees (Tempatan) Sdn. Bhd. (4,911,590)** Registered with Citigroup Nominees (Tempatan) Sdn. Bhd.*** Registered with AmanahRaya Trustees Berhad**** Kumpulan Wang Persaraan (Diperbadankan)
- Registered with Citigroup Nominees (Tempatan) Sdn. Bhd. (41,651,734)
TOP 30 SECURITIES ACCOUNT HOLDERS
No. Name of Shareholders No. of Shares %
1. Khazanah Nasional Berhad 1,455,609,224 25.52
2. Citigroup Nominees (Tempatan) Sdn. Bhd.Employees Provident Fund Board
908,792,582 15.93
3. AmanahRaya Trustees BerhadAmanah Saham Bumiputera
557,399,500 9.77
4. Kumpulan Wang Persaraan (Diperbadankan) 375,749,191 6.59
5. Permodalan Nasional Berhad 153,611,800 2.69

p.349
INTEGRATED ANNUAL REPORT 2020
ADDITIONAL INFORMATION
Statistics of ShareholdingsAs at 26 February 2021
No. Name of Shareholders No. of Shares %
6. AmanahRaya Trustees BerhadAmanah Saham Malaysia 2 - Wawasan
101,714,800 1.78
7. AmanahRaya Trustees BerhadAmanah Saham Malaysia
86,744,100 1.52
8. Cartaban Nominees (Tempatan) Sdn. Bhd.PAMB for Prulink Equity Fund
62,102,950 1.09
9. Citigroup Nominees (Tempatan) Sdn. Bhd.Great Eastern Life Assurance (Malaysia) Berhad (PAR 1)
56,168,625 0.99
10. HSBC Nominees (Asing) Sdn. Bhd.JPMCB NA for Vanguard Emerging Markets Stock Index Fund
51,464,051 0.90
11. HSBC Nominees (Asing) Sdn. Bhd.JPMCB NA for Vanguard Total International Stock Index Fund
50,355,250 0.88
12. Cartaban Nominees (Asing) Sdn. Bhd.Exempt AN for State Street Bank & Trust Company (West CLT OD67)
47,076,162 0.83
13. AmanahRaya Trustees BerhadAmanah Saham Bumiputera 2
44,895,700 0.79
14. Maybank Nominees (Tempatan) Sdn. Bhd.Maybank Trustees Berhad for Public Ittikal Fund (N14011970240)
43,000,000 0.75
15. Lembaga Tabung Haji 40,216,400 0.70
16. AmanahRaya Trustees BerhadAmanah Saham Malaysia 3
38,532,600 0.68
17. AmanahRaya Trustees BerhadAmanah Saham Bumiputera 3 - Didik
36,535,992 0.64
18. Citigroup Nominees (Tempatan) Sdn. Bhd.Employees Provident Fund Board (Nomura)
34,229,600 0.60
19. AmanahRaya Trustees BerhadPublic Islamic Dividend Fund
30,962,975 0.54
20. Pertubuhan Keselamatan Sosial 28,177,520 0.49
21. AmanahRaya Trustees BerhadPublic Ittikal Sequel Fund
23,403,900 0.41
22. Citigroup Nominees (Tempatan) Sdn. Bhd.Great Eastern Life Assurance (Malaysia) Berhad (PAR 3)
22,045,250 0.39
23. Citigroup Nominees (Tempatan) Sdn. Bhd.Exempt An For AIA Berhad
21,120,325 0.37
24. AmanahRaya Trustees BerhadPublic Islamic Equity Fund
18,931,237 0.33
25. HSBC Nominees (Asing) Sdn. Bhd.HSBC BK PLC for The Prudential Assurance Company Limited
18,746,900 0.33
26. Maybank Nominees (Tempatan) Sdn. Bhd.MTrustee Berhad for Principal Dali Equity Growth Fund (UT-CIMB-DALI) (419455)
18,538,400 0.33
27. Citigroup Nominees (Tempatan) Sdn. Bhd.Employees Provident Fund Board (CIMB PRIN)
18,502,500 0.32
28. Cartaban Nominees (Tempatan) Sdn. Bhd.PBTB for Takafulink Dana Ekuiti
17,685,150 0.31
29. AmanahRaya Trustees BerhadPublic Islamic Select Enterprises Fund
15,091,700 0.27
30. DB Malaysia Nominee (Asing) Sdn. Bhd.BNYM SA/NV for People's Bank of China (SICL ASIA EM)
15,016,300 0.26
Total 4,392,420,684 77.00

p.350
TENAGA NASIONAL BERHAD
LAN
DB
UIL
DIN
GS
Lea
seho
ld
Fre
ehol
d
Tot
al
No.
(1
0)
Bui
lt-U
p
Are
a (s
q M
) (1
1)
Tot
al
NB
V
(RM
'000
) (1
2)
Loca
tion
N
o. o
fLo
ts
(1)
Are
a(s
q M
) (2
)
NB
V
(RM
'000
) (3
)
No.
of
Lots
(4
)
Are
a(s
q M
) (5
)
NB
V
(RM
'000
) (6
)
No.
of
Lots
(1
+4)
Are
a(s
q M
) (2
+5)
NB
V
(RM
'000
) (3
+6)
Per
lis
51
156
,976
1
,734
4
12
88,
183
10,
061
463
2
45,1
59
11,
795
62
5,2
18
19,
274
Ked
ah
298
1
,056
,663
1
4,00
8 7
83
2,8
17,1
45
123
,974
1
,081
3
,873
,808
1
37,9
82
354
1
00,9
12
233
,348
Pul
au P
inan
g 1
94
689
,888
8
4,85
1 6
97
985
,302
1
02,2
81
891
1
,675
,190
1
87,1
32
361
1
46,0
20
825
,118
Per
ak
795
6
,164
,128
3
26,0
12
1,1
06
10,
141,
273
376
,831
1
,901
1
6,30
5,40
1 7
02,8
43
997
6
73,9
73
2,5
73,3
33
Sel
ango
r 1
,001
1
2,99
0,12
3 5
39,2
86
1,6
46
2,6
87,7
03
675
,519
2
,647
1
5,67
7,82
6 1
,214
,805
1
,819
8
63,0
58
2,6
26,3
91
W. P
erse
kutu
an
384
2
94,8
06
64,
484
531
6
15,1
76
208
,118
9
15
909
,982
2
72,6
02
701
2
04,7
32
797
,684
Put
raja
ya/C
yber
jaya
9
7
59,9
54
13,
390
16
1,5
54
1,7
06
25
761
,508
1
5,09
6 6
4 8
,905
4
7,82
2
N.S
embi
lan
288
1
,806
,880
1
39,6
86
612
1
,108
,378
1
52,3
14
900
2
,915
,258
2
92,0
00
247
3
90,3
86
1,1
21,0
14
Mel
aka
365
6
40,5
02
23,
052
1,0
44
251
,676
3
52,7
21
1,4
09
892
,178
3
75,7
73
77
157
,173
2
20,1
01
Joho
r 9
59
3,4
40,3
10
432
,670
1
,307
1
,005
,893
3
15,4
51
2,2
66
4,4
46,2
03
748
,121
5
19
201
,293
8
90,0
47
Pah
ang
387
2
,737
,527
4
9,65
0 9
74
361
,944
3
12,7
55
1,3
61
3,0
99,4
71
362
,405
4
06
418
,452
3
,709
,035
Tere
ngga
nu
367
7
,008
,124
3
0,53
7 3
16
11,
009,
770
147
,649
6
83
18,
017,
894
178
,186
2
94
548
,265
1
,695
,003
Kel
anta
n 3
60
1,2
88,0
93
8,0
27
369
2
,296
,831
2
7,41
2 7
29
3,5
84,9
24
35,
439
330
3
45,7
67
796
,871
Sab
ah
356
6
,261
,621
8
1,41
8 6
0 4
,501
,754
3
5,52
4 4
16
10,
763,
375
116
,942
1
,599
6
51,9
54
409
,130
Pak
ista
n 1
3
8,14
1 8
8 1
7
90,3
44
1,2
75
2
828
,485
1
,363
2
1
3,45
8 1
,686
Uni
ted
Kin
gdom
7
7 6
,523
,128
2
16,6
53
00
0 7
7 6
,523
,128
2
16,6
53
00
0
Tota
l 5
,892
5
1,85
6,86
4 2
,025
,546
9
,874
3
8,66
2,92
6 2
,843
,591
1
5,76
6 9
0,51
9,79
0 4
,869
,137
7,
832
4,7
29,5
66
15,
965,
857
The
land
and
bui
ldin
gs c
ompr
ise
pow
er s
tatio
ns,
min
i hyd
ros,
jetti
es,
dam
s, s
ubst
atio
ns,
resi
dent
ial h
ouse
s, a
part
men
ts,
holid
ay b
unga
low
s, o
ffice
bui
ldin
gs,
war
ehou
ses,
sto
res
and
wor
ksho
ps.
Ne
t B
oo
k V
alu
e o
f L
an
d a
nd
Bu
ild
ing
sA
s a
t 3
1 D
ece
mb
er
20
20
Pro
pert
yLi
st

p.351
INTEGRATED ANNUAL REPORT 2020
ADDITIONAL INFORMATION
Notice of the 31st Annual General Meeting
NOTICE IS HEREBY GIVEN THAT the Thirty-First Annual General Meeting (31st AGM) of Tenaga Nasional Berhad (TNB or the Company) will be held on Monday, 10 May 2021 at 10.00 a.m., fully virtual via Remote Participation and Voting (RPV) at Dewan Seminar, Kompleks Balai Islam An-Nur, Ibu Pejabat Tenaga Nasional Berhad, No. 129, Jalan Bangsar, 59200 Kuala Lumpur, Malaysia (the Broadcast Venue) to transact the following businesses:
AGENDA
AS ORDINARY BUSINESS:
1. To receive the Audited Financial Statements for the Financial Year ended 31 December 2020 together with the Reports of the Directors and Auditors thereon.
Please refer to Explanatory Note (a)
2. To re-elect the following Directors who retire by rotation in accordance with Clause 64(1) of the Company’s Constitution and being eligible offer themselves for re-election:
(i) Juniwati Rahmat Hussin (ii) Gopala Krishnan K.Sundaram Please refer to Explanatory Note (b)
3. To re-elect the following Directors who were appointed to the Board and retire in accordance with Clause 63(2) of the Company’s Constitution and being eligible offer themselves for re-election:
(i) Dato’ Asri bin Hamidin @ Hamidon(ii) Dato’ Ir. Nawawi bin Ahmad(iii) Datuk Rawisandran a/l Narayanan(iv) Datuk Ir. Baharin bin DinPlease refer to Explanatory Note (b)
4. To approve the payment of the following Non-Executive Directors’ fees from the 31st AGM until the next Annual General Meeting (AGM) of the Company:
(i) Director’s fee of RM30,000.00 per month for the Non-Executive Chairman;(ii) Director’s fee of RM20,000.00 per month for each Non-Executive Director;(iii) Director’s fee of RM7,000.00 and RM5,000.00 per month for TNB Subsidiaries Category II and III respectively to
Non-Executive Chairman.Please refer to Explanatory Note (c)
5. To approve the payment of benefits payable to the Non-Executive Directors (excluding Non-Executive Directors’ fees) amounting to RM1,968,200.00 from the 31st AGM until the next AGM of the Company.Please refer to Explanatory Note (c)
6. To re-appoint Messrs PricewaterhouseCoopers PLT, having consented to act, as Auditors of the Company, to hold office
until the conclusion of the next AGM and to authorise the Directors to fix their remuneration.Please refer to Explanatory Note (d)
AS SPECIAL BUSINESS:
To consider and if thought fit, to pass the following Resolutions:
7. Proposed Grant and Allotment of Shares to Datuk Ir. Baharin bin Din.
“THAT the Board (save for Datuk Ir. Baharin bin Din) be and is hereby authorised at any time and from time to time, to cause or procure the offering and allocation to Datuk Ir. Baharin bin Din, President/Chief Executive Officer of the Company, of up to 850,000 ordinary shares in TNB (TNB Shares) under the Long Term Incentive Plan for the Eligible Employees of TNB and Its Subsidiaries and Executive Directors of TNB (LTIP) as they shall deem fit, which will be vested to him at a future date, subject to such terms and conditions of the LTIP By-Laws.”
“AND THAT the Board be and is hereby authorised to allot and issue new TNB Shares pursuant to the LTIP to him from time to time in accordance with the vesting of his Grant.”Please refer to Explanatory Note (e)
Ordinary Resolution 1Ordinary Resolution 2
Ordinary Resolution 3Ordinary Resolution 4Ordinary Resolution 5Ordinary Resolution 6
Ordinary Resolution 7
Ordinary Resolution 8
Ordinary Resolution 9
Ordinary Resolution 10

p.352
TENAGA NASIONAL BERHAD
Notice of the 31st Annual General Meeting
Ordinary Resolution 11
8. Proposed Grant and Allotment of Shares to Noor Liyana binti Baharin.
“THAT the Board (save for Datuk Ir. Baharin bin Din) be and is hereby authorised at any time and from time to time, to cause or procure the offering and allocation to Noor Liyana binti Baharin, Electrical Engineer of the Company, being Person Connected to Datuk Ir. Baharin bin Din, of up to 4,400 TNB Shares under the LTIP as they shall deem fit, which will be vested to her at a future date, subject to such terms and conditions of the LTIP By-Laws.”
“AND THAT the Board be and is hereby authorised to allot and issue new TNB shares pursuant to the LTIP to her from time to time in accordance with the vesting of her Grant.”Please refer to Explanatory Note (e)
9. To transact any other business of which due notice shall have been given in accordance with the Companies Act 2016 (Act).
EXPLANATORY NOTES ON ORDINARY BUSINESSES:
(a) Agenda No. 1 is meant for discussion only as Section 340(1)(a) of the Act does not require shareholders’ approval for the Audited Financial Statements. As such, it is not put forward for voting.
(b) Ordinary Resolutions 1 to 6 – Proposed Re-election of Directors in accordance with Clauses 64(1) and 63(2) of the Company’s Constitution
Clause 64(1) of the Company’s Constitution provides among others, that one-third (1/3) of the Directors at the time being of whom have been longest in office shall retire by rotation at the AGM of the Company and shall be eligible for re-election.
Clause 63(2) of the Company’s Constitution provides among others, that the Directors shall have power at any time and from time to time to appoint any other person to be a Director of the Company either to fill a casual vacancy or as an addition to the existing Directors. Any Director so appointed shall hold office only until the next following AGM of the Company and shall then be eligible for re-election.
The Board Nomination and Remuneration Committee (BNRC) and Board have conducted an independence assessment of all Independent Directors including Juniwati Rahmat Hussin and Gopala Krishnan K.Sundaram and are satisfied that they have complied with the independence criteria as required by the Main Market Listing Requirements of Bursa Malaysia Securities Berhad (MMLR) and continue to bring independent and objective judgment to the Board deliberations.
The BNRC and Board have also considered the Board Evaluation Assessment including the Self and Peer Assessment results of Juniwati Rahmat Hussin and Gopala Krishnan K.Sundaram and agreed that they have met the Board’s expectation in terms of experience, expertise, integrity, competency, commitment and individual contribution by continuously performing their duties diligently as Directors of the Company.
The Board on 25 June 2020 had approved, with the concurrence of Minister of Finance (Incorporated), the Special Shareholder of TNB for the appointment of Dato’ Asri bin Hamidin @ Hamidon as Non-Independent Non-Executive Director with effect from 1 July 2020.
The Board on 15 October 2020 approved, on the appointment of Dato’ Ir. Nawawi bin Ahmad and Datuk Rawisandran a/l Narayanan as Independent Non-Executive Directors with effect from 16 October 2020. Subsequently the Board on 10 February 2021 had approved on the appointment of Datuk Ir. Baharin bin Din as President/Chief Executive Officer with effect from 1 March 2021.
Pursuant to Clause 63(2) of the Company’s Constitution, Dato’ Asri bin Hamidin @ Hamidon, Dato’ Ir. Nawawi bin Ahmad, Datuk Rawisandran a/l Narayanan and Datuk Ir. Baharin bin Din are standing for re-election. Their expertise/experience that they bring to the Board, shall further strengthen the Board composition and dynamics.
The BNRC and Board hereby recommend for the re-election of each Director who is retiring at the 31st AGM.
(c) Ordinary Resolutions 7 & 8 – Non-Executive Directors’ Remuneration
Section 230(1) of the Act stipulates among others that the fees and any benefits payable to the Directors of a listed company and its subsidiaries shall be approved at a general meeting. As agreed by the Board, the shareholders’ approval shall be sought at the 31st AGM on the Non-Executive Directors’ remuneration of the Company and TNB Subsidiaries Category II and III through two (2) separate resolutions as follows:
(i) Ordinary Resolution 7 on the payment of Non-Executive Directors’ fees for the Non-Executive Chairman and each Non-Executive Director from the 31st AGM until the next AGM of the Company.
(ii) Ordinary Resolution 8 on the payment of benefits payable (excluding Non-Executive Directors’ fees) to the Non-Executive Directors from the 31st AGM until the next AGM of the Company.
FURTHER NOTICE IS HEREBY GIVEN THAT for the purpose of determining a member who shall be entitled to attend this 31st AGM, the Company shall be requesting Bursa Malaysia Depository Sdn. Bhd. (Bursa Depository) in accordance with Clause 45(2) of the Company’s Constitution and Section 34(1) of the Securities Industry (Central Depositories) Act 1991 (SICDA) to issue a General Meeting Record of Depositors (ROD) as at 3 May 2021. Only a depositor whose name appears on the ROD as at 3 May 2021 shall be entitled to attend the said Meeting or appoint proxy/proxies to attend and/or vote on his/her behalf.
BY ORDER OF THE BOARD
NORAZNI BINTI MOHD ISA(LS 0009635)(SSM Practicing Certificate No. 201908000492) Company Secretary
Kuala Lumpur9 April 2021

p.353
INTEGRATED ANNUAL REPORT 2020
ADDITIONAL INFORMATION
Notice of the 31st Annual General Meeting
The Non-Executive Directors remuneration remains unchanged of which was last reviewed in 2013. Based on the review of Non-Executive Directors remuneration by Willis Towers Watson (WTW) in 2018, overall, TNB is at par with the market, for most of the compensation elements that are offered to the Non-Executive Directors. The current remuneration framework of TNB Non-Executive Directors is retained and suggested to be reviewed in the next one (1) or two (2) years’ time to ensure its market competitiveness.
The proposed Ordinary Resolution 7 for the payment of fees to Non-Executive Directors of the Company and its subsidiaries from the 31st AGM until the conclusion of the next AGM is tabled herewith in line with the provision of the Act and best practices of corporate governance to ensure full disclosure.
The Non-Executive Directors remuneration policy of TNB and its subsidiaries is as follows:
Description TNB Board TNB Subsidiaries
Chairman Non-ExecutiveDirectors
Chairman** Non- ExecutiveDirectors
Monthly fixed fees RM30,000 per month RM20,000 per month Category I – RM20,000 Category II – RM7,000 Category III – RM5,000
Category I – RM15,000 Category II – RM5,000 Category III – RM3,000
*Meeting Allowances(per meeting)
(i) Board RM2,500 RM2,000 Category I – RM2,000 Category II & III – RM1,500
Category I – RM1,500 Category II & III – RM1,000
(ii) Board Committees RM2,000 RM1,500 Category I – RM1,500 Category II & III – RM1,000
Category I – RM1,000 Category II & III – RM800
Benefits Medical, Business Peripherals, Utilities Bills, Travelling & Telecommunication and other claimable benefits
* subject to not more than three (3) payments in a month.** save for TNB Non-Executive Chairman, none of TNB Non-Executive Directors are currently on the board of TNB subsidiaries.
In determining the estimated total amount of benefits payable, the Board has considered various factors including the number of scheduled and special meetings for the Board, Board Committees and boards of subsidiaries along with the number of Non-Executive Directors involved.
Payment of Non-Executive Directors’ benefits payable will be made by the Company and its subsidiaries on a monthly basis and/or as and when incurred, provided that the proposed Ordinary Resolution 8 be passed at the 31st AGM. The Board is of the view that it is fair and justifiable for the payment of benefits payable to the Non-Executive Directors be made as and when incurred, after the Non-Executive Directors have discharged their responsibilities and rendered their services to the Company.
Details of the Directors’ Remuneration for the Financial Year ended 31 December 2020 are enumerated on page 99 of the Corporate Governance Overview Statement of this Integrated Annual Report.
(d) Ordinary Resolution 9 – Re-appointment of Auditors
Based on the External Auditors Assessment Result for the Financial Year under review, the Board Audit Committee and Board are satisfied with the quality of service, adequacy of resources provided, communication, independence, objectivity and professionalism demonstrated by the External Auditors in carrying out their duties.
Being satisfied with the External Auditors’ performance, the Board recommends their re-appointment for shareholders’ approval at the forthcoming AGM.
EXPLANATORY NOTES ON SPECIAL BUSINESSES:
(e) Ordinary Resolutions 10 & 11 – Proposed Grant and Allotment of Shares to Datuk Ir. Baharin bin Din and Noor Liyana binti Baharin
Pursuant to Paragraph 6.06 of the MMLR, any offer and issuance of shares to the director, major shareholder or chief executive and persons connected with them must be approved by the shareholders at the general meeting stating the specific allotment.
The Proposed Grant is the maximum number of TNB Shares that may be vested to Datuk Ir. Baharin bin Din subject to the stretched individual and Company
performance targets set by the Board Long Term Incentive Plan Committee (BLTIP) and Board, upon the vesting exercise. The BLTIP and Board (save for Datuk Ir. Baharin bin Din) have deliberated on the proposal and concurred that the proposed maximum allowable number of TNB Shares allocation is fair and reasonable, to link the interest of Executive Director with the long term shareholders’ value enhancement and long term success of the Company.
The proposed Ordinary Resolutions 10 and 11, if passed, are to empower the Directors at any time and from time to time to cause or procure the offering and the allocation to Datuk Ir. Baharin bin Din and Noor Liyana binti Baharin, being Person Connected to Datuk Ir. Baharin bin Din, respectively such number of TNB Shares as they shall deem fit, which will be vested to them for the remaining LTIP period until 29 April 2025, subject to such terms and conditions of the LTIP By-Laws, which was approved at the Extraordinary General Meeting of the Company held on 18 December 2014.
Datuk Ir. Baharin bin Din and Person Connected to him will abstain from voting on Ordinary Resolutions 10 and 11.
p.354
TENAGA NASIONAL BERHAD
NOTES:
1. A member of a Company shall be entitled to appoint another person as his/her proxy to exercise all or any of his/her rights to attend, participate, speak and vote at a meeting of members of the Company, in accordance with Section 334(1) of the Act.
2. Where a member is an authorised nominee as defined in accordance with the provisions of the SICDA, it may appoint up to two (2) proxies in respect of each Securities Account it holds with ordinary shares in the Company standing to the credit of the said Securities Account.
3. A member entitled to participate and vote at the Meeting is entitled to appoint not more than two (2) proxies to participate and vote on his/her behalf. Where a member appoints two (2) proxies, the appointments shall be invalid unless the proportion of the shareholdings to be represented by each proxy is specified.
4. The instrument appointing a proxy/Proxy Form shall be in writing under the hand of the appointer or of his attorney duly appointed under a power of attorney. Where the instrument appointing a proxy/Proxy Form is executed by a corporation, it shall be executed either under its common seal or under the hand of any officer or attorney duly appointed under a power of attorney.
5. A corporation which is a member may by resolution of its Directors or other governing body authorise such person as it thinks fit to act as its representative at the Meeting in accordance with Clause 51 of the Company’s Constitution.
6. Duly completed Proxy Form must be deposited at Boardroom Share Registrars Sdn. Bhd., 11th Floor, Menara Symphony, No. 5, Jalan Prof. Khoo Kay Kim, Seksyen 13, 46200 Petaling Jaya, Selangor Darul Ehsan, Malaysia not less than 48 hours before the time appointed for the taking of the poll or no later than 8 May 2021 at 12.00 p.m.
7. Alternatively, you may lodge the Proxy Form by online via the Boardroom Smart Portal at www.boardroomlimited.my or by fax to +603-7890 4670 before the abovementioned cut-off time. For further details on proxy lodgement, kindly refer to the Administrative Details of 31st AGM.
8. Pursuant to Paragraph 8.29A(1) of the MMLR, voting at the 31st AGM of the Company will be conducted by poll.
Statement Accompanying Notice ofthe 31st Annual General Meeting
The Directors who are retiring by rotation in accordance with Clause 64(1) of the Company’s Constitution and seeking for re-election:
(i) Juniwati Rahmat Hussin(ii) Gopala Krishnan K.Sundaram
The Directors who were appointed to the Board and are retiring in accordance with Clause 63(2) of the Company’s Constitution and seeking for re-election:
(i) Dato’ Asri bin Hamidin @ Hamidon(ii) Dato’ Ir. Nawawi bin Ahmad(iii) Datuk Rawisandran a/l Narayanan(iv) Datuk Ir. Baharin bin Din
The profiles of the retiring Directors are set out in Board of Directors’ Profile on pages 60 to 71 of this Integrated Annual Report.
Save for Datuk Ir. Baharin bin Din and Dato’ Roslina binti Zainal, who hold 58,000 and 18,400 ordinary shares respectively in the Company, none of the above Directors has any interest in the securities of the Company or its Subsidiaries.
(Pursuant to Paragraph 8.27(2) and Appendix 8A of the Main Market Listing Requirements of Bursa Malaysia Securities Berhad)
Notice of the 31st Annual General Meeting

PROXY FORM31ST ANNUAL GENERAL MEETING(Before completing the form, please refer to the notes overleaf)
NUMBER OF ORDINARY SHARE(S) HELD CDS ACCOUNT NO.
– –
I/We, _____________________________________________________________________________________________________________________________________(FULL NAME OF SHAREHOLDER AS PER NRIC/CERTIFICATE OF INCORPORATION IN CAPITAL LETTERS)
NRIC No./Passport No./Company No. _________________________________ of _______________________________________________________________________ (FULL ADDRESS)
__________________________________________________________________________________________________________________________________________ (FULL ADDRESS)
Telephone No. ____________________________________________ being a Member of Tenaga Nasional Berhad, hereby appoint:
FULL NAME OF PROXY AS PER NRIC IN CAPITAL LETTERS NO. OF SHARES PERCENTAGE (%)
Proxy1 or failing him/her
NRIC No./Passport No.:
Proxy2 or failing him/her
NRIC No./Passport No.:
TOTAL 100%
*the Chairman of the Meeting, as my/our proxy, to attend and vote for me/us and on my/our behalf at the 31ST ANNUAL GENERAL MEETING (31ST AGM) of TENAGA NASIONAL BERHAD (“TNB” or “the Company”) to be held fully virtual via Remote Participation and Voting (RPV) at Dewan Seminar, Kompleks Balai Islam An-Nur, Ibu Pejabat Tenaga Nasional Berhad, No. 129, Jalan Bangsar, 59200 Kuala Lumpur, Malaysia (the Broadcast Venue) on MONDAY, 10 MAY 2021 at 10.00 a.m., and/or at any adjournment thereof.
My/Our proxy is to vote as indicated below:
NO. RESOLUTIONS FOR AGAINST
ORDINARY BUSINESS
Re-election of the following Directors who retire in accordance with Clause 64(1) of the Company’s Constitution:
1. Juniwati Rahmat Hussin ORDINARY RESOLUTION 1
2. Gopala Krishnan K.Sundaram ORDINARY RESOLUTION 2
Re-election of the following Directors who retire in accordance with Clause 63(2) of the Company’s Constitution:
3. Dato’ Asri bin Hamidin @ Hamidon ORDINARY RESOLUTION 3
4. Dato’ Ir. Nawawi bin Ahmad ORDINARY RESOLUTION 4
5. Datuk Rawisandran a/l Narayanan ORDINARY RESOLUTION 5
6. Datuk Ir. Baharin bin Din ORDINARY RESOLUTION 6
7. Approval for payment of the following Non-Executive Directors’ fees from the 31st AGM until the next Annual General Meeting (AGM) of the Company:(i) Director’s fee of RM30,000.00 per month for the Non-Executive Chairman(ii) Director’s fee of RM20,000.00 per month for each Non-Executive Director(iii) Director’s fee of RM7,000.00 and RM5,000.00 per month for TNB Subsidiaries Category II and III
respectively to Non-Executive Chairman
ORDINARY RESOLUTION 7
8. Approval for payment of benefits payable to the Non-Executive Directors (excluding Non-Executive Directors’ fees) from the 31st AGM until the next AGM of the Company
ORDINARY RESOLUTION 8
9. Re-appointment of Messrs PricewaterhouseCoopers PLT as Auditors of the Company and to authorise the Directors to fix their remuneration
ORDINARY RESOLUTION 9
SPECIAL BUSINESS
10. Proposed Grant and Allotment of Shares to Datuk Ir. Baharin bin Din ORDINARY RESOLUTION 10
11. Proposed Grant and Allotment of Shares to Noor Liyana binti Baharin ORDINARY RESOLUTION 11
Please indicate with an “X” in the box provided for each Resolution as how you wish your votes to be cast. If no voting instruction is given, the proxy(ies) is/are hereby authorised to vote or abstain from voting at his/her/their discretion.
*If you do not wish to appoint the Chairman of the Meeting as your proxy/one (1) of your proxies, please strike out the word “the Chairman of the Meeting” and insert the name(s) of the proxy(ies) you wish to appoint in the blank spaces provided.
Dated this day of , 2021Signature(s) or Common Seal of Member(s)

BOARDROOM SHARE REGISTRARS SDN. BHD.11th Floor, Menara SymphonyNo. 5, Jalan Prof. Khoo Kay KimSeksyen 13, 46200 Petaling JayaSelangor Darul EhsanMalaysia
AFFIX
STAMP
NOTES:
1. A member of a Company shall be entitled to appoint another person as his/her proxy to exercise all or any of his/her rights to attend, participate, speak and vote at a meeting of members of the Company in accordance with Section 334(1) of the Companies Act 2016.
2. Only members whose names appear in the General Meeting Record of Depositors as at 3 May 2021 shall be entitled to attend the Meeting or appoint proxy(ies) to attend and/or vote on their behalf.
3. Where a member is an authorised nominee as defined in accordance with the provisions of the Securities Industry (Central Depositories) Act 1991, it may appoint up to two (2) proxies in respect of each Securities Account it holds with ordinary shares in the Company standing to the credit of the said Securities Account.
4. A member entitled to participate and vote at the Meeting is entitled to appoint not more than two (2) proxies to participate and vote on his/her behalf. Where a member appoints two (2) proxies, the appointments shall be invalid unless the proportion of the shareholdings to be represented by each proxy is specified.
5. The instrument appointing a proxy/Proxy Form shall be in writing under the hand of the appointer or of his attorney duly appointed under a power of attorney. Where the instrument appointing a proxy/Proxy Form is executed by a corporation, it shall be executed either under its common seal or under the hand of any officer or attorney duly appointed under a power of attorney.
6. A corporation which is a member may by resolution of its Directors or other governing body authorise such person as it thinks fit to act as its representative at the Meeting in accordance with Clause 51 of the Company’s Constitution.
7. The Proxy Form may be downloaded from the website at www.tnb.com.my. Duly completed Proxy Form must be deposited to the Boardroom Share Registrars Sdn. Bhd., 11th Floor, Menara Symphony, No. 5, Jalan Prof. Khoo Kay Kim, Seksyen 13, 46200 Petaling Jaya, Selangor Darul Ehsan, Malaysia not less than 48 hours before the time appointed for the taking of the poll or no later than 8 May 2021 at 12.00 p.m.
8. Alternatively, you may lodge the Proxy Form by online via the Boardroom Smart Portal at www.boardroomlimited.my or by fax to +603-7890 4670 before the abovementioned cut-off time. For further details on proxy lodgement, kindly refer to the Administrative Details of 31st AGM.
9. Pursuant to Paragraph 8.29A(1) of the Main Market Listing Requirements of Bursa Malaysia Securities Berhad, voting at the Meeting will be conducted by poll.
1. Fold Here
2. Fold Here To Seal


TENA
GA
NA
SION
AL B
ERH
AD
199001009294 (200866-W)
INTEG
RATED
AN
NU
AL R
EPO
RT 2020
TENAGA NASIONAL BERHAD 199001009294 (200866-W)
No. 129, Jalan Bangsar, 59200 Kuala Lumpur Tel: +603 2107 4515/4517 Fax: +603 2107 1086 Email: [email protected]
www.tnb.com.my