energy 2020 (report 11: 2020–21)
TRANSCRIPT

FINANCIAL AUDIT REPORT 4 February 2021
Energy 2020
Report 11: 2020–21
• Queensland • • Audit Office
Better public services

As the independent auditor of the Queensland public sector, including local governments, the Queensland Audit Office:
• provides professional audit services, which include our audit opinions on the accuracy and reliability of the financial
statements of public sector entities
• provides entities with insights on their financial performance, risk, and internal controls; and on the efficiency,
effectiveness, and economy of public service delivery
• produces reports to parliament on the results of our audit work, and on our insights, advice, and recommendations for
improvement
• conducts investigations into claims of financial waste and mismanagement raised by elected members, state and local
government employees, and the public
• shares wider learnings and best practice from our work with state and local government entities, our professional
networks, industry, and peers.
We conduct all our audits and reports to parliament under the Auditor-General Act 2009 (the Act). Our work complies with
the Auditor-General Auditing Standards and the Australian standards relevant to assurance engagements.
• Financial audit reports summarise the results of our audits of over 400 state and local government entities.
• Performance audit reports cover our evaluation of some, or all, of the entities’ efficiency, effectiveness, and economy
in providing public services. Depending on the level of assurance we can provide, these reports may also take the
form of:
Audit insights, which provide some evaluation and share our insights or learnings from our audit work across
government
Audit briefs, which set out key facts, involve some evaluation, and may include findings and recommendations
Audit overviews, which help clients and stakeholders understand complex issues and subjects.
Learn more about our publications on our website.
The Honourable C Pitt MP
Speaker of the Legislative Assembly
Parliament House
BRISBANE QLD 4000
4 February 2021
This report is prepared under Part 3 Division 3 of the Auditor-General Act 2009.
Brendan Worrall
Auditor-General
© The State of Queensland (Queensland Audit Office) 2021.
The Queensland Government supports and encourages the dissemination of its information. The copyright in this
publication is licensed under a Creative Commons Attribution-Non-Commercial-No Derivatives (CC BY-NC-ND) 4.0
International licence.
To view this licence visit https://creativecommons.org/licenses/by-nc-nd/4.0/
Under this licence you are free, without having to seek permission from QAO, to use this publication in accordance
with the licence terms. For permissions beyond the scope of this licence contact [email protected]
Content from this work should be attributed as: The State of Queensland (Queensland Audit Office) Report 11: 2020–21 Energy
2020, available under CC BY-NC-ND 4.0 International
Cover image is a stock image purchased by QAO.
ISSN 1834-1128
QUEE NSLAND
"'-...::::.:::.:.=:·"'

Energy 2020 (Report 11: 2020–21)
Contents
Report on a page 1
Recommendations for entities 2
1. Overview of entities in this sector 3
2. Results of our audits 4
3. Financial performance of energy entities 7
Appendices 14
A. Full responses from entities 15
B. Legislative context 18
C. Audit opinions for entities preparing financial reports 20
D. Entities not preparing financial reports 22
E. Financial results 24
F. Glossary 25

Energy 2020 (Report 11: 2020–21)
1
Report on a page
This report summarises the audit results of Queensland’s six energy entities. These entities
generate (CleanCo, CS Energy and Stanwell), transmit (Powerlink) and distribute (Energy
Queensland) most of Queensland’s electricity; while Ergon Energy Queensland is the
electricity retailer for most customers in regional Queensland.
Financial statements are reliable
The financial statements of all entities in the energy sector are reliable and comply with
relevant laws and standards. All entities prepared their financial statements in a timely manner.
Entities should strengthen the security of their information systems
While we were able to rely on the entities’ internal controls, we identified some deficiencies.
Most involved the security of information systems, including high-risk issues relating to the
security and authorisation of online payments. These high-risk issues required immediate
action and were resolved in a timely manner.
Sector profitability continues to decline
While the energy sector is still financially viable, its profits have declined significantly.
Queensland continues to have the lowest wholesale electricity prices in the National Electricity
Market, and they have reduced further this year. This influences the price customers pay, but
also contributes to the significant reduction in revenues and values of assets for the
generators.
The profits of the transmission and distribution businesses continue to decline. This is largely
driven by decisions of the Australian Energy Regulator to reduce the revenue they can earn
from their core business activities. We expect to see this trend continue in the next financial
year.
Future challenges
The energy sector is undergoing significant change. Our electricity system needs to adapt to
these changes to ensure affordable and reliable electricity supply for Queenslanders.
Coal-fired power plants are scheduled to progressively be retired over the next 26 years. As
this occurs, their capacity is expected to be replaced by more renewables. The generators
need to adapt to this changing mix to ensure they remain profitable and continue to deliver
electricity reliably.
Integrating renewables and new technology into the electricity network is also a challenge.
With reduced regulated revenues, transmission and distribution entities need to manage their
costs while maintaining network strength and stability.
• • ••

Energy 2020 (Report 11: 2020–21)
2
Recommendations for entities
We have identified the following recommendation:
Strengthen the security of information systems (all entities)
REC 1 We recommend all entities strengthen the security of their information systems. They rely
heavily on technology, and increasingly, they have to be prepared for cyber attacks. Any
unauthorised access could result in fraud or error, and significant reputational damage.
Their workplace culture, through their people and processes, must emphasise strong
security practices to provide a foundation for the security of information systems.
Entities should:
• provide security training for employees so they understand the importance of
maintaining strong information systems, and their roles in keeping them secure
• assign employees only the minimum access required to perform their job, and ensure
important stages of each process are not performed by the same person
• regularly review user access to ensure it remains appropriate
• monitor activities performed by employees with privileged access (allowing them to
access sensitive data and create and configure within the system) to ensure they are
appropriately approved
• implement strong password practices and multifactor authentication (for example, a
username and password, plus a code sent to a mobile), particularly for systems that
record sensitive information
• encrypt sensitive information to protect it
• patch vulnerabilities in systems in a timely manner, as upgrades and solutions are
made available by software providers to address known security weaknesses that
could be exploited by external parties.
Entities should also self-assess against all of the recommendations in Managing cyber
security risks (Report 3: 2019–20) to ensure their systems are appropriately secured.
• •• •

Energy 2020 (Report 11: 2020–21)
3
1. Overview of entities in this
sector
In Queensland, state government owned corporations generate, transmit, and distribute most
of the state’s electricity. The following diagram shows the state-owned entities’ roles in the
Queensland energy sector supply chain.
Figure 1A Queensland’s energy sector
Note:
• The National Electricity Market is the cross-state wholesale electricity market where generators and retailers trade electricity. Stanwell and CS Energy also participate in the retail market.
• Energex, Ergon, and Ergon Energy Queensland are subsidiaries of Energy Queensland Limited.
Source: Compiled by Queensland Audit Office.
•
The electricity supply chain Electricity is generated from power stati ons and flows through transmission and distribution lines to
consumers_ Electricity reta ilers and the National Electricity Market are also involved in the sale of the
electricity_
NATIONAL ELECTRICITY
MARKET
' -
CONSUMERS POWERLINK
II •
• ••

Energy 2020 (Report 11: 2020–21)
4
2. Results of our audits
This chapter provides an overview of our audit opinions for each entity in the energy sector. It
also provides conclusions on the effectiveness of the systems and processes (internal
controls) entities use to prepare financial statements.
Chapter snapshot
Note:
• Regulatory information notices are used to collect information from the transmission and distribution entities to assist the Australian Energy Regulator in deciding how much these entities can earn.
• Entities must have Australian financial services licences if they enter into contracts to manage the risk of fluctuating electricity prices. These entities must lodge an annual compliance form with the Australian Securities and Investments Commission.
Financial statements and other reports are reliable
We issued unmodified audit opinions for all six energy entities in Queensland, which means
we believe the results in their financial statements can be relied upon. All entities met their
legislative deadlines for issuing their annual reports. Appendix C details the audit opinions we
issued for energy entities in 2019–20.
Not all entities in the energy sector need to prepare financial statements. Appendix D lists the
entities that do not prepare financial statements and the reasons why.
Other audit certifications
We also provided assurance over regulatory information notices and Australian Financial
Services Licences.
For the regulatory notices, if the information is based on actual data, we conduct an audit. If
the information is based on estimated data, we conduct a review. We have issued eight
unmodified audit opinions and 11 unmodified review conclusions for these audits.
2 significant
deficiencies
deficiencies relating to strengthening
internal controls, mostly for
information systems.
26
relating to securing
of electronic funds
transfer (EFT) files
and online banking
authorisations.
6 unmodified financial statement audit opinions Financial statements of all entities are reliable.
23 unmodified other audit and review opinions relating to regulatory information notices and Australian
financial services licences.
• •• •

Energy 2020 (Report 11: 2020–21)
5
The information included with the regulatory information notices can be relied upon and the
entities fulfilled their obligations under their financial services licenses during the year.
Appendix C lists the audit certifications we issued.
Entities assessed their financial statement preparation processes as mature
We worked with the energy entities as they undertook a self-assessment of their financial
statement preparation processes using the maturity model on our website. The entities
concluded that their strengths across the sector included quality month-end processes and
timely resolution of financial reporting matters. Most entities identified an opportunity to
minimise manual adjustments to their financial statements.
Entities should strengthen their information systems
In 2019–20, we found the internal controls energy entities have in place (to ensure reliable
financial reporting) are generally effective. While we were able to rely on them, we identified
two significant deficiencies (high-risk issues) in internal controls—both related to security of
online payments. These issues have been resolved.
Figure 2A shows the nature of the internal control deficiencies reported during the year.
Figure 2A Overview of internal control issues raised in 2019–20
Source: Compiled by Queensland Audit Office.
The number of deficiencies (lower-risk matters) increased at energy entities this year, largely
due to the implementation of new information systems.
We found nine issues relating to Energy Queensland’s ongoing implementation of a new
system. These related to the need to secure financial data, implement strong password
controls, and ensure users have only the appropriate access to the system.
The new system project is expected to be finalised by 2021–22 and is currently expected to
cost four per cent more than the $229 million approved by the Australian Energy Regulator
(which sets the prices for network services). If Energy Queensland spends more than the
approved funding, it may not be able to recover the excess by increasing its customer network
charges. Financial returns to government (the shareholder) may be affected.
The security of information systems is the most common internal control weakness across the
entire public sector. All entities need their people and processes to demonstrate strong
security practices so information systems are promptly updated, to respond to changes within
their entity and protect against external threats.
•
20 information systems security and access
deficiencies (two sign·ficant)
Four online access and payment security (including two significant deficiencies}
Four non-complliance with policies and procedures
• ••

Energy 2020 (Report 11: 2020–21)
6
Recommendation for all entities
Strengthen the security of information systems (REC 1)
We recommend all entities strengthen the security of their information systems. They rely heavily on
technology, and increasingly, they have to be prepared for cyber attacks. Any unauthorised access
could result in fraud or error, and significant reputational damage.
Their workplace culture, through their people and processes, must emphasise strong security
practices to provide a foundation for the security of information systems.
Entities should:
• provide security training for employees so they understand the importance of maintaining strong
information systems, and their roles in keeping them secure
• assign employees only the minimum access required to perform their job, and ensure important
stages of each process are not performed by the same person
• regularly review user access to ensure it remains appropriate
• monitor activities performed by employees with privileged access (allowing them to access
sensitive data and create and configure within the system) to ensure they are appropriately
approved
• implement strong password practices and multifactor authentication (for example, a username
and password, plus a code sent to a mobile), particularly for systems that record sensitive
information
• encrypt sensitive information to protect it
• patch vulnerabilities in systems in a timely manner, as upgrades and solutions are made available
by software providers to address known security weaknesses that could be exploited by external
parties.
Entities should also self-assess against all of the recommendations in Managing cyber security risks
(Report 3: 2019–20) to ensure their systems are appropriately secured.
• •• •

Energy 2020 (Report 11: 2020–21)
7
3. Financial performance of
energy entities
Chapter snapshot
Sector profits have declined
In 2019–20, the energy entities recorded a combined profit of $204 million. This was a
decrease of $1.5 billion (88 per cent) from the previous year. Figure 3A shows that this profit
reduction was largely due to the generators (CleanCo, CS Energy and Stanwell), because of
lower electricity prices.
Figure 3A Energy sector’s profits by supply chain element
Source: Compiled by Queensland Audit Office.
Future challenges
• Making the transition to renewable energy sources
• Maintaining system stability while integrating renewables into the grid
• Coping with changes to market rules and regulations
Energy sector
Lower electricity prices
resulted in combined net
losses of $367 million for the
generators. Lower electricity
prices resulted in less
generation revenue and a
decline in the value of power
stations.
Transmission, distribution,
and retail entities all reported
net profits, but they were
26 per cent lower than the
previous year.
$0.2 bil. $1.0 bil. Profits
▼ 88% from 2019
Returns to shareholders
▼ 54% from 2019
$41.0 bil. $1.5 bil. Assets
▲ 1% from 2019
Returns to customers
▲ 37% from 2019
$1 bil.
$0.8 bil.
-$0.2 bi l.
-$0.4 bi l.
2016- 17 2017- 18 2018- 19 2019- 20
e Generation e Transmission e Distribution e Retail
• • ••

Energy 2020 (Report 11: 2020–21)
8
Lower electricity prices caused coal and gas power stations to decline in value
The generators assess the value of their power stations annually. During the year, they
determined that the future amounts they can recover from the use or sale of their coal and gas
power stations are less than their current recorded value. As such, each of the generators
wrote down (decreased) the value of their power stations as follows:
• Stanwell: $720 million (19 per cent of total assets)
• CS Energy: $353 million (15 per cent of total assets)
• CleanCo: $35 million (eight per cent of total assets).
Although Stanwell and CS Energy decreased the value of their coal power stations, they
expect them to remain profitable until their scheduled retirement over the next 26 years. The
reduction in value was largely due to declining electricity prices attributed to:
• reduced electricity demand as a result of COVID-19
• increased generation from renewable sources
• lower gas prices—which increased the electricity supply from gas power stations.
Despite this, CleanCo reduced the value of its Swanbank E gas power station to zero. Due to
declining electricity prices, forecasted revenues will not be sufficient to cover the increasing
costs to operate the power station. CleanCo expects to earn net losses from running this
power station until its expected retirement in 2036.
Queensland continues to record the lowest electricity prices in the National Electricity Market
Queensland’s wholesale electricity price fell on average by $27 per megawatt hour
(33 per cent) compared to 2018–19. Figure 3B shows this decline in electricity prices
compared to 2018–19 and also compared to the rest of the states in the National Electricity
Market (NEM).
Figure 3B Average daily electricity prices
Note: MWh—a megawatt hour, which is equal to 1,000 kilowatts of energy used continuously for one hour.
Source: Compiled by Queensland Audit Office from Australian Energy Market Operator (AEMO) data.
• ••
$160
--2019-20 OLD ---- 2018-19 OLD
--2019-20 rest of NEM --- - 2018-19 rest of INEM
•
Energy 2020 (Report 11: 2020–21)
9
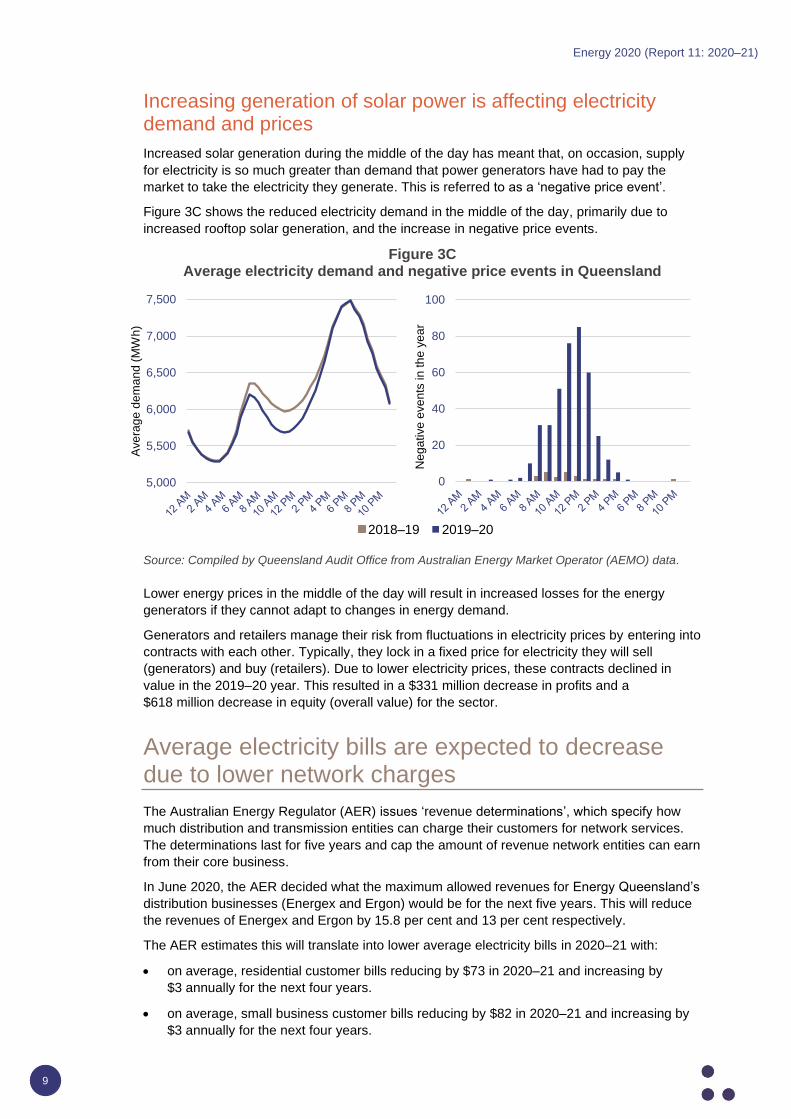
Increasing generation of solar power is affecting electricity demand and prices
Increased solar generation during the middle of the day has meant that, on occasion, supply
for electricity is so much greater than demand that power generators have had to pay the
market to take the electricity they generate. This is referred to as a ‘negative price event’.
Figure 3C shows the reduced electricity demand in the middle of the day, primarily due to
increased rooftop solar generation, and the increase in negative price events.
Figure 3C Average electricity demand and negative price events in Queensland
Source: Compiled by Queensland Audit Office from Australian Energy Market Operator (AEMO) data.
Lower energy prices in the middle of the day will result in increased losses for the energy
generators if they cannot adapt to changes in energy demand.
Generators and retailers manage their risk from fluctuations in electricity prices by entering into
contracts with each other. Typically, they lock in a fixed price for electricity they will sell
(generators) and buy (retailers). Due to lower electricity prices, these contracts declined in
value in the 2019–20 year. This resulted in a $331 million decrease in profits and a
$618 million decrease in equity (overall value) for the sector.
Average electricity bills are expected to decrease due to lower network charges
The Australian Energy Regulator (AER) issues ‘revenue determinations’, which specify how
much distribution and transmission entities can charge their customers for network services.
The determinations last for five years and cap the amount of revenue network entities can earn
from their core business.
In June 2020, the AER decided what the maximum allowed revenues for Energy Queensland’s
distribution businesses (Energex and Ergon) would be for the next five years. This will reduce
the revenues of Energex and Ergon by 15.8 per cent and 13 per cent respectively.
The AER estimates this will translate into lower average electricity bills in 2020–21 with:
• on average, residential customer bills reducing by $73 in 2020–21 and increasing by
$3 annually for the next four years.
• on average, small business customer bills reducing by $82 in 2020–21 and increasing by
$3 annually for the next four years.
0
20
40
60
80
100
Neg
ative
eve
nts
in
th
e y
ea
r
2018–19 2019–20
5,000
5,500
6,000
6,500
7,000
7,500
Ave
rag
e d
em
an
d (
MW
h)
~~~~~~~~~~~~~~~~~~ "'7, '7, b< <o 'o "<;) "'7, '7, b< <o 'o "<;)
■
•
L_,_ ~ ~ ~ ~ ~ ~ ~~ ~~ ~~ ~~ ~~ ~~
"'7, '7, b< <o 'o "<;) "'7, '7, b< <o 'o "<;)
■
• ••

Energy 2020 (Report 11: 2020–21)
10
Figure 3D shows the actual and expected regulated revenue for the transmission and
distribution entities (Powerlink and Energy Queensland), based on AER decisions.
Figure 3D Actual and forecasted regulated revenue
Note: The forecasted revenue figures do not take into account inflation.
Source: Compiled by Queensland Audit Office from Powerlink and Energy Queensland’s annual reports and AER determinations.
This reduction in distribution revenue will place further pressure on Energy Queensland to
manage its operational and network costs. A reduction in revenue will likely result in decreased
shareholder returns to the state government.
Returns to shareholders declined but returns to customers increased
Returns to the state government are made up of dividends (a share of profits paid to
shareholders) and income tax equivalents. Total returns to the state government amounted to
$1.0 billion, a decrease of $1.2 billion (54 per cent) from the previous year.
In 2019–20, the Queensland Government returned $1.5 billion to customers in rebates,
concessions, and payments—up $403 million from the previous year. This increase is largely
due to the electricity bill relief provided by the government during COVID-19. Figure 3E shows
the returns to customers for the last three years.
Figure 3E Returns to customers
Note: The Affordable Energy Plan amount for 2019–20 includes the additional utility relief payment (residential) made under the Queensland Government’s COVID-19 economic relief package.
Source: Compiled by Queensland Audit Office.
Distribution revenue will decline
next year and will remain steady
due to the AER price decision
issued in June 2020. Should
COVID-19 have a substantial
impact on network operations, the
AER will reconsider its decision.
Transmission revenue will remain
relatively flat for the next two
financial years. The AER will issue
a new price decision for Powerlink
in 2022.
• ••
$5 bil.
Q,I $4 bil. :::I C: Q,I
$3 bil. ~ ] $2 bil.
."--·-•--•
·---.. , _______ ---•·------. ------·•-------• Ill
~ $1 bil. Q,I
er: 0 ·---•--•--•-----··•·------•
• Transmission • Distribution
2019- 20
2018-19
2017-1 8
0 200 400 600
277
285
292
800
416
127
146
1,000
Amount ($ mil.)
1,200 1,400
e Electricity rebates and concessions e Community service obligation payments
86
e Solar Bonus Scheme payments e Affordable Energy Plan e Uti lity relief payment (business)
•

Energy 2020 (Report 11: 2020–21)
11
The government continued to support regional customers
The state government subsidises the cost of providing electricity in regional Queensland
through what is known as community service obligation payments to Ergon Energy
Queensland. The cost is high because a relatively small number of customers are spread
across a large area. Ergon Energy Queensland is the electricity retailer for most of regional
Queensland’s electricity.
In 2019–20, the community service obligation payments to Energy Queensland were
$498 million, a $36 million increase from the prior year. This was due to an increase in the
average retail tariffs, which are independently set by the Queensland Competition Authority.
Without community service obligation payments, Ergon Energy Queensland would have
recorded a loss of $204 million in 2019–20. Average retail tariffs are expected to reduce next
year.
Solar Bonus Scheme funding will cease
In 2019–20, Energy Queensland paid customers $277 million for the power they contributed to
the energy grid through their rooftop solar. This included eligible customers under the state
government’s Solar Bonus Scheme who receive 44 cents per kilowatt hour.
The state government has funded the scheme in the last three years, but has not extended the
funding beyond 30 June 2020. From next financial year, electricity customers will pay for this in
their bills as part of network charges.
The government provided electricity bill relief during COVID-19
As a result of the COVID-19 pandemic, the Queensland Government helped some households
and small businesses to pay electricity costs. Through the Department of Communities,
Disability Services and Seniors, it spent $404 million to assist eligible households and
$86 million to assist eligible small businesses.
Future challenges for the energy sector
Renewable energy sources will replace coal as the main source of energy
Stanwell’s and CS Energy’s coal-fired power stations generated 68 per cent of the state’s
electricity, while CleanCo generated two per cent. The shift to renewable energy sources,
along with the planned retirement of existing coal power stations over the next 26 years, will
see a change in the generation mix in Queensland. We also plan to issue a report to
parliament on how the state government is managing the transition to renewable energy.
Figure 3F shows when coal power stations in Queensland are due to be retired and how
generation of renewables is expected to replace them. This change will impact on the
generators’ operations and asset investment decisions.
• • ••

Energy 2020 (Report 11: 2020–21)
12
Figure 3F Forecast change in coal capacity and renewables generation
Note: The figure above does not include Callide C, as this information is yet to be submitted to AEMO. Forecast renewable capacity includes committed and anticipated projects.
Source: AEMO generating unit expected closure year—July 2020 and AEMO 2020 Integrated System Plan—Central scenario.
In response to this shift, the generators are investing in renewable energy, mostly by entering
into agreements to purchase power.
During the year, CleanCo announced it will purchase:
• 400 megawatts from the Macintyre Wind Farm, located in the Darling Downs region
• 320 megawatts of solar energy from Neoen’s Western Downs Green Power Hub.
In August 2020, Stanwell and CS Energy announced they had signed two new agreements:
• Stanwell will purchase 348 megawatts from the Clarke Creek Wind Farm, which will be
constructed in the Isaac and Livingstone Shire areas.
• CS Energy will purchase 162 megawatts from the Columboola Solar Farm, which will be
constructed in the Western Downs Regional Council area.
In addition, CleanCo plans to build and operate its own 18-turbine wind farm at the same site
as the Macintyre Wind Farm. CS Energy and Stanwell are also investing in hydrogen projects.
Integrating renewables into the electricity networks
With the shift towards renewable energy sources, electricity generators are becoming smaller
and more geographically dispersed, which means they need more transmission connections to
the network. As mentioned earlier, an increasing number of households also produce their own
electricity through rooftop solar panels. If households do not consume this electricity, it is sent
back into the network.
These changes affect the stability of the network. The network entities need to accommodate
these changes while maintaining a reliable electricity supply.
• ••
s 0
e "' ... ... "' ::: "' ti) ..
::iE
7 Calli de B
6
5
4
3
2 Stanw@ll
0 I
• Remaining coal capacity • Capacity closing down • Forecast renewables generation
•

Energy 2020 (Report 11: 2020–21)
13
Rules are changing in the electricity market
From 1 October 2021, wholesale electricity prices will be determined every five minutes
(instead of every 30 minutes). Over time, the Australian Energy Market Commission
expects this change to result in lower wholesale costs, which should lead to lower
electricity prices. Wholesale costs make up around one third of a typical electricity bill.
To implement this change, Queensland energy entities need to reconfigure their existing
information technology systems. The estimated cost of implementation for all energy
entities is $42 million.
• • ••

Energy 2020 (Report 11: 2020–21)
14
Appendices
A. Full responses from entities 15
B. Legislative context 18
C. Audit opinions for entities preparing financial reports 20
D. Entities not preparing financial reports 22
E. Financial results 24
F. Glossary 25
• •• •

Energy 2020 (Report 11: 2020–21)
15
A. Full responses from entities
As mandated in Section 64 of the Auditor-General Act 2009, the Queensland Audit Office gave
a copy of this report with a request for comments to the:
• Minister for Energy, Renewables and Hydrogen and Minister for Public Works and
Procurement
• Under Treasurer, Queensland Treasury
• Chief executive officers for
CleanCo Queensland Limited
CS Energy Limited
Energy Queensland Limited
Queensland Electricity Transmission Corporation Limited (trading as Powerlink
Queensland)
Stanwell Corporation Limited.
We also provided a copy of this report to the Premier and Minister for Trade; Treasurer and
Minister for Investment; and Director-General, Department of the Premier and Cabinet with an
invitation to respond.
This appendix contains the formal responses that we received.
The heads of these agencies are responsible for the accuracy, fairness, and balance of their
comments.
• • ••

Energy 2020 (Report 11: 2020–21)
16
Comments received from Minister for Energy, Renewables and Hydrogen and Minister for Public Works and Procurement
• ••
Minister for Energy, Renew ables and Hydrogen Minister for Public Works and Procurement
Q.uHnaltnd Govemmenl
Our Rel: CTS 25325/20
2 2 JAN 2021
Mr Brendan Worrall Auditor-General of Queensland Queensland Audit Office PO Box 15396 CITY EAST OLD 4002
Email: [email protected]
DearM~II /Jr"~~
1 Wil lam Street &lsbane Ooeensland GPO Box 2457 Brisbane OUeenMand 4001 Australia Telephone +617 3719 7270 E: [email protected]
Thank you for your email of 1 December 2020 regarding the Queensland Audit Office {QAO) Queensland Energy Entitles: 2019-20 Results of Financial Audits Report (the Report) and the opportunity to provide comments.
The Report presents an Informative overview of the energy sector entitles in Queensland and I appreciate the consultative approach taken by the QAO. I note the Report's finding that the financial statements of all six energy entities are reliable and comply with relevant laws and standards, and that despite declines in sector profits the energy sector remains financially viable.
The Report included a recommendation for the energy entities to strengthen the security of their information systems. I understand aspects of this important matter required immediate action and were resolved in a timely manner.
Thank you again for the opportunity to review and respond on the Report. If you need more information or help with this matter, can be contacted on
Yours sincerely
~s Mick de Brenni MP Minister for Energy, Renewables and Hydrogen Minister for Public Works and Procurement
•
Energy 2020 (Report 11: 2020–21)
17
Comments received from Acting Under Treasurer, Queensland Treasury
•
Our Ref: 05905-2020
Mr Brendan Worrall Auditor-General of Queensland Queensland Audit Office PO Box 15396 CITY EAST QLD 4002
Email: [email protected]
13,-i;: ~o •tJ
Dear ~/6irall
Queensland Government
Queensland Treasury
Thank you for your email of 1 December 2020 about the Queensland Audit Office (QAO) draft Energy 2020 report (the Report) suml1"'arising the audit results of Queensland's six energy entities and the opportunity to provide comments.
As it has for many years, the draft repoI1 presents an informative overview of the energy sector entities in Queensland and I acknowledge efforts of the officers involved in developing this repcrt.
I welcome that unmodified audit opinions were provided on the 2019-20 financial statements for all the energy sector entities, and therefore readers can rely on the results in the fimmcial st;aternents.
The three challenges raised in the report are not unique to the Queensland energy sector, and the entire industry will need to adapt lo meet this changing environment. The Queensland Government has a strong commitment to ensuring prices remain sustainable and the fact that Queensland owns its energy businesses means that these businesses can play an important role in our transition to 50 per cent renewable energy by 2030.
I understand QAO and Queensland Treasury officers are in discussions regarding the draft Report and I appreciate the QAO's constructive engagement and consultative approach.
Thank you again for the opportunity to review and respond on this draft report. If you require any further information, please contact
Yours sincerely
~-J-Graham ,raine Acting Under Treasurer
7 1 / 2021
who will be happy to discuss further.
1 William Street GPO B:>x 611 8ri5bane Que1=nc;lanrl 4001 A •~tr,.li.:t l etephor1e +61 7 JOJS 1933 Wt: b:ii I~ 'WVl'W, II t:d$U ff •4 kJ, 'l!IJ'l ,.:I u ABN 90 356 020 23?
• ••
Energy 2020 (Report 11: 2020–21)
18
B. Legislative context
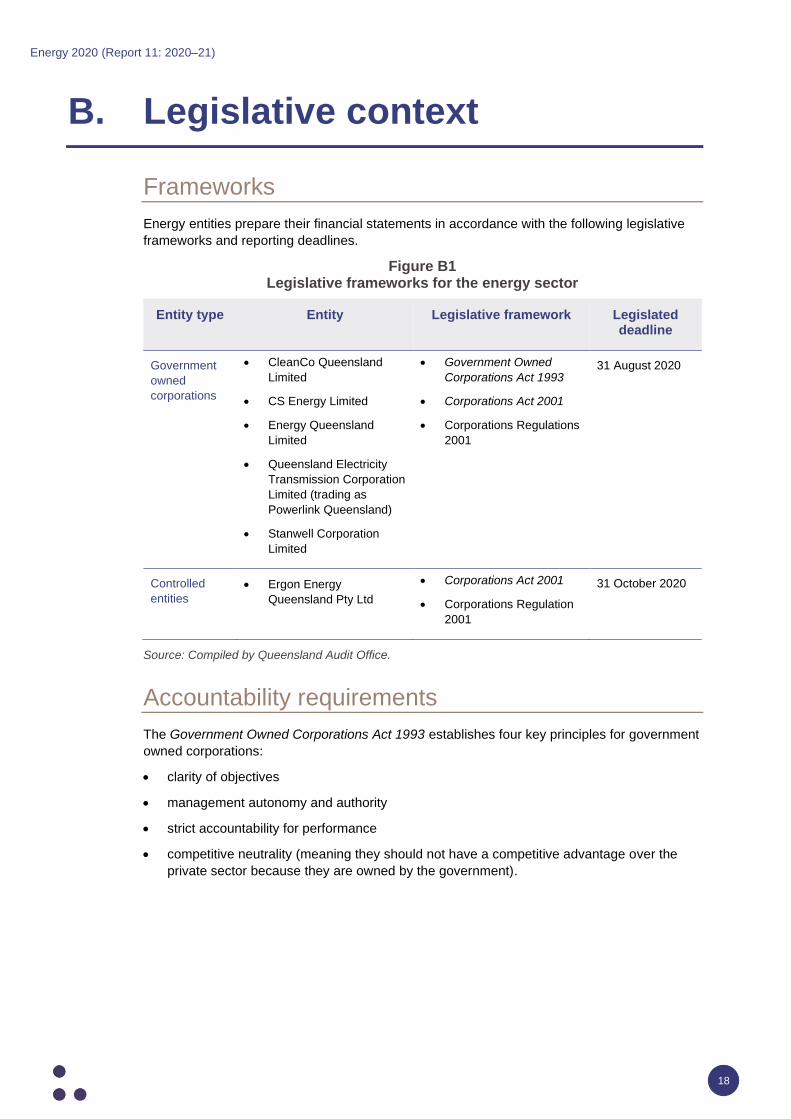
Frameworks
Energy entities prepare their financial statements in accordance with the following legislative
frameworks and reporting deadlines.
Figure B1 Legislative frameworks for the energy sector
Entity type Entity Legislative framework Legislated deadline
Government
owned
corporations
• CleanCo Queensland
Limited
• CS Energy Limited
• Energy Queensland
Limited
• Queensland Electricity
Transmission Corporation
Limited (trading as
Powerlink Queensland)
• Stanwell Corporation
Limited
• Government Owned
Corporations Act 1993
• Corporations Act 2001
• Corporations Regulations
2001
31 August 2020
Controlled
entities
• Ergon Energy
Queensland Pty Ltd
• Corporations Act 2001
• Corporations Regulation
2001
31 October 2020
Source: Compiled by Queensland Audit Office.
Accountability requirements
The Government Owned Corporations Act 1993 establishes four key principles for government
owned corporations:
• clarity of objectives
• management autonomy and authority
• strict accountability for performance
• competitive neutrality (meaning they should not have a competitive advantage over the
private sector because they are owned by the government).
• •• •

Energy 2020 (Report 11: 2020–21)
19
Queensland state government financial statements
Each year, Queensland state public sector entities must table their audited financial
statements in parliament.
These financial statements are used by a broad range of parties including parliamentarians,
taxpayers, employees, and users of government services. For these statements to be useful,
the information reported must be relevant and accurate.
The Auditor-General's audit opinion on these entities' financial statements assures users that
the statements are accurate and in accordance with relevant legislative requirements.
We express an unmodified opinion when the financial statements are prepared in accordance
with the relevant legislative requirements and Australian accounting standards. We modify our
audit opinion when financial statements do not comply with the relevant legislative
requirements and Australian accounting standards and are not accurate and reliable.
• • ••
Energy 2020 (Report 11: 2020–21)
20
C. Audit opinions for entities
preparing financial reports
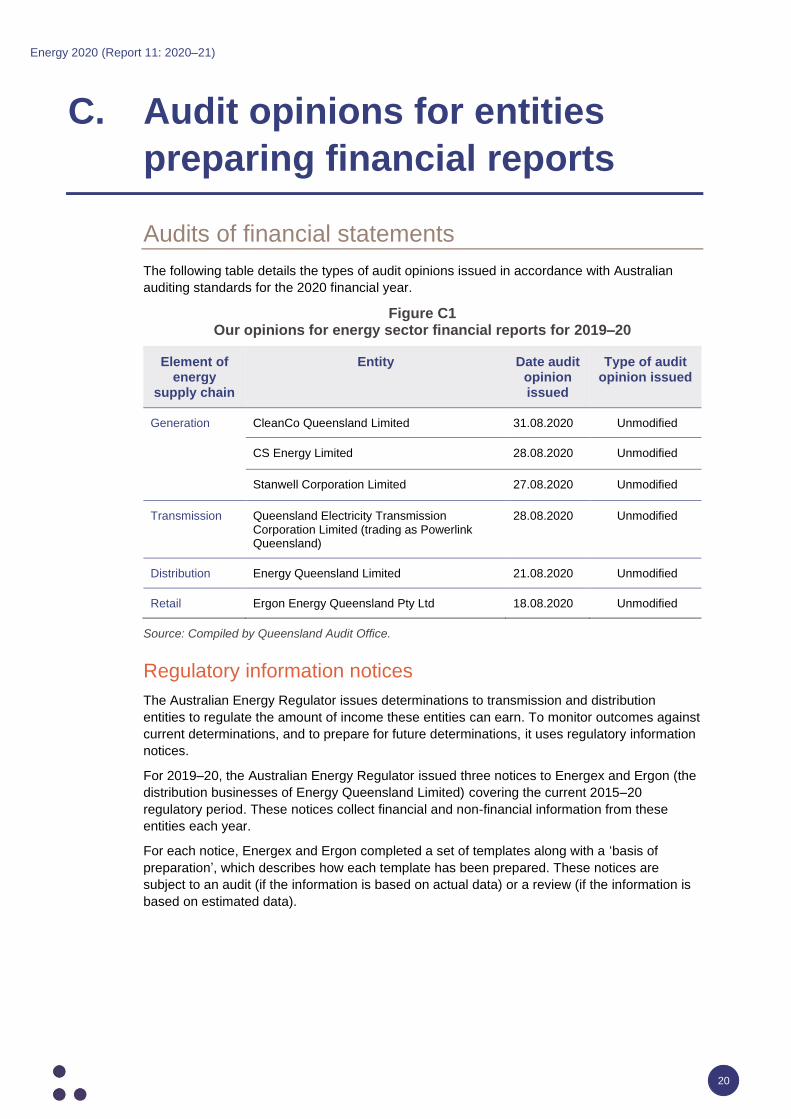
Audits of financial statements
The following table details the types of audit opinions issued in accordance with Australian
auditing standards for the 2020 financial year.
Figure C1 Our opinions for energy sector financial reports for 2019–20
Element of energy
supply chain
Entity Date audit opinion issued
Type of audit opinion issued
Generation CleanCo Queensland Limited 31.08.2020 Unmodified
CS Energy Limited 28.08.2020 Unmodified
Stanwell Corporation Limited 27.08.2020 Unmodified
Transmission Queensland Electricity Transmission Corporation Limited (trading as Powerlink Queensland)
28.08.2020 Unmodified
Distribution Energy Queensland Limited 21.08.2020 Unmodified
Retail Ergon Energy Queensland Pty Ltd 18.08.2020 Unmodified
Source: Compiled by Queensland Audit Office.
Regulatory information notices
The Australian Energy Regulator issues determinations to transmission and distribution
entities to regulate the amount of income these entities can earn. To monitor outcomes against
current determinations, and to prepare for future determinations, it uses regulatory information
notices.
For 2019–20, the Australian Energy Regulator issued three notices to Energex and Ergon (the
distribution businesses of Energy Queensland Limited) covering the current 2015–20
regulatory period. These notices collect financial and non-financial information from these
entities each year.
For each notice, Energex and Ergon completed a set of templates along with a ‘basis of
preparation’, which describes how each template has been prepared. These notices are
subject to an audit (if the information is based on actual data) or a review (if the information is
based on estimated data).
• •• •

Energy 2020 (Report 11: 2020–21)
21
Figure C2 Results of 2019–20 audits and reviews of Energex and Ergon annual regulatory
notices
Type of
information
provided
Certification date Type of report issued
Financial 02.11.2020 (Energex)
02.11.2020 (Ergon)
(8) Unmodified audit opinions
(5) Unmodified review conclusions
Non-financial 02.11.2020 (Energex)
02.11.2020 (Ergon)
(6) Unmodified review conclusions
Source: Compiled by Queensland Audit Office.
Australian financial services licences
Energy sector entities are required to hold an Australian financial services licence if they enter
into contracts used to manage the risk of fluctuating electricity prices. Licence holders must
meet the requirements set out in their licences. These entities lodge forms annually within four
months after the financial year end to the Australian Securities and Investments Commission
to confirm their compliance.
Figure C3 Results of 2019–20 audit of Australian financial services licences
Entity Certification date Type of opinion issued
CleanCo Queensland Limited 03.09.2020 Unmodified
CS Energy Limited 21.09.2020 Unmodified
Ergon Energy Queensland Pty Ltd 19.10.2020 Unmodified
Stanwell Corporation Limited 01.09.2020 Unmodified
Source: Compiled by Queensland Audit Office.
• • ••

Energy 2020 (Report 11: 2020–21)
22
D. Entities not preparing financial
reports
When entities are part of a group and are secured by a deed of cross guarantee (with other
entities in that group agreeing to cover debts), they are not required by the Australian
Securities and Investments Commission (ASIC) to prepare financial statements. Small
companies that meet specific criteria under the Corporations Act 2001 also do not have to
prepare financial statements.
Accordingly, the Auditor-General will not issue audit opinions for the following entities for
2019–20, as they were not required to produce financial statements.
Figure D1 Energy sector entities not preparing financial reports in 2019–20
Public sector entity Reason for not preparing financial statements
Generation
Controlled entities of CS Energy Limited
Aberdare Collieries Pty Ltd Deed of cross guarantee ASIC order
Callide Energy Pty Ltd Deed of cross guarantee ASIC order
CS Energy Group Holdings Pty Ltd Dormant
CS Energy Group Operations Holdings Pty Ltd Dormant
CS Kogan (Australia) Pty Ltd Deed of cross guarantee ASIC order
CS Energy Kogan Creek Pty Ltd Deed of cross guarantee ASIC order
CS Energy Oxyfuel Pty Ltd Deed of cross guarantee ASIC order
Kogan Creek Power Pty Ltd Deed of cross guarantee ASIC order
Kogan Creek Power Station Pty Ltd Deed of cross guarantee ASIC order
• •• •

Energy 2020 (Report 11: 2020–21)
23
Public sector entity Reason for not preparing financial statements
Controlled entities of Stanwell Corporation Limited
Energy Portfolio 1 Pty Ltd Dormant
Glen Wilga Coal Pty Ltd Dormant
Goondi Energy Pty Ltd Non-reporting
Mica Creek Pty Ltd Deed of cross guarantee ASIC order
SCL North West Pty Ltd Deed of cross guarantee ASIC order
Tarong Energy Corporation Pty Ltd Dormant
Tarong Fuel Pty Ltd Deed of cross guarantee ASIC order
Tarong North Pty Ltd Non-reporting
TEC Coal Pty Ltd Deed of cross guarantee ASIC order
TN Power Pty Ltd Deed of cross guarantee ASIC order
Transmission
Controlled entities of Powerlink
Harold Street Holdings Pty Ltd Non-reporting
Powerlink Transmission Services Pty Ltd Non-reporting
Queensland Capacity Network Pty Ltd Non-reporting
Distribution
Controlled entities of Energy Queensland Limited
Energex Limited Deed of cross guarantee ASIC order
Ergon Energy Corporation Limited Deed of cross guarantee ASIC order
Ergon Energy Telecommunications Pty Ltd Non-reporting
Metering Dynamics Pty Ltd Non-reporting
SPARQ Solutions Pty Ltd Non-reporting
Varnsdorf Pty Ltd Dormant
VH Operations Pty Ltd Dormant
Yurika Pty Ltd Deed of cross guarantee ASIC order
Source: Compiled by Queensland Audit Office.
• • ••

Energy 2020 (Report 11: 2020–21)
24
E. Financial results
Figure E1 Energy sector entities—for the year ended 30 June 2020
Note: The results of Ergon Energy Queensland are included in the results of Energy Queensland.
Source: Compiled by Queensland Audit Office.
Figure E2 Energy sector entities—for the year ended 30 June 2019
Note: The results of Ergon Energy Queensland are included in the results of Energy Queensland.
Source: Compiled by Queensland Audit Office.
Amounts in $’000
Entity
Total assets
Total liabilities
Total income
Total expenses (incl. tax)
Operating result after
tax
Returns to shareholders
Finance costs
Total borrowings
CleanCo 418,296 149,714 107,847 157,444 (49,597) (17,592) 4,501 –
CS Energy 2,405,510 1,777,829 1,285,475 1,363,075 (77,600) 40,313 56,359 557,353
Energy Queensland
26,042,000 22,692,000 4,863,000 4,380,000 483,000 651,000 714,000 17,355,000
Powerlink 8,365,933 6,464,125 970,762 882,186 88,576 200797 233,470 5,265,221
Stanwell 3,782,859 2,648,257 3,193,981 3,434,245 (240,264) 128,028 62,896 821,419
Total 41,014,598 33,731,925 10,421,065 10,216,950 204,115 1,002,546 1,071,226 23,998,993
Ergon Energy Queensland
1,151,292 1,151,292 2,038,219 1,933,480 104,739 57,973 822 –
Amounts in $’000
Entity Total assets
Total liabilities
Total income
Total expenses (incl. tax)
Operating result after
tax
Returns to shareholders
Finance costs
Total borrowings
CleanCo 183,267 4,335 6,804 7,872 (1,068) (457) 34 –
CS Energy 2,219,788 1,643,299 1,378,787 1,218,478 160,309 233,861 66,267 557,353
Energy Queensland
25,783,000 22,156,000 4,991,000 4,334,000 657,000 939,000 764,000 16,724,000
Powerlink 8,350,985 6,479,024 1,005,837 891,798 114,039 163,068 240,034 5,265,221
Stanwell 4,157,725 2,865,437 4,046,896 3,310,887 736,009 863,916 70,356 821,603
Total 40,694,765 33,148,095 11,429,324 9,755,163 1,667,357 2,199,388 1,140,691 23,368,177
Ergon Energy Queensland
1,079,201 970,371 2,180,266 1,959,810 220,456 314,737 685 –
• •• •

Energy 2020 (Report 11: 2020–21)
25
F. Glossary
Term Definition
Accountability The responsibility of public sector entities to achieve their
objectives of delivering reliable financial reporting, effective and
efficient operations, compliance with applicable laws, and reports to
interested parties.
Auditor-General Act 2009 An Act of the State of Queensland that establishes the
responsibilities of the Auditor-General, the operation of the
Queensland Audit Office, the nature and scope of audits to be
conducted, and the relationship of the Auditor-General with
parliament.
Australian accounting standards The rules by which financial statements are prepared in Australia.
These standards ensure consistency in measuring and reporting on
similar transactions.
Community service obligations Government payments to commercial entities to provide services
that are not sustainable otherwise.
Competitive neutrality This is the policy that a public sector business should not have a
competitive advantage (or disadvantage) over the private sector
solely due to their government ownership.
Controlled entity An entity controlled by another entity. The controlling entity can
dominate decision-making, directly or indirectly, in relation to
financial and operating policies so as to enable the other entity to
operate with it in achieving the objectives of the controlling entity.
Deficiency When internal controls are ineffective or missing, and are unable to
prevent, or detect and correct, misstatements in the financial
statements. A deficiency may also result in non-compliance with
policies and applicable laws and regulations and/or inappropriate
use of public resources.
Megawatt hours A megawatt hour (MWh) is equal to 1,000 kilowatts of energy used
continuously for one hour.
Significant deficiency A deficiency, or combination of deficiencies, in an internal control
that requires immediate remedial action.
Unmodified audit opinion An unmodified opinion is expressed when financial statements are
prepared in accordance with the relevant legislative requirements
and Australian accounting standards.
• • ••

qao.qld.gov.au/reports-resources/reports-parliament
Suggest a performance audit topic
Contribute to a performance audit in progress
Subscribe to news and our blog
Connect with QAO on LinkedIn
T: (07) 3149 6000 E: [email protected] W: qao.qld.gov.au 53 Albert Street, Brisbane Qld 4000 PO Box 15396, City East Qld 4002
• Queensland • • Audit Office
Better public services