energy analysis and mechanical re-design of little souls daycare …...
TRANSCRIPT

Energy Analysis and Mechanical Re-design of Little Souls Daycare
A project submitted for the 2016 ASHRAE Student Design Competition.
University of Regina
Faculty of Engineering and Applied Science Regina, Saskatchewan, Canada
Bradley Lulik Eva Rennie Brent Yeske
© June 2016
The following report is a condensed version, and has been provided to ensure compliance with the 2016
Applied Engineering Challenge judging criteria. If you wish to review the extended document, please
contact Brad Lulik at [email protected]

Tel: (306) 543-0011 Fax: (306) 525-3079 Email: [email protected]
Web: www.shrmsk.com Administration Office: 3535-8th Avenue
Mailing Address: PO Box 3356 Stn Main, Regina SK S4P 3H1
Shayil Home * Meal Program * Emergency Shelter * Subsidized Daycare * Youth Centre
Serving Saskatchewan Since 1990
To The Applied Engineering Competition
RE: Souls Harbour Rescue Mission entry
Dated: May 31 2016
Our organization was approached last fall by a team of engineering students, (Brent Yeske, Eva Rennie,
and Brad Lulik) to do an energy assessment of one of our buildings (1475 Athol St). We discussed a
couple aspects that we would appreciate out of this process: one being some accurate floor plans that
we could use for future renovations and an updated fire plan, along with a suggestive strategy in order
to deal with the lack of any air circulation systems in this building.
Our organization was very impressed with the finished product, whereas the team completed a very
thorough energy assessment of our building, allowing us to clearly see where there are major energy
inefficiencies through a variety of deficiencies. In addition, they put together a strategic plan that takes
into account our non-profit status and inability to suddenly produce hundreds of thousands of dollars
for building repairs. This strategic plan analyzes the best approach to do strategic upgrades to our
building to install a series of air ventilation systems, providing us with the best ROI over a ten year
period.
It was this balance between the professional standards associated with engineering and the empathic
understanding of our organization’s challenges to implement these necessary changes that impressed us
the most. Their help and contribution has provided us with a blueprint for success, allowing us to
implement a plan to upgrade our building without it overwhelming us financially, over the next ten
years.
Well done team!
Michael Towers
Director of Operations

Energy Analysis and Mechanical Re-design of Little Souls Daycare
Brent Yeske - Brad Lulik - Eva Rennie
i © June 2016
EXECUTIVE SUMMARY The project team has entered into a partnership with Little Souls Daycare, an affiliate of Souls Harbour
Rescue Mission, to provide an energy audit and mechanical system redesign for their facility.
Construction of the building was completed in 1951, and originally housed St. Andrew's United Church.
Following the closure of St. Andrews, Souls Harbour Rescue Mission purchased the facility and re-
purposed it to include an administration area, youth center, and fully licensed childcare facility.
For more than 25 years, Souls Harbour Rescue Mission has been providing a variety of programs and
services to the community of Regina, Saskatchewan. Men’s and Women’s shelters, a clothing store, meal
programming, youth centres, a daycare facility, addiction programming, and affordable housing are where
the organization focuses most of their effort.
In August of 2015, the project team was made aware of mechanical deficiencies at the Souls Harbour
Rescue Mission facility. Due to the nature of these deficiencies, largely related to ventilation
requirements, the physical health of the occupants was at risk. Souls Harbour Rescue Mission makes it
their goal to provide a caring, warm, and safe environment for each child to play, explore, and learn; in
doing so, special consideration is being applied by the project team to ensure a regulatory compliant
mechanical system is proposed. The facility is a not-for-profit and relies solely on charitable donations
from the general public; and as such, the management team at Souls Harbour works relentlessly to
provide all necessary care for their stakeholders, while attempting to retain enough resources to maintain
each of their facilities. Due to the fact that the majority of Souls Harbour’s funding is invested into the
programs and services being offered, financial consideration has remained a large component of the
project.
Literature review pertaining to regulatory compliance was an important aspect of the final project.
Compliance with the National Building Code of Canada, with a specific focus on ASHRAE Ventilation
requirements, was crucial to ensuring that any proposed solution addresses deficiencies with the
stipulations laid out by government. Given that the current mechanical system at Little Souls Daycare
lacks any form of cooling or ventilation, the health of the primary occupants -- children -- must be
ensured. When discussing improvements to the efficiencies and quality of heating, ventilation, and air-
conditioning, the building envelope becomes important. In the context of an energy audit and mechanical
system redesign, an economical system coupled with an effective envelope creates an energy efficient
building.
The project team worked closely with the Operations staff at Souls Harbour Rescue Mission to analyze
various mechanical solutions within an HVAC simulation software. This exercise provides for
optimization and proper sizing of the proposed heating, ventilation, and air-conditioning systems; and in
doing so, the project team is able to ensure that the design is on the basis of energy utilization. A
multitude of simulations were completed to further enhance the facilitation of the energy analysis, and
confirmation of the simulation outputs was completed to verify that the results reflect an accurate measure
of energy within the system. Further to the basic energy utilization for Little Souls Daycare, the project
team utilized an energy modeling software, as well as past utility expenses, to explore the energy use for
the building on a multitude of levels. There are many factors that have an influence on the heating and
cooling loading for the facility, and with this in mind the project team explored several opportunities for
improvement to the physical building that may lead to better resulting efficiencies. Component
specifications were altered to reflect replacement with higher quality materials, and several mechanical
solutions were simulated to determine if a more efficient system, at a greater capital expense, provides a
more significant return-on-investment. Additionally, in order to provide a more qualitative analysis of the
current and proposed facilities, ASHRAE’s Building Energy Quotient (BEQ) was utilized to characterize
the various energy uses of the current and proposed systems. The BEQ provides an opportunity to

Energy Analysis and Mechanical Re-design of Little Souls Daycare
Brent Yeske - Brad Lulik - Eva Rennie
ii © June 2016
analyze a system on the merits of its energy efficiencies rather than compromising the indoor
environment quality. As such, although the current system, with no means of ventilation, achieves a A-
(Very Good) grading for its efficiencies, by creating a regulatory compliant facility, that ultimately uses
more energy than the current system, the BEQ can still achieve a grading of B (efficient).
Infrared analysis of the existing facility was an important component for gaining further insight into
problematic areas throughout the building. Infrared serves as a formidable tool for identifying areas of
substantial heat loss. There is little purpose to implementing an improved mechanical system when the
facility is experiencing excessive infiltration. The trouble areas that have been identified proved to be
influential on the final recommendations.
Throughout the duration of the energy audit and mechanical re-design of Little Souls Daycare, various
recommendations have been made in order to improve the efficiencies of the space and the regulatory
compliances of the facility. Roof Top Units, often referred to as Air Handling Units, have been
recommended as the most practical design solution. It is also recommended that Souls Harbour Rescue
Mission utilize a phased implementation plan, which effectively utilizes any returns on investment.
The project team designed an energy model which was validated through the use of past utility expenses,
infrared imaging, and ASHRAE’s Building Energy Quotient. This process allowed for recommendations
to improve the energy performance of Little Souls Daycare. Ensuring that recommendations are on the
basis of both energy utilization and economic evaluation remained a priority for the project team.
Following the project team’s wrap-up meeting with the client, it is hoped that this plan will further assist
with ensuring the health and safety of future generations of facility users.

Energy Analysis and Mechanical Re-design of Little Souls Daycare
Brent Yeske - Brad Lulik - Eva Rennie
iii © June 2016
TABLE OF CONTENTS
Executive Summary ......................................................................................................................... i
Table of Contents ........................................................................................................................... iii
List of Appendices ......................................................................................................................... iv
List of Figures ................................................................................................................................. v
List of Tables ................................................................................................................................. vi
1.0 Introduction and Background ................................................................................................... 1
2.0 Facility Description ................................................................................................................... 1
3.0 Problem Statement .................................................................................................................... 1
3.1 Client Concerns ..................................................................................................................... 1
3.2 Constraints ............................................................................................................................. 1
4.0 Measurement ............................................................................................................................. 2
4.1 Infrared Photography............................................................................................................. 2
4.2 Simulation ............................................................................................................................. 4
4.2.1 System Model ................................................................................................................ 4
4.2.2 System Model Confirmation .......................................................................................... 5
4.2.3 EQUEST ........................................................................................................................ 6
4.3 Regulatory Compliance ......................................................................................................... 8
4.3.1 ASHRAE Standard 55: Thermal Comfort ..................................................................... 8
4.3.2 ASHRAE Standard 62: Ventilation for Acceptable Indoor Quality .............................. 8
5.0 Analysis..................................................................................................................................... 8
5.1 System Analysis .................................................................................................................... 8
5.2 Equipment Alternatives Analysis ........................................................................................ 10
5.2.1 Roof Top Units ............................................................................................................ 10
5.3 Energy Analysis .................................................................................................................. 11
5.3.1 TRACE 700 ................................................................................................................. 11
5.3.2 eQuest .......................................................................................................................... 12
5.3.3 Building Energy Quotient ............................................................................................ 17

Energy Analysis and Mechanical Re-design of Little Souls Daycare
Brent Yeske - Brad Lulik - Eva Rennie
iv © June 2016
6.0 System Improvements ............................................................................................................. 18
6.1 Mechanical System Selection ............................................................................................. 18
6.1.1 Sizing and Placement of Equipment ............................................................................ 18
6.1.2 Cost Analysis ............................................................................................................... 19
7.0 Implementation Plan ............................................................................................................... 22
7.1 List of Alternatives .............................................................................................................. 22
7.2 Priority List ......................................................................................................................... 22
8.0 Recommendations ................................................................................................................... 23
9.0 Conclusion .............................................................................................................................. 23
REFERENCES ............................................................................................................................. 24
LIST OF APPENDICES
Appendix A: eQuest Data
Appendix B: Roof Top Unit Data
Appendix C: Trace700 Data
Appendix D: Trace700 Calculations
Appendix E: List of Alternatives

Energy Analysis and Mechanical Re-design of Little Souls Daycare
Brent Yeske - Brad Lulik - Eva Rennie
v © June 2016
LIST OF FIGURES
Figure 1: Infrared Photo: Concrete Foundation Heat Losses .......................................................... 2
Figure 2: Infrared Photo: Single-Pane Windows & Wall Insulation Discrepancies ....................... 3
Figure 3: Infrared Photo: Poorly Insulated Chimney Cap .............................................................. 3
Figure 4: Infrared Photo: Frost Penetration of Gymnasium Skylights ........................................... 4
Figure 5: Power Consumption Comparison (Actual vs eQuest) ................................................... 13
Figure 6: Gas Consumption Comparison (Actual vs eQuest) ....................................................... 13
Figure 7: Power Consumption of Baseline System (Left) ............................................................ 14
Figure 8: Gas Consumption of Baseline System (Right) .............................................................. 14
Figure 9: Power Consumption of Mid-Efficiency System ........................................................... 15
Figure 10: Gas Consumption of Mid-Efficiency System ............................................................. 16
Figure 11: Power Consumption of High-Efficiency System (Left) .............................................. 17
Figure 12: Gas Consumption of High-Efficiency System (Right)................................................ 17
Figure 13: Present Value of Cost for Varying Analysis Periods .................................................. 21

Energy Analysis and Mechanical Re-design of Little Souls Daycare
Brent Yeske - Brad Lulik - Eva Rennie
vi © June 2016
LIST OF TABLES
Table 1: Envelope Performance Data ............................................................................................. 5
Table 2: Internal Loads ................................................................................................................... 5
Table 3: Total Capacity of Heating Coil ....................................................................................... 11
Table 4: Total Capacity of Cooling Coil....................................................................................... 12
Table 5: BuildingEQ Ratings ........................................................................................................ 17
Table 6: Cooling and Heating Capacities ..................................................................................... 18
Table 7: Breakdown of Costs for Each Alternative ...................................................................... 19
Table 8: NPV and Payback Period for Incremental Options ........................................................ 20
Table 9: Cost Breakdown for Individual HVAC Zones ............................................................... 21
Table 10: Priority List for Project Implementation....................................................................... 22

Energy Analysis and Mechanical Re-design of Little Souls Daycare
Brent Yeske - Brad Lulik - Eva Rennie
1 © June 2016
1.0 INTRODUCTION AND BACKGROUND In partnership with Souls Harbour Rescue Mission, the project team has completed an energy audit and
mechanical system redesign of Little Souls Daycare. Through extensive analysis of the Little Souls
Daycare facility, the project team was able to thoroughly examine the impacts of external factors on both
the heating and cooling loads of the building. The project team has worked to ensure that the energy audit
and mechanical system redesign is on the basis of energy utilization and economic evaluation; in doing
so, various engineering tools were used to facilitate the analysis of energy-use and the economic effects of
the proposed mechanical solutions. Recommendations made through this report will assist Souls Harbour
in improving the energy performance of Little Souls Daycare, and will include practical solutions for
improving the regulatory compliance associated with operation.
2.0 FACILITY DESCRIPTION The facility of interest is located at 1475 Athol Street, Regina, Saskatchewan, and was originally owned
by the United Church. The chapel was located on the upper floor where the daycare facility is currently
situated. The building was renovated and repurposed after its purchase by Souls Harbour. The purpose of
the facility today is to provide children in lower income families the opportunity to partake in daycare
activities,while under the supervision of Souls Harbour employees. The building now consists of a large
daycare room with kitchen and washroom facilities on the main floor, along with administrative offices
and a small boardroom. The lower level houses ample storage space, as well as a second kitchen area, a
fully equipped computer room, and a rumpus area for kids to play. Furthermore, there is a gymnasium
located on the East side of the building, which gives children and youth the opportunity to play sports and
interact. Along the perimeter of the gymnasium, there are additional storage rooms on the main level, and
office spaces on the upper balcony. (Towers, 2015)
3.0 PROBLEM STATEMENT
3.1 CLIENT CONCERNS The client had concerns regarding their building ventilation and the inherent safety of their occupants.
More specifically, the client was fully aware that the facility has no current means of ventilation in
summer months, which results in a stale and humid environment. This environment can reach
temperatures upwards of 30 degrees Celsius during hot summer months, and poses a risk to occupants
who are generally children under the age of 10. Furthermore, when the building was repurposed, the
ventilating ductwork was closed off and made unusable. The deliverables for the client were made very
clear; the organization wanted to improve inefficiencies at the lowest possible cost while improving the
health and safety of the building and providing a habitable environment for its users. (Towers, 2015)
Given that the organization is not-for-profit, their budget is limited and is primarily directed towards
providing quality services for the children they care for each day. Additional operating and maintenance
costs for the facility create a burden for the organization, but must be budgeted for and justified in order
to improve the indoor environment for occupants. Therefore, by helping Souls Harbour update their
HVAC system, the project group can effectively accomplish the client’s goal, preferably at a reasonable
cost and with a phased approach. (Towers, 2015)
3.2 CONSTRAINTS The first constraint of the project was the cost of implementation of an HVAC solution. The company, as
mentioned, is not-for-profit and thus has limited funds available for spending on additional capital costs.
Energy Analysis and Mechanical Re-design of Little Souls Daycare
Brent Yeske - Brad Lulik - Eva Rennie
2 © June 2016
Also, because the facility was constructed in the 1950’s, the structural integrity of the building may be
compromised and this could ultimately impact the type of alternatives allowable for HVAC in terms of
weight and size. Furthermore, since the building is already constructed, there is limited access to walls,
ceilings and other areas where insulation and plumbing exists. Therefore the group, working together with
their industry partner and other qualified individuals, had to come up with assumptions regarding the
building condition, including but not limited to: thermal insulation values and clearances for ductwork.
Technologies such as infrared scanning, which will be discussed later, were utilized to help reveal
building deficiencies undetected by the naked eye that require immediate or future attention.
4.0 MEASUREMENT
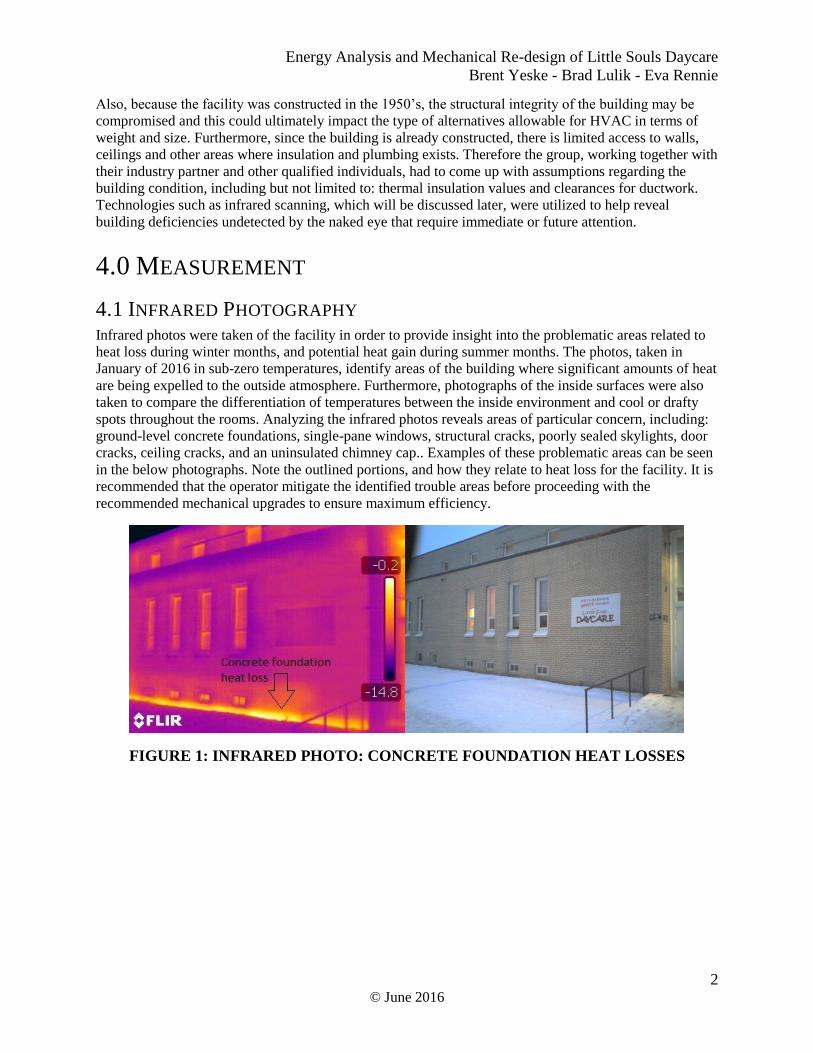
4.1 INFRARED PHOTOGRAPHY Infrared photos were taken of the facility in order to provide insight into the problematic areas related to
heat loss during winter months, and potential heat gain during summer months. The photos, taken in
January of 2016 in sub-zero temperatures, identify areas of the building where significant amounts of heat
are being expelled to the outside atmosphere. Furthermore, photographs of the inside surfaces were also
taken to compare the differentiation of temperatures between the inside environment and cool or drafty
spots throughout the rooms. Analyzing the infrared photos reveals areas of particular concern, including:
ground-level concrete foundations, single-pane windows, structural cracks, poorly sealed skylights, door
cracks, ceiling cracks, and an uninsulated chimney cap.. Examples of these problematic areas can be seen
in the below photographs. Note the outlined portions, and how they relate to heat loss for the facility. It is
recommended that the operator mitigate the identified trouble areas before proceeding with the
recommended mechanical upgrades to ensure maximum efficiency.
FIGURE 1: INFRARED PHOTO: CONCRETE FOUNDATION HEAT LOSSES
Energy Analysis and Mechanical Re-design of Little Souls Daycare
Brent Yeske - Brad Lulik - Eva Rennie
3 © June 2016
Figure 1 demonstrates the heat loss through the concrete foundation that was identified around the entire
perimeter of the building. This type of heat loss is caused by inadequate insulating material between the
facility wall and the outside air. The scale shown on the right side of the infrared photograph denotes an
outside ambient temperature of -14.8 degrees Celsius. The concrete foundation exterior wall experiences
temperatures upwards of -0.2 degrees Celsius, a differential temperature of 14.6 degrees Celsius.
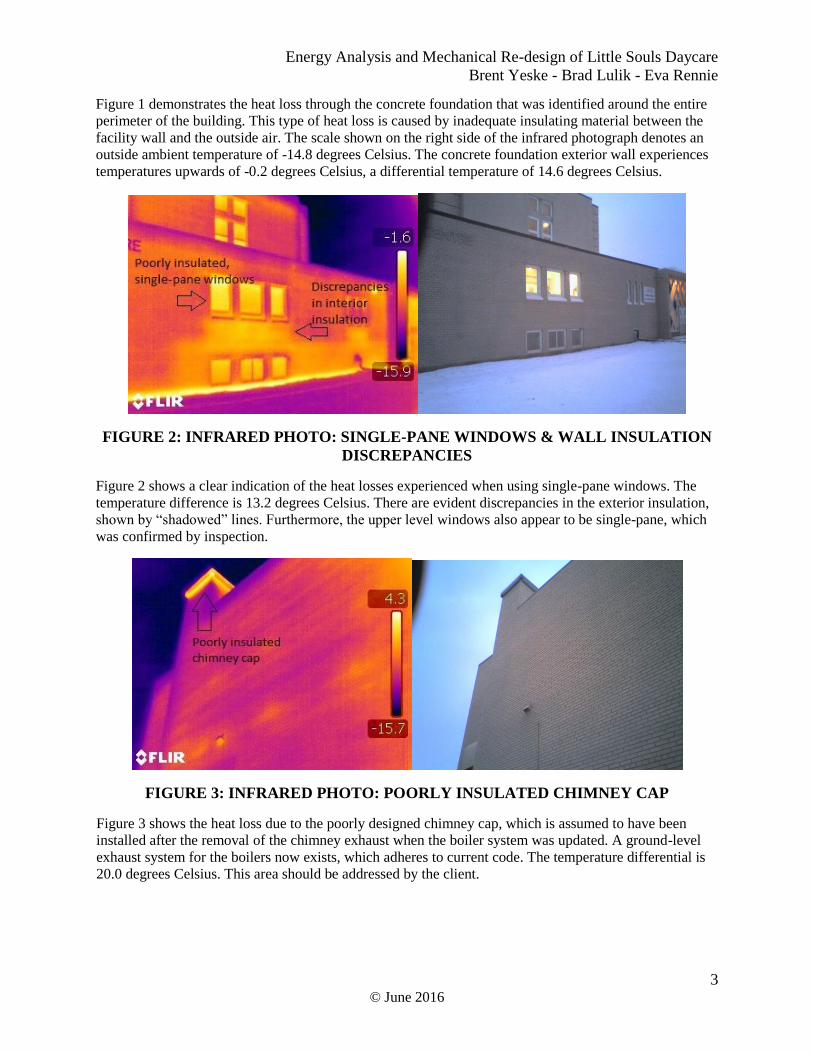
FIGURE 2: INFRARED PHOTO: SINGLE-PANE WINDOWS & WALL INSULATION
DISCREPANCIES
Figure 2 shows a clear indication of the heat losses experienced when using single-pane windows. The
temperature difference is 13.2 degrees Celsius. There are evident discrepancies in the exterior insulation,
shown by “shadowed” lines. Furthermore, the upper level windows also appear to be single-pane, which
was confirmed by inspection.
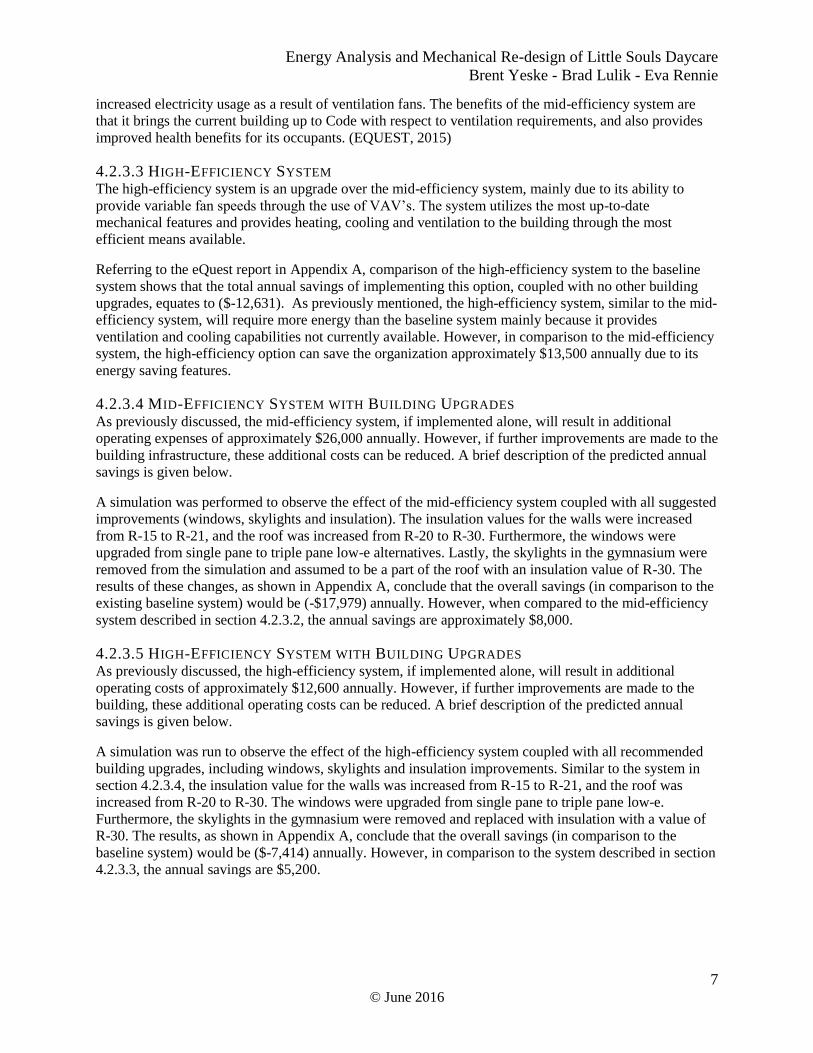
FIGURE 3: INFRARED PHOTO: POORLY INSULATED CHIMNEY CAP
Figure 3 shows the heat loss due to the poorly designed chimney cap, which is assumed to have been
installed after the removal of the chimney exhaust when the boiler system was updated. A ground-level
exhaust system for the boilers now exists, which adheres to current code. The temperature differential is
20.0 degrees Celsius. This area should be addressed by the client.

Energy Analysis and Mechanical Re-design of Little Souls Daycare
Brent Yeske - Brad Lulik - Eva Rennie
4 © June 2016
FIGURE 4: INFRARED PHOTO: FROST PENETRATION OF GYMNASIUM
SKYLIGHTS
Figure 4 shows the appearance of frost along the perimeter of the gymnasium skylight windows. The
existence of frost indicates that a significant amount of heat loss is occurring along these edges.
Moreover, since the skylight is located on the roof of the building, and because heat inherently rises, there
is an increased risk of significant heat loss through skylights and other poorly insulated roof-mounted
fixtures. As seen in the infrared photograph, the differentiation in temperature is 21.8 degrees Celsius.
This is another area of concern that should be addressed.
4.2 SIMULATION
4.2.1 SYSTEM MODEL TRACE700 is an engineering simulation tool designed to weight the energy and economic impacts of
architectural features, HVAC systems, HVAC equipment, building utilization and financial options; and
was the primary software program used for simulating the existing and proposed systems for the daycare
facility. Values entered into the program were referenced from ASHRAE standards, as well as
recommendations by our industry partner. It is important to have an understanding on the techniques used
by the program to calculate output values, as such, the general formula for heat loss is described below:
(ASHRAE, 2013)
𝐻 = 𝑈 ⋅ 𝐴 ⋅ (𝑡𝑜𝑢𝑡 − 𝑡𝑖𝑛) [1]
As seen from the above equation, the total change in enthalpy is proportional to the U-value of the shared
barrier, the square footage of the barrier, and the temperature difference across the barrier. When
discussing the daycare facility, it was determined that the R-value of the walls was 15, while the roof’s R-
value is 20. Below-grade walls were determined to have minimal insulation barrier, aside from the
existing brick, as was supported through the aforementioned infrared photos. In Regina, Saskatchewan,
most walls are constructed with either 4” to 6” insulation. For the Little Souls Day Care facility,
insulation thickness was determined to be slightly less than 4”. When discussing insulation, it is
important to note that the U-Value represents the thermal conduction across the surface.
The first step to ensuring an accurate model was creating architectural drawings for the facility. Although
Souls Harbour Rescue Mission had basic plans available, they were determined to be outdated and
inaccurate for our purposes. Following the creation of these drawings, TRACE700 was used to perform
the heating and cooling load calculations for the individual rooms throughout the facility. The relevant
characteristics of the area -- such as dimensions, the number of people, the amount of heat gain due to

Energy Analysis and Mechanical Re-design of Little Souls Daycare
Brent Yeske - Brad Lulik - Eva Rennie
5 © June 2016
lighting, as well as miscellaneous loads -- were defined for the consideration of internal loading of the
facility. (TRANE, 2015)
In order to ensure that the proposed HVAC system is appropriate for the current operational needs, clear
design temperatures for the facility must also be defined. In doing so, the cooling and heating dry bulb
values were selected as 88 ℉ and -33℉, respectively. Although temperature considerations are important,
due to the fact that Regina, Saskatchewan is a relatively dry climate, the humidity considerations must be
accounted for to ensure an appropriate unit selection. Finally, moisture capacitance of any absorbing
materials present within the facility will be considered throughout our facility model. (TRANE, 2015)
The interior loading of the facility is another crucial component when considering the facility model, as
the occupants contribute towards substantive loading within the system. With this said, specifying the
number of occupants must be completed to ensure that the proposed system is able to overcome the
natural heat being displaced by the occupants. For the purposes of this facility, a sensible heat gain and
latent heat gain of 250 Btu/person and 200 Btu/person, respectively, can be used for the office space and
daycare, while a sensible heat gain and latent heat gain of 710 Btu/person and 1090 Btu/person,
respectively, can be used for the Gymnasium. (TRANE, 2015)
Regarding lighting, recessed fluorescents are used for the majority of the facility, and approximately 80%
of the heat load is rejected into the space, with the heat gain due to the lighting being determined to be 1
W/sqft. The heat gain due to the lighting was calculated by examining the wattage and size of each
lighting unit. (TRANE, 2015)
The above listing has been provided to briefly outline a general summary of the information used to
accurately model the proposed system.
4.2.2 SYSTEM MODEL CONFIRMATION The system model serves as an important tool when proposing a mechanical system, but the data from the
simulation outputs should be confirmed to ensure accuracy. For the Little Souls Daycare facility, the
overall envelope performance was determined to be:
TABLE 1: ENVELOPE PERFORMANCE DATA
U-Value
Overall Roof U-Value 0.056 Btu/h*ft2*F
Overall Wall U-Value 0.067 Btu/h*ft2*F
Overall Glass U-Value 0.962 Btu/h*ft2*F
Overall Ceiling U-Value 0.317 Btu/h*ft2*F
Further to this, the internal loads of Little Souls Daycare were determined to be:
TABLE 2: INTERNAL LOADS
Internal Load
Occupancy Density 200 ft2 per person
Lighting Power Density 1 W/ft2 (max)
Plug-Loads 20% after-hours
Simulation data summaries can be viewed in Appendix C. Although TRACE700 provides a reasonable
outline of internal loading, the data should be confirmed for accuracy. As such, the project team has
committed to confirming the output data, and an example of these calculations have been provided for the
administrative space in Appendix D.

Energy Analysis and Mechanical Re-design of Little Souls Daycare
Brent Yeske - Brad Lulik - Eva Rennie
6 © June 2016
4.2.3 EQUEST EQuest is a free software available from the Government of Canada. It allows users to predict changes in
energy usage for a building based on a variety of different factors, including but not limited to: window
efficiency, heating and cooling efficiency, mechanical system parameters, insulation ratings,
miscellaneous plug loads, area lighting, hours of operation, and occupancy. From this software, the
project team was able to compare the results of many different simulation runs to determine the ultimate
impact each change would have on the overall building energy consumption. (EQUEST, 2016)
4.2.3.1 BASELINE SYSTEM The baseline system, or existing system, is best described as having no ventilation or cooling capability,
coupled with baseboard (boiler supplied) heating. Insulation values were estimated to be R-20 for the
roof, R-15 for the walls, and zero insulation for any below grade walls (foundation). This is a
conservative estimate, as no access was available to the existing insulating material. However, through
the use of infrared scanning technology, it was evident that insulation quality was poor on all below grade
surfaces, as earlier discussed. Furthermore, the baseline system assumed a lighting power density of one
Watt per square foot in heavy traffic areas. These areas included the daycare and offices, where the
majority of day-to-day operations and activities take place. Lighting in the gymnasium, storage areas,
kitchen and corridors was assumed to be zero, as these areas are infrequently used and are not lit when
unoccupied. Plug loads were assumed to be low, approximately 20% during hours of no occupancy, and
60% during hours of occupancy. However, plug loads were only accounted for in areas of high traffic or
where administrative duties typically take place. Other areas, including the kitchen and storage rooms
were assumed to have plug loads of 20% during occupancy, since there were not many appliances
identified in these areas during field visits. Windows for the baseline system were all assumed to be single
pane. This assumption holds true for the majority of the building, with exception to a select few areas
where renovations have taken place in recent years. However, for the purpose of the simulations, single
pane was assumed for all windows. Infiltration rates were assumed to be 0.45 CFM/ft2 at the perimeter
and 0.225 CFM/ft2 in the core area. From the baseline system, a variety of simulations could be
performed by manipulating the system characteristics, and results could be compared to the baseline
system from the exported data. (EQUEST, 2015)
4.2.3.2 MID-EFFICIENCY SYSTEM The first option provided for improvement over the baseline system consisted of mid-efficiency
ventilation, cooling and heating units located on the roof of the facility. These units are capable of
providing air-conditioned air to the building during summer months. Ventilation is provided by
circulating fans within the unit, with return air and exhaust ports. Heating is provided via forced air
heating, which can be used in combination with the existing boiler system, as a stand-alone solution, or
not at all. The mid-efficiency system does not include the ability to vary the speed of the output fan
motor, which limits its abilities to a simple on/off operation. This is typical of most furnace and air
conditioning units; however, variable frequency drives (VFDs) and variable air volume (VAV) control are
becoming more popular in industry because of their ability to operate at speeds between zero (off) and
100% (maximum). VAV units can provide additional cost savings. The mid-efficiency system described
assumes that no other upgrades have been made to the building aside from the heating, cooling and
ventilation system. Therefore, windows, insulation, skylights, doors and other sources of heat gain/loss
have been left unchanged. (EQUEST, 2015)
The eQuest report, as shown in Appendix A, indicates that the mid-efficiency system coupled with no
other building improvements would result in annual energy savings of (-$26,176) over the baseline
system. The reasoning for this loss of operating costs is due to the fact that the baseline system, as
described in section 4.2.3.1 above, does not currently provide any means of ventilation or air conditioning
to the building. Therefore, by introducing both ventilation and air conditioning, additional operating costs
must also be incurred as a result of more energy consumption during hot summer months, as well as
Energy Analysis and Mechanical Re-design of Little Souls Daycare
Brent Yeske - Brad Lulik - Eva Rennie
7 © June 2016
increased electricity usage as a result of ventilation fans. The benefits of the mid-efficiency system are
that it brings the current building up to Code with respect to ventilation requirements, and also provides
improved health benefits for its occupants. (EQUEST, 2015)
4.2.3.3 HIGH-EFFICIENCY SYSTEM The high-efficiency system is an upgrade over the mid-efficiency system, mainly due to its ability to
provide variable fan speeds through the use of VAV’s. The system utilizes the most up-to-date
mechanical features and provides heating, cooling and ventilation to the building through the most
efficient means available.
Referring to the eQuest report in Appendix A, comparison of the high-efficiency system to the baseline
system shows that the total annual savings of implementing this option, coupled with no other building
upgrades, equates to ($-12,631). As previously mentioned, the high-efficiency system, similar to the mid-
efficiency system, will require more energy than the baseline system mainly because it provides
ventilation and cooling capabilities not currently available. However, in comparison to the mid-efficiency
system, the high-efficiency option can save the organization approximately $13,500 annually due to its
energy saving features.
4.2.3.4 MID-EFFICIENCY SYSTEM WITH BUILDING UPGRADES As previously discussed, the mid-efficiency system, if implemented alone, will result in additional
operating expenses of approximately $26,000 annually. However, if further improvements are made to the
building infrastructure, these additional costs can be reduced. A brief description of the predicted annual
savings is given below.
A simulation was performed to observe the effect of the mid-efficiency system coupled with all suggested
improvements (windows, skylights and insulation). The insulation values for the walls were increased
from R-15 to R-21, and the roof was increased from R-20 to R-30. Furthermore, the windows were
upgraded from single pane to triple pane low-e alternatives. Lastly, the skylights in the gymnasium were
removed from the simulation and assumed to be a part of the roof with an insulation value of R-30. The
results of these changes, as shown in Appendix A, conclude that the overall savings (in comparison to the
existing baseline system) would be (-$17,979) annually. However, when compared to the mid-efficiency
system described in section 4.2.3.2, the annual savings are approximately $8,000.
4.2.3.5 HIGH-EFFICIENCY SYSTEM WITH BUILDING UPGRADES As previously discussed, the high-efficiency system, if implemented alone, will result in additional
operating costs of approximately $12,600 annually. However, if further improvements are made to the
building, these additional operating costs can be reduced. A brief description of the predicted annual
savings is given below.
A simulation was run to observe the effect of the high-efficiency system coupled with all recommended
building upgrades, including windows, skylights and insulation improvements. Similar to the system in
section 4.2.3.4, the insulation value for the walls was increased from R-15 to R-21, and the roof was
increased from R-20 to R-30. The windows were upgraded from single pane to triple pane low-e.
Furthermore, the skylights in the gymnasium were removed and replaced with insulation with a value of
R-30. The results, as shown in Appendix A, conclude that the overall savings (in comparison to the
baseline system) would be ($-7,414) annually. However, in comparison to the system described in section
4.2.3.3, the annual savings are $5,200.

Energy Analysis and Mechanical Re-design of Little Souls Daycare
Brent Yeske - Brad Lulik - Eva Rennie
8 © June 2016
4.3 REGULATORY COMPLIANCE
4.3.1 ASHRAE STANDARD 55: THERMAL COMFORT ASHRAE Standard 55 does not provide specific guidance for the design of mechanical systems, as stated
in section 6.1 of the standard (ASHRAE, 2004). However, it is recommended that at least one of the
several methodologies provided within the standard be used to help design an effective and comfortable
environment. The method presented in section 7.6.2.1 of the standard recommends surveying the
occupants to ensure 80% (minimum) of the people feel comfortable in their environment. This type of
survey could easily be completed by the building operator, providing valuable feedback to the design
engineer. Furthermore, it would be beneficial moving forward to perform a complete analysis of the
existing temperature conditions including but not limited to: floor surface temperature, vertical
temperature difference, and radiant temperature asymmetry. Furthermore, after the proposed HVAC
system has been installed, it is recommended that a survey and full analysis be completed to ensure the
set-points and system variance remain consistent, and provide 80% satisfaction (minimum) for all
frequent occupants. The steady state of the system shall remain consistent (if possible) without cycling, as
defined in ASHRAE 55 section 7.6.2.2 (ASHRAE, 2004).
4.3.2 ASHRAE STANDARD 62: VENTILATION FOR ACCEPTABLE INDOOR QUALITY The National Building Code of Canada requires that ASHRAE Standard 62 be followed. ASHRAE
Standard 62 provides guidelines for minimum ventilation rates and other requirements of ventilation
systems. It covers new buildings, as well as additions, renovations, and change of use to existing
buildings. The standard applies to all buildings intended for human occupancy with the exception of
houses of three stories above grade or less, vehicles, and aircrafts. ASHRAE 62, similar to the national
building code, provides guidelines for minimum air intake separation distances, as well as regulations for
resistance to erosion, resistance to mold growth, and snow and rain entrainment. Additional measures
need to be taken if the outdoor air is contaminated, for smoking areas, and areas requiring additional
ventilation such as hospital operating rooms, laboratories, and industrial facilities. (ASHRAE, 2013)
All units manufactured in Canada or the United States will comply with this standard. The most
important section of the standard describes the procedures for the calculation of minimum ventilation
rates. It states that “either the ventilation rate or the IAQ procedure shall be used to design each
ventilation system in a building”. The ventilation rate procedure determines the outdoor intake rate based
on the type of space, the area of the space, and the occupancy level of the space, whereas the IAQ
procedure takes into account the contaminant sources, contaminant concentration targets, and perceived
acceptability targets. For the purposes of this project, TRACE700 was used for the calculation of the
minimum ventilation rate. (ASHRAE, 2013)
The standard also provides guidelines for construction and system start-up which would need to be used
during the construction and commissioning phases of the project. Section 8 contains regulations on
operations and maintenance of ventilation systems including information on the maintenance of the
various components of the system, including the filters, air dampers, and sensors. The standard also
provides guidelines for minimum activity and frequency of maintenance of the components. (ASHRAE,
2013)
5.0 ANALYSIS
5.1 SYSTEM ANALYSIS The building envelope is defined as the enclosure that “provides physical separation between the indoor
and outdoor environments” (ASHRAE, 2013) . Within the envelope there are numerous components,

Energy Analysis and Mechanical Re-design of Little Souls Daycare
Brent Yeske - Brad Lulik - Eva Rennie
9 © June 2016
including all mechanical, structural, electrical, plumbing, and miscellaneous equipment, which is often
referred to as the “system” for the building. Therefore, by upgrading the “system”, one is essentially
upgrading the overall condition, performance, and efficiency of such system, depending on the changes
made to the system. Together, an economical system coupled with an effective envelope create an energy
efficient building.
Some of the structural components included in a building system are insulation values for the roof, walls,
ceiling and windows, as well as the window characteristics, and the material from which the building
itself was constructed. All of these components play a significant role in the effectiveness of the overall
building efficiency in terms of retaining heat in winter months, and stopping the permission of heat into
the building during summer months. The importance of adequate insulation in a building is evident from
the basic equation for heat transfer through a body, given as H=U∙A(to-ti), where H represents the heat
transfer, U is the U-value of the given medium, A is the surface area, and t values represent inside and
outside temperatures.
Similarly, windows have different thermal resistivity values, depending on their quality, thickness, and
insulating medium. As an example, a double paned window with ½ inch of air space between panes has
an effective U-value of 0.35 ft2⋅h⋅F/BTU, whereas the same double pane window containing ½ inch of
argon space between panes has an improved U-value of 0.30 ft2⋅h⋅F/BTU, as described in the ASHRAE
Fundamentals Handbook.
Taking into account the effect of window insulating mediums and thickness, it was observed at the
daycare facility that many of the existing windows were either single or double paned, depending on the
location and age of the window. The offices along the West and East sides of the building appeared to
have newer double pane windows installed, while the remainder of the windows were primarily single
paned. Single pane windows, when compared to double pane or triple pane windows, have a significant
impact on the heat loss and heat gain of the building. For example, referring again to Table 4 in Chapter
15 of the ASHRAE Fundamentals Handbook, a single pane, ¼ inch acrylic window has an effective U-
value of 0.88 ft2⋅h⋅F/BTU, while a double pane ¼ inch air spaced window has an effective U-value of
0.55 ft2⋅h⋅F/BTU and a triple pane ¼ air spaced window has a U-value of 0.38 ft
2⋅h⋅F/BTU. As was
discussed earlier in this section, a lower U-value results in a significantly lower amount of heat transfer
through an insulating body, and therefore by reducing the U-value of the windows throughout the facility,
the heat transfer can be reduced to in turn save energy and operating costs.
Skylights, as confirmed by Chapter 15 of the ASHRAE Fundamentals Handbook, can be treated similar
to windows in terms of insulation quality and U-values. Five important aspects that are often considered
for skylights include: “(1) transmittance and absorptance of the skylight unit, (2) transmitted solar flux
that reaches the aperture of the light well, (3) whether that aperture is covered by a diffuser, (4)
transmitted solar flux that strikes the walls of the light well, and (5) reflectance of the walls of the light
well”. (ASHRAE, 2013) Skylights are especially important in terms of insulation quality, mainly due to
the fact that they are located on the roof of the facility, and since heat rises, the temperature of air on the
interior side of the skylight is often warmer than it would be near a window in the same room. As seen
from the daycare facility, the skylights were heavily frosted around the perimeter edges, and infrared
scanning revealed even more information regarding the poor insulation capability of these skylights.
Therefore, by simply removing the skylights and replacing them with an appropriate insulating medium,
or improving the skylight quality with another better insulated skylight, one could significantly reduce the
amount of heat loss during winter months and heat gain during summer months.
Energy Analysis and Mechanical Re-design of Little Souls Daycare
Brent Yeske - Brad Lulik - Eva Rennie
10 © June 2016
5.2 EQUIPMENT ALTERNATIVES ANALYSIS The client has not specified preference for mechanical equipment to be used within the Little Souls
Daycare facility, and as such the project team has tasked themselves with determining the most
appropriate system selection.
5.2.1 ROOF TOP UNITS The project team proposes that Roof-top units (RTUs) be installed for the purposes of this project. All
proposed units have electrical specifications of 208-230V/60Hz, with single phase for the 5 ton unit, and
three-phase for the 7 and 10 ton units. All proposed units incorporate electromechanical controls rather
than microprocessor controls, and due to our local climate, an economizer with barometric relief for all
units has been specified. As mentioned, the project teams continued goal is to ensure that the expenses
associated with the upgrades remains modest. In doing so, seven RTUs are to be analyzed.
The first unit to be discussed is the 5 ton 4YCC, which serves as a single packaged convertible gas and/or
electric unit. These particular units are versatile and will provide operators with simplicity of
maintenance. Although the project team is proposing that all RTUs be installed on the roof, this unit also
has the ability to be installed on ground level should the client see fit. The additional benefit of this
particular unit is the fact that the components used within are common, and therefore less expensive than
most other alternatives. The second proposed unit to be discussed is the 4YCZ, and also serves as a single
packaged convertible gas and/or electric unit. Both of the aforementioned units are designed to provide
energy efficient operation with minimal maintenance. Further information regarding product data can be
found in Appendix B.
The following five units to be discussed are similar in style, with several alternative features. The benefit
of the following units are certainly their performance standards, as well as their reasonable price points.
The 5 ton YSC060 includes DX Cooling as well as gas heat. This unit has been specified with standard
efficiency rather than high efficiency to provide a lower cost option for the facility operator.
Microchannel condenser coils have been specified as they help reduce the space requirements of
conventional coils, while providing the same cooling capacities and using less refrigerant. For the
YSC060 unit, high heat has been specified, which is largely due to the climatic considerations in Regina,
Saskatchewan. Due to our extreme temperatures, it is necessary to ensure that the units are designed for
both extreme cold and hot. The fourth unit to be discussed is the 7 ton YSC090 unit, which is very similar
to the YSC060 with exception to the cooling and heating capacities. The final YSC unit to be discussed is
the YSC120. The primary characteristics of this unit are very similar to the previous YSC’s, with
exception to the larger cooling and heating capacities. Further information regarding product data can be
found in Appendix B.
Finally, there are a variety of YHC air handling units available for use within the facility. Similar to the
YSC units, these are packaged rooftop air conditioners with both cooling and heating capabilities. To
assist with the additional static requirements, the YHC units offer a variable speed direct drive motor. The
YHC090 provides both DX Cooling and gas heat capabilities, but is rated as a high efficiency unit to
assist with providing the client with an environmentally friendly solution to their current concerns. This
particular unit has a 7 ton cooling capacity with a single compressor. Similar to the previously discussed
units, microchannel type condensing coils have been specified to further reduce space considerations
within the unit itself. Finally, a high heat capacity has been specified to help combat the extreme weather
conditions of Saskatchewan. The YHC120 holds close resemblance to the YHC090, with exception to the
fact that the 120 is capable of 10 tons of cooling capacity. Further information regarding product data can
be found in Appendix XX.
Energy Analysis and Mechanical Re-design of Little Souls Daycare
Brent Yeske - Brad Lulik - Eva Rennie
11 © June 2016
5.3 ENERGY ANALYSIS
5.3.1 TRACE 700 Simulation calculations use techniques described by the American Society of Heating, Refrigeration, and
Air-Conditioning Engineers, and a selection of the commonly used TRACE700 reports have been
provided in Appendix C. These reports serve as an example of the air-distribution capabilities of the
software. After the load-design is complete, the subsequent calculations simulate the mechanical systems
over the extension of a year. These simulations explicitly describe the climatic data, the structural
attributes of the building, the operational characteristics of the facility, the operational characteristics of
the HVAC system, and the heat generated within the facility. (TRANE, 2015)
Within the facility, there are four primary spaces: the administration area, daycare, gymnasium, and
basement. Additionally, there are several subsidiary spaces such as the infant sleep-room, and computer
room. Due to the sensitive nature of the sleep-room, and the substantial internal loading of the computer
room, there is special consideration being applied to these spaces.
The system checksum report, which can be found in Appendix C, is more commonly used for high-level
overview. For example, the airflow section of the system checksums is easily used to confirm that there is
indeed sufficient available airflow for energy recovery. The system checksum report will characterize the
various envelope loads being produced in the space, and the internal loads such as lights, occupants, and
computers. (TRANE, 2015)
The room checksum report, also found in Appendix C, focusses on the loading of individual spaces
within the system. This serves as a formidable tool when designing a system that will provide adequate
ventilation to all spaces. (TRANE, 2015)
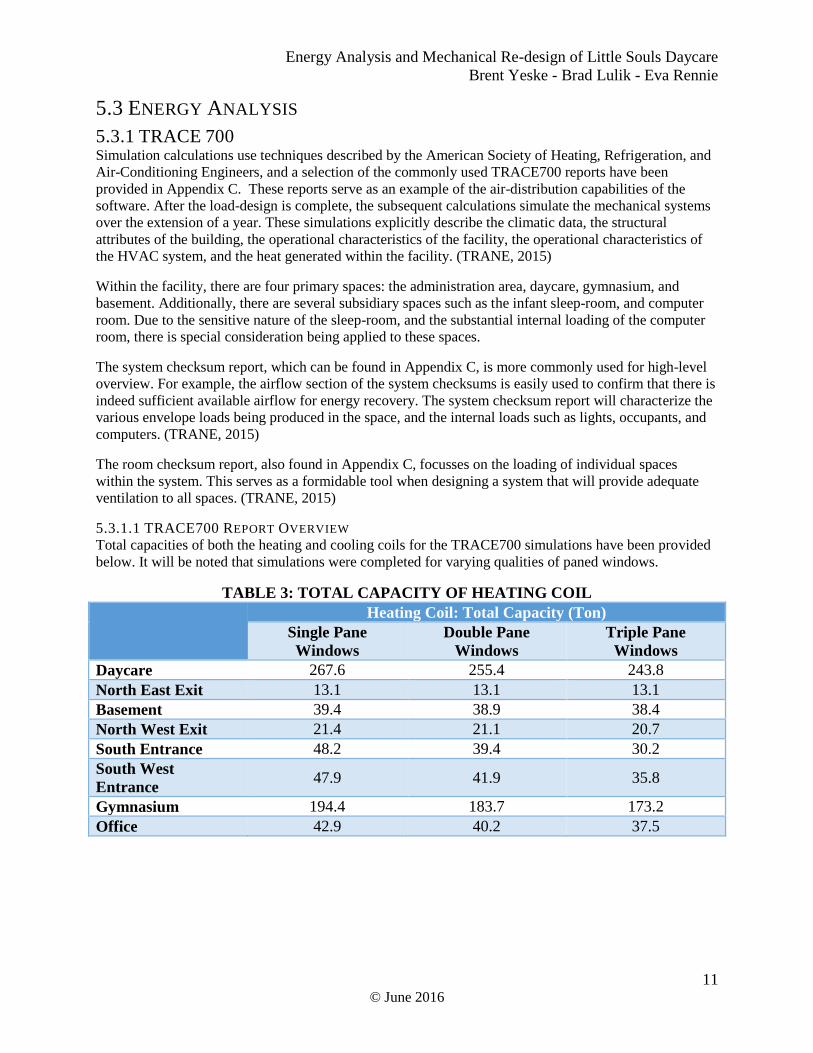
5.3.1.1 TRACE700 REPORT OVERVIEW Total capacities of both the heating and cooling coils for the TRACE700 simulations have been provided
below. It will be noted that simulations were completed for varying qualities of paned windows.
TABLE 3: TOTAL CAPACITY OF HEATING COIL
Heating Coil: Total Capacity (Ton)
Single Pane
Windows
Double Pane
Windows
Triple Pane
Windows
Daycare 267.6 255.4 243.8
North East Exit 13.1 13.1 13.1
Basement 39.4 38.9 38.4
North West Exit 21.4 21.1 20.7
South Entrance 48.2 39.4 30.2
South West
Entrance 47.9 41.9 35.8
Gymnasium 194.4 183.7 173.2
Office 42.9 40.2 37.5

Energy Analysis and Mechanical Re-design of Little Souls Daycare
Brent Yeske - Brad Lulik - Eva Rennie
12 © June 2016
TABLE 4: TOTAL CAPACITY OF COOLING COIL
Cooling Coil: Total Capacity (Ton)
Single Pane
Windows
Double Pane
Windows
Triple Pane
Windows
Daycare 11.9 11.6 10.9
North East Exit 0.3 0.3 0.3
Basement 6 6 5.9
North West Exit 0.5 0.6 0.6
South Entrance 3.4 3.1 2.5
South West
Entrance 2.8 2.6 2.2
Gymnasium 14.3 13.9 13.2
Office 2.3 2.2 2
It becomes clear that the heating and cooling capacities are affected by insulation values of windows.
When analyzing the data, it appears easy to realize the benefits of enhancing the insulation of the
windows and walls. This claim is discussed more thoroughly in the following section.
5.3.2 EQUEST As discussed in section 4.2.3, eQuest software had an important role in the project, allowing the group to
effectively measure the efficiency of the existing mechanical system and interpret this data both
numerically and graphically. It was observed from the output data that any manipulation to the existing
system had a noticeable effect on the energy consumption and overall operating costs of the facility. The
full data report, including graphs and analysis is shown in Appendix A; however, this section will provide
an overview of the analysis done using eQuest and the results inferred therein.
Using the utility bills provided by Souls Harbour for the 2015 calendar year, the actual energy
consumption and cost was imported into Excel for further comparison. These values were also used to
establish the baseline energy model in eQuest, as discussed in section 4.2.3.1. It should be noted that the
utility bills for the facility had some data that did not align well with the remainder of the bills, and was
treated as outlier data for that purpose. The eQuest model provides a relatively stable, realistic energy
consumption curve based on real-world weather data from Regina, Saskatchewan. A comparison of the
utility bills and the eQuest baseline model energy consumption is shown in the figures below. It is evident
from the graphical representation of the actual data that there are outliers within the data, and these
outliers can be assumed to be caused by either:
a) Improper meter reading of gas/power consumption
b) Credit/back-charge applied to the gas/power bills, resulting in increased/decreased billing
amounts
c) Irregular utility usage for that month, or
d) System malfunction (mechanical/electrical) resulting in higher/lower utility usage

Energy Analysis and Mechanical Re-design of Little Souls Daycare
Brent Yeske - Brad Lulik - Eva Rennie
13 © June 2016
FIGURE 5: POWER CONSUMPTION COMPARISON (ACTUAL VS EQUEST)
FIGURE 6: GAS CONSUMPTION COMPARISON (ACTUAL VS EQUEST)
For the baseline system, the summation of the total costs for power and gas consumption, as provided
from the utility bills, equates to: a) Power consumption = $4,534.45/year (2015)
b) Gas consumption = $11,798.37/year (2015)

Energy Analysis and Mechanical Re-design of Little Souls Daycare
Brent Yeske - Brad Lulik - Eva Rennie
14 © June 2016
The eQuest software, using the same baseline model, calculated annual power and gas consumption costs
of approximately: a) Power consumption = $6,773.80/year (2015)
b) Gas consumption = $7,724.40/year (2015)
It can be seen from this comparison that the eQuest software is relatively close in terms of utility costs for
both power and gas consumption. The total annual cost comparison between the actual and eQuest data is
as follows: a) Actual cost/year = $16,332.82
b) eQuest cost/year = $14,498.20
c) DIFFERENCE (cost/year) = $1,834.62
The eQuest software was manipulated extensively in order to reach a value that would accurately reflect
the actual energy consumption of the building for the baseline system. This includes, but is not limited to,
manipulating lighting power densities, plug loads, occupancy levels, infiltration, etc. As mentioned
earlier, the difference in the data stems primarily from the discrepancy in data for the actual utility bills
for certain months of the year. The eQuest model follows a relatively predictable pattern, and this can be
seen in the figures above. The power and gas consumption for the eQuest baseline system can be seen
graphically in the figures shown below as well.
FIGURE 7: POWER CONSUMPTION OF BASELINE SYSTEM (LEFT)
FIGURE 8: GAS CONSUMPTION OF BASELINE SYSTEM (RIGHT)
After the baseline system was established, further comparisons were done with respect to heating, cooling
and ventilation upgrades, and the effect each upgrade would have on the energy model. For reference, the
baseline system energy usage, in terms of quantity per year, as established in the eQuest baseline model
was: a) Power consumption = 59,770 kWh/year
b) Gas consumption = 1,071,500,000 BTU/year = 30,354.10765 m3/year
As provided on the utility bills from SaskPower and SaskEnergy, the energy multipliers were as follows: a) Power multiplier = $0.11335/kWh
b) Gas multiplier = $0.2545/m3 (includes delivery & supply costs)
These multipliers were useful in determining the annual savings or costs of implementing a different
mechanical system into the facility. Each utility will include a standard monthly fee, regardless of the
amount of energy consumed during the monthly period. These fees were held constant, and ignored
during the comparison.

Energy Analysis and Mechanical Re-design of Little Souls Daycare
Brent Yeske - Brad Lulik - Eva Rennie
15 © June 2016
The first system analyzed after the baseline system was completed was the mid-efficiency system. As
mentioned earlier, this system includes the implementation of several roof-top units on the facility, each
capable of providing cooling, ventilating and heating to the building. The mid-efficiency units assumed
air volume inputs could not be adjusted (Variable Air Volume) and the motor efficiency within the units
was 80%, as given by industry standards. The mid-efficiency system was first modeled, assuming no
other upgrades were done to the building. Energy usage of this system was as follows: a) Power consumption = 169,800 kWh/year
b) Gas consumption = 2,972,300,000 BTU/year = 84,201.13314 m3/year
Comparing these values to the above baseline system, it is evident that both the gas and power
consumption for the facility increases substantially. There are several reasons for the increase in
consumption. First of all, the mid-efficiency system introduces two components that did not exist in the
baseline system: ventilation and cooling. Therefore, since neither of these components were available
with the baseline system, it is expected that power consumption will increase as a result. Cooling requires
substantial energy during summer months to provide a comfortable interior temperature, and ventilation
requires energy consumption year-round in order to provide adequate air changes to the facility. It should
be noted that although ventilation alone will not provide heating/cooling for the facility, it still requires
that external air being drawn into the roof-top unit be pre-heated or pre-cooled before entering the system
in order to refrain from disturbing the room temperature established by the heating or cooling system.
Thus, ventilation alone requires an increased amount of energy usage, which can be illustrated by the
graph shown in the figure below.
FIGURE 9: POWER CONSUMPTION OF MID-EFFICIENCY SYSTEM
Furthermore, the increase in gas consumption can best be explained by the difference between the roof-
top units versus the boiler system that currently exists in the building. The boiler system was implemented
in the building seven years ago, and includes three higher efficiency boilers that pump hot water through
baseboard heaters throughout the facility. Boiler systems are traditionally cheaper to run than forced air
systems, mainly because they require less energy to start/stop frequently. Also, the boiler system is

Energy Analysis and Mechanical Re-design of Little Souls Daycare
Brent Yeske - Brad Lulik - Eva Rennie
16 © June 2016
typically located inside the facility, resulting in less heat loss to the surrounding environment in
comparison to roof-top units, which must heat outside air (potentially at -40 degrees Celsius) to room
temperature. Boiler system piping is typically insulated to prevent heat loss during transportation through
the piping system. Forced air furnaces require ductwork, which can result in heat losses to the plenum
area before exiting into the appropriate zone. All of these factors result in efficiency differences between
boiler heaters and forced air furnaces. The increase in gas requirements for the mid-efficiency roof-top
units is illustrated in the figure below:
FIGURE 10: GAS CONSUMPTION OF MID-EFFICIENCY SYSTEM
The second system analyzed using eQuest was the high-efficiency system. As mentioned earlier, this
system is similar in characteristic to the mid-efficiency system, but includes higher efficiency heating,
cooling and ventilation components, coupled with improved motor efficiency and variable air volume
capabilities. The energy usage of this system was modeled, and the energy consumption was analyzed to
determine any cost differentiation from the other two systems. The energy consumption for the high-
efficiency system was as follows: a) Power consumption = 99,650 kWh/year
b) Gas consumption = 2,196,500,000 BTU/year = 62,223.79603 m3/year
As can be seen, these energy consumption values are significantly lower than was described for the mid-
efficiency system. This is expected, since the general layout of the mechanical ductwork, as well as the
number of roof-top units for the high-efficiency system remains the same as the mid-efficiency system.
However, it is still evident that the high-efficiency system, even though it accommodates improved
efficiencies and industry-leading mechanical components, still uses more energy in comparison to the
baseline system. Again, this can be explained by the fact that the baseline system does not incorporate
ventilation or cooling capability, whereas the premium system provides this option. The additional utility
usage can be seen in the two figures below, both in terms of power and gas consumption:

Energy Analysis and Mechanical Re-design of Little Souls Daycare
Brent Yeske - Brad Lulik - Eva Rennie
17 © June 2016
FIGURE 11: POWER CONSUMPTION OF HIGH-EFFICIENCY SYSTEM (LEFT)
FIGURE 12: GAS CONSUMPTION OF HIGH-EFFICIENCY SYSTEM (RIGHT)
The figures help illustrate the primary consumers of power and gas within the facility, and help draw
conclusions regarding the additional operating costs that must be incurred if the building operator chooses
to implement the high-efficiency system.
As mentioned in section 4.2.3, energy models were created for the baseline, mid-, and high-efficiency
systems. Windows, insulation and skylights were manipulated. Building upgrades, whether completed
individually or together, affected the performance of the building envelope. By upgrading the mechanical
system and improving the building envelope, a more comfortable and healthier environment can be
created for occupants.
5.3.3 BUILDING ENERGY QUOTIENT As was discussed in the previous section, the utility expenses associated with Little Souls Daycare are
significant, but can be mitigated to ensure that the majority of their resources remain directed towards
programming. ASHRAE`s BEQ as-designed worksheet has been used to assist with characterizing the
energy uses of the building, and determining how the facility is designed to perform, how it actually
performs, and the best methods that can be employed to improve future performance.
The BEQ program focuses on the energy efficiencies of the facility without compromising the indoor
environment quality. In essence, the program is built to provide information for improving energy
performance. The table below has been provided to summarize the various mechanical systems discussed
above and their respective BuildingEQ Rating.
TABLE 5: BUILDINGEQ RATINGS
BuildingEQ Rating
No Facility Upgrades
BuildingEQ Rating
With Facility Upgrades
Baseline System A- (Very Good) A- (Very Good)
Mid-Efficiency System C (Average) B (Efficient)
High-Efficiency System C (Average) B (Efficient)
As described in section 5.3.2, the Baseline system does not employ any form of ventilation or cooling.
The Baseline System BEQ rating should only be used as a reference point due to the fact that it is not
compliant with ASHRAE ventilation standards. As mentioned above, the BEQ labeling program focuses

Energy Analysis and Mechanical Re-design of Little Souls Daycare
Brent Yeske - Brad Lulik - Eva Rennie
18 © June 2016
solely on the energy performance of the facility and not the regulatory compliances, and with this in mind
the above results confirm that enhancing the facility envelope will reflect positively on the energy
efficiency of the space.
6.0 SYSTEM IMPROVEMENTS Through the project team's analysis and energy audit of Little Souls Daycare, various recommendations
have been made in order to improve the efficiencies of the space and the regulatory compliances of the
facility. These recommendations serve as the initial stage for major renovations.
6.1 MECHANICAL SYSTEM SELECTION The project team has concluded that the aforementioned Roof Top Units (RTUs) are the most practical
design solution for Little Souls Daycare facility. There were various units described in section 5.2.1 of the
report. Additionally, a thorough cost analysis of the proposed system has been included to better capture
the size of the re-design project and in order to evaluate the feasibility of the various system options. The
cost analysis has also been included in the proceeding section.
6.1.1 SIZING AND PLACEMENT OF EQUIPMENT In order to effectively size the air-handling units to be used within the facility, the TRACE700 load
outputs have been used. Table 6 below outlines the cooling and heating capacities for the facility.
TABLE 6: COOLING AND HEATING CAPACITIES
Cooling Coil (ton) Heating Coil (MBh)
Office 2.3 42.9
Daycare/Infant 11.9 267.6
Basement/Computer 6 39.4
Gymnasium 14.3 194.4
Units that meet, and more-often exceed, the above capacities have been specified for this project. This is
to assist in ensuring that appropriate safety-factors and ventilation loading is encapsulated within this
project. The project team spoke with a local structural engineering firm to discuss implications of
installing roof top units on Little Souls Daycare. The first consideration discussed with the engineer was
to ensure that snow drifts are accounted for in the placement of this unit. ASHRAE standards should be
further analyzed prior to installation, but a 15 foot range from vertical walls should be an appropriate
factor. The weight from snow drifts can be substantial in Saskatchewan, and as such, must be a
consideration. In addition to the weight from snow, it is essential to ensure that the rooftop is able to
support the physical weight of the unit over an extended period of time. In the case that there are concerns
with the weight of the units on the roof-top, steel beams or steel plates can be bolted to the wood joist to
assist in supporting the unit, and distributed the load evenly throughout. In doing this, the curb that the
roof top unit will be positioned on must be supported around the entirety of the perimeter. (Gallagher,
2016)
When selecting units for use within Little Souls Daycare, it was recommended by the structural engineer
that the project team select smaller units, rather than one larger units (where possible). This is often more
economical in terms of structural considerations, as the weight loads can be distributed over a larger area.
If a larger unit is to be used, there would need to be a thorough analysis of the foundational support to
ensure that the facility is able to have a significant point load without any catastrophic impacts. In
addition to spacing out the units on the rooftop, the project team should also locate the units over the

Energy Analysis and Mechanical Re-design of Little Souls Daycare
Brent Yeske - Brad Lulik - Eva Rennie
19 © June 2016
beams and columns rather than joists. This will lead to a more economical solution. (Gallagher, 2016)
Consultation should be carried out with a structural engineer prior to installation of any units.
6.1.2 COST ANALYSIS Quotes were obtained for the equipment required for the ventilation system and for the building upgrades.
Estimates of labour costs were made for the installation of the ductwork and for the covering of the
skylights. Note that costs associated with structural reinforcements of the roof were not included in this
analysis A summary of the costs for the mid-efficient and high-efficiency system, as well as each of these
two systems with the building upgrades are shown in Table 7 below. The annual operating cost of each
system is also shown using data estimated by eQuest.
TABLE 7: BREAKDOWN OF COSTS FOR EACH ALTERNATIVE
Mid-Efficiency
System
High-Efficiency
System
Mid-Efficiency
w/ Upgrades
High-Efficiency
w/ Upgrades
Crane $18,900.00 $18,900.00 $18,900.00 $18,900.00
Electrical $35,000.00 $35,000.00 $35,000.00 $35,000.00
Gas lines $10,000.00 $10,000.00 $10,000.00 $10,000.00
Ductwork $7,000.00 $7,000.00 $7,000.00 $7,000.00
Labour for
Ductwork $21,000.00 $21,000.00 $21,000.00 $21,000.00
Supply
Diffusers $20,740.00 $20,740.00 $20,740.00 $20,740.00
Return Grilles $3,900.00 $3,900.00 $3,900.00 $3,900.00
Fire Dampers $600.00 $600.00 $600.00 $600.00
5 Ton RTUs -
Mid $55,575.00 - $55,575.00 -
5 Ton RTUs -
High - $77,220.00 - $77,220.00
10 Ton RTUs -
Mid $46,085.00 - $46,085.00 -
10 Ton RTUs -
High - $58,300.00 - $58,300.00
Window
Upgrades - - $34,400.00 $34,400.00
Insulation
Upgrades - - $15,900.00 $15,900.00
Skylight
Covering - - $500.00 $500.00
Total Cost $218,800.00 $252,660.00 $269,600.00 $303,460.00
Annual
Operating
Costs
$40,676.00 $27,131.00 $32,479.00 $21,915.00
Present Value
(i=5%, n=20) $725,712.00 $590,776.00 $674,358.00 $576,563.00
Energy Analysis and Mechanical Re-design of Little Souls Daycare
Brent Yeske - Brad Lulik - Eva Rennie
20 © June 2016
Since a ventilation system is required for the building to meet the National Building Code, operating costs
will increase whether the mid-efficiency or the high-efficiency system is implemented. The minimum
required investment by Souls Harbour is therefore $218,800 which corresponds to the Mid-Efficiency
ventilation system without the recommended building upgrades. Souls Harbour can however save on
annual operating costs if one of the other three systems is implemented instead. From these savings, the
payback period of the required additional investment can be calculated using the following formula:
𝑃𝑎𝑦𝑏𝑎𝑐𝑘 𝑃𝑒𝑟𝑖𝑜𝑑 =𝐶𝑎𝑝𝑖𝑡𝑎𝑙 𝐶𝑜𝑠𝑡
𝐴𝑛𝑛𝑢𝑎𝑙 𝑆𝑎𝑣𝑖𝑛𝑔𝑠 [2]
The net present value of the additional investment and the corresponding savings was also calculated
using a discount rate (i) of 5% and an analysis period (n) of 20 years using the following formula:
𝑁𝑃𝑉 = −𝐴𝑑𝑑𝑖𝑡𝑖𝑜𝑛𝑎𝑙 𝐼𝑛𝑣𝑒𝑠𝑡𝑚𝑒𝑛𝑡 + (𝐴𝑛𝑛𝑢𝑎𝑙 𝑆𝑎𝑣𝑖𝑛𝑔𝑠) × ((1+𝑖)𝑛−1
𝑖(1+𝑖)𝑛 ) [3]
The additional investment, the annual savings, the payback period, and the net present value over 20 years
are shown in Table 8 below for each of the incremental options as compared to the base option of the
mid-efficiency system without upgrades.
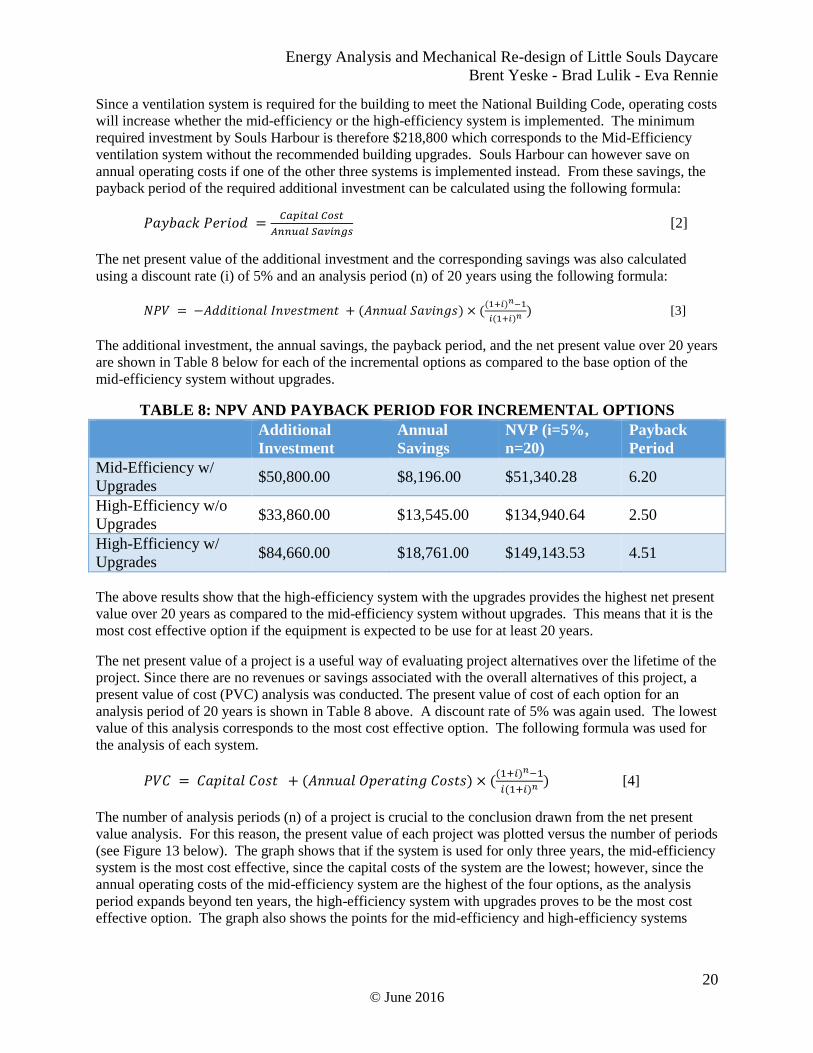
TABLE 8: NPV AND PAYBACK PERIOD FOR INCREMENTAL OPTIONS
Additional
Investment
Annual
Savings
NVP (i=5%,
n=20)
Payback
Period
Mid-Efficiency w/
Upgrades $50,800.00 $8,196.00 $51,340.28 6.20
High-Efficiency w/o
Upgrades $33,860.00 $13,545.00 $134,940.64 2.50
High-Efficiency w/
Upgrades $84,660.00 $18,761.00 $149,143.53 4.51
The above results show that the high-efficiency system with the upgrades provides the highest net present
value over 20 years as compared to the mid-efficiency system without upgrades. This means that it is the
most cost effective option if the equipment is expected to be use for at least 20 years.
The net present value of a project is a useful way of evaluating project alternatives over the lifetime of the
project. Since there are no revenues or savings associated with the overall alternatives of this project, a
present value of cost (PVC) analysis was conducted. The present value of cost of each option for an
analysis period of 20 years is shown in Table 8 above. A discount rate of 5% was again used. The lowest
value of this analysis corresponds to the most cost effective option. The following formula was used for
the analysis of each system.
𝑃𝑉𝐶 = 𝐶𝑎𝑝𝑖𝑡𝑎𝑙 𝐶𝑜𝑠𝑡 + (𝐴𝑛𝑛𝑢𝑎𝑙 𝑂𝑝𝑒𝑟𝑎𝑡𝑖𝑛𝑔 𝐶𝑜𝑠𝑡𝑠) × ((1+𝑖)𝑛−1
𝑖(1+𝑖)𝑛 ) [4]
The number of analysis periods (n) of a project is crucial to the conclusion drawn from the net present
value analysis. For this reason, the present value of each project was plotted versus the number of periods
(see Figure 13 below). The graph shows that if the system is used for only three years, the mid-efficiency
system is the most cost effective, since the capital costs of the system are the lowest; however, since the
annual operating costs of the mid-efficiency system are the highest of the four options, as the analysis
period expands beyond ten years, the high-efficiency system with upgrades proves to be the most cost
effective option. The graph also shows the points for the mid-efficiency and high-efficiency systems
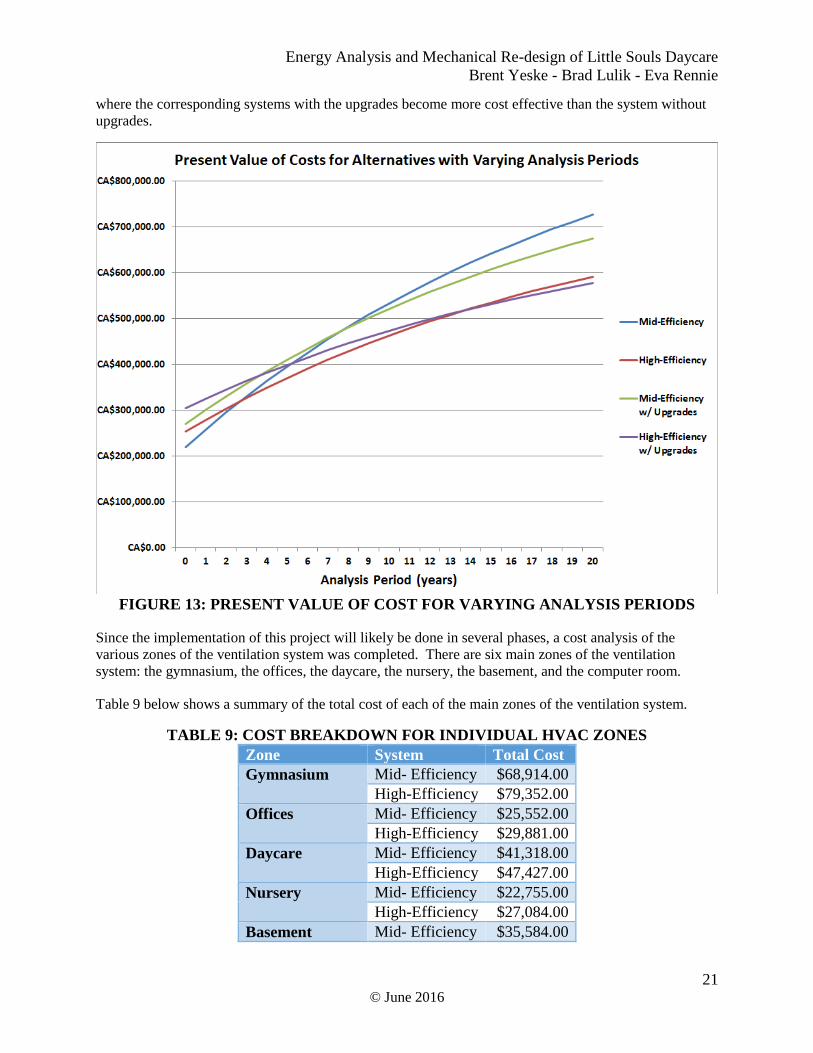
Energy Analysis and Mechanical Re-design of Little Souls Daycare
Brent Yeske - Brad Lulik - Eva Rennie
21 © June 2016
where the corresponding systems with the upgrades become more cost effective than the system without
upgrades.
FIGURE 13: PRESENT VALUE OF COST FOR VARYING ANALYSIS PERIODS
Since the implementation of this project will likely be done in several phases, a cost analysis of the
various zones of the ventilation system was completed. There are six main zones of the ventilation
system: the gymnasium, the offices, the daycare, the nursery, the basement, and the computer room.
Table 9 below shows a summary of the total cost of each of the main zones of the ventilation system.
TABLE 9: COST BREAKDOWN FOR INDIVIDUAL HVAC ZONES
Zone System Total Cost
Gymnasium Mid- Efficiency $68,914.00
High-Efficiency $79,352.00
Offices Mid- Efficiency $25,552.00
High-Efficiency $29,881.00
Daycare Mid- Efficiency $41,318.00
High-Efficiency $47,427.00
Nursery Mid- Efficiency $22,755.00
High-Efficiency $27,084.00
Basement Mid- Efficiency $35,584.00

Energy Analysis and Mechanical Re-design of Little Souls Daycare
Brent Yeske - Brad Lulik - Eva Rennie
22 © June 2016
High-Efficiency $39,913.00
Computer Room Mid- Efficiency $26,340.00
High-Efficiency $30,669.00
7.0 IMPLEMENTATION PLAN A phased implementation approach is recommended, and is outlined for the client in the sections below.
7.1 LIST OF ALTERNATIVES The complete list of alternatives for the client is given in the Appendix E.
7.2 PRIORITY LIST To provide the client with further flexibility in terms of implementation, the project team also developed a
priority list which provides further recommendations related to a “phased” implementation plan. The
client requested that a phased approach be taken, mostly due to the fact that Souls Harbour has limited
available funds, and the implementation of the entire HVAC system with (or without) upgrades is beyond
feasible. Therefore, the below priority list was created, which provides insight into the cost and benefits
of a phased approach, allowing the client to pick-and-choose which HVAC systems are implemented first,
and any other associated upgrades.
TABLE 10: PRIORITY LIST FOR PROJECT IMPLEMENTATION
Priority Timeline Justification
Total
(Approx.)
Cost
1) Daycare HVAC System
(High Efficiency) Immediately
Biggest concern for client;
provides stable
temperature for children
during summer months
$47,427.00
2) Skylights & Insulation
Throughout Entire
Facility; Remove
Stained-Glass Front
Window
1-2 years after
implementation of
Daycare HVAC
system
Costs are relatively low;
payback period is <10
years; helps improve entire
facility without installing
new HVAC system for
every zone; less cost if
installed all at once
$16,400.00 +
cost to board up
& insulate
stained-glass
front window
3) Administrative Offices
HVAC (High Efficiency) < 5 years
High occupancy area;
ducting already in place
for HVAC unit $29,881.00
4) Gymnasium Area
HVAC System (High
Efficiency)
5-10 years
Next highest occupancy
area; high cost (due to
capacity) but relatively
large area
$79,352.28
5) Windows Throughout
Facility < 10 years
Costs are relatively low;
helps improve
performance of entire
facility; current window
performance is hard to
simulate, but infrared
$34,400.00

Energy Analysis and Mechanical Re-design of Little Souls Daycare
Brent Yeske - Brad Lulik - Eva Rennie
23 © June 2016
revealed high heat loss
TOTAL INVESTMENT OVER 10 YEARS
$207,460.28
Caution should be taken when implementing each zone in a phased approached. Pressurization of
adjacent rooms can cause issues, and can be mitigated by installing appropriate controls such as door
grating. Efficiencies will also be reduced if adjacent zones are unconditioned; however, this is something
the client has been made aware of.
8.0 RECOMMENDATIONS After analyzing the supporting data, and reviewing the costs and payback periods, the project group was
able to provide the client with a short list of recommendations moving forward. It is recommended that
the client follow as closely as feasible the priority list from section 7.2 related to the phased
implementation of HVAC improvements and structural upgrades. Furthermore, the full list of
administrative and engineering controls should be closely reviewed and implemented as deemed
necessary by the facility operator. Administrative controls can easily be implemented through
instructional training of employees and general employee awareness. Engineering controls such as
occupancy light sensors should be compared cost-wise to the proposed annual savings, and installed if
deemed feasible.
Further recommendations include consultation with a structural engineer prior to purchasing and
installing roof-top units to be used at the facility. As mentioned previously, a structural engineer was
briefly consulted by the project group, and general direction was provided regarding the installation of the
roof-top units; however, a full structural analysis should be completed to further support the
recommendations provided in this report. Moreover, the project team, though under the direction of a
Professional Engineer throughout the entirety of the project, does not maintain the capacity to make any
formal recommendations to the client without a full review and signing off of the herein technical report.
9.0 CONCLUSION Throughout the duration of the energy audit and mechanical system redesign, the project team was able to
outline several recommendations for improving the energy performance of Little Souls Daycare. These
recommendations were fashioned on the basis of both energy utilization and economic evaluation, and
will assist Souls Harbour Rescue Mission with mitigating any concerns pertaining to regulatory
compliance. It remained a focus for the project team to establish an implementation plan that allows for a
phased installation with returns on investment throughout the duration of the proposed plan. This plan
will assist Little Souls Daycare with further providing a caring, warm, and safe environment for each
child to play, explore, and learn.

Energy Analysis and Mechanical Re-design of Little Souls Daycare
Brent Yeske - Brad Lulik - Eva Rennie
24 © June 2016
REFERENCES
ASHRAE Engineers, Inc. Thermal Environmental Conditions for Human Occupancy. Atlanta, GA:
American Society of Heating, Refrigerating and Air-Conditioning Engineers, 2004. Print.
ASHRAE Research, comp. Ashrae Handbook: Fundamentals. I-P ed. Atlanta, GA: Ashrae, 2013. Print.
Edgar, Dylan. Personal Communication: Roof Top Unit information. January, 2016.
EIA. Analysis and Representation of Miscellaneous Electric Loads in NEMS. Washington: U.S.
Department of Energy, Dec. 2013. PDF.
EQUEST. CD-ROM Windows. Computer software. EQUEST. Vers. 3.65. DOE2.com, 24 Mar. 2014.
Web. 10 Dec. 2015.
Gallagher, Eleah. Personal Communication: Structural Considerations. January, 2016.
Griffith. "Griffith University." Griffith University. Web. 12 Apr. 2016.
Harris, Norman C. Modern Air Conditioning Practice. 3rd Ed. McGraw-Hill Inc. 1983.
Hirsch, Jeff. "EQUEST: The Quick Energy Simulation Tool." EQUEST. DOE2. Web. 12 Apr. 2016.
Larson, Jared. Personal Communication: General MacPherson Engineering information. August, 2015.
Larson, Jared. Personal Communication: Insulation terminology. December, 2015.
Miller, Joe. "Little Souls Daycare." Souls Harbour Rescue Mission. Web. 07 Jan. 2016.
<https://www.shrmsk.com/>.
NBC. National Building Code of Canada, 2010. Ottawa, Ont.: National Research Council Canada,
Institute for Research in Construction, 2010. Print.
Towers, Michael. Personal Communication: General facility information and concerns. August, 2015.
TRANE. TRACE700: Building Energy and Economic Analysis. Davidson, NC, 2015. PDF.
U.S. Department of Energy. "Fans for Cooling." Fans for Cooling. Web. 12 Mar. 2016. <http://energy.gov/energysaver/fans-cooling>.
Webster. The New Merriam-Webster Dictionary. Springfield, MA: Merriam-Webster, 1989. Print.

APPENDIX A – EQUEST
DATA

Existing System

Project/Run: Little Souls Daycare NO VENT-COOLING - Whole Build EEM Run Date/Time: 04/03/16 @ 16:01
eQUEST 3.65.7163 Monthly Energy Consumption by Enduse Page 1
0123456
Jan Feb Mar Apr May Jun Jul Aug Sep Oct Nov Dec
Electric Consumption (kWh) (x000)
0
50
100
150
200
Jan Feb Mar Apr May Jun Jul Aug Sep Oct Nov Dec
Gas Consumption (Btu) (x000,000)
Area LightingTask LightingMisc. EquipmentExterior UsagePumps & Aux.Ventilation Fans
Water HeatingHt Pump Supp.Space HeatingRefrigerationHeat RejectionSpace Cooling
Electric Consumption (kWh x000)Jan Feb Mar Apr May Jun Jul Aug Sep Oct Nov Dec Total
Space Cool - - - - - - - - - - - - - Heat Reject. - - - - - - - - - - - - - Refrigeration - - - - - - - - - - - - - Space Heat - - - - - - - - - - - - - HP Supp. - - - - - - - - - - - - - Hot Water - - - - - - - - - - - - - Vent. Fans - - - - - - - - - - - - - Pumps & Aux. 0.31 0.28 0.31 0.30 0.31 0.30 0.31 0.31 0.30 0.31 0.30 0.31 3.66 Ext. Usage - - - - - - - - - - - - - Misc. Equip. 2.45 2.36 2.77 2.66 2.53 2.66 2.61 2.69 2.58 2.53 2.50 2.61 30.95 Task Lights 0.22 0.22 0.27 0.25 0.23 0.25 0.24 0.25 0.24 0.23 0.23 0.24 2.88 Area Lights 1.71 1.69 2.04 1.95 1.79 1.95 1.87 1.96 1.87 1.79 1.79 1.87 22.28 Total 4.69 4.55 5.38 5.16 4.86 5.16 5.04 5.21 4.99 4.86 4.82 5.04 59.77
Gas Consumption (Btu x000,000)Jan Feb Mar Apr May Jun Jul Aug Sep Oct Nov Dec Total
Space Cool - - - - - - - - - - - - - Heat Reject. - - - - - - - - - - - - - Refrigeration - - - - - - - - - - - - - Space Heat 160.1 143.8 143.9 94.7 36.0 8.1 0.6 2.6 32.0 82.1 136.4 156.7 996.8 HP Supp. - - - - - - - - - - - - - Hot Water 6.5 6.7 8.0 7.5 6.3 6.3 5.5 5.4 5.2 5.2 5.7 6.5 74.7 Vent. Fans - - - - - - - - - - - - - Pumps & Aux. - - - - - - - - - - - - - Ext. Usage - - - - - - - - - - - - - Misc. Equip. - - - - - - - - - - - - - Task Lights - - - - - - - - - - - - - Area Lights - - - - - - - - - - - - - Total 166.6 150.4 151.9 102.1 42.3 14.3 6.1 8.0 37.2 87.3 142.0 163.2 1,071.5
Existing System with Upgrades

Project/Run: Little Souls Daycare BASEBOARD ALL UPGRADES - Whole Build EEM Run Date/Time: 04/03/16 @ 16:11
eQUEST 3.65.7163 Monthly Energy Consumption by Enduse Page 1
0123456
Jan Feb Mar Apr May Jun Jul Aug Sep Oct Nov Dec
Electric Consumption (kWh) (x000)
0
50
100
150
200
Jan Feb Mar Apr May Jun Jul Aug Sep Oct Nov Dec
Gas Consumption (Btu) (x000,000)
Area LightingTask LightingMisc. EquipmentExterior UsagePumps & Aux.Ventilation Fans
Water HeatingHt Pump Supp.Space HeatingRefrigerationHeat RejectionSpace Cooling
Electric Consumption (kWh x000)Jan Feb Mar Apr May Jun Jul Aug Sep Oct Nov Dec Total
Space Cool - - - - - - - - - - - - - Heat Reject. - - - - - - - - - - - - - Refrigeration - - - - - - - - - - - - - Space Heat - - - - - - - - - - - - - HP Supp. - - - - - - - - - - - - - Hot Water - - - - - - - - - - - - - Vent. Fans - - - - - - - - - - - - - Pumps & Aux. 0.25 0.22 0.25 0.24 0.25 0.24 0.25 0.25 0.24 0.25 0.24 0.25 2.90 Ext. Usage - - - - - - - - - - - - - Misc. Equip. 2.45 2.36 2.77 2.66 2.53 2.66 2.61 2.69 2.58 2.53 2.50 2.61 30.95 Task Lights 0.22 0.22 0.27 0.25 0.23 0.25 0.24 0.25 0.24 0.23 0.23 0.24 2.88 Area Lights 1.68 1.67 2.01 1.92 1.76 1.92 1.85 1.93 1.84 1.76 1.76 1.85 21.96 Total 4.60 4.47 5.29 5.07 4.77 5.07 4.94 5.12 4.90 4.77 4.73 4.94 58.69
Gas Consumption (Btu x000,000)Jan Feb Mar Apr May Jun Jul Aug Sep Oct Nov Dec Total
Space Cool - - - - - - - - - - - - - Heat Reject. - - - - - - - - - - - - - Refrigeration - - - - - - - - - - - - - Space Heat 143.98 121.12 106.46 55.72 16.05 1.21 - 0.04 12.13 44.80 96.46 125.67 723.63 HP Supp. - - - - - - - - - - - - - Hot Water 6.40 6.59 7.95 7.44 6.26 6.23 5.45 5.39 5.16 5.21 5.66 6.49 74.24 Vent. Fans - - - - - - - - - - - - - Pumps & Aux. - - - - - - - - - - - - - Ext. Usage - - - - - - - - - - - - - Misc. Equip. - - - - - - - - - - - - - Task Lights - - - - - - - - - - - - - Area Lights - - - - - - - - - - - - - Total 150.38 127.72 114.42 63.16 22.31 7.43 5.45 5.43 17.29 50.01 102.12 132.16 797.88

Mid-Efficiency System
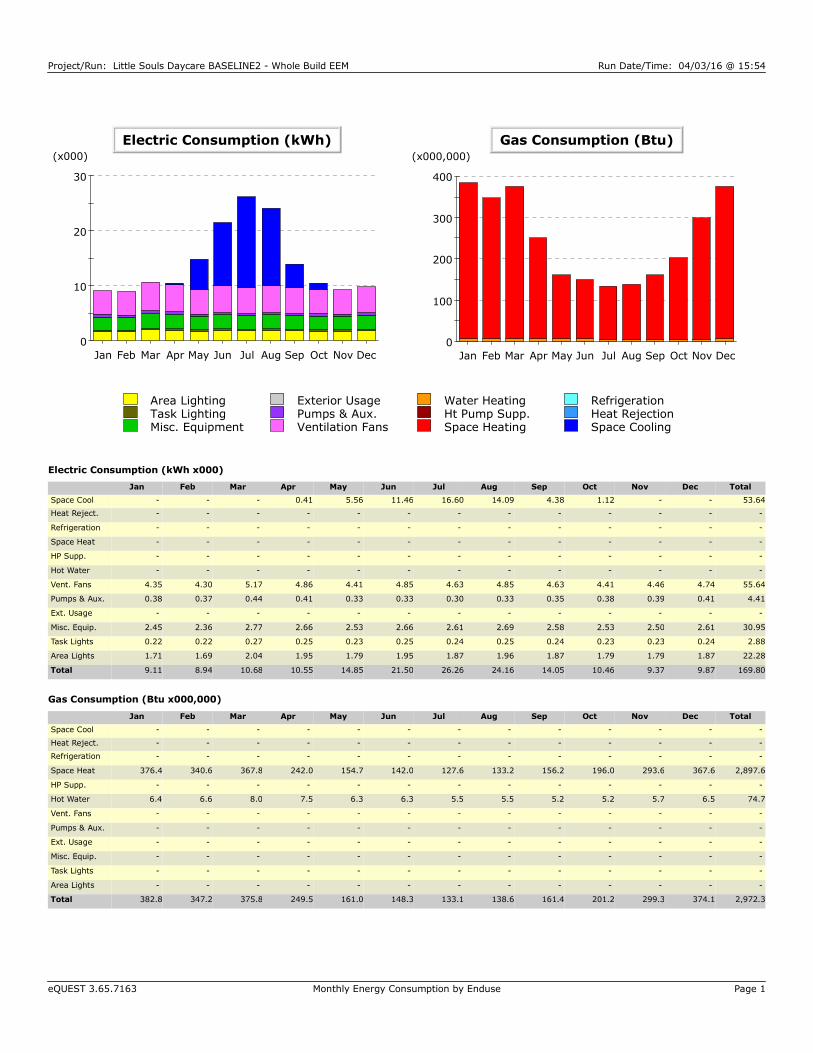
Project/Run: Little Souls Daycare BASELINE2 - Whole Build EEM Run Date/Time: 04/03/16 @ 15:54
eQUEST 3.65.7163 Monthly Energy Consumption by Enduse Page 1
0
10
20
30
Jan Feb Mar Apr May Jun Jul Aug Sep Oct Nov Dec
Electric Consumption (kWh) (x000)
0
100
200
300
400
Jan Feb Mar Apr May Jun Jul Aug Sep Oct Nov Dec
Gas Consumption (Btu) (x000,000)
Area LightingTask LightingMisc. EquipmentExterior UsagePumps & Aux.Ventilation Fans
Water HeatingHt Pump Supp.Space HeatingRefrigerationHeat RejectionSpace Cooling
Electric Consumption (kWh x000)Jan Feb Mar Apr May Jun Jul Aug Sep Oct Nov Dec Total
Space Cool - - - 0.41 5.56 11.46 16.60 14.09 4.38 1.12 - - 53.64 Heat Reject. - - - - - - - - - - - - - Refrigeration - - - - - - - - - - - - - Space Heat - - - - - - - - - - - - - HP Supp. - - - - - - - - - - - - - Hot Water - - - - - - - - - - - - - Vent. Fans 4.35 4.30 5.17 4.86 4.41 4.85 4.63 4.85 4.63 4.41 4.46 4.74 55.64 Pumps & Aux. 0.38 0.37 0.44 0.41 0.33 0.33 0.30 0.33 0.35 0.38 0.39 0.41 4.41 Ext. Usage - - - - - - - - - - - - - Misc. Equip. 2.45 2.36 2.77 2.66 2.53 2.66 2.61 2.69 2.58 2.53 2.50 2.61 30.95 Task Lights 0.22 0.22 0.27 0.25 0.23 0.25 0.24 0.25 0.24 0.23 0.23 0.24 2.88 Area Lights 1.71 1.69 2.04 1.95 1.79 1.95 1.87 1.96 1.87 1.79 1.79 1.87 22.28 Total 9.11 8.94 10.68 10.55 14.85 21.50 26.26 24.16 14.05 10.46 9.37 9.87 169.80
Gas Consumption (Btu x000,000)Jan Feb Mar Apr May Jun Jul Aug Sep Oct Nov Dec Total
Space Cool - - - - - - - - - - - - - Heat Reject. - - - - - - - - - - - - - Refrigeration - - - - - - - - - - - - - Space Heat 376.4 340.6 367.8 242.0 154.7 142.0 127.6 133.2 156.2 196.0 293.6 367.6 2,897.6 HP Supp. - - - - - - - - - - - - - Hot Water 6.4 6.6 8.0 7.5 6.3 6.3 5.5 5.5 5.2 5.2 5.7 6.5 74.7 Vent. Fans - - - - - - - - - - - - - Pumps & Aux. - - - - - - - - - - - - - Ext. Usage - - - - - - - - - - - - - Misc. Equip. - - - - - - - - - - - - - Task Lights - - - - - - - - - - - - - Area Lights - - - - - - - - - - - - - Total 382.8 347.2 375.8 249.5 161.0 148.3 133.1 138.6 161.4 201.2 299.3 374.1 2,972.3

Mid-Efficiency System with Upgrades

Project/Run: Little Souls Daycare MID ALL UPGRADES - Whole Build EEM Run Date/Time: 04/03/16 @ 15:38
eQUEST 3.65.7163 Monthly Energy Consumption by Enduse Page 1
0
5
1015
20
25
Jan Feb Mar Apr May Jun Jul Aug Sep Oct Nov Dec
Electric Consumption (kWh) (x000)
0
100
200
300
400
Jan Feb Mar Apr May Jun Jul Aug Sep Oct Nov Dec
Gas Consumption (Btu) (x000,000)
Area LightingTask LightingMisc. EquipmentExterior UsagePumps & Aux.Ventilation Fans
Water HeatingHt Pump Supp.Space HeatingRefrigerationHeat RejectionSpace Cooling
Electric Consumption (kWh x000)Jan Feb Mar Apr May Jun Jul Aug Sep Oct Nov Dec Total
Space Cool - - - 0.30 4.18 8.82 12.91 10.85 3.31 0.83 - - 41.17 Heat Reject. - - - - - - - - - - - - - Refrigeration - - - - - - - - - - - - - Space Heat - - - - - - - - - - - - - HP Supp. - - - - - - - - - - - - - Hot Water - - - - - - - - - - - - - Vent. Fans 3.24 3.19 3.83 3.58 3.24 3.56 3.40 3.56 3.40 3.25 3.30 3.52 41.08 Pumps & Aux. 0.31 0.30 0.35 0.32 0.25 0.24 0.22 0.24 0.27 0.30 0.31 0.33 3.44 Ext. Usage - - - - - - - - - - - - - Misc. Equip. 2.45 2.36 2.77 2.66 2.53 2.66 2.61 2.69 2.58 2.53 2.50 2.61 30.95 Task Lights 0.22 0.22 0.27 0.25 0.23 0.25 0.24 0.25 0.24 0.23 0.23 0.24 2.88 Area Lights 1.71 1.69 2.04 1.95 1.79 1.95 1.87 1.96 1.87 1.79 1.79 1.87 22.28 Total 7.92 7.76 9.25 9.06 12.22 17.48 21.26 19.55 11.67 8.92 8.13 8.57 141.81
Gas Consumption (Btu x000,000)Jan Feb Mar Apr May Jun Jul Aug Sep Oct Nov Dec Total
Space Cool - - - - - - - - - - - - - Heat Reject. - - - - - - - - - - - - - Refrigeration - - - - - - - - - - - - - Space Heat 305.6 274.7 292.3 180.1 104.1 91.5 82.4 86.9 110.1 145.7 231.5 296.0 2,200.8 HP Supp. - - - - - - - - - - - - - Hot Water 6.4 6.6 8.0 7.4 6.3 6.3 5.5 5.4 5.2 5.2 5.7 6.5 74.6 Vent. Fans - - - - - - - - - - - - - Pumps & Aux. - - - - - - - - - - - - - Ext. Usage - - - - - - - - - - - - - Misc. Equip. - - - - - - - - - - - - - Task Lights - - - - - - - - - - - - - Area Lights - - - - - - - - - - - - - Total 312.0 281.3 300.3 187.5 110.3 97.7 88.0 92.3 115.3 150.9 237.2 302.6 2,275.4
High-Efficiency System
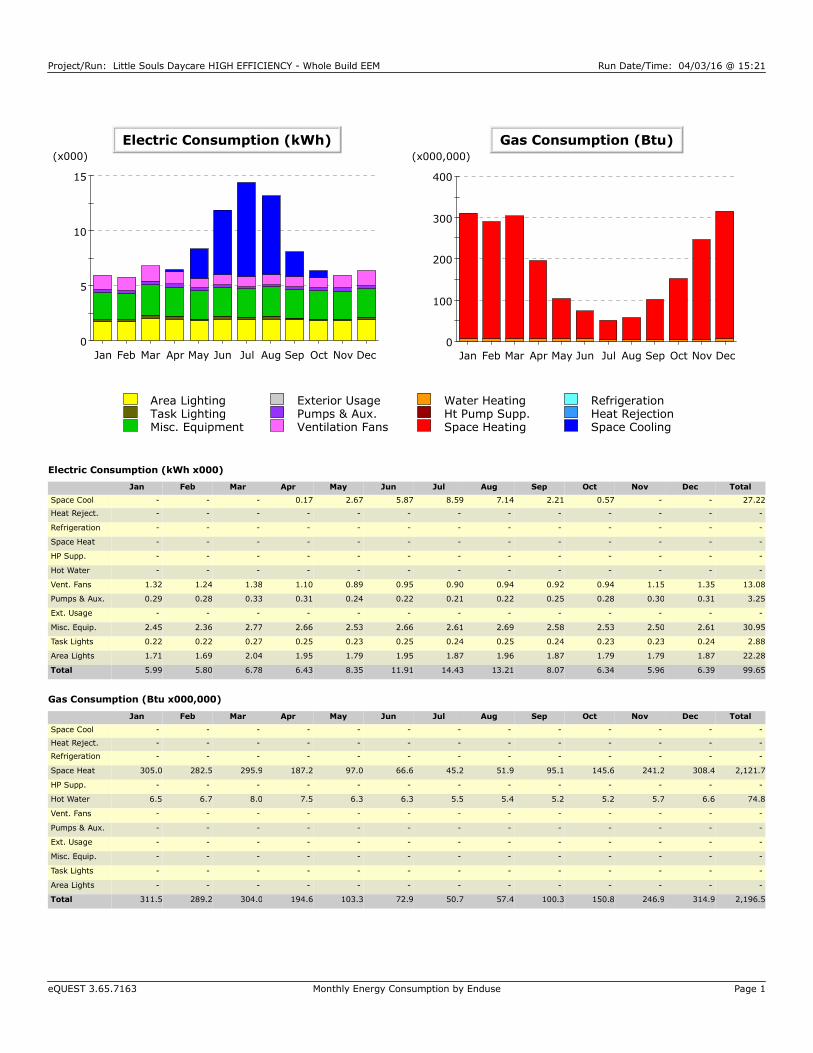
Project/Run: Little Souls Daycare HIGH EFFICIENCY - Whole Build EEM Run Date/Time: 04/03/16 @ 15:21
eQUEST 3.65.7163 Monthly Energy Consumption by Enduse Page 1
0
5
10
15
Jan Feb Mar Apr May Jun Jul Aug Sep Oct Nov Dec
Electric Consumption (kWh) (x000)
0
100
200
300
400
Jan Feb Mar Apr May Jun Jul Aug Sep Oct Nov Dec
Gas Consumption (Btu) (x000,000)
Area LightingTask LightingMisc. EquipmentExterior UsagePumps & Aux.Ventilation Fans
Water HeatingHt Pump Supp.Space HeatingRefrigerationHeat RejectionSpace Cooling
Electric Consumption (kWh x000)Jan Feb Mar Apr May Jun Jul Aug Sep Oct Nov Dec Total
Space Cool - - - 0.17 2.67 5.87 8.59 7.14 2.21 0.57 - - 27.22 Heat Reject. - - - - - - - - - - - - - Refrigeration - - - - - - - - - - - - - Space Heat - - - - - - - - - - - - - HP Supp. - - - - - - - - - - - - - Hot Water - - - - - - - - - - - - - Vent. Fans 1.32 1.24 1.38 1.10 0.89 0.95 0.90 0.94 0.92 0.94 1.15 1.35 13.08 Pumps & Aux. 0.29 0.28 0.33 0.31 0.24 0.22 0.21 0.22 0.25 0.28 0.30 0.31 3.25 Ext. Usage - - - - - - - - - - - - - Misc. Equip. 2.45 2.36 2.77 2.66 2.53 2.66 2.61 2.69 2.58 2.53 2.50 2.61 30.95 Task Lights 0.22 0.22 0.27 0.25 0.23 0.25 0.24 0.25 0.24 0.23 0.23 0.24 2.88 Area Lights 1.71 1.69 2.04 1.95 1.79 1.95 1.87 1.96 1.87 1.79 1.79 1.87 22.28 Total 5.99 5.80 6.78 6.43 8.35 11.91 14.43 13.21 8.07 6.34 5.96 6.39 99.65
Gas Consumption (Btu x000,000)Jan Feb Mar Apr May Jun Jul Aug Sep Oct Nov Dec Total
Space Cool - - - - - - - - - - - - - Heat Reject. - - - - - - - - - - - - - Refrigeration - - - - - - - - - - - - - Space Heat 305.0 282.5 295.9 187.2 97.0 66.6 45.2 51.9 95.1 145.6 241.2 308.4 2,121.7 HP Supp. - - - - - - - - - - - - - Hot Water 6.5 6.7 8.0 7.5 6.3 6.3 5.5 5.4 5.2 5.2 5.7 6.6 74.8 Vent. Fans - - - - - - - - - - - - - Pumps & Aux. - - - - - - - - - - - - - Ext. Usage - - - - - - - - - - - - - Misc. Equip. - - - - - - - - - - - - - Task Lights - - - - - - - - - - - - - Area Lights - - - - - - - - - - - - - Total 311.5 289.2 304.0 194.6 103.3 72.9 50.7 57.4 100.3 150.8 246.9 314.9 2,196.5

High-Efficiency System with Upgrades

Project/Run: Little Souls Daycare HIGH EFF SYSTEM ALL UPGRADES - Whole Build EEM Run Date/Time: 04/03/16 @ 14:17
eQUEST 3.65.7163 Monthly Energy Consumption by Enduse Page 1
02468
1012
Jan Feb Mar Apr May Jun Jul Aug Sep Oct Nov Dec
Electric Consumption (kWh) (x000)
0
50
100150
200
250
Jan Feb Mar Apr May Jun Jul Aug Sep Oct Nov Dec
Gas Consumption (Btu) (x000,000)
Area LightingTask LightingMisc. EquipmentExterior UsagePumps & Aux.Ventilation Fans
Water HeatingHt Pump Supp.Space HeatingRefrigerationHeat RejectionSpace Cooling
Electric Consumption (kWh x000)Jan Feb Mar Apr May Jun Jul Aug Sep Oct Nov Dec Total
Space Cool - - - 0.10 1.82 4.30 6.39 5.23 1.59 0.40 - - 19.83 Heat Reject. - - - - - - - - - - - - - Refrigeration - - - - - - - - - - - - - Space Heat - - - - - - - - - - - - - HP Supp. - - - - - - - - - - - - - Hot Water - - - - - - - - - - - - - Vent. Fans 1.00 0.95 1.03 0.79 0.63 0.67 0.64 0.67 0.65 0.68 0.87 1.04 9.63 Pumps & Aux. 0.25 0.24 0.28 0.26 0.20 0.18 0.16 0.18 0.21 0.24 0.26 0.27 2.74 Ext. Usage - - - - - - - - - - - - - Misc. Equip. 2.45 2.36 2.77 2.66 2.53 2.66 2.61 2.69 2.58 2.53 2.50 2.61 30.95 Task Lights 0.22 0.22 0.27 0.25 0.23 0.25 0.24 0.25 0.24 0.23 0.23 0.24 2.88 Area Lights 1.71 1.69 2.04 1.95 1.79 1.95 1.87 1.96 1.87 1.79 1.79 1.87 22.28 Total 5.63 5.47 6.39 6.02 7.19 10.02 11.92 10.98 7.15 5.87 5.65 6.03 88.31
Gas Consumption (Btu x000,000)Jan Feb Mar Apr May Jun Jul Aug Sep Oct Nov Dec Total
Space Cool - - - - - - - - - - - - - Heat Reject. - - - - - - - - - - - - - Refrigeration - - - - - - - - - - - - - Space Heat 236.8 222.6 232.0 141.3 59.0 34.0 21.0 26.3 61.9 106.2 192.2 243.4 1,576.5 HP Supp. - - - - - - - - - - - - - Hot Water 6.5 6.6 8.0 7.4 6.3 6.3 5.5 5.4 5.2 5.2 5.7 6.5 74.7 Vent. Fans - - - - - - - - - - - - - Pumps & Aux. - - - - - - - - - - - - - Ext. Usage - - - - - - - - - - - - - Misc. Equip. - - - - - - - - - - - - - Task Lights - - - - - - - - - - - - - Area Lights - - - - - - - - - - - - - Total 243.3 229.2 240.0 148.7 65.3 40.3 26.5 31.7 67.1 111.4 197.9 250.0 1,651.2
APPENDIX B – ROOF TOP
UNIT DATA

YCC30603R41096A

YSC060G3E3H3AD3

YSC060G3E3H3AD3 – cont’d

4YZC60601R410115AD3

YSC090F3E3H3AD3

YSC090F3E3H3AD3 – cont’d

YHC090F3E3H3A

YHC090F3E3H3A – cont’d

YSC120F3E3H3AD3
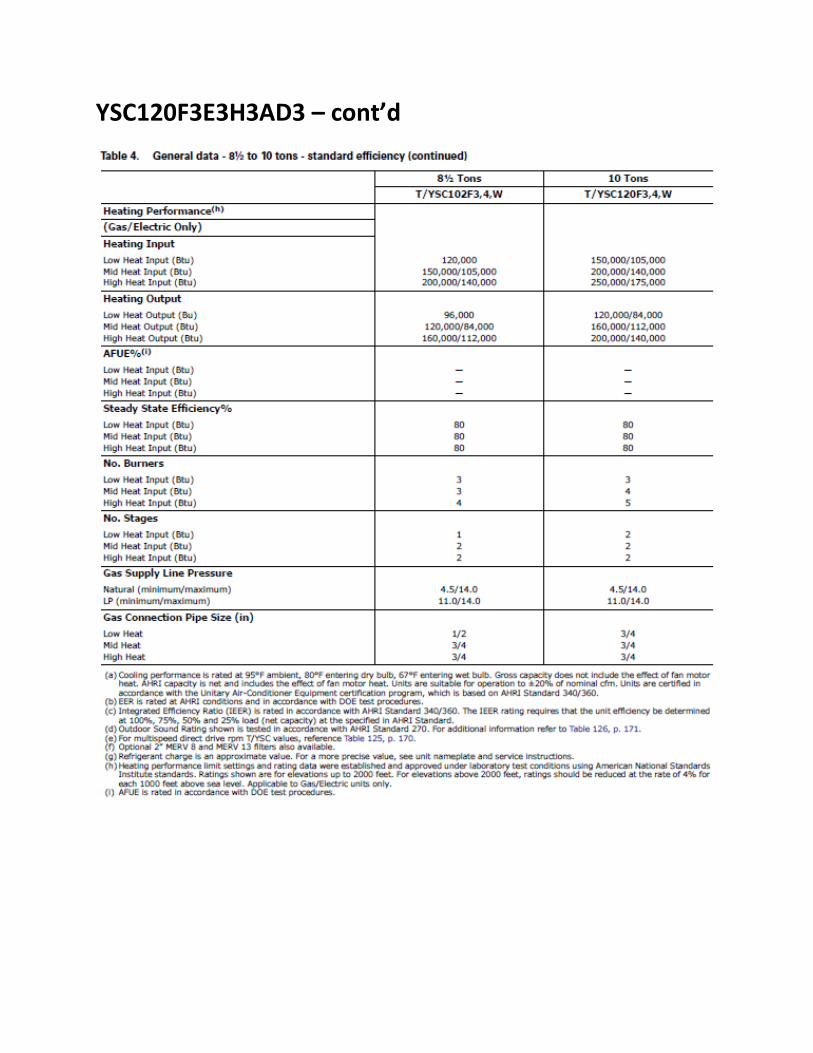
YSC120F3E3H3AD3 – cont’d

YHC120F3E3H3A

YHC120F3E3H3A – cont’d

APPENDIX C – TRACE700
DATA

System Checksums

System ChecksumsBy MACPHERSON ENGINEERING INC.
VAV w/Baseboard HeatingVAV - DAYCARE
HEATING COIL PEAKCLG SPACE PEAKCOOLING COIL PEAK TEMPERATURES
Heating DesignMo/Hr:7 / 16Mo/Hr:7 / 15Mo/Hr:Peaked at Time: Cooling Heating
SADBOADB: -33OADB:88 / 68 / 78OADB/WB/HR:Outside Air: 59.4 70.0
Ra Plenum 77.3 64.3
ReturnPercentCoil PeakSpace PeakSpace PercentPercentNetPlenumSpace 77.3 64.3Ret/OASens. + Lat. Of TotalTot SensSpace SensOf TotalSensibleOf TotalTotalSens. + Lat 64.3 77.3
0.0 0.0Fn MtrTDBtu/h (%)Btu/hBtu/h(%)Btu/h(%)Btu/hBtu/h 0.0 0.0Fn BldTDEnvelope Loads 0.0 0.0Fn Frict 0Skylite Solar 0.00 0 0 0 0 0 0 0
0Skylite Cond 0.00 0 0 0 0 0 0 0 0Roof Cond 9.46-25,304 0 0 0 9 13,494 13,494
0.00 22,495Glass Solar 0 0 22 24,013 16 22,495 0 2,745Glass/Door Cond -31,448 11.75-31,448 2 2,749 2 2,745 0
AIRFLOWS
HeatingCooling 9,001Wall Cond 13.05-34,933-27,843 9 9,528 8 11,266 2,265
0Partition/Door 0.00 0 0 0 0 0 0 0Floor 0.00 0 0 0 0 0
Sec Fan 65.42 31,467Infiltration -175,064-175,064 19 20,719 22 31,467
2,057 2,057MinStop/Rh
99.68 65,709Sub Total ==> -266,749-234,355 51 57,009 57 81,467 15,759
8,475Return 3,696
Internal Loads
1,640 1,640Exhaust
31,978Lights 0.00 0 0 29 31,978 28 39,973 7,995
0 0Rm Exh
14,640People 0.00 0 7 7,320 10
0 0Auxiliary
9,993Misc 0.00 0 0 9 9,993 7 9,993 0
56,612Sub Total ==> 0.00 0 0 44 49,292 45 64,606 7,995
4,168Ceiling Load 0.000-10,569 4 4,505 0 0-4,168 0Ventilation Load 0.00 0 0 0 0 0 0 0
Sup. Fan Heat 0 0
ENGINEERING CKS
HeatingCooling
Ret. Fan Heat 0 0 0 % OA 0.0 0.0
Duct Heat Pkup 0 0 0 0.35 1.17cfm/ft²
0Ov/Undr Sizing
0.00 0 0
0 0 0 0
576.58cfm/ton
Exhaust Heat
-3.62 9,681-3-3,818
493.98ft²/ton
-45.70 24.29Btu/hr·ft²
29No. People 126,488Grand Total ==> 100.00-267,603-244,924100.00 110,805100.00 142,256 15,768
AREAS HEATING COIL SELECTIONCOOLING COIL SELECTIONTotal Capacity Sens Cap. Coil Airflow Enter DB/WB/HR Leave DB/WB/HR Gross Total Glass Coil Airflow Ent LvgCapacityton MBh MBh cfm °F °F gr/lb °F °F gr/lb ft² (%) °F°FcfmMBh
Floor 5,856 Main Htg -267.6 0 0.0 0.0 11.9 142.3 125.6 6,773 77.3 62.9 69.6 59.4 55.8 65.9Main ClgPart 0 Aux Htg 0.0 0.0 0.0 0 0.0 0.0 0.0 0 0.0 0.0 0.0 0.0 0.0 0.0Aux Clg
ExFlr 0 0.0Preheat 0.0 0.0 0 0.0 0.0 0.0 0 0.0 0.0 0.0 0.0 0.0 0.0Opt Vent
Roof 5,201 0 0Reheat -22.7 70.0 59.4 2,057
Wall 5,465 317 6Humidif 0.0 0 0.0 0.0 11.9 142.3TotalOpt Vent 0.0 0.0 0.0 0
-267.6Total
Envelope LoadsSkylite SolarSkylite CondRoof CondGlass SolarGlass/Door CondWall CondPartition/DoorFloor
InfiltrationSub Total ==>
LightsPeopleMisc
Sub Total ==>
Ceiling LoadVentilation Load
Additional Reheat
OA Preheat Diff.
Ov/Undr SizingExhaust Heat
RA Preheat Diff.
Grand Total ==>
Internal Loads
0
0-10,535
0.00 3.94 0.00
-3,818
Supply Air Leakage
87
Dehumid. Ov Sizing 0 0
Adj Air Trans Heat 0 0 0 0 0 Adj Air Trans Heat 0 0 0Leakage Ups
Leakage Dwn
1,640 1,640Infil
AHU Vent
Nom Vent
Main FanTerminal
Adjacent Floor
Diffuser
Supply Air Leakage
Underflr Sup Ht Pkup Underflr Sup Ht Pkup
Adjacent Floor 0 0 0 0
0 0
0 0 0
0 0
0 0 0 0
0 0.00
0 0.00
6,835
6,835 6,835
0
0
0
0
0
2,057
2,057 2,057
0
0
0
0
0
0 14,640 0
Int Door 0
Ext Door 0 0 0
TRACE® 700 v6.3.1 calculated at 01:49 PM on 01/29/2016Project Name:
Dataset Name: Alternative - 1 System Checksums Report Page 1 of 8SOULS HARBOUR - JANUARY22.TRC
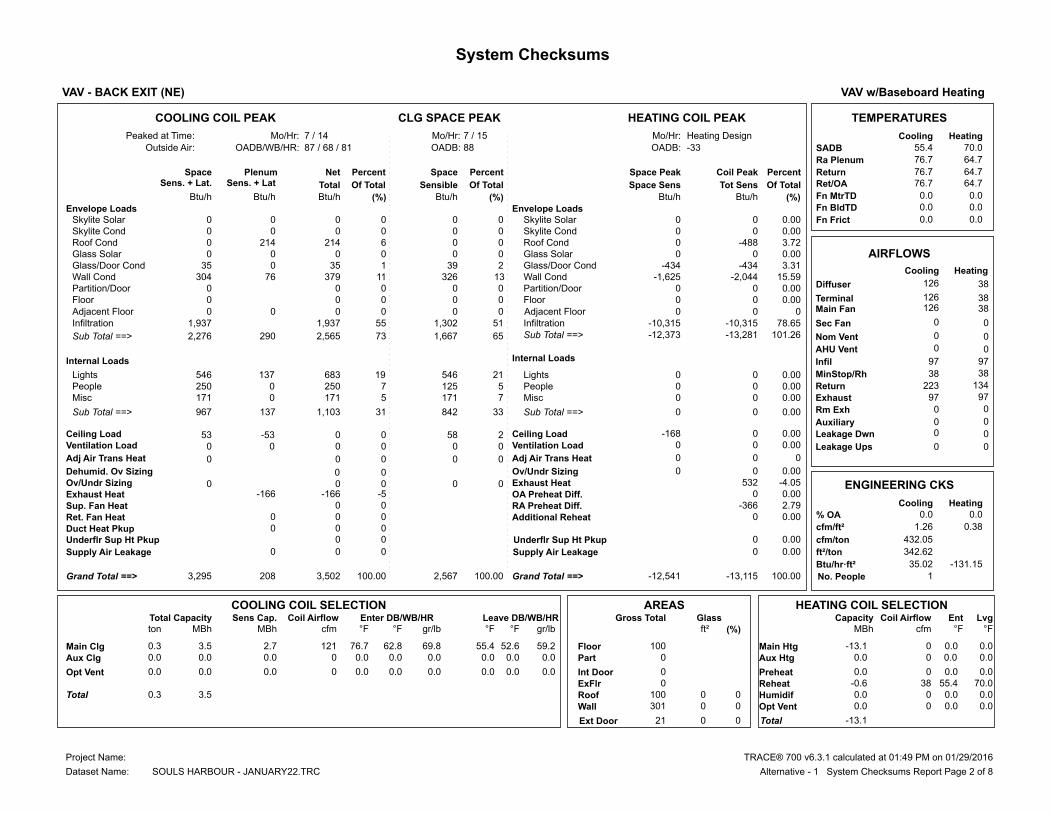
System ChecksumsBy MACPHERSON ENGINEERING INC.
VAV w/Baseboard HeatingVAV - BACK EXIT (NE)
HEATING COIL PEAKCLG SPACE PEAKCOOLING COIL PEAK TEMPERATURES
Heating DesignMo/Hr:7 / 15Mo/Hr:7 / 14Mo/Hr:Peaked at Time: Cooling Heating
SADBOADB: -33OADB:87 / 68 / 81OADB/WB/HR:Outside Air: 55.4 70.0
Ra Plenum 76.7 64.7
ReturnPercentCoil PeakSpace PeakSpace PercentPercentNetPlenumSpace 76.7 64.7Ret/OASens. + Lat. Of TotalTot SensSpace SensOf TotalSensibleOf TotalTotalSens. + Lat 64.7 76.7
0.0 0.0Fn MtrTDBtu/h (%)Btu/hBtu/h(%)Btu/h(%)Btu/hBtu/h 0.0 0.0Fn BldTDEnvelope Loads 0.0 0.0Fn Frict 0Skylite Solar 0.00 0 0 0 0 0 0 0
0Skylite Cond 0.00 0 0 0 0 0 0 0 0Roof Cond 3.72-488 0 0 0 6 214 214
0.00 0Glass Solar 0 0 0 0 0 0 0 35Glass/Door Cond -434 3.31-434 2 39 1 35 0
AIRFLOWS
HeatingCooling 304Wall Cond 15.59-2,044-1,625 13 326 11 379 76
0Partition/Door 0.00 0 0 0 0 0 0 0Floor 0.00 0 0 0 0 0
Sec Fan 78.65 1,937Infiltration -10,315-10,315 51 1,302 55 1,937
38 38MinStop/Rh
101.26 2,276Sub Total ==> -13,281-12,373 65 1,667 73 2,565 290
223Return 134
Internal Loads
97 97Exhaust
546Lights 0.00 0 0 21 546 19 683 137
0 0Rm Exh
250People 0.00 0 5 125 7
0 0Auxiliary
171Misc 0.00 0 0 7 171 5 171 0
967Sub Total ==> 0.00 0 0 33 842 31 1,103 137
53Ceiling Load 0.000-168 2 58 0 0-53 0Ventilation Load 0.00 0 0 0 0 0 0 0
Sup. Fan Heat 0 0
ENGINEERING CKS
HeatingCooling
Ret. Fan Heat 0 0 0 % OA 0.0 0.0
Duct Heat Pkup 0 0 0 0.38 1.26cfm/ft²
0Ov/Undr Sizing
0.00 0 0
0 0 0 0
432.05cfm/ton
Exhaust Heat
-4.05 532-5-166
342.62ft²/ton
-131.15 35.02Btu/hr·ft²
1No. People 3,295Grand Total ==> 100.00-13,115-12,541100.00 2,567100.00 3,502 208
AREAS HEATING COIL SELECTIONCOOLING COIL SELECTIONTotal Capacity Sens Cap. Coil Airflow Enter DB/WB/HR Leave DB/WB/HR Gross Total Glass Coil Airflow Ent LvgCapacityton MBh MBh cfm °F °F gr/lb °F °F gr/lb ft² (%) °F°FcfmMBh
Floor 100 Main Htg -13.1 0 0.0 0.0 0.3 3.5 2.7 121 76.7 62.8 69.8 55.4 52.6 59.2Main ClgPart 0 Aux Htg 0.0 0.0 0.0 0 0.0 0.0 0.0 0 0.0 0.0 0.0 0.0 0.0 0.0Aux Clg
ExFlr 0 0.0Preheat 0.0 0.0 0 0.0 0.0 0.0 0 0.0 0.0 0.0 0.0 0.0 0.0Opt Vent
Roof 100 0 0Reheat -0.6 70.0 55.4 38
Wall 301 0 0Humidif 0.0 0 0.0 0.0 0.3 3.5TotalOpt Vent 0.0 0.0 0.0 0
-13.1Total
Envelope LoadsSkylite SolarSkylite CondRoof CondGlass SolarGlass/Door CondWall CondPartition/DoorFloor
InfiltrationSub Total ==>
LightsPeopleMisc
Sub Total ==>
Ceiling LoadVentilation Load
Additional Reheat
OA Preheat Diff.
Ov/Undr SizingExhaust Heat
RA Preheat Diff.
Grand Total ==>
Internal Loads
0
0-366
0.00 2.79 0.00
-166
Supply Air Leakage
88
Dehumid. Ov Sizing 0 0
Adj Air Trans Heat 0 0 0 0 0 Adj Air Trans Heat 0 0 0Leakage Ups
Leakage Dwn
97 97Infil
AHU Vent
Nom Vent
Main FanTerminal
Adjacent Floor
Diffuser
Supply Air Leakage
Underflr Sup Ht Pkup Underflr Sup Ht Pkup
Adjacent Floor 0 0 0 0
0 0
0 0 0
0 0
0 0 0 0
0 0.00
0 0.00
126
126 126
0
0
0
0
0
38
38 38
0
0
0
0
0
0 250 0
Int Door 0
Ext Door 21 0 0
TRACE® 700 v6.3.1 calculated at 01:49 PM on 01/29/2016Project Name:
Dataset Name: Alternative - 1 System Checksums Report Page 2 of 8SOULS HARBOUR - JANUARY22.TRC
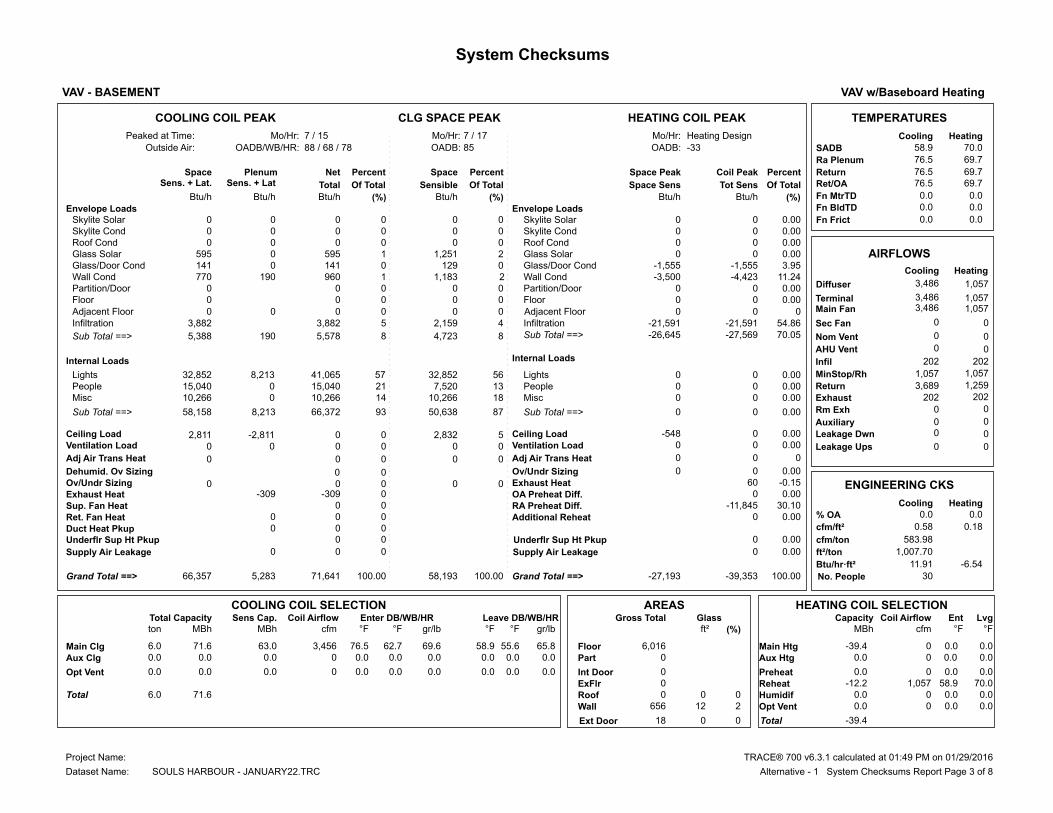
System ChecksumsBy MACPHERSON ENGINEERING INC.
VAV w/Baseboard HeatingVAV - BASEMENT
HEATING COIL PEAKCLG SPACE PEAKCOOLING COIL PEAK TEMPERATURES
Heating DesignMo/Hr:7 / 17Mo/Hr:7 / 15Mo/Hr:Peaked at Time: Cooling Heating
SADBOADB: -33OADB:88 / 68 / 78OADB/WB/HR:Outside Air: 58.9 70.0
Ra Plenum 76.5 69.7
ReturnPercentCoil PeakSpace PeakSpace PercentPercentNetPlenumSpace 76.5 69.7Ret/OASens. + Lat. Of TotalTot SensSpace SensOf TotalSensibleOf TotalTotalSens. + Lat 69.7 76.5
0.0 0.0Fn MtrTDBtu/h (%)Btu/hBtu/h(%)Btu/h(%)Btu/hBtu/h 0.0 0.0Fn BldTDEnvelope Loads 0.0 0.0Fn Frict 0Skylite Solar 0.00 0 0 0 0 0 0 0
0Skylite Cond 0.00 0 0 0 0 0 0 0 0Roof Cond 0.00 0 0 0 0 0 0 0
0.00 595Glass Solar 0 0 2 1,251 1 595 0 141Glass/Door Cond -1,555 3.95-1,555 0 129 0 141 0
AIRFLOWS
HeatingCooling 770Wall Cond 11.24-4,423-3,500 2 1,183 1 960 190
0Partition/Door 0.00 0 0 0 0 0 0 0Floor 0.00 0 0 0 0 0
Sec Fan 54.86 3,882Infiltration -21,591-21,591 4 2,159 5 3,882
1,057 1,057MinStop/Rh
70.05 5,388Sub Total ==> -27,569-26,645 8 4,723 8 5,578 190
3,689Return 1,259
Internal Loads
202 202Exhaust
32,852Lights 0.00 0 0 56 32,852 57 41,065 8,213
0 0Rm Exh
15,040People 0.00 0 13 7,520 21
0 0Auxiliary
10,266Misc 0.00 0 0 18 10,266 14 10,266 0
58,158Sub Total ==> 0.00 0 0 87 50,638 93 66,372 8,213
2,811Ceiling Load 0.000-548 5 2,832 0 0-2,811 0Ventilation Load 0.00 0 0 0 0 0 0 0
Sup. Fan Heat 0 0
ENGINEERING CKS
HeatingCooling
Ret. Fan Heat 0 0 0 % OA 0.0 0.0
Duct Heat Pkup 0 0 0 0.18 0.58cfm/ft²
0Ov/Undr Sizing
0.00 0 0
0 0 0 0
583.98cfm/ton
Exhaust Heat
-0.15 60 0-309
1,007.70ft²/ton
-6.54 11.91Btu/hr·ft²
30No. People 66,357Grand Total ==> 100.00-39,353-27,193100.00 58,193100.00 71,641 5,283
AREAS HEATING COIL SELECTIONCOOLING COIL SELECTIONTotal Capacity Sens Cap. Coil Airflow Enter DB/WB/HR Leave DB/WB/HR Gross Total Glass Coil Airflow Ent LvgCapacityton MBh MBh cfm °F °F gr/lb °F °F gr/lb ft² (%) °F°FcfmMBh
Floor 6,016 Main Htg -39.4 0 0.0 0.0 6.0 71.6 63.0 3,456 76.5 62.7 69.6 58.9 55.6 65.8Main ClgPart 0 Aux Htg 0.0 0.0 0.0 0 0.0 0.0 0.0 0 0.0 0.0 0.0 0.0 0.0 0.0Aux Clg
ExFlr 0 0.0Preheat 0.0 0.0 0 0.0 0.0 0.0 0 0.0 0.0 0.0 0.0 0.0 0.0Opt Vent
Roof 0 0 0Reheat -12.2 70.0 58.9 1,057
Wall 656 12 2Humidif 0.0 0 0.0 0.0 6.0 71.6TotalOpt Vent 0.0 0.0 0.0 0
-39.4Total
Envelope LoadsSkylite SolarSkylite CondRoof CondGlass SolarGlass/Door CondWall CondPartition/DoorFloor
InfiltrationSub Total ==>
LightsPeopleMisc
Sub Total ==>
Ceiling LoadVentilation Load
Additional Reheat
OA Preheat Diff.
Ov/Undr SizingExhaust Heat
RA Preheat Diff.
Grand Total ==>
Internal Loads
0
0-11,845
0.00 30.10
0.00
-309
Supply Air Leakage
85
Dehumid. Ov Sizing 0 0
Adj Air Trans Heat 0 0 0 0 0 Adj Air Trans Heat 0 0 0Leakage Ups
Leakage Dwn
202 202Infil
AHU Vent
Nom Vent
Main FanTerminal
Adjacent Floor
Diffuser
Supply Air Leakage
Underflr Sup Ht Pkup Underflr Sup Ht Pkup
Adjacent Floor 0 0 0 0
0 0
0 0 0
0 0
0 0 0 0
0 0.00
0 0.00
3,486
3,486 3,486
0
0
0
0
0
1,057
1,057 1,057
0
0
0
0
0
0 15,040 0
Int Door 0
Ext Door 18 0 0
TRACE® 700 v6.3.1 calculated at 01:49 PM on 01/29/2016Project Name:
Dataset Name: Alternative - 1 System Checksums Report Page 3 of 8SOULS HARBOUR - JANUARY22.TRC

System ChecksumsBy MACPHERSON ENGINEERING INC.
VAV w/Baseboard HeatingVAV - ENTRANCE (NW)
HEATING COIL PEAKCLG SPACE PEAKCOOLING COIL PEAK TEMPERATURES
Heating DesignMo/Hr:7 / 15Mo/Hr:7 / 15Mo/Hr:Peaked at Time: Cooling Heating
SADBOADB: -33OADB:88 / 68 / 78OADB/WB/HR:Outside Air: 56.4 70.0
Ra Plenum 77.2 64.1
ReturnPercentCoil PeakSpace PeakSpace PercentPercentNetPlenumSpace 77.2 64.1Ret/OASens. + Lat. Of TotalTot SensSpace SensOf TotalSensibleOf TotalTotalSens. + Lat 64.1 77.2
0.0 0.0Fn MtrTDBtu/h (%)Btu/hBtu/h(%)Btu/h(%)Btu/hBtu/h 0.0 0.0Fn BldTDEnvelope Loads 0.0 0.0Fn Frict 0Skylite Solar 0.00 0 0 0 0 0 0 0
0Skylite Cond 0.00 0 0 0 0 0 0 0 0Roof Cond 5.85-1,252 0 0 0 10 669 669
0.00 264Glass Solar 0 0 5 264 4 264 0 125Glass/Door Cond -1,425 6.65-1,425 2 125 2 125 0
AIRFLOWS
HeatingCooling 500Wall Cond 14.69-3,147-2,506 10 500 9 622 121
0Partition/Door 0.00 0 0 0 0 0 0 0Floor 0.00 0 0 0 0 0
Sec Fan 74.02 2,842Infiltration -15,857-15,857 38 2,001 40 2,842
81 81MinStop/Rh
101.20 3,732Sub Total ==> -21,681-19,788 55 2,891 64 4,522 790
420Return 230
Internal Loads
149 149Exhaust
1,409Lights 0.00 0 0 27 1,409 25 1,761 352
0 0Rm Exh
645People 0.00 0 6 323 9
0 0Auxiliary
440Misc 0.00 0 0 8 440 6 440 0
2,494Sub Total ==> 0.00 0 0 41 2,172 41 2,846 352
181Ceiling Load 0.000-484 3 181 0 0-181 0Ventilation Load 0.00 0 0 0 0 0 0 0
Sup. Fan Heat 0 0
ENGINEERING CKS
HeatingCooling
Ret. Fan Heat 0 0 0 % OA 0.0 0.0
Duct Heat Pkup 0 0 0 0.32 1.05cfm/ft²
0Ov/Undr Sizing
0.00 0 0
0 0 0 0
462.95cfm/ton
Exhaust Heat
-4.25 911-5-340
440.52ft²/ton
-83.04 27.24Btu/hr·ft²
1No. People 6,407Grand Total ==> 100.00-21,423-20,272100.00 5,243100.00 7,028 621
AREAS HEATING COIL SELECTIONCOOLING COIL SELECTIONTotal Capacity Sens Cap. Coil Airflow Enter DB/WB/HR Leave DB/WB/HR Gross Total Glass Coil Airflow Ent LvgCapacityton MBh MBh cfm °F °F gr/lb °F °F gr/lb ft² (%) °F°FcfmMBh
Floor 258 Main Htg -21.4 0 0.0 0.0 0.6 7.0 5.9 271 77.2 63.0 69.7 56.4 54.0 63.2Main ClgPart 0 Aux Htg 0.0 0.0 0.0 0 0.0 0.0 0.0 0 0.0 0.0 0.0 0.0 0.0 0.0Aux Clg
ExFlr 0 0.0Preheat 0.0 0.0 0 0.0 0.0 0.0 0 0.0 0.0 0.0 0.0 0.0 0.0Opt Vent
Roof 258 0 0Reheat -1.2 70.0 56.4 81
Wall 474 10 2Humidif 0.0 0 0.0 0.0 0.6 7.0TotalOpt Vent 0.0 0.0 0.0 0
-21.4Total
Envelope LoadsSkylite SolarSkylite CondRoof CondGlass SolarGlass/Door CondWall CondPartition/DoorFloor
InfiltrationSub Total ==>
LightsPeopleMisc
Sub Total ==>
Ceiling LoadVentilation Load
Additional Reheat
OA Preheat Diff.
Ov/Undr SizingExhaust Heat
RA Preheat Diff.
Grand Total ==>
Internal Loads
0
0-653
0.00 3.05 0.00
-340
Supply Air Leakage
88
Dehumid. Ov Sizing 0 0
Adj Air Trans Heat 0 0 0 0 0 Adj Air Trans Heat 0 0 0Leakage Ups
Leakage Dwn
149 149Infil
AHU Vent
Nom Vent
Main FanTerminal
Adjacent Floor
Diffuser
Supply Air Leakage
Underflr Sup Ht Pkup Underflr Sup Ht Pkup
Adjacent Floor 0 0 0 0
0 0
0 0 0
0 0
0 0 0 0
0 0.00
0 0.00
271
271 271
0
0
0
0
0
81
81 81
0
0
0
0
0
0 645 0
Int Door 0
Ext Door 21 0 0
TRACE® 700 v6.3.1 calculated at 01:49 PM on 01/29/2016Project Name:
Dataset Name: Alternative - 1 System Checksums Report Page 4 of 8SOULS HARBOUR - JANUARY22.TRC

System ChecksumsBy MACPHERSON ENGINEERING INC.
VAV w/Baseboard HeatingVAV - FRONT ENTRANCE (S)
HEATING COIL PEAKCLG SPACE PEAKCOOLING COIL PEAK TEMPERATURES
Heating DesignMo/Hr:10 / 15Mo/Hr:8 / 15Mo/Hr:Peaked at Time: Cooling Heating
SADBOADB: -33OADB:78 / 65 / 81OADB/WB/HR:Outside Air: 55.0 70.0
Ra Plenum 75.8 67.9
ReturnPercentCoil PeakSpace PeakSpace PercentPercentNetPlenumSpace 75.8 67.9Ret/OASens. + Lat. Of TotalTot SensSpace SensOf TotalSensibleOf TotalTotalSens. + Lat 67.9 75.8
0.0 0.0Fn MtrTDBtu/h (%)Btu/hBtu/h(%)Btu/h(%)Btu/hBtu/h 0.0 0.0Fn BldTDEnvelope Loads 0.0 0.0Fn Frict 0Skylite Solar 0.00 0 0 0 0 0 0 0
0Skylite Cond 0.00 0 0 0 0 0 0 0 0Roof Cond 2.88-1,388 0 0 0 1 534 534
0.00 26,703Glass Solar 0 0 105 34,763 66 26,703 0 96Glass/Door Cond -23,099 47.89-23,099-13-4,366 0 96 0
AIRFLOWS
HeatingCooling 598Wall Cond 3.21-1,547-1,154 2 502 2 803 205
0Partition/Door 0.00 0 0 0 0 0 0 0Floor 0.00 0 0 0 0 0
Sec Fan 32.54 5,904Infiltration -15,696-15,696-8-2,789 15 5,904
509 509MinStop/Rh
86.51 33,301Sub Total ==> -41,731-39,949 85 28,110 85 34,040 739
1,738Return 656
Internal Loads
147 147Exhaust
3,107Lights 0.00 0 0 9 3,107 10 3,884 777
0 0Rm Exh
1,423People 0.00 0 2 711 4
0 0Auxiliary
971Misc 0.00 0 0 3 971 2 971 0
5,501Sub Total ==> 0.00 0 0 15 4,789 16 6,278 777
139Ceiling Load 0.000-373 0 80 0 0-139 0Ventilation Load 0.00 0 0 0 0 0 0 0
Sup. Fan Heat 0 0
ENGINEERING CKS
HeatingCooling
Ret. Fan Heat 0 0 0 % OA 0.0 0.0
Duct Heat Pkup 0 0 0 0.89 2.80cfm/ft²
0Ov/Undr Sizing
0.00 0 0
0 0 0 0
474.82cfm/ton
Exhaust Heat
-0.65 316 0-117
169.85ft²/ton
-84.77 70.65Btu/hr·ft²
3No. People 38,940Grand Total ==> 100.00-48,237-40,322100.00 32,980100.00 40,200 1,260
AREAS HEATING COIL SELECTIONCOOLING COIL SELECTIONTotal Capacity Sens Cap. Coil Airflow Enter DB/WB/HR Leave DB/WB/HR Gross Total Glass Coil Airflow Ent LvgCapacityton MBh MBh cfm °F °F gr/lb °F °F gr/lb ft² (%) °F°FcfmMBh
Floor 569 Main Htg -48.2 0 0.0 0.0 3.4 40.2 34.0 1,581 75.8 52.0 24.4 55.0 40.8 18.0Main ClgPart 0 Aux Htg 0.0 0.0 0.0 0 0.0 0.0 0.0 0 0.0 0.0 0.0 0.0 0.0 0.0Aux Clg
ExFlr 0 0.0Preheat 0.0 0.0 0 0.0 0.0 0.0 0 0.0 0.0 0.0 0.0 0.0 0.0Opt Vent
Roof 275 0 0Reheat -7.9 70.0 55.0 509
Wall 452 225 50Humidif 0.0 0 0.0 0.0 3.4 40.2TotalOpt Vent 0.0 0.0 0.0 0
-48.2Total
Envelope LoadsSkylite SolarSkylite CondRoof CondGlass SolarGlass/Door CondWall CondPartition/DoorFloor
InfiltrationSub Total ==>
LightsPeopleMisc
Sub Total ==>
Ceiling LoadVentilation Load
Additional Reheat
OA Preheat Diff.
Ov/Undr SizingExhaust Heat
RA Preheat Diff.
Grand Total ==>
Internal Loads
0
0-6,822
0.00 14.14
0.00
-117
Supply Air Leakage
57
Dehumid. Ov Sizing 0 0
Adj Air Trans Heat 0 0 0 0 0 Adj Air Trans Heat 0 0 0Leakage Ups
Leakage Dwn
147 147Infil
AHU Vent
Nom Vent
Main FanTerminal
Adjacent Floor
Diffuser
Supply Air Leakage
Underflr Sup Ht Pkup Underflr Sup Ht Pkup
Adjacent Floor 0 0 0 0
0 0
0 0 0
0 0
0 0 0 0
0 0.00
0 0.00
1,591
1,591 1,591
0
0
0
0
0
509
509 509
0
0
0
0
0
0 1,423 0
Int Door 0
Ext Door 39 0 0
TRACE® 700 v6.3.1 calculated at 01:49 PM on 01/29/2016Project Name:
Dataset Name: Alternative - 1 System Checksums Report Page 5 of 8SOULS HARBOUR - JANUARY22.TRC

System ChecksumsBy MACPHERSON ENGINEERING INC.
VAV w/Baseboard HeatingVAV - FRONT ENTRANCE (SW)
HEATING COIL PEAKCLG SPACE PEAKCOOLING COIL PEAK TEMPERATURES
Heating DesignMo/Hr:7 / 19Mo/Hr:7 / 18Mo/Hr:Peaked at Time: Cooling Heating
SADBOADB: -33OADB:82 / 63 / 60OADB/WB/HR:Outside Air: 55.0 70.0
Ra Plenum 76.3 67.9
ReturnPercentCoil PeakSpace PeakSpace PercentPercentNetPlenumSpace 76.3 67.9Ret/OASens. + Lat. Of TotalTot SensSpace SensOf TotalSensibleOf TotalTotalSens. + Lat 67.9 76.3
0.0 0.0Fn MtrTDBtu/h (%)Btu/hBtu/h(%)Btu/h(%)Btu/hBtu/h 0.0 0.0Fn BldTDEnvelope Loads 0.0 0.0Fn Frict 0Skylite Solar 0.00 0 0 0 0 0 0 0
0Skylite Cond 0.00 0 0 0 0 0 0 0 0Roof Cond 2.53-1,211 0 0 0 2 784 784
0.00 16,943Glass Solar 0 0 62 18,363 50 16,943 0 1,022Glass/Door Cond -16,302 34.03-16,302 2 661 3 1,022 0
AIRFLOWS
HeatingCooling 925Wall Cond 6.59-3,156-2,242 2 693 4 1,298 373
0Partition/Door 0.00 0 0 0 0 0 0 0Floor 0.00 0 0 0 0 0
Sec Fan 45.43 2,623Infiltration -21,767-21,767 3 824 8 2,623
443 443MinStop/Rh
88.57 21,513Sub Total ==> -42,435-40,310 69 20,541 67 22,670 1,157
1,639Return 647
Internal Loads
204 204Exhaust
5,723Lights 0.00 0 0 19 5,723 21 7,154 1,431
0 0Rm Exh
2,620People 0.00 0 4 1,310 8
0 0Auxiliary
1,788Misc 0.00 0 0 6 1,788 5 1,788 0
10,131Sub Total ==> 0.00 0 0 30 8,821 34 11,562 1,431
423Ceiling Load 0.000-703 1 401 0 0-423 0Ventilation Load 0.00 0 0 0 0 0 0 0
Sup. Fan Heat 0 0
ENGINEERING CKS
HeatingCooling
Ret. Fan Heat 0 0 0 % OA 0.0 0.0
Duct Heat Pkup 0 0 0 0.42 1.37cfm/ft²
0Ov/Undr Sizing
0.00 0 0
0 0 0 0
507.20cfm/ton
Exhaust Heat
-0.93 448-1-270
370.29ft²/ton
-45.72 32.41Btu/hr·ft²
5No. People 32,068Grand Total ==> 100.00-47,910-41,014100.00 29,763100.00 33,963 1,895
AREAS HEATING COIL SELECTIONCOOLING COIL SELECTIONTotal Capacity Sens Cap. Coil Airflow Enter DB/WB/HR Leave DB/WB/HR Gross Total Glass Coil Airflow Ent LvgCapacityton MBh MBh cfm °F °F gr/lb °F °F gr/lb ft² (%) °F°FcfmMBh
Floor 1,048 Main Htg -47.9 0 0.0 0.0 2.8 34.0 31.6 1,432 76.3 58.8 51.5 55.0 49.8 48.9Main ClgPart 0 Aux Htg 0.0 0.0 0.0 0 0.0 0.0 0.0 0 0.0 0.0 0.0 0.0 0.0 0.0Aux Clg
ExFlr 0 0.0Preheat 0.0 0.0 0 0.0 0.0 0.0 0 0.0 0.0 0.0 0.0 0.0 0.0Opt Vent
Roof 240 0 0Reheat -6.9 70.0 55.0 443
Wall 613 151 25Humidif 0.0 0 0.0 0.0 2.8 34.0TotalOpt Vent 0.0 0.0 0.0 0
-47.9Total
Envelope LoadsSkylite SolarSkylite CondRoof CondGlass SolarGlass/Door CondWall CondPartition/DoorFloor
InfiltrationSub Total ==>
LightsPeopleMisc
Sub Total ==>
Ceiling LoadVentilation Load
Additional Reheat
OA Preheat Diff.
Ov/Undr SizingExhaust Heat
RA Preheat Diff.
Grand Total ==>
Internal Loads
0
0-5,923
0.00 12.36
0.00
-270
Supply Air Leakage
79
Dehumid. Ov Sizing 0 0
Adj Air Trans Heat 0 0 0 0 0 Adj Air Trans Heat 0 0 0Leakage Ups
Leakage Dwn
204 204Infil
AHU Vent
Nom Vent
Main FanTerminal
Adjacent Floor
Diffuser
Supply Air Leakage
Underflr Sup Ht Pkup Underflr Sup Ht Pkup
Adjacent Floor 0 0 0 0
0 0
0 0 0
0 0
0 0 0 0
0 0.00
0 0.00
1,436
1,436 1,436
0
0
0
0
0
443
443 443
0
0
0
0
0
0 2,620 0
Int Door 0
Ext Door 67 0 0
TRACE® 700 v6.3.1 calculated at 01:49 PM on 01/29/2016Project Name:
Dataset Name: Alternative - 1 System Checksums Report Page 6 of 8SOULS HARBOUR - JANUARY22.TRC

System ChecksumsBy MACPHERSON ENGINEERING INC.
VAV w/Baseboard HeatingVAV - GYMNASIUM
HEATING COIL PEAKCLG SPACE PEAKCOOLING COIL PEAK TEMPERATURES
Heating DesignMo/Hr:7 / 15Mo/Hr:7 / 15Mo/Hr:Peaked at Time: Cooling Heating
SADBOADB: -33OADB:88 / 68 / 78OADB/WB/HR:Outside Air: 58.9 70.0
Ra Plenum 77.6 62.9
ReturnPercentCoil PeakSpace PeakSpace PercentPercentNetPlenumSpace 77.6 62.9Ret/OASens. + Lat. Of TotalTot SensSpace SensOf TotalSensibleOf TotalTotalSens. + Lat 62.9 77.6
0.0 0.0Fn MtrTDBtu/h (%)Btu/hBtu/h(%)Btu/h(%)Btu/hBtu/h 0.0 0.0Fn BldTDEnvelope Loads 0.0 0.0Fn Frict 16,107Skylite Solar 0.00 0 0 12 16,107 9 16,107 0
0Skylite Cond 4.56-8,857 0 0 0 0 604 604 0Roof Cond 16.80-32,661 0 0 0 10 17,602 17,602
0.00 14,404Glass Solar 0 0 11 14,404 8 14,404 0 2,067Glass/Door Cond -23,539 12.11-23,539 2 2,067 1 2,067 0
AIRFLOWS
HeatingCooling 5,625Wall Cond 10.66-20,716-16,498 4 5,625 4 7,054 1,429
0Partition/Door 0.00 0 0 0 0 0 0 0Floor 0.00 0 0 0 0 0
Sec Fan 54.39 19,003Infiltration -105,711-105,711 10 13,342 11 19,003
2,492 2,492MinStop/Rh
98.51 57,206Sub Total ==> -191,483-145,747 39 51,545 45 76,841 19,635
8,979Return 3,482
Internal Loads
990 990Exhaust
48,246Lights 0.00 0 0 36 48,246 35 60,308 12,062
0 0Rm Exh
22,088People 0.00 0 8 11,044 13
0 0Auxiliary
15,077Misc 0.00 0 0 11 15,077 9 15,077 0
85,411Sub Total ==> 0.00 0 0 56 74,367 57 97,472 12,062
7,324Ceiling Load 0.000-19,975 5 7,324 0 0-7,324 0Ventilation Load 0.00 0 0 0 0 0 0 0
Sup. Fan Heat 0 0
ENGINEERING CKS
HeatingCooling
Ret. Fan Heat 0 0 0 % OA 0.0 0.0
Duct Heat Pkup 0 0 0 0.28 0.90cfm/ft²
0Ov/Undr Sizing
0.00 0 0
0 0 0 0
558.55cfm/ton
Exhaust Heat
-3.77 7,323-2-2,685
617.73ft²/ton
-22.00 19.43Btu/hr·ft²
44No. People 149,941Grand Total ==> 100.00-194,373-165,723100.00 133,236100.00 171,628 21,687
AREAS HEATING COIL SELECTIONCOOLING COIL SELECTIONTotal Capacity Sens Cap. Coil Airflow Enter DB/WB/HR Leave DB/WB/HR Gross Total Glass Coil Airflow Ent LvgCapacityton MBh MBh cfm °F °F gr/lb °F °F gr/lb ft² (%) °F°FcfmMBh
Floor 8,835 Main Htg -194.4 0 0.0 0.0 14.3 171.6 154.9 7,989 77.6 63.1 69.6 58.9 55.8 66.4Main ClgPart 0 Aux Htg 0.0 0.0 0.0 0 0.0 0.0 0.0 0 0.0 0.0 0.0 0.0 0.0 0.0Aux Clg
ExFlr 0 0.0Preheat 0.0 0.0 0 0.0 0.0 0.0 0 0.0 0.0 0.0 0.0 0.0 0.0Opt Vent
Roof 6,910 96 1Reheat -28.7 70.0 58.9 2,492
Wall 3,300 237 7Humidif 0.0 0 0.0 0.0 14.3 171.6TotalOpt Vent 0.0 0.0 0.0 0
-194.4Total
Envelope LoadsSkylite SolarSkylite CondRoof CondGlass SolarGlass/Door CondWall CondPartition/DoorFloor
InfiltrationSub Total ==>
LightsPeopleMisc
Sub Total ==>
Ceiling LoadVentilation Load
Additional Reheat
OA Preheat Diff.
Ov/Undr SizingExhaust Heat
RA Preheat Diff.
Grand Total ==>
Internal Loads
0
0-10,213
0.00 5.25 0.00
-2,685
Supply Air Leakage
88
Dehumid. Ov Sizing 0 0
Adj Air Trans Heat 0 0 0 0 0 Adj Air Trans Heat 0 0 0Leakage Ups
Leakage Dwn
990 990Infil
AHU Vent
Nom Vent
Main FanTerminal
Adjacent Floor
Diffuser
Supply Air Leakage
Underflr Sup Ht Pkup Underflr Sup Ht Pkup
Adjacent Floor 0 0 0 0
0 0
0 0 0
0 0
0 0 0 0
0 0.00
0 0.00
7,989
7,989 7,989
0
0
0
0
0
2,492
2,492 2,492
0
0
0
0
0
0 22,088 0
Int Door 0
Ext Door 0 0 0
TRACE® 700 v6.3.1 calculated at 01:49 PM on 01/29/2016Project Name:
Dataset Name: Alternative - 1 System Checksums Report Page 7 of 8SOULS HARBOUR - JANUARY22.TRC
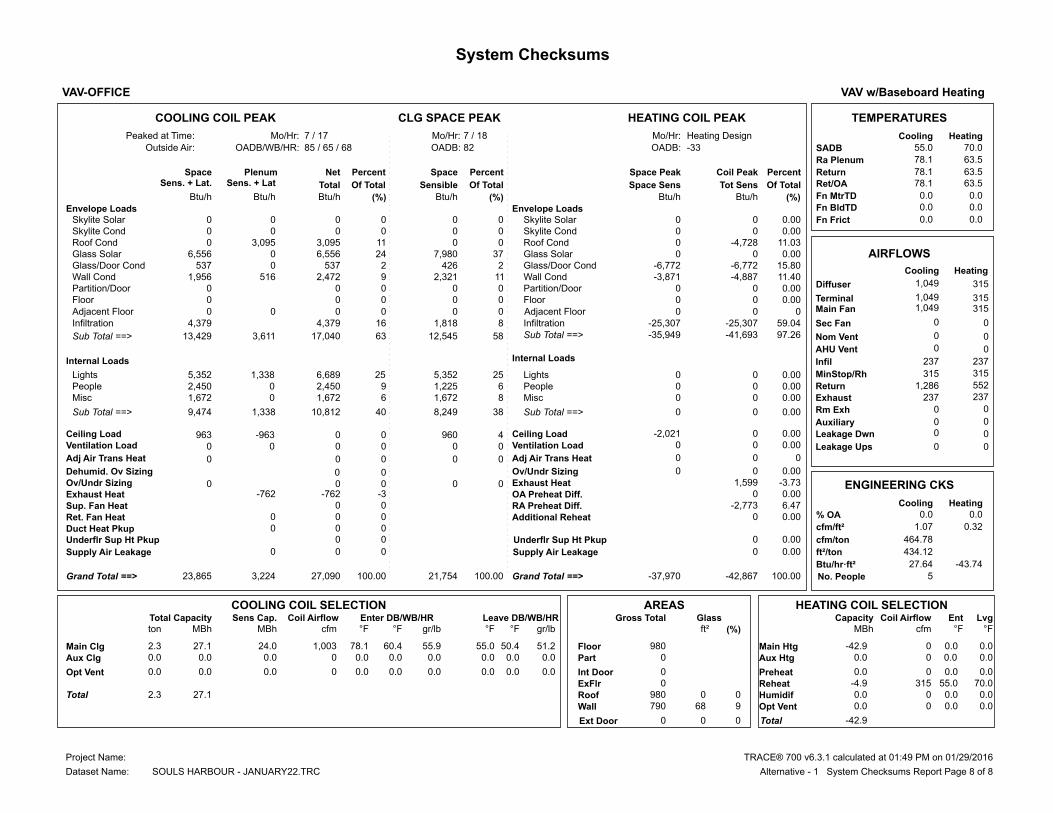
System ChecksumsBy MACPHERSON ENGINEERING INC.
VAV w/Baseboard HeatingVAV-OFFICE
HEATING COIL PEAKCLG SPACE PEAKCOOLING COIL PEAK TEMPERATURES
Heating DesignMo/Hr:7 / 18Mo/Hr:7 / 17Mo/Hr:Peaked at Time: Cooling Heating
SADBOADB: -33OADB:85 / 65 / 68OADB/WB/HR:Outside Air: 55.0 70.0
Ra Plenum 78.1 63.5
ReturnPercentCoil PeakSpace PeakSpace PercentPercentNetPlenumSpace 78.1 63.5Ret/OASens. + Lat. Of TotalTot SensSpace SensOf TotalSensibleOf TotalTotalSens. + Lat 63.5 78.1
0.0 0.0Fn MtrTDBtu/h (%)Btu/hBtu/h(%)Btu/h(%)Btu/hBtu/h 0.0 0.0Fn BldTDEnvelope Loads 0.0 0.0Fn Frict 0Skylite Solar 0.00 0 0 0 0 0 0 0
0Skylite Cond 0.00 0 0 0 0 0 0 0 0Roof Cond 11.03-4,728 0 0 0 11 3,095 3,095
0.00 6,556Glass Solar 0 0 37 7,980 24 6,556 0 537Glass/Door Cond -6,772 15.80-6,772 2 426 2 537 0
AIRFLOWS
HeatingCooling 1,956Wall Cond 11.40-4,887-3,871 11 2,321 9 2,472 516
0Partition/Door 0.00 0 0 0 0 0 0 0Floor 0.00 0 0 0 0 0
Sec Fan 59.04 4,379Infiltration -25,307-25,307 8 1,818 16 4,379
315 315MinStop/Rh
97.26 13,429Sub Total ==> -41,693-35,949 58 12,545 63 17,040 3,611
1,286Return 552
Internal Loads
237 237Exhaust
5,352Lights 0.00 0 0 25 5,352 25 6,689 1,338
0 0Rm Exh
2,450People 0.00 0 6 1,225 9
0 0Auxiliary
1,672Misc 0.00 0 0 8 1,672 6 1,672 0
9,474Sub Total ==> 0.00 0 0 38 8,249 40 10,812 1,338
963Ceiling Load 0.000-2,021 4 960 0 0-963 0Ventilation Load 0.00 0 0 0 0 0 0 0
Sup. Fan Heat 0 0
ENGINEERING CKS
HeatingCooling
Ret. Fan Heat 0 0 0 % OA 0.0 0.0
Duct Heat Pkup 0 0 0 0.32 1.07cfm/ft²
0Ov/Undr Sizing
0.00 0 0
0 0 0 0
464.78cfm/ton
Exhaust Heat
-3.73 1,599-3-762
434.12ft²/ton
-43.74 27.64Btu/hr·ft²
5No. People 23,865Grand Total ==> 100.00-42,867-37,970100.00 21,754100.00 27,090 3,224
AREAS HEATING COIL SELECTIONCOOLING COIL SELECTIONTotal Capacity Sens Cap. Coil Airflow Enter DB/WB/HR Leave DB/WB/HR Gross Total Glass Coil Airflow Ent LvgCapacityton MBh MBh cfm °F °F gr/lb °F °F gr/lb ft² (%) °F°FcfmMBh
Floor 980 Main Htg -42.9 0 0.0 0.0 2.3 27.1 24.0 1,003 78.1 60.4 55.9 55.0 50.4 51.2Main ClgPart 0 Aux Htg 0.0 0.0 0.0 0 0.0 0.0 0.0 0 0.0 0.0 0.0 0.0 0.0 0.0Aux Clg
ExFlr 0 0.0Preheat 0.0 0.0 0 0.0 0.0 0.0 0 0.0 0.0 0.0 0.0 0.0 0.0Opt Vent
Roof 980 0 0Reheat -4.9 70.0 55.0 315
Wall 790 68 9Humidif 0.0 0 0.0 0.0 2.3 27.1TotalOpt Vent 0.0 0.0 0.0 0
-42.9Total
Envelope LoadsSkylite SolarSkylite CondRoof CondGlass SolarGlass/Door CondWall CondPartition/DoorFloor
InfiltrationSub Total ==>
LightsPeopleMisc
Sub Total ==>
Ceiling LoadVentilation Load
Additional Reheat
OA Preheat Diff.
Ov/Undr SizingExhaust Heat
RA Preheat Diff.
Grand Total ==>
Internal Loads
0
0-2,773
0.00 6.47 0.00
-762
Supply Air Leakage
82
Dehumid. Ov Sizing 0 0
Adj Air Trans Heat 0 0 0 0 0 Adj Air Trans Heat 0 0 0Leakage Ups
Leakage Dwn
237 237Infil
AHU Vent
Nom Vent
Main FanTerminal
Adjacent Floor
Diffuser
Supply Air Leakage
Underflr Sup Ht Pkup Underflr Sup Ht Pkup
Adjacent Floor 0 0 0 0
0 0
0 0 0
0 0
0 0 0 0
0 0.00
0 0.00
1,049
1,049 1,049
0
0
0
0
0
315
315 315
0
0
0
0
0
0 2,450 0
Int Door 0
Ext Door 0 0 0
TRACE® 700 v6.3.1 calculated at 01:49 PM on 01/29/2016Project Name:
Dataset Name: Alternative - 1 System Checksums Report Page 8 of 8SOULS HARBOUR - JANUARY22.TRC

Building U-Values

BUILDING U-FACTORSBy MACPHERSON ENGINEERING INC.
Btu/h·ft²·°F Room RoomROOM U-FACTORSExposed Summer Winter Summer Winter Mass Capacitance
Description Partition Floor Skylight Skylight Roof Window WallWindow Ceiling lb/ft² Btu/lb·°FDoor
ExternalInternal
Door
Alternative 1
0.000 0.000 0.000 0.000 0.950 0.067 0.962 0.050 0.317 39.5 8.8FIRST - Reception - Zone 0.000 0.000
0.000 0.000 0.000 0.000 0.950 0.067 0.962 0.050 0.317 51.2 11.1FIRST - Staff Room - Zone 0.000 0.000
0.000 0.000 0.000 0.000 0.950 0.067 0.962 0.050 0.317 42.6 9.4FIRST - Office #1 - Zone 0.000 0.000
0.000 0.000 0.000 0.000 0.950 0.067 0.962 0.050 0.317 43.3 9.6FIRST - Office #2 - Zone 0.000 0.000
0.000 0.000 0.000 0.000 0.950 0.067 0.962 0.050 0.317 43.2 9.5FIRST - Office #3 - Zone 0.000 0.000
0.000 0.000 0.000 0.000 0.950 0.067 0.962 0.050 0.317 42.5 9.4FIRST - Office W/C - Zone 0.000 0.000
0.000 0.000 0.000 0.000 0.950 0.067 0.962 0.050 0.317 42.9 9.5VAV-OFFICE - System 0.000 0.000
0.000 0.000 0.000 0.000 0.000 0.067 0.000 0.000 0.317 28.2 5.6FIRST - Boys W/C - Zone 0.000 0.000
0.000 0.000 0.000 0.000 0.000 0.067 0.000 0.000 0.317 34.6 6.9FIRST - Handicap W/C - Zone 0.000 0.000
0.000 0.000 0.000 0.000 0.000 0.000 0.000 0.000 0.317 13.3 2.7FIRST - Girls W/C - Zone 0.000 0.000
0.000 0.000 0.000 0.000 0.000 0.000 0.000 0.000 0.317 13.3 2.7FIRST - Day Care Hallway - Zone 0.000 0.000
0.000 0.000 0.000 0.000 0.000 0.067 0.000 0.000 0.317 31.5 6.3FIRST - Office/Storage - Zone 0.000 0.000
0.000 0.000 0.000 0.000 0.950 0.067 0.962 0.050 0.317 45.5 10.0FIRST - Day Care - Zone 0.000 0.000
0.000 0.000 0.000 0.000 0.000 0.067 0.000 0.000 0.317 38.0 7.6FIRST - Nursery W/C - Zone 0.000 0.000
0.000 0.000 0.000 0.000 0.950 0.067 0.962 0.050 0.317 48.3 10.6FIRST - Nursery - Zone 0.000 0.000
0.000 0.000 0.000 0.000 0.950 0.067 0.962 0.050 0.317 42.1 9.3FIRST - Day Care Entrance - Zone 0.000 0.000
0.000 0.000 0.000 0.000 0.950 0.067 0.962 0.050 0.317 43.1 9.4VAV - DAYCARE - System 0.000 0.000
0.000 0.000 0.000 0.000 0.950 0.067 0.962 0.050 0.317 41.8 9.3BASEMENT - Stage - Zone 0.000 0.000
0.000 0.000 0.950 0.962 0.000 0.000 0.000 0.050 0.317 30.8 7.0BASEMENT - Gymnasium - Zone 0.000 0.000
0.000 0.000 0.000 0.000 0.950 0.067 0.962 0.050 0.317 44.5 9.8BASEMENT - Office #2 - Zone 0.000 0.000
0.000 0.000 0.000 0.000 0.950 0.067 0.962 0.050 0.317 40.8 9.1BASEMENT - Office #3 - Zone 0.000 0.000
0.000 0.000 0.000 0.000 0.950 0.067 0.962 0.050 0.317 45.0 9.9BASEMENT - Office #4 - Zone 0.000 0.000
0.000 0.000 0.000 0.000 0.950 0.067 0.962 0.050 0.317 43.2 9.5BASEMENT - Office #5 - Zone 0.000 0.000
0.000 0.000 0.000 0.000 0.950 0.067 0.962 0.050 0.317 44.8 9.9BASEMENT - Office #6 - Zone 0.000 0.000
0.000 0.000 0.000 0.000 0.950 0.067 0.962 0.050 0.317 45.3 10.0BASEMENT - Office #7 - Zone 0.000 0.000
0.000 0.000 0.000 0.000 0.000 0.067 0.000 0.050 0.317 46.0 10.1BASEMENT - Storage #4 - Zone 0.000 0.000
0.000 0.000 0.000 0.000 0.000 0.067 0.000 0.050 0.317 52.4 11.4BASEMENT - Spare Room - Zone 0.000 0.000
0.000 0.000 0.000 0.000 0.000 0.067 0.000 0.000 0.317 26.8 5.4BASEMENT - Spare Room #2 - Zone 0.000 0.000
0.000 0.000 0.000 0.000 0.950 0.067 0.962 0.000 0.317 17.7 3.5BASEMENT - Office #8 - Zone 0.000 0.000
0.000 0.000 0.000 0.000 0.950 0.067 0.962 0.000 0.317 17.3 3.5BASEMENT - Office #9 - Zone 0.000 0.000
0.000 0.000 0.000 0.000 0.950 0.067 0.962 0.000 0.317 17.5 3.5BASEMENT - Office #10 - Zone 0.000 0.000
Project Name: TRACE® 700 v6.3.1 calculated at 01:49 PM on 01/29/2016
Dataset Name: SOULS HARBOUR - JANUARY22.TRC Building U-Factors Report Page 1 of 3

BUILDING U-FACTORSBy MACPHERSON ENGINEERING INC.
Btu/h·ft²·°F Room RoomROOM U-FACTORSExposed Summer Winter Summer Winter Mass Capacitance
Description Partition Floor Skylight Skylight Roof Window WallWindow Ceiling lb/ft² Btu/lb·°FDoor
ExternalInternal
Door
0.000 0.000 0.000 0.000 0.950 0.067 0.962 0.000 0.317 17.0 3.4BASEMENT - Office #11 - Zone 0.000 0.000
0.000 0.000 0.000 0.000 0.950 0.067 0.962 0.000 0.317 16.9 3.4BASEMENT - Mens Changroom - Zone 0.000 0.000
0.000 0.000 0.000 0.000 0.950 0.067 0.962 0.000 0.317 17.5 3.5BASEMENT - Womens Changroom - Zone 0.000 0.000
0.000 0.000 0.000 0.000 0.000 0.067 0.000 0.000 0.317 17.9 3.6BASEMENT - Shower - Zone 0.000 0.000
0.000 0.000 0.000 0.000 0.000 0.067 0.000 0.000 0.317 37.2 7.4BASEMENT - Office #12 - Zone 0.000 0.000
0.000 0.000 0.000 0.000 0.000 0.067 0.000 0.000 0.317 25.5 5.1BASEMENT - Office #13 - Zone 0.000 0.000
0.000 0.000 0.000 0.000 0.950 0.067 0.962 0.000 0.317 17.4 3.5BASEMENT - Canteen - Zone 0.000 0.000
0.000 0.000 0.950 0.962 0.950 0.067 0.962 0.050 0.317 32.6 7.2VAV - GYMNASIUM - System 0.000 0.000
0.000 0.000 0.000 0.000 0.950 0.067 0.962 0.050 0.317 48.6 10.6FIRST - Front Entrance - Zone 0.200 0.000
0.000 0.000 0.000 0.000 0.000 0.067 0.000 0.000 0.317 17.3 3.5BASEMENT - Hallway - Zone 0.000 0.000
0.000 0.000 0.000 0.000 0.950 0.067 0.962 0.050 0.317 24.4 5.1VAV - FRONT ENTRANCE (SW) - System 0.200 0.000
0.000 0.000 0.000 0.000 0.950 0.067 0.962 0.050 0.317 59.8 12.9FIRST - Back Fire Exit - Zone 0.200 0.000
0.000 0.000 0.000 0.000 0.950 0.067 0.962 0.050 0.317 59.8 12.9VAV - ENTRANCE (NW) - System 0.200 0.000
0.000 0.000 0.000 0.000 0.000 0.067 0.000 0.050 0.317 79.1 16.7BASEMENT - Fire Exit - Zone 0.200 0.000
0.000 0.000 0.000 0.000 0.000 0.067 0.000 0.050 0.317 79.1 16.7VAV - BACK EXIT (NE) - System 0.200 0.000
0.000 0.000 0.000 0.000 0.950 0.067 0.962 0.050 0.317 32.1 7.3BASEMENT - MAIN ENTRANCE - Zone 0.200 0.000
0.000 0.000 0.000 0.000 0.000 0.067 0.000 0.000 0.317 24.7 4.9BASEMENT - Entrance - Zone 0.000 0.000
0.000 0.000 0.000 0.000 0.950 0.067 0.962 0.050 0.317 28.3 6.1VAV - FRONT ENTRANCE (S) - System 0.200 0.000
0.000 0.000 0.000 0.000 0.950 0.067 0.962 0.000 0.317 16.2 3.2BASEMENT - Office #1 - Zone 0.000 0.000
0.000 0.000 0.000 0.000 0.950 0.067 0.962 0.000 0.317 16.3 3.3BASEMENT - Kitchen - Zone 0.000 0.000
0.000 0.000 0.000 0.000 0.950 0.067 0.962 0.000 0.317 16.0 3.2BASEMENT - Mens W/C #1 - Zone 0.000 0.000
0.000 0.000 0.000 0.000 0.950 0.067 0.962 0.000 0.317 16.2 3.2BASEMENT - Womens W/C #1 - Zone 0.000 0.000
0.000 0.000 0.000 0.000 0.000 0.067 0.000 0.000 0.317 22.4 4.5BASEMENT - Storage #1 - Zone 0.000 0.000
0.000 0.000 0.000 0.000 0.000 0.067 0.000 0.000 0.317 19.5 3.9BASEMENT - Hallway #2 - Zone 0.000 0.000
0.000 0.000 0.000 0.000 0.000 0.067 0.000 0.000 0.317 18.8 3.8BASEMENT - Boiler Room - Zone 0.200 0.000
0.000 0.000 0.000 0.000 0.000 0.000 0.000 0.000 0.317 13.3 2.7BASEMENT - Computer Room - Zone 0.000 0.000
0.000 0.000 0.000 0.000 0.000 0.000 0.000 0.000 0.317 13.3 2.7BASEMENT - Storage #2 - Zone 0.000 0.000
0.000 0.000 0.000 0.000 0.000 0.000 0.000 0.000 0.317 13.3 2.7BASEMENT - Multi Purpose - Zone 0.000 0.000
0.000 0.000 0.000 0.000 0.000 0.000 0.000 0.000 0.317 13.3 2.7BASEMENT - Storage #3 - Zone 0.000 0.000
0.000 0.000 0.000 0.000 0.950 0.067 0.962 0.000 0.317 15.0 3.0VAV - BASEMENT - System 0.200 0.000
Project Name: TRACE® 700 v6.3.1 calculated at 01:49 PM on 01/29/2016
Dataset Name: SOULS HARBOUR - JANUARY22.TRC Building U-Factors Report Page 2 of 3

BUILDING U-FACTORSBy MACPHERSON ENGINEERING INC.
Btu/h·ft²·°F Room RoomROOM U-FACTORSExposed Summer Winter Summer Winter Mass Capacitance
Description Partition Floor Skylight Skylight Roof Window WallWindow Ceiling lb/ft² Btu/lb·°FDoor
ExternalInternal
Door
Roof Btu/h·ft²·°F 0.056
Wall Btu/h·ft²·°F 0.142
Building Btu/h·ft²·°F 0.096
Roof (OTTVr) Btu/hr·ft² 3.52
Wall (OTTVw) Btu/hr·ft² 12.93
Overall U-Factors Overall Thermal Transfer Values
Project Name: TRACE® 700 v6.3.1 calculated at 01:49 PM on 01/29/2016
Dataset Name: SOULS HARBOUR - JANUARY22.TRC Building U-Factors Report Page 3 of 3

Peak Cooling Load

PEAK COOLING LOADS
MAIN SYSTEM
By MACPHERSON ENGINEERING INC.
SPACE COIL
SpaceSpaceRoom Supply Space OA
CoilSupply
CoilCoil
Floor Peak LatentSensibleAir Peak Condition Sensible Latent
Area Time LoadLoadBulb Bulb Flow Time DB AirflowDry Bulb Load Load
System ft² Mo/Hr Btu/hBtu/h°F °F cfm Mo/Hr °F Btu/hBtu/hcfm°F
WB
°F
OA
°F °F
WBDB
Condition Dry Dry
Zone Room
Alternative 1 120 16 67 1,676 250 59.4 103 75.0 7 68 59.4 4037 / 87 100 87/14PeakFIRST - Boys W/C 1,651
4,522 16 67 87,966 9,536 59.4 5,426 75.0 7 68 59.4 13,1077 / 87 5,347 88/15PeakFIRST - Day Care 100,045
369 15 68 7,889 941 59.4 487 75.0 7 68 59.4 9417 / 88 487 88/15PeakFIRST - Day Care Entrance 9,086
133 19 53 1,239 166 59.4 76 75.0 7 68 59.4 1666 / 66 74 87/14PeakFIRST - Day Care Hallway 1,301
95 19 53 885 119 59.4 55 75.0 7 68 59.4 1196 / 66 53 87/14PeakFIRST - Girls W/C 929
66 15 68 1,050 233 59.4 65 75.0 7 68 59.4 2827 / 88 62 87/14PeakFIRST - Handicap W/C 1,019
310 15 68 6,610 988 59.4 408 75.0 7 68 59.4 9887 / 88 408 88/15PeakFIRST - Nursery 7,578
31 14 68 567 147 59.4 35 75.0 7 68 59.4 1477 / 87 35 87/14PeakFIRST - Nursery W/C 583
210 15 68 3,252 674 59.4 201 75.0 7 68 59.4 8067 / 88 199 87/14PeakFIRST - Office/Storage 3,317
5,856 67 111,133 13,056 59.4 6,855 75.0 68 59.4 16,959 87 6,764 88 Peak 125,509VAV - DAYCARE
5,856 16 67 110,805 12,203 59.4 6,835 75.0 7 68 59.4 16,6927 / 87 6,773 88/15Block 125,564VAV - DAYCARE
100 15 68 2,567 665 55.4 126 75.0 7 68 55.4 8417 / 88 121 87/14PeakBASEMENT - Fire Exit 2,661
100 68 2,567 665 55.4 126 75.0 68 55.4 841 88 121 87 Peak 2,661VAV - BACK EXIT (NE)
100 15 68 2,567 665 55.4 126 75.0 7 68 55.4 8417 / 88 121 87/14Block 2,661VAV - BACK EXIT (NE)
808 15 68 8,696 1,518 58.9 521 75.0 7 68 58.9 1,6807 / 88 514 87/14PeakBASEMENT - Boiler Room 9,226
597 19 12 5,336 746 58.9 320 75.0 7 68 58.9 7462 / 13 318 87/14PeakBASEMENT - Computer Room 5,840
100 15 68 1,087 192 58.9 65 75.0 7 68 58.9 2137 / 88 64 87/14PeakBASEMENT - Hallway #2 1,151
413 18 63 4,582 356 58.9 275 75.0 7 65 58.9 4897 / 82 272 85/17PeakBASEMENT - Kitchen 4,929
221 18 63 2,411 199 58.9 144 75.0 7 65 58.9 2637 / 82 143 85/17PeakBASEMENT - Mens W/C #1 2,597
2,744 19 12 24,528 3,430 58.9 1,469 75.0 7 68 58.9 3,4302 / 13 1,461 87/14PeakBASEMENT - Multi Purpose 26,843
606 18 63 6,662 532 58.9 399 75.0 7 65 58.9 7197 / 82 396 85/17PeakBASEMENT - Office #1 7,173
110 16 67 1,305 194 58.9 78 75.0 7 68 58.9 2467 / 87 78 88/15PeakBASEMENT - Storage #1 1,391
110 19 12 983 138 58.9 59 75.0 7 68 58.9 1382 / 13 59 87/14PeakBASEMENT - Storage #2 1,076
86 19 12 769 108 58.9 46 75.0 7 68 58.9 1082 / 13 46 87/14PeakBASEMENT - Storage #3 841
221 18 63 2,428 193 58.9 145 75.0 7 65 58.9 2627 / 82 144 85/17PeakBASEMENT - Womens W/C #1 2,616
6,016 65 58,788 7,606 58.9 3,522 75.0 68 58.9 8,295 85 3,494 88 Peak 63,684VAV - BASEMENT
6,016 17 65 58,193 7,295 58.9 3,486 75.0 7 68 58.9 8,6777 / 85 3,456 88/15Block 62,963VAV - BASEMENT
258 15 68 5,243 1,163 56.3 271 75.0 7 68 56.3 1,1637 / 88 271 88/15PeakFIRST - Back Fire Exit 5,865
258 68 5,243 1,163 56.3 271 75.0 68 56.3 1,163 88 271 88 Peak 5,865VAV - ENTRANCE (NW)
258 15 68 5,243 1,163 56.3 271 75.0 7 68 56.3 1,1637 / 88 271 88/15Block 5,865VAV - ENTRANCE (NW)
294 15 68 4,017 2,587 55.0 194 75.0 7 68 55.0 2,5877 / 88 194 88/15PeakBASEMENT - Entrance 4,425
275 15 47 31,157 926 55.0 1,503 75.0 8 65 55.0 3,45610 / 57 1,420 78/15PeakBASEMENT - MAIN ENTRANCE 30,275
569 47 35,174 3,514 55.0 1,696 75.0 65 55.0 6,043 57 1,614 78 Peak 34,700VAV - FRONT ENTRANCE (S)
569 15 47 32,980 1,731 55.0 1,591 75.0 8 65 55.0 6,15810 / 57 1,581 78/15Block 34,042VAV - FRONT ENTRANCE (S)
Project Name: TRACE® 700 v6.3.1 calculated at 01:49 PM on 01/29/2016
Dataset Name: SOULS HARBOUR - JANUARY22.TRC Peak Clg Loads Main System Report Page 1 of 2

SPACE COIL
SpaceSpaceRoom Supply Space OA
CoilSupply
CoilCoil
Floor Peak LatentSensibleAir Peak Condition Sensible Latent
Area Time LoadLoadBulb Bulb Flow Time DB AirflowDry Bulb Load Load
System ft² Mo/Hr Btu/hBtu/h°F °F cfm Mo/Hr °F Btu/hBtu/hcfm°F
WB
°F
OA
°F °F
WBDB
Condition Dry Dry
Zone Room
808 15 68 8,583 2,058 55.0 414 75.0 7 68 55.0 2,0587 / 88 414 88/15PeakBASEMENT - Hallway 9,336
240 19 60 22,068 457 55.0 1,064 75.0 7 63 55.0 1,0487 / 79 1,044 82/18PeakFIRST - Front Entrance 22,739
1,048 60 30,651 2,515 55.0 1,478 75.0 63 55.0 3,106 79 1,458 82 Peak 32,075VAV - FRONT ENTRANCE (SW)
1,048 19 60 29,763 1,532 55.0 1,436 75.0 7 63 55.0 2,3697 / 79 1,432 82/18Block 31,594VAV - FRONT ENTRANCE (SW)
123 15 68 1,795 214 58.9 108 75.0 7 68 58.9 2147 / 88 108 88/15PeakBASEMENT - Canteen 1,857
4,447 16 60 58,227 5,559 58.9 3,491 75.0 7 65 58.9 5,5596 / 73 3,440 85/17PeakBASEMENT - Gymnasium 73,561
129 12 66 2,030 202 58.9 122 75.0 7 66 58.9 2027 / 82 122 82/12PeakBASEMENT - Mens Changroom 2,143
150 12 66 2,271 241 58.9 136 75.0 7 66 58.9 2417 / 82 136 82/12PeakBASEMENT - Office #10 2,402
172 12 66 2,468 268 58.9 148 75.0 7 66 58.9 2687 / 82 148 82/12PeakBASEMENT - Office #11 2,617
245 15 68 4,637 938 58.9 278 75.0 7 68 58.9 1,1397 / 88 271 87/14PeakBASEMENT - Office #12 4,615
196 14 68 2,689 583 58.9 161 75.0 7 68 58.9 5837 / 87 161 87/14PeakBASEMENT - Office #13 2,779
257 12 66 7,702 617 58.9 462 75.0 7 66 58.9 6177 / 82 462 82/12PeakBASEMENT - Office #2 8,180
172 12 66 8,628 403 58.9 517 75.0 7 66 58.9 4037 / 82 517 82/12PeakBASEMENT - Office #3 8,947
150 12 66 4,151 362 58.9 249 75.0 7 67 58.9 4657 / 82 242 85/13PeakBASEMENT - Office #4 4,364
172 12 66 4,359 390 58.9 261 75.0 7 67 58.9 4927 / 82 254 85/13PeakBASEMENT - Office #5 4,618
129 13 67 2,248 374 58.9 135 75.0 7 68 58.9 4227 / 85 134 87/14PeakBASEMENT - Office #6 2,562
150 13 67 2,569 443 58.9 154 75.0 7 68 58.9 5007 / 85 154 87/14PeakBASEMENT - Office #7 2,941
257 12 66 3,385 411 58.9 203 75.0 7 66 58.9 4117 / 82 203 82/12PeakBASEMENT - Office #8 3,611
172 12 66 2,485 272 58.9 149 75.0 7 66 58.9 2727 / 82 149 82/12PeakBASEMENT - Office #9 2,635
86 15 68 939 150 58.9 56 75.0 7 68 58.9 1637 / 88 56 87/14PeakBASEMENT - Shower 983
318 15 68 5,700 1,127 58.9 342 75.0 7 68 58.9 1,1277 / 88 342 88/15PeakBASEMENT - Spare Room 6,588
245 15 68 3,702 661 58.9 222 75.0 7 68 58.9 7757 / 88 214 87/14PeakBASEMENT - Spare Room #2 3,695
1,029 15 68 15,410 2,573 58.9 924 75.0 7 68 58.9 2,5737 / 88 924 88/15PeakBASEMENT - Stage 18,173
86 14 68 1,265 290 58.9 76 75.0 7 68 58.9 2907 / 87 76 87/14PeakBASEMENT - Storage #4 1,479
150 12 66 1,902 237 58.9 114 75.0 7 67 58.9 2657 / 82 114 85/13PeakBASEMENT - Womens Changroom 2,009
8,835 68 138,564 16,316 58.9 8,308 75.0 68 58.9 16,981 88 8,227 88 Peak 160,761VAV - GYMNASIUM
8,835 15 68 133,236 16,705 58.9 7,989 75.0 7 68 58.9 16,7057 / 88 7,989 88/15Block 154,923VAV - GYMNASIUM
270 19 60 6,823 220 55.0 329 75.0 7 63 55.0 4917 / 79 329 82/18PeakFIRST - Office #1 7,739
149 18 63 2,785 270 55.0 134 75.0 7 65 55.0 4677 / 82 131 85/17PeakFIRST - Office #2 3,210
135 18 63 2,772 245 55.0 134 75.0 7 65 55.0 4267 / 82 129 85/17PeakFIRST - Office #3 3,119
68 18 63 1,101 120 55.0 53 75.0 7 65 55.0 2027 / 82 53 85/17PeakFIRST - Office W/C 1,317
258 18 63 4,948 427 55.0 239 75.0 7 65 55.0 6737 / 82 229 85/17PeakFIRST - Reception 5,612
100 18 63 3,337 222 55.0 161 75.0 7 65 55.0 4527 / 82 151 85/17PeakFIRST - Staff Room 3,449
980 63 21,766 1,504 55.0 1,050 75.0 65 55.0 2,712 82 1,022 85 Peak 24,446VAV-OFFICE
980 18 63 21,754 1,775 55.0 1,049 75.0 7 65 55.0 3,0737 / 82 1,003 85/17Block 24,017VAV-OFFICE
Project Name: TRACE® 700 v6.3.1 calculated at 01:49 PM on 01/29/2016
Dataset Name: SOULS HARBOUR - JANUARY22.TRC Peak Clg Loads Main System Report Page 2 of 2

Peak Heating Load

PEAK HEATING LOADS
MAIN SYSTEM
By MACPHERSON ENGINEERING INC.
SPACE COIL
CoilCoilSupplySpaceSpaceSupplyRoom
SensibleAirDryFloor SensibleAirDryDry
LoadFlowBulbArea LoadFlowBulbBulb
System Btu/hcfm°Fft² Btu/hcfm°F°F
OA Condition
DB
°F
WB
°FPeak Time
Htg Design -33 -34
Zone Room
Block
or
Peak
Alternative 1 0 -4,762 70.0 120 70.0 31 -4,420 70.0PeakFIRST - Boys W/C
0 -214,707 70.0 4,522 70.0 1,628 -196,755 70.0PeakFIRST - Day Care
0 -15,179 70.0 369 70.0 146 -13,569 70.0PeakFIRST - Day Care Entrance
0 -493 70.0 133 70.0 23 -240 70.0PeakFIRST - Day Care Hallway
0 -352 70.0 95 70.0 16 -172 70.0PeakFIRST - Girls W/C
0 -3,636 70.0 66 70.0 19 -3,421 70.0PeakFIRST - Handicap W/C
0 -16,453 70.0 310 70.0 122 -15,104 70.0PeakFIRST - Nursery
0 -1,973 70.0 31 70.0 10 -1,857 70.0PeakFIRST - Nursery W/C
0 -10,049 70.0 210 70.0 60 -9,385 70.0PeakFIRST - Office/Storage
0 -267,604 70.0 5,856 70.0 2,057 -244,924 70.0Peak VAV - DAYCARE
0 -267,604 70.0 5,856 70.0 2,057 -244,924 70.0Block VAV - DAYCARE
0 -13,115 70.0 100 70.0 38 -12,541 70.0PeakBASEMENT - Fire Exit
0 -13,115 70.0 100 70.0 38 -12,541 70.0Peak VAV - BACK EXIT (NE)
0 -13,115 70.0 100 70.0 38 -12,541 70.0Block VAV - BACK EXIT (NE)
0 -13,222 70.0 808 70.0 156 -11,423 70.0PeakBASEMENT - Boiler Room
0 -1,158 70.0 597 70.0 96 -54 70.0PeakBASEMENT - Computer Room
0 -1,697 70.0 100 70.0 20 -1,473 70.0PeakBASEMENT - Hallway #2
0 -4,353 70.0 413 70.0 82 -3,405 70.0PeakBASEMENT - Kitchen
0 -2,146 70.0 221 70.0 43 -1,647 70.0PeakBASEMENT - Mens W/C #1
0 -5,323 70.0 2,744 70.0 441 -250 70.0PeakBASEMENT - Multi Purpose
0 -6,167 70.0 606 70.0 120 -4,789 70.0PeakBASEMENT - Office #1
0 -2,644 70.0 110 70.0 23 -2,374 70.0PeakBASEMENT - Storage #1
0 -214 70.0 110 70.0 18 -10 70.0PeakBASEMENT - Storage #2
0 -167 70.0 86 70.0 14 -8 70.0PeakBASEMENT - Storage #3
0 -2,262 70.0 221 70.0 44 -1,760 70.0PeakBASEMENT - Womens W/C #1
0 -39,353 70.0 6,016 70.0 1,057 -27,194 70.0Peak VAV - BASEMENT
0 -39,353 70.0 6,016 70.0 1,057 -27,193 70.0Block VAV - BASEMENT
0 -21,423 70.0 258 70.0 81 -20,272 70.0PeakFIRST - Back Fire Exit
0 -21,423 70.0 258 70.0 81 -20,272 70.0Peak VAV - ENTRANCE (NW)
0 -21,423 70.0 258 70.0 81 -20,272 70.0Block VAV - ENTRANCE (NW)
0 -8,977 70.0 294 70.0 58 -8,074 70.0PeakBASEMENT - Entrance
0 -39,259 70.0 275 70.0 451 -32,249 70.0PeakBASEMENT - MAIN ENTRANCE
0 -48,237 70.0 569 70.0 509 -40,322 70.0Peak VAV - FRONT ENTRANCE (S)
Project Name: TRACE® 700 v6.3.1 calculated at 01:49 PM on 01/29/2016
Dataset Name: SOULS HARBOUR - JANUARY22.TRC Peak Htg Loads Main System Report Page 1 of 2

SPACE COIL
CoilCoilSupplySpaceSpaceSupplyRoom
SensibleAirDryFloor SensibleAirDryDry
LoadFlowBulbArea LoadFlowBulbBulb
System Btu/hcfm°Fft² Btu/hcfm°F°F
OA Condition
DB
°F
WB
°FPeak Time
Htg Design -33 -34
Zone Room
Block
or
Peak
0 -48,237 70.0 569 70.0 509 -40,322 70.0Block VAV - FRONT ENTRANCE (S)
0 -9,960 70.0 808 70.0 124 -8,029 70.0PeakBASEMENT - Hallway
0 -37,950 70.0 240 70.0 319 -32,985 70.0PeakFIRST - Front Entrance
0 -47,910 70.0 1,048 70.0 443 -41,014 70.0Peak VAV - FRONT ENTRANCE (SW)
0 -47,910 70.0 1,048 70.0 443 -41,014 70.0Block VAV - FRONT ENTRANCE (SW)
0 -2,327 70.0 123 70.0 32 -1,956 70.0PeakBASEMENT - Canteen
0 -22,094 70.0 4,447 70.0 1,047 -10,055 70.0PeakBASEMENT - Gymnasium
0 -2,585 70.0 129 70.0 37 -2,165 70.0PeakBASEMENT - Mens Changroom
0 -3,076 70.0 150 70.0 41 -2,606 70.0PeakBASEMENT - Office #10
0 -3,166 70.0 172 70.0 44 -2,656 70.0PeakBASEMENT - Office #11
0 -15,323 70.0 245 70.0 83 -14,364 70.0PeakBASEMENT - Office #12
0 -6,609 70.0 196 70.0 48 -6,053 70.0PeakBASEMENT - Office #13
0 -15,132 70.0 257 70.0 139 -13,540 70.0PeakBASEMENT - Office #2
0 -13,412 70.0 172 70.0 155 -11,628 70.0PeakBASEMENT - Office #3
0 -8,540 70.0 150 70.0 75 -7,682 70.0PeakBASEMENT - Office #4
0 -8,633 70.0 172 70.0 78 -7,731 70.0PeakBASEMENT - Office #5
0 -5,474 70.0 129 70.0 40 -5,009 70.0PeakBASEMENT - Office #6
0 -6,451 70.0 150 70.0 46 -5,919 70.0PeakBASEMENT - Office #7
0 -4,730 70.0 257 70.0 61 -4,030 70.0PeakBASEMENT - Office #8
0 -3,301 70.0 172 70.0 45 -2,787 70.0PeakBASEMENT - Office #9
0 -1,308 70.0 86 70.0 17 -1,114 70.0PeakBASEMENT - Shower
0 -17,865 70.0 318 70.0 103 -16,687 70.0PeakBASEMENT - Spare Room
0 -9,087 70.0 245 70.0 67 -8,322 70.0PeakBASEMENT - Spare Room #2
0 -39,194 70.0 1,029 70.0 277 -36,007 70.0PeakBASEMENT - Stage
0 -3,477 70.0 86 70.0 23 -3,215 70.0PeakBASEMENT - Storage #4
0 -2,589 70.0 150 70.0 34 -2,195 70.0PeakBASEMENT - Womens Changroom
0 -194,373 70.0 8,835 70.0 2,492 -165,723 70.0Peak VAV - GYMNASIUM
0 -194,373 70.0 8,835 70.0 2,492 -165,723 70.0Block VAV - GYMNASIUM
0 -12,697 70.0 270 70.0 99 -11,162 70.0PeakFIRST - Office #1
0 -5,989 70.0 149 70.0 40 -5,363 70.0PeakFIRST - Office #2
0 -5,718 70.0 135 70.0 40 -5,094 70.0PeakFIRST - Office #3
0 -2,404 70.0 68 70.0 16 -2,157 70.0PeakFIRST - Office W/C
0 -8,561 70.0 258 70.0 72 -7,448 70.0PeakFIRST - Reception
0 -7,497 70.0 100 70.0 48 -6,747 70.0PeakFIRST - Staff Room
0 -42,867 70.0 980 70.0 315 -37,970 70.0Peak VAV-OFFICE
0 -42,867 70.0 980 70.0 315 -37,970 70.0Block VAV-OFFICE
Project Name: TRACE® 700 v6.3.1 calculated at 01:49 PM on 01/29/2016
Dataset Name: SOULS HARBOUR - JANUARY22.TRC Peak Htg Loads Main System Report Page 2 of 2

APPENDIX D TRACE700 CALCULATIONS

The first step to confirming the TRACE 700 simulation outputs is calculating the measure of energy within the system. This measurement will include the internal energy, and the amount of energy that the facility requires to make room for the incoming energy through the displacement of its environment. To begin, the total heat leakage equation, along with the specific enthalpy equations for windows, doors, walls, and the roof can be found below: (ASHRAE, 2013)
Total Heat Leakage (Enthalpy, ):hrBTU
Windows & Doors: ∙A(t ) ∙SC∙SHGFH = U o − ti + A [1]
Walls & Roof: ∙A(t )H = U o − ti [2]
The below sensible heat calculation can be used to verify that the simulated data is reasonable to use throughout the energy analysis of Little Souls Daycare. The below data has been taken from the single pane office glass and doors found in Appendix C.
.962∙(68ft )∙(70 − 3)) ∙SC∙SHGFH hrBTU = 0 2 − ( 3 + 68ft2
Since there are windows on the West side, choose worst HGF 1S = 4 BTUhr∙f t2
Assume no shading: C .00S = 1
.962∙(68ft )∙(103) ∙1.00∙41H hrBTU = 0 2 + 68ft2
525.85H hrBTU = 9
It should be noted that the program simulation does not account for SC or SHGF, which is a reasonable assumption. As such, the program simulation outputs a value of . When repeating the772H hr
BTU = 6 previous sensible heat calculation without accounting for SC or SHGF, the value is:
.962∙(68ft )∙(103)H hrBTU = 0 2
737.85 H hrBTU = 6
This value is within 0.006% of the simulated value, and therefore the simulated data can be used as a reasonable representation of the physical system.
The below sensible heat calculation can be used to verify that the simulated data is reasonable to use throughout the energy analysis of Little Souls Daycare.
.605∙(68ft )∙(70 − 3)) ∙SC∙SHGFH hrBTU = 0 2 − ( 3 + 68ft2
Since there are windows on the West side, choose worst HGF 1S = 4 BTUhr∙f t2
Assume no shading: C .00S = 1

.605∙(68ft )∙(103) ∙1.00∙41H hrBTU = 0 2 + 68ft2
025.42H hrBTU = 7
It should be noted that the program simulation does not account for SC or SHGF, which is a reasonable assumption. As such, the program simulation outputs a value of . When repeating the256H hr
BTU = 4 previous sensible heat calculation without accounting for SC or SHGF, the value is:
.605∙(68ft )∙(103)H hrBTU = 0 2
4237.42H hrBTU =
This value is within 0.437% of the simulated value, and therefore the simulated data can be used as a reasonable representation of the physical system.
The below sensible heat calculation can be used to verify that the simulated data is reasonable to use throughout the energy analysis of Little Souls Daycare.
.281∙(68ft )∙(70 − 3)) ∙SC∙SHGFH hrBTU = 0 2 − ( 3 + 68ft2
Since there are windows on the West side, choose worst HGF 1S = 4 BTUhr∙f t2
Assume no shading: C .00S = 1
.281∙(68ft )∙(103) ∙1.00∙41H hrBTU = 0 2 + 68ft2
756.12H hrBTU = 4
It should be noted that the program simulation does not account for SC or SHGF, which is a reasonable assumption. As such, the program simulation outputs a value of . When repeating the978H hr
BTU = 1 previous sensible heat calculation without accounting for SC or SHGF, the value is:
.281∙(68ft )∙(103)H hrBTU = 0 2
1968.12H hrBTU =
This value is within 0.499% of the simulated value, and therefore the simulated data can be used as a reasonable representation of the physical system.
The above calculation verifications prove that the outputs generated by the TRACE 700 software system are accurate and coincide with the values calculated using equations found in textbooks (Harris, 1983). The enthalpy values, given in BTU/hr (British Thermal Units per hour), were calculated using the basic equation provided by the textbook. Total enthalpy, in terms of air conditioning or heating an indoor space, is given by the total sensible heat summed with the total latent heat. Sensible heat, as defined by Harris, is “heat which, when supplied to or removed from a substance, produces temperature which is measurable by a thermometer” (Harris, 1983). In other words, sensible heat is heat that can be physically measured

and felt by human touch. In contrast, latent heat as defined by Harris, is “heat which, when supplied to or removed from a substance, produces a change of state without any change in temperature” (Harris, 1983). Therefore, latent heat can be described as the heat required to change the state of water from liquid to gas, or solid to liquid. This occurrence can be seen through experimental means.

APPENDIX E - LIST OF
ALTERNATIVES

The complete list of alternatives is provided below. These alternatives include the implementation of the
suggested HVAC system for the entire building system (not broken into zones). However, the cost of
implementing a HVAC system for each individual ‘zone’ is given above in the cost analysis portion of the
report. A priority list for implementation is presented in section 7.2 of the report, and provides a
recommended plan of action for Souls Harbour, Dean Smith Youth Center.
Alternative Options Included Approximate
Total Cost
1. Mid-Efficiency HVAC
system
Mid-efficiency roof-top units; includes all
necessary ductwork, materials, labor and
installation; less structural improvements to
roof supports (if required)
$218,798.34
2. Mid-Efficiency HVAC
system with Window
Upgrades
Same as alternative (1); includes upgrades to
all single-pane windows to triple-pane low-e
windows
$253,198.34
3. Mid-Efficiency HVAC
system with Insulation
Upgrades
Same as alternative (1); includes upgrades to
insulation along grade wall and other areas
identified by infrared scanning
$234,698.34
4. Mid-Efficiency HVAC
system with Skylight
Upgrades
Same as alternative (1); includes sealing,
insulating and covering of skylights in
gymnasium area
$219,298.34
5. Mid-Efficiency HVAC
system with Window
and Insulation Upgrades
Alternative (2) and (3) combined $269,098.34
6. Mid-Efficiency HVAC
System with Window
and Skylight Upgrades
Alternative (2) and (4) combined $253,698.34
7. Mid-Efficiency HVAC
System with Insulation
and Skylight Upgrades
Alternative (3) and (4) combined
$235,198.34

8. Mid-Efficiency HVAC
System with All
Upgrades
Alternative (2), (3) and (4) combined $269,598.34
9. High-Efficiency HVAC
system
Mid-efficiency roof-top units; includes all
necessary ductwork, materials, labor and
installation; less structural improvements to
roof supports (if required)
$252,660.12
10. High-Efficiency HVAC
system with Window
Upgrades
Same as alternative (9); includes upgrades to
all single-pane windows to triple-pane low-e
windows
$287,060.12
11. High-Efficiency HVAC
system with Insulation
Upgrades
Same as alternative (9); includes upgrades to
insulation along grade wall and other areas
identified by infrared scanning
$268,560.12
12. High-Efficiency HVAC
system with Skylight
Upgrades
Same as alternative (9); includes sealing,
insulating and covering of skylights in
gymnasium area
$253,160.12
13. High-Efficiency HVAC
system with Window
and Insulation Upgrades
Alternative (10) and (11) combined $302,960.12
14. High-Efficiency HVAC
System with Window
and Skylight Upgrades
Alternative (10) and (12) combined $287,560.12
15. High-Efficiency HVAC
System with Insulation
and Skylight Upgrades
Alternative (11) and (12) combined $269,060.12
16. High-Efficiency HVAC
System with All
Upgrades
Alternative (10), (11) and (12) combined $303,460.12
This list of alternatives provided gives the client an overview of the options available for implementation,
and the associated cost of implementation. For a full breakdown of the cost structure, please refer to
section 6.2.2 of the report.