energy and economic growth in pakistan siddiqui.pdf · energy and economic growth in pakistan ......
TRANSCRIPT

The Pakistan Development Review 43 : 2 (Summer 2004) pp. 175–200
Energy and Economic Growth in Pakistan
REHANA SIDDIQUI*
Recent rise in energy prices, shrinking existing resources, and the search for
alternative sources of energy and energy conservation technologies have brought into focus the issue of causality between energy use and economic growth. The results of this study show that energy expansion is expected to lead to higher growth and its shortage may retard the growth process. The impact of all sources of energy on economic growth is not the same. The impact of electricity and petroleum products as well as that of electricity only is high and statistically significant. However, the reverse causality is critical for the petroleum products.
1. INTRODUCTION
Recent rise in energy prices, shrinking existing resources, and the search for alternative sources of energy and energy conservation technologies have brought into focus the issue of causality between energy use and economic growth.1 Energy expansion is expected to lead to higher growth and its shortage may retard the growth process.2,3 Similarly economic growth may affect the demand for energy significantly. In empirical literature, however, there is no consensus about the
Rehana Siddiqui is Chief of Research at the Pakistan Institute of Development Economics, Islamabad.
Author’s Note: An earlier version of the paper was presented at the Annual General Meeting of Pakistan Society of Development Economists, in 2002, in Islamabad, Pakistan. The author is grateful to Dr A. R. Kemal, Director, PIDE, for his useful comments and suggestions. The comments of the participants of the PSDE meeting in Islamabad and invaluable suggestions of an anonymous referee have helped to improve the paper.
1See, for example, Stern and Cleveland (2003); Asafu-Adjaye (2000); Aqeel and Butt (2001); Mahmud (2000); Riaz (1984) and Siddiqui (1999).
2See Ebinger (1981). 3Increased use of better energy sources saves time, helps people in improving the quality of life
and environment. It improves the social services delivery, like effective utilisation of modern health related equipment and better facilities in educational institutions and others. The availability of modern and better fuels improves the lives of the females and children who spend time on collection of traditional fuel like wood. Therefore, it can be claimed that energy sector and the energy services have important implications for poverty reduction. For example, in the small scale industry, mostly concentrated in rural areas, electricity provision can increase the length of working day and increase the productivity of the resources. Furthermore, energy sector itself is an important source of employment generation. Thus, use of energy as an input is expected to have direct positive impact on output and indirect positive impact on poverty and quality of life through the employment generation.

Rehana Siddiqui
176
direction of causality. For example, Asafu-Adjaye (2000) examines the causal relationship between energy consumption, energy prices, and economic growth for selected developing countries. The study finds evidence of uni-directional Granger causality running from energy to income for India and Indonesia, in the short run, and bi-directional Granger causality between energy and income for The Philippines and Thailand. The evidence for Pakistan also reveals that electricity consumption affects economic growth significantly, and there is bi-directional causality between economic growth and consumption of petroleum products and no causal relationship between natural gas consumption and economic growth [see Aqeel and Butt (2001)]. At the sectoral level, the evidence shows that energy use affects the growth of manufacturing sector of Pakistan, however, the substitution possibilities are limited among energy and non-energy inputs and between electricity and gas for the period 1972–93 [see Mahmud (2000)].
Energy demand, particularly for households, responds positively and significantly to economic growth [see Siddiqui (1999)]. The demand is responsive to changes in energy prices also. Own price effect is negative and the cross price elasticity estimates indicate substitution between electricity and petroleum products and between natural gas and petroleum products, especially for domestic users. The results for commodity producing sectors like industry and agriculture, reported in Siddiqui (1999), are supported by the findings of Mahmud (2000) that there is limited substitutability between different sources of energy. Thus, the rise in prices of energy has important implications for energy use in Pakistan.4
In this paper, our objective is to examine the issue of causality between economic growth and energy use for Pakistan, for the period 1971–2003. The study differs from earlier studies in three dimensions. First, earlier studies, like Aqeel and Butt (2001), examine the issue of causality for Pakistan but ignore the impact of changes in other sources of economic growth. We intend to analyse the role of energy in economic growth while controlling for changes in primary factors of production and other sources of growth, viz., labour, capital, human capital formation and exports. Second, earlier studies examine the impact of total energy use on economic growth. The households are important users of energy, however, this use may not contribute to economic growth. Therefore, in this study, we exclude the household consumption of energy and examine the impact of commercial use of energy on economic growth. Third, unlike earlier studies, the present study constructs capital stock series to examine the impact of capital formation on economic growth.
The order of the study is as follows: Current issues and trends in energy use are discussed in Section 2. Section 3 outlines the model, methodology and data
4Energy is also an important source of government revenue that can improve the fiscal deficit in the country, and can also result in increased availability of the resources for public investment.

Energy and Economic Growth
177
issues. The results are presented in Section 4. Conclusions and policy implications of the results and the future directions for research are discussed, briefly, in Section 5.
2. ENERGY TRENDS IN PAKISTAN5
Table A1 shows that in 1990s, the energy requirement in Pakistan was lower relative to many developing and developed countries except for Sri Lanka and Nepal. This may be a result of lower availability and/or lower energy intensity in Pakistan. Per capita availability of energy, used as indicator of prosperity, is low and it has remained constant from 1993 to 1996 revealing that the country is relatively poor in terms of availability of energy, but the growth rate of commercial use of energy is similar to other developing countries in the region like China and India. Table A1 also indicates that the gross domestic product (GDP) per unit of energy is lower in Pakistan as compared to other countries. The growth rate of energy use per unit of GDP was lower in Pakistan as compared to Bangladesh, India and Nepal. In Pakistan, it declined from 3.3 percent in 1990 to 2.8 percent in 1997.6
In Pakistan, ratio of growth rate of energy use to growth rate of output produced, viz., indicator of energy intensity, was around 0.96 during 1970–2003. However, energy intensity, of different sources of energy viz., electricity, natural gas and petroleum products varied significantly over time7 (see Table 1). The energy coefficient for electricity is 1.51 for total electricity use and 1.19 for the commercial use of electricity. This shows that inclusion of domestic consumption of electricity overestimates the energy coefficient. The coefficients for gas and petroleum products also change when we exclude household consumption from total, but the change is largest for electricity.8 Thus, in order to forecast energy needs for economic growth, it is important to exclude domestic use from total energy use.
The coefficients may decrease as the efficiency of fuel use increases either due to improvements in technology or due to reduction in wastage. This indicates that Pakistan should concentrate not only on the expansion of energy sources but also on efforts to improve the efficiency of energy use. How efficiency can be improved—is an important issue and the role of pricing mechanism may be important.9 Main features and critical issues for these components of energy are discussed below:
5Due to data availability for net supply and net demand, the discussion in this section covers the
period from 1991 to 2003 only. 6A simple correlation coefficient between growth rate of various sources of energy and output
growth rate, in Pakistan, varies between 0.612 (for electricity), 0.437 (for petroleum products) and almost negligible for natural gas.
7Non-commercial sources of energy, viz., wood, cotton sticks, begasses, and crop roots, are less economical and inefficient because of lower energy content and higher energy losses. Due to non availability of data we can not include these sources in the analysis.
8See Table 3, Table 4 and Table 5, discussed later. 9According to Riaz (1984), present energy pricing structure does not provide incentives to
improve efficiency.

Rehana Siddiqui
178
Table 1
Coefficient of Energy Intensity (1971–2003) Electricity
(Gwh) Natural Gas
(mcft) Petroleum Products
(Tonnes) Total
Energy Growth Rate of
Gross Domestic Product E1 E2 G1 G2 P1 P2 T1
1970-1980 4.63 1.63 1.29 1.84 1.74 1.05 1.04 1.29 1980-1990 6.12 1.76 1.52 1.12 1.00 1.50 1.58 0.74 1990-2000 4.40 1.07 0.49 1.11 0.93 1.35 1.57 1.04 2000-2003 3.34 1.47 1.90 2.05 2.31 –0.76 –0.66 0.65 1970-2003 4.89 1.51 1.19 1.38 1.27 1.18 1.27 0.93
Notes: Energy intensity is defined as the ratio of growth rate of energy to growth rate of output. E1= Coefficient of energy intensity for total electricity use. E2= Coefficient of energy intensity for electricity use (excluding household use). G1= Coefficient of energy intensity for total natural gas. G2= Coefficient of energy intensity for natural gas (excluding household use). P1= Coefficient of energy intensity for total petroleum products. P2= Coefficient of energy intensity for petroleum products (excluding household use). T1= Coefficient of total energy intensity. (Total Energy is in TOE units).
2(a) Petroleum Products
Given initial gap in net supply and net consumption of energy, a higher growth in consumption relative to growth in supply indicates a widening gap between energy demand and supply. Table A2 shows that, on average, the gap between demand and supply of petroleum products reduced by 0.17 percent during 1991–2003. However, the growth rate of supply and consumption, both, was negative in 1990-91, in 1996-97 and onwards from 2000-01. From Figure 1, we can see
Fig. 1. Growth Rate of Net Supply and Net Consumption of Petroleum Products:1991–2003.
Note: Series 1: growth rate of net supply of Oil Products. Series 2: growth rate of net consumption of Oil Products.
–10
–5
0
5
10
15
1 2 3 4 5 6 7 8 9 10 11 12 13
Years
Gro
wth
Rat
es
Series 1 Series 2

Energy and Economic Growth
179
fluctuations in the supply and demand for petroleum products. The demand and supply of petroleum products moved together with supply lagging behind slightly.
In addition to economic growth, the rise and fall in supply and demand for petroleum products has important implications for balance of payment. In 1980s, approximately 90 percent of oil needs were fulfilled from imports of petroleum products. Despite the rise in prices the import of petroleum products increased resulting in rising share of petroleum products in total imports until 1999-2000 but declined afterwards (see Table 2). The growth rate of total imports was negative (–0.98 percent per annum) during 1996–2000, but the decline in import growth rate, excluding petroleum products, is larger i.e., equaling –3.09 percent, in 1996–2000. (see Table 2). This reflects the significance of imports of petroleum products in total imports and its implications for balance of payments.
Table 2
Import of Petroleum Products (1990-91–2002-03)
Import of Petroleum Products (at Constant Prices 1990-91=100)
Total Imports (at Constant Prices 1990-91=100)
Total Imports Excluding Import of Petroleum Products (at Constant Prices 1990-91=100)
Rs Million Growth Rate (%)
Rs Million Growth Rate (%)
Rs Million Growth Rate (%)
Share of Petroleum Products in
Total Imports (%)
1990-1991 37823 – 171114 – 133291 – 22.10 1995-1996 60829 9.50 214349 4.51 153520 2.83 28.38 1999-2000 70401 3.65 206073 –0.98 135672 –3.09 34.16 2002-2003 60336 –5.14 230800 3.78 170465 7.61 26.14
Source: Pakistan (Various Issues) Pakistan Economic Survey.
In order to reduce import dependence and encourage exploration and conservation efforts, Government of Pakistan announced petroleum policies in 1990-91, 1994 and in 1997. In the 1990s, the emphasis of the government policies was to exploit existing energy resources and to build strong base for the domestic production and exploration. The main objectives of the policies were to ensure adequate and cost-effective provision of the energy with minimum environmental cost to the various sectors of the economy. The efforts were directed towards cost effectiveness, reduction in import dependence, promotion of self-reliance through accelerated exploitation, minimum environmental degradation, encouraging private foreign investment, creation of qualitatively improved infrastructure in oil and gas industry, development of an efficient and transparent management, deregulation of downstream petroleum marketing sector, and rationalisation of prices and LPG allocation.
In petroleum policy of 1994, the emphasis was on providing the fiscal incentives to the petroleum industries and to suggest measures for quality control, to minimise discretion and to increase transparency in the measures undertaken by the

Rehana Siddiqui
180
government. In 1996, a number of fiscal incentives, given to petroleum exploring industries, were withdrawn which affected the activities adversely. In the policy of 1997, the emphasis was on revival of those incentives and on encouraging off-shore exploration activity. However, we can see that rapid growth in import of petroleum products, despite rise in prices has resulted in higher dependence on imports. The changing pricing policies with deregulation efforts have also added uncertainty in the market for oil products.10
The sectoral share for petroleum products also varies. The share of transport sector varied between 48.6 percent (in 1990-91) and 49.1 percent in 2002-03. The share of power sector varied between 24.4 percent in 1990-91 and 48.8 percent in 2002-03. This shows that the transport and power sectors are the main users of petroleum products as the total use of these two sectors varied between 70-90 percent of total consumption. The share of household sector was 9.5 percent in 1990-91 and it declined sharply to 1.72 percent in 2002-03.11 The declining share of domestic sector in consumption of petroleum products could be a result of substitution of natural gas for domestic use [see Siddiqui (1999)]. Thus, we expect that growth in supply and demand for petroleum products is significantly correlated with growth in output, particularly the growth of services sector.
Table 3
Sectoral Share in Consumption of Petroleum Products (1991–2003) Households Industry Agriculture Transport Power 1990-91 9.5 11.5 2.7 48.6 24.4 1998-99 2.9 12.8 1.5 47.2 33.2 2002-03 1.72 9.75 1.2 49.1 36.6
Sources: Pakistan (Various Issues) Pakistan Energy Yearbook.
2(b) Natural Gas
Natural gas is another critical source of energy and its net supply and net demand increased during the 1990s (see Table A2). In early 1990s, as compared to late 1990s, the gap between supply and demand, given the initial positive gap of
10Initially, the prices of the major petroleum products were fixed by the Ministry of Petroleum, Government of Pakistan. Later prices were linked to the Singapore Mean FOB value of the petroleum products and then linked to the average price of the petroleum products during the last quarter in the Arabian-Gulf countries. The variation in prices of petroleum products from different sources were reflected in variation in development surcharge. In 1999, fixed development surcharge and sales tax was imposed on petroleum products that has resulted in sharp rise in prices of petroleum products. The price of furnace oil was deregulated from 1st July 2000 which resulted in almost doubling of the price.
11On average, during 1990s, the share of different sectors in consumption of petroleum products was: 4.3 percent households, 12.7 percent industry, 1.9 percent agriculture, 47.5 percent for transport, 31 percent for power and 2.6 percent for other government.

Energy and Economic Growth
181
417060 (TOE), was large due to sharp fluctuations in net supply (see Figure 2). In recent years the demand for natural gas is rising whereas the supply is showing a downward trend indicating a need for efforts to increase net supply through exploration and conservation.
Fig. 2. Growth Rates of Net Supply and Consumption of Natural Gas.
Note: Series 1: growth rate of net supply of Natural Gas. Series 2: growth rate of net consumption of Natural Gas.
A number of steps were taken by the Government of Pakistan (GOP) to improve gas supply. For example, the privatisation of distribution system and establishment of Oil and Gas Regulatory Authority. However, the privatisation process of the SSGC and SNGPL is progressing at a slow pace. In order to speed up the process, Oil and Gas Regulatory Authority (OGRA) is established which will specify the revenue requirements for companies engaged in transmission and distribution and regulate the functioning of the gas supply and distribution companies.12
The gas distribution agencies SSGC and SNGPL purchase gas from producers at prices fixed under different pricing regimes. These agencies sell gas to various
12The producer (well-head) price and consumer price are still determined by the Government of Pakistan (GOP). Gas prices which were initially linked with the energy pricing policies at the time of commercialisation of the well, are now linked with the international fuel prices. This adds variability to gas price due to variability of the real exchange rate. Currently, the government of Pakistan regulates all gas prices, both for producers (at the well-head) and for consumers. The gas price is fixed neither on economical nor on financial basis. Increase in consumer gas prices has not kept pace with the increase in average purchase prices implying that the gap between revenue for gas companies and average gas prices at the well-head has declined over time. The difference between the two prices is used to meet operating expenses of the companies that are ensured a fixed rate of return, the balance reverts to the GOP and is distributed among the provinces as Gas Development Surcharge.
–15
–10
–5 0 5
10
15
20
25
30
35
1 2 3 4 5 6 7 8 9 10 11 12 13
Years
Gro
wth
Rat
es
Series 1Series 2

Rehana Siddiqui
182
categories of consumers according to tariff schedule determined by the GOP. Regardless of the difference in cost due to location, all consumers within the same category pay the same price. GOP also controls expansion of gas transmission system and connections to new consumers.13
In 1990s, the use of natural gas in various sectors of the economy shows fluctuations, except for the power sector. The increased use of natural gas was also a result of inter-fuel substitution in transport sector and in power sector (see Table 4). In 2002-03, the demand for natural gas from different sectors was: 17.7 percent for households, 2.9 percent for commercial, 1.7 percent for cement, 24.4 percent for fertiliser, 34.1 percent for power, and 19 percent for industrial sector.
Table 4
Sectoral Share in Consumption of Natural Gas Household Commercial Cement Fertiliser Power Industry 1990-91 14.3 2.6 2.8 23.2 27.9 19.1 1998-99 20.7 3.4 1.2 26.3 28.9 19.1 2002-03 17.6 2.6 0.4 16.2 38.5 18.9
Sources: Pakistan (Various Issues) Pakistan Energy Yearbook. 2(c) Electricity
Growth rate of net supply and net consumption of electricity slowed down after 1995-96, however divergence between two indicators increased resulting in cyclical pattern. In fact the gap between supply and demand was negative showing rapid growth in demand, relative to supply, in the early two years of the current decade (see Table A2 in Appendix). This may be a reflection of improvements in economic activity. The growth rate in net supply and demand for electricity also exhibits sharp fluctuations (see Figure 3).
In 1980s, despite increase in supply, Pakistan was unable to meet rapidly growing demand for electricity due to financial and political constraints. In 1985, under an agreement with the World Bank, a policy for encouraging private power producers and attracting foreign direct investment in the power sector was announced. However, the details with the applicants from the international consortium and groups, were finalised after the mid-1990s. In the Energy Policy
13For allocation of gas the sectoral priority is: residential and commercial users; feedstock in fertiliser industry; replacement of HSD in power generation; general industry; and replacement of furnace oil in power generation. In order to reduce pressure on the natural gas during the peak period of domestic demand for natural gas, the gas distribution companies started regulating the supply of gas. For example, to some industrial units, gas is supplied on a nine-months supply basis. SNGPL adopted the policy of nine-months supply to all new industrial units in 1988. Later on same policy was adopted by SSGC. For fertiliser plants the gas supply is stopped from December to February. These units have to use alternative fuel during this period and it results in higher cost of production. For Cement industry also, the supply of gas is curtailed.

Energy and Economic Growth
183
Fig. 3. Growth Rates of Net Supply and Net Consumption of Electricity: 1991–2003.
Note: Series 1: growth rate of net supply of Electricity. Series 2: growth rate of net consumption of Electricity.
announced in 1994, incentives were given to independent power producers (IPPs) to set up thermal power units in Pakistan. Initially after intensive negotiations, 13 projects with a capacity of 2700 MW were finalised. Among these 13 projects, 11 have started production, however, HUBCO with largest power generating capacity of 1200 MW started production in 1997. Currently, 16 IPPs with generation capacity of 5794 MW are in operation.14 In 2002-03, total power generating capacity of WAPDA and KESC was 6491 MW for thermal power and 5045 MW for hydel power.
In the power sector reduction in transmission and distribution losses and theft are also critical issues for improving the efficiency of consumption and distribution. The losses were more than 20 percent in 1990s with a rising trend from 21.1 percent in 1990-91 to 23.4 percent in 2002-03 (see Table A3 in Appendix). In order to reduce these losses, WAPDA has taken a number of steps. For example, the induction of Army Monitoring Teams to check the bills and the electricity theft and transmission losses, according to Chairman of WAPDA, has resulted in 10 percent overall reduction in system losses resulting in monitory benefit of about Rs 15 billion. Managed billing and collection has also increased the revenue of WAPDA by Rs 133 billion in 1998-99 from Rs 117 billion last year. Similarly, renegotiated
14The controversy over the tariff rates between IPPs and WAPDA resulted in long conflict. The private power producer claim that high oil prices, in Pakistan, are responsible for high electricity tariff charged from WAPDA and KESC. The guaranteed 18 percent rate of return to IPPs has created financial problems for WAPDA and puts a heavy burden on future generations.
–4
–2
0
2
4
6
8
10
12
1 2 3 4 5 6 7 8 9 10 11 12 13
Years
Gro
wth
Rat
esSeries 1Series 2

Rehana Siddiqui
184
tariff of 4.75 cents, with IPPs, also resulted in saving of $1.5 billion over the life of the projects [see Bashar (2000)].15
Like other energy products, the price of electricity also increased sharply in the 1990s. The increase in price of electricity resulted in substitution of natural gas for electricity, particularly in the agriculture and industrial sector. The share of these sectors declined from 35.61 and 17.82 percent in 1990-91 to 30.73 percent and 11.43 percent in 2002-03, respectively. Despite the rise in electricity tariff the share of household sector in total increased from 33.01 percent in 1990-91 to 44.87 in 2003-03 (see Table 5).16
Table 5
Sectoral Share in Consumption of Electricity (1991–2003) Household Commercial Industry Agriculture 1990-91 33.0 6.8 35.6 17.8 1998-99 44.8 5.6 27.9 13.0 2002-03 44.9 6.1 30.7 11.4
Sources: Pakistan (Various Issues) Pakistan Energy Yearbook.
On the basis of this discussion a number of critical issues emerge. For example, what is the impact of changes in energy use on economic growth, what are the determinants of supply and demand of different sources of energy, how pricing policies affect inter-fuel substitution, and what is the role of foreign direct investment on energy sector. In this study, we analyse the first issue in detail.17
3. METHODOLOGY
The model, methodology used for testing the causality between economic growth and energy use and data issues are discussed in this section. 3(a) Model
The impact of energy use on economic growth has become critical after the energy shocks in 1970s and recent emphasis on shrinking energy resources and search for energy efficient production technologies and equipments. The role of energy in economic growth is highlighted in a number of studies [see for example, Aqeel and Butt (2001); Moroney (1992); Riaz (1986) and Stern and Cleveland
15According to Bashar (2000), Chairman WAPDA claimed that: “The capacity has increased, beyond demand growth, but it is an irony that electric power is not affordable for a majority of the population and has become an increasingly non-economic input for industry”.
16The growth rate of electricity prices was, on average, 12 percent per annum during 1993–2003. 17The issues like pricing and inter-fuel substitution are discussed partially in Siddiqui (1999) and
Mahmud (2000).

Energy and Economic Growth
185
(2003)]. The studies used production function approach to examine the impact of energy on economic growth. Following Moroney (1992) and Stern and Cleveland (2003), the model assumes production function of the following form:
Qt = f (At, Kt, Ht, Lt, Xt, Eit) = At Ktα Lt
β Htδ Xt
η Ejtγj … … (1)
0 ≤ α, β, δ, η, γj < 1 where:
Qt is total output produced at ‘t’; At is state of technology at time ‘t’; Kt is capital stock at time ‘t’; Lt is labour force at time ‘t’; Ht is indicator of human capital; Xt is exports at time ‘t’; Ejt is consumption of ‘jth’ energy at time ‘t’ (where energy sources are
electricity , natural gas and petroleum products).
Taking logarithm on both side the equation, we can write Equation (1) as:
ln(Qt)=ln (At)+ αln(Kt) +β ln (Lt) + δ ln(Ht) + η ln (Xt) + ∑ γ j ln(Ejt) … (2)
‘j’ varies from 1,2,3 (for electricity (1), gas (2) and petroleum products(3))
t = 1,….,33 (for the period from1969-70 to 2002-03)
Taking first difference, on both sides, Equation (2) can be written as following growth equation:
Gq= Ga +α Gk + βGl+ δGh+ ηGx + ∑j γj Gej … … … (3)
where:
Gq = ln(Qt) – ln(Qt–1) (growth rate of output) Ga = ln(At) – ln(At–1) (growth rate of total factor productivity) Gk = ln (Kt) – ln (Kt–1) (growth rate of capital stock) Gl = ln (Lt) – ln (Lt–1) (growth rate of labour force) Gh = ln (Ht) – ln (Ht–1) (growth rate of human capital) Gx = ln (Xt) – ln (Xt–1) (growth rate of exports) Gej = (ln (Et) – ln (Et–1))j (growth rate of jth energy source).
Capital and Labour are the primary factors of production. The economic theory suggests that rise in capital and labour affects economic growth positively and significantly. Vast literature on endogenous growth models highlights the significance of human capital also for economic growth suggesting that increase in human capital increases output [see for example, Barro and Sala-i-Martin (1995)]. The exports are included to capture the effect of external demand or the changes in external environment or openness on domestic economy. The theoretical and
Rehana Siddiqui
186
empirical literature suggests positive impact of export expansion on domestic output [see Dornbusch (1992) and Todaro (2000)].
Although mainstream growth theory focuses on primary factors of production only, after the energy crisis of 1970s, the role of energy in economic growth became critical issue. For example, Moroney (1992) attributes the decline in productivity in United Stated to changes in energy market. The evidence for China shows that energy played a critical role in her economic growth particularly due to changes in production structure. The energy-growth relationship is also affected due to application of better and efficient fuel and changes in production technology [see Chandler and Gwin (2003) and Stern and Cleveland (2003)]. Therefore, energy growth is categorised as critical factor for economic growth. In order to examine the causality between economic growth and energy use, we have divided the analysis in two parts:
(1) Energy-Output relationship. (2) Productivity Analysis where we focus on relationship between energy use
per unit of labour and output per unit of labour. For this purpose, the model in Equation (1) is expressed in terms of labour. 18
3(b) Estimation
Estimation based on time series data requires special attention. It is well documented that application of standard estimation techniques on non-stationary time series data can cause spurious correlation. This can lead to wrong policy implications and incorrect forecasting. However, if the data are not stationary then after appropriate adjustments Vector Auto Regression (VAR), Error Correction Model (ECM) or Autoregressive Distributed Lag Model or other models may be applied [see Gujarati (1995) and Maddala and Kim (1998)]. Therefore, for time series model estimation involves two steps:
(i) Test for Data Stationarity and Causality
In order to test stationarity of each series, we first apply the unit root test. We have selected Augmented Dicky Fuller (ADF) and Phillips-Perron (PP) tests for this study.19 The tests are applied to the data at levels and first difference.
After testing for stationarity of each series, we examine the direction of causality by applying Hsiao’s Granger Causality Test. For the test model is specified as:
Yt = Σi=1 ai Yt–i + Σi=1 bi Xt–i
Xjt = Σi=1 ci Yt–i + Σi=1 dji Xjt–i … … … … (4)
18In the productivity model, all the variables and growth rates are in terms of per unit of labour. 19For details of the tests, see Banerjee, et al. (1993) and Maddala and Kim (1998).

Energy and Economic Growth
187
where Y is output, Xj is the set of explanatory variables representing capital, labour, human capital, exports and energy sources, i.e., electricity, natural gas and petroleum products. If ‘ Σbi’ and ‘Σci’ are not statistically significant then the explanatory variable do not affect output and changes in output do not affect the explanatory variables. If only one set of coefficients is significant then it is concluded that there is uni-directional causality. We apply F-test and the null hypotheses are: H0: Σbi = 0 and H0: Σcji = 0 against the alternate hypotheses in each case. If the estimated F-value is greater than critical F-value in both cases we conclude that Y and X cause each other and there is bi-directional causality between economic growth and energy. If one of the null hypothesis is not rejected then we have uni-directional causality and if both are not rejected then there is no causal relationship between changes in output and energy.20 (ii) Estimation of the Model
After applying unit root test, and determining causality we estimate the casual relationship between economic growth and energy controlling for changes in capital stock, labour, human capital and exports. After the test for stationarity and causality, we apply Autoregressive Distributed Lag (ADL) model for estimating the regression model.21
The model is specified as:
Yt = a0 + ∑ ai Yt–i + ∑ ∑ bji Xt–i + εt … … … … (5)
It is dynamic linear regression model. The basic issue is to decide about the size of the lag for dependent and explanatory variables. The standard assumptions for the model include that residual is random and explanatory variables are uncorrelated with the error term (εt) and the forecasts are consistent with the theory. 3(c) Data
For estimation of the model, we use time series data, for the period 1970–2003. The main sources of data are various issues of Energy Year Book (various issues) and Pakistan Economic Survey (various issues).22 The variables are defined as follows:
(1) Gross domestic product (GDP), at factor cost, is used as measure of output. The data series is at constant prices of 1980-81.
(2) The data on primary factors of production and other sources of economic growth, including the various measures of energy include:
20For details of the test, see Gujarati (1995). 21According to Maddala and Kim (1998), the ADL model, Vector Autoregression (VAR) model
and Error Correction Model (ECM) give similar results [see Chapter 2, for detail, in Maddala and Kim (1998)].
22Both are published by the Government of Pakistan.

Rehana Siddiqui
188
(a) Capital: Capital stock data are not available from secondary sources. The series is constructed on the basis of available series on domestic capital formation. The series for domestic capital formation is available from 1959-60 to 2002-03. Assuming initial capital-output was equal to 1.16 in 1959-60, we estimate capital stock for 1959-60 [see Kemal and Ahmad (1992)].23 For the subsequent years the capital stock series is computed using the following formula:
Kt = (1– δ) Kt–1 + It
where:
Kt = capital stock in period t; δ = rate of depreciation, assumed to be constant; Kt–1 = capital stock in year t–1; and It = Gross fixed capital formation in year t.
Since the study covers the period from 1969-70 to 2002-03, the impact of assuming constant capital-output ratio in 1959-60 is expected to be significantly lower in 1960-70 and afterwards.
(a) The labour force data are taken from the Pakistan Economic Survey. It is in million of persons in the work force.24
(b) Human capital also affects economic growth significantly. We have included five years lagged enrolment at the secondary level, as a proxy for human capital.
(c) Exports of goods and services, at constant prices of 1980-81, is included as a proxy for openness of the economy. Export expansion is expected to have positive effect on economic growth.
(d) Energy sector is divided in three components: electricity, natural gas and petroleum products. The electricity consumption is measured in Gwh, gas consumption is measured in MCFT and consumption of petroleum is measured in tonnes.25 Since the commercial use of energy is expected to affect economic growth, we have excluded the household demand from total demand for each energy source.
23The value of capital-output ratio is reported in Kemal and Ahmad (1992). They report capital-
output equal to 1.16 in 1959-60. 24Since capital stock and labour force are the primary factors of production. The growth in
services of these factors are assumed to be proportional to the growth in the physical units of these services.
25The data on energy, measured in terms of tonnees of oil equivalent (TOE) are also available. However, due to change in methodology around 1988 the data for different sources of energy, measured in TOE, shows sharp changes in 1988. Therefore, in estimation of the model we do not include the different components of energy, measured in TOE.

Energy and Economic Growth
189
As mentioned earlier, the sectoral decomposition of energy consumption shows varying share of household over time and it differs across energy sources. Furthermore, since the household consumption of energy is not expected to affect over all economic performance, we exclude domestic consumption from each energy source and include only commercial use of energy in the model.
For estimation, the variables are at constant prices of 1980-81 and expressed either in natural-log form and in first difference of log-form, i.e., in growth rates terms.
4. RESULTS
The discussion of the results is divided into two parts.
4(a) Output Growth Model
The results for unit root test are reported in Table 6. The tests are applied to the level and fist difference of the data series. Both ADF and PP statistics show that all the variables are stationary at first difference implying the data series for growth rates are stationary. Thus, we estimate the first difference model.
The results of causality test are reported in Table 7.26 The results show that growth in capital stock, in electricity consumption and in petroleum products affects economic growth significantly.27 For the natural gas the effect of rise in consumption does not affect economic growth.
Table 6
Results for Stationarity—Unit Root Test Augmented Dicky Fuller Test Phillip-Perron Test
Level 1st Difference Level 1st Difference Gross Domestic Product –0.171 –4.397 –0.615 –5.033 Capital Stock –1.341 –3.662 –2.653 –3.662 Labour –1.882 –4.615 –2.250 –6.675 Exports –2.319 –4.163 –1.520 –6.371 Education –1.445 –3.942 –2.487 –4.621 Electricity –0.437 –4.026 –0.621 –4.835 Natural Gas –1.756 –4.020 –2.110 –9.020 Petroleum Products –0.440 –4.116 –0.997 –4.423 Critical Value (at 5 %) (–3.561) (–3.561) (–3.551) (–3.551)
Note: Since each variable is measured in natural log. 1st difference series represent annul average growth rate for each variable.
26Here we report only the results for causality from explanatory variables to growth. The results
for the reverse causality are not reported. However, the results show that for exports, petroleum products and human capital reverse causality holds. Similarly for the relationship within the energy group we see that gas consumption affects consumption of electricity and petroleum products significantly only in the short run. This is a surprising result, given the substitutability between gas (CNG) and gasoline. We intend to explore the issue of bi-directional in a later study.
27We estimated the models for one to eight years lags, however, we report only the results for two years lag model for two reasons. First, the main conclusions do not change and secondly, the R-sqaured and F-ratio for 2-years lag model is higher.
Rehana Siddiqui
190
Table 7
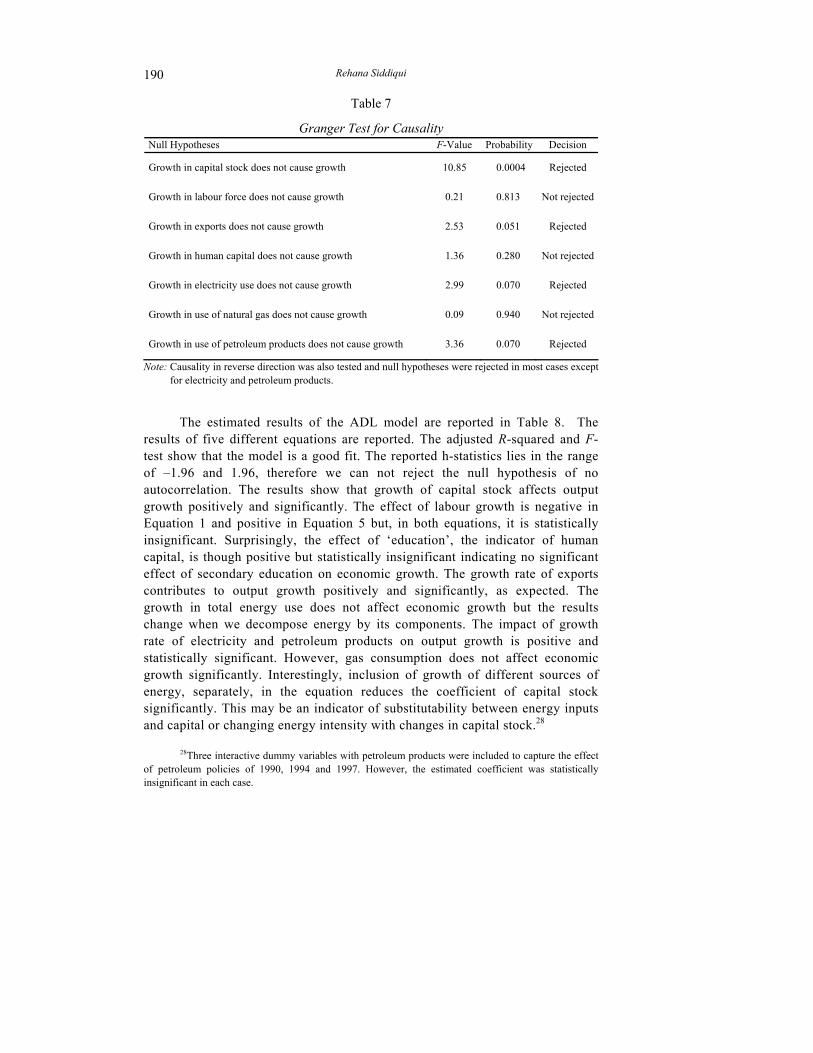
Granger Test for Causality Null Hypotheses F-Value Probability Decision
Growth in capital stock does not cause growth 10.85 0.0004 Rejected
Growth in labour force does not cause growth 0.21 0.813 Not rejected
Growth in exports does not cause growth 2.53 0.051 Rejected
Growth in human capital does not cause growth 1.36 0.280 Not rejected
Growth in electricity use does not cause growth 2.99 0.070 Rejected
Growth in use of natural gas does not cause growth 0.09 0.940 Not rejected
Growth in use of petroleum products does not cause growth 3.36 0.070 Rejected
Note: Causality in reverse direction was also tested and null hypotheses were rejected in most cases except for electricity and petroleum products.
The estimated results of the ADL model are reported in Table 8. The
results of five different equations are reported. The adjusted R-squared and F-test show that the model is a good fit. The reported h-statistics lies in the range of –1.96 and 1.96, therefore we can not reject the null hypothesis of no autocorrelation. The results show that growth of capital stock affects output growth positively and significantly. The effect of labour growth is negative in Equation 1 and positive in Equation 5 but, in both equations, it is statistically insignificant. Surprisingly, the effect of ‘education’, the indicator of human capital, is though positive but statistically insignificant indicating no significant effect of secondary education on economic growth. The growth rate of exports contributes to output growth positively and significantly, as expected. The growth in total energy use does not affect economic growth but the results change when we decompose energy by its components. The impact of growth rate of electricity and petroleum products on output growth is positive and statistically significant. However, gas consumption does not affect economic growth significantly. Interestingly, inclusion of growth of different sources of energy, separately, in the equation reduces the coefficient of capital stock significantly. This may be an indicator of substitutability between energy inputs and capital or changing energy intensity with changes in capital stock.28
28Three interactive dummy variables with petroleum products were included to capture the effect of petroleum policies of 1990, 1994 and 1997. However, the estimated coefficient was statistically insignificant in each case.

Energy and Economic Growth
191
Table 8
Estimated Regression Model—Autoregressive Distributed Lag Model Equation 1 Equation 2 Equation 3 Equation 4 Equation 5 Constant 0.944
(0.57) 0.758
(0.394) 0.79
(0.40) 3.325
(2.55) 2.251
(1.586) Growth Rate of Capital
Stock-Gk 0.839
(2.73) 0.849
(2.68) 0.84
(2.58) 0.301
(2.117) 0.42
(2.469) Growth Rate of Labour
Force-Gl –0.07 (0.38)
–0.063 (0.31)
–0.068 (0.316 –
0.152 (0.887)
Growth Rate of Exports-Gx
0.058 (1.96)
0.058 (1.884)
0.057 (1.89)
0.03 (1.94)
0.029 (2.24)
Growth Rate of Human Capital-Gedu –
0.014 (0.020)
0.012 (0.16)
0.05 (0.89) –
Growth Rate of Electricity-Ge – – –
0.186 (3.049)
0.153 (2.236)
Growth Rate of Natural Gas-Gg – – –
–0.10 (0.837) –
Growth Rate of Petro. Products-Gp – – –
0.198 (2.896)
0.168 (2.491)
Growth Rate of Total Energy-Gte – –
0.008 (0.16) – –
Y(t–1) –0.045 (0.35)
–0.045 (0.246)
–0.047 (0.27)
–0.159 (1.162)
–0.112 (0.722)
Y(t–2) 0.026 (0.169)
–0.022 (0.133)
–0.023 (0.14)
–0.227 (1.662)
–0.262 (1.688)
Adjusted R-squared 0.21 0.18 0.17 0.569 0.52 F-value 2.62 2.08 2.20 5.945 4.536 h-statistics –1.571 –1.468 –1.524 –1.515 –1.50 N 31 31 31 31 31
Note: t-values are reported in parentheses. Y(t–1) and Y(t–2) are lagged values of dependent variable.
4(b) Productivity Growth Model
In the second part, we estimate the productivity growth model. The results for unit root test, reported in Table 9, show that first difference series are stationary at 5 percent. The results for level, not reported here, show that the data series are not stationary at level. Therefore, the first difference model is estimated where the first difference in dependent variable becomes growth in labour productivity. The adjusted R-squared and F-test show that the model is a fit. The reported h-statistics indicates that null hypothesis of no autocorrelation can not be rejected.

Rehana Siddiqui
192
Table 9
Test for Stationarity: Unit Root Test Augmented Dicky Fuller
Test—1st Difference Phillip-Perron
Test—1st Difference Gross Domestic Product –3.887 –5.182 Capital Stock –3.810 –5.241 Exports –3.927 –6.183 Education –4.814 –5.225 Electricity –3.740 –5.383 Natural Gas –4.293 –7.976 Petroleum Products –3.817 –4.632 Critical Value (at 5 %) (–3.561) (–3.556)
Note: All the variables are divided by labour force. Since each variable is measured in natural log. 1st difference series represent annual average growth rate for each variable.
The results for causality, reported in Table 10, show that there is a long run
relationship between growth in capital-per-worker, and productivity growth. Except for growth in human capital and consumption of natural gas, all other variables are important and statistically significant determinants of productivity growth.
The estimated productivity model shows that growth in capital-labour ratio is the major determinant of productivity growth. For the remaining variables also, the results are similar to the output-growth model. Export growth contributes to productivity growth positively.29 Growth in electricity use per worker and petroleum products use per worker also contributes to productivity growth significantly. Interestingly, like the earlier model, the inclusion of energy in the growth model reduces the magnitude of the coefficient of growth of capital-labour ratio whereas the magnitude of the coefficient of export growth is robust. If the constant represents the impact of changes in technology, the coefficient represent insignificant impact on productivity growth, but the size of the coefficient is sensitive to the inclusion/exclusion of indicators of energy.
These results indicate that capital stock is the most important determinant of economic growth. However, the coefficient is sensitive to inclusion/exclusion of the growth rate of energy sources, like electricity and petroleum products. This result may be an indicator of interrelationship between energy use and use of capital stock. Surprisingly, the effect of growth of human capital is not statistically significant. The impact of export growth is positive and the coefficient is robust, indicating that external economic environment or openness plays a critical role in domestic economic expansion. The results show that energy is an important contributor to productivity growth.
29The Granger Causality test shows that reverse causality also holds.

Energy and Economic Growth
193
Table 10
Granger Test for Causality-Productivity Growth Null Hypotheses F-Value Probability Decision Growth in capital-labour ratio does not cause
productivity growth 2.10 0.048 Rejected Growth in exports per unit of labour does not
cause productivity growth 2.42 0.109 Rejected Growth in human capital does not cause
productivity growth 0.19 0.82 Not rejected Growth in electricity per unit of labour does not
cause productivity growth 3.84 0.035 Rejected Growth in natural gas per unit of labour does
not cause productivity growth 0.23 0.80 Not rejected Growth in petroleum products per unit of labour
does not cause productivity growth 2.64 0.82 Rejected Note: Causality in reverse direction was also tested and null hypotheses were rejected in most cases except
for electricity and petroleum products.
Table 11
Estimated Result for Productivity Growth—Autoregressive Distributed Lag Model Equation 1 Equation 2 Equation 3 Equation 4 Equation 5 Constant –0.154
(0.223) –0.456 (0.647)
–0.401 (0.558)
0.617 (1.285)
0.557 (1.002)
Growth Rate of Capital-GkL 0.772 (4.369)
0.687 (5.784)
0.664 (3.545)
0.448 (1.839)
0.423 (2.693)
Growth Rate of Exports-GxL 0.068 (2.12)
0.076 (2.394)
0.074 (2.303)
0.02 (1.76)
0.023 (1.840)
Growth Rate of Human Capital-GeduL – 0.111 (1.51)
0.100 (1.312)
0.103 (1.863)
0.048 (0.793)
Growth Rate of Electricity-GeL – – – 0.291 (4.412)
0.18 (3.165)
Growth Rate of Natural Gas-GgL – – – –0.112 (0.973)
–
Growth Rate of Petro. Products-GpL – – – 0.199 (3.344)
0.171 (2.515)
Growth Rate of Total Energy-GteL – – 0.04 (0.624)
– –
YL(t–1) 0.041 (0.306)
–0.007 (0.056)
–0.026 (0.189)
–0.033 (0.385)
–0.005 (0.793)
YL(t–2) –0.052 (0.341)
–0.095 (0.712)
–0.102 (0.751)
–0.236 (0.389)
–0.192 (0.702)
Adjusted R-squared 0.482 0.506 0.494 0.810 0.7745 F-value 7.968 7.144 5.87 16.94 13.496 h-statistics –1.57 –2.00 –1.53 –1.52 –2.00 N 31 31 31 31 31 Note: t-values are reported in parentheses. YL(t–1) and YL(t–2) are lagged values of dependent variable.

Rehana Siddiqui
194
Keeping in view these conclusions, can we determine the required growth rates of capital and energy input for achieving target growth rate of output. For example, what will be the required growth rate for these inputs for achieving target growth rate of GDP of 5 percent (low), 7 percent (medium) and 10 percent (high)? Utilising the estimates of Equation 1 and Equation 5, reported in Table 8, and assuming that changes in growth rates of all the other variables are in line with target growth rate of GDP, we compute the required growth rates for capital stock, for electricity use and for use of petroleum products (see Table 12).30 The results show that substantially higher growth rate in capital stock, electricity and petroleum products would be required to achieve even modest economic growth rate of 5 percent. For achieving GDP growth rate greater then 5 percent targeted efforts will be required to increase capital stock and energy, i.e., electricity and petroleum products. Furthermore, in order to achieve target GDP growth rate of 7 percent the employment growth rate should exceed four percent and exports growth rate should be more than 7 percent.31 If the growth rates of all other explanatory variables falls behind then achievement of target GDP growth will become even more difficult. Thus, for the achievement of target GDP growth rates policy efforts are required in various dimensions.
Table 12
Required Growth of Critical Sources of Economic Growth Required Growth
Rate of Capital Stock
Required Growth Rate of
Electricity
Required Growth Rate of Petroleum
Products Target Growth Rate of Gross Domestic Product Equation 1 Equation 5 Equation 5 Equation 5 5 Percent 5.12 4.56 4.75 5.20 7 Percent 7.50 8.60 9.65 8.65 10 Percent 11.64 12.65 20.04 20.73
Actual Growth Rates of the Sources of Growth (1970-2003) Min. Growth Rate 2.76 2.76 –7.73 –4.06 Max. Growth Rate 7.84 7.84 13.24 13.97 Avg. Growth Rate 5.51 5.51 5.67 6.04 Note: The equations are from Table 7.
30For different growth scenarios, the growth rates of other explanatory variables are expected to
change in the same proportion as the ratio of target GDP growth rate and average GDP growth rate. The growth rates, for the period examined in the study were: 2.64 percent per annum for labour force, 5.00 percent per annum for exports, 4.89 percent per annum for one year lagged GDP-growth and 4.98 percent per annum for 2 years lagged GDP-growth. For different growth scenarios, the growth rates of other explanatory variables are expected to change in the same proportion as the ratio of target growth rate and average growth rate.
31In order to achieve target growth rate of 10 percent, employment should increase by more then 5 percent and export should increase by 10 percent per annum.

Energy and Economic Growth
195
5. CONCLUSIONS, POLICY IMPLICATIONS, AND FUTURE DIRECTIONS
The issue of energy supply and demand is important not only for the economic prosperity of the current generations but also for the future generations. From the above analysis, we can see that energy is a critical determinant of economic growth. Therefore, its shortage can retard economic growth. However, in order to achieve high economic growth rates, multidimensional policies are required and these policies should not ignore the energy sector. In order to improve availability of energy and balance of payment position, alternative sources of energy should also be developed. Based on the discussion above, we can outline following policy implications and areas for future research:
(1) The rise in supply of energy at affordable prices is important for economic growth. Deregulation will have important implication for pricing behaviour of the various sources of energy. The rise in prices affects the demand and consequently the economic growth. Thus, the pricing policies should take into account the impact on economic growth also.
(2) The issue of renewable and non renewable sources of energy, demand and supply of each component of energy, intensity and efficiency of energy use, availability of substitutes, pricing mechanism and balance of payment implications of energy use are important and the issue should be examined in detail.
(3) The poverty reduction strategy should have clear strategy for energy sector. Lamech and O’Sullivan (2002) suggest that energy plays an important role in reducing poverty. However, the poverty reduction strategies should emphasise on expanding the access to energy, improve reliability and achieve fiscal sustainability by reducing the claims of the sector on budget, reduce fiscal risk due to the energy sector, eliminate subsidies to reduce government liabilities, improve governance and ensure environmental sustainability. These efforts should be accompanied by a set of monitoring indicators like availability and affordability of energy related equipment, fiscal discipline for energy utilities and regulatory framework. The poverty reduction strategy of Pakistan concentrates on energy sector also. [see Pakistan (2001)]. However, the emphasis of the policy is on deregulation and privatisation. As we have seen earlier that it has resulted in higher prices. The privatisation process in Pakistan has resulted in loss of jobs, at least in the short run [see Kemal (1999)]. This will impact the desired outcomes of the poverty reduction strategy. Thus, there is a need, at least in the short run, to develop a mechanism to mitigate the adverse impact of deregulation of energy prices on the poor and unemployed.

Rehana Siddiqui
196
(4) In the recent decade the issues of energy conservation, its pricing and the impact on environment have raised concerns in the developed and developing countries. In Pakistan, crisis of energy can be termed not only the supply issue but also the “Crisis of Energy Pricing”. The crises is not a result of only the mismatch in demand and supply of energy, but an outcome of imbalance in government policies. Since a significant proportion of energy is imported particularly the petroleum and petroleum products, a sharp increase in price of energy also indicate deterioration in the purchasing power of our export earnings in Pakistan. For example, in 1971-72, 1 metric ton of raw cotton export could buy 64 metric tons of crude oil in 1984-85, but in 1999, it could buy only 14.79 MT of crude oil. This increase in prices affects not only the economic growth but also the balance of payments.
(5) The discussion in Section 2 indicates the possibility of inter-fuel substitution which may be result of changes in price structure resulting in changes in production technologies and/or changes in production structure. It will be interesting to examine these issues, in detail.

Energy and Economic Growth
197
Table A1 Growth Rates of Energy Use Indicators: 1990–97 (Percentages)
Commercial Energy Use Carbon Dioxide Emissions
Countries Total Per Capita
GDP/ Per Unit of Energy Use (PPP
$ kg of TOE)
Net Energy Imports (% of Commercial
Use) Total Per Capita
Electricity Consumption Per
Capita (kwh)
Electricity Transmisand Distribution Lo
(% of Total OutpuBangladesh 2.53
(20936) 0.60
(190) 5.26
(5.0) 0
(10) 6.91
(15.4) 12.25 (0.1)
9.86 (43)
–12.75 (34)
China 4.26 (866666)
2.92 (763)
10.65 (1.8)
20.09 (–3)
5.77 (2401.7)
4.91 (2.1)
7.18 (471)
2.25 (7)
Egypt 3.66 (31895)
1.27 (608)
3.3 (3.9)
–6.86 (–72)
4.45 (75.4)
3.29 (1.4)
2.39 (697)
0 (12)
India 4.22 (359846)
2.05 (424)
4.10 (3.3)
9.40 (7)
2.20 (675.3)
3.40 (0.9)
6.13 (254)
0 (18)
Indonesia 5.82 (98846)
3.77 (555)
4.78 (3.4)
–2.3 (–69)
6.80 (165.2)
0 (7.0)
13.24 (156)
–3.65 (15)
Korea 11.58 (91402)
10.28 (2132)
–0.42 (4.0)
2.08 (76)
9.16 (241.2)
8.23 (5.6)
14.05 (2202)
–3.65 (5)
Malaysia 12.45 (23874)
9.23 (1317)
0 (4.0)
–10.63 (–104)
13.64 (55.3)
10.96 (3)
13.59 (1096)
–1.74 (10)
Nepal 3.47 (5834)
0.53 (311)
4.76 (2.8)
17.76 (3)
17.76 (0.6)
0 (0.1)
5.68 (28)
–0.58 (29)
Pakistan 4.66 (43238)
1.68 (400)
2.82 (3.3)
3.62 (21)
5.63 (67.9)
4.91 (0.6)
3.75 (267)
2.25 (21)
Sri Lanka 4.57 (5476)
3.07 (322)
3.45 (6.2)
9.20 (23)
10.50 (3.9)
12.25 (0.2)
6.80 (153)
0 (17)
Thailand 10.59 (43706)
9.01 (786)
–0.69 (4.9)
–1.23 (39)
13.58 (95.7)
12.25 (1.7)
11.97 (690)
–3.29 (11)
World 1.53 (8508414)
–0.13 (1705)
–
–
5.97 (16183.1)
3.26 (3.30)
1.05 (1928)
0 (8)
Low Income Countries 1.04 (1122683)
–1.25 (6.07)
–
–
9.96 (1376.8)
7.82 (0.70)
–0.73 (373)
4.57 (13)
Middle Income Countries
1.11
(3297830)
–0.35
(1397)
–
–
8.70
(5772.8)
5.39
(2.70)
1.26
(1243)
3.40
(9) High Income Countries 1.99
(4167901) 1.21
(4996)
– –
2.91 (9033.6)
0.55 (11.9)
2.05 (7294)
–2.54 (7)
Source: World Bank (2000) World Development Report 2000-01. * Initial values of each variable are reported in parenthesis.

Rehana Siddiqui
198
Table A2
Growth Rates of Net Supply and Net Consumption of Energy
Initial Net Supply and Demand (1989-90)
(TOE) 1990-
91 1991-
92 1992-
93 1993-
94 1994-
95 1995-
96 1996-
97 1997-
98 1998-
99 1999-2000
2000-01
2001-02
2002-03 Avg.
(a) Oil Products Net Supply 8065360 –5.14 11.33 8.14 5.98 1.97 8.34 –1.07 0.41 6.27 2.64 –1.06 –6.89 –3.29 2.13 Net Consumption 8066499 –3.20 8.63 7.53 5.15 4.29 10.17 –2.87 0.41 5.43 3.85 –3.17 –4.39 –2.03 2.29 Difference –1139 –1.94 2.70 0.61 0.83 –2.31 –1.83 1.80 0.00 0.84 –1.21 2.11 –2.49 –1.26 –0.17
(b) Natural Gas Net Supply 5137893 9.30 –7.89 12.00 –12.02 30.04 6.74 0.63 6.76 0.74 4.70 6.44 1.84 0.22 4.58 Net Consumption 4720833 7.16 3.57 8.40 4.64 5.53 8.73 –3.60 9.11 2.49 7.87 0.61 5.10 6.19 5.06 Difference 417060 2.14 –11.46 3.60 –16.66 24.51 –1.99 4.23 –2.35 –1.74 –3.16 5.83 –3.26 –5.97 –0.48
(c) LPG Net Supply 137294 14.57 –11.90 3.04 –5.01 29.90 17.19 –9.15 9.87 13.09 10.47 7.90 23.10 4.57 7.59 Net Consumption 137294 14.57 –11.90 3.04 –5.01 29.90 17.19 –9.15 9.87 13.09 10.47 7.90 19.58 3.77 7.26 Difference 0.00 0.00 0.00 0.00 0.00 0.00 0.00 0.00 0.00 0.00 0.00 0.00 3.53 0.80 0.33
(d) Coal Net Supply 1388352 –2.41 16.90 –10.80 8.06 –15.07 7.59 –1.18 –12.65 7.99 –7.72 2.42 13.88 13.01 1.52 Net Consumption 1388352 –2.41 16.90 –10.80 8.06 –15.07 7.59 –1.17 –12.66 7.99 –7.72 2.42 13.88 13.01 1.52 Difference 0.00 0.00 0.00 0.00 0.00 0.00 0.00 –0.01 0.0 0.00 0.00 0.00 0.00 0.00 0.00
(e) Electricity Net Supply 2978866 8.16 10.23 7.37 3.33 5.73 5.82 3.31 5.32 5.41 –0.09 3.08 6.52 4.50 5.28 Net Consumption 2342996 9.18 7.17 7.44 2.40 5.38 5.64 2.31 3.79 –2.91 5.62 6.37 4.11 3.94 4.65 Difference 635870 –1.01 3.06 –0.07 0.93 0.35 0.18 1.00 1.52 8.32 –5.71 –3.29 2.41 0.56 0.63
(f) Total Energy Net Supply 17707764 1.89 5.77 7.58 0.74 9.57 7.42 0.19 2.69 4.52 2.24 2.39 0.03 0.53 3.50 Net Consumption 16655974 1.85 7.45 6.25 4.73 3.67 8.96 –2.26 2.88 3.48 4.74 –0.11 1.36 2.73 3.52 Difference 1051790 0.05 –1.68 1.33 –4.00 5.91 –1.55 2.44 –0.19 1.04 –2.49 2.50 –1.33 –2.20 –0.01
Growth Rate of GDP 422484 5.60 7.70 2.10 4.40 5.10 6.60 1.70 3.50 4.20 3.90 1.80 3.10 5.10 4.215 Source: Author’s calculation based on data taken from Pakistan Energy Yearbook (Various Issues).

Energy and Economic Growth
199
Table A3
Transmission and Distribution Losses—Electricity
Years Auxiliary
Consumption Transmission and
Distribution Losses 1991-1992 2.43 21.68 1992-1993 2.23 21.06 1993-1994 2.62 21.59 1994-1995 2.60 21.45 1995-1996 2.93 21.50 1996-1997 2.41 21.70 1997-1998 2.07 23.97 1998-1999 1.74 25.80 1999-2000 2.09 24.18 2002-2003 2.10 23.80
Source: Pakistan (Various Issues).
REFERENCES
Aqeel, A., and M. S. Butt (2001) The Relationship between Energy Consumption and Economic Growth in Pakistan. Asia-Pacific Development Journal 8:2 (December), 101–110.
Asafu-Adjaye (2000) The Relationship between Energy Consumption, Energy Prices and Economic Growth: Time Series Evidence from Asain Developing Countries. Energy Economics 22:6 (December), 615–626.
Banerjee, A., J. Dolando, J. Galbraith, and D. F. Hendry (1993) Co-integration, Error Correction, and the Econometric Analysis of Non-stationary Data. Oxford University Press.
Barro, R. J., and X. Sala-i-Martin (1995) Economic Growth. New York: McGraw Hill, International Edition.
Bashar, Amanullah (2000) Pakistan Energy Conference—Special Report. Pakistan and Gulf Economist. April 24–30.
Chandler, W., and H. Gwin (2003) Helping China Manage Energy Growth. [downloaded from internet].
Dornbusch, R. (1992) The Case for Trade Liberalisation in Developing Countries. Journal of Economic Perspectives 6, (Winter), 69–85.
Ebinger, C. K. (1981) Pakistan: Energy Planning in a Strategic Vortex. Bloomington, USA: Indiana University Press.
Gujarati, D. N. (1995) Basic Econometrics. (Chapters 17, 21 and 22), (3rd edition). New York: McGraw Hill, International Edition, USA.
Kazmi, S. (2000) PEPCO. Pakistan and Gulf Economist 19:18, May.

Rehana Siddiqui
200
Kemal, A. R. and S. I. Ahmad (1992) The Sources of Economic Growth in Pakistan. Study prepared for the Ninth Five-Year Plan. Pakistan Institute of Development Economics, Islamabad. (May).
Kemal, A. R. (1999) Privatisation in Pakistan—Social Effects and Restructuring. Pakistan Institute of Development Economics, Islamabad. (September). (Unpublished paper.)
Lamech, R., and K. O’Sullivan (2002) Energy. (Chapter 21 and Technical Note ‘Q’) In Jeni Klugman (ed.) A Sourcebook for Poverty Reduction Strategies: Vol 2: Macroeconomic and Sectoral Approaches. Washington, D. C.: The World Bank.
Maddala, G. S., and In-Moo Kim (1998) Unit Roots, Cointegration, and Structural Change. (Chapter 2). Cambridge: Cambridge University Press, USA.
Mahmud, S. F. (2000) The Energy Demand in the Manufacturing Sector of Pakistan: Some Further Results. Energy Economics 22:6 (December), 641–648.
Moroney, J. R. (1992) Energy, Capital and Technological Change in the United States. Resource and Energy 14:4 (December), 363–380.
Pakistan, Government of (2001) Energy Year Book. Islamabad: Government of Pakistan.
Pakistan, Government of (2001) Interim Poverty Reduction Strategy of Pakistan. Islamabad: Government of Pakistan.
Pakistan, Government of (Various Issues) Pakistan Economic Survey. Islamabad: Ministry of Finance, Government of Pakistan.
Riaz, T. (1984) Pakistan: The Energy Sector—A Study in Sector Planning. Lahore: Ferozesons Limited, Pakistan.
Siddiqui, R. (1999) Demand for Energy and the Revenue Impact of Changes in Energy Prices. Pakistan Institute of Development Economics, Islamabad. (Research Report No. 174.)
Stern, D. I., and C. J. Cleveland (2003) Energy and Economic Growth. [downloaded from internet]. December.
Todaro, M. P. (2000) Economic Development. (Seventh Edition). New York: Addison-Wesley.
World Bank (2002) Pakistan: Country Assistance Strategy FY03-05. Washington, D. C.: The World Bank.