energy and environment cabinet department for
TRANSCRIPT

1
ENERGY AND ENVIRONMENT CABINET DEPARTMENT FOR
ENVIRONMENTAL PROTECTION DIVISION OF WATER
300 SOWER BOULEVARD FRANKFORT, KENTUCKY 40601
INSTRUCTIONS: Completing the Monthly Operating Report (MOR)
These instructions are for the eMOR, available at: https://eec.ky.gov/Environmental-
Protection/Water/Drinking/DWProfessionals/Pages/Compliance.aspx
If you have any questions, please email us at [email protected].
Contents
Sending the Completed MOR: ...................................................................................................................... 2
General Notes on using eMOR: .................................................................................................................... 2
Cover Sheet: .................................................................................................................................................. 3
Page 1 - Chemicals: APPLICABLE TO ALL PLANTS .......................................................................................... 4
Page 2 - Chemicals: APPLICABLE TO ALL PLANTS .......................................................................................... 5
Page 3 – Water Quality: APPLICABLE TO ALL PLANTS................................................................................... 6
Page 4 – AWOP Turbidity: OPTIONAL FOR SURFACE WATER PLANTS .......................................................... 6
Page 5 – Water Quality: APPLICABLE TO ALL PLANTS................................................................................... 6
Page 6 – Filters: APPLICABLE TO ALL PLANTS WITH FILTRATION ................................................................. 7
Page 7 – Distribution: ALL WATER SYSTEMS ................................................................................................. 8
Page 8 – 4-Hour Turbidity Report: ALL SURFACE WATER PLANTS WITH FILTRATION .................................. 8
Page 9 – Individual Filter Turbidity Exceedance Report: ALL SURFACE WATER PLANTS WITH FILTRATION 9
Page 10 – Chlorite & Chlorine Dioxide: ALL PLANTS USING CHLORINE DIOXIDE ......................................... 9
Additional Data: ALL SYSTEMS AS NEEDED ................................................................................................. 10
Plant Summary Sheet: ALL SYSTEMS WITH TREATMENT PLANTS .............................................................. 10
Summary Sheet: ALL PUBLIC WATER SYSTEMS .......................................................................................... 11
Annual Data – ALL PUBLIC WATER SYSTEMS .............................................................................................. 11
Appendix A: Using Microsoft Excel ............................................................................................................. 13
Version 1.1 09/08/2021
2
Sending the Completed MOR:
• Preferred Submission Method: Upload eMOR on the Drinking Water Information and Data Submittal Form, eForm 169 (preferred submission method)
o The eForms home page is located at: https://dep.gateway.ky.gov/eForms/Account/Home.aspx. You will need a Kentucky Online Gateway account to use the eForm; contact us for assistance in setting one up.
o You may upload the original Excel format (preferred), or save as a PDF. o Upload no later than the 10th of the month following the reporting month o Remember to also complete the last page: Annual Data, with your December
MOR.
• IF you send the MOR through the mail/US Postal service: o Be sure to send the original document that has the signature in ink.
No copies please. Sending the MOR by certified mail and keeping the receipt will provide
proof of submitting the MOR on time to the Department. o Send the MOR in time for the Division of Water to receive it no later than
the 10th of the month following the reported month. o Mail the MOR to: Division of Water
300 Sower Blvd, 3rd Floor Frankfort, KY 40601
General Notes on using eMOR:
If you are new to using Microsoft Excel, see some general information in Appendix A
Notice that as you fill out the eMOR (electronic MOR) in Excel, as data are entered some cells will calculate and populate numbers and results on other pages because many are linked. Some cells may be linked and waiting for data from other parts of the eMOR to be entered and will display an error message (#DIV/0! or #VALUE!). If you have entered all of your data and checked to make sure that all of it has been entered correctly to the best of your knowledge, you may ignore such messages or “errors”. FILL IN ONLY THE PARTS OF THE MOR THAT APPLY TO YOUR SYSTEM. IGNORE AND LEAVE BLANK THOSE PARTS THAT DO NOT APPLY.
Once you type the PWSID, Plant ID, and month/year on the first page, the rest of the pages will automatically add it.
On some sheets, look for cells highlighted in yellow at the bottom of the sheet; these are important questions you need to answer.
Each page is on a separate sheet (listed like tabs across the bottom) in the eMOR workbook. Each page is named according to the information it contains.

3
Printing the eMOR: go to “File” then “Print”. In the Settings section, choose “Entire Workbook” in order to print all the pages. There is also the option to enter specific pages to be printed. Use these same steps to convert the file to a PDF, but select the “Print to PDF” option instead of your printer.
We recommend that the eMOR file first be saved as a “Blank” MOR; this can be used as a starting point each month. Second, open the “Blank” file and fill in all of the month’s information/data. When ready to save it, click on “File”, “Save As” and rename the file always including the PWSID, the correct plant ID (A, B, or C) the month and the year you are reporting for (Example: KY0123456_MOR_0221_A for the Feb, 2021 MOR for Plant A). This will keep each month’s data separate on your system and avoid having to clear the numbers each month before entering the current data. This will also avoid duplicate filenames in the DOW system when received.
Leave cells empty if there is no data to input. Do not enter “0” (zero) in any of these spaces. (For example, do not enter “0” in the spaces for the 31st day if there are only 30 days in the current month). The “Average” calculations will not be correct if “0’s” are used. Do not use the letter “o” or the number “0” in place of no data.
Cover Sheet:
Month & Year The month and year reported as MM/YYYY format
(Example: 02/2021)
PWS ID and Name The unique 9 digit state code and number (KY0000000) of the water system and the name of the water system. Be sure to enter all 9 digits.
Plant ID Indicate which treatment plant is being reported
(Example: A, B or C)
Date Mailed Date placed in the mail or uploaded to eForms - MM/DD/YYYY
Agency Interest (AI) A state-assigned system specific identification number -Locate this number on the mailing label from the state. It is located immediately after your PWSID. There is one space between your PWSID and AI number on the label. Contact the DWB if unable to locate the AI.
Source Name Name of source water for the water plant

4
Operator(s)
Design Capacity
Type of Filtration
Design Filtration Rate
Percent Backwash
Name and certification numbers of operators responsible for running the plant. We do not need a full report of all
operators, but only one licensed operator for each shift.
Design capacity in gallons per minute as last approved by the Cabinet
Type of media (i.e. dual media, mixed media, slow sand, rapid sand, etc.)
Filtration rate in gallons per minute per square foot as last approved by the Cabinet
Calculate: (gal. of backwash water used/gal. raw water)/100
Date Flocculation Basin(s) Date flocculators were last cleaned in month/year Last Cleaned
Date Settling Basin(s)
Last Cleaned
(MM/YYYY)
Date settling basin(s) last cleaned in month/year
(MM/YYYY)
After completing the Cover Page on your Blank form, save it; then you don’t have to fill this out every month. Remember to update the dates each month, however.
Page 1 - Chemicals: APPLICABLE TO ALL PLANTS
NOTE: The calculations in the cells for ppm have been set up on a wet basis. The wet weight refers to the weight of liquid product used. You may use the dry weight if you prefer. The dry weight refers to the weight of the actual chemical in the product used and may be calculated by multiplying the weight of the liquid product used by the percentage of that product which is the chemical. For example, liquid fluoride can be weighed as the amount of product used from a tank (wet weight). It can also be weighed as that amount multiplied by 23% (0.23), (dry weight) as fluoride is 23% of the product if using hydrofluorosilicic acid (HSF).
Raw Water Treated Amount of raw water treated in gallons – This is NOT the finished water pumped to the distribution system; this is to reflect water that has had chemicals added.
Hours Plant Operated Number of hours plant operated and treated water

5
Chemicals Added Provide type of chemical added in the cell under the appropriate column. (i.e. alum, ferric, lime, caustic, etc.)
LBS Total pounds of chemical/product used each day (as described above)
PPM Parts per million = mg/L -Calculate by using the formula:
lbs. chemical (e.g., fluoride) (gal. raw water treated/1,000,000/8.34)
The chart will automatically calculate the column totals, column averages, and find the maximum daily gallons of raw water treated.
** For any extra data, please use the “Additional Data” sheet and format as needed.
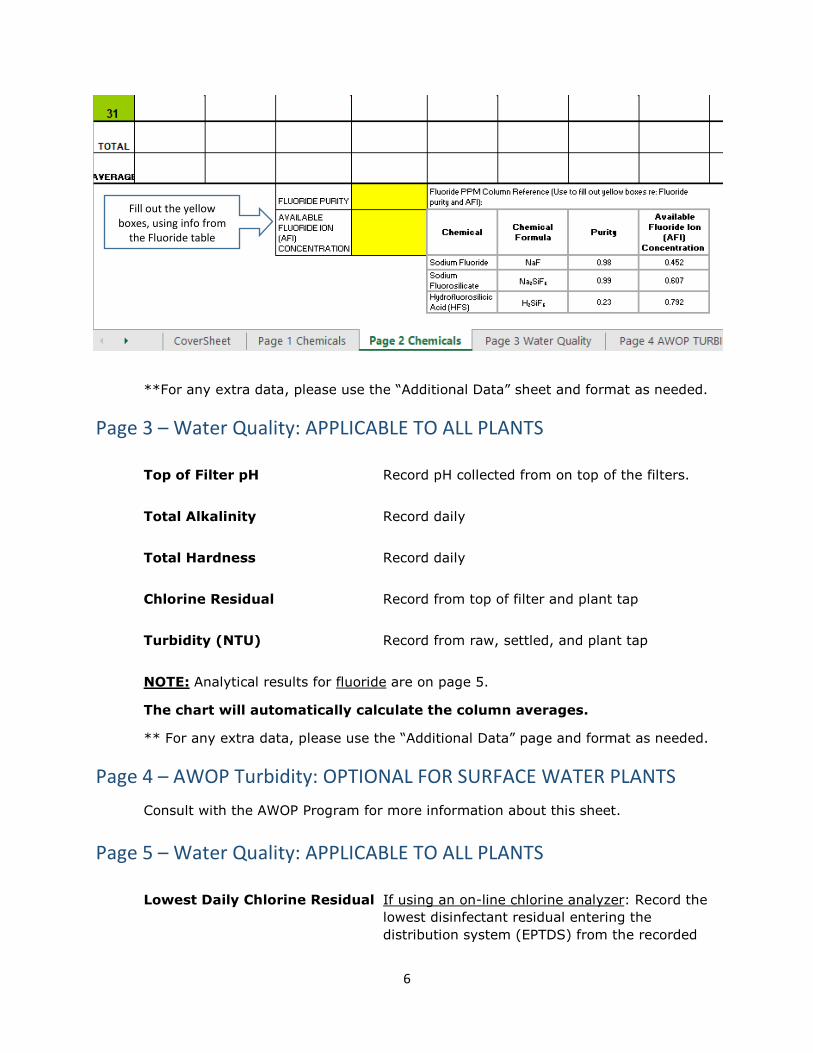
Page 2 - Chemicals: APPLICABLE TO ALL PLANTS
Continuation of Page 1 – Chemicals
The chart will automatically calculate the column totals and averages.
For fluoride, it is necessary to fill out the two yellow boxes at the bottom of the page for fluoride purity and available fluoride ion (AFI) concentration; the column formulas will not work correctly until this has been done. Use the fluoride reference table next to the yellow cells to choose the correct purity and AFI for your water system (see graphic on next page).
6
**For any extra data, please use the “Additional Data” sheet and format as needed.
Page 3 – Water Quality: APPLICABLE TO ALL PLANTS
Top of Filter pH Record pH collected from on top of the filters.
Total Alkalinity Record daily
Total Hardness Record daily
Chlorine Residual Record from top of filter and plant tap
Turbidity (NTU) Record from raw, settled, and plant tap
NOTE: Analytical results for fluoride are on page 5.
The chart will automatically calculate the column averages.
** For any extra data, please use the “Additional Data” page and format as needed.
Page 4 – AWOP Turbidity: OPTIONAL FOR SURFACE WATER PLANTS Consult with the AWOP Program for more information about this sheet.
Page 5 – Water Quality: APPLICABLE TO ALL PLANTS
Lowest Daily Chlorine Residual If using an on-line chlorine analyzer: Record the lowest disinfectant residual entering the distribution system (EPTDS) from the recorded
Fill out the yellow boxes, using info from
the Fluoride table

7
data on the on-line chlorine analyzer; circle or highlight “FREE” for free chlorine or “TOTAL” for total chlorine.
If NOT using an on-line chlorine analyzer: record the lowest grab sample value of disinfectant residual entering the distribution system (EPTDS) each day.
Rainfall . . . . . . . . . . . Total rainfall recorded for each day
Water Temperature Record a daily water temperature; circle “F” for Fahrenheit or “C” for Centigrade. If using the electronic format, type in “F” or “C”.
Disinfectant Chloramines At bottom of chart: Select Y or N if the plant uses chloramines to disinfect.
Free Chlorine and Chloramines The chart will automatically count all values less than 0.2 mg/L (free chlorine) or less than 0.5 mg/L (chloramines)
The chart will automatically calculate the column averages.
Page 6 – Filters: APPLICABLE TO ALL PLANTS WITH FILTRATION
No.: Filter number as designated by the plant
Area (square feet) Filter area in square feet
Total Washwater Gallons The chart will automatically summarize all the washwater gallons entered in the row
Washwater Gallons Gallons used to backwash filter(s)
Filter Run Hours Daily cumulative number of hours filter was in service
The chart will automatically calculate the column totals and averages.
* If there are additional filters, you may use Page 6 Filters (2) and Page 6 Filters (3).The Cover Page will add the totals of all filters in

8
Page 7 – Distribution: ALL WATER SYSTEMS
Chlorine Booster Pounds of chlorine added as a booster each day used
Total/Free Cl2 Residual Record samples taken each day at representative points throughout the distribution system. At least one sample must be taken and recorded each day.
Disinfectant Chloramines Below the chart, at the bottom of the page, choose Y or N if the plant uses chloramines to disinfect.
Number of Days Operated Below the chart, enter the total number of days the distribution system was in operation for any amount of time throughout the month.
For paper MOR Count/calculate and include data for all sections below the chart.
If you enter your data electronically, the chart will automatically calculate the column totals, averages, and find the minimum chlorine residuals at each location for the month.
At the bottom of the chart, you will see that the number of free and total residuals is counted automatically, as well as the number <0.2 mg/L.
Page 8 – 4-Hour Turbidity Report: ALL SURFACE WATER PLANTS WITH FILTRATION
Note: If you do not see Page 8 (and the pages that follow it), select the triangle arrow on the left side of the screen to scroll through the sheets.
Hours Plant Operated Number of hours the plant filtered water; this will be filled in automatically from the numbers you entered in Page 1

9
# Turbidity Samples Required This will be calculated automatically, based on the number of hours/day the plant operated. At the bottom of the sheet, the total number of turbidity samples required for the month will be calculated automatically.
If filling in by paper: For each day, divide the “Hours Plant Operated” by 4 (turbidity readings to be taken 4 hours apart) and round the number up to the next whole number; this will be the number of turbidity readings you will need to have taken for the day.
Daily Maximum This column will be automatically filled; it chooses the highest number entered for the day
Conventional or Direct Filtration At the bottom of the sheet: Please choose Y or N to indicate the category of filtration you are using.
Certification / Signature Sign electronically with a Digital ID
Page 9 – Individual Filter Turbidity Exceedance Report: ALL SURFACE WATER PLANTS WITH FILTRATION
Exceedance Report Record any exceedance of any trigger listed and contact the Kentucky Division of Water Drinking Water Branch within 24 hours.
Trigger Level The “letter” of Trigger Level exceeded; see the bottom of the sheet
Report Required and Timeframe See the bottom of the sheet for the information required to be submitted to the DOW, and the timeframe for submittal, based on the Trigger Level
Page 10 – Chlorite & Chlorine Dioxide: ALL PLANTS USING CHLORINE DIOXIDE
If chlorine dioxide is used as a disinfectant, it is required that chlorite and chlorine dioxide tests be performed daily.
Chlorite: The daily test can be run using amperometric titration. The routine monthly monitoring and additional monthly monitoring due to exceeding the daily MCL must be done by ion chromatography (and reported on a separate compliance form).

10
Chlorine Dioxide: The daily test and additional testing as a result of a daily MRDL exceedance can be run using either amperometric titration or DPD titration. If approved by the State, chlorine dioxide may be measure using DPD test kits.
Bottom of sheet: Information about compliance and required monitoring frequency is provided
Additional Data: ALL SYSTEMS AS NEEDED
This page is for use when there are more data to report than space available on pages one through ten (Ex. more chlorine boosters, disinfectants, etc.).
The sheet is changeable to correspond with the data being reported. Format the columns, rows and headers as you see fit. Be sure to label column headings with the appropriate information (e.g., chemical name/use, analyte name, etc.)
Plant Summary Sheet: ALL SYSTEMS WITH TREATMENT PLANTS
NOTE for those using the eMOR:
Many fields on this page will be automatically populated after completing the rest of the MOR. Be sure to complete the fields that remain and that apply to your water system.
Individual Filter Effluent Turbidity (All plants with filtration) Answer all questions in this section with Y or N.
Combined Filter Effluent Turbidity (All plants with filtration) Indicate whether at least one sample of the combined filter turbidity was taken and recorded for every 4 hours the plant was in operation with Y or N.
Entry Point Residual Disinfectant (All plants) Answer Y or N to indicate if samples were recorded from the online chlorine analyzer each day the plant was in operation.
If the EPRD was less than required for any one reading, was the residual restored within 4 hours of operation: Y or N
Chlorine Dioxide at Entry Point (All plants using Chlorine Dioxide) Answer Y or N to indicate if samples were analyzed each day the plant was in operation.

11
Chlorite at Entry Point (All plants using Chlorine Dioxide) Answer Y or N to indicate if samples were analyzed each day the plant was in operation.
SIGNATURE The OWNER OR THE AUTHORIZED AGENT MUST SIGN THE MOR AFTER REVIEW TO VERIFY THAT THE INFORMATION IS CORRECT. An eSignature is acceptable.
Summary Sheet: ALL PUBLIC WATER SYSTEMS
Purchased Record the state code and PWSID # of the water system that water was purchased from and the total amount purchased. (State codes may be KY, OH, WV, or TN.) Do NOT include any letters or abbreviations indicating the name of the system. Only include 9 digits total (2-letter state code + 7 numbers).
Sold Record the state code and PWSID # of the water system that water was sold to and the total amount sold. (State codes may be KY, OH, WV, or TN.) Do NOT include any letters or abbreviations indicating the name of the system. Only include 9 digits total (2-letter state code + 7 numbers).
(This does not refer to selling water to customers in your own distribution system).
Distribution Residual Disinfectant At bottom of sheet: Indicate with Y or N if at Concentration (All water systems) least one sample was taken each day the
distribution system was in operation.
NOTE: If you are submitting MORs for multiple plants in your system, include the Distribution Residual Disinfectant information on only one MOR. Only one “Summary Sheet” will be accepted in the data system each month for a PWS. Do not repeat the Distribution Residual information on two MORs.
Annual Data – ALL PUBLIC WATER SYSTEMS
* This page will be filled out and sent only one time per year with the December MOR.Water systems must use the Annual Water System Data form DOW0801 (the last sheet inthe eMOR).
Number of Meters List the total number of meters for the applicable type(s).

12
System Population Total population within the distribution system
Use either of the following to obtain the system population (401 KAR 8:200 Section 3)
o United States Census Bureauo Multiply the number of service connections
by 2.69
Consecutive System Populations Systems who sell water to other distribution systems, enter the PWSID for the system sold to and the number of meters served water from your system.
Total Population Served in Total population of the areas within each distribution
Consecutive Systems Systems that are served the sold water.
Contact Information Current or updated contact information for each of those persons listed. Be sure to fill out each line.
Water Sold Total residential gallons sold in current year.
Total commercial gallons sold in current year.
Total industrial gallons sold in current year.
Total wholesale gallons sold in current year.

13
Appendix A: Using Microsoft Excel
Each of these tabs is a “sheet.” Click on one to enter data on that sheet
Row
Each square is a “cell”
Column
All the sheets together make up the “workbook” Use these arrows
to scroll to another sheet