energy and environment health and health care ... · centers and possibly other private-sector...
TRANSCRIPT

This document and trademark(s) contained herein are protected by law as indicated in a notice appearing later in this work. This electronic representation of RAND intellectual property is provided for non-commercial use only. Permission is required from RAND to reproduce, or reuse in another form, any of our research documents for commercial use.
Limited Electronic Distribution Rights
This PDF document was made available from www.rand.org as a public
service of the RAND Corporation.
6Jump down to document
THE ARTS
CHILD POLICY
CIVIL JUSTICE
EDUCATION
ENERGY AND ENVIRONMENT
HEALTH AND HEALTH CARE
INTERNATIONAL AFFAIRS
NATIONAL SECURITY
POPULATION AND AGING
PUBLIC SAFETY
SCIENCE AND TECHNOLOGY
SUBSTANCE ABUSE
TERRORISM AND HOMELAND SECURITY
TRANSPORTATION ANDINFRASTRUCTURE
WORKFORCE AND WORKPLACE
The RAND Corporation is a nonprofit research organization providing objective analysis and effective solutions that address the challenges facing the public and private sectors around the world.
Visit RAND at www.rand.org
Explore RAND Homeland Security Program
View document details
For More Information
Purchase this document
Browse Books & Publications
Make a charitable contribution
Support RAND
This product is part of the RAND Corporation technical report series. Reports may
include research findings on a specific topic that is limited in scope; present discus-
sions of the methodology employed in research; provide literature reviews, survey
instruments, modeling exercises, guidelines for practitioners and research profes-
sionals, and supporting documentation; or deliver preliminary findings. All RAND
reports undergo rigorous peer review to ensure that they meet high standards for re-
search quality and objectivity.

Reducing Terrorism Risk at Shopping CentersAn Analysis of Potential Security Options
Tom LaTourrette, David R. Howell,
David E. Mosher, John MacDonald
The RAND Corporation is a nonprofit research organization providing objective analysis and effective solutions that address the challenges facing the public and private sectors around the world. RAND’s publications do not necessarily ref lect the opinions of its research clients and sponsors.
R® is a registered trademark.
© Copyright 2006 RAND Corporation
All rights reserved. No part of this book may be reproduced in any form by any electronic or mechanical means (including photocopying, recording, or information storage and retrieval) without permission in writing from RAND.
Published 2006 by the RAND Corporation1776 Main Street, P.O. Box 2138, Santa Monica, CA 90407-2138
1200 South Hayes Street, Arlington, VA 22202-50504570 Fifth Avenue, Suite 600, Pittsburgh, PA 15213-2665
RAND URL: http://www.rand.org/To order RAND documents or to obtain additional information, contact
Distribution Services: Telephone: (310) 451-7002; Fax: (310) 451-6915; Email: [email protected]
Library of Congress Cataloging-in-Publication Data
Reducing terrorism risk at shopping centers : an analysis of potential security options / Tom LaTourrette ... [et al.]. p. cm. Includes bibliographical references. ISBN-13: 978-0-8330-4040-4 (pbk. : alk. paper) 1. Shopping centers—Security measures. 2. Terrorism—Prevention. I. LaTourrette, Tom, 1963–
HF5430.R43 2006363.325'938111—dc22
2006033164
The research described in this report was conducted under the auspices of the Homeland Security Program within RAND Infrastructure, Safety, and Environment (ISE).
iii
Preface
Rising concern over the threat of terrorist attacks at private-sector targets has prompted com-mercial industries to consider ways to reduce the risk of terrorism. Shopping centers are par-ticularly vulnerable to terrorist attacks because of their easy access and dense concentrations of people. This vulnerability has resulted in a relatively high risk of attacks: Since 1998, over 60 terrorist attacks at shopping centers have occurred throughout the world.
In response to heightened concerns about terrorism, a commercial property owner-operator asked the RAND Corporation to examine physical security approaches for reduc-ing the risk of terrorist attacks at commercial shopping centers. The study used a modeling approach to identify and prioritize 39 potential security options in terms of their effective-ness at reducing the risk posed by 17 terrorist attack scenarios and their associated costs. The prioritization explicitly accounts for the wide variation in the relative risk (in terms of relative likelihood and consequences) among the scenarios. While the analysis is developed from case studies of three specific shopping centers, the method and findings are generally applicable to commercial shopping centers with a common corridor connecting tenants.
The results of this study, presented in this report, are intended to help guide shopping centers and possibly other private-sector industries in the design and implementation of secu-rity strategies aimed at minimizing the risks of terrorism. The report may also be useful in assisting with the design of incentives, standards, or other policy tools aimed at increasing pri-vate-sector involvement in homeland security. Finally, it is hoped that the analytical approach developed in this study will be a useful step toward a rational and defensible methodology for designing and evaluating security strategies.
The RAND Homeland Security Program
This research was conducted under the auspices of the Homeland Security Program within RAND Infrastructure, Safety, and Environment (ISE). The mission of RAND Infrastruc-ture, Safety, and Environment is to improve the development, operation, use, and protection of society’s essential physical assets and natural resources and to enhance the related social assets of safety and security of individuals in transit and in their workplaces and communities. Homeland Security Program research supports the Department of Homeland Security and other agencies charged with preventing and mitigating the effects of terrorist activity within
iv Reducing Terrorism Risk at Shopping Centers: An Analysis of Potential Security Options
U.S. borders. Projects address critical infrastructure protection, emergency management, ter-rorism risk management, border control, first responders and preparedness, domestic threat assessments, domestic intelligence, and workforce and training.
Questions or comments about this report should be sent to the project leader, Tom LaTourrette ([email protected]). Information about the Homeland Security Pro-gram is available online (http://www.rand.org/ise/security/). Inquiries about homeland secu-rity research projects should be sent to the following address:
Michael Wermuth, DirectorHomeland Security Program, ISERAND Corporation1200 South Hayes StreetArlington, VA 22202-5050703-413-1100, [email protected]

Contents
v
Preface . . . . . . . . . . . . . . . . . . . . . . . . . . . . . . . . . . . . . . . . . . . . . . . . . . . . . . . . . . . . . . . . . . . . . . . . . . . . . . . . . . . . . . . . . . . . . . . . . . . . . . . . . . . iiiFigures . . . . . . . . . . . . . . . . . . . . . . . . . . . . . . . . . . . . . . . . . . . . . . . . . . . . . . . . . . . . . . . . . . . . . . . . . . . . . . . . . . . . . . . . . . . . . . . . . . . . . . . . . . . viiTables . . . . . . . . . . . . . . . . . . . . . . . . . . . . . . . . . . . . . . . . . . . . . . . . . . . . . . . . . . . . . . . . . . . . . . . . . . . . . . . . . . . . . . . . . . . . . . . . . . . . . . . . . . . . ixSummary . . . . . . . . . . . . . . . . . . . . . . . . . . . . . . . . . . . . . . . . . . . . . . . . . . . . . . . . . . . . . . . . . . . . . . . . . . . . . . . . . . . . . . . . . . . . . . . . . . . . . . . . xiAcknowledgments . . . . . . . . . . . . . . . . . . . . . . . . . . . . . . . . . . . . . . . . . . . . . . . . . . . . . . . . . . . . . . . . . . . . . . . . . . . . . . . . . . . . . . . . . . . . xiiiAbbreviations . . . . . . . . . . . . . . . . . . . . . . . . . . . . . . . . . . . . . . . . . . . . . . . . . . . . . . . . . . . . . . . . . . . . . . . . . . . . . . . . . . . . . . . . . . . . . . . . . . . xv
CHAPTER ONE
Introduction . . . . . . . . . . . . . . . . . . . . . . . . . . . . . . . . . . . . . . . . . . . . . . . . . . . . . . . . . . . . . . . . . . . . . . . . . . . . . . . . . . . . . . . . . . . . . . . . . . . . . 1Terrorism and the Private Sector . . . . . . . . . . . . . . . . . . . . . . . . . . . . . . . . . . . . . . . . . . . . . . . . . . . . . . . . . . . . . . . . . . . . . . . . . . . . . . . 1
Shopping Centers as Terrorist Targets. . . . . . . . . . . . . . . . . . . . . . . . . . . . . . . . . . . . . . . . . . . . . . . . . . . . . . . . . . . . . . . . . . . . . . . 1Study Motivation and Objective . . . . . . . . . . . . . . . . . . . . . . . . . . . . . . . . . . . . . . . . . . . . . . . . . . . . . . . . . . . . . . . . . . . . . . . . . . . . . . . 3
Study Approach . . . . . . . . . . . . . . . . . . . . . . . . . . . . . . . . . . . . . . . . . . . . . . . . . . . . . . . . . . . . . . . . . . . . . . . . . . . . . . . . . . . . . . . . . . . . . . . . 4Study Scope. . . . . . . . . . . . . . . . . . . . . . . . . . . . . . . . . . . . . . . . . . . . . . . . . . . . . . . . . . . . . . . . . . . . . . . . . . . . . . . . . . . . . . . . . . . . . . . . . . . . . 4
About This Report . . . . . . . . . . . . . . . . . . . . . . . . . . . . . . . . . . . . . . . . . . . . . . . . . . . . . . . . . . . . . . . . . . . . . . . . . . . . . . . . . . . . . . . . . . . . . . . 5
CHAPTER TWO
Historical Trends in Terrorism. . . . . . . . . . . . . . . . . . . . . . . . . . . . . . . . . . . . . . . . . . . . . . . . . . . . . . . . . . . . . . . . . . . . . . . . . . . . . . . 7Predicting Terrorism Risk from Historical Trends. . . . . . . . . . . . . . . . . . . . . . . . . . . . . . . . . . . . . . . . . . . . . . . . . . . . . . . . . . . 7Data. . . . . . . . . . . . . . . . . . . . . . . . . . . . . . . . . . . . . . . . . . . . . . . . . . . . . . . . . . . . . . . . . . . . . . . . . . . . . . . . . . . . . . . . . . . . . . . . . . . . . . . . . . . . . . . . 8Weapon Types Used in Terrorist Attacks . . . . . . . . . . . . . . . . . . . . . . . . . . . . . . . . . . . . . . . . . . . . . . . . . . . . . . . . . . . . . . . . . . . . . 8Consequences of Terrorist Incidents . . . . . . . . . . . . . . . . . . . . . . . . . . . . . . . . . . . . . . . . . . . . . . . . . . . . . . . . . . . . . . . . . . . . . . . . . . 11
CHAPTER THREE
Modeling the Effect of Security Options on Terrorism Risk . . . . . . . . . . . . . . . . . . . . . . . . . . . . . . . . . . . . . . . . . . 15Modeling Approach. . . . . . . . . . . . . . . . . . . . . . . . . . . . . . . . . . . . . . . . . . . . . . . . . . . . . . . . . . . . . . . . . . . . . . . . . . . . . . . . . . . . . . . . . . . . . 15
Modeling Risk. . . . . . . . . . . . . . . . . . . . . . . . . . . . . . . . . . . . . . . . . . . . . . . . . . . . . . . . . . . . . . . . . . . . . . . . . . . . . . . . . . . . . . . . . . . . . . . . . 16Prioritizing Security Options . . . . . . . . . . . . . . . . . . . . . . . . . . . . . . . . . . . . . . . . . . . . . . . . . . . . . . . . . . . . . . . . . . . . . . . . . . . . . . . . 17
Model Inputs . . . . . . . . . . . . . . . . . . . . . . . . . . . . . . . . . . . . . . . . . . . . . . . . . . . . . . . . . . . . . . . . . . . . . . . . . . . . . . . . . . . . . . . . . . . . . . . . . . . . 18Attack Scenarios . . . . . . . . . . . . . . . . . . . . . . . . . . . . . . . . . . . . . . . . . . . . . . . . . . . . . . . . . . . . . . . . . . . . . . . . . . . . . . . . . . . . . . . . . . . . . . 19Scenario Likelihoods . . . . . . . . . . . . . . . . . . . . . . . . . . . . . . . . . . . . . . . . . . . . . . . . . . . . . . . . . . . . . . . . . . . . . . . . . . . . . . . . . . . . . . . . 20Scenario Consequences. . . . . . . . . . . . . . . . . . . . . . . . . . . . . . . . . . . . . . . . . . . . . . . . . . . . . . . . . . . . . . . . . . . . . . . . . . . . . . . . . . . . . . 22Baseline Relative Risk Estimates . . . . . . . . . . . . . . . . . . . . . . . . . . . . . . . . . . . . . . . . . . . . . . . . . . . . . . . . . . . . . . . . . . . . . . . . . . . 24
vi Reducing Terrorism Risk at Shopping Centers: An Analysis of Potential Security Options
Security Options . . . . . . . . . . . . . . . . . . . . . . . . . . . . . . . . . . . . . . . . . . . . . . . . . . . . . . . . . . . . . . . . . . . . . . . . . . . . . . . . . . . . . . . . . . . . . . 25Option Effectiveness. . . . . . . . . . . . . . . . . . . . . . . . . . . . . . . . . . . . . . . . . . . . . . . . . . . . . . . . . . . . . . . . . . . . . . . . . . . . . . . . . . . . . . . . . . 29Option Costs . . . . . . . . . . . . . . . . . . . . . . . . . . . . . . . . . . . . . . . . . . . . . . . . . . . . . . . . . . . . . . . . . . . . . . . . . . . . . . . . . . . . . . . . . . . . . . . . . . 31Collateral Benefits and Detriments of Security Options. . . . . . . . . . . . . . . . . . . . . . . . . . . . . . . . . . . . . . . . . . . . . . . . . 32
Modeling Results. . . . . . . . . . . . . . . . . . . . . . . . . . . . . . . . . . . . . . . . . . . . . . . . . . . . . . . . . . . . . . . . . . . . . . . . . . . . . . . . . . . . . . . . . . . . . . . . 32General Findings. . . . . . . . . . . . . . . . . . . . . . . . . . . . . . . . . . . . . . . . . . . . . . . . . . . . . . . . . . . . . . . . . . . . . . . . . . . . . . . . . . . . . . . . . . . . . 36Differences Between Centers . . . . . . . . . . . . . . . . . . . . . . . . . . . . . . . . . . . . . . . . . . . . . . . . . . . . . . . . . . . . . . . . . . . . . . . . . . . . . . . 36Costs and Effectiveness of Prioritized Security Options . . . . . . . . . . . . . . . . . . . . . . . . . . . . . . . . . . . . . . . . . . . . . . . . . 37Collateral Impacts of Security Options . . . . . . . . . . . . . . . . . . . . . . . . . . . . . . . . . . . . . . . . . . . . . . . . . . . . . . . . . . . . . . . . . . . 38Sensitivity to Model Parameters. . . . . . . . . . . . . . . . . . . . . . . . . . . . . . . . . . . . . . . . . . . . . . . . . . . . . . . . . . . . . . . . . . . . . . . . . . . . 38Results for Heightened Threat Conditions . . . . . . . . . . . . . . . . . . . . . . . . . . . . . . . . . . . . . . . . . . . . . . . . . . . . . . . . . . . . . . . 44
Summary. . . . . . . . . . . . . . . . . . . . . . . . . . . . . . . . . . . . . . . . . . . . . . . . . . . . . . . . . . . . . . . . . . . . . . . . . . . . . . . . . . . . . . . . . . . . . . . . . . . . . . . . . 51
CHAPTER FOUR
Additional Components of Terrorism Security at Shopping Centers . . . . . . . . . . . . . . . . . . . . . . . . . . . . . . . . 53Standby Considerations . . . . . . . . . . . . . . . . . . . . . . . . . . . . . . . . . . . . . . . . . . . . . . . . . . . . . . . . . . . . . . . . . . . . . . . . . . . . . . . . . . . . . . . . 53
Preparing for Future Acquisitions. . . . . . . . . . . . . . . . . . . . . . . . . . . . . . . . . . . . . . . . . . . . . . . . . . . . . . . . . . . . . . . . . . . . . . . . . . . 53Data Collection Opportunities. . . . . . . . . . . . . . . . . . . . . . . . . . . . . . . . . . . . . . . . . . . . . . . . . . . . . . . . . . . . . . . . . . . . . . . . . . . . . 54Modeling Opportunities . . . . . . . . . . . . . . . . . . . . . . . . . . . . . . . . . . . . . . . . . . . . . . . . . . . . . . . . . . . . . . . . . . . . . . . . . . . . . . . . . . . . 54Psychological Implications. . . . . . . . . . . . . . . . . . . . . . . . . . . . . . . . . . . . . . . . . . . . . . . . . . . . . . . . . . . . . . . . . . . . . . . . . . . . . . . . . . 54
Structural Design Considerations. . . . . . . . . . . . . . . . . . . . . . . . . . . . . . . . . . . . . . . . . . . . . . . . . . . . . . . . . . . . . . . . . . . . . . . . . . . . 54Standoff . . . . . . . . . . . . . . . . . . . . . . . . . . . . . . . . . . . . . . . . . . . . . . . . . . . . . . . . . . . . . . . . . . . . . . . . . . . . . . . . . . . . . . . . . . . . . . . . . . . . . . . . 55Hardening Structures . . . . . . . . . . . . . . . . . . . . . . . . . . . . . . . . . . . . . . . . . . . . . . . . . . . . . . . . . . . . . . . . . . . . . . . . . . . . . . . . . . . . . . . 56
Strategic Security Considerations . . . . . . . . . . . . . . . . . . . . . . . . . . . . . . . . . . . . . . . . . . . . . . . . . . . . . . . . . . . . . . . . . . . . . . . . . . . . . 57Special Operational Environments. . . . . . . . . . . . . . . . . . . . . . . . . . . . . . . . . . . . . . . . . . . . . . . . . . . . . . . . . . . . . . . . . . . . . . . . . . . . 57
CHAPTER FIVE
Implications for Terrorism Security at Shopping Centers . . . . . . . . . . . . . . . . . . . . . . . . . . . . . . . . . . . . . . . . . . . . . 59
APPENDIXES
A. Summary of Terrorist Attacks at Shopping Centers . . . . . . . . . . . . . . . . . . . . . . . . . . . . . . . . . . . . . . . . . . . . . . . 63B. Model Input Parameters and Results . . . . . . . . . . . . . . . . . . . . . . . . . . . . . . . . . . . . . . . . . . . . . . . . . . . . . . . . . . . . . . . . . 81
References . . . . . . . . . . . . . . . . . . . . . . . . . . . . . . . . . . . . . . . . . . . . . . . . . . . . . . . . . . . . . . . . . . . . . . . . . . . . . . . . . . . . . . . . . . . . . . . . . . . . . 103

Figures
vii
1.1. Terrorist Attacks at Shopping Centers, 1998–2005 . . . . . . . . . . . . . . . . . . . . . . . . . . . . . . . . . . . . . . . . . . . . 22.1. Distribution of Terrorist Attacks by Weapon Type, 1998–2005. . . . . . . . . . . . . . . . . . . . . . . . . . . . . 102.2. Distribution of Fatalities from Terrorist Bombings, 1998–2005 . . . . . . . . . . . . . . . . . . . . . . . . . . . . 123.1. Modeling Approach . . . . . . . . . . . . . . . . . . . . . . . . . . . . . . . . . . . . . . . . . . . . . . . . . . . . . . . . . . . . . . . . . . . . . . . . . . . . . . . 163.2. Baseline Relative Risk for Scenarios . . . . . . . . . . . . . . . . . . . . . . . . . . . . . . . . . . . . . . . . . . . . . . . . . . . . . . . . . . . . . 253.3. Prioritized Security Options for Center A . . . . . . . . . . . . . . . . . . . . . . . . . . . . . . . . . . . . . . . . . . . . . . . . . . . . . . 333.4. Prioritized Security Options for Center B . . . . . . . . . . . . . . . . . . . . . . . . . . . . . . . . . . . . . . . . . . . . . . . . . . . . . 343.5. Prioritized Security Options for Center C . . . . . . . . . . . . . . . . . . . . . . . . . . . . . . . . . . . . . . . . . . . . . . . . . . . . . . 353.6. Collateral Impacts of Prioritized Security Options for Center A . . . . . . . . . . . . . . . . . . . . . . . . . . . . 393.7. Collateral Impacts of Prioritized Security Options for Center B . . . . . . . . . . . . . . . . . . . . . . . . . . . 403.8. Collateral Impacts of Prioritized Security Options for Center C . . . . . . . . . . . . . . . . . . . . . . . . . . . . 413.9. Wait Times for Customer Entrance Security Screening Checkpoints. . . . . . . . . . . . . . . . . . . . . . 42
3.10. Wait Times for Vehicle Security Screening Checkpoints . . . . . . . . . . . . . . . . . . . . . . . . . . . . . . . . . . . . 433.11. Distributions of Rank Assignments for Top Six Options . . . . . . . . . . . . . . . . . . . . . . . . . . . . . . . . . . . . 443.12. Effect of Alternate Likelihood Profiles on Option Rankings for Center B . . . . . . . . . . . . . . . . . 453.13. Effect of Consequence Weighting on Option Rankings for Center B . . . . . . . . . . . . . . . . . . . . . 463.14. Prioritized Security Options for Explosives Scenarios. . . . . . . . . . . . . . . . . . . . . . . . . . . . . . . . . . . . . . . . 483.15. Prioritized Security Options for Firearms Scenarios . . . . . . . . . . . . . . . . . . . . . . . . . . . . . . . . . . . . . . . . . . 493.16. Prioritized Security Options for Chemical and Biological Weapon Scenarios . . . . . . . . . . . . 50B.1. Collateral Benefits and Detriments of Security Options. . . . . . . . . . . . . . . . . . . . . . . . . . . . . . . . . . . . . 98


Tables
ix
2.1. Frequency by Weapon Type of Terrorist Attacks, 1998–2005 . . . . . . . . . . . . . . . . . . . . . . . . . . . . . . . . 92.2. Average Fatalities for Different Attack Types, 1998–2005 . . . . . . . . . . . . . . . . . . . . . . . . . . . . . . . . . . . 133.1. Terrorist Attack Scenarios . . . . . . . . . . . . . . . . . . . . . . . . . . . . . . . . . . . . . . . . . . . . . . . . . . . . . . . . . . . . . . . . . . . . . . . . 193.2. Scenario Relative Likelihoods . . . . . . . . . . . . . . . . . . . . . . . . . . . . . . . . . . . . . . . . . . . . . . . . . . . . . . . . . . . . . . . . . . . . 213.3. Likelihood Profiles for Terrorist Attack Scenarios . . . . . . . . . . . . . . . . . . . . . . . . . . . . . . . . . . . . . . . . . . . . 223.4. Scenario Consequences . . . . . . . . . . . . . . . . . . . . . . . . . . . . . . . . . . . . . . . . . . . . . . . . . . . . . . . . . . . . . . . . . . . . . . . . . . 233.5. Downtime Scale. . . . . . . . . . . . . . . . . . . . . . . . . . . . . . . . . . . . . . . . . . . . . . . . . . . . . . . . . . . . . . . . . . . . . . . . . . . . . . . . . . . 243.6. Security Options . . . . . . . . . . . . . . . . . . . . . . . . . . . . . . . . . . . . . . . . . . . . . . . . . . . . . . . . . . . . . . . . . . . . . . . . . . . . . . . . . . 263.7. Effectiveness Criteria . . . . . . . . . . . . . . . . . . . . . . . . . . . . . . . . . . . . . . . . . . . . . . . . . . . . . . . . . . . . . . . . . . . . . . . . . . . . . 303.8. Summary of Key General Results . . . . . . . . . . . . . . . . . . . . . . . . . . . . . . . . . . . . . . . . . . . . . . . . . . . . . . . . . . . . . . 364.1. Structural Damage and Injuries Due to Explosion Effects . . . . . . . . . . . . . . . . . . . . . . . . . . . . . . . . . . . 55A.1. Summary of Terrorist Attacks at Shopping Centers . . . . . . . . . . . . . . . . . . . . . . . . . . . . . . . . . . . . . . . . . . . 63
B.1a. Security Option Effectiveness: Scenarios 1–9 . . . . . . . . . . . . . . . . . . . . . . . . . . . . . . . . . . . . . . . . . . . . . . . . . . 81B.1b. Security Option Effectiveness: Scenarios 10–17 . . . . . . . . . . . . . . . . . . . . . . . . . . . . . . . . . . . . . . . . . . . . . . 87B.2. Security Option Cost Elements . . . . . . . . . . . . . . . . . . . . . . . . . . . . . . . . . . . . . . . . . . . . . . . . . . . . . . . . . . . . . . . . . . 93B.3. Security Option Annual Costs for Centers . . . . . . . . . . . . . . . . . . . . . . . . . . . . . . . . . . . . . . . . . . . . . . . . . . . . 96B.4. Prioritized Security Options for Center A . . . . . . . . . . . . . . . . . . . . . . . . . . . . . . . . . . . . . . . . . . . . . . . . . . . . . 99B.5. Prioritized Security Options for Center B . . . . . . . . . . . . . . . . . . . . . . . . . . . . . . . . . . . . . . . . . . . . . . . . . . . . 100B.6. Prioritized Security Options for Center C . . . . . . . . . . . . . . . . . . . . . . . . . . . . . . . . . . . . . . . . . . . . . . . . . . . . 101


xi
Summary
The threat of terrorism at commercial shopping centers is a prominent concern, with over 60 terrorist attacks against shopping centers in 21 countries since 1998. Because of this threat, shopping center operators are beginning to explore and implement increased security efforts specifically designed to combat terrorism. In order to help understand methods for reducing the risk of terrorist attacks in shopping centers, we have used a modeling approach to help shopping center operators evaluate candidate security options in terms of their effectiveness at reducing terrorism risk.
The basic modeling approach involves incrementally reducing the risk from terrorism by sequentially implementing security options. Security options are selected by weighing the effec-tiveness of specific options in reducing the risk of particular terrorist attack scenarios against the costs of implementing those options. Model inputs are derived from multiple sources, including statistical analyses of historical trends in terrorism, case studies of individual shop-ping centers, and review of security and crime deterrence literature. The model output is a pri-oritized list of security options and an estimate of the cumulative reduction in terrorism risk associated with the addition of each option.
The modeling results for the three centers examined share several common characteristics that reflect some important general conclusions about terrorism security at commercial shop-ping centers that can be drawn from our analysis:
Based on our model and assumptions, implementing security options can substantially decrease the terrorism risk at a shopping center: We find that, if all the security options considered in this study were implemented, the risk of terrorism could be reduced by a factor of 20.The prioritization of security options is similar for the different centers examined. Eight of the top 10 options for each of the three centers are the same, and few options are shifted by more than two positions among the three centers.The prioritization of security options is strongly driven by the risk of bomb attacks. Because the overall terrorism risk is dominated by bomb attacks, the model selectively chooses options that address bomb attacks.Most of the risk reduction occurs with the highest-priority options. The cumulative risk drops steeply with the initial options, then decreases more gradually as additional options
•
•
•
•
xii Reducing Terrorism Risk at Shopping Centers: An Analysis of Potential Security Options
are added. We find that 95 percent of the total reduction achievable with all options is provided by the first 6–10 options (the “high-priority set”).Most risk reduction occurs with less expensive options; the average cost of each of the options in the high-priority set is 20–35 percent of the average cost of all the options.The overall annual cost of the high-priority set of options ranges from $0.4 million to $2.0 million at the three centers examined.The high-priority set of security options spans a diverse range of approaches, including communication and education, emergency response, customer entrance management, vehicle management, and building management.
In conjunction with the quantitative model, we also include qualitative estimates of the collateral benefits and detriments of each security option. We also examine some security issues outside the model framework, such as structural hardening considerations and “standby” pos-tures to facilitate the rapid implementation of security options.
Our analysis has some important implications for terrorism security at commercial shop-ping centers. First, a strategy to reduce the risk of terrorism will be similar for most shopping centers. Our analysis indicates that the principal risk-reducing security options do not differ dramatically across the three types of centers examined in this study.
Second, disaster preparedness plans and exercises that focus primarily on emergency response do little to reduce terrorism risk. The vast majority of terrorism risk derives from attacks using explosives, for which the effects are immediate and the hazard abates very quickly.As a result, little can be done to reduce consequences (casualties or property damage) of a ter-rorist attack once it has occurred.
Third, centers that move to implement terrorism security options early may experience both challenges and advantages. Some of the high-priority security options identified in the analysis are expected to have negative collateral effects that, if great enough, may cause some shoppers to shop elsewhere. On the other hand, were the threat from terrorism to be perceived as increasing, the psychology may be reversed and customers may feel safer in centers with increased security. As terrorism security is increased in the United States and elsewhere, it would be instructive to examine the customer responses to increasing terrorism security.
Fourth, a tiered implementation may be the best strategy. One way to approach the prob-lem of reducing the risk of terrorist attack is to implement a set of security options that are most appropriate for today’s environment and develop plans today for further measures to take if the environment changes for the worse. Those plans could address precontracting for equip-ment and services, collecting data needed to implement options efficiently, educating staff on the measures, and planning public relations efforts. Such efforts would reduce the time and disruption involved in implementing future measures.
Finally, decisions about when to implement security options will depend on perceptions of the absolute risk of terrorism. This analysis provides useful guidance about prioritizing security options to reduce terrorism risk, but it does not address the risk of terrorism overall or when to begin implementing terrorism security options. Despite the best analytical efforts, the evolution of this perception is likely to be guided by indirect indicators, such as government actions and guidance, political changes, press coverage, or industry trends.
•
•
•
xiii
Acknowledgments
We thank Michael Thompson of RAND for helping to define the initial research problem and for guidance throughout the project. The modeling approach used in this study grew out of prior modeling work at RAND by Richard Hillestad and Paul Dreyer, and we benefited from their suggestions and guidance. We also thank Paul Dreyer for writing the computer program for the model and Kimberly Curry for research assistance. We gratefully acknowledge Ami Pedahzur (University of Texas, Austin) and Sara Daly and Brian Jackson (RAND) for helpful peer reviews that strengthened the report.


xv
Abbreviations
ISE Infrastructure, Safety, and EnvironmentMIPT National Memorial Institute for the Prevention of Terrorism

1
CHAPTER ONE
Introduction
Terrorism and the Private Sector
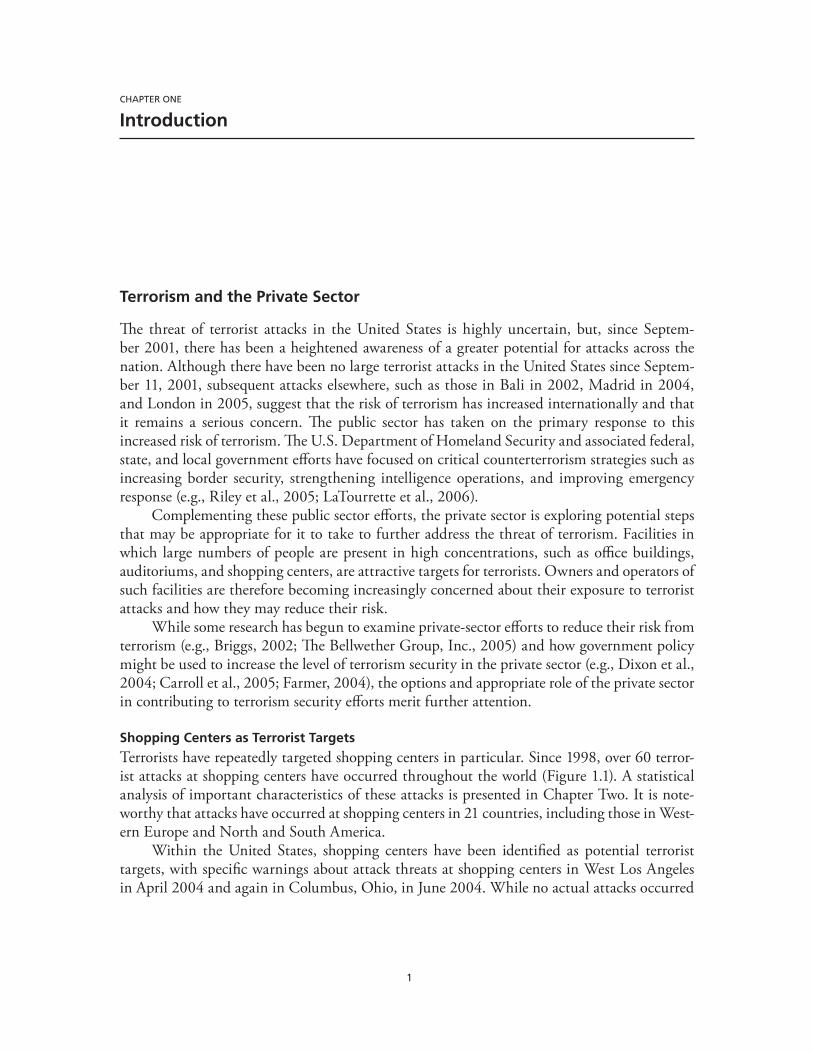
The threat of terrorist attacks in the United States is highly uncertain, but, since Septem-ber 2001, there has been a heightened awareness of a greater potential for attacks across the nation. Although there have been no large terrorist attacks in the United States since Septem-ber 11, 2001, subsequent attacks elsewhere, such as those in Bali in 2002, Madrid in 2004, and London in 2005, suggest that the risk of terrorism has increased internationally and that it remains a serious concern. The public sector has taken on the primary response to this increased risk of terrorism. The U.S. Department of Homeland Security and associated federal, state, and local government efforts have focused on critical counterterrorism strategies such as increasing border security, strengthening intelligence operations, and improving emergency response (e.g., Riley et al., 2005; LaTourrette et al., 2006).
Complementing these public sector efforts, the private sector is exploring potential steps that may be appropriate for it to take to further address the threat of terrorism. Facilities in which large numbers of people are present in high concentrations, such as office buildings, auditoriums, and shopping centers, are attractive targets for terrorists. Owners and operators of such facilities are therefore becoming increasingly concerned about their exposure to terrorist attacks and how they may reduce their risk.
While some research has begun to examine private-sector efforts to reduce their risk from terrorism (e.g., Briggs, 2002; The Bellwether Group, Inc., 2005) and how government policy might be used to increase the level of terrorism security in the private sector (e.g., Dixon et al., 2004; Carroll et al., 2005; Farmer, 2004), the options and appropriate role of the private sector in contributing to terrorism security efforts merit further attention.
Shopping Centers as Terrorist Targets
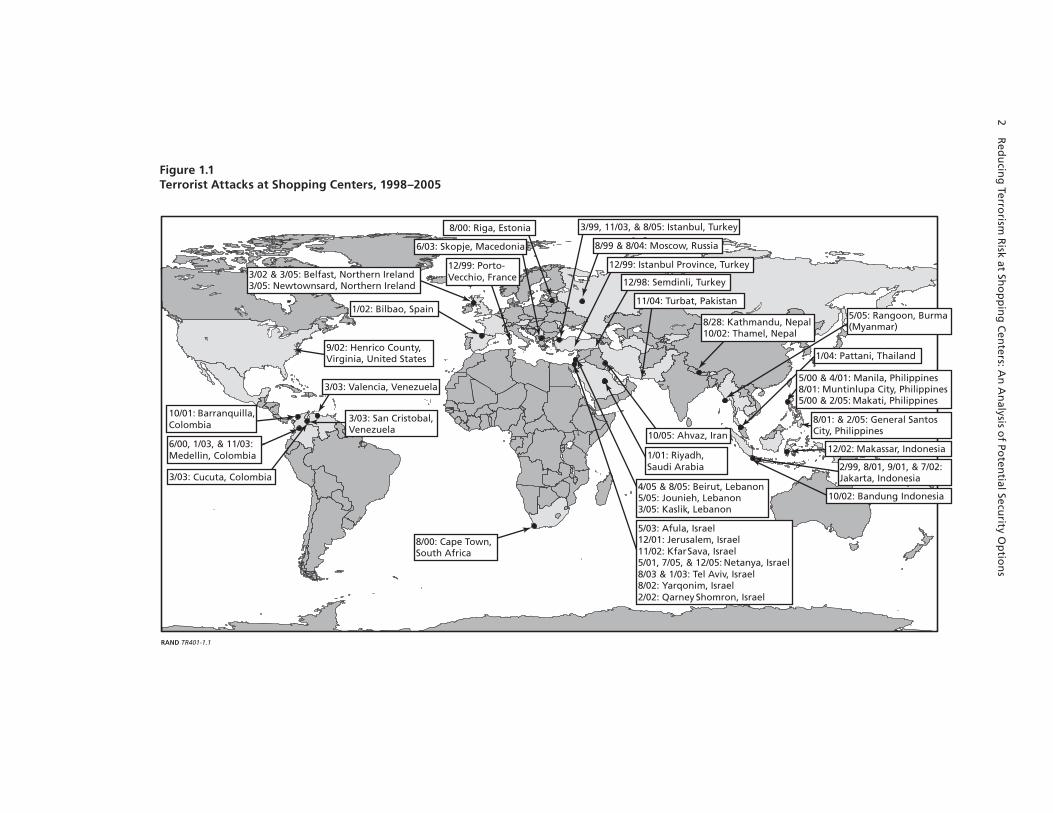
Terrorists have repeatedly targeted shopping centers in particular. Since 1998, over 60 terror-ist attacks at shopping centers have occurred throughout the world (Figure 1.1). A statisticalanalysis of important characteristics of these attacks is presented in Chapter Two. It is note-worthy that attacks have occurred at shopping centers in 21 countries, including those in West-ern Europe and North and South America.
Within the United States, shopping centers have been identified as potential terrorist targets, with specific warnings about attack threats at shopping centers in West Los Angeles in April 2004 and again in Columbus, Ohio, in June 2004. While no actual attacks occurred
2 Red
ucin
g Terro
rism R
isk at Sho
pp
ing
Cen
ters: An
An
alysis of Po
tential Secu
rity Op
tion
s
Figure 1.1Terrorist Attacks at Shopping Centers, 1998–2005
RAND TR401-1.1
5/05: Rangoon, Burma(Myanmar)
10/01: Barranquilla,Colombia
6/00, 1/03, & 11/03:Medellin, Colombia
3/03: Valencia, Venezuela
3/03: Cucuta, Colombia
9/02: Henrico County,Virginia, United States
8/00: Riga, Estonia
12/99: Porto-Vecchio, France
10/02: Bandung, Indonesia
2/99, 8/01, 9/01, & 7/02:Jakarta, Indonesia
12/02: Makassar, Indonesia
5/00 & 4/01: Manila, Philippines8/01: Muntinlupa City, Philippines5/00 & 2/05: Makati, Philippines
1/04: Pattani, Thailand
10/05: Ahvaz, Iran
1/01: Riyadh,Saudi Arabia
5/03: Afula, Israel12/01: Jerusalem, Israel11/02: KfarSava, Israel5/01, 7/05, & 12/05: Netanya, Israel8/03 & 1/03: Tel Aviv, Israel8/02: Yarqonim, Israel2/02: Qarney Shomron, Israel
4/05 & 8/05: Beirut, Lebanon5/05: Jounieh, Lebanon3/05: Kaslik, Lebanon
6/03: Skopje, Macedonia 8/99 & 8/04: Moscow, Russia
8/00: Cape Town,South Africa
3/99, 11/03, & 8/05: Istanbul, Turkey
12/98: Semdinli, Turkey
12/99: Istanbul Province, Turkey
8/01: & 2/05: General SantosCity, Philippines
8/28: Kathmandu, Nepal10/02: Thamel, Nepal
11/04: Turbat, Pakistan
3/02 & 3/05: Belfast, Northern Ireland3/05: Newtownsard, Northern Ireland
1/02: Bilbao, Spain
3/03: San Cristobal, Venezuela
Introduction 3
in either case, the Los Angeles warning prompted the deployment of over 100 local and federal law enforcement officials to local shopping centers, leading to widespread panic and disruption (Yang, 2004).
In terms of their potential role as terrorist targets, shopping centers present numerous challenges for security. Shopping centers are distributed throughout the United States, both in areas that are considered high risk for terrorist attack (e.g., prominent cities or areas with iconic targets) and in areas that are not (e.g., rural or suburban areas).1 This wide distribution makes prioritizing security efforts difficult. Shopping centers also allow unimpeded access to the public and attract a wide cross-section of the nation’s population. In addition, most people have access to alternative venues for their shopping needs and can therefore avoid shopping centers without suffering undue hardship. Shopping centers therefore differ markedly from facilities like airports, which provide an essential service with few alternatives. For this reason, shopping center customers and tenants may not tolerate the expense and inconvenience of increased security. In addition, shopping center operations are governed by a complicated own-ership and decisionmaking structure consisting of, among others, property owners and manag-ers, tenant retailers, on-site employees, contract security, and customers. This multistakeholder structure increases the difficulties of implementing security and other risk-reduction measures. Finally, as with any competitive private-sector business, shopping centers may have a difficult time justifying investment in reducing the seemingly remote risk of terrorism.
Because shopping centers remain attractive targets for terrorists, stakeholders are begin-ning to consider increased security measures. In light of the security challenges discussed above, understanding methods for reducing the risk of terrorist attacks in shopping centers is therefore an important topic for public policy analysis.
Study Motivation and Objective
In light of continuing concerns about the risk of terrorist attacks at shopping centers and the uncertainties and complexities involved in reducing that risk, the RAND Corporation under-took a study to examine vulnerabilities to terrorist threats at shopping centers and to assess security options that could be implemented to reduce these vulnerabilities.
The primary objective of the study was to identify and prioritize security options that could help reduce the risk of terrorist attack losses at commercial shopping centers. The inten-tion is not to recommend which specific security options should be implemented immediately, but rather which security options make the most sense in terms of cost and effectiveness against particular threats. Decisions about which options to implement and when to implement them will depend on how perceptions about the absolute risk of terrorist attacks at shopping centers evolve in a changing threat environment over time. Some stakeholders could choose to imple-ment some of the security options analyzed in this report immediately, but many of the options may not be feasible or appropriate under current conditions. If the terrorist threat in the United
1 In fact, one could argue that their suburban origins may make shopping centers icons of nonurban America and draw the threat outside nominally high-risk urban areas.

4 Reducing Terrorism Risk at Shopping Centers: An Analysis of Potential Security Options
States increases over time, then the security options and priorities identified in this report pro-vide a basis upon which to plan for increasing security as the risks increase.
Study Approach
Our analysis is built largely around a modeling approach in which the estimated effective-ness of specific security options in reducing the risk of particular terrorist attack scenarios is weighed against the costs of implementing those options. The basic elements of the model are a set of attack scenarios, estimates of the relative likelihoods and the consequences of each sce-nario, a set of potential security options, the cost of each option, and the likely effectiveness of each option in each scenario. These inputs are drawn from multiple sources, including a survey of terrorist attack statistics in shopping centers and in general throughout the world. For a given risk outlook, the model provides a prioritized list of security options and the cumulative decrease in relative risk and the cumulative cost as each option is implemented.
We also examine some security issues outside the model framework. These include pre-paring “standby” postures that facilitate the rapid implementation of security options, some aspects of structural design criteria, considerations for special events, and the importance of addressing terrorism both at the facility level and at the company or industry level.
Study Scope
Although we use the general term shopping center, our analysis is restricted to centers with a common corridor connecting tenants (malls in the terminology of DeLisle, 2005). We do not consider centers in which most tenants are accessed directly from a parking lot or street (open-air centers), although we do consider outdoor malls. We apply our model of terrorist sce-narios and security options to three specific shopping centers: an outdoor shopping center with underground parking (Center A), a large indoor center surrounded by surface parking (Center B), and an urban center at which many customers enter from the street and from public trans-portation (Center C). The specific centers span a range of important shopping center char-acteristics, such as size, parking arrangements, indoor versus outdoor, and urban versus sub-urban. This set of centers was chosen to help understand the extent to which different access and design characteristics influence the prioritization of security options and to provide a more generalizable test of the risk-reducing effects of security options in shopping centers.
In addition, our analysis considers individual center-level security options only—it does not cover company- or industry-wide steps.2 While we do consider differences in the physical design characteristics of the three centers, we do not consider any variations in the exogenous threat of terrorism that may exist among the centers (e.g., from being located in higher-risk cities). Finally, we consider the threat from terrorism only and do not consider benefits to non-terrorism security concerns or indirect negative implications of security options (e.g., customer
2 Because of so-called target shifting, or displacement (i.e., terrorists deterred from one target may choose an alternate target), site-specific security measures are likely to reduce the risk to society as a whole less than they do at the individual site of interest. This possibility could have implications for how security measures are implemented (e.g., Lakdawalla and Zanjani, 2004).

Introduction 5
resistance). We do provide a qualitative estimate of these implications, some of which may have an important influence on decisionmaking.
About This Report
Chapter Two presents a summary of statistics on terrorist attacks at shopping centers that are used to help us estimate the relative likelihoods and consequences of different attack scenarios. Chapter Three presents our security options model and a discussion of the findings, which include prioritized lists of security options. We also examine how the findings change under different assumptions about the threat conditions and other variables. Chapter Four discusses additional issues relevant to terrorism security at shopping centers. The report concludes in Chapter Five with a discussion of some general implications of our analysis regarding reducing the risk of terrorism in commercial shopping centers.


7
CHAPTER TWO
Historical Trends in Terrorism
Predicting Terrorism Risk from Historical Trends
In this chapter, we summarize recent (1998–2005) historical trends in terrorism. In particu-lar, we characterize the relative frequency of different types of terrorist attacks and the con-sequences of those different types of attacks. Our analysis examines both terrorist incidents in general and terrorist incidents specifically targeting shopping centers. The objective is to inform estimates of the relative likelihoods and consequences of the terrorist attack scenarios we examine in our risk modeling.
Making assessments about future likelihood or consequences of particular terrorist attacks is an elusive undertaking. One approach is to examine recent historical evidence of what types of attacks terrorists have been conducted and what the consequences of those attacks have been. There is considerable debate about the extent to which historical trends in terrorism can be used to predict terrorism risk in the future (e.g., Willis et al., 2005; Grossi and Kunreuther, 2005; Sauter and Carafano, 2005; Haimes, 2004). Compared with other risks (e.g., automo-bile accidents), there are limited statistical data about terrorist attacks from which to param-eterize terrorism risk rigorously in terms of relevant variables such as target type, weapon type, and geographic location.
Extrapolation from historical trends is also difficult because terrorist organizations are known to evolve and adapt as security and counterterrorism efforts are implemented (e.g., Jackson et al., 2005a, 2005b). A related uncertainty is the difficulty in predicting how terror-ism, which so far has occurred largely outside the United States, will evolve if it becomes a more common threat in the United States.
In short, no golden rule says that terrorists will continue to choose targets or carry out attacks in a similar manner as they have in the recent past. However, we must begin by char-acterizing data from recent incidents and then determine which, if any, of the parameters esti-mated are likely to be different today and in the future.
8 Reducing Terrorism Risk at Shopping Centers: An Analysis of Potential Security Options
Data
We used data from the RAND–National Memorial Institute for the Prevention of Terrorism (MIPT) Terrorism Incident Database.1 Observations were restricted to those that occurred between January 1, 1998, and December 31, 2005, because we are interested in assessing more-recent consequences of terrorist incidents. We eliminated observations in which an attack was interrupted or aborted. We also eliminated attacks that occurred in Iraq after March 2003. While attacks in Iraq might be considered acts of terrorism, we do not think that they appro-priately characterize the risk facing potential targets outside Iraq.
This analysis included a total of 12,831 observations. Some of the observations do not report data for specific parameters. For example, for analyzing the average number of fatalities by weapon type, only 9,614 observations report the number of fatalities. That analysis excluded observations with missing data.
The RAND-MIPT Terrorism Incident Database does not specify car or truck bomb as a weapon type. The weapon field for attacks using car or truck bombs is categorized simplyas explosives. For our purposes, we believed that it was useful to analyze car bomb incidents as a specific weapon type. Car bombs have the potential to deliver a much higher explosive yield than, say, a backpack, package, or pedestrian suicide bomb, and security measures relevant to them are very different. Therefore, we used the description field to identify incidents that involved a car or truck bomb. When it was concluded from the terrorist incident description that a car or truck bomb was clearly used, we classified the weapon type as a car or truck bomb. It is important to note that this process may not result in the identification of every car and truck bomb incident. For example, a car bomb incident may appear in the database that does not include the phrase “car bomb” in the description field. However, this process does pull out instances in which it is clear from the description that a car or truck bomb was used.
Additionally, we compared the differences between terrorist incidents against any target with those against shopping centers. To do this, we first separated incidents that had occur-rences of the words “mall” or “shopping center” in the description field. Then we examined the descriptions to ensure that the incident did target a shopping center or mall (e.g., some descrip-tions made reference to a previous attack by the same group that targeted a mall; such incidents are not be included here). Between 1998 and 2005, 62 incidents met the previously discussed inclusion criteria and clearly targeted a shopping center based on the description. Short descrip-tions and other data fields from the shopping center attacks are listed in Appendix A.
Weapon Types Used in Terrorist Attacks
A key consideration in prioritizing efforts to address the risk of terrorism is understanding the relative frequency of different weapons used by terrorists. Different security measures address
1 RAND has maintained the RAND Terrorism Chronology, a database of international terrorism incidents, since 1972. More recently, RAND database efforts have been supported under contract with MIPT. The newer data set, called the RAND-MIPT Terrorism Incident Database, includes all terrorist incidents worldwide—international and domestic—since 1998. For the combined databases, see MIPT (undated).
Historical Trends in Terrorism 9
different weapon and attack types, and an overall security approach needs to be based on an expectation about what sorts of incidents are most likely. In this section, we first examine data for all incidents that meet the inclusion criteria described previously to understand the relative frequencies with which different weapons are used. We then compare the results for all inci-dents with those targeting shopping centers to determine whether there are differences in the weapons terrorists use when attacking malls or shopping centers. The objective is to provide a basis for estimating likelihoods for different attack scenarios modeled in Chapter Three.
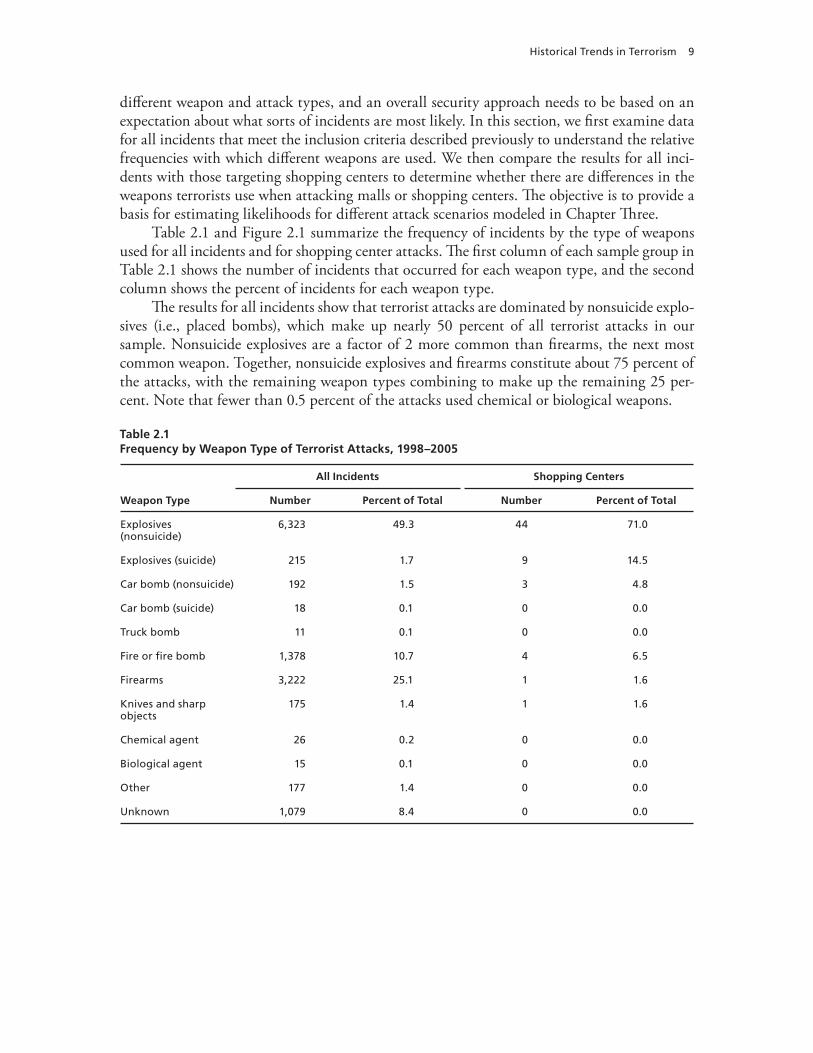
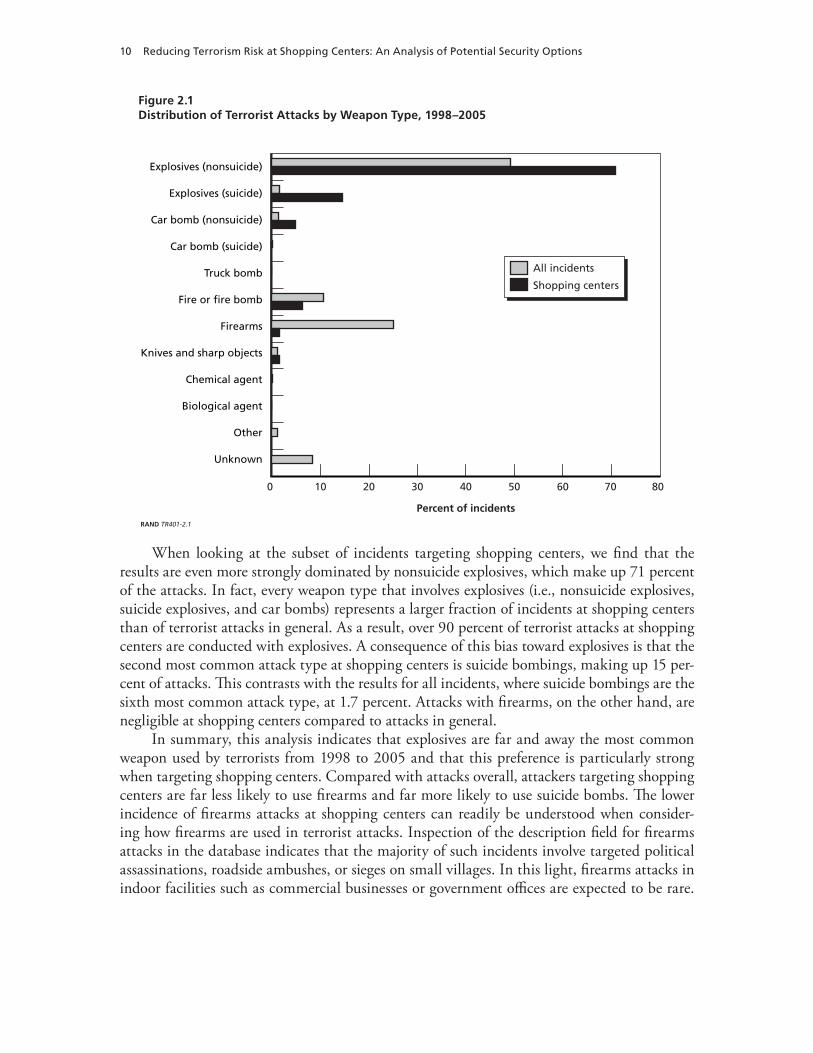
Table 2.1 and Figure 2.1 summarize the frequency of incidents by the type of weapons used for all incidents and for shopping center attacks. The first column of each sample group in Table 2.1 shows the number of incidents that occurred for each weapon type, and the second column shows the percent of incidents for each weapon type.
The results for all incidents show that terrorist attacks are dominated by nonsuicide explo-sives (i.e., placed bombs), which make up nearly 50 percent of all terrorist attacks in our sample. Nonsuicide explosives are a factor of 2 more common than firearms, the next most common weapon. Together, nonsuicide explosives and firearms constitute about 75 percent of the attacks, with the remaining weapon types combining to make up the remaining 25 per-cent. Note that fewer than 0.5 percent of the attacks used chemical or biological weapons.
Table 2.1Frequency by Weapon Type of Terrorist Attacks, 1998–2005
Weapon Type
All Incidents Shopping Centers
Number Percent of Total Number Percent of Total
Explosives (nonsuicide)
6,323 49.3 44 71.0
Explosives (suicide) 215 1.7 9 14.5
Car bomb (nonsuicide) 192 1.5 3 4.8
Car bomb (suicide) 18 0.1 0 0.0
Truck bomb 11 0.1 0 0.0
Fire or fire bomb 1,378 10.7 4 6.5
Firearms 3,222 25.1 1 1.6
Knives and sharp objects
175 1.4 1 1.6
Chemical agent 26 0.2 0 0.0
Biological agent 15 0.1 0 0.0
Other 177 1.4 0 0.0
Unknown 1,079 8.4 0 0.0
10 Reducing Terrorism Risk at Shopping Centers: An Analysis of Potential Security Options
Figure 2.1Distribution of Terrorist Attacks by Weapon Type, 1998–2005
Percent of incidents
All incidents
Shopping centers
Explosives (nonsuicide)
Explosives (suicide)
Car bomb (nonsuicide)
Car bomb (suicide)
Truck bomb
Fire or fire bomb
Firearms
Knives and sharp objects
Chemical agent
Biological agent
Other
Unknown
706050403020100 80
RAND TR401-2.1
When looking at the subset of incidents targeting shopping centers, we find that the results are even more strongly dominated by nonsuicide explosives, which make up 71 percent of the attacks. In fact, every weapon type that involves explosives (i.e., nonsuicide explosives, suicide explosives, and car bombs) represents a larger fraction of incidents at shopping centers than of terrorist attacks in general. As a result, over 90 percent of terrorist attacks at shopping centers are conducted with explosives. A consequence of this bias toward explosives is that the second most common attack type at shopping centers is suicide bombings, making up 15 per-cent of attacks. This contrasts with the results for all incidents, where suicide bombings are the sixth most common attack type, at 1.7 percent. Attacks with firearms, on the other hand, are negligible at shopping centers compared to attacks in general.
In summary, this analysis indicates that explosives are far and away the most common weapon used by terrorists from 1998 to 2005 and that this preference is particularly strong when targeting shopping centers. Compared with attacks overall, attackers targeting shopping centers are far less likely to use firearms and far more likely to use suicide bombs. The lower incidence of firearms attacks at shopping centers can readily be understood when consider-ing how firearms are used in terrorist attacks. Inspection of the description field for firearms attacks in the database indicates that the majority of such incidents involve targeted political assassinations, roadside ambushes, or sieges on small villages. In this light, firearms attacks in indoor facilities such as commercial businesses or government offices are expected to be rare.
Historical Trends in Terrorism 11
The reason for the higher incidence of suicide bombings in shopping centers is less clear, but probably reflects the bias of such attacks toward targets that allow unimpeded access and have high population densities.
If recent historical trends are a good predictor of terrorist weapon choices, these data pro-vide us with an estimate of the relative likelihood of various weapon types that might be used against malls or shopping centers. We use this evidence to guide our estimates of likelihood of the various scenarios we include in our model.
Consequences of Terrorist Incidents
In addition to the likelihoods of different attack types, understanding the consequences of ter-rorist incidents is important for assessing risk and allocating resources to reduce this risk. The primary consequences of terrorist attacks are casualties and property damage. Other important consequences include business interruption, liability, and indirect economic impacts. While all of these consequences can be substantial, most are rarely documented and are difficult to estimate. The RAND-MIPT Terrorism Incident Database records consequences in terms of injuries and fatalities. Although casualties reflect only part of the total consequences, they are arguably the single metric of greatest concern. To characterize the consequences of past ter-rorist attacks, we examined the number of fatalities produced by incidents as a function of weapon type used.
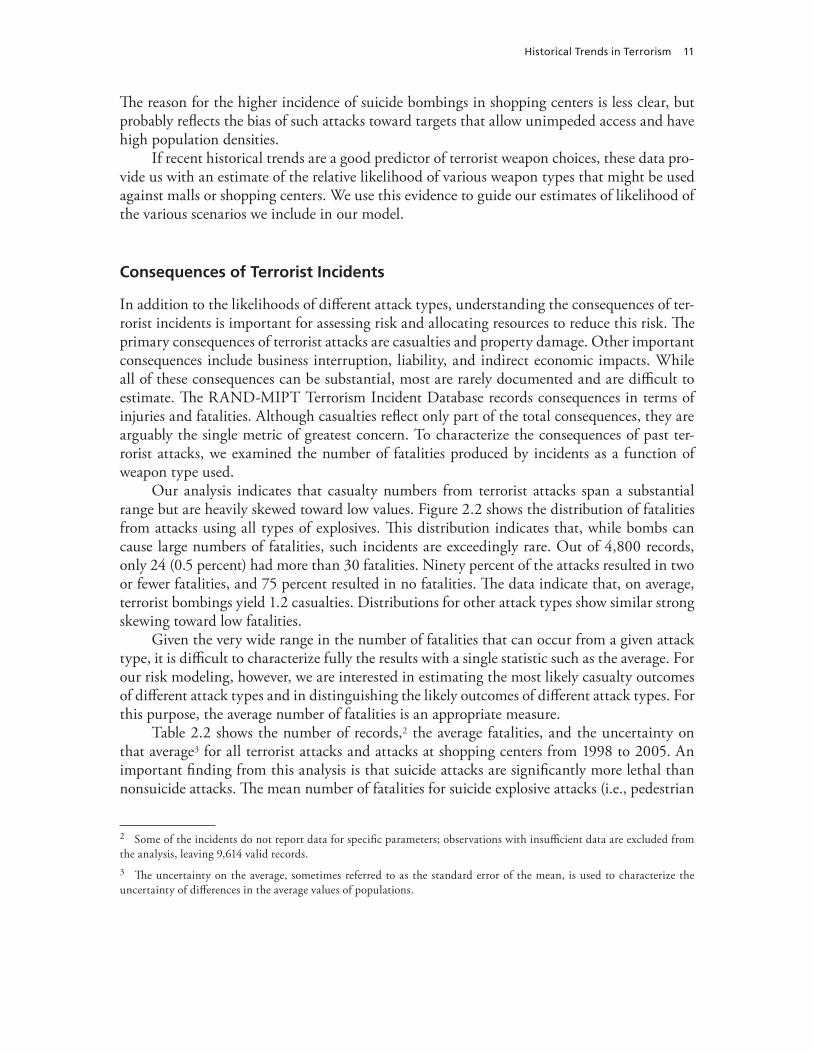
Our analysis indicates that casualty numbers from terrorist attacks span a substantial range but are heavily skewed toward low values. Figure 2.2 shows the distribution of fatalities from attacks using all types of explosives. This distribution indicates that, while bombs can cause large numbers of fatalities, such incidents are exceedingly rare. Out of 4,800 records, only 24 (0.5 percent) had more than 30 fatalities. Ninety percent of the attacks resulted in two or fewer fatalities, and 75 percent resulted in no fatalities. The data indicate that, on average, terrorist bombings yield 1.2 casualties. Distributions for other attack types show similar strong skewing toward low fatalities.
Given the very wide range in the number of fatalities that can occur from a given attack type, it is difficult to characterize fully the results with a single statistic such as the average. For our risk modeling, however, we are interested in estimating the most likely casualty outcomes of different attack types and in distinguishing the likely outcomes of different attack types. For this purpose, the average number of fatalities is an appropriate measure.
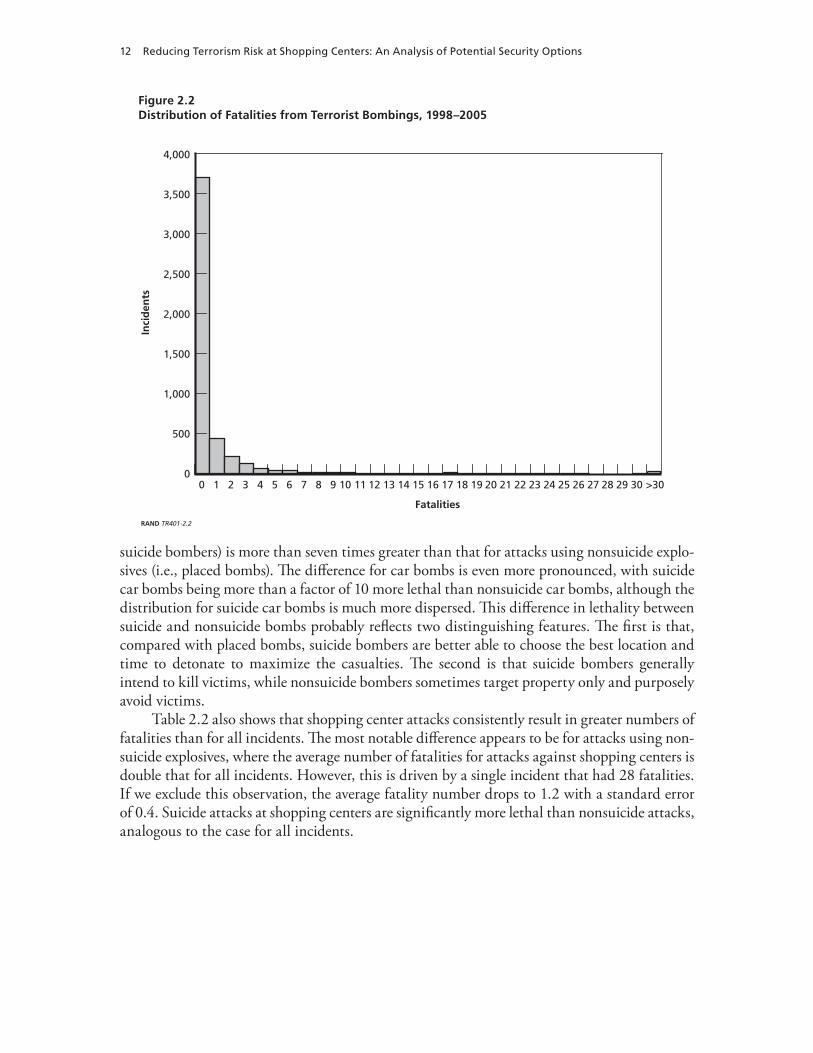
Table 2.2 shows the number of records,2 the average fatalities, and the uncertainty on that average3 for all terrorist attacks and attacks at shopping centers from 1998 to 2005. An important finding from this analysis is that suicide attacks are significantly more lethal than nonsuicide attacks. The mean number of fatalities for suicide explosive attacks (i.e., pedestrian
2 Some of the incidents do not report data for specific parameters; observations with insufficient data are excluded from the analysis, leaving 9,614 valid records.3 The uncertainty on the average, sometimes referred to as the standard error of the mean, is used to characterize the uncertainty of differences in the average values of populations.
12 Reducing Terrorism Risk at Shopping Centers: An Analysis of Potential Security Options
Figure 2.2Distribution of Fatalities from Terrorist Bombings, 1998–2005
0 1 2 3 4 5 6 7 8 9 10 11 12 13 14 15 16 17 18 19 20 21 22 23 24 25 26 27 28 29 30 >30
RAND TR401-2.2
Fatalities
Inci
den
ts
3,500
3,000
2,500
2,000
1,500
1,000
500
4,000
0
suicide bombers) is more than seven times greater than that for attacks using nonsuicide explo-sives (i.e., placed bombs). The difference for car bombs is even more pronounced, with suicide car bombs being more than a factor of 10 more lethal than nonsuicide car bombs, although the distribution for suicide car bombs is much more dispersed. This difference in lethality between suicide and nonsuicide bombs probably reflects two distinguishing features. The first is that, compared with placed bombs, suicide bombers are better able to choose the best location and time to detonate to maximize the casualties. The second is that suicide bombers generally intend to kill victims, while nonsuicide bombers sometimes target property only and purposely avoid victims.
Table 2.2 also shows that shopping center attacks consistently result in greater numbers of fatalities than for all incidents. The most notable difference appears to be for attacks using non-suicide explosives, where the average number of fatalities for attacks against shopping centers is double that for all incidents. However, this is driven by a single incident that had 28 fatalities. If we exclude this observation, the average fatality number drops to 1.2 with a standard error of 0.4. Suicide attacks at shopping centers are significantly more lethal than nonsuicide attacks, analogous to the case for all incidents.
Historical Trends in Terrorism 13
Table 2.2Average Fatalities for Different Attack Types, 1998–2005
Weapon Type
All Incidents Shopping Centers
NumberAverage Fatalities
Std Error of Mean Number
Average Fatalities
Std Error of Mean
Explosives (nonsuicide) 4,594 1.0 0.1 33 2.0 0.9
Explosives (suicide) 211 7.4 0.8 9 8.3 2.4
Truck bomb 5 17.0 9.4 0
Car bomb (nonsuicide) 131 3.2 0.6 1 5.0 0.0
Car bomb (suicide) 18 36.4 18.5 0
Fire or fire bomb 857 0.4 0.3 4 3.3 3.3
Firearms 2,705 1.8 0.2 1 2.0 0.0
Knives and sharp objects 161 1.5 0.2 1 0.0 0.0
Chemical agent 17 0.3 0.2 0
Biological agent 6 1.0 0.3 0
Othera 132 1.2 0.4 0
Unknown 774 1.9 0.1 0
a Excludes September 11, 2001, attacks.

15
CHAPTER THREE
Modeling the Effect of Security Options on Terrorism Risk
We used a quantitative modeling approach to help identify and prioritize potential security options that a shopping center could implement to reduce the risk of terrorism losses. A sys-tematic modeling approach was chosen to help contend with the great uncertainty and com-plexity inherent in addressing terrorism risk. Estimates of the level of terrorism risk and the effectiveness of various security options in reducing that risk are subjective and sensitive tothe assumptions built into the model. In addition, the large number of potential attack scenar-ios and security options that must be considered make it difficult to keep track of cumulative effects, interdependencies, and mutual exclusivities. A modeling approach has the advantage of applying consistent rules and treating input parameters systematically. This generates results that are internally consistent, can be linked to specific parameters, and can be tested for their sensitivity to particular assumptions.
In our analysis, we borrow from the theoretical logic of rational-choice models of offend-ing and situational crime prevention strategies (Clarke, 1983). This theoretical model applied to terrorism assumes that the decisionmaking process is rational and that terrorists considering an attack on a shopping mall consider the risks of their actions. We assume that terrorists are rational actors and consider the risks and rewards of their actions. These risks are assumed to flow from a consideration of the likelihood that terrorists think they can be successful in their planned attack and the consequences of their attack (e.g., number of people killed). Therefore, efforts to minimize the likelihood of a terrorist attack on a mall should focus on options that reduce the opportunities for terrorism. This study focuses on specific terrorist event scenarios and how the risk of these events can be “manipulated” through variations in the management of security and design characteristics of shopping centers that limit their attractiveness as ter-rorist targets.
Modeling Approach
The overall modeling approach involves incrementally reducing the risk from terrorism by sequentially implementing security options. The overall terrorism risk is the sum of the indi-vidual risks of different attack types that are intended to span the range of attacks that may occur at a shopping center. Different attack types are characterized in terms of 17 specific ter-rorism scenarios. The model selects security options according to their effectiveness at reduc-

16 Reducing Terrorism Risk at Shopping Centers: An Analysis of Potential Security Options
ing risk and their cost and estimates the reduction in overall risk with each option. Figure 3.1 summarizes the modeling approach.
Modeling Risk
Risk is a measure of expected losses, and the risk of an attack can be expressed in terms of the likelihood of a successful attack occurring and the consequences of that attack. Risk is thus dependent on the expected frequency of an event and on how damaging that event is. Ter-rorism risk is reduced by implementing security options that reduce attack likelihoods, con-sequences, or both. We express the effectiveness of each option in terms of its ability to deter, deny, and mitigate attacks in each scenario; deterrence and denial reduce the likelihoods, and mitigation reduces the consequences. In detail, likelihood is a function of the threat from a terrorist group and the vulnerability of a target. Security options considered in this report have little influence on threat and affect likelihoods primarily by reducing vulnerabilities. Option effectiveness values are expressed on a 0–1 scale: A value of 0 has no effect on risk and a value of 1 in any one of the three categories reduces the risk to zero. For the 17 scenarios considered in our model, each option has 51 effectiveness values (deter, deny, and mitigate in each scenario) associated with it.
For a single security option applied to a given scenario, the relationship among risk, likeli-hood, consequences, and security option effectiveness is expressed as
R LC Dt Dn Mt1 1 1 , (3.1)
where R is risk, L is the likelihood of that scenario occurring, C is consequence if that scenario does occur, and Dt, Dn, and Mt are the deter, deny, and mitigate values, respectively, for the security option in the given scenario.
The overall effectiveness of a set of N potential security options in a given scenario depends on which individual options are implemented and the effectiveness of each option. We assume that, when multiple security options are implemented, they act independently such that the net effectiveness of multiple options can be expressed as
Figure 3.1Modeling Approach
RAND TR401-3.1
Terrorism risk • Individual scenarios • Scenario risks
Inputs Outputs
Security options • Effectiveness • Cost
Specializeddecision
support tool
Prioritized listof options
Reduction inrelative risk

Modeling the Effect of Security Options on Terrorism Risk 17
Dt Dt Dt DtX XN
X N1 1 1 11 21 1 2 2/$ /$ /$... NN
i i
i
N
iXDt1 1
1
/$ ,
where the subscript i refers to a particular option, Xi is the amount of money spent on option i,$i is the cost of option i, N is total number of options being considered, and indicates taking the product. Analogous expressions hold for Dn and Mt. In our analysis, we assume that any option has a fixed effectiveness for any scenario (i.e., options cannot be partially implemented) so that the values Xi must be either 0 (option excluded) or $i (option included). The risk for a given scenario when multiple security options are implemented is then given by
R L C Dt Dn Mtj j j i
N
ij ij ij
Xi
11 1 1
/$$,
i
where the subscript j refers to a particular scenario. The overall risk is the sum of the risks from each scenario:
R R L Cjj
S
j j i
N
ijX
j
Si i
11
1
/$ ,
where S is the number of scenarios being considered and
ij ij ij ijDt Dn Mt1 1 1 .
Because the absolute likelihood of any terrorist attack is very difficult to estimate, our modeling uses relative likelihoods for the various scenarios considered. Relative likelihood refers to the likelihood of one scenario relative to the likelihoods of the other scenarios. Thus, the relative likelihood is a measure of the likelihood that a particular scenario will be used in a given terrorist attack. Relative likelihood estimates are presented below. It is important to note that, by using relative likelihoods, our analysis does not address the overall risk of terrorist attacks on shopping centers relative to other security risks. This has an important implication for the ultimate decisions about implementing security options: By prioritizing the various security options for reducing terrorism risk, the analysis helps guide decisions about which options are the most effective and the order in which they should be implemented. However, this model provides no insight into when to begin to implement terrorism security options.
Prioritizing Security Options
Given a set of scenarios, security options, security option costs, and deterrence, denial, and mitigation effectiveness values for each option in each scenario, the model prioritizes the selec-tion of security options based on a cost-effectiveness algorithm. Security options are selected sequentially in such a way that each selection generates the greatest reduction in risk for the

18 Reducing Terrorism Risk at Shopping Centers: An Analysis of Potential Security Options
lowest cost. Starting with a baseline risk value (i.e., no options implemented), the optimum option is selected and implemented. The overall risk is then recalculated with that option in place, and a new optimum option is selected from the remaining pool of options. Some options are mutually exclusive (e.g., unarmed security guards and armed security guards) and are therefore prohibited from being selected together. This process is repeated until all options have been selected or a maximum spending budget has been reached.
At each step, the optimum option is identified by computing the derivative of risk with respect to amount spent,
RX
L C Ri
j j i
N
ijX ij
ij
i i
1
/$ ln$
ln ij
ij
S
j
S
$,
11
and choosing the option for which R Xi gives the greatest negative magnitude. This can be understood intuitively as the option that results in the greatest decrease in risk (R) for the smallest number of dollars spent (Xi).1
Model Inputs
This section summarizes the various input parameters used in the security options model. Each subsection discusses the rationale for the parameters chosen, data sources, and uncertainties. Input parameters were also informed by site visits to each of the three shopping centers exam-ined in this report. Site visits comprised discussions with center operators, engineers, and secu-rity managers, along with tours of systems and individual components essential to security, such as entrances, parking facilities, loading docks, service halls, and roofs.
It is important to acknowledge that the parameters that contribute to terrorism risk are highly uncertain and therefore difficult to estimate. Our estimates of scenario likelihoodsare informed by statistical analysis of past terrorist attacks, but there is substantial uncertainty as to whether historical trends are good predictors of future attacks (see Chapter Two). The consequences of the various scenarios we consider are also informed by past terrorist attacks and, while they are better understood than likelihoods, are still subject to uncertainty stem-ming from details of individual attacks that are complex to predict and beyond the resolution of this analysis. And the effectiveness of a particular security option in a given scenario is also often difficult to estimate, either because its technical effectiveness is uncertain or because its effectiveness depends on scenario details that have not been modeled (e.g., will a terrorist appear to be a customer or attempt to impersonate an employee?).
We also tested the sensitivity of our estimates to a varying set of assumptions. Theseanalyses, which are discussed in the Modeling Results section below, illustrate how the rank-ings of security options vary with the various parameters used to define risk.
1 Under some conditions, the modeling approach used here, known as a marginal analysis, will not necessarily produce the optimum solution. However, under conditions of a pseudoconcave objective and a single, linear budget constraint such as is used here, marginal analysis will lead to the optimal answer (Hillestad, 2006).
Modeling the Effect of Security Options on Terrorism Risk 19
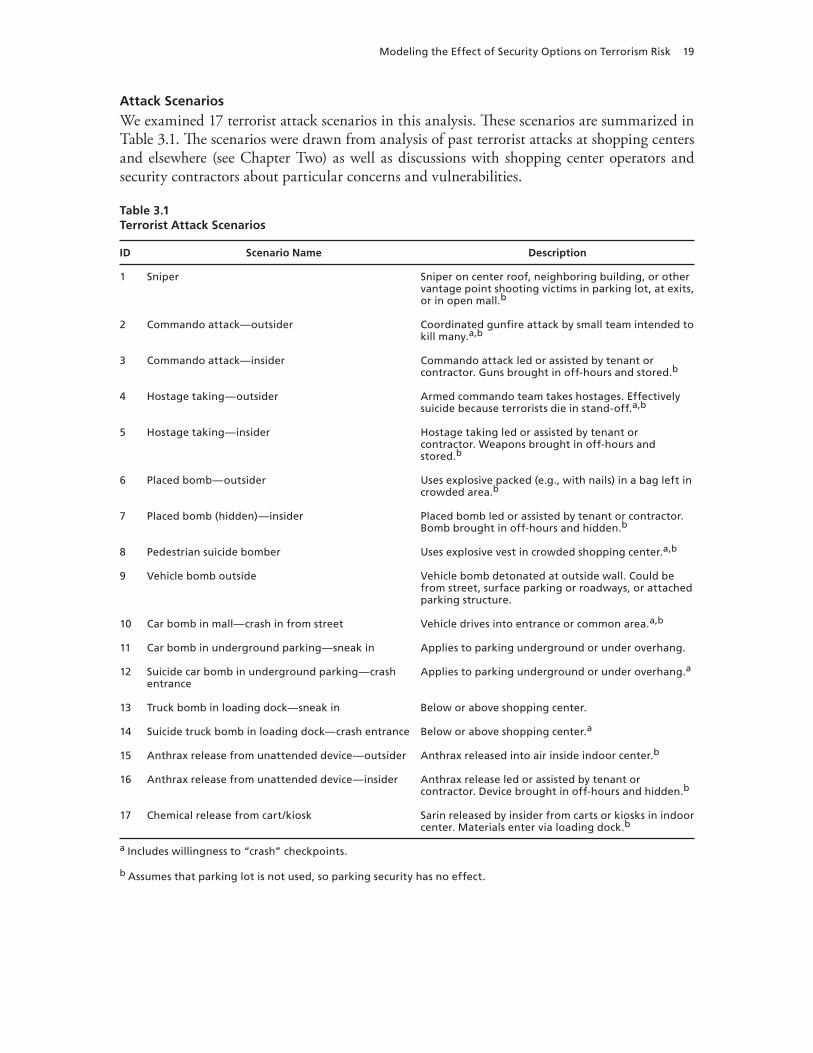
Attack Scenarios
We examined 17 terrorist attack scenarios in this analysis. These scenarios are summarized in Table 3.1. The scenarios were drawn from analysis of past terrorist attacks at shopping centers and elsewhere (see Chapter Two) as well as discussions with shopping center operators and security contractors about particular concerns and vulnerabilities.
Table 3.1Terrorist Attack Scenarios
ID Scenario Name Description
1 Sniper Sniper on center roof, neighboring building, or other vantage point shooting victims in parking lot, at exits, or in open mall.b
2 Commando attack—outsider Coordinated gunfire attack by small team intended to kill many.a,b
3 Commando attack—insider Commando attack led or assisted by tenant or contractor. Guns brought in off-hours and stored.b
4 Hostage taking—outsider Armed commando team takes hostages. Effectively suicide because terrorists die in stand-off.a,b
5 Hostage taking—insider Hostage taking led or assisted by tenant or contractor. Weapons brought in off-hours andstored.b
6 Placed bomb—outsider Uses explosive packed (e.g., with nails) in a bag left in crowded area.b
7 Placed bomb (hidden)—insider Placed bomb led or assisted by tenant or contractor. Bomb brought in off-hours and hidden.b
8 Pedestrian suicide bomber Uses explosive vest in crowded shopping center.a,b
9 Vehicle bomb outside Vehicle bomb detonated at outside wall. Could be from street, surface parking or roadways, or attached parking structure.
10 Car bomb in mall—crash in from street Vehicle drives into entrance or common area.a,b
11 Car bomb in underground parking—sneak in Applies to parking underground or under overhang.
12 Suicide car bomb in underground parking—crash entrance
Applies to parking underground or under overhang.a
13 Truck bomb in loading dock—sneak in Below or above shopping center.
14 Suicide truck bomb in loading dock—crash entrance Below or above shopping center.a
15 Anthrax release from unattended device—outsider Anthrax released into air inside indoor center.b
16 Anthrax release from unattended device—insider Anthrax release led or assisted by tenant or contractor. Device brought in off-hours and hidden.b
17 Chemical release from cart/kiosk Sarin released by insider from carts or kiosks in indoor center. Materials enter via loading dock.b
a Includes willingness to “crash” checkpoints.
b Assumes that parking lot is not used, so parking security has no effect.

20 Reducing Terrorism Risk at Shopping Centers: An Analysis of Potential Security Options
Scenarios fall into three general categories based on the weapons used: firearms, explo-sives, and chemical or biological. The scenario set includes the most common terrorist attack modes, as well as several modes that are less commonly employed or that have never occurred. Although it is impossible to predict with any certainty how a terrorist strike may occur, the selected set is intended to span the range of attack types of general concern and the range of vulnerabilities present in commercial shopping centers.
Scenario Likelihoods
The first major component of risk is event likelihood. The more likely an event is, the more often it will occur over the long term. Scenarios with higher likelihoods will therefore occur more often and have higher overall losses. Because risk represents an estimate of expected loss, higher likelihood translates into higher risk.
We treated the overall terrorist threat to shopping centers as uniform at all centers. In reality, exogenous factors may cause the threat to be higher at particular centers. However, such factors are elusive and often evolve with time, so our analysis did not take into account differences in scenario likelihoods stemming from different threat environments that may exist among the three centers. Where necessary, however, we excluded particular scenarios at a spe-cific center if the physical design of that center made the particular scenarios impossible (e.g., a car bomb in an underground parking lot is not an option in a center with no underground parking). As noted above, we restricted our estimates to relative likelihoods, or the likelihood of a particular scenario occurring relative to the likelihoods of other scenarios.
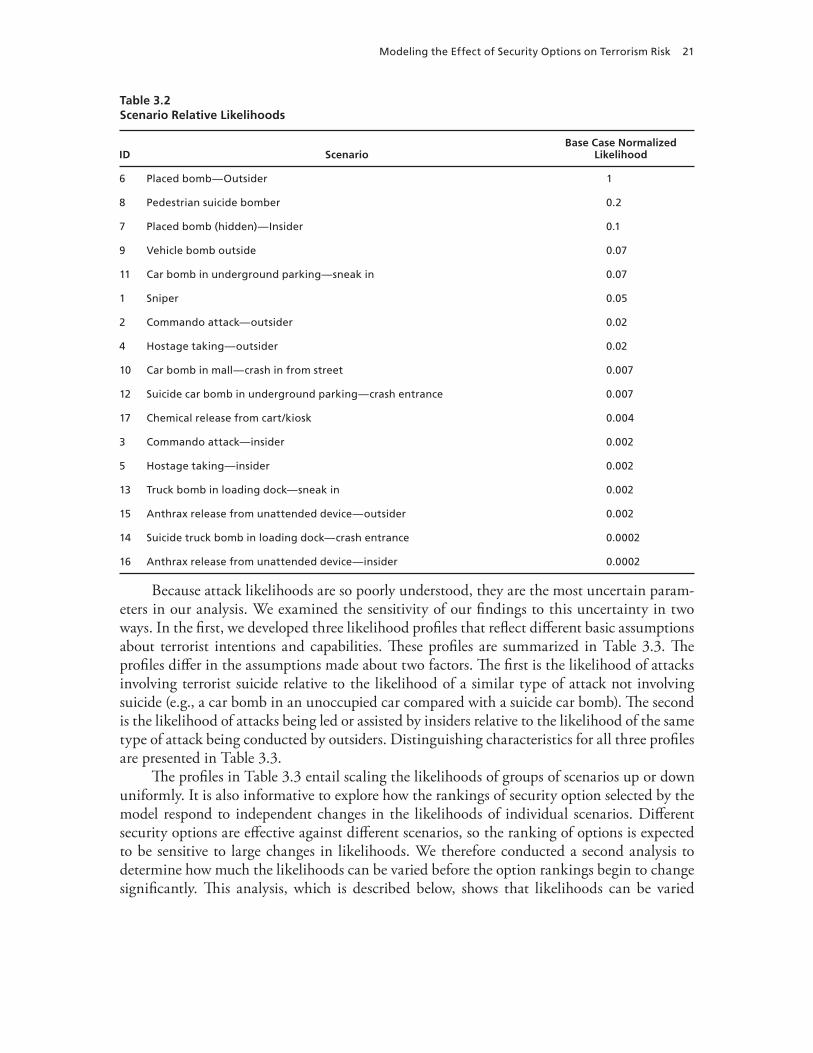
The relative likelihood assigned to each scenario was estimated based on our analyses of the frequency of use of different weapons in past terrorist attacks at shopping centers (see Table 2.1). Likelihoods for 10 of the 17 scenarios were taken directly from these historical frequency data (the relative frequency of firearms attacks from Table 2.1 was applied to the commando attack). From these data, for example, we estimated that a terrorist attack at a shopping center is most likely to involve a placed bomb. Likelihoods for the remaining scenarios were estimated in two ways. First, likelihoods for attacks perpetrated by an insider (i.e., tenant employees, contractors, and delivery people) were assumed to be one-tenth the likelihood of the same attack being perpetrated by an outsider. Second, likelihoods for three scenarios were estimated based on the frequencies for similar scenarios for which we had likelihoods estimates: The hostage taking was assigned the same likelihood as the commando attack, the sniper attack was assigned a likelihood 2.5 times greater than that of the commando attack, and the suicide truck bomb likelihood was estimated from the nonsuicide truck bomb frequency multiplied by the ratio of suicide and nonsuicide car bomb frequencies (10).
Relative likelihood values for each scenario are listed in Table 3.2. The values listed in Table 3.2 are normalized to the likelihood of the scenario with the greatest likelihood (placed bomb—outsider). Values are normalized to a 0–1 scale so that they will be equally weighted with consequences in the risk calculations.
Modeling the Effect of Security Options on Terrorism Risk 21
Table 3.2Scenario Relative Likelihoods
ID ScenarioBase Case Normalized
Likelihood
6 Placed bomb—Outsider 1
8 Pedestrian suicide bomber 0.2
7 Placed bomb (hidden)—Insider 0.1
9 Vehicle bomb outside 0.07
11 Car bomb in underground parking—sneak in 0.07
1 Sniper 0.05
2 Commando attack—outsider 0.02
4 Hostage taking—outsider 0.02
10 Car bomb in mall—crash in from street 0.007
12 Suicide car bomb in underground parking—crash entrance 0.007
17 Chemical release from cart/kiosk 0.004
3 Commando attack—insider 0.002
5 Hostage taking—insider 0.002
13 Truck bomb in loading dock—sneak in 0.002
15 Anthrax release from unattended device—outsider 0.002
14 Suicide truck bomb in loading dock—crash entrance 0.0002
16 Anthrax release from unattended device—insider 0.0002
Because attack likelihoods are so poorly understood, they are the most uncertain param-eters in our analysis. We examined the sensitivity of our findings to this uncertainty in two ways. In the first, we developed three likelihood profiles that reflect different basic assumptions about terrorist intentions and capabilities. These profiles are summarized in Table 3.3. The profiles differ in the assumptions made about two factors. The first is the likelihood of attacks involving terrorist suicide relative to the likelihood of a similar type of attack not involving suicide (e.g., a car bomb in an unoccupied car compared with a suicide car bomb). The second is the likelihood of attacks being led or assisted by insiders relative to the likelihood of the same type of attack being conducted by outsiders. Distinguishing characteristics for all three profiles are presented in Table 3.3.
The profiles in Table 3.3 entail scaling the likelihoods of groups of scenarios up or down uniformly. It is also informative to explore how the rankings of security option selected by the model respond to independent changes in the likelihoods of individual scenarios. Different security options are effective against different scenarios, so the ranking of options is expected to be sensitive to large changes in likelihoods. We therefore conducted a second analysis to determine how much the likelihoods can be varied before the option rankings begin to change significantly. This analysis, which is described below, shows that likelihoods can be varied

22 Reducing Terrorism Risk at Shopping Centers: An Analysis of Potential Security Options
Table 3.3Likelihood Profiles for Terrorist Attack Scenarios
Likelihood Profile Distinguishing Characteristics
Base case Nonsuicide likelihood = 10x suicide likelihoodOutsider likelihood = 10x insider likelihood
High suicide Nonsuicide likelihood = suicide likelihood
High insider Outsider likelihood = insider likelihood
independently by as much as a factor of 10 before the rankings of security options begin to change.
Scenario Consequences
The second major component of risk is event consequence. Because risk is a measure of expected loss, the greater the consequences of an event, the greater its risk. As discussed in Chapter Two, there are several types of potential consequences of terrorist attacks, including casualties, prop-erty damage, business interruption, liability, and indirect economic impacts. However, as also mentioned in Chapter Two, most of these consequences are difficult to estimate, particularly given that casualties are generally the only consequence metric recorded in historical terrorism data. For this analysis, we have modeled terrorist attack consequences in terms of two compo-nents: fatality count, which is intended to reflect the human loss component, and the amount of time a center would be shut down after an attack, which is intended to reflect the economic loss component of terrorist attacks. Because our analysis examines relative likelihoods and, therefore, relative risks, including separate estimates of well-correlated components does not help distinguish the relative risks of different scenarios and thus adds no value to the analysis.
Fatalities. The numbers of injuries and fatalities in terrorist attacks are very sensitive to details such as the relative locations of weapons, structures, and victims; the population density in the affected area; and structural characteristics of any buildings involved. Our scenarios do not stipulate this level of detail, and we have not attempted to tailor fatality estimates precisely to the multitude of possible outcomes of a given scenario. Rather, fatalities for each scenario were estimated from the historical fatality data for terrorist attacks on shopping centers using associated weapon types (see Chapter Two).
The average number of fatalities resulting from attacks using a particular weapon was assumed to reflect the most likely outcome of that type of attack and thus the appropriate value to use in our risk modeling. Where available, fatality estimates were taken directly from historical averages for shopping center incidents in Table 2.2: The value for placed bombs was taken from explosives (nonsuicide), the value for pedestrian suicide bomber was taken from explo-sives (suicide), the value for vehicle bomb outside was taken from car bomb (nonsuicide), and the value for gunfire attacks (scenarios 1–5) was taken from firearms. Based on the data for all incidents, the value for the truck bomb in loading scenarios was taken from truck bomb and the value for car bomb in mall—crash in from street was taken to be 10 times the value for vehicle bomb outside. The value for the car bomb in parking scenarios was assumed to be the same as for vehicle bomb outside. Note that, for a vehicle bomb in an underground parking lot or loading dock, there is no obvious reason that a suicide attack would lead to more fatalities than would

Modeling the Effect of Security Options on Terrorism Risk 23
a nonsuicide attack, so the fatality values for suicide and nonsuicide attacks are the same. Finally, fatality values used for biological and chemical weapons are 10 times higher than those observed in the historical data for all incidents in order to reflect potential improvements in terrorist capabilities with these weapons. Note that, despite using higher fatality estimates, the likelihoods of chemical and biological attacks are sufficiently low that they have negligible influence on the overall risk.
Normalized fatality values for each scenario are listed in Table 3.4. The values in Table 3.4 are normalized to the number of fatalities of the scenario with the greatest number of fatali-ties (suicide truck bomb in loading dock—crash entrance). Values are normalized to a 0–1 scale so that they will be equally weighted with likelihoods in the risk calculations.
Downtime. Downtime is a measure of the time that part or all of a shopping center would remain closed following a terrorist attack. Very few data reporting closure durations or prop-erty damage are available for past terrorist attacks. Consequently, we developed a fairly coarse
Table 3.4Scenario Consequences
ID ScenarioNormalized
Fatalities DowntimeNet
Consequencea
1 Sniper 0.04 0.25 0.145
2 Commando attack—outsider 0.04 0.5 0.27
3 Commando attack—insider 0.04 0.5 0.27
4 Hostage taking—outsider 0.04 0.75 0.395
5 Hostage taking—insider 0.04 0.75 0.395
6 Placed bomb—outsider 0.04 0.5 0.27
7 Placed bomb (hidden)—insider 0.04 0.5 0.27
8 Pedestrian suicide bomber 0.166 0.5 0.333
9 Vehicle bomb outside 0.1 0.75 0.425
10 Car bomb in mall—crash in from street 1 0.75 0.875
11 Car bomb in underground parking—sneak in 0.1 0.75 0.425
12 Suicide car bomb in underground parking—crash entrance
0.1 0.75 0.425
13 Truck bomb in loading dock—sneak in 0.34 0.75 0.545
14 Suicide truck bomb in loading dock—crash entrance 0.34 0.75 0.545
15 Anthrax release from unattended device—outsider 0.2 1 0.6
16 Anthrax release from unattended device—insider 0.2 1 0.6
17 Chemical release from cart/kiosk 0.06 0.75 0.405
a Consequence = 0.5 fatalities + 0.5 downtime ..
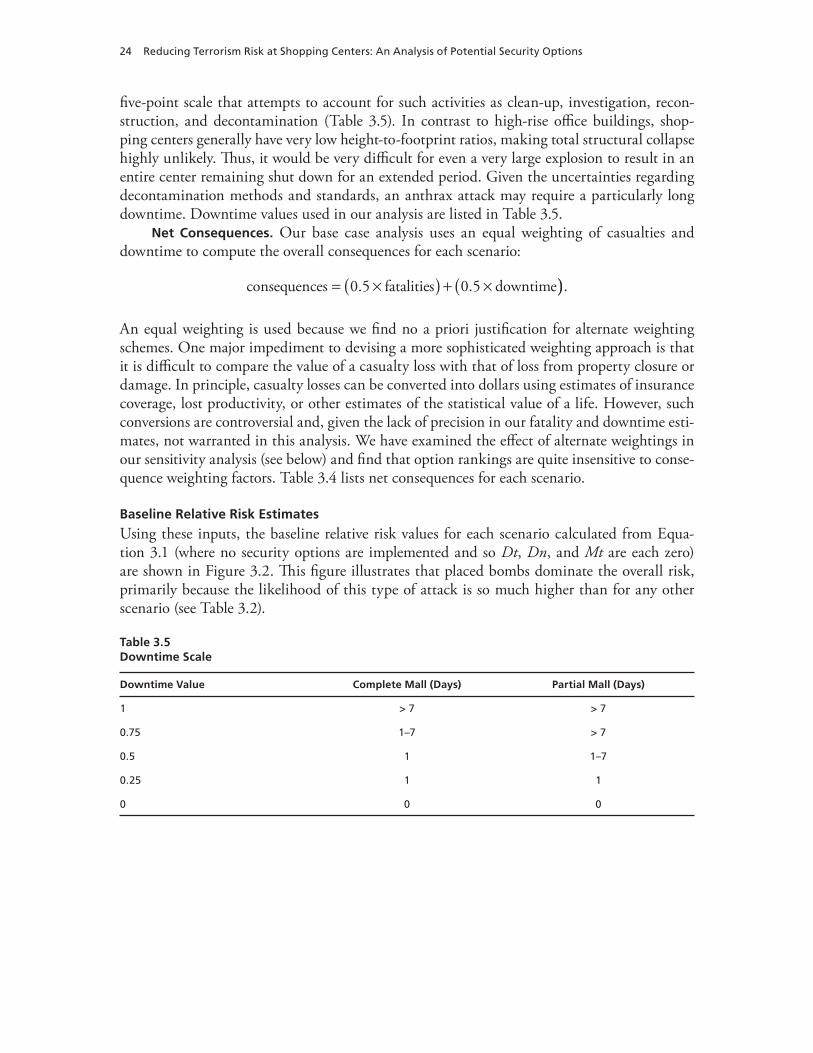
24 Reducing Terrorism Risk at Shopping Centers: An Analysis of Potential Security Options
five-point scale that attempts to account for such activities as clean-up, investigation, recon-struction, and decontamination (Table 3.5). In contrast to high-rise office buildings, shop-ping centers generally have very low height-to-footprint ratios, making total structural collapse highly unlikely. Thus, it would be very difficult for even a very large explosion to result in an entire center remaining shut down for an extended period. Given the uncertainties regarding decontamination methods and standards, an anthrax attack may require a particularly long downtime. Downtime values used in our analysis are listed in Table 3.5.
Net Consequences. Our base case analysis uses an equal weighting of casualties and downtime to compute the overall consequences for each scenario:
consequences fatalities downtime0 5 0 5. . .
An equal weighting is used because we find no a priori justification for alternate weighting schemes. One major impediment to devising a more sophisticated weighting approach is that it is difficult to compare the value of a casualty loss with that of loss from property closure or damage. In principle, casualty losses can be converted into dollars using estimates of insurance coverage, lost productivity, or other estimates of the statistical value of a life. However, such conversions are controversial and, given the lack of precision in our fatality and downtime esti-mates, not warranted in this analysis. We have examined the effect of alternate weightings in our sensitivity analysis (see below) and find that option rankings are quite insensitive to conse-quence weighting factors. Table 3.4 lists net consequences for each scenario.
Baseline Relative Risk Estimates
Using these inputs, the baseline relative risk values for each scenario calculated from Equa-tion 3.1 (where no security options are implemented and so Dt, Dn, and Mt are each zero) are shown in Figure 3.2. This figure illustrates that placed bombs dominate the overall risk, primarily because the likelihood of this type of attack is so much higher than for any other scenario (see Table 3.2).
Table 3.5Downtime Scale
Downtime Value Complete Mall (Days) Partial Mall (Days)
1 > 7 > 7
0.75 1–7 > 7
0.5 1 1–7
0.25 1 1
0 0 0

Modeling the Effect of Security Options on Terrorism Risk 25
Figure 3.2Baseline Relative Risk for Scenarios
Truck bomb in loading dock—sneak in
Suicide truck bomb in loading dock—crash entrance
Anthrax release from unattended device—insider
Commando attack—insider
Hostage taking—insider
Chemical release from cart/kiosk
Anthrax release from unattended device—outsider
Suicide car bomb in underground parking—crash entrance
Commando attack—outsider
Car bomb in mall—crash in from street
Sniper
Hostage taking—outsider
Placed bomb (hidden)—insider
Vehicle bomb outside
Car bomb in underground parking—sneak in
Pedestrian suicide bomber
Placed bomb—outsider
RAND TR401-3.2
Baseline relative risk
.30.25.20.15.100 .05
Security Options
We have examined the effectiveness of 39 security options in our analysis. Several criteria were used to arrive at the final set of security options included. Many options were chosen based on established and emerging security approaches used in other environments (e.g., airports; see Stevens et al., 2004). Options were also designed in response to consultation with mall operators and security contractors. Finally, some options were selected or tailored to address particular vulnerabilities to the various scenarios that exist in a shopping center operational environment. For example, to cover insider and outsider threats separately, customer entrance checkpoint options are divided into two sets—one for the hours during which the center is open to the public (when outsiders have access) and another for the hours during which itis closed to the public (when only insiders have access).
The options considered target individual facilities—our modeling focuses on deterring, denying, or mitigating terrorist attacks at a given center and does not consider implications for other centers within a company or across the industry. For example, a security option that causes a potential terrorist to choose a different target is considered entirely effective because it has deterred an attack at the center of interest.

26 Reducing Terrorism Risk at Shopping Centers: An Analysis of Potential Security Options
The options we consider in our modeling cover operations, technology, staffing, and management, but exclude major design and construction issues. Although property develop-ment and redevelopment are important aspects of the shopping center industry, design and construction go beyond the scope of our analysis and our expertise. Several government agen-cies have developed guidance in this area and we include in Chapter Four a brief summary of this topic.
The security options we used in our analysis are listed in Table 3.6. For each option, we include a brief explanation, along with the options with which it is mutually exclusive. Mutual exclusivity occurs when options provide essentially redundant capabilities (e.g., explosives detectors and explosives dogs) or when one option includes another (e.g., customer entrance checkpoints include security personnel and so are mutually exclusive with security guards at entrances).
Table 3.6Security Options
Option Category Op ID Option Explanation
Mutually Exclusive Options
Co
mm
un
icat
ion
an
d
Edu
cati
on
1 Employee threat ID training Periodic training seminars for staff (center, permanent contractor, tenant) to help understand and identify threats such as suspicious packages or possible suicide bombers.
2 Suspicious package reporting
Public information campaign consisting of signs around center reminding people to be on the lookout for suspicious packages.
Emer
gen
cy
Res
po
nse
3 Emergency response teams Subset of tenant staff trained and exercised to help with emergency response (evacuation and assistance).
Emp
loye
e M
anag
emen
t 4 Employee background checks
Basic check on center staff, contractors, and tenant employees: criminal, credit, driving.
5 Photo ID badge for contractors and delivery
Registration and identification for all temporary contractors and delivery staff.

Modeling the Effect of Security Options on Terrorism Risk 27
Table 3.6—Continued
Option Category Op ID Option Explanation
Mutually Exclusive Options
Cu
sto
mer
En
tran
ce M
anag
emen
t
6 Search bags and remove coats at entrances, open hours
Manual search of bags, including shopping bags, and temporary removal of coats for all people entering customer entrances during business hours.
7, 8, 12
7 Mandatory coat and bag check, open hours
All bags and coats taken and stored while shopping.
6, 8, 12
8 Metal detectors and search bags at entrances, open hours
Walk-through metal detectors plus search bags and remove coats for all people entering.
6, 7, 12
9 Millimeter wave cameras at entrances, open hours
Walk-through gun and bomb detector—searches people only (not bags).
12
10 Trace detector portals at entrances, open hours
Walk-through trace explosive detectors—searches people and bags.
11, 12
11 Dogs at entrances, open hours
Two teams of a bomb dog plus handler at each entrance. Teams alternate 20 minutes on, 20minutes off.
10, 12
12 Security guard at entrances, open hours
Security guard posted at each entrance. 6, 7, 8, 9, 10, 11
13 Search bags and remove coats at entrances, closed hours
Same as 6, but for employees and contractors entering during off-hours.
14, 15, 19
14 Mandatory coat and bag check, closed hours
Same as 7, but for employees and contractors entering during off-hours.
13, 15, 19
15 Metal detectors and search bags at entrances, closed hours
Same as 8, but for employees and contractors entering during off-hours.
13, 14, 19
16 Millimeter wave cameras at entrances, closed hours
Same as 9, but for employees and contractors entering during off-hours.
19
17 Trace detector portals at entrances, closed hours
Same as 10, but for employees and contractors entering during off-hours.
18, 19
18 Dogs at entrances, closed hours
Same as 11, but for employees and contractors entering during off-hours.
17, 19
19 Security guard at entrances, closed hours
Same as 12, but for employees and contractors entering during off-hours.
13, 14, 15, 16, 17, 18

28 Reducing Terrorism Risk at Shopping Centers: An Analysis of Potential Security Options
Table 3.6—Continued
Option Category Op ID Option Explanation
Mutually Exclusive Options
Bu
ildin
g M
anag
emen
t
20 Control access to service areas
Limit access to service halls, loading, utilities, roofs, and the like to authorized employees.
21 Search carts/kiosks daily Quick (< 5 min) search for guns, bombs, chemical agents, and such each morning.
22 Security with 100-percent visual coverage of common area
Triple current number of security guards on site (see Table B.2).
23
23 Armed security with 100-percent visual coverage of common area
Arm and triple current number of security guards on site (see Table B.2).
22
24 Police substation in center Small police station with 1–2 officers; includes patrol.
25 More clearly label exits Signage to label paths to exits more clearly.
Veh
icle
Man
agem
ent
26 Vehicle inspection at parking, open hours
Manually search cars for bombs at parking entrance.
27, 30
27 Vehicle inspection and hydraulic bollards at parking, open hours
Search parking cars for bombs and prevent detected (suicide) bombs from entering lot.
26, 30
28 Loading dock access control Limit access to loading area to authorized vehicles.
29
29 Loading dock access control and hydraulic bollards
Limit access to authorized vehicles and prevent detected (suicide) bombs from entering dock.
28
30 Increase building stand-off distance with bollard fence
Maintain 100-foot distance between building and parking or roadways and limit access with bollards.
26, 27, 31
31 Bollards at pedestrian entrances
Bollards to block suicide car bombers from entering pedestrian entrances.
30
32 Dogs at parking and loading, open/delivery hours
Same as 11 but for parking and loading entrances.
33
33 Explosive detectors at parking/loading, open/delivery hours
Explosives detection portal at parking and loading entrances.
32

Modeling the Effect of Security Options on Terrorism Risk 29
Table 3.6—Continued
Option Category Op ID Option Explanation
Mutually Exclusive Options
Ch
emic
al-B
iolo
gic
al
34 Air filters High-efficiency filters to remove anthrax from common area air system in first pass.
36
35 Anthrax detectors Real-time anthrax spore detector with alarm. 36, 39
36 Anthrax detectors and filters
Filters and alarm. 34, 35, 39
37 Chemical detectors Real-time chemical agent detector with alarm. 38, 39
38 Chemical detector and individual protection
Real-time chemical agent detector with alarm plus stock of quick masks.
37, 39
39 Anthrax and chemical detector and auto-response HVAC
Real-time detector with alarm and that diverts air flow away from people.
35, 36, 37, 38
Option Effectiveness
Each option was assigned values for its effectiveness at deterring, denying, and mitigating each of the 17 scenarios. In some cases, the distinctions between deter, deny, and mitigate can be ambiguous. For clarity, we use the following definitions in apportioning effectiveness between deter, deny, and mitigate:
An attack scenario is deterred if no attempt is made at the facility. Examples of deterrence include background checks, checkpoints, and security patrols.An attack scenario is denied if an attack attempt is not successful, where attack success is defined for different scenario types as follows: for firearms, at least one shot is fired in the intended location; for explosives, the explosive is detonated where intended; for chemical or biological weapons, the agent is released. Examples of denial include checkpoints, bol-lards, and threat awareness training.An attack scenario is mitigated if the consequences of a successful attack are reduced. Examples of mitigation include emergency response, security patrols, and chemical and biological agent detectors.2
Note that many options are effective in more than one of these three categories.
2 One consequence of these definitions is that we do not completely account for a suicide attacker’s adaptability. Though we account for the possibility that a suicide attacker may successfully crash a checkpoint (e.g., a suicide car bomber may be able to drive through a checkpoint), our definitions do not account for the possibility that a bomber may detonate an explosive at a checkpoint. This is because a checkpoint is not the intended detonation location in any scenario and thus detonation at a checkpoint is not considered a successful attack. Though suicide bombers have detonated at checkpoints in the past, such an outcome is expected to be very unlikely in a commercial shopping center setting because terrorists would be expected to conduct substantial planning and surveillance and therefore would avoid situations in which they would need to force their way through a checkpoint; shopping centers generally allow unimpeded access and so a terrorist would likely chose an alternative location or method of attack if faced with enhanced security.
•
•
•
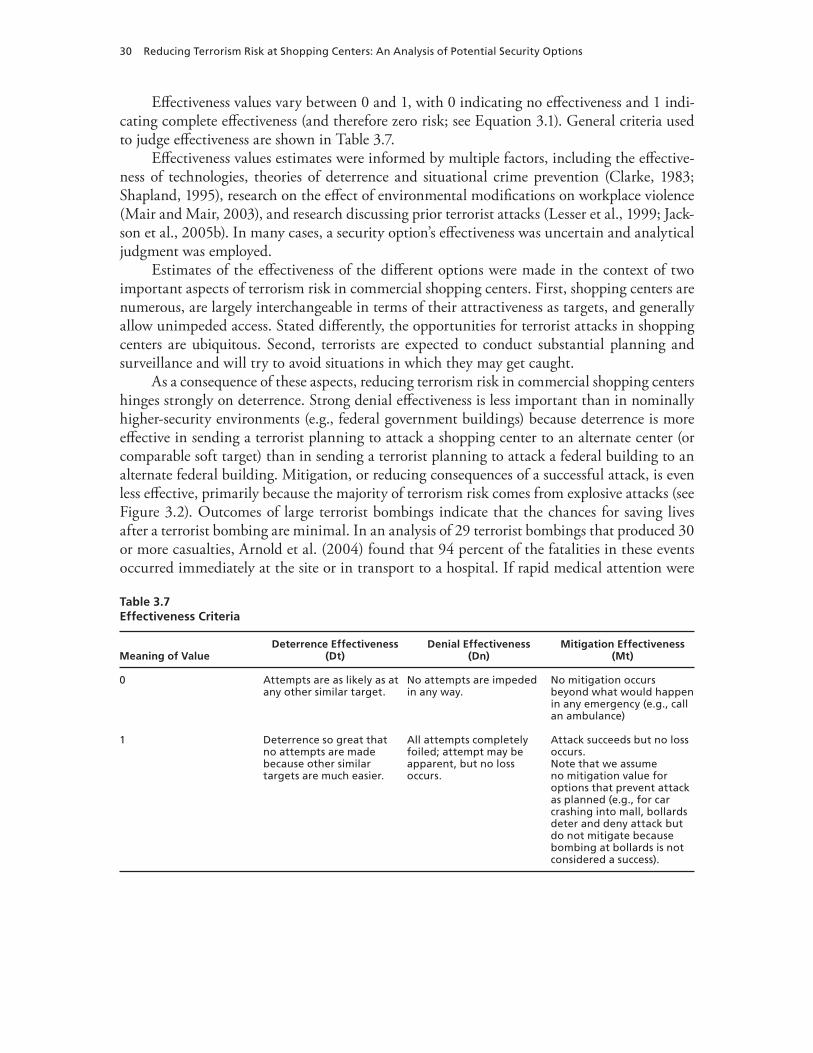
30 Reducing Terrorism Risk at Shopping Centers: An Analysis of Potential Security Options
Effectiveness values vary between 0 and 1, with 0 indicating no effectiveness and 1 indi-cating complete effectiveness (and therefore zero risk; see Equation 3.1). General criteria used to judge effectiveness are shown in Table 3.7.
Effectiveness values estimates were informed by multiple factors, including the effective-ness of technologies, theories of deterrence and situational crime prevention (Clarke, 1983; Shapland, 1995), research on the effect of environmental modifications on workplace violence (Mair and Mair, 2003), and research discussing prior terrorist attacks (Lesser et al., 1999; Jack-son et al., 2005b). In many cases, a security option’s effectiveness was uncertain and analytical judgment was employed.
Estimates of the effectiveness of the different options were made in the context of two important aspects of terrorism risk in commercial shopping centers. First, shopping centers are numerous, are largely interchangeable in terms of their attractiveness as targets, and generally allow unimpeded access. Stated differently, the opportunities for terrorist attacks in shopping centers are ubiquitous. Second, terrorists are expected to conduct substantial planning and surveillance and will try to avoid situations in which they may get caught.
As a consequence of these aspects, reducing terrorism risk in commercial shopping centers hinges strongly on deterrence. Strong denial effectiveness is less important than in nominally higher-security environments (e.g., federal government buildings) because deterrence is more effective in sending a terrorist planning to attack a shopping center to an alternate center (or comparable soft target) than in sending a terrorist planning to attack a federal building to an alternate federal building. Mitigation, or reducing consequences of a successful attack, is even less effective, primarily because the majority of terrorism risk comes from explosive attacks (see Figure 3.2). Outcomes of large terrorist bombings indicate that the chances for saving lives after a terrorist bombing are minimal. In an analysis of 29 terrorist bombings that produced 30 or more casualties, Arnold et al. (2004) found that 94 percent of the fatalities in these events occurred immediately at the site or in transport to a hospital. If rapid medical attention were
Table 3.7Effectiveness Criteria
Meaning of ValueDeterrence Effectiveness
(Dt)Denial Effectiveness
(Dn)Mitigation Effectiveness
(Mt)
0 Attempts are as likely as at any other similar target.
No attempts are impeded in any way.
No mitigation occurs beyond what would happen in any emergency (e.g., call an ambulance)
1 Deterrence so great that no attempts are made because other similar targets are much easier.
All attempts completely foiled; attempt may be apparent, but no loss occurs.
Attack succeeds but no loss occurs.Note that we assume no mitigation value for options that prevent attack as planned (e.g., for car crashing into mall, bollards deter and deny attack but do not mitigate because bombing at bollards is not considered a success).
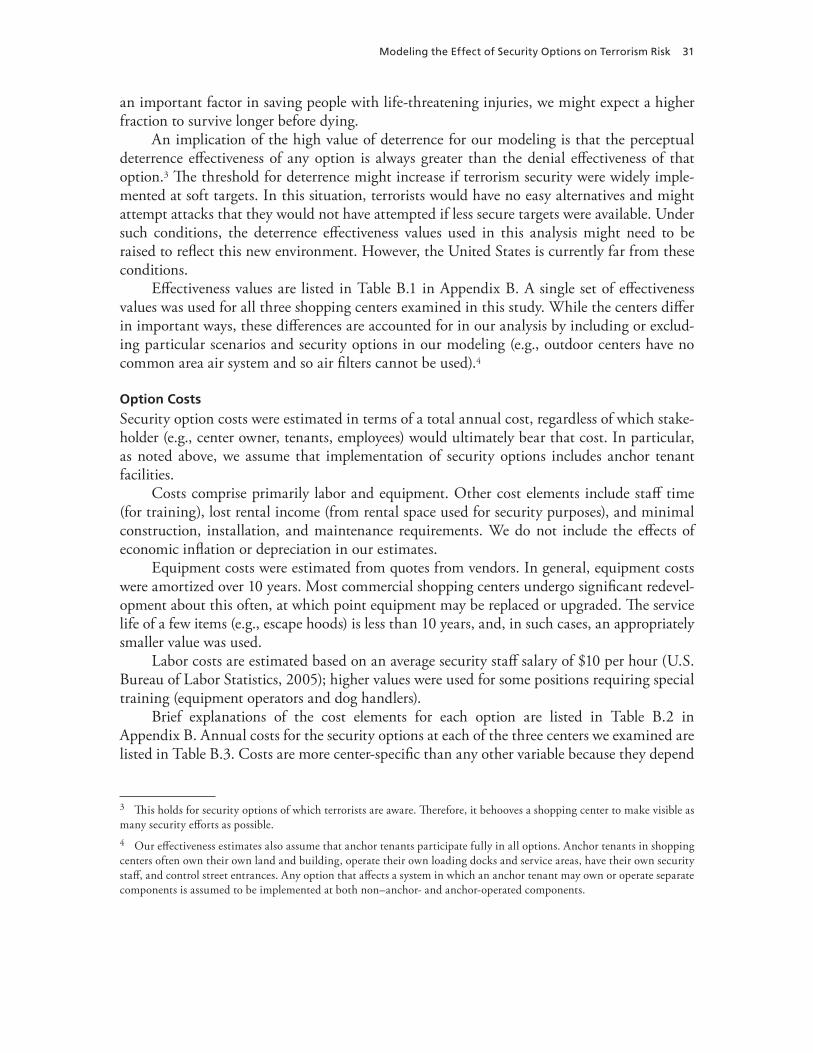
Modeling the Effect of Security Options on Terrorism Risk 31
an important factor in saving people with life-threatening injuries, we might expect a higher fraction to survive longer before dying.
An implication of the high value of deterrence for our modeling is that the perceptual deterrence effectiveness of any option is always greater than the denial effectiveness of that option.3 The threshold for deterrence might increase if terrorism security were widely imple-mented at soft targets. In this situation, terrorists would have no easy alternatives and might attempt attacks that they would not have attempted if less secure targets were available. Under such conditions, the deterrence effectiveness values used in this analysis might need to be raised to reflect this new environment. However, the United States is currently far from these conditions.
Effectiveness values are listed in Table B.1 in Appendix B. A single set of effectiveness values was used for all three shopping centers examined in this study. While the centers differ in important ways, these differences are accounted for in our analysis by including or exclud-ing particular scenarios and security options in our modeling (e.g., outdoor centers have no common area air system and so air filters cannot be used).4
Option Costs
Security option costs were estimated in terms of a total annual cost, regardless of which stake-holder (e.g., center owner, tenants, employees) would ultimately bear that cost. In particular, as noted above, we assume that implementation of security options includes anchor tenant facilities.
Costs comprise primarily labor and equipment. Other cost elements include staff time (for training), lost rental income (from rental space used for security purposes), and minimal construction, installation, and maintenance requirements. We do not include the effects of economic inflation or depreciation in our estimates.
Equipment costs were estimated from quotes from vendors. In general, equipment costs were amortized over 10 years. Most commercial shopping centers undergo significant redevel-opment about this often, at which point equipment may be replaced or upgraded. The service life of a few items (e.g., escape hoods) is less than 10 years, and, in such cases, an appropriately smaller value was used.
Labor costs are estimated based on an average security staff salary of $10 per hour (U.S. Bureau of Labor Statistics, 2005); higher values were used for some positions requiring special training (equipment operators and dog handlers).
Brief explanations of the cost elements for each option are listed in Table B.2 inAppendix B. Annual costs for the security options at each of the three centers we examined are listed in Table B.3. Costs are more center-specific than any other variable because they depend
3 This holds for security options of which terrorists are aware. Therefore, it behooves a shopping center to make visible as many security efforts as possible.4 Our effectiveness estimates also assume that anchor tenants participate fully in all options. Anchor tenants in shopping centers often own their own land and building, operate their own loading docks and service areas, have their own security staff, and control street entrances. Any option that affects a system in which an anchor tenant may own or operate separate components is assumed to be implemented at both non–anchor- and anchor-operated components.

32 Reducing Terrorism Risk at Shopping Centers: An Analysis of Potential Security Options
on the number and size of elements of a system. For example, the cost of security checkpoints at customer entrances depends on the number of entrances.
Collateral Benefits and Detriments of Security Options
The security options analyzed in this study were chosen for their ability to reduce the risk of specific terrorist scenarios. However, the options also have some important collateral benefits and detriments. Some of the options have collateral benefits in terms of their effect on other security concerns. On the other hand, several of the options are likely to have a negative impact on the conventional shopping center operational environment, such as impeding customer access.
The impacts of such collateral effects may be important considerations in security deci-sions. However, these impacts are very difficult to characterize because they may include both logistical (e.g., time lost waiting at a security checkpoint) and psychological (e.g., concern about the risks of terrorism in shopping centers) aspects. Consequently, we did not include quantitative estimates of collateral effects in our risk modeling. Rather, we present a simple qualitative tabulation of collateral benefits and detriments associated with each security option that accompanies the prioritized list of options.
Each option was assessed for collateral impact in five categories. Non–terrorism-related security benefits include aiding loss prevention and reducing workplace violence. Operational detriments include impeding customer access, inconveniencing employees, and negative psy-chological impacts. The assessment simply indicates in which benefit and detriment categories each option is judged to have an impact—we made no attempt to assess the magnitude of the impact of any option in any category. Collateral impact assessments for each option are shown in Figure B.1. The Modeling Results section presents collateral impact assessments associated with each of the prioritized security options for each center.
Modeling Results
Our analytical model generates a prioritized list of security options, the cumulative reduction in risk as each option is added, and the cumulative annual cost as each option is added. The results for the three centers we examined in this study are displayed in Figures 3.3–3.5.5 Each figure shows the prioritized list of selected security options, with the priority decreasing from top to bottom. The figures also show the cost for each security option, the cumulative cost of the options up to any point in the list, and the cumulative relative risk at any point achieved by implementing the options up to that point in the list. These results are also listed in tabular form in Tables B.4–B.6.
5 The characteristics of each center are described in Chapter One.

Modeling the Effect of Security Options on Terrorism Risk 33
Figure 3.3Prioritized Security Options for Center A
RAND TR401-3.3
2. Suspicious package reporting
0. Baseline (no options)
31. Bollards at pedestrian entrances
13. Search bags and remove coatsat entrances, closed hours
25. More clearly label exits
3. Emergency response teams
6. Search bags and remove coats atentrances, open hours
21. Search carts/kiosks daily
1. Employee threat ID training
32. Dogs at parking and loading,open/delivery hours
23. Armed security with 100-percentvisual coverage of common area
18. Dogs at entrances, closed hours
5. Photo ID badge for contractorsand delivery
10. Trace detector portals atentrances, open hours
20. Control access to service areas
29. Loading dock access control and hydraulic bollards
16. Millimeter wave cameras atentrances, closed hours
24. Police substation in center
9. Millimeter wave cameras atentrances, open hours
26. Vehicle inspection at parking,open hours
4. Employee background checks
Cost ($M)
Annual costCumulative relative riskCumulative annual cost
654321 70
0.6 0.80.40.2 1.00
NOTES: Chemical and biological weapon scenarios (scenarios 15–17) and options that apply to chemical and biological weapons only (options 34–39) are excluded from this analysis because Center A is outdoors. Loading dock access control (option 28) is excluded from this analysis because this option is already implemented at Center A. Increase building standoff distance with bollard fence (option 30) is excluded from this analysis because there is no space for a standoff zone at Center A.
Relative risk
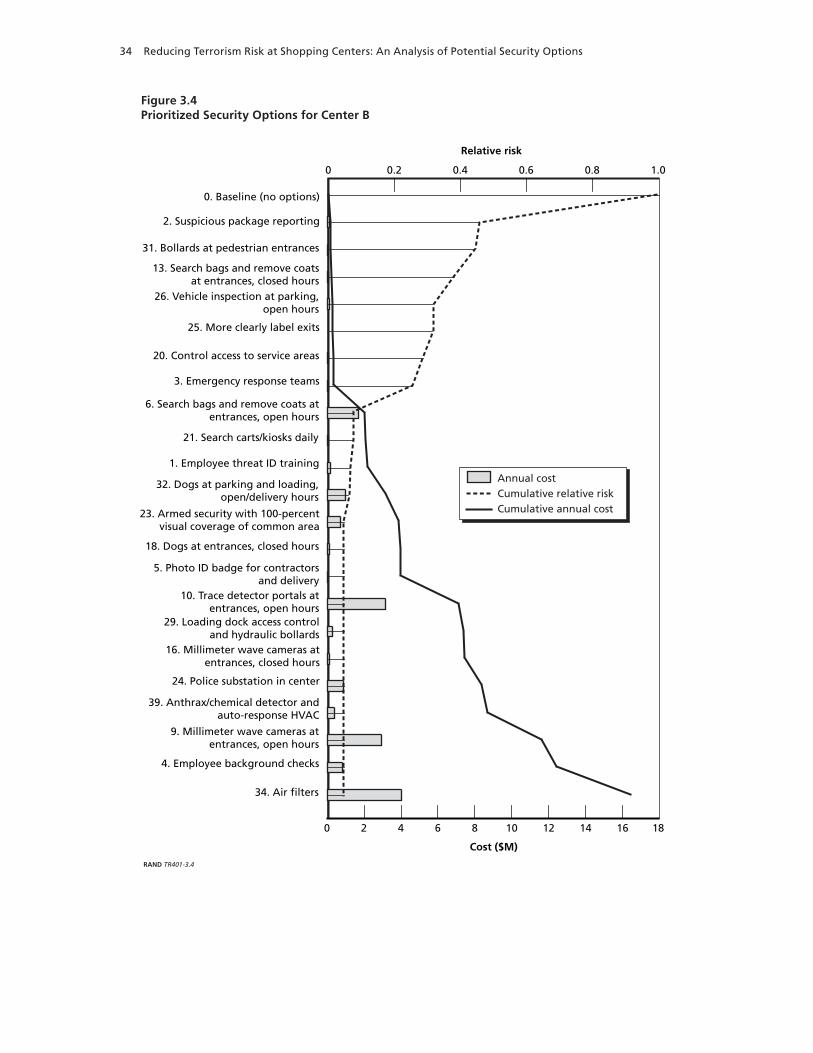
34 Reducing Terrorism Risk at Shopping Centers: An Analysis of Potential Security Options
Figure 3.4Prioritized Security Options for Center B
RAND TR401-3.4
Cost ($M)
Annual costCumulative relative riskCumulative annual cost
12108642 14 16 180
Relative risk
0.6 0.80.40.2 1.00
2. Suspicious package reporting
0. Baseline (no options)
31. Bollards at pedestrian entrances
13. Search bags and remove coatsat entrances, closed hours
26. Vehicle inspection at parking,open hours
25. More clearly label exits
3. Emergency response teams
6. Search bags and remove coats atentrances, open hours
21. Search carts/kiosks daily
1. Employee threat ID training
32. Dogs at parking and loading,open/delivery hours
23. Armed security with 100-percentvisual coverage of common area
18. Dogs at entrances, closed hours
10. Trace detector portals atentrances, open hours
5. Photo ID badge for contractorsand delivery
29. Loading dock access controland hydraulic bollards
20. Control access to service areas
16. Millimeter wave cameras atentrances, closed hours
24. Police substation in center
39. Anthrax/chemical detector andauto-response HVAC
9. Millimeter wave cameras atentrances, open hours
4. Employee background checks
34. Air filters

Modeling the Effect of Security Options on Terrorism Risk 35
Figure 3.5Prioritized Security Options for Center C
RAND TR401-3.5
Annual costCumulative relative riskCumulative annual cost
654321 7 80
NOTES: Car bomb in underground parking scenarios (scenarios 11 and 12) and options that apply to these scenarios only (options 26 and 27) are excluded from this analysis because Center C has no underground parking. Increase building standoff distance with bollard fence (option 30) is excluded from this analysis because there is no space for a standoff zone at Center C.
2. Suspicious package reporting
0. Baseline (no options)
31. Bollards at pedestrian entrances
13. Search bags and remove coatsat entrances, closed hours
25. More clearly label exits
3. Emergency response teams
6. Search bags and remove coats atentrances, open hours
21. Search carts/kiosks daily
1. Employee threat ID training
32. Dogs at parking and loading,open/delivery hours
23. Armed security with 100-percentvisual coverage of common area
18. Dogs at entrances, closed hours
11. Dogs at entrances, open hours
5. Photo ID badge for contractorsand delivery
20. Control access to service areas
28. Loading dock access control
16. Millimeter wave cameras atentrances, closed hours
24. Police substation in center
39. Anthrax/chemical detector andauto-response HVAC
9. Millimeter wave cameras atentrances, open hours
4. Employee background checks
34. Air filters
Cost ($M)
0.6 0.80.40.2 1.00
Relative risk
36 Reducing Terrorism Risk at Shopping Centers: An Analysis of Potential Security Options
General Findings
The modeling results for the different centers share several common characteristics that reflect some important general conclusions about terrorism security at commercial shopping centers that can be drawn from our analysis. These conclusions are listed below and summarized in Table 3.8.
Based on our model and assumptions, implementing security options can substantially decrease the terrorism risk at a shopping center: We find that if all the security options considered in this study were implemented, the risk of terrorism could be reduced by a factor of 20.The prioritization of security options is similar for the different centers. Eight of the top 10 options for each of the three centers are the same, and few options are shifted by more than two positions among the three centers. This result is discussed further below.The prioritization of security options is strongly driven by the risk of bomb attacks. Because bomb attacks dominate the overall terrorism risk, the model selectively chooses options that address bomb attacks.Most of the risk reduction occurs with the highest priority options. The cumulative risk drops steeply with the initial options, then decreases more gradually as additional options are added. We find that 95 percent of the total reduction achievable with all options is provided by the first six to ten options (the high-priority set).Most risk reduction occurs with less expensive options; the average cost of each of the options in the high-priority set is 20–35 percent of the average cost of all the options. This result is discussed further below.The high-priority set of security options spans a diverse range of approaches; the high-priority set of options include entries from five of the seven option categories listed in Table 3.6.
Differences Between Centers
As noted above, the prioritized list of security options is similar for the different centers exam-ined. This reflects the fact that the analyses for each center are based on the same set of sce-narios and security options and that the same security option effectiveness values were used for each center. Security option costs differ substantially between centers, but most costs correlate
Table 3.8Summary of Key General Results
Result Value
Risk reduction with all options Factor of 20
Number of options needed to reach 95% of total risk reduction (high-priority set) 6–10
Average cost of each option in high-priority set/average cost of all options 20–35%
Number of option categories represented in high-priority set 5 of 7
•
•
•
•
•
•

Modeling the Effect of Security Options on Terrorism Risk 37
with center size, so option costs tend to scale uniformly between centers and thus have little effect on the relative priority of different options.
The differences in option priorities among the three shopping centers stems mainly from the inclusion or exclusion of particular scenarios or options that are unique to these centers. For example, Center A is an outdoor center for which dispersal of biological or chemical agents is ineffective. Scenarios 15–17 (anthrax or chemical release) and options 34–39 (air filters and anthrax and chemical detectors) (see Tables 3.1 and 3.6, respectively) are therefore excluded from the prioritization analysis for Center A.
Costs and Effectiveness of Prioritized Security Options
The annual costs of the candidate security options range from $550 for option 25 (more clearly label exits) at Center C to nearly $5 million for option 11 (dogs at entrances, open hours) at Center B. The model algorithm prioritizes the security options according to their cost-effec-tiveness. Since costs do not necessarily correlate with effectiveness, the model preferentially selects the less expensive, more effective options. Consequently, the average cost of each option in the high-priority set is only 20–35 percent of the average cost of all the options. The total annual cost of the high-priority set of options is $1.1 million at Center A, $2.0 million at Center B, and $0.4 million at Center C. For comparison, typical annual common area main-tenance costs are $15 to $20 per square foot (Field and Bodamer, 2005), or $15 million to $20 million per year for a 1 million–square-foot center.
The most cost-effective option at all three centers is suspicious package reporting (option 2). Its value stems from the ability to take advantage relatively easily of the surveillance capability of the large number of customers in a shopping center. As with most other options, the great-est strength of this option is as a deterrent—if a terrorist group knows that an unattended bag or package will be reported swiftly, it will choose another target or choose another method to attack the same target.
Note that the model does not necessarily select options in the order of their individual cost-effectiveness. This is because the model algorithm recalculates the overall risk after each selected option is implemented and then selects the option that is most cost-effective at reduc-ing the risk from that point. Previously selected options will have already reduced some of the risk for various scenarios, which could potentially decrease or even nullify the incremen-tal effectiveness of a remaining option. In other words, the cost-effectiveness of any option depends on which options have already been implemented.
In terms of pure effectiveness (i.e., setting aside cost considerations), the most effective options entail security screening at customer entrances—dogs at entrances, open hours (option 11), search bags, open hours (option 6), mandatory coat and bag check, open hours (option 7), metal detectors and search bags, open hours (option 8), and trace detector portals at entrances, open hours (option 10). Note that some options in this group are mutually exclusive. Security screen-ing at customer entrances is the most effective approach because it is very good at preventing bomb attacks, which constitute the majority of the terrorism risk (see Figure 3.2). However, security screening is also an expensive approach, because it requires staff and, in some cases, equipment at every entrance. Because of their high cost, the highest any of these options rank in the three centers is fifth.

38 Reducing Terrorism Risk at Shopping Centers: An Analysis of Potential Security Options
Collateral Impacts of Security Options
Figures 3.6–3.8 show the qualitative collateral impacts for the prioritized security options at each center. In general, cumulative collateral impacts (either negative or positive) do not corre-late with the prioritized rank of the security options. Although these collateral impacts are not considered when the model prioritizes the security options, they may be helpful for decisions about which options to implement or about the details of how an option is implemented.
Screening checkpoints, in particular, could have strong negative collateral impacts if they cause people to wait in line to enter a shopping center or parking lot. We have examined the effect of screening checkpoints on line formation by using a simple queuing theory model. The queuing model calculates the wait time at a checkpoint as function of the arrival rate of people or cars and the number of security checkpoints in operation.
Analyses were conducted for a manual search of bags at customer entrances and for a manual search of vehicles entering a parking garage. Search times were assumed to be 30 sec-onds per bag at customer entrances (and we assume that half the people entering have bags that require searching) and 1 minute per vehicle. Arrival rates (30 people per minute and 17 cars per minute) are based on daily average rates for Center A during peak customer traffic times (mid-December). Peak arrival rates during the busiest part of the day could be as much as double the daily average rate. On the other hand, arrival rates at slower times of year could be less than half the rates in December. These two effects will tend to offset each other, so the rates we examine approximate typical values for this center. Results are shown in Figure 3.9 and 3.10.
The lowest value shown for the number of servers in each figure (eight for customer entrances and 18 for vehicle entrances) is the minimum number of checkpoints needed to prevent the line from growing to infinite length. The results show that nine checkpoints for searching bags at customer entrances is sufficient to keep the wait time under 1 minute. Vehicle screening, however, requires a minimum of 18 checkpoints, which could be infeasible.
Note that analyses made with this model are only approximate, since they assume a steady arrival rate and do not allow for natural fluctuations in arrival rates. In particular, lower numbers of servers may suffice if arrival rate variations allow a backlog of excess arrivals in one time interval to be “made up for” in a subsequent lower-traffic time interval.
Sensitivity to Model Parameters
The security option rankings generated in our analysis depend on certain assumptions, and it is informative to examine the sensitivity of the rankings to the various parameter values. In this section, we examine the sensitivity of the results to different input parameters. This provides a measure of how much security option rankings change when we vary our estimates of likeli-hoods and other assumptions.

Modeling the Effect of Security Options on Terrorism Risk 39
Figure 3.6Collateral Impacts of Prioritized Security Options for Center A
RAND TR401-3.6
–3 –2 –1 0 1 2
2. Suspicious package reporting
31. Bollards at pedestrian entrances
13. Search bags and remove coatsat entrances, closed hours
25. More clearly label exits
3. Emergency response teams
6. Search bags and remove coats atentrances, open hours
21. Search carts/kiosks daily
1. Employee threat ID training
32. Dogs at parking and loading,open/delivery hours
23. Armed security with 100-percentvisual coverage of common area
18. Dogs at entrances, closed hours
5. Photo ID badge for contractorsand delivery
10. Trace detector portals atentrances, open hours
20. Control access to service areas
29. Loading dock access control and hydraulic bollards
16. Millimeter wave cameras atentrances, closed hours
24. Police substation in center
9. Millimeter wave cameras atentrances, open hours
26. Vehicle inspection at parking,open hours
4. Employee background checks
Number of collateral benefit or detriment categories
Negative psychological impactEmployee inconvenienceImpeding customer access
Aiding loss preventionReducing workplaceviolence

40 Reducing Terrorism Risk at Shopping Centers: An Analysis of Potential Security Options
Figure 3.7Collateral Impacts of Prioritized Security Options for Center B
RAND TR401-3.7
–3 –2 –1 0 1 2
2. Suspicious package reporting
31. Bollards at pedestrian entrances13. Search bags and remove coats
at entrances, closed hours
26. Vehicle inspection at parking,open hours
25. More clearly label exits
3. Emergency response teams
6. Search bags and remove coats atentrances, open hours
21. Search carts/kiosks daily
1. Employee threat ID training
32. Dogs at parking and loading,open/delivery hours
23. Armed security with 100-percentvisual coverage of common area
18. Dogs at entrances, closed hours
10. Trace detector portals atentrances, open hours
5. Photo ID badge for contractorsand delivery
29. Loading dock access controland hydraulic bollards
20. Control access to service areas
16. Millimeter wave cameras atentrances, closed hours
24. Police substation in center
39. Anthrax/chemical detector andauto-response HVAC
9. Millimeter wave cameras atentrances, open hours
4. Employee background checks
34. Air filters
Number of collateral benefit or detriment categories
Negative psychological impactEmployee inconvenienceImpeding customer access
Aiding loss preventionReducing workplaceviolence

Modeling the Effect of Security Options on Terrorism Risk 41
Figure 3.8Collateral Impacts of Prioritized Security Options for Center C
RAND TR401-3.8
–3 –2 –1 0 1 2
2. Suspicious package reporting
31. Bollards at pedestrian entrances
13. Search bags and remove coatsat entrances, closed hours
25. More clearly label exits
3. Emergency response teams
6. Search bags and remove coats atentrances, open hours
21. Search carts/kiosks daily
1. Employee threat ID training
32. Dogs at parking and loading,open/delivery hours
23. Armed security with 100-percentvisual coverage of common area
18. Dogs at entrances, closed hours
11. Dogs at entrances, open hours
5. Photo ID badge for contractorsand delivery
20. Control access to service areas
28. Loading dock access control
16. Millimeter wave cameras atentrances, closed hours
24. Police substation in center
39. Anthrax/chemical detector andauto-response HVAC
9. Millimeter wave cameras atentrances, open hours
4. Employee background checks
34. Air filters
Number of collateral benefit or detriment categories
Negative psychological impactEmployee inconvenienceImpeding customer access
Aiding loss preventionReducing workplaceviolence

42 Reducing Terrorism Risk at Shopping Centers: An Analysis of Potential Security Options
Figure 3.9Wait Times for Customer Entrance Security Screening Checkpoints
RAND TR401-3.9
0
0.2
0.4
0.6
0.8
1.0
1.2
1.4
8 9 10 11 12 13
Number of servers
Cu
sto
mer
wai
t ti
me
(min
ute
s)
Likelihood Estimates. Because different security options are effective against different sce-narios, the option rankings selected by the model depend on the relative likelihoods of the sce-narios. To understand how sensitive the rankings are to changes in likelihoods, we conducted an analysis to determine how much the likelihoods could be varied before the option rankings began to change significantly. We used a Monte Carlo simulation6 to calculate the frequency with which each option was assigned a particular rank, since the likelihood values for each sce-nario were varied independently. Based on this analysis, we found that the option rankings did not begin to change appreciably until likelihoods were varied by more than a factor of 10. This indicates that the security option rankings determined by the model are insensitive to uncer-tainties of a factor of 10 in the scenario likelihoods. That the results are insensitive to such a large range in likelihood values may seem surprising, but can be understood in light of the fact that the likelihood for the different scenarios span a range of 5,000 (Table 3.2).
6 Monte Carlo simulations involve running multiple analyses in which the values of particular variables change from run to run according to a prescribed formula. In this analysis, the likelihood values for each scenario were drawn from a trian-gular distribution for each run.
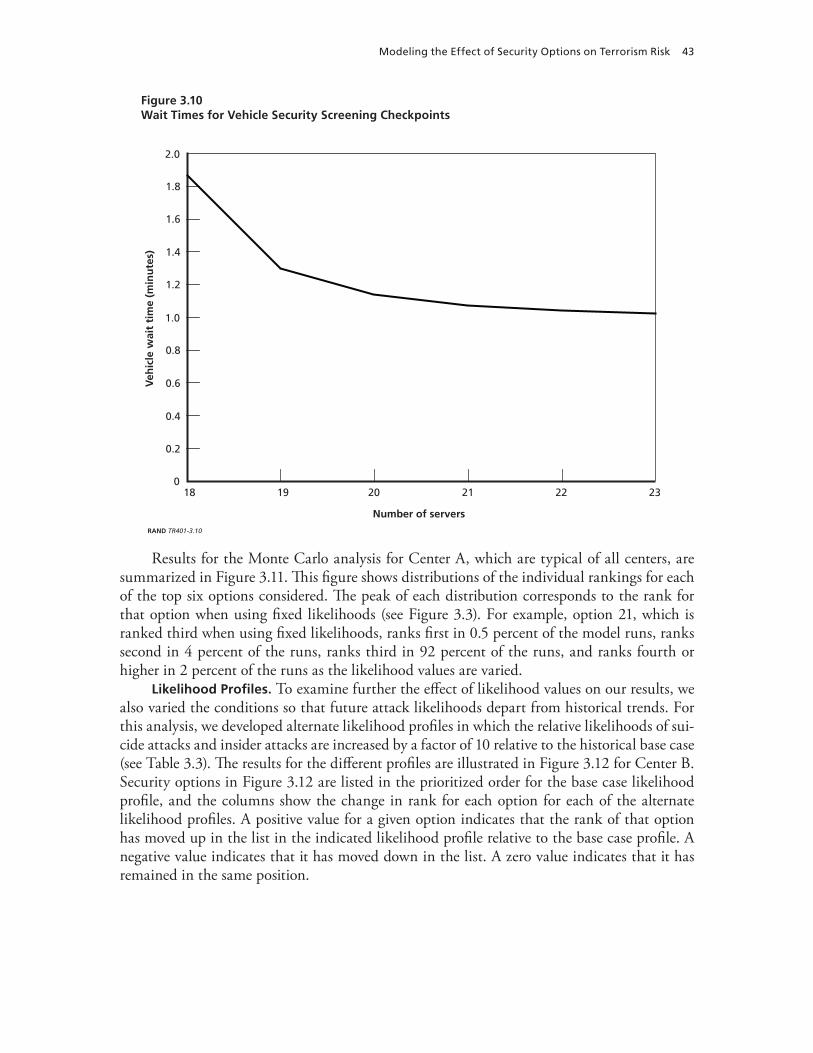
Modeling the Effect of Security Options on Terrorism Risk 43
Figure 3.10Wait Times for Vehicle Security Screening Checkpoints
RAND TR401-3.10
18 19 20 21 22 23
Number of servers
Veh
icle
wai
t ti
me
(min
ute
s)
0
0.2
0.4
0.6
0.8
1.0
1.2
1.4
1.6
1.8
2.0
Results for the Monte Carlo analysis for Center A, which are typical of all centers, are summarized in Figure 3.11. This figure shows distributions of the individual rankings for each of the top six options considered. The peak of each distribution corresponds to the rank for that option when using fixed likelihoods (see Figure 3.3). For example, option 21, which is ranked third when using fixed likelihoods, ranks first in 0.5 percent of the model runs, ranks second in 4 percent of the runs, ranks third in 92 percent of the runs, and ranks fourth or higher in 2 percent of the runs as the likelihood values are varied.
Likelihood Profiles. To examine further the effect of likelihood values on our results, we also varied the conditions so that future attack likelihoods depart from historical trends. For this analysis, we developed alternate likelihood profiles in which the relative likelihoods of sui-cide attacks and insider attacks are increased by a factor of 10 relative to the historical base case (see Table 3.3). The results for the different profiles are illustrated in Figure 3.12 for Center B. Security options in Figure 3.12 are listed in the prioritized order for the base case likelihood profile, and the columns show the change in rank for each option for each of the alternate likelihood profiles. A positive value for a given option indicates that the rank of that option has moved up in the list in the indicated likelihood profile relative to the base case profile. A negative value indicates that it has moved down in the list. A zero value indicates that it has remained in the same position.

44 Reducing Terrorism Risk at Shopping Centers: An Analysis of Potential Security Options
Figure 3.11Distributions of Rank Assignments for Top Six Options
RAND TR401-3.11
Rank
Freq
uen
cy a
t ta
nk
0.9
0.8
0.7
0.6
0.5
0.4
0.3
0.2
0.1
1.0
010987654321
31. Bollards at pedestrian entrances 2. Suspicious package reporting21. Search carts/kiosks daily25. More clearly label exits 3. Emergency response teams13. Search bags and remove coats at entrances, closed hours
The changes in ranking of various options under the alternate likelihood profiles can gen-erally be understood in terms of the differential effectiveness of options for suicide and insider attacks. For example, option 21, search carts/kiosks daily, is effective against insider attacks only, so it moves up five positions under the high insider profile.
Consequence Weighting. We also examined the effect of alternate weightings of fatalities and shopping center downtime on the rankings of security options. Results for Center B are shown in Figure 3.13. This analysis indicates that the option rankings are less sensitive to the relative weightings of fatalities and downtime than they are to likelihood profiles. This appears to result from the fact that the dynamic range of both consequence metrics is small compared with the dynamic range of the likelihood values: Fatalities vary by a factor of 25 among the scenarios, while likelihoods vary by a factor of 5,000. Thus, security option rankings are less sensitive to changes in consequences than they are to changes in relative likelihoods.
Results for Heightened Threat Conditions
Thus far, our model results have addressed conditions under which there is no specific height-ened threat of a terrorist attack. Here we examine how the model can be used to prioritize security options under such conditions. A heightened terrorist threat at shopping centers could occur in two ways. One is a general increased terrorist threat nationwide, in a particular local

Modeling the Effect of Security Options on Terrorism Risk 45
Figure 3.12Effect of Alternate Likelihood Profiles on Option Rankings for Center B
RAND TR401-3.12
–4 –3 –2 –1 0 1 2 3 4 5 6 7
2. Suspicious package reporting
31. Bollards at pedestrian entrances
13. Search bags and remove coatsat entrances, closed hours
26. Vehicle inspection at parking,open hours
25. More clearly label exits
20. Control access to service areas
3. Emergency response teams
6. Search bags and remove coats atentrances, open hours
21. Search carts/kiosks daily
1. Employee threat ID training
32. Dogs at parking and loading,open/delivery hours
23. Armed security with 100-percentvisual coverage of common area
18. Dogs at entrances, closed hours
5. Photo ID badge for contractorsand delivery
10. Trace detector portals at entrances,open hours
29. Loading dock access control andhydraulic bollards
16. Millimeter wave cameras at entrances,closed hours
24. Police substation in center
39. Anthrax/chemical detector andauto-response HVAC
9. Millimeter wave cameras at entrances,open hours
4. Employee background checks
34. Air filters
Rank change relative to base case
High suicide
High insider
area, or for shopping centers in particular. In this situation, the overall likelihood of an attack is higher, but there is no specific information to indicate that a particular weapon or scenario is planned. Consequently, the likelihoods for all scenarios would increase uniformly and there

46 Reducing Terrorism Risk at Shopping Centers: An Analysis of Potential Security Options
Figure 3.13Effect of Consequence Weighting on Option Rankings for Center B
RAND TR401-3.13
–3 –2 –1 0 1 2
2. Suspicious package reporting
31. Bollards at pedestrian entrances
13. Search bags and remove coatsat entrances, closed hours
25. More clearly label exits
3. Emergency response teams
6. Search bags and remove coats atentrances, open hours
21. Search carts/kiosks daily
1. Employee threat ID training
32. Dogs at parking and loading,open/delivery hours
23. Armed security with 100-percentvisual coverage of common area
18. Dogs at entrances, closed hours
5. Photo ID badge for contractorsand delivery
39. Anthrax/chemical detector andauto-response HVAC
10. Trace detector portals atentrances, open hours
20. Control access to service areas
29. Loading dock access control and hydraulic bollards
16. Millimeter wave cameras atentrances, closed hours
24. Police substation in center
9. Millimeter wave cameras atentrances, open hours
26. Vehicle inspection at parking,open hours
4. Employee background checks
34. Air filters
Rank change relative to base case
C = 0.75F + 0.25DC = 0.25F + 0.75D
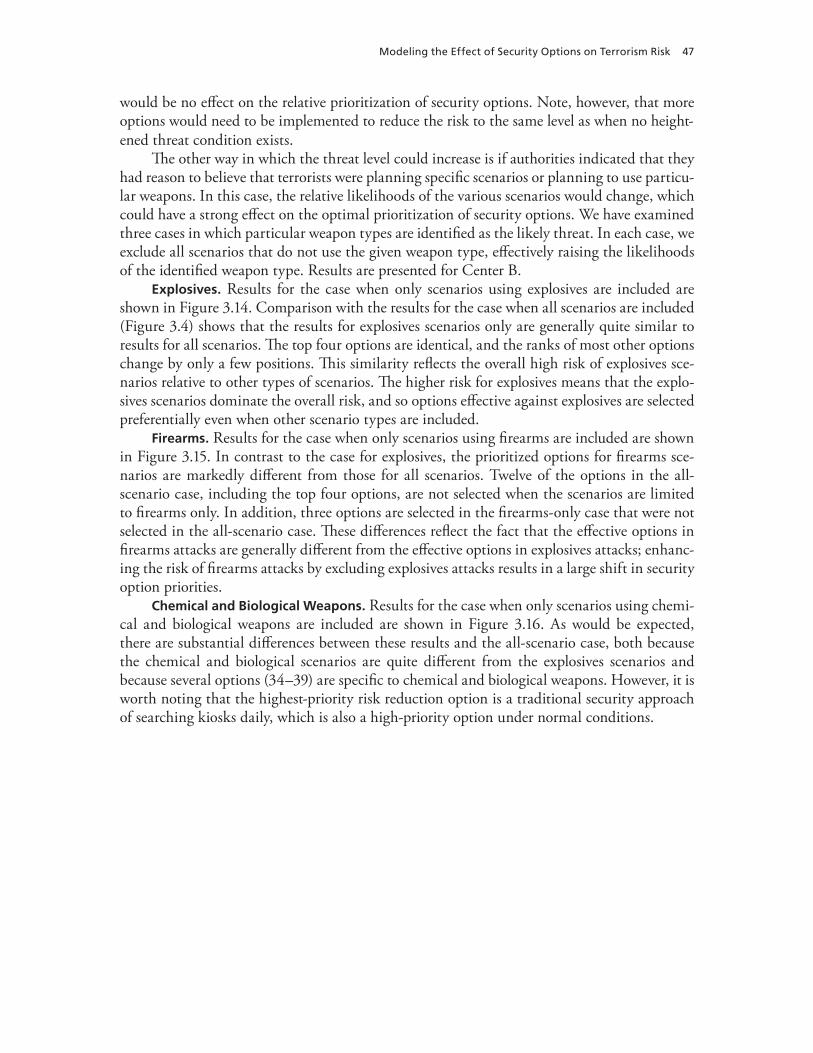
Modeling the Effect of Security Options on Terrorism Risk 47
would be no effect on the relative prioritization of security options. Note, however, that more options would need to be implemented to reduce the risk to the same level as when no height-ened threat condition exists.
The other way in which the threat level could increase is if authorities indicated that they had reason to believe that terrorists were planning specific scenarios or planning to use particu-lar weapons. In this case, the relative likelihoods of the various scenarios would change, which could have a strong effect on the optimal prioritization of security options. We have examined three cases in which particular weapon types are identified as the likely threat. In each case, we exclude all scenarios that do not use the given weapon type, effectively raising the likelihoods of the identified weapon type. Results are presented for Center B.
Explosives. Results for the case when only scenarios using explosives are included are shown in Figure 3.14. Comparison with the results for the case when all scenarios are included (Figure 3.4) shows that the results for explosives scenarios only are generally quite similar to results for all scenarios. The top four options are identical, and the ranks of most other options change by only a few positions. This similarity reflects the overall high risk of explosives sce-narios relative to other types of scenarios. The higher risk for explosives means that the explo-sives scenarios dominate the overall risk, and so options effective against explosives are selected preferentially even when other scenario types are included.
Firearms. Results for the case when only scenarios using firearms are included are shown in Figure 3.15. In contrast to the case for explosives, the prioritized options for firearms sce-narios are markedly different from those for all scenarios. Twelve of the options in the all-scenario case, including the top four options, are not selected when the scenarios are limited to firearms only. In addition, three options are selected in the firearms-only case that were not selected in the all-scenario case. These differences reflect the fact that the effective options in firearms attacks are generally different from the effective options in explosives attacks; enhanc-ing the risk of firearms attacks by excluding explosives attacks results in a large shift in security option priorities.
Chemical and Biological Weapons. Results for the case when only scenarios using chemi-cal and biological weapons are included are shown in Figure 3.16. As would be expected, there are substantial differences between these results and the all-scenario case, both because the chemical and biological scenarios are quite different from the explosives scenarios and because several options (34–39) are specific to chemical and biological weapons. However, it is worth noting that the highest-priority risk reduction option is a traditional security approach of searching kiosks daily, which is also a high-priority option under normal conditions.

48 Reducing Terrorism Risk at Shopping Centers: An Analysis of Potential Security Options
Figure 3.14Prioritized Security Options for Explosives Scenarios
RAND TR401-3.14
Cost ($M)
Annual costCumulative relative riskCumulative annual cost
108642 120
Relative risk
0.6 0.80.40.2 1.00
2. Suspicious package reporting
0. Baseline (no options)
31. Bollards at pedestrian entrances
13. Search bags and remove coatsat entrances, closed hours
3. Emergency response teams
6. Search bags and remove coats atentrances, open hours
21. Search carts/kiosks daily
1. Employee threat ID training
32. Dogs at parking and loading,open/delivery hours
18. Dogs at entrances, closed hours
5. Photo ID badge for contractorsand delivery
20. Control access to service areas
16. Millimeter wave cameras atentrances, closed hours
22. Security with 100-percent visualcoverage of common areas
9. Millimeter wave cameras atentrances, open hours
4. Employee background checks
10. Trace detector portals atentrances, open hours
29. Loading dock access control and hydraulic bollards
26. Vehicle inspection at parking,open hours
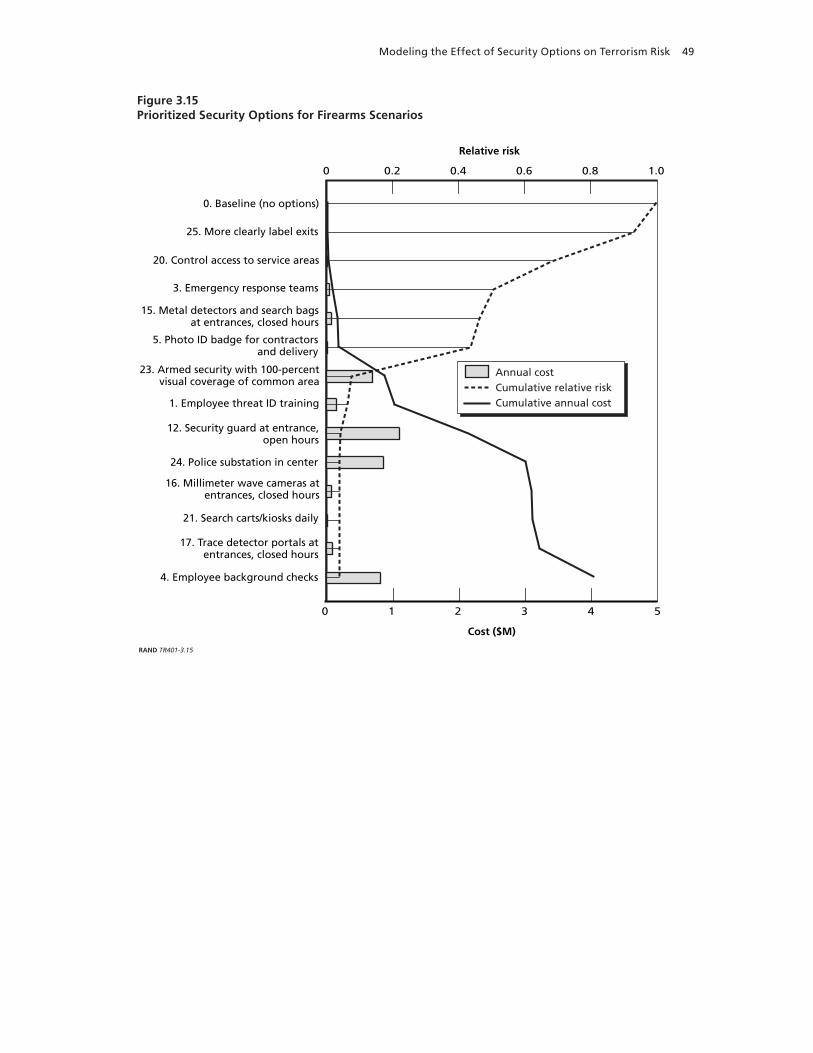
Modeling the Effect of Security Options on Terrorism Risk 49
Figure 3.15Prioritized Security Options for Firearms Scenarios
RAND TR401-3.15
0. Baseline (no options)
25. More clearly label exits
3. Emergency response teams
21. Search carts/kiosks daily
1. Employee threat ID training
23. Armed security with 100-percentvisual coverage of common area
12. Security guard at entrance,open hours
5. Photo ID badge for contractorsand delivery
17. Trace detector portals atentrances, closed hours
20. Control access to service areas
16. Millimeter wave cameras atentrances, closed hours
24. Police substation in center
15. Metal detectors and search bagsat entrances, closed hours
4. Employee background checks
Cost ($M)
Annual costCumulative relative riskCumulative annual cost
4321 50
Relative risk
0.6 0.80.40.2 1.00

50 Reducing Terrorism Risk at Shopping Centers: An Analysis of Potential Security Options
Figure 3.16Prioritized Security Options for Chemical and Biological Weapon Scenarios
RAND TR401-3.16
0. Baseline (no options)
21. Search carts/kiosks daily
35. Anthrax detectors
1. Employee threat ID training
22. Security with 100-percent visualcoverage of common area
17. Trace detector portals atentrances, closed hours
37. Chemical detectors
5. Photo ID badge for contractorsand delivery
16. Millimeter wave cameras atentrances, closed hours
34. Air filters
4. Employee background checks
Cost ($M)
Annual costCumulative relative riskCumulative annual cost
1412108642 160
Relative risk
0.6 0.80.40.2 1.00
2. Suspicious package reporting
25. More clearly label exits
13. Search bags and remove coatsat entrances, closed hours
6. Search bags and remove coats atentrances, open hours
3. Emergency response teams
10. Trace detector portals atentrances, open hours
9. Millimeter wave cameras atentrances, open hours
Modeling the Effect of Security Options on Terrorism Risk 51
Summary
Our analysis shows that implementing about 10 security options that span a range of approaches and that deter, deny, or mitigate a range of potential terrorist threats can substantially reduce the terrorism risk at commercial shopping centers. The majority of these options involve tradi-tional security approaches, such as installing bollards at pedestrian entrances, searching bags, encouraging suspicious package reporting, and searching vehicles.
Although there are some differences in the order of the high-priority options selected for different centers, overall the prioritizations of security options for the different centers exam-ined in this report are similar. The similarity among centers ultimately reflects the fact that shopping centers generally share a similar set of vulnerabilities to terrorism and lend themselves to the same types of security options to reduce the terrorism risk.
Qualitatively estimated collateral impacts of high-priority options are likely to influence security decisions. A simple queuing model applied to a modest-sized center indicates that cus-tomer entrance security checkpoints could easily be implemented with minimal wait times but that vehicle screening at parking entrances may result in substantial wait times.
The total annual cost of the high-priority options (those that generate 95 percent of the total possible risk reduction) ranges from $0.4 million to $2.0 million at the three centers examined.
Prioritization results are largely insensitive to the relative weighting of fatalities and center downtime and are moderately sensitive to variations in likelihood estimates. Results are most sensitive to variations in which scenarios are included, which could vary if authorities indicate an increased likelihood of attacks using a specific weapon type.

53
CHAPTER FOUR
Additional Components of Terrorism Security at Shopping Centers
The model presented in Chapter Three prioritizes the security options considered under assumptions about likelihood and consequence of varying types of attacks and effectiveness of options. There is a wide spectrum of nuanced strategies and implications that this model does not attempt to characterize yet that are important considerations. This chapter discusses some perspectives that the model does not address, but nonetheless may be important for guiding decisionmaking about reducing terrorism risk at shopping centers.
Standby Considerations
Some of the high-priority security options identified in our modeling may be appropriate to implement immediately. Indeed, some shopping centers have begun implementing terrorism security strategies that include some of the options identified in this report. On the other hand, stakeholders may choose not to implement many of the security options unless the terrorism threat conditions were to change for the worse.
If the risk of terrorist attacks were to increase rapidly, e.g., if periodic attacks began occurring in the United States, it would be important for shopping center operators to be in a position to implement additional security options quickly. The security options identified in this report cannot leap immediately from concept to implementation. Much consideration will have to be brought to each option to develop a suitable implementation plan. This section discusses some things that center operators could do now to facilitate the implementation of security options.
Preparing for Future Acquisitions
Some of the security options require physical assets (e.g., metal detectors) that shopping cen-ters may not already possess. Many of the options will require substantial changes in security operations and staffing levels. Some will require light construction. All options will require some level of public relations effort to educate tenants and customers about new procedures. All these steps could be facilitated by contacting suppliers and prepositioning agreements with specific vendors for assets that might be needed in the future. This would increase how quickly shopping centers could respond to a particular threat environment to continue operations.

54 Reducing Terrorism Risk at Shopping Centers: An Analysis of Potential Security Options
Data Collection Opportunities
The model does not take into account every consideration that management would have to weigh for each security option. Many of these considerations are very site specific and would be exceedingly difficult to build into a general model. For example, inspecting the vehicles of all patrons parking at the facility could require more inspection stations than there are entrances to a garage. This is a physical constraint that particular shopping centers face, which is not represented in the model. Similarly, a decisionmaker cannot make a sound judgment as to whether a particular site can inspect every vehicle entering a parking structure without know-ing something about projected volume of vehicles entering. Decisionmakers must have access to detailed data in order to make sound judgments, estimate costs accurately, and develop implementation plans. An effort to collect relevant data ahead of time would enable manage-ment to determine whether and how to implement various security options in particular envi-ronments when the need arises.
Modeling Opportunities
Implications of many of the security options could be explored further using site-specific data mentioned above. Queuing theory could be applied to several of the security options consid-ered. More sophisticated queuing models could elucidate optimal strategies for specific sites. Such models would allow decisionmakers to determine the appropriate number of stations needed and define efficient staffing schedules. Queuing models have been successfully used in a variety of industries to optimize operations.
Psychological Implications
Implementation of some of the security options may have a negative psychological impact on shopping center customers and employees. For example, requiring shoppers to go through a screening checkpoint imposes a disutility that might turn away the consumers on the margin. It is difficult to project how consumers will react to measures taken to increase security. Much will likely be determined by the public’s perception of the risk environment at a particular point in time. For example, after September 11, 2001, the public accepted increased security measures at airports that might have been met with more resistance earlier. There may be strategies that shopping centers could design to mitigate the psychological impact of shoppers. Such strategies should seek to communicate to consumers that facilities have taken appropriate security measures while still providing a permissive environment for shopping.
Structural Design Considerations
As noted in Chapter Three, the security options considered in this report exclude major design and construction issues. In some cases, the risk of bomb attacks can be mitigated by means of structural design approaches. Given that property development and redevelopment are impor-tant aspects of the shopping center industry, structural design and construction options may be useful approaches. In this section, we summarize some guidance available from government agencies regarding structural hardening (physically strengthening a structure) and building

Additional Components of Terrorism Security at Shopping Centers 55
standoff zones. This material is provided for informational purposes only and has not been reviewed for accuracy or effectiveness.
As described in Chapter Two, explosives are the most common weapon used in terrorist attacks. Notable examples include pedestrian suicide bombers in Israel and vehicle bombs at the Murrah building in Oklahoma City, Khobar Towers in Saudi Arabia, and the U.S. embas-sies in Kenya and Tanzania. The blast from explosives affects structures and the people inside them in multiple ways. People can be injured or killed by the blast pressure, by being propelled into walls or objects, and by fragments created and propelled by the blast wave. Fragments can come from glass and structural materials as well as from shrapnel placed around the bomb. Blast can also cause localized damage to a structure, knocking down walls and columns and causing sections of a building nearest the explosion to collapse. The effects of a particular bomb depend on its size and the distance it is detonated from the building. Table 4.1 summarizes the effects of bombs at different distances.
In shopping centers, bombs can also damage merchandise, equipment, and real property. Bombs can lead to revenue losses for the merchants and the shopping center owner by forcing the closure of a portion or even the entire facility.
A bomb’s effects can be amplified many times over if the blast from a bomb causes a structure to undergo a progressive collapse, where an initial local structural failure spreads to other elements in the structure, resulting in collapse that is much larger than the explosive would have caused on its own (Federal Emergency Management Agency, 2003a). The collapse of the two World Trade Center buildings in 2001 illustrates the amplifying effect that progres-sive collapse can have on casualties and property losses. Many of the deaths and injuries in the Oklahoma City bombing were in the zone of progressive collapse (Mallonee et al., 1996).
Structural mitigation measures can be broken into two basic groups: those that keep the bombs away from the structure or critical elements of the structure and those that harden the structure, making it more resistant to the effects of a bomb.
Standoff
The most effective mitigation measure for bomb attacks is to keep bombs as far away from the structure as possible. This is accomplished by establishing a standoff distance between a structure and potential bomb detonation locations. This approach takes advantage of the
Table 4.1Structural Damage and Injuries Due to Explosion Effects
Distance from Explosion Most Severe Building Damage Expected Associated Injuries
Close General collapse Fatality due to impact and crushing
Moderate Exterior wall failure, damage to floor slabs in rooms along exterior wall
Skull fracture, concussion
Far Window breakage, falling light fixtures, flying debris
Lacerations from flying glass, abrasions from being thrown against objects or objects striking occupants
SOURCE: Federal Emergency Management Agency (2003a, pp. 4–8).

56 Reducing Terrorism Risk at Shopping Centers: An Analysis of Potential Security Options
fact that the blast effects from a bomb decrease rapidly with distance. It is possible to create standoff zones to some extent for truck and car bombs at shopping centers where access can be restricted. But this can be difficult in urban areas if a shopping center adjoins city streets and sidewalks.
Exterior Standoff. U.S. Department of Defense (2003) guidance for military facilities mandates standoff distances of 80–150 feet for inhabited buildings. This guidance was devel-oped primarily for sleeping quarters and office buildings. The topology of shopping centers provides comparatively greater protection to the occupants from bombs detonated outside of the structure. There generally are not many windows facing outside, and the storefronts face the internal common area rather than the road or parking areas. Moreover, the areas closest to the exterior of the structure tend to be storage areas and service hallways, where the density of people is very low. This topology means that the standoff distance needed for a shopping center is likely to be smaller than that needed for an office building.
Interior Standoff. The open nature of shopping centers creates risks that are less common in office buildings—the public can simply walk into the common area where the density of people is the highest. Keeping package bombs and pedestrian bombers out of a shopping center is thus difficult, requiring security checkpoints to screen people and bags at shopping center entrances.
Even without security screening, however, the structure still could be protected to some degree against these smaller bombs by preventing them from being placed in direct contact with vulnerable points in the structure. This could be accomplished by hiding critical columns and beams in walls or spaces that are inaccessible to the public. Critical columns that must remain exposed could be protected by creating architectural barriers around them that are at least six inches away from the columns. In a shopping center, these standoff distances could be created by placing columnar billboards around the columns.
Critical structural columns may be present both in a center’s interior and in exterior areas such as beneath overhangs or in underground parking structures. Movie theaters above parking lots or other easily accessible spaces are particularly vulnerable to bombs targeting columns.
Hardening Structures
Hardening the structure can be a useful mitigation strategy in some situations, particularly where it would be difficult to establish standoff zones for vehicles or where package bombs could be placed near critical structural elements. Extensive hardening would require radi-cally different construction techniques and architecture than are used today. Shopping centers would end up looking more like concrete military bunkers and would be extremely expensive to build. Nevertheless, several steps short of building bunkers could be taken to strengthen the structure of a shopping center, particularly against progressive collapse.
The first of these is to harden specific elements of the structure, particularly those col-umns and beams that are critical to preventing progressive collapse. Several useful references provide a general overview of potential measures for new and existing structures.1 According to
1 The Federal Emergency Management Agency has publications that provide general guidance on protecting structures from so-called WMD attacks, including explosives. They include Federal Emergency Management Agency (2003a, 2003b,

Additional Components of Terrorism Security at Shopping Centers 57
these references, concrete columns in existing facilities can be retrofitted with protective wrap-pings of steel or composite materials that would hold the column in place even if the concrete inside had been turned to rubble. Steel columns can be wrapped with concrete to protect them from the force of the blast. In new structures, important columns can be built with spiral rein-forcing, column spacing can be minimized, and floor slabs can be attached to columns so that they can withstand the upward pressures of an explosion.
The degree to which an existing or new structure should be hardened and the best mea-sures for achieving the desired level of protection would depend on an assessment of the likely threat and the effectiveness of the measures in reducing that threat. It would also require detailed analysis of the proposed protective measures by a structural engineer specializing in hardening against explosives.
Strategic Security Considerations
Our analysis addresses security options implemented at the individual center level. Suchtactical-level security, however, is only one component of the overall terrorism security strategy protecting a shopping center. Higher-level security efforts can also be important and should be included in any terrorism security strategy. An example of a potentially valuable mid-level security option that can be implemented company- or industry-wide is developing and shar-ing databases of suspicious persons and events (e.g., unexplained recurring visits to a particular center, visits to numerous centers). Most higher-level strategic components, such as intelligence gathering and analysis, border security, emergency response, and terrorism insurance, are gen-erally outside the influence of a shopping center operator or the shopping center industry. However, by staying informed about initiatives and progress in these areas, shopping center operators may identify opportunities to express their interests and influence activities.
Special Operational Environments
The model does not consider the implications of special operational environments created by nonroutine events. Special events (e.g., concerts) have the potential to create unique situa-tions that could have an impact on the likelihood or consequences of attacks and on the types and effectiveness of security options. A special event may increase the number and density of people (increasing the consequences) and might make an attack more desirable to terrorists (increasing the likelihood). In addition, these events generate deviations from routine activi-ties, making it more difficult to notice unusual activities that could be indications of a terrorist attack (decreasing the effect of security measures). A special event transforms the venue from its originally designed purpose. Security measures taken to provide a permissive environment for shopping may not be optimal for special events.
2005). Other useful references on the effects of explosions on structures include U.S. Department of Defense (2003) and U.S. Army Corps of Engineers (1999).


59
CHAPTER FIVE
Implications for Terrorism Security at Shopping Centers
We conclude with a discussion of some implications for terrorism security at commercial shop-ping centers raised by our analysis. These implications derive from the prioritization of terror-ism security options at three centers that, in turn, is based on estimates of the relative risks of different types of terrorist attacks at shopping centers of how well different security options reduce these risks. It is important to reiterate that terrorism risk is uncertain, and the results of our analysis are contingent upon various assumptions about the likelihoods of different attack scenarios, the consequences of these scenarios, and the effectiveness and cost of security options. We have examined the sensitivity of our results to several parameters and find that the results are generally robust over large variations in fundamental assumptions. In addition, we have attempted to be comprehensive when including scenarios and security options for consid-eration. Nonetheless, as discussed in Chapter Two, terrorism risk is evolving and it is unclear how well the future terrorism risk can be predicted from historical trends. This tenet applies not only to the likelihoods of different scenarios, but also to the lethality of attacks and the type and effectiveness of terrorism security strategies. Terrorism risk is dynamic, and assess-ments of terrorism security strategies must be updated frequently (e.g., Jackson et al., 2005a, 2005b). The implications discussed here apply to the current threat environment.
A strategy to reduce the risk of terrorism will be similar for most shopping centers. Our analysis indicates that the principal risk-reducing security options do not differ dramatically across the three types of centers examined in this report. Because the characteristics of the centers we examined are quite diverse, including large and small, indoor and outdoor, urban and suburban, this similarity is expected to hold for shopping centers in general. This means that many of the decisions regarding implementing terrorism security options can be managed centrally.
Centralized management of a similar set of options at multiple centers would facilitate information sharing among centers, allowing pitfalls to be identified and avoided and best practices to be promoted. Given the fairly substantial operational impacts of some options, this could help minimize transition problems. Centralized security management can also create an economy of scale and increase efficiency.
A similar set of options at most shopping centers may also help mitigate the confusion and anxiety among the public that could potentially arise if security efforts are increased. Espe-
60 Reducing Terrorism Risk at Shopping Centers: An Analysis of Potential Security Options
cially if accompanied by a company- or industry-wide public relations effort, this could increase confidence that the increased security is safe and effective and is being well monitored.1
Disaster preparedness plans and exercises that focus primarily on emergency response do little to reduce terrorism risk. The vast majority of terrorism risk derives from attacks using explosives (Figure 3.2), for which the effects are immediate and the hazard abates very quickly. As a result, little can be done to reduce consequences (casualties or property damage) of a ter-rorist attack once it has occurred. While security options may help mitigate consequences in some cases, the effects are small and generally apply to low-risk attack scenarios (see Table B.1). As opposed to mitigating consequences, terrorism risk must be reduced by deterrence. This is the primary way in which most of the security options considered in this analysis are effective.2
Consequently, existing disaster preparedness plans and exercises, which focus primarily on the emergency response to a disaster, offer little toward reducing the risk of terrorism. Such plans have great benefit for reducing the risks of threats such as fires and earthquakes and therefore represent an essential part of a shopping center’s security strategy. However, shopping center operators should not assume that in having such a plan they have adequately addressed terrorism security. Terrorism security is very different from disaster preparedness. This means that terrorism security will involve separate planning, training, and exercising approaches that focus on concerns such as reporting suspicious packages and detecting weapons.
Centers that move to implement terrorism security options early may experience both challenges and advantages. As illustrated in Figures 3.6–3.8, some of the high-priority secu-rity options identified in the analysis are expected to have negative collateral effects. Some options, primarily security checkpoints at parking and customer entrances, will impede access of shoppers into a center. Some high-priority options may also elicit some amount of negative psychological reaction from customers. If these effects are great enough, they may cause some shoppers to choose to go to alternate shopping centers or to avoid shopping centers altogether. This effect would be a disadvantage to centers that implement terrorism security options.
On the other hand, were the threat from terrorism to be perceived as increasing, the psy-chology may be reversed and customers may feel safer in centers with increased security. This would almost certainly be the case in the aftermath of an attack in the United States. One pos-sible sequence is that a center that decides to implement terrorism security may at first suffer some decrease in customer traffic only to have it resume or increase as people become more accustomed to the new environment.
It would be instructive to examine the customer responses to increasing terrorism secu-rity. As noted earlier, some of the options highlighted in this analysis are being implemented at shopping centers currently, and customer responses could be tracked and evaluated. Case stud-
1 We note that the effectiveness values for the security options were assigned under the assumption that terrorists deterred from one shopping center could easily choose an alternate shopping center to attack. If all centers implement terrorism secu-rity options, this logic may fail because terrorists might not be so easily deterred and effectiveness values would need to be adjusted to reflect this. On the other hand, in the face of strong deterrence at shopping centers, terrorist may seek alternate target types.2 As noted in Chapter Three, deterrence is most effective when unprotected alternate targets are available.

Implications for Terrorism Security at Shopping Centers 61
ies in regions with greater terrorist threats and greater security, such as Israel and the United Kingdom, could provide useful reference models and lessons that could assist decisionmaking and security implementation in shopping centers in the United States.
Tiered implementation may be the best strategy. One way to approach the problem of reducing the risk of terrorist attack is to implement a set of measures that is most appropri-ate for today’s environment and develop plans today for further measures if the environment changes for the worse. Those plans should address the issue of how best to deal with the long-lead aspects of those measures, including precontracting for equipment or activities such as light construction or training staff to implement the measures in case they are needed. Efforts taken today to reduce the time it will take to implement future measures could reduce the dis-ruptions to operations and revenue that could occur if the threat changes and customers are afraid to patronize shopping centers.
Ultimately, decisions about when to implement security options will be driven by assessments of the absolute risk of terrorism. Our analysis does not include any assump-tions about the recurrence intervals of different attack scenarios or the likelihood of a terror-ist attack compared with other security threats. Thus, though the analysis provides guidance about the relative priority of security options and how effective they are at reducing terrorism risk, it does not specify the absolute threat conditions necessary to warrant implementing any security options. In other words, the model indicates what to do once the initial decision has been made to implement terrorism security options, but it does not indicate how or when to make that initial decision.
Limiting terrorism security to temporary efforts such as is done currently may be entirely appropriate under the current conditions of generally low terrorism risk. Decisions to ramp up terrorism security would ideally be based on an understanding of the absolute terrorism risk, expressed in expected annual losses. Such estimates, however, are even more difficult to make and uncertain than the relative scenario likelihoods derived in this study. Some attempts to estimate absolute terrorism risk have been put forth in insurance industry models, but these attempts are restricted to catastrophic events (greater than 100 fatalities or $1 billion in losses).
In lieu of any reliable information about the absolute risk of terrorist attacks, decisions about when to implement security options are likely to be informed indirect indicators, such as government actions and guidance, political changes, media reporting, or industry trends.


63
APPENDIX A
Summary of Terrorist Attacks at Shopping Centers
Table A.1Summary of Terrorist Attacks at Shopping Centers
Date Country City Weapon Suicide Description
12/6/98 Turkey Semdinli Explosives No An explosive device detonated in a small shopping mall in Semdinli, in Hakkali Province, causing damage to some of the shops in the mall. The blast occurred in the middle of the night and so no injuries were caused.
2/9/99 Indonesia Jakarta Explosives No A bomb exploded near the Ramayana Department Store inside the Kelapa Gading Shopping Mall in north Jakarta. No significant damage was reported.
3/10/99 Turkey Istanbul Explosives No A group calling itself the “National Kurdish Revenge Teams” (Milliyetci Kurt Intikam Timleri) claimed responsibility for a bomb blast that killed a taxi driver and wounded eight others. The blast took place outside a shopping mall in the Bakirkoy neighborhood of Istanbul. A man was seen running from the scene shortly before the explosion.
3/10/99 Turkey Istanbul Explosives No A TNT bar was placed under a car at a shopping mall in the Atakoy neighborhood of Istanbul, where it exploded. Even though the explosion took place during the busiest hour at the shopping mall, there were no injuries. Extensive damage was caused to cars parked nearby. A group calling itself the “Nationalist Kurdish Revenge Teams” (Milliyetci Kurt Intikam Timi) claimed responsibility for this blast and another at a shopping center in the Bakirkoy neighborhood. The group stated that “NoTurk will sleep comfortably from now on” in their claim.

64 Reducing Terrorism Risk at Shopping Centers: An Analysis of Potential Security Options
Table A.1—Continued
Date Country City Weapon Suicide Description
3/13/99 Turkey Istanbul Fire or fire bomb
No Thirteen people were killed and at least six others injured when an explosive device ripped through a shopping center in the Goztepe neighborhood of Istanbul. The blast was caused when Molotov cocktails were hurled at the center. Authorities blamed the Kurdistan Workers’ Party for the attack but the group denied all responsibility. On March 15, 1999, police captured a student from Marmara University whom they suspect was involved in this attack.
8/30/99 Russia Moscow Explosives No A powerful explosion occurred in the underground shopping mall in Manezhnaya Square in Moscow. The bomb was activated by a timer and was placed in the Dinamit amusement arcade. It was likely a homemade device with an explosive power of 200–300g of TNT. Around 40 people were injured in the attack.Police found a leaflet that was written by the Union of Revolutionary Writer that stated, “. . . ladies and gentlemen, we do not like your way of life.” The leader of the group is named Dmitriy Pimenov and is vocal about his anticop and anti-Semitic views. There was suspicion that the group may have been involved in the blast.However, in early September, the Dagestan Liberation Group, an extremist organization called the Agence France Presse office in Dagestan and claimed responsibility for the blast. They told reporters that events like this would occur until the Russian army left Dagestan.
12/12/99 France Porto-Vecchio Explosives No On the evening before a meeting between Prime Minister Lionel Jospin and Corsican representatives, a bomb, which failed to ignite, was found at a shopping center in Porto-Vecchio. A man in custody for another incident admitted responsibility for this and two other incidents in Porto-Vecchio that night. Two other men were also arrested in connection with the incidents.
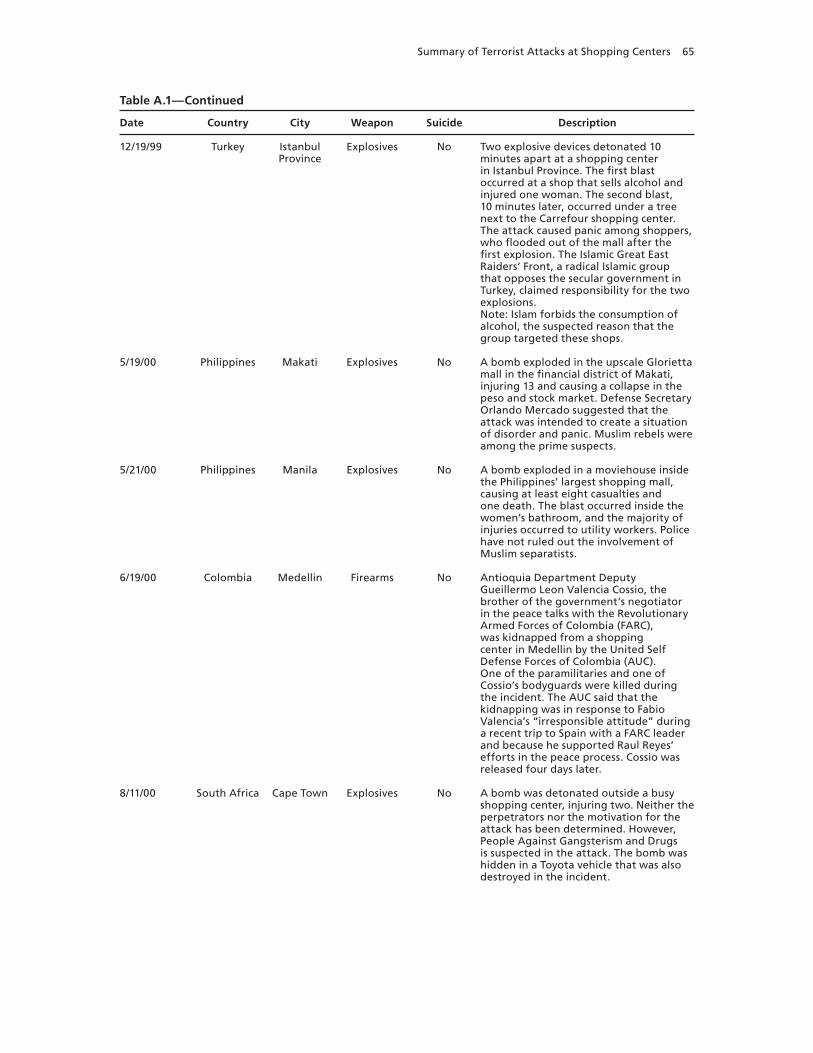
Summary of Terrorist Attacks at Shopping Centers 65
Table A.1—Continued
Date Country City Weapon Suicide Description
12/19/99 Turkey Istanbul Province
Explosives No Two explosive devices detonated 10minutes apart at a shopping center in Istanbul Province. The first blast occurred at a shop that sells alcohol and injured one woman. The second blast, 10 minutes later, occurred under a tree next to the Carrefour shopping center. The attack caused panic among shoppers, who flooded out of the mall after the first explosion. The Islamic Great East Raiders’ Front, a radical Islamic group that opposes the secular government in Turkey, claimed responsibility for the two explosions.Note: Islam forbids the consumption of alcohol, the suspected reason that the group targeted these shops.
5/19/00 Philippines Makati Explosives No A bomb exploded in the upscale Glorietta mall in the financial district of Makati, injuring 13 and causing a collapse in the peso and stock market. Defense Secretary Orlando Mercado suggested that the attack was intended to create a situation of disorder and panic. Muslim rebels were among the prime suspects.
5/21/00 Philippines Manila Explosives No A bomb exploded in a moviehouse inside the Philippines’ largest shopping mall, causing at least eight casualties and one death. The blast occurred inside the women’s bathroom, and the majority of injuries occurred to utility workers. Police have not ruled out the involvement of Muslim separatists.
6/19/00 Colombia Medellin Firearms No Antioquia Department Deputy Gueillermo Leon Valencia Cossio, the brother of the government’s negotiator in the peace talks with the Revolutionary Armed Forces of Colombia (FARC), was kidnapped from a shopping center in Medellin by the United Self Defense Forces of Colombia (AUC). One of the paramilitaries and one of Cossio’s bodyguards were killed during the incident. The AUC said that the kidnapping was in response to Fabio Valencia’s “irresponsible attitude” during a recent trip to Spain with a FARC leader and because he supported Raul Reyes’ efforts in the peace process. Cossio was released four days later.
8/11/00 South Africa Cape Town Explosives No A bomb was detonated outside a busy shopping center, injuring two. Neither the perpetrators nor the motivation for the attack has been determined. However, People Against Gangsterism and Drugs is suspected in the attack. The bomb was hidden in a Toyota vehicle that was also destroyed in the incident.

66 Reducing Terrorism Risk at Shopping Centers: An Analysis of Potential Security Options
Table A.1—Continued
Date Country City Weapon Suicide Description
8/17/00 Estonia Riga Explosives No Two explosions rocked the downtown Riga shopping center “Centrs.” The two blasts occurred in the lobby of the supermarket 10 minutes apart. One person died from the injuries and 35were wounded in the attack. Police were investigating, but had not yet arrested any suspects.
1/10/01 Saudi Arabia Riyadh Explosives No A small bomb exploded at a shopping mall in Riyadh, causing damage but no injuries. The explosion at Euromarche—a shopping complex favored by Western expatriates—occurred at the entrance to the mall’s supermarket. The Saudi Interior Minister downplayed the significance of the blast, citing children’s firecrackers.
4/29/01 Philippines Manila Remote-detonated explosive
No Two explosive devices detonated simultaneously in a Manila mall. The bombs exploded on the ground floor and the upper floor of the mall, injuring 37people.Note: Police think that the bombings may be terrorist incidents but that they may also be related to the ongoing rallies in support of ousted Joseph Estrada.
5/18/01 Israel Netanya Explosives Yes Around 11:30 a.m., 21-year-old Mahmoud Ahmed Marmash, from the West Bank town of Tulkarem, blew himself up at the entrance to the Hasharon shopping mall. Marmash was wearing a heavy blue coat over the explosive device when he tried to enter the mall and detonated the bomb shortly after being stopped by a security guard at the mall’s entrance. This explosion caused injuries to at least 50 people and killed seven, including the suicide bomber. At a rally in Gaza later that day, Hamas claimed responsibility for this attack made in retaliation for the killing of five Palestinian police officers by Israeli security forces earlier that week.Note: On May 19, 2001, Hamas distributed the videotape of suicide bomber Mahmoud Ahmed Marmash to news agencies. In that tape, Marmash stated that he would carry out this attack to “. . . avenge the killing of the people of Palestine, its women, elderly and children, to avenge the killing of Iman Hejjo. . . .” (“Bomber Leaves Video,” 2001).
8/1/01 Philippines Muntinlupa City
Explosives No An explosive device injured a painter working in the parking area of a shopping mall in Muntinlupa City. Nofurther information was available for this incident.

Summary of Terrorist Attacks at Shopping Centers 67
Table A.1—Continued
Date Country City Weapon Suicide Description
8/2/01 Indonesia Jakarta Remote-detonated explosive
No An explosive device detonated in front of a mall, injuring six people.
8/4/01 Philippines General Santos City
Remote-detonated explosive
No A small explosive device detonated in the TSP Kimball Plaza shopping mall in General Santos City. The explosion occurred at the baggage counter at the entrance to the mall. No casualties.
9/23/01 Indonesia Jakarta Remote-detonated explosive
No Two bombs exploded in the garage of the Atrium Plaza Mall. Several people were reportedly injured.Note: A blast at this mall on August 6, 2001, injured six.
10/26/01 Colombia Barranquilla Remote-detonated explosive
No Two bombs exploded in Barranquilla. The first bomb exploded near Superalmacenes Olimpica in Soledad municipality, and the second bomb exploded at the La Macarena shopping center in the southern part of the city. There are no further details. Authorities suspect that the National Liberation Army is responsible for the attack.
12/1/01 Israel Jerusalem Explosives Yes Two suicide bombers detonated nail-studded explosives in a downtown Jerusalem mall, killing themselves and 10others and wounding 150 more. The two attacks occurred almost simultaneously 40 meters apart. Hamas claimed the attacks.
1/12/02 Spain Bilbao Car bomb No Two people were injured by a car bomb containing 15–20 kilos of dynamite that exploded across the street from a large shopping center in the center of Bilbao.A warning had been phoned in, but police did not reach the stolen car in time.Note: In a communiqué sent to the Basque daily “Gara” on March 27, 2002,the Basque Fatherland and Freedom (ETA) group claimed responsibility for this attack that was aimed at the BBVA and the Banco de Espana banks.
1/12/02 Spain Car bomb No A car bomb exploded in the busy shopping center of Bilbao. The blast occurred several minutes after police evacuated the area upon receiving a telephone call from someone claiming to be from ETA and giving a 40-minute warning of the attack. The blast occurred close to the regional headquarters of the Bank of Spain and the El Corte Ingles department store, which had been evacuated. The explosion injured at least two people.
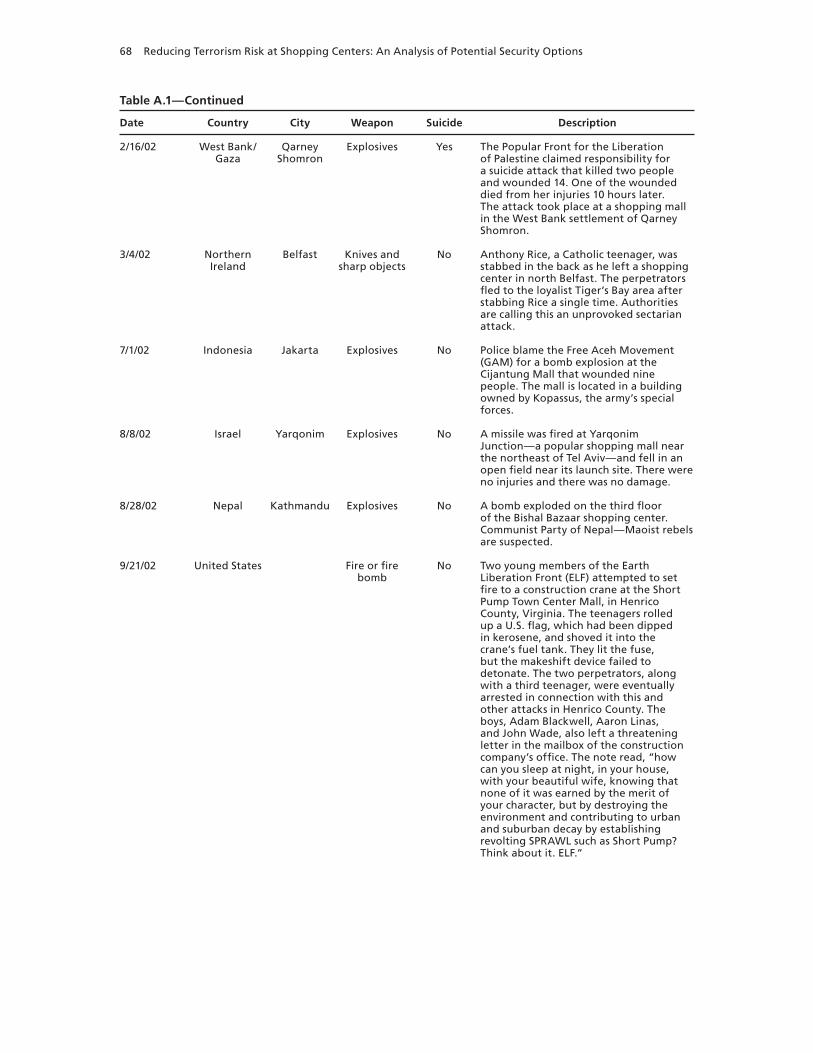
68 Reducing Terrorism Risk at Shopping Centers: An Analysis of Potential Security Options
Table A.1—Continued
Date Country City Weapon Suicide Description
2/16/02 West Bank/Gaza
Qarney Shomron
Explosives Yes The Popular Front for the Liberation of Palestine claimed responsibility for a suicide attack that killed two people and wounded 14. One of the wounded died from her injuries 10 hours later. The attack took place at a shopping mall in the West Bank settlement of Qarney Shomron.
3/4/02 Northern Ireland
Belfast Knives and sharp objects
No Anthony Rice, a Catholic teenager, was stabbed in the back as he left a shopping center in north Belfast. The perpetrators fled to the loyalist Tiger’s Bay area after stabbing Rice a single time. Authorities are calling this an unprovoked sectarian attack.
7/1/02 Indonesia Jakarta Explosives No Police blame the Free Aceh Movement (GAM) for a bomb explosion at the Cijantung Mall that wounded nine people. The mall is located in a building owned by Kopassus, the army’s special forces.
8/8/02 Israel Yarqonim Explosives No A missile was fired at Yarqonim Junction—a popular shopping mall near the northeast of Tel Aviv—and fell in an open field near its launch site. There were no injuries and there was no damage.
8/28/02 Nepal Kathmandu Explosives No A bomb exploded on the third floor of the Bishal Bazaar shopping center. Communist Party of Nepal—Maoist rebels are suspected.
9/21/02 United States Fire or fire bomb
No Two young members of the Earth Liberation Front (ELF) attempted to set fire to a construction crane at the Short Pump Town Center Mall, in Henrico County, Virginia. The teenagers rolled up a U.S. flag, which had been dipped in kerosene, and shoved it into the crane’s fuel tank. They lit the fuse, but the makeshift device failed to detonate. The two perpetrators, along with a third teenager, were eventually arrested in connection with this and other attacks in Henrico County. The boys, Adam Blackwell, Aaron Linas, and John Wade, also left a threatening letter in the mailbox of the construction company’s office. The note read, “how can you sleep at night, in your house, with your beautiful wife, knowing that none of it was earned by the merit of your character, but by destroying the environment and contributing to urban and suburban decay by establishing revolting SPRAWL such as Short Pump? Think about it. ELF.”

Summary of Terrorist Attacks at Shopping Centers 69
Table A.1—Continued
Date Country City Weapon Suicide Description
10/24/02 Indonesia Bandung Explosives No An explosive device blew up at the Bandung supermall, slightly wounding two people. The devices were inside a cleaning cart in the basement of the mall and were apparently intended to frighten rather than kill.
10/27/02 Nepal Thamel Explosives No In a series of three nearly simultaneous explosions close to the royal palace set off by Communist Party of Nepal—Maoist rebels, an explosion damaged a bookshop in a tourist shopping mall in Thamel. Noinjuries were reported.Note: These explosions occurred two days after the rebel leader Pushpa Kamal Dahal (also known as Prachanda) announced that he was willing to hold talks with the government to end the six-year insurgency.
11/4/02 Israel Kfar Sava Explosives Yes Two people were killed and 69 wounded when a suicide bomber blew himself up at the entrance to Kfar Sava’s open-air Arim shopping mall. One of the dead was a security guard who is believed to have prevented the bomber from entering a Shekem electronic store, where a detonation would have caused higher numbers of casualties. Palestinian Islamic Jihad claimed responsibility for the attack, as did an unknown group calling itself the Jerusalem Group (or Battalions) and believed to be composed of both Palestinian Islamic Jihad and al-Fatah activists.
12/5/02 Indonesia Makassar Explosives No In the first of two bombings in the south Sulawesi capital of Makassar on this day, a bomb explosion ripped through a McDonald’s restaurant in the Ratu Indah shopping mall. Three people, including the bomber, were killed and two were injured in this explosion. Agence France Presse reported on April 11, 2003,that Agung Hamid was believed to be the main suspect in this bombing and the car showroom explosion. Agence France Presse reported on July 21 that an Indonesian accused of helping to bomb the McDonald’s testified that he had received weapon training in the Philippines. Four others accused in this case have admitted being members of the Laskar Jundullah Islamic militia. On December 22, 2003, an Indonesian court sentenced Galazi bin Abdul Somad to 18years in prison for his role in this attack. Prosecutors say that he was guilty of transporting the bomb before passing it on to the actual bombers.

70 Reducing Terrorism Risk at Shopping Centers: An Analysis of Potential Security Options
Table A.1—Continued
Date Country City Weapon Suicide Description
1/5/03 Israel Tel Aviv Explosives Yes A pair of suicide bombers blew themselves up 500 feet and 30 seconds apart—the first in front of a bus stop, the second next to a currency exchange kiosk in a pedestrian mall—in a Tel Aviv neighborhood home to many foreign workers and a local transportation hub. Over 100 people were injured (approximately 108) and 23 were killed, including two people from China, two from Romania, one from Ghana, and one from Bulgaria. Nails, ball bearings, and metal pieces had been planted in the bombs to sharpen their effect. The attack was the first suicide bombing since November 21, 2002, and the deadliest attack since a March 2002 suicide bombing that took 29 lives (as well as the second deadliest attack of the current intifada, which began in September 2000). Both Palestinian Islamic Jihad’s al-Quds Squads and the al-Fatah–linked al-Aqsa Martyrs Brigades claimed responsibility for the attack; the al-Aqsa Martyrs Brigades rescinded their claim but had identified the bombers. In March 2005, a court indicted Mu’afaq Iruk, an Israeli Arab, to 42 years in prison for this bombing. According to the court, Iruk was responsible for transporting the two suicide bombers to the site.
1/16/03 Colombia Medellin Car Bomb No A car bomb exploded in the parking lot of the El Cid shopping center, killing five people and injuring 32. The target was apparently the Regional Prosecutors Office, located next to the shopping center. The explosives were placed in an abandoned taxi and were likely on a timed device. Although authorities suspect the FARC, they say it may also be the work of local urban militias. This is one of three car bombings in January 2003.
3/5/03 Colombia Cucuta Explosives No An explosive device was left in the Alejandria shopping mall in Cucuta. The attack occurred at about 10:00 a.m. The bomb contained approximately 30 kg of dynamite. A fire resulting from the explosion of a nearby truck’s gas tank caused most of the damage. Authorities are unclear about which nearby guerrilla group conducted the attack, but they suspect the National Liberation Army. Notably, FARC and National Liberation Army had been conducting joint operations during this period.

Summary of Terrorist Attacks at Shopping Centers 71
Table A.1—Continued
Date Country City Weapon Suicide Description
3/22/03 Venezuela Valencia Explosives No A small bomb exploded at the Sambil Shopping Center in Valencia, Venezuela. The bomb was filled with small metal objects that dispersed widely during the explosion.
3/23/03 Venezuela San Cristobal Explosives No An explosive device detonated in San Cristobal, Venezuela. This bomb was one in a series of three containing metal objects that dispersed upon detonation in Venezuela this week. This bomb was placed in an automobile near a shopping mall.
5/19/03 Israel Afula Explosives Yes A suicide bomber blew herself up at the entrance to a shopping center in the northern Israeli town of Afula, killing three people and wounding 48. She had been headed into the Ha’amakim Mall when a guard stopped her for a security check, at which point she detonated her explosives. The bomber—19-year-old Hiba Daraghmeh from the West Bank village of Tubas—was an English literature student and described as a very devout Muslim. She usually wore a veil over her entire face except her eyes, a particularly conservative covering rarely seen even among religious Palestinian women. Both the al-Fatah–linked al-Aqsa Martyrs Brigades and Palestinian Islamic Jihad claimed responsibility for the attack, with the al-Aqsa Martyrs Brigades stating that it was a joint operation. Palestinian Islamic Jihad’s al-Quds Brigades then claimed full and sole responsibility.
6/22/03 Macedonia Skopje Explosives No Two powerful explosive devices detonated in the center of Skopje almost simultaneously. Both bombs were planted in trash bins, one in the vicinity of a shopping center and across from a university, and the second near an office of Macedonian Telecommunications. The exact targets of the bombs are unclear. One person was slightly injured by one of the blasts and material damage was caused in both cases. Authorities believe that the assailants were Kosovars who entered the country through Gosince and may have detonated the devices with a cell phone.
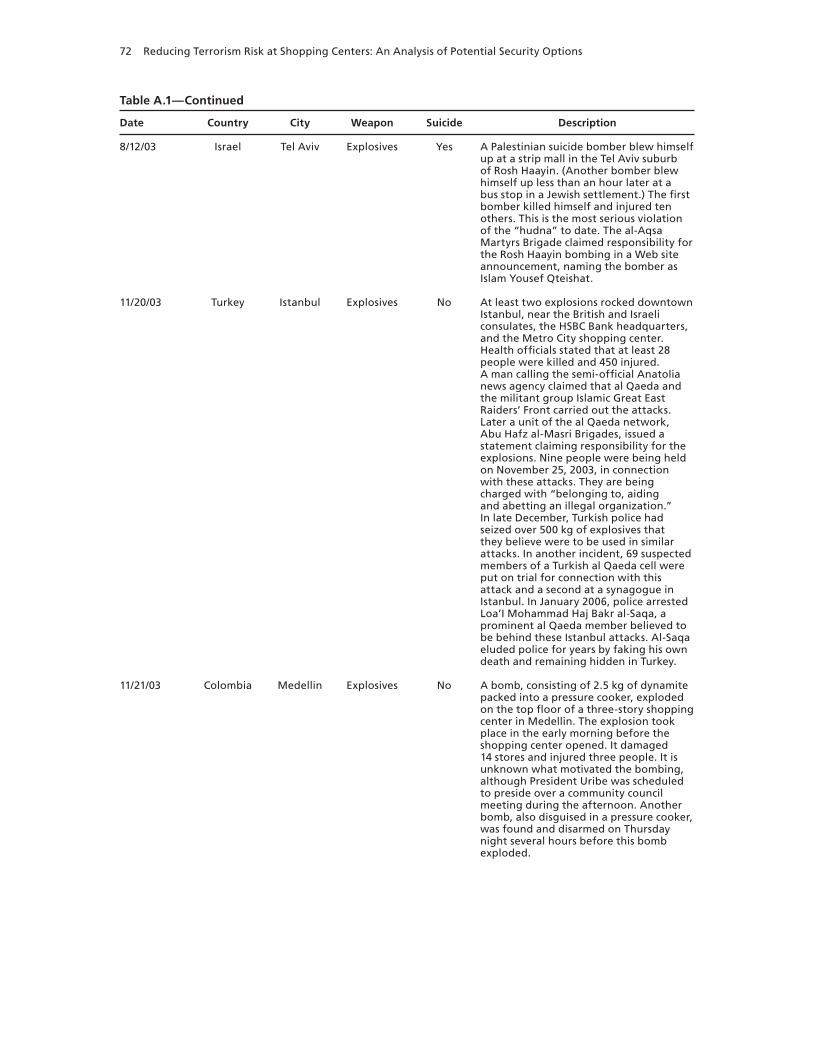
72 Reducing Terrorism Risk at Shopping Centers: An Analysis of Potential Security Options
Table A.1—Continued
Date Country City Weapon Suicide Description
8/12/03 Israel Tel Aviv Explosives Yes A Palestinian suicide bomber blew himself up at a strip mall in the Tel Aviv suburb of Rosh Haayin. (Another bomber blew himself up less than an hour later at a bus stop in a Jewish settlement.) The first bomber killed himself and injured ten others. This is the most serious violation of the “hudna” to date. The al-Aqsa Martyrs Brigade claimed responsibility for the Rosh Haayin bombing in a Web site announcement, naming the bomber as Islam Yousef Qteishat.
11/20/03 Turkey Istanbul Explosives No At least two explosions rocked downtown Istanbul, near the British and Israeli consulates, the HSBC Bank headquarters, and the Metro City shopping center. Health officials stated that at least 28people were killed and 450 injured.A man calling the semi-official Anatolia news agency claimed that al Qaeda and the militant group Islamic Great East Raiders’ Front carried out the attacks. Later a unit of the al Qaeda network, Abu Hafz al-Masri Brigades, issued a statement claiming responsibility for the explosions. Nine people were being held on November 25, 2003, in connection with these attacks. They are being charged with “belonging to, aiding and abetting an illegal organization.” In late December, Turkish police had seized over 500 kg of explosives that they believe were to be used in similar attacks. In another incident, 69 suspected members of a Turkish al Qaeda cell were put on trial for connection with this attack and a second at a synagogue in Istanbul. In January 2006, police arrested Loa’I Mohammad Haj Bakr al-Saqa, a prominent al Qaeda member believed to be behind these Istanbul attacks. Al-Saqa eluded police for years by faking his own death and remaining hidden in Turkey.
11/21/03 Colombia Medellin Explosives No A bomb, consisting of 2.5 kg of dynamite packed into a pressure cooker, exploded on the top floor of a three-story shopping center in Medellin. The explosion took place in the early morning before the shopping center opened. It damaged 14 stores and injured three people. It is unknown what motivated the bombing, although President Uribe was scheduled to preside over a community council meeting during the afternoon. Another bomb, also disguised in a pressure cooker, was found and disarmed on Thursday night several hours before this bomb exploded.
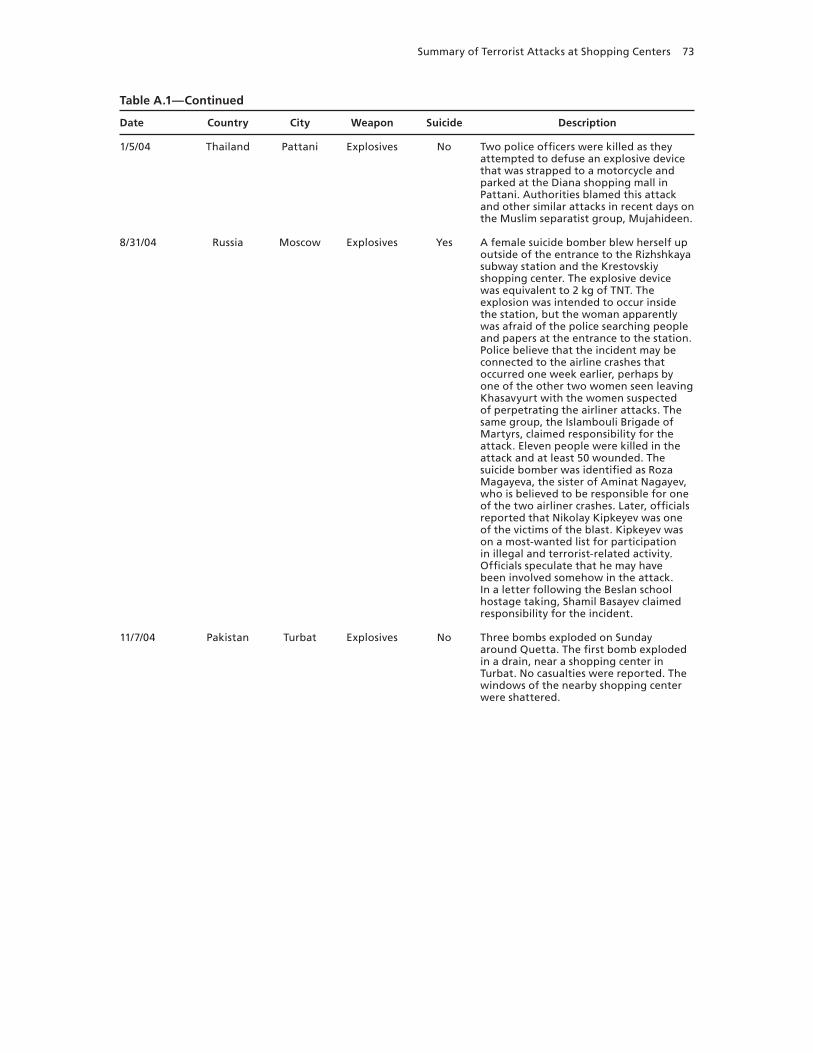
Summary of Terrorist Attacks at Shopping Centers 73
Table A.1—Continued
Date Country City Weapon Suicide Description
1/5/04 Thailand Pattani Explosives No Two police officers were killed as they attempted to defuse an explosive device that was strapped to a motorcycle and parked at the Diana shopping mall in Pattani. Authorities blamed this attack and other similar attacks in recent days on the Muslim separatist group, Mujahideen.
8/31/04 Russia Moscow Explosives Yes A female suicide bomber blew herself up outside of the entrance to the Rizhshkaya subway station and the Krestovskiy shopping center. The explosive device was equivalent to 2 kg of TNT. The explosion was intended to occur inside the station, but the woman apparently was afraid of the police searching people and papers at the entrance to the station. Police believe that the incident may be connected to the airline crashes that occurred one week earlier, perhaps by one of the other two women seen leaving Khasavyurt with the women suspected of perpetrating the airliner attacks. The same group, the Islambouli Brigade of Martyrs, claimed responsibility for the attack. Eleven people were killed in the attack and at least 50 wounded. The suicide bomber was identified as Roza Magayeva, the sister of Aminat Nagayev, who is believed to be responsible for one of the two airliner crashes. Later, officials reported that Nikolay Kipkeyev was one of the victims of the blast. Kipkeyev was on a most-wanted list for participation in illegal and terrorist-related activity. Officials speculate that he may have been involved somehow in the attack. In a letter following the Beslan school hostage taking, Shamil Basayev claimed responsibility for the incident.
11/7/04 Pakistan Turbat Explosives No Three bombs exploded on Sunday around Quetta. The first bomb exploded in a drain, near a shopping center in Turbat. No casualties were reported. The windows of the nearby shopping center were shattered.

74 Reducing Terrorism Risk at Shopping Centers: An Analysis of Potential Security Options
Table A.1—Continued
Date Country City Weapon Suicide Description
2/14/05 Philippines General Santos City
Explosives No The Abu Sayyaf Group claimed responsibility for three nearly simultaneous attacks on Manila, General Santos City, and Davao. In General Santos City, the explosion occurred at Gaisano Mall at approximately 6:30 p.m., killing at least three and wounding 33 others. A total of at least 13 were killed and 140injured in the three attacks. In late March 2005, Philippine authorities arrested a man they would identify only as “Rohmat,” a member of Jemaah Islamiyah whom they believe was also involved in these Valentines Day bombings. Authorities believe that Rohmat may have ordered and financed these attacks.
2/14/05 Philippines Makati Explosives No The Abu Sayyaf Group claimed responsibility for three nearly simultaneous attacks on Manila, General Santos City, and Davao. In Makaki City, the business district of Manila, an explosion at approximately 7:50 p.m. on a bus at a commuter terminal near a crowded mall killed six and injured at least 74. The dead were identified as Jose Marie Balboa, Bernardo de la Cruz Rizarito, and an unidentified female. At least 13 were killed and 140 injured in the three attacks. The Abu Sayyaf Group claimed they carried out the bombings in retaliation for alleged abuses of the military during missions against Muslim rebels. One week after the attacks, two suspects were arrested in Mandaluyong in connection with this attack. Gamal Baharan and Abu Khalil Trinidad are both believed to be members of the Abu Sayyaf Group. Trinidad is being accused of being “the guy who devised the bomb.” Both Baharan and Trinidad reportedly made confessions to news reporters. In late March 2005, Philippines authorities arrested a man they would only identify as ‘Rohmat,’ a member of Jemaah Islamiyah whom they believe was also involved in these Valentine’s Day bombings. Authorities believe Rohmat may have ordered and financed these attacks.

Summary of Terrorist Attacks at Shopping Centers 75
Table A.1—Continued
Date Country City Weapon Suicide Description
3/23/05 Lebanon Kaslik Explosives No A bomb exploded in a shopping mall in Kaslik, north of Beirut, an area made up mostly of anti-Syrian Christians. The blast at the Alta Vista Center was caused by a 45-lb bomb left at the back entrance to the mall and destroyed most of the building. The attack killed three people, all workers, including a Sri Lankan and two Indians. Five other people were wounded in the attack, including a police officer wounded while inspecting the building. This was the second bombing of a Christian-inhabited area in five days and came amid instability in the country following the assassination of former Prime Minister Rafik Hariri and the partial withdrawal of Syrian troops.
3/28/05 Northern Ireland
Belfast Fire or fire bomb
No An incendiary device was found and made safe at a Belfast shopping complex. The device caused a major traffic backup, and the shopping center had to be evacuated for hours. Authorities blamed this attempted attack and two others in the area on dissident republicans.
3/28/05 Northern Ireland
Newtownsard Fire or fire bomb
No An explosive device was found burned out at the Ards shopping center in Newtownsard. This was one of three such devices found in the area, which authorities are blaming on dissident republicans.
4/1/05 Lebanon Beirut Explosives No A bomb exploded in the Christian resort village of Broummana at the Rick Plaza shopping center. The bomb consisted of a suitcase that was filled with TNT(20–25 kg) and placed at the entrance to the underground car garage of the center, shattering windows and destroying several nearby cars. The blast wounded nine people (including one Kuwaiti citizen). This was the fourth bombing in a Christian area of Beirut in two weeks. The attack came as Lebanon tried to prepare for May elections and occurred after an announcement that Prime Minister Omar Karami would not step down as he had previously promised, but would stay and try to form a new government to oversee elections. Instability in Lebanon had been high since the assassination of former Prime Minister Hariri less than two months earlier.
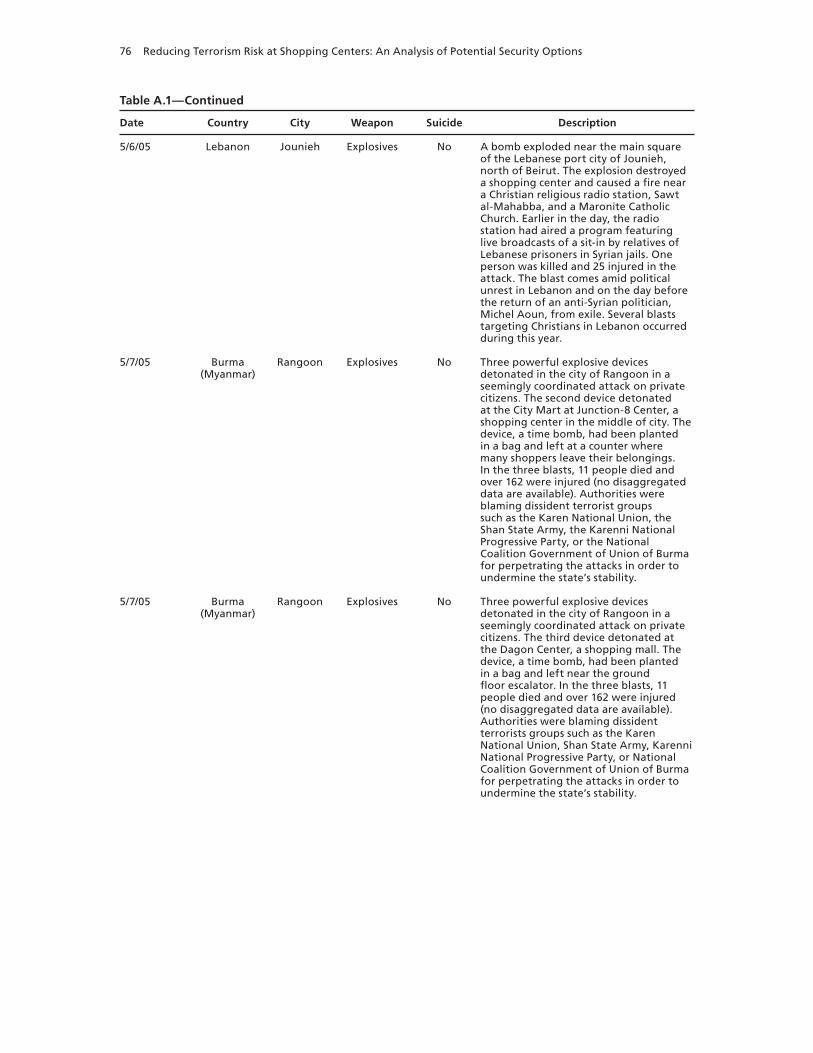
76 Reducing Terrorism Risk at Shopping Centers: An Analysis of Potential Security Options
Table A.1—Continued
Date Country City Weapon Suicide Description
5/6/05 Lebanon Jounieh Explosives No A bomb exploded near the main square of the Lebanese port city of Jounieh, north of Beirut. The explosion destroyed a shopping center and caused a fire near a Christian religious radio station, Sawt al-Mahabba, and a Maronite Catholic Church. Earlier in the day, the radio station had aired a program featuring live broadcasts of a sit-in by relatives of Lebanese prisoners in Syrian jails. One person was killed and 25 injured in the attack. The blast comes amid political unrest in Lebanon and on the day before the return of an anti-Syrian politician, Michel Aoun, from exile. Several blasts targeting Christians in Lebanon occurred during this year.
5/7/05 Burma (Myanmar)
Rangoon Explosives No Three powerful explosive devices detonated in the city of Rangoon in a seemingly coordinated attack on private citizens. The second device detonated at the City Mart at Junction-8 Center, a shopping center in the middle of city. The device, a time bomb, had been planted in a bag and left at a counter where many shoppers leave their belongings. In the three blasts, 11 people died and over 162 were injured (no disaggregated data are available). Authorities were blaming dissident terrorist groups such as the Karen National Union, the Shan State Army, the Karenni National Progressive Party, or the National Coalition Government of Union of Burma for perpetrating the attacks in order to undermine the state’s stability.
5/7/05 Burma (Myanmar)
Rangoon Explosives No Three powerful explosive devices detonated in the city of Rangoon in a seemingly coordinated attack on private citizens. The third device detonated at the Dagon Center, a shopping mall. The device, a time bomb, had been planted in a bag and left near the ground floor escalator. In the three blasts, 11people died and over 162 were injured (no disaggregated data are available). Authorities were blaming dissident terrorists groups such as the Karen National Union, Shan State Army, Karenni National Progressive Party, or National Coalition Government of Union of Burma for perpetrating the attacks in order to undermine the state’s stability.
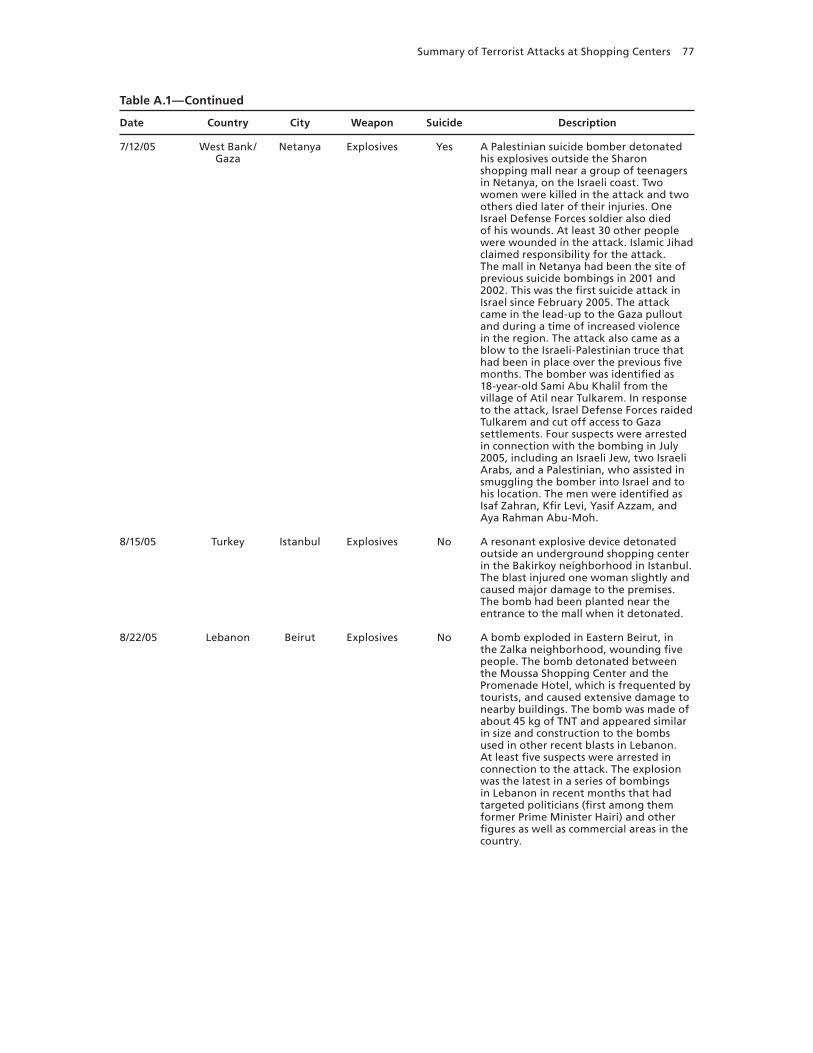
Summary of Terrorist Attacks at Shopping Centers 77
Table A.1—Continued
Date Country City Weapon Suicide Description
7/12/05 West Bank/Gaza
Netanya Explosives Yes A Palestinian suicide bomber detonated his explosives outside the Sharon shopping mall near a group of teenagers in Netanya, on the Israeli coast. Two women were killed in the attack and two others died later of their injuries. One Israel Defense Forces soldier also died of his wounds. At least 30 other people were wounded in the attack. Islamic Jihad claimed responsibility for the attack. The mall in Netanya had been the site of previous suicide bombings in 2001 and 2002. This was the first suicide attack in Israel since February 2005. The attack came in the lead-up to the Gaza pullout and during a time of increased violence in the region. The attack also came as a blow to the Israeli-Palestinian truce that had been in place over the previous five months. The bomber was identified as 18-year-old Sami Abu Khalil from the village of Atil near Tulkarem. In response to the attack, Israel Defense Forces raided Tulkarem and cut off access to Gaza settlements. Four suspects were arrested in connection with the bombing in July 2005, including an Israeli Jew, two Israeli Arabs, and a Palestinian, who assisted in smuggling the bomber into Israel and to his location. The men were identified as Isaf Zahran, Kfir Levi, Yasif Azzam, and Aya Rahman Abu-Moh.
8/15/05 Turkey Istanbul Explosives No A resonant explosive device detonated outside an underground shopping center in the Bakirkoy neighborhood in Istanbul. The blast injured one woman slightly and caused major damage to the premises. The bomb had been planted near the entrance to the mall when it detonated.
8/22/05 Lebanon Beirut Explosives No A bomb exploded in Eastern Beirut, in the Zalka neighborhood, wounding five people. The bomb detonated between the Moussa Shopping Center and the Promenade Hotel, which is frequented by tourists, and caused extensive damage to nearby buildings. The bomb was made of about 45 kg of TNT and appeared similar in size and construction to the bombs used in other recent blasts in Lebanon. At least five suspects were arrested in connection to the attack. The explosion was the latest in a series of bombings in Lebanon in recent months that had targeted politicians (first among them former Prime Minister Hairi) and other figures as well as commercial areas in the country.
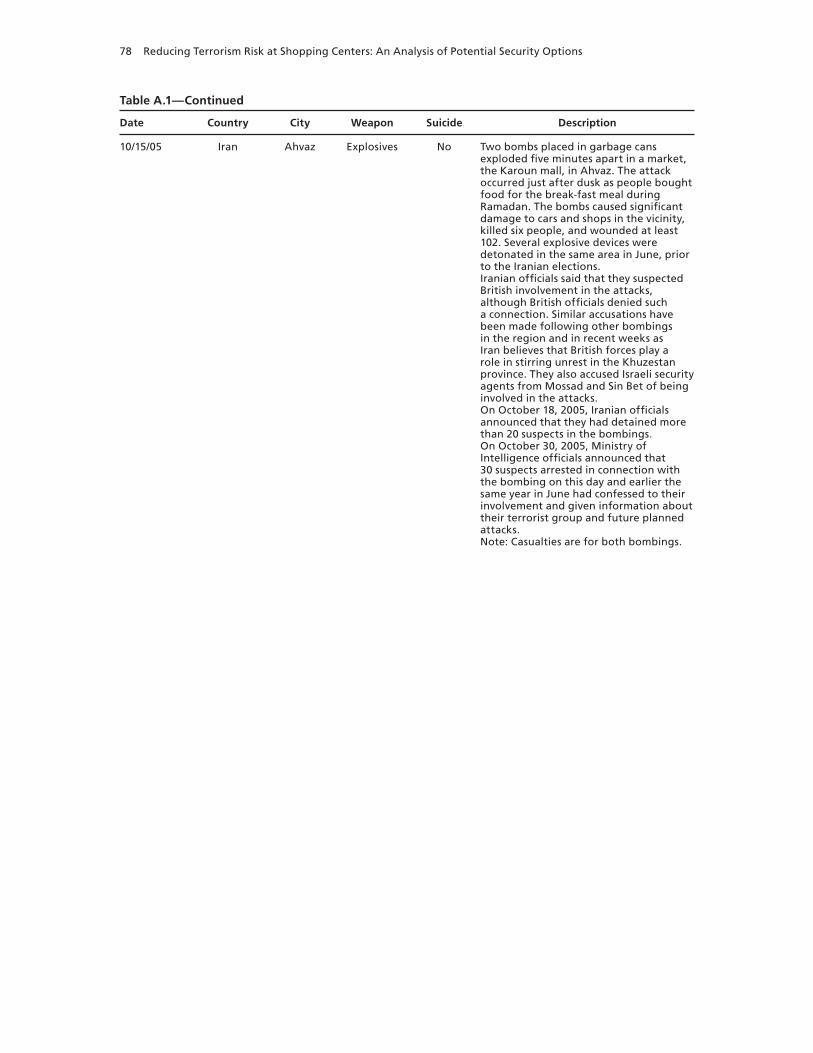
78 Reducing Terrorism Risk at Shopping Centers: An Analysis of Potential Security Options
Table A.1—Continued
Date Country City Weapon Suicide Description
10/15/05 Iran Ahvaz Explosives No Two bombs placed in garbage cans exploded five minutes apart in a market, the Karoun mall, in Ahvaz. The attack occurred just after dusk as people bought food for the break-fast meal during Ramadan. The bombs caused significant damage to cars and shops in the vicinity, killed six people, and wounded at least 102. Several explosive devices were detonated in the same area in June, prior to the Iranian elections.Iranian officials said that they suspected British involvement in the attacks, although British officials denied such a connection. Similar accusations have been made following other bombings in the region and in recent weeks as Iran believes that British forces play a role in stirring unrest in the Khuzestan province. They also accused Israeli security agents from Mossad and Sin Bet of being involved in the attacks.On October 18, 2005, Iranian officials announced that they had detained more than 20 suspects in the bombings.On October 30, 2005, Ministry of Intelligence officials announced that 30 suspects arrested in connection with the bombing on this day and earlier the same year in June had confessed to their involvement and given information about their terrorist group and future planned attacks.Note: Casualties are for both bombings.

Summary of Terrorist Attacks at Shopping Centers 79
Table A.1—Continued
Date Country City Weapon Suicide Description
10/15/05 Iran Ahvaz Explosives No Two bombs placed in garbage cans exploded five minutes apart in a market, the Karoun mall, in Ahvaz. The attack occurred just after dusk as people bought food for the break-fast meal during Ramadan. The bombs caused significant damage to cars and shops in the vicinity, killed six people and wounded at least 102. Several explosive devices were detonated in the same area in June, prior to the Iranian elections.Iranian officials said that they suspected British involvement in the attacks, although British officials denied such a connection. Similar accusations have been made following other bombings in the region and in recent weeks as Iran believes British forces play a role in stirring unrest in the Khuzestan province. They also accused Israeli security agents from Mossad and Sin Bet of being involved in the attacks.On October 18, 2005, Iranian officials announced that they had detained more than 20 suspects in the bombings.On October 30, 2005, Ministry of Intelligence officials announced that 30 suspects arrested in connection with the bombing on this day and earlier the same year in June had confessed to their involvement and given information about their terrorist group and future attacks.Note: Casualties are for both bombings.
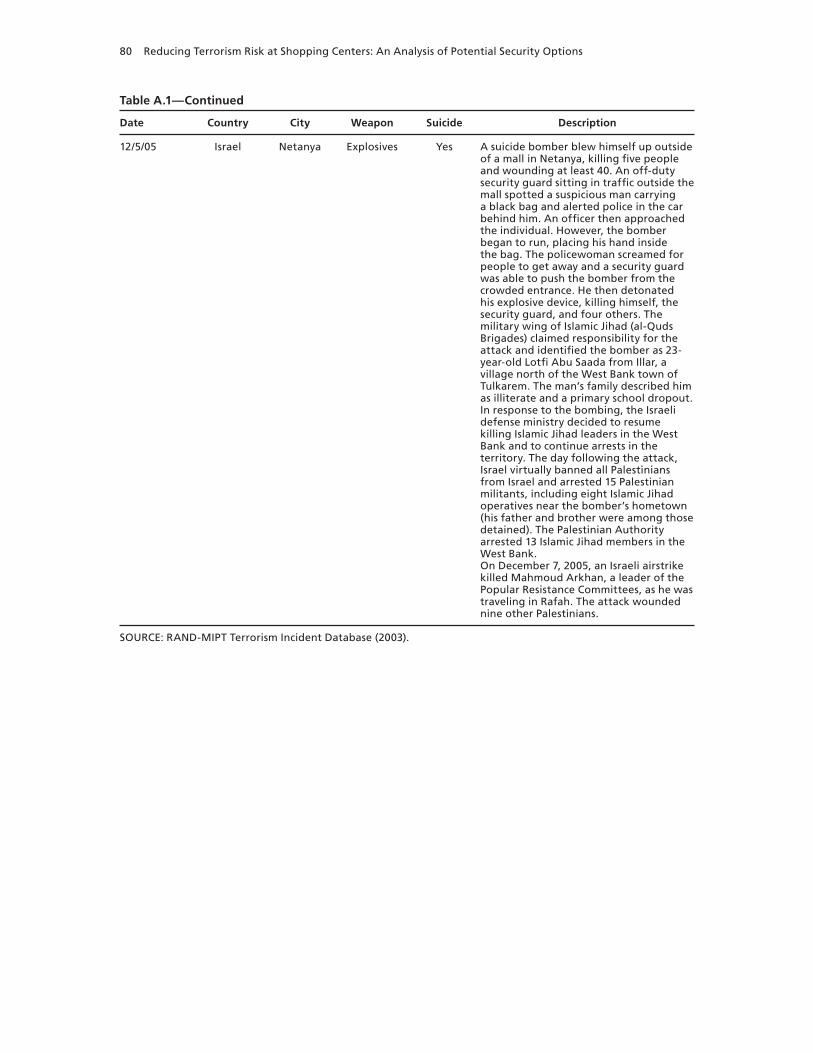
80 Reducing Terrorism Risk at Shopping Centers: An Analysis of Potential Security Options
Table A.1—Continued
Date Country City Weapon Suicide Description
12/5/05 Israel Netanya Explosives Yes A suicide bomber blew himself up outside of a mall in Netanya, killing five people and wounding at least 40. An off-duty security guard sitting in traffic outside the mall spotted a suspicious man carrying a black bag and alerted police in the car behind him. An officer then approached the individual. However, the bomber began to run, placing his hand inside the bag. The policewoman screamed for people to get away and a security guard was able to push the bomber from the crowded entrance. He then detonated his explosive device, killing himself, the security guard, and four others. The military wing of Islamic Jihad (al-Quds Brigades) claimed responsibility for the attack and identified the bomber as 23-year-old Lotfi Abu Saada from Illar, a village north of the West Bank town of Tulkarem. The man’s family described him as illiterate and a primary school dropout.In response to the bombing, the Israeli defense ministry decided to resume killing Islamic Jihad leaders in the West Bank and to continue arrests in the territory. The day following the attack, Israel virtually banned all Palestinians from Israel and arrested 15 Palestinian militants, including eight Islamic Jihad operatives near the bomber’s hometown (his father and brother were among those detained). The Palestinian Authority arrested 13 Islamic Jihad members in the West Bank.On December 7, 2005, an Israeli airstrike killed Mahmoud Arkhan, a leader of the Popular Resistance Committees, as he was traveling in Rafah. The attack wounded nine other Palestinians.
SOURCE: RAND-MIPT Terrorism Incident Database (2003).
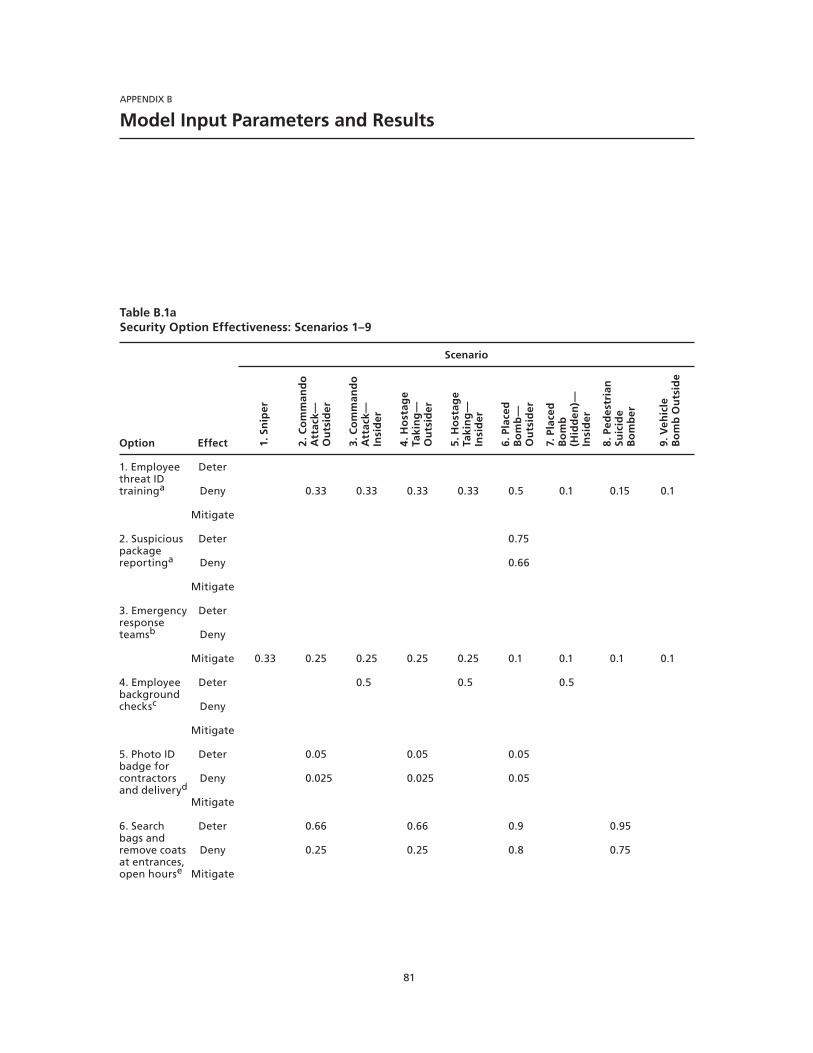
81
APPENDIX B
Model Input Parameters and Results
Table B.1aSecurity Option Effectiveness: Scenarios 1–9
Option Effect
Scenario
1. S
nip
er
2. C
om
man
do
A
ttac
k—O
uts
ider
3. C
om
man
do
A
ttac
k—In
sid
er
4. H
ost
age
Taki
ng
—O
uts
ider
5. H
ost
age
Taki
ng
—In
sid
er
6. P
lace
d
Bo
mb
—O
uts
ider
7. P
lace
d
Bo
mb
(H
idd
en)—
Insi
der
8. P
edes
tria
n
Suic
ide
Bo
mb
er
9. V
ehic
le
Bo
mb
Ou
tsid
e
1. Employee threat ID traininga
Deter
Deny 0.33 0.33 0.33 0.33 0.5 0.1 0.15 0.1
Mitigate
2. Suspicious package reportinga
Deter 0.75
Deny 0.66
Mitigate
3. Emergency response teamsb
Deter
Deny
Mitigate 0.33 0.25 0.25 0.25 0.25 0.1 0.1 0.1 0.1
4. Employee background checksc
Deter 0.5 0.5 0.5
Deny
Mitigate
5. Photo ID badge for contractors and deliveryd
Deter 0.05 0.05 0.05
Deny 0.025 0.025 0.05
Mitigate
6. Search bags and remove coats at entrances, open hourse
Deter 0.66 0.66 0.9 0.95
Deny 0.25 0.25 0.8 0.75
Mitigate

82 Reducing Terrorism Risk at Shopping Centers: An Analysis of Potential Security Options
Table B.1a—Continued
Option Effect
Scenario
1. S
nip
er
2. C
om
man
do
A
ttac
k—O
uts
ider
3. C
om
man
do
A
ttac
k—In
sid
er
4. H
ost
age
Taki
ng
—O
uts
ider
5. H
ost
age
Taki
ng
—In
sid
er
6. P
lace
d
Bo
mb
—O
uts
ider
7. P
lace
d
Bo
mb
(H
idd
en)—
Insi
der
8. P
edes
tria
n
Suic
ide
Bo
mb
er
9. V
ehic
le
Bo
mb
O
uts
ide
7. Mandatory coat and bag check, open hourse
Deter 0.66 0.66 0.9 0.95
Deny 0.25 0.25 0.8 0.75
Mitigate
8. Metal detectors and search bags at entrances, open hourse
Deter 0.66 0.66 0.9 0.95
Deny 0.25 0.25 0.8 0.75
Mitigate
9. Millimeter wave cameras at entrances, open hoursf
Deter 0.66 0.66 0.33 0.95
Deny 0.25 0.25 0.75
Mitigate
10. Trace detector portals at entrances, open hoursg
Deter 0.5 0.5 0.95 0.95
Deny 0.95 0.75
Mitigate
11. Dogs at entrances, open hoursg
Deter 0.5 0.5 1.0 0.95
Deny 1.0 0.75
Mitigate
12. Security guard at entrances, open hoursh
Deter 0.25 0.1 0.25 0.1 0.25 0.33
Deny 0.1
Mitigate 0.25 0.1 0.1 0.1 0.1 0.1 0.1 0.1 0.1
13. Search bags and remove costs at entrances, closedi
Deter 0.765 0.765 0.9
Deny 0.765 0.765 0.9
Mitigate
14.Mandatory coat and bag check, closed hoursi
Deter 0.765 0.765 0.9
Deny 0.765 0.765 0.9
Mitigate
15. Metal detectors and search bags at entrances, closedi
Deter 0.9 0.9 0.9
Deny 0.9 0.9 0.9
Mitigate

Model Input Parameters and Results 83
Table B.1a—Continued
Option Effect
Scenario
1. S
nip
er
2. C
om
man
do
A
ttac
k—O
uts
ider
3. C
om
man
do
A
ttac
k—In
sid
er
4. H
ost
age
Taki
ng
—O
uts
ider
5. H
ost
age
Taki
ng
—In
sid
er
6. P
lace
d
Bo
mb
—O
uts
ider
7. P
lace
d
Bo
mb
(H
idd
en)—
Insi
der
8. P
edes
tria
n
Suic
ide
Bo
mb
er
9. V
ehic
le
Bo
mb
Ou
tsid
e
16. Millimeter wave cameras at entrances, closed hoursi
Deter 0.855 0.855 0.3
Deny 0.855 0.855
Mitigate
17. Trace detector portals at entrances, closed hoursi
Deter 0.45 0.45 0.855
Deny 0.855
Mitigate
18. Dogs at entrances, closed hoursi
Deter 0.45 0.45 0.9
Deny 0.9
Mitigate
19. Security guard at entrances, closed hoursi
Deter 0.225 0.225 0.225
Deny
Mitigate
20. Control access to service areasj
Deter 0.5 0.25
Deny 0.5
Mitigate
21. Search carts/kiosks dailyk
Deter 0.15 0.15 0.33
Deny 0.15 0.15 0.33
Mitigate
22. Security with 100 percent visual coverage of common areal
Deter 0.25 0.25 0.25 0.25 0.5 0.33
Deny 0.33
Mitigate 0.25 0.1
23. Armed security with 100 percent visual coverage of common aream
Deter 0.75 0.75 0.75 0.75 0.5 0.33
Deny 0.33
Mitigate 0.25 0.66 0.66 0.66 0.66 0.1

84 Reducing Terrorism Risk at Shopping Centers: An Analysis of Potential Security Options
Table B.1a—Continued
Option Effect
Scenario
1. S
nip
er
2. C
om
man
do
A
ttac
k—O
uts
ider
3. C
om
man
do
A
ttac
k—In
sid
er
4. H
ost
age
Taki
ng
—O
uts
ider
5. H
ost
age
Taki
ng
—In
sid
er
6. P
lace
d
Bo
mb
—O
uts
ider
7. P
lace
d
Bo
mb
(H
idd
en)—
Insi
der
8. P
edes
tria
n
Suic
ide
Bo
mb
er
9. V
ehic
le
Bo
mb
Ou
tsid
e
24. Police substation in centern
Deter 0.25 0.25 0.25 0.25
Deny
Mitigate 0.25 0.25 0.25 0.25
25. More clearly label exitso
Deter
Deny
Mitigate 0.1 0.1 0.1 0.1
26. Vehicle inspection at parking, open hoursp
Deter
Deny
Mitigate
27. Vehicle inspection and hydraulic bollards at parking, open hoursq
Deter
Deny
Mitigate
28. Loading dock access controlr
Deter
Deny
Mitigate
29. Loading dock access control and hydraulic bollardss
Deter
Deny
Mitigate
30. Increase building standoff distance with bollard fencet
Deter 0.95
Deny 0.95
Mitigate
31. Bollards at pedestrian entrancesu
Deter
Deny
Mitigate
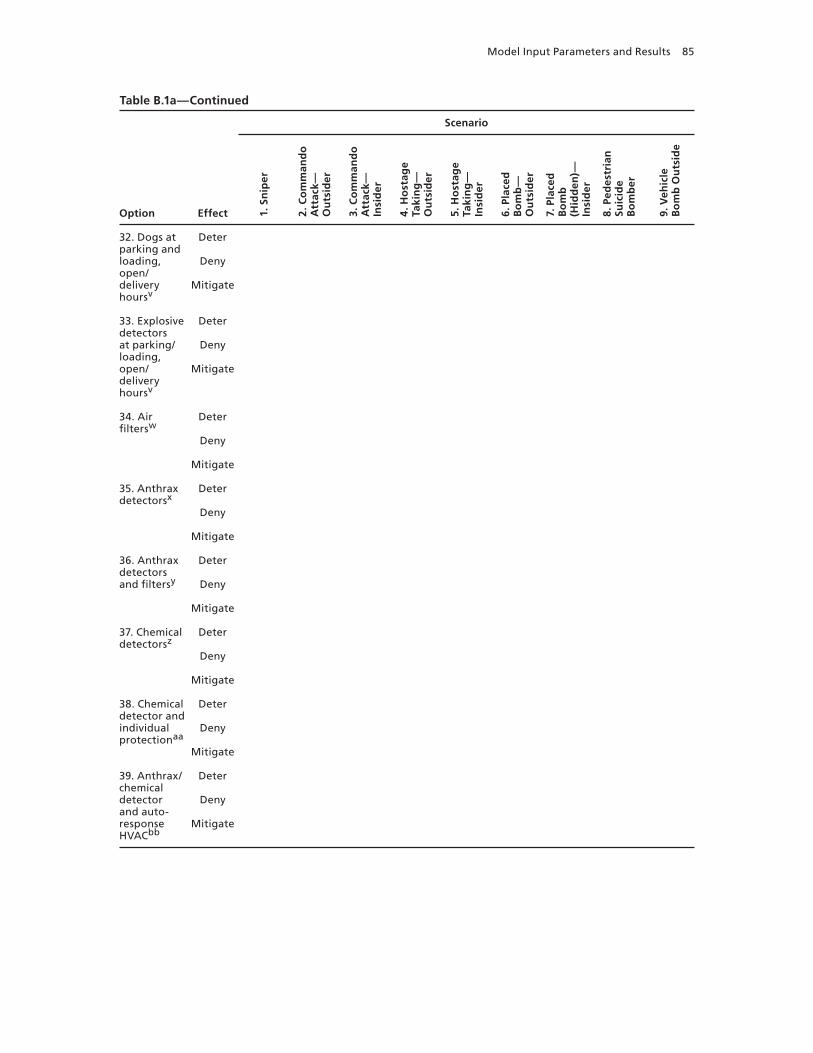
Model Input Parameters and Results 85
Table B.1a—Continued
Option Effect
Scenario
1. S
nip
er
2. C
om
man
do
A
ttac
k—O
uts
ider
3. C
om
man
do
A
ttac
k—In
sid
er
4. H
ost
age
Taki
ng
—O
uts
ider
5. H
ost
age
Taki
ng
—In
sid
er
6. P
lace
d
Bo
mb
—O
uts
ider
7. P
lace
d
Bo
mb
(H
idd
en)—
Insi
der
8. P
edes
tria
n
Suic
ide
Bo
mb
er
9. V
ehic
le
Bo
mb
Ou
tsid
e
32. Dogs at parking and loading, open/delivery hoursv
Deter
Deny
Mitigate
33. Explosive detectors at parking/loading, open/delivery hoursv
Deter
Deny
Mitigate
34. Air filtersw
Deter
Deny
Mitigate
35. Anthrax detectorsx
Deter
Deny
Mitigate
36. Anthrax detectors and filtersy
Deter
Deny
Mitigate
37. Chemical detectorsz
Deter
Deny
Mitigate
38. Chemical detector and individual protectionaa
Deter
Deny
Mitigate
39. Anthrax/chemical detector and auto-response HVACbb
Deter
Deny
Mitigate
86 Reducing Terrorism Risk at Shopping Centers: An Analysis of Potential Security Options
Table B.1a—Continued
NOTE: Deterrence estimates are based on the premise that alternate targets with no terrorism security are available and that terrorists will choose an alternate target when faced with convincing security measures. In cases in which detection is insufficient to deter or deny an attack (e.g., suicide attacks, where terrorists can crash checkpoints) not all detected attacks are deterred and even fewer are denied. In these cases, deterrence and denial effectiveness values are discounted to reflect feasibility of successfully completing a detected attack. Conversely, in other cases (e.g., getting placed bombs through some security screening checkpoints), deterrence effectiveness is greater than detection capability because terrorists are unfamiliar with the detection capabilities or because the mere existence of a checkpoint is a partial deterrent.a With proper training, employees may be able to detect and report suspicious persons, packages, and vehicles; the primary limitation is that employees do not patrol center. Suspicious package reporting is similar but targets the public (shoppers) and focuses on suspicious packages only; detection ability is assumed to be extensive and rapid. Both have been very effective in reducing terrorism in transit systems in the United Kingdom (Taylor, 2005;Jenkins and Gerston, 2001).
b Limited impact in bomb attacks based on past casualty patterns (Arnold et al., 2004). Quick reaction can result in slightly higher effectiveness for gunfire attacks.
c Assumed to catch 50 percent of terrorists applying for jobs.
d Assumed 100-percent effective in deterring imposters, but assume imposter is only 5 percent of outsider threat.
e Highly effective at detecting guns, bombs, and anthrax devices.
f Same as e but only for person-carried items, so less effective against placed bomb and anthrax device.
g Very effective for bombs but will not detect guns or anthrax devices.
h Provides limited deterrence and very limited mitigation.
i Same as e–h applied to insider attacks except that detection is decreased by 10 percent to account for possibility that materials are brought in via loading dock rather than customer entrance and that detection is a perfect deterrent because there is no incentive to crash a checkpoint during closed hours.
j Primary effectiveness is denying access to rooftop for sniper scenario.
k Very effective for detecting insider guns, bombs, and chemical or biological devices, but overall effectiveness discounted to account for other possible locations these items could be stored.
l Increased security presence provides some deterrence and minimal mitigation for some scenarios.
m Similar to l but with much greater deterrence and mitigation for gunfire scenarios.
n Minimal deterrence and mitigation for gunfire scenarios.
o Minor mitigation value for gunfire scenarios.
p Effective for detecting car bombs.
q Same as p but no deter or deny discount for suicide attack.
r Effective for detecting imposter deliveries.
s Same as r but no deter or deny discount for suicide attack.
t Very effective at preventing car bombs outside center and crashing into center.
u Very effective at preventing car bombs crashing into center.
v Very effective at detecting vehicle bombs.
Model Input Parameters and Results 87
Table B.1a—Continuedw Appropriate filters remove anthrax in approximately one hour where it would otherwise remain airborne up to 24 hours, thereby reducing the number of victims. Presence of filters would not be publicly known, so option is a strong deterrent to insiders only.
x New technologies allow real-time anthrax detection that will trigger alarm and allow evacuation and rapid administration of antibiotics to reduce number of victims.
y Same deterrence and combined mitigation benefit of filters and detectors.
z Strong deterrence for chemical attack; mitigation is moderate because attack will be apparent quickly from victim reactions, decreasing benefit of detector alarm.
aa Adds moderate deterrence for anthrax attack (less for insiders, who know chemical detector cannot detect anthrax) and minimal mitigation for anthrax attack (in the case that an anthrax attack is recognized in real time); decreases mitigation for chemical attack because taking time to locate and don escape hoods increases exposure.
bb Best chemical-biological option—strong deterrence and mitigation effectiveness.
Table B.1bSecurity Option Effectiveness: Scenarios 10–17
Option Effect
Scenario
10. C
ar B
om
b in
M
all—
Cra
sh in
fr
om
Str
eet
11. C
ar B
om
b in
U
nd
erg
rou
nd
Pa
rkin
g—
Bre
ak In
12. S
uic
ide
Car
Bo
mb
in
Un
der
gro
un
d
Park
ing
—C
rash
En
tran
ce
13. T
ruck
Bo
mb
in
Load
ing
Do
ck—
Bre
ak In
14. S
uic
ide
Tru
ck
Bo
mb
in L
oad
ing
D
ock
—C
rash
En
tran
ce
15. A
nth
rax
Rel
ease
fro
m
Un
atte
nd
ed
Dev
ice
—O
uts
ider
16. A
nth
rax
Rel
ease
fro
m
Un
atte
nd
ed
Dev
ice
—In
sid
er
17. C
hem
ical
R
elea
se f
rom
Car
t/K
iosk
1. Employee threat ID traininga
Deter 0.5
Deny 0.1 0.5 0.5 0.33
Mitigate
2. Suspicious package reportinga
Deter 0.75
Deny 0.66
Mitigate
3. Emergency response teamsb
Deter
Deny
Mitigate 0.1 0.1 0.1 0.1 0.1 0.25
4. Employee background checksc
Deter 0.5 0.5
Deny
Mitigate
5. Photo ID badge for contractors and deliveryd
Deter 0.05
Deny 0.05
Mitigate

88 Reducing Terrorism Risk at Shopping Centers: An Analysis of Potential Security Options
Table B.1b—Continued
Option Effect
Scenario
10. C
ar B
om
b in
M
all—
Cra
sh in
fr
om
Str
eet
11. C
ar B
om
b in
U
nd
erg
rou
nd
Pa
rkin
g—
Bre
ak
In 12. S
uic
ide
Car
Bo
mb
in
Un
der
gro
un
d
Park
ing
—C
rash
En
tran
ce
13. T
ruck
Bo
mb
in
Load
ing
Do
ck—
Bre
ak In
14. S
uic
ide
Tru
ck
Bo
mb
in L
oad
ing
D
ock
—C
rash
En
tran
ce
15. A
nth
rax
Rel
ease
fro
m
Un
atte
nd
ed
Dev
ice
—O
uts
ider
16. A
nth
rax
Rel
ease
fro
m
Un
atte
nd
ed
Dev
ice
—In
sid
er
17. C
hem
ical
R
elea
se f
rom
C
art/
Kio
sk
6. Search bags and remove coats at entrances, open hourse
Deter 0.9
Deny 0.8
Mitigate
7. Mandatory coat and bag check, open hourse
Deter 0.9
Deny 0.8
Mitigate
8. Metal detectors and search bags at entrances, open hourse
Deter 0.9
Deny 0.8
Mitigate
9. Millimeter wave cameras at entrances, open hoursf
Deter 0.33
Deny
Mitigate
10. Trace detector portals at entrances, open hoursg
Deter 0.5
Deny
Mitigate
11. Dogs at entrances, open hoursg
Deter 0.5
Deny
Mitigate
12. Security guard at entrances, open hoursh
Deter 0.25
Deny
Mitigate 0.1 0.1 0.1 0.1 0.1 0.1
13. Search bags and remove costs at entrances, closedi
Deter 0.9
Deny 0.9
Mitigate
Model Input Parameters and Results 89
Table B.1b—Continued
Option Effect
Scenario
10. C
ar B
om
b in
M
all—
Cra
sh in
fro
m
Stre
et
11. C
ar B
om
b in
U
nd
erg
rou
nd
Pa
rkin
g—
Bre
ak In
12. S
uic
ide
Car
Bo
mb
in
Un
der
gro
un
d
Park
ing
—C
rash
En
tran
ce
13. T
ruck
Bo
mb
in
Load
ing
Do
ck—
Bre
ak In
14. S
uic
ide
Tru
ck
Bo
mb
in L
oad
ing
D
ock
—C
rash
En
tran
ce
15. A
nth
rax
Rel
ease
fr
om
Un
atte
nd
ed
Dev
ice
—O
uts
ider
16. A
nth
rax
Rel
ease
fr
om
Un
atte
nd
ed
Dev
ice
—In
sid
er
17. C
hem
ical
R
elea
se f
rom
Car
t/K
iosk
14.Mandatory coat and bag check,closed hoursi
Deter 0.9
Deny 0.9
Mitigate
15. Metal detectors and search bags at entrances, closedi
Deter 0.9
Deny 0.9
Mitigate
16. Millimeter wave cameras at entrances, closed hoursi
Deter 0.3
Deny
Mitigate
17. Trace detector portals at entrances, closed hoursi
Deter 0.45
Deny
Mitigate
18. Dogs at entrances, closed hoursi
Deter 0.45
Deny
Mitigate
19. Security guard at entrances, closed hoursi
Deter 0.225
Deny
Mitigate
20. Control access to service areasj
Deter
Deny
Mitigate
21. Search carts/kiosks dailyk
Deter 0.15 0.9
Deny 0.15 0.75
Mitigate

90 Reducing Terrorism Risk at Shopping Centers: An Analysis of Potential Security Options
Table B.1b—Continued
Option Effect
Scenario
10. C
ar B
om
b in
M
all—
Cra
sh in
fr
om
Str
eet
11. C
ar B
om
b in
U
nd
erg
rou
nd
Pa
rkin
g—
Bre
ak In
12. S
uic
ide
Car
Bo
mb
in
Un
der
gro
un
d
Park
ing
—C
rash
En
tran
ce
13. T
ruck
Bo
mb
in
Load
ing
Do
ck—
Bre
ak In
14. S
uic
ide
Tru
ck
Bo
mb
in L
oad
ing
D
ock
—C
rash
En
tran
ce
15. A
nth
rax
Rel
ease
fro
m
Un
atte
nd
ed
Dev
ice
—O
uts
ider
16. A
nth
rax
Rel
ease
fro
m
Un
atte
nd
ed
Dev
ice
—In
sid
er
17. C
hem
ical
R
elea
se f
rom
C
art/
Kio
sk
22. Security with 100 percent visual coverage of common areal
Deter 0.5
Deny 0.33
Mitigate 0.1 0.1 0.1 0.1 0.1 0.25
23. Armed security with 100 percent visual coverage of common aream
Deter 0.5
Deny 0.33
Mitigate 0.1 0.1 0.1 0.1 0.1 0.25
24. Police substation in centern
Deter
Deny
Mitigate
25. More clearly label exitso
Deter
Deny
Mitigate 0.1
26. Vehicle inspection at parking, open hoursp
Deter 0.85 0.425
Deny 0.66 0.2
Mitigate
27. Vehicle inspection and hydraulic bollards at parking, open hoursq
Deter 0.85 0.85
Deny 0.66 0.66
Mitigate
28. Loading dock access controlr
Deter 0.85 0.425
Deny 0.85 0.15
Mitigate
29. Loading dock access control and hydraulic bollardss
Deter 0.85 0.85
Deny 0.85 0.85
Mitigate
Model Input Parameters and Results 91
Table B.1b—Continued
Option Effect
Scenario
10. C
ar B
om
b in
M
all—
Cra
sh in
fr
om
Str
eet
11. C
ar B
om
b in
U
nd
erg
rou
nd
Pa
rkin
g—
Bre
ak In
12. S
uic
ide
Car
Bo
mb
in
Un
der
gro
un
d
Park
ing
—C
rash
En
tran
ce
13. T
ruck
Bo
mb
in
Load
ing
Do
ck—
Bre
ak In
14. S
uic
ide
Tru
ck
Bo
mb
in L
oad
ing
D
ock
—C
rash
En
tran
ce
15. A
nth
rax
Rel
ease
fro
m
Un
atte
nd
ed
Dev
ice
—O
uts
ider
16. A
nth
rax
Rel
ease
fro
m
Un
atte
nd
ed
Dev
ice
—In
sid
er
17. C
hem
ical
R
elea
se f
rom
C
art/
Kio
sk
30. Increase building standoff distance with bollard fencet
Deter 0.95
Deny 0.9
Mitigate
31. Bollards at pedestrian entrancesu
Deter 0.95
Deny 0.9
Mitigate
32. Dogs at parking and loading, open/delivery hoursv
Deter 1.0 0.5 1.0 0.5
Deny 0.95 0.2 0.95 0.2
Mitigate
33. Explosive detectors at parking/loading, open/delivery hoursv
Deter 1.0 0.5 1.0 0.5
Deny 0.9 0.2 0.9 0.2
Mitigate
34. Air filtersw
Deter 0.75
Deny
Mitigate 0.5 0.5
35. Anthrax detectorsx
Deter 0.75 0.75
Deny
Mitigate 0.66 0.66
36. Anthrax detectors and filtersy
Deter 0.75 0.75
Deny
Mitigate 0.82 0.82
37. Chemical detectorsz
Deter 0.75
Deny
Mitigate 0.33
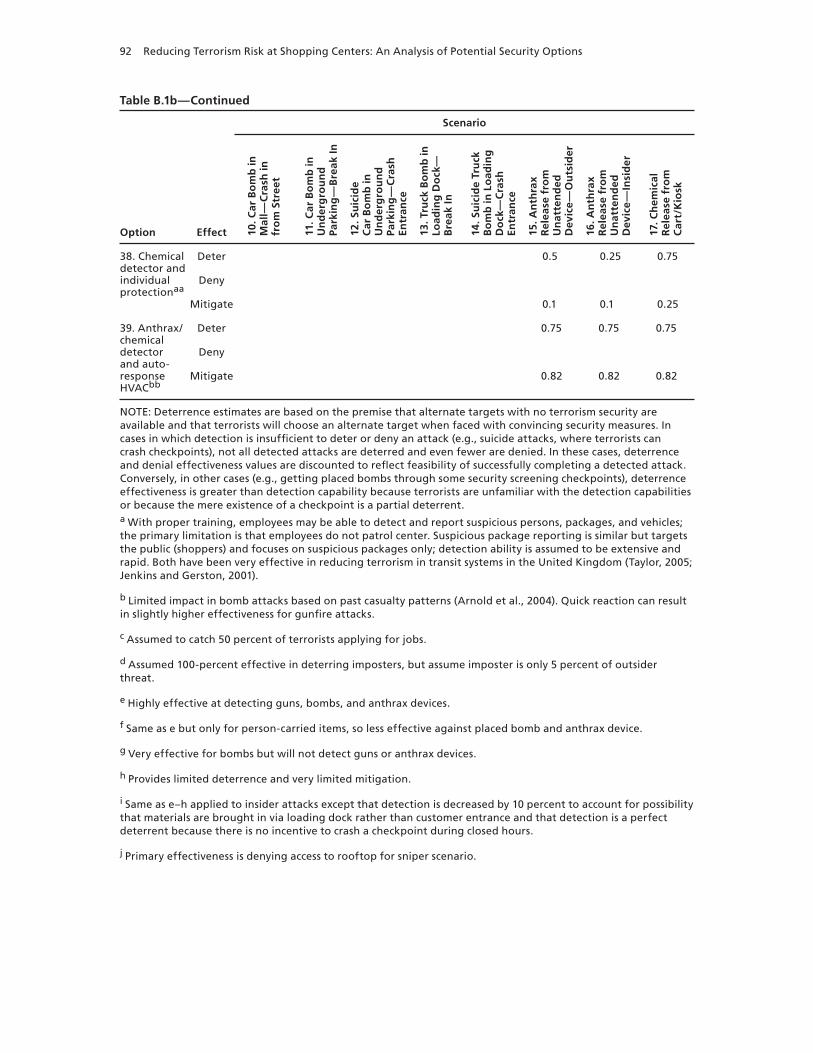
92 Reducing Terrorism Risk at Shopping Centers: An Analysis of Potential Security Options
Table B.1b—Continued
Option Effect
Scenario
10. C
ar B
om
b in
M
all—
Cra
sh in
fr
om
Str
eet
11. C
ar B
om
b in
U
nd
erg
rou
nd
Pa
rkin
g—
Bre
ak In
12. S
uic
ide
Car
Bo
mb
in
Un
der
gro
un
d
Park
ing
—C
rash
En
tran
ce
13. T
ruck
Bo
mb
in
Load
ing
Do
ck—
Bre
ak In
14. S
uic
ide
Tru
ck
Bo
mb
in L
oad
ing
D
ock
—C
rash
En
tran
ce
15. A
nth
rax
Rel
ease
fro
m
Un
atte
nd
ed
Dev
ice
—O
uts
ider
16. A
nth
rax
Rel
ease
fro
m
Un
atte
nd
ed
Dev
ice
—In
sid
er
17. C
hem
ical
R
elea
se f
rom
C
art/
Kio
sk
38. Chemical detector and individual protectionaa
Deter 0.5 0.25 0.75
Deny
Mitigate 0.1 0.1 0.25
39. Anthrax/chemical detector and auto-response HVACbb
Deter 0.75 0.75 0.75
Deny
Mitigate 0.82 0.82 0.82
NOTE: Deterrence estimates are based on the premise that alternate targets with no terrorism security are available and that terrorists will choose an alternate target when faced with convincing security measures. In cases in which detection is insufficient to deter or deny an attack (e.g., suicide attacks, where terrorists can crash checkpoints), not all detected attacks are deterred and even fewer are denied. In these cases, deterrence and denial effectiveness values are discounted to reflect feasibility of successfully completing a detected attack. Conversely, in other cases (e.g., getting placed bombs through some security screening checkpoints), deterrence effectiveness is greater than detection capability because terrorists are unfamiliar with the detection capabilities or because the mere existence of a checkpoint is a partial deterrent.a With proper training, employees may be able to detect and report suspicious persons, packages, and vehicles; the primary limitation is that employees do not patrol center. Suspicious package reporting is similar but targets the public (shoppers) and focuses on suspicious packages only; detection ability is assumed to be extensive and rapid. Both have been very effective in reducing terrorism in transit systems in the United Kingdom (Taylor, 2005;Jenkins and Gerston, 2001).
b Limited impact in bomb attacks based on past casualty patterns (Arnold et al., 2004). Quick reaction can result in slightly higher effectiveness for gunfire attacks.
c Assumed to catch 50 percent of terrorists applying for jobs.
d Assumed 100-percent effective in deterring imposters, but assume imposter is only 5 percent of outsider threat.
e Highly effective at detecting guns, bombs, and anthrax devices.
f Same as e but only for person-carried items, so less effective against placed bomb and anthrax device.
g Very effective for bombs but will not detect guns or anthrax devices.
h Provides limited deterrence and very limited mitigation.
i Same as e–h applied to insider attacks except that detection is decreased by 10 percent to account for possibility that materials are brought in via loading dock rather than customer entrance and that detection is a perfect deterrent because there is no incentive to crash a checkpoint during closed hours.
j Primary effectiveness is denying access to rooftop for sniper scenario.
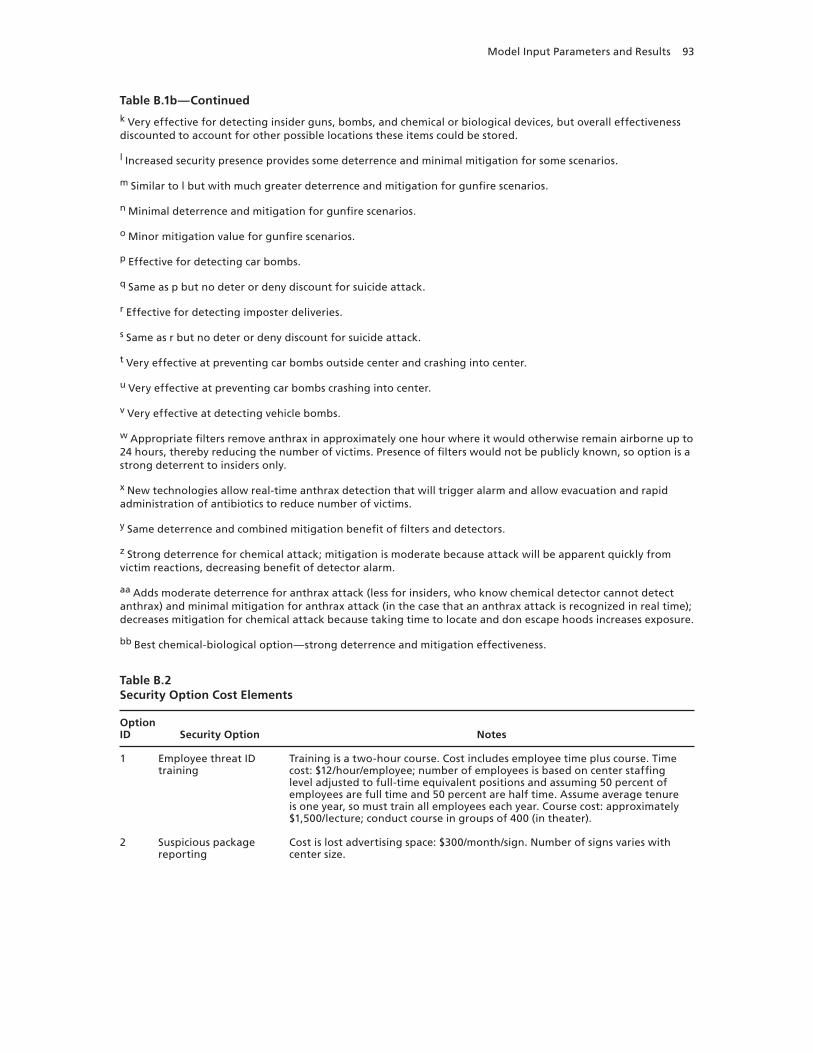
Model Input Parameters and Results 93
Table B.1b—Continuedk Very effective for detecting insider guns, bombs, and chemical or biological devices, but overall effectiveness discounted to account for other possible locations these items could be stored.
l Increased security presence provides some deterrence and minimal mitigation for some scenarios.
m Similar to l but with much greater deterrence and mitigation for gunfire scenarios.
n Minimal deterrence and mitigation for gunfire scenarios.
o Minor mitigation value for gunfire scenarios.
p Effective for detecting car bombs.
q Same as p but no deter or deny discount for suicide attack.
r Effective for detecting imposter deliveries.
s Same as r but no deter or deny discount for suicide attack.
t Very effective at preventing car bombs outside center and crashing into center.
u Very effective at preventing car bombs crashing into center.
v Very effective at detecting vehicle bombs.
w Appropriate filters remove anthrax in approximately one hour where it would otherwise remain airborne up to 24 hours, thereby reducing the number of victims. Presence of filters would not be publicly known, so option is a strong deterrent to insiders only.
x New technologies allow real-time anthrax detection that will trigger alarm and allow evacuation and rapid administration of antibiotics to reduce number of victims.
y Same deterrence and combined mitigation benefit of filters and detectors.
z Strong deterrence for chemical attack; mitigation is moderate because attack will be apparent quickly from victim reactions, decreasing benefit of detector alarm.
aa Adds moderate deterrence for anthrax attack (less for insiders, who know chemical detector cannot detect anthrax) and minimal mitigation for anthrax attack (in the case that an anthrax attack is recognized in real time); decreases mitigation for chemical attack because taking time to locate and don escape hoods increases exposure.
bb Best chemical-biological option—strong deterrence and mitigation effectiveness.
Table B.2Security Option Cost Elements
Option ID Security Option Notes
1 Employee threat ID training
Training is a two-hour course. Cost includes employee time plus course. Time cost: $12/hour/employee; number of employees is based on center staffing level adjusted to full-time equivalent positions and assuming 50 percent of employees are full time and 50 percent are half time. Assume average tenure is one year, so must train all employees each year. Course cost: approximately $1,500/lecture; conduct course in groups of 400 (in theater).
2 Suspicious package reporting
Cost is lost advertising space: $300/month/sign. Number of signs varies with center size.
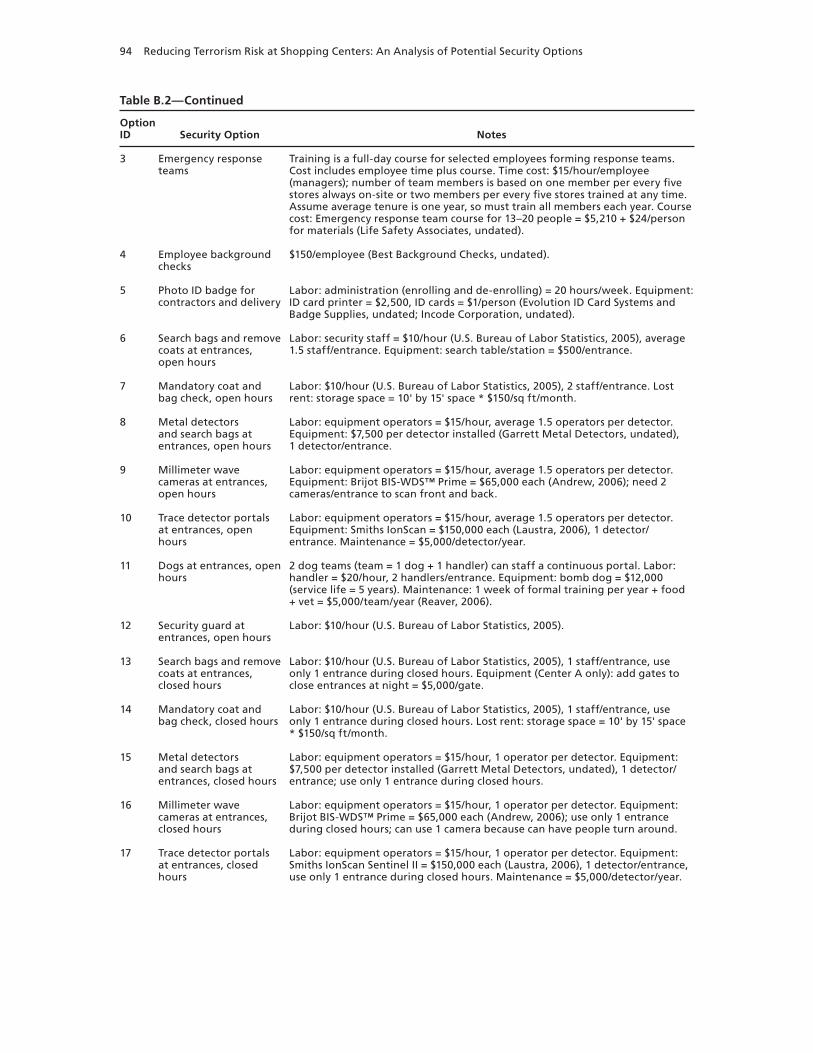
94 Reducing Terrorism Risk at Shopping Centers: An Analysis of Potential Security Options
Table B.2—Continued
Option ID Security Option Notes
3 Emergency response teams
Training is a full-day course for selected employees forming response teams. Cost includes employee time plus course. Time cost: $15/hour/employee (managers); number of team members is based on one member per every five stores always on-site or two members per every five stores trained at any time. Assume average tenure is one year, so must train all members each year. Course cost: Emergency response team course for 13–20 people = $5,210 + $24/person for materials (Life Safety Associates, undated).
4 Employee background checks
$150/employee (Best Background Checks, undated).
5 Photo ID badge for contractors and delivery
Labor: administration (enrolling and de-enrolling) = 20 hours/week. Equipment: ID card printer = $2,500, ID cards = $1/person (Evolution ID Card Systems and Badge Supplies, undated; Incode Corporation, undated).
6 Search bags and remove coats at entrances, open hours
Labor: security staff = $10/hour (U.S. Bureau of Labor Statistics, 2005), average 1.5 staff/entrance. Equipment: search table/station = $500/entrance.
7 Mandatory coat and bag check, open hours
Labor: $10/hour (U.S. Bureau of Labor Statistics, 2005), 2 staff/entrance. Lost rent: storage space = 10' by 15' space * $150/sq ft/month.
8 Metal detectors and search bags at entrances, open hours
Labor: equipment operators = $15/hour, average 1.5 operators per detector. Equipment: $7,500 per detector installed (Garrett Metal Detectors, undated),1 detector/entrance.
9 Millimeter wave cameras at entrances, open hours
Labor: equipment operators = $15/hour, average 1.5 operators per detector. Equipment: Brijot BIS-WDS™ Prime = $65,000 each (Andrew, 2006); need 2cameras/entrance to scan front and back.
10 Trace detector portals at entrances, open hours
Labor: equipment operators = $15/hour, average 1.5 operators per detector. Equipment: Smiths IonScan = $150,000 each (Laustra, 2006), 1 detector/entrance. Maintenance = $5,000/detector/year.
11 Dogs at entrances, open hours
2 dog teams (team = 1 dog + 1 handler) can staff a continuous portal. Labor: handler = $20/hour, 2 handlers/entrance. Equipment: bomb dog = $12,000 (service life = 5 years). Maintenance: 1 week of formal training per year + food + vet = $5,000/team/year (Reaver, 2006).
12 Security guard at entrances, open hours
Labor: $10/hour (U.S. Bureau of Labor Statistics, 2005).
13 Search bags and remove coats at entrances, closed hours
Labor: $10/hour (U.S. Bureau of Labor Statistics, 2005), 1 staff/entrance, use only 1 entrance during closed hours. Equipment (Center A only): add gates to close entrances at night = $5,000/gate.
14 Mandatory coat and bag check, closed hours
Labor: $10/hour (U.S. Bureau of Labor Statistics, 2005), 1 staff/entrance, use only 1 entrance during closed hours. Lost rent: storage space = 10' by 15' space * $150/sq ft/month.
15 Metal detectors and search bags at entrances, closed hours
Labor: equipment operators = $15/hour, 1 operator per detector. Equipment: $7,500 per detector installed (Garrett Metal Detectors, undated), 1 detector/entrance; use only 1 entrance during closed hours.
16 Millimeter wave cameras at entrances, closed hours
Labor: equipment operators = $15/hour, 1 operator per detector. Equipment: Brijot BIS-WDS™ Prime = $65,000 each (Andrew, 2006); use only 1 entrance during closed hours; can use 1 camera because can have people turn around.
17 Trace detector portals at entrances, closed hours
Labor: equipment operators = $15/hour, 1 operator per detector. Equipment: Smiths IonScan Sentinel II = $150,000 each (Laustra, 2006), 1 detector/entrance, use only 1 entrance during closed hours. Maintenance = $5,000/detector/year.

Model Input Parameters and Results 95
Table B.2—Continued
Option ID Security Option Notes
18 Dogs at entrances, closed hours
Labor: handler = $20/hour, 1 handler/entrance (assume traffic low enough that 1 team is enough; use only 1 entrance during closed hours). Equipment: bomb dog = $12,000 (service life = 5 years). Maintenance: 1 week of formal training per year + food + vet = $5,000/team/year (Reaver, 2006).
19 Security guard at entrances, closed hours
Labor: $10/hour (U.S. Bureau of Labor Statistics, 2005); use only 1 entrance during closed hours.
20 Control access to service areas
Labor: administration (enroll/de-enroll) = 20 hours/week. Equipment: Omnilocks = $1,500/door (OSI Security Devices, undated), ID card printer = $2,500, ID cards = $1/person (Evolution ID Card Systems and Badge Supplies, undated).
21 Search carts/kiosks daily Search requires 5 minutes/cart/day. Labor: $10/hour.
22 Security with 100 percent visual coverage of common area
Security currently has approximately 30 percent visual coverage, so need to triple guard staff. Labor: $10/hour.
23 Armed security with 100 percent visual coverage of common area
Armed guards make $8,000/year more than unarmed guards do.
24 Police substation in center
Small store space staffed with an officer and an aide. Labor: $100,000/year for officer and $50,000/year for aide. Lost rent: 20' by 20' space * $150/sq ft/month.
25 More clearly label exits More exit signage, lights, and arrows; $500/entrance.
26 Vehicle inspection at parking, open hours
Labor: $10/hour, 2 staff/entrance.
27 Vehicle inspection and hydraulic bollards at parkingo open hours
Labor: $10/hour, 2 staff/entrance. Equipment: 3-bollard hydraulic system installed = $75,000/entrance + in-ground tiger-teeth barrier = $1,000/exit (Kessinger, 2004; Texas Security Gates, undated).
28 Loading dock access control
Labor: $10/hour, 1 staff/entrance.
29 Loading dock access control and hydraulic bollards
Labor: $10/hour, 1 staff/entrance. Equipment: $76,000/entrance (3-bollard hydraulic system installed = $75,000/entrance + in-ground tiger-teeth barrier = $1,000/exit (Kessinger, 2004; Texas Security gates, undated).
30 Increase building standoff distance with bollard fence
Equipment: security planters = $200 per linear foot of perimeter protection (Stonewear Force Protection, undated)
31 Bollards at pedestrian entrances
Equipment: security planters = $200 per linear foot of perimeter protection (Stonewear Force Protection, undated), 30 feet/entrance.
32 Dogs at parking and loading, open/delivery hours
2 dog teams/entrance (team = 1 dog + 1 handler) can staff a continuous portal. Labor: handler = $20/hour, 2 handlers/entrance. Equipment: bomb dog = $12,000 (service life = 5 years). Maintenance: 1 week of formal training per year + food + vet = $5,000/team/year (Reaver, 2006).
33 Explosive detectors at parking/loading, open/delivery hours
Labor: equipment operators = $15/hour, 2 operators/entrance. Equipment: HiETcar bomb finder = $950,000 (Moore, 2006), 1 detector/entrance. Maintenance = $5,000/detector/year.
34 Air filters Equipment: $15/sq ft. Maintenance = $0.50/sq ft/year (NIOSH, 2003).
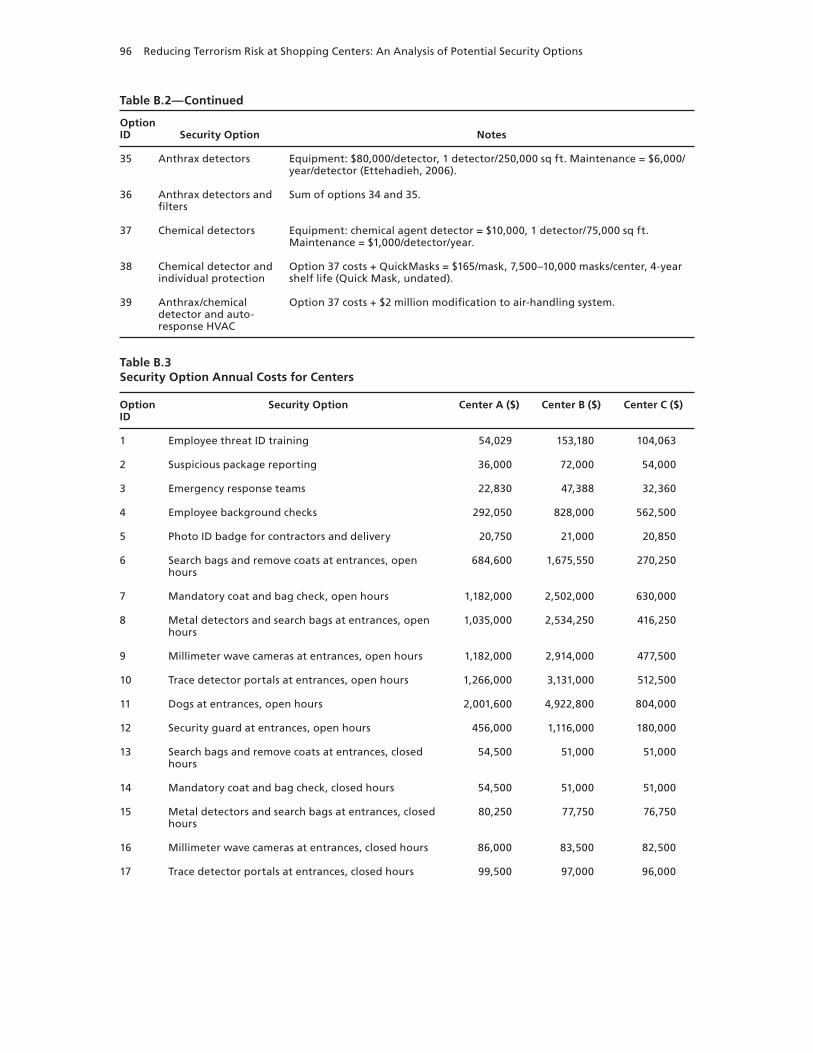
96 Reducing Terrorism Risk at Shopping Centers: An Analysis of Potential Security Options
Table B.2—Continued
Option ID Security Option Notes
35 Anthrax detectors Equipment: $80,000/detector, 1 detector/250,000 sq ft. Maintenance = $6,000/year/detector (Ettehadieh, 2006).
36 Anthrax detectors and filters
Sum of options 34 and 35.
37 Chemical detectors Equipment: chemical agent detector = $10,000, 1 detector/75,000 sq ft. Maintenance = $1,000/detector/year.
38 Chemical detector and individual protection
Option 37 costs + QuickMasks = $165/mask, 7,500–10,000 masks/center, 4-year shelf life (Quick Mask, undated).
39 Anthrax/chemical detector and auto-response HVAC
Option 37 costs + $2 million modification to air-handling system.
Table B.3Security Option Annual Costs for Centers
Option ID
Security Option Center A ($) Center B ($) Center C ($)
1 Employee threat ID training 54,029 153,180 104,063
2 Suspicious package reporting 36,000 72,000 54,000
3 Emergency response teams 22,830 47,388 32,360
4 Employee background checks 292,050 828,000 562,500
5 Photo ID badge for contractors and delivery 20,750 21,000 20,850
6 Search bags and remove coats at entrances, open hours
684,600 1,675,550 270,250
7 Mandatory coat and bag check, open hours 1,182,000 2,502,000 630,000
8 Metal detectors and search bags at entrances, open hours
1,035,000 2,534,250 416,250
9 Millimeter wave cameras at entrances, open hours 1,182,000 2,914,000 477,500
10 Trace detector portals at entrances, open hours 1,266,000 3,131,000 512,500
11 Dogs at entrances, open hours 2,001,600 4,922,800 804,000
12 Security guard at entrances, open hours 456,000 1,116,000 180,000
13 Search bags and remove coats at entrances, closed hours
54,500 51,000 51,000
14 Mandatory coat and bag check, closed hours 54,500 51,000 51,000
15 Metal detectors and search bags at entrances, closed hours
80,250 77,750 76,750
16 Millimeter wave cameras at entrances, closed hours 86,000 83,500 82,500
17 Trace detector portals at entrances, closed hours 99,500 97,000 96,000
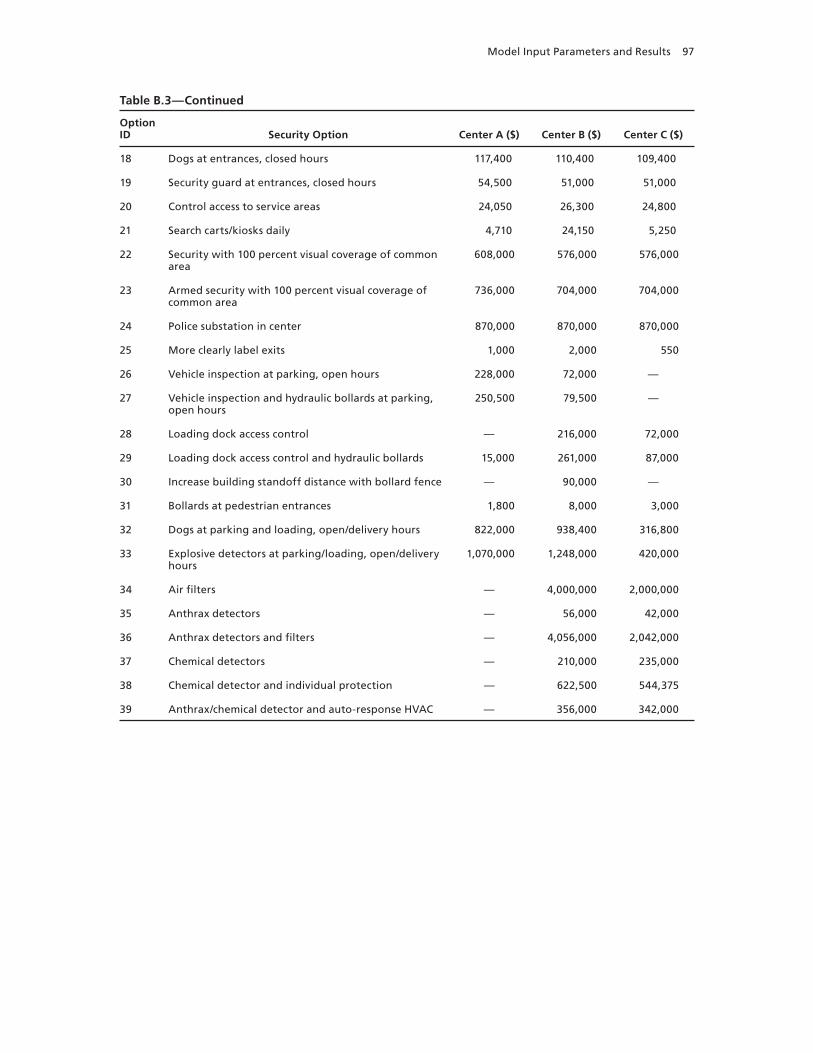
Model Input Parameters and Results 97
Table B.3—Continued
Option ID Security Option Center A ($) Center B ($) Center C ($)
18 Dogs at entrances, closed hours 117,400 110,400 109,400
19 Security guard at entrances, closed hours 54,500 51,000 51,000
20 Control access to service areas 24,050 26,300 24,800
21 Search carts/kiosks daily 4,710 24,150 5,250
22 Security with 100 percent visual coverage of common area
608,000 576,000 576,000
23 Armed security with 100 percent visual coverage of common area
736,000 704,000 704,000
24 Police substation in center 870,000 870,000 870,000
25 More clearly label exits 1,000 2,000 550
26 Vehicle inspection at parking, open hours 228,000 72,000 —
27 Vehicle inspection and hydraulic bollards at parking, open hours
250,500 79,500 —
28 Loading dock access control — 216,000 72,000
29 Loading dock access control and hydraulic bollards 15,000 261,000 87,000
30 Increase building standoff distance with bollard fence — 90,000 —
31 Bollards at pedestrian entrances 1,800 8,000 3,000
32 Dogs at parking and loading, open/delivery hours 822,000 938,400 316,800
33 Explosive detectors at parking/loading, open/delivery hours
1,070,000 1,248,000 420,000
34 Air filters — 4,000,000 2,000,000
35 Anthrax detectors — 56,000 42,000
36 Anthrax detectors and filters — 4,056,000 2,042,000
37 Chemical detectors — 210,000 235,000
38 Chemical detector and individual protection — 622,500 544,375
39 Anthrax/chemical detector and auto-response HVAC — 356,000 342,000

98 Reducing Terrorism Risk at Shopping Centers: An Analysis of Potential Security Options
Figure B.1Collateral Benefits and Detriments of Security Options
RAND TR401-B.1
–3 –2 –1 0 1 2
Number of collateral benefit or detriment categories
Negative psychological impact
Employee inconvenience
Impeding customer access
Aiding loss prevention
Reducing workplace violence
6. Search bags and remove coats at entrances, open hours
7. Mandatory coat and bag check, open hours
8. Metal detectors and search bags at entrances, open hours
9. Millimeter wave cameras at entrances, open hours
26. Vehicle inspection at parking, open hours27. Vehicle inspection and hydraulic bollards at parking,
open hours10. Trace detector portals at entrances, open hours
11. Dogs at entrances, open hours
32. Dogs at parking and loading, open/delivery hours
33. Explosive detectors at parking/loading, open/delivery hours
30. Increase building standoff distance with bollard fence
4. Employee background checks23. Armed security with 100-percent visual coverage
of common area1. Employee threat ID training
3. Emergency response teams
13. Search bags and remove coats at entrances, closed hours
14. Mandatory coat and bag check, closed hours
15. Metal detectors and search bags at entrances, closed hours
16. Millimeter wave cameras at entrances, closed hours
2. Suspicious package reporting
5. Photo ID badge for contractors and delivery
17. Trace detector portals at entrances, closed hours18. Dogs at entrances, closed hours
21. Search carts/kiosks daily
28. Loading dock access control
29. Loading dock access control and hydraulic bollards
35. Anthrax detectors
36. Anthrax detectors and filters
37. Chemical detectors
38. Chemical detector and individual protection
39. Anthrax/chemical detector and auto-response HVAC
12. Security guard at entrances, open hours
22. Security with 100 percent visual coverage of common area
19. Security guard at entrances, closed hours
20. Control access to service areas
24. Police substation in center
25. More clearly label exits
31. Bollards at pedestrian entrances
34. Air filters

Model Input Parameters and Results 99
Table B.4Prioritized Security Options for Center A
Rank OptionAnnual Cost
($)
Cumulative Annual Cost
($)Cumulative
Relative Risk
Fraction of Total Risk Reduction
1 2. Suspicious package reporting 36,000 36,000 0.455 0.5731
2 31. Bollards at pedestrian entrances 1,800 37,800 0.442 0.5872
3 21. Search carts/kiosks daily 4,710 42,510 0.408 0.6226
4 25. More clearly label exits 1,000 43,510 0.405 0.6259
5 13. Search bags and remove coats at entrances, closed hours
54,500 98,010 0.377 0.6556
6 3. Emergency response teams 22,830 120,840 0.331 0.7035
7 1. Employee threat ID training 54,029 174,870 0.277 0.7614
8 20. Control access to service areas 24,050 198,920 0.263 0.7759
9 6. Search bags and remove coats at entrances, open hours
684,600 883,520 0.126 0.9206
10 26. Vehicle inspection at parking, open hours 228,000 1,111,520 0.067 0.9829
11 32. Dogs at parking and loading, open/delivery hours
822,000 1,933,520 0.062 0.9879
12 23. Armed security with 100 percent visual coverage of common area
736,000 2,669,520 0.052 0.9983
13 29. Loading dock access control and hydraulic bollards
15,000 2,684,520 0.052 0.9984
14 18. Dogs at entrances, closed hours 117,400 2,801,920 0.052 0.9986
15 10. Trace detector portals at entrances, open hours 1,266,000 4,067,920 0.051 0.9999
16 5. Photo ID badge for contractors and delivery 20,750 4,088,670 0.051 0.9999
17 9. Millimeter wave cameras at entrances, open hours
1,182,000 5,270,670 0.051 1.0000
18 16. Millimeter wave cameras at entrances, closed hours
86,000 5,356,670 0.051 1.0000
19 24. Police substation in center 870,000 6,226,670 0.051 1.0000
20 4. Employee background checks 292,050 6,518,720 0.051 1.0000
NOTES: Chemical and biological weapon scenarios (scenarios 15–17) and options that apply only to chemical and biological weapons (options 34–39) are excluded from this analysis because Center A is outdoors. Loading Dock Access Control (option 28) is excluded from this analysis because this option is already implemented at Center A. Increase building standoff distance with bollard fence (option 30) is excluded from this analysis because there is no space for a standoff zone at Center A.
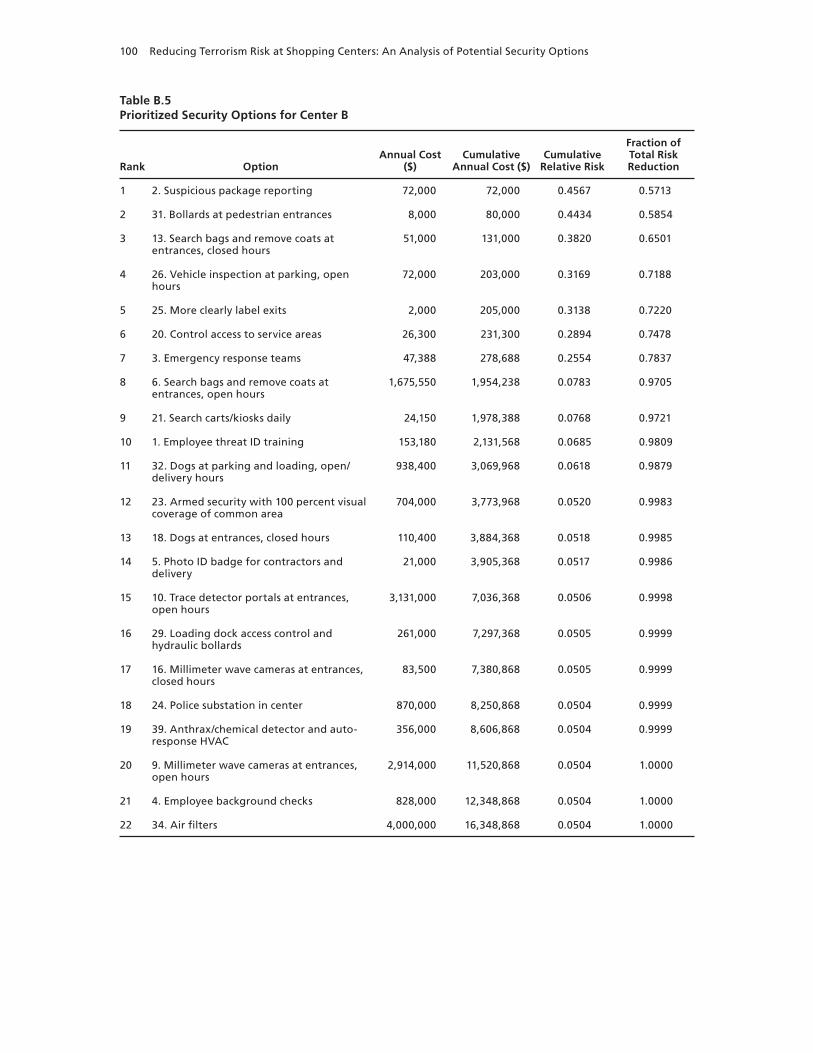
100 Reducing Terrorism Risk at Shopping Centers: An Analysis of Potential Security Options
Table B.5Prioritized Security Options for Center B
Rank OptionAnnual Cost
($)Cumulative
Annual Cost ($)Cumulative
Relative Risk
Fraction of Total Risk Reduction
1 2. Suspicious package reporting 72,000 72,000 0.4567 0.5713
2 31. Bollards at pedestrian entrances 8,000 80,000 0.4434 0.5854
3 13. Search bags and remove coats at entrances, closed hours
51,000 131,000 0.3820 0.6501
4 26. Vehicle inspection at parking, open hours
72,000 203,000 0.3169 0.7188
5 25. More clearly label exits 2,000 205,000 0.3138 0.7220
6 20. Control access to service areas 26,300 231,300 0.2894 0.7478
7 3. Emergency response teams 47,388 278,688 0.2554 0.7837
8 6. Search bags and remove coats at entrances, open hours
1,675,550 1,954,238 0.0783 0.9705
9 21. Search carts/kiosks daily 24,150 1,978,388 0.0768 0.9721
10 1. Employee threat ID training 153,180 2,131,568 0.0685 0.9809
11 32. Dogs at parking and loading, open/delivery hours
938,400 3,069,968 0.0618 0.9879
12 23. Armed security with 100 percent visual coverage of common area
704,000 3,773,968 0.0520 0.9983
13 18. Dogs at entrances, closed hours 110,400 3,884,368 0.0518 0.9985
14 5. Photo ID badge for contractors and delivery
21,000 3,905,368 0.0517 0.9986
15 10. Trace detector portals at entrances, open hours
3,131,000 7,036,368 0.0506 0.9998
16 29. Loading dock access control and hydraulic bollards
261,000 7,297,368 0.0505 0.9999
17 16. Millimeter wave cameras at entrances, closed hours
83,500 7,380,868 0.0505 0.9999
18 24. Police substation in center 870,000 8,250,868 0.0504 0.9999
19 39. Anthrax/chemical detector and auto-response HVAC
356,000 8,606,868 0.0504 0.9999
20 9. Millimeter wave cameras at entrances, open hours
2,914,000 11,520,868 0.0504 1.0000
21 4. Employee background checks 828,000 12,348,868 0.0504 1.0000
22 34. Air filters 4,000,000 16,348,868 0.0504 1.0000

Model Input Parameters and Results 101
Table B.6Prioritized Security Options for Center C
Rank OptionAnnual Cost
($)
Cumulative Annual Cost
($)Cumulative
Relative Risk
Fraction of Total Risk Reduction
1 2. Suspicious package reporting 54,000 54,000 0.4048 0.6271
2 31. Bollards at pedestrian entrances 3,000 57,000 0.3902 0.6425
3 21. Search carts/kiosks daily 5,250 62,250 0.3518 0.6831
4 25. More clearly label exits 550 62,800 0.3483 0.6867
5 6. Search bags and remove coats at entrances, open hours
270,250 333,050 0.1158 0.9326
6 13. Search bags and remove coats at entrances, closed hours
51,000 384,050 0.0849 0.9652
7 3. Emergency response teams 32,360 416,410 0.0753 0.9753
8 28. Loading dock access control 72,000 488,410 0.0729 0.9779
9 1. Employee threat ID training 104,063 592,473 0.0638 0.9875
10 9. Millimeter wave cameras at entrances, open hours
477,500 1,069,973 0.0594 0.9921
11 23. Armed security with 100 percent visual coverage of common area
704,000 1,773,973 0.0525 0.9994
12 18. Dogs at entrances, closed hours 109,400 1,883,373 0.0523 0.9997
13 11. Dogs at entrances, open hours 804,000 2,687,373 0.0521 0.9999
14 32. Dogs at parking and loading, open/delivery hours
316,800 3,004,173 0.0520 1.0000
15 5. Photo ID badge for contractors and delivery 20,850 3,025,023 0.0520 1.0000
16 16. Millimeter wave cameras at entrances, closed hours
82,500 3,107,523 0.0520 1.0000
17 39. Anthrax/chemical detector and auto-response HVAC
342,000 3,449,523 0.0520 1.0000
18 24. Police substation in center 870,000 4,319,523 0.0520 1.0000
19 4. Employee background checks 562,500 4,882,023 0.0520 1.0000
20 34. Air filters 2,000,000 6,882,023 0.0520 1.0000
21 20. Control access to service areas 24,800 6,906,823 0.0520 1.0000
NOTES: Car bomb in underground parking scenarios (scenarios 11 and 12) and options that apply only to these scenarios (options 26 and 27) are excluded from this analysis because Center C has no underground parking. Increase building standoff distance with bollard fence (option 30) is excluded from this analysis because there is no space for a standoff zone at Center C.


103
References
Andrew, Brian, Brijot Imaging Systems, Inc., meeting with the authors, product demonstration, Mar-riott Los Angeles Downtown, March 24, 2006.
Arnold, Jeffrey L., Pinchas Halpern, Ming-Che Tsai, and Howard Smithline, “Mass Casualty Terrorist Bombings: A Comparison of Outcomes by Bombing Type,” Annals of Emergency Medicine, Vol. 43, No. 2, February 2004, pp. 263–273.
The Bellwether Group, Inc., Disaster and Terrorism Preparedness: An Examination of the State of Cor-porate Preparedness in the US Among Eight Leading Corporations, Boston, Mass.: The Bellwether Group, Inc., 2005.
Best Background Checks, “Employment Background Check,” undated Web page. Online at http://www.bestbackgroundchecks.com/employment.html (as of September 25, 2006).
“Bomber Leaves Video,” The Jerusalem Post, May 20, 2001, p. 2.Briggs, Rachel, ed., The Unlikely Counter-Terrorists, London: Foreign Policy Center, 2002. Online at
http://fpc.org.uk/fsblob/45.pdf (as of October 18, 2006).Carroll, Stephen J., Tom LaTourrette, Brian G. Chow, Gregory S. Jones, and Craig Martin, Distri-
bution of Losses from Large Terrorist Attacks Under the Terrorism Risk Insurance Act, Santa Monica, Calif.: RAND Corporation, MG-427-CTRMP, 2005. Online at http://www.rand.org/pubs/monographs/MG427/index.html (as of September 23, 2006).
Clarke, Ronald V., “Situational Crime Prevention: Its Theoretical Basis and Practical Scope,” in Michael H. Tonry and Norval Morris, eds., Crime and Justice: An Annual Review of Research,Vol. 4, Chicago, Ill.: University of Chicago Press, 1983, pp. 225–256.
DeLisle, James R., Shopping Center Classifications: Challenges and Opportunities, New York: Interna-tional Council of Shopping Centers, September 2005. Online at http://www.icsc.org/srch/rsrch/wp/USSC_Class_091305.pdf (as of September 23, 2006).
Dixon, Lloyd, Stephen J. Carroll, Darius N. Lakdawalla, Robert T. Reville, and David Adamson, Issues and Options for Government Intervention in the Market for Terrorism Insurance, Santa Monica, Calif.: RAND Corporation, OP-135-ICJ, 2004. Online at http://www.rand.org/pubs/occasional_papers/OP135/ (as of September 23, 2006).
Ettehadieh, Amir, Universal Detection Technology, telephone conversation with the authors, Febru-ary 23, 2006.
Evolution ID Card Systems and Badge Supplies, undated homepage. Online at http://www.evolution-1.com (as of September 26, 2006).
104 Reducing Terrorism Risk at Shopping Centers: An Analysis of Potential Security Options
Farmer, Richard D., Homeland Security and the Private Sector, Washington, D.C.: Congress of the United States, Congressional Budget Office, 2004. Online at http://purl.access.gpo.gov/GPO/LPS70724 (as of September 23, 2006).
Federal Emergency Management Agency, Primer for Design of Commercial Buildings to Mitigate Ter-rorist Attacks: Providing Protection to People and Buildings, Washington, D.C.: FEMA, December 2003a. Online at http://purl.access.gpo.gov/GPO/LPS44083 (as of September 23, 2006).
———, Reference Manual to Mitigate Potential Terrorist Attacks Against Buildings: Providing Protection to People and Buildings, Washington, D.C.: FEMA, December 2003b. Online at http://purl.access.gpo.gov/GPO/LPS43825 (as of September 23, 2006).
———, Risk Assessment: A How-To Guide to Mitigate Potential Terrorist Attacks Against Buildings: Pro-viding Protection to People and Building, Washington, D.C.: FEMA, January 2005.
Field, Anne, and David Bodamer, “Targeting the Mall,” Retail Traffic, September 1, 2005. Online at http://retailtrafficmag.com/mag/retail_targeting_mall/index.html (as of September 23, 2006).
Garrett Metal Detectors, “Security Division,” undated Web page. Online at http://www.garrett.com/security (as of September 25, 2006).
Grossi, Patricia, and Howard Kunreuther, eds., Catastrophe Modeling: A New Approach to Managing Risk, New York: Springer Science+Business Media, 2005.
Haimes, Yacov Y., Risk Modeling, Assessment, and Management, 2nd ed., Hoboken, N.J.: Wiley-Interscience, 2004.
Hillestad, Richard, personal communication with the authors, August 22, 2006.Incode Corporation, undated homepage. Online at http://www.incodenet.com (as of September 25,
2006).Jackson, Brian A., John C. Baker, Peter Chalk, Kim Cragin, John V. Parachini, and Horacio R. Tru-
jillo, Aptitude for Destruction, Volume 1: Organizational Learning in Terrorist Groups and Its Impli-cations for Combating Terrorism, Santa Monica, Calif.: RAND Corporation, MG-331-NIJ, 2005a. Online at http://www.rand.org/pubs/monographs/MG331/ (as of September 23, 2006).
———, Aptitude for Destruction, Volume 2: Case Studies of Organizational Learning in Five Terrorist Groups, Santa Monica, Calif.: RAND Corporation, MG-332-NIJ, 2005b. Online at http://www.rand.org/pubs/monographs/MG332/ (as of September 23, 2006).
Jenkins, Brian Michael, and Larry N. Gerston, Protecting Public Surface Transportation Against Ter-rorism and Serious Crime: Continuing Research on Best Security Practices, San Jose, Calif.: Mineta Transportation Institute, San Jose State University, MTI Report 01-07, 2001.
Kessinger, Richard, “From Jericho to Jersey Barrier,” Security Management Online, August 2004. Online at http://www.securitymanagement.com/library/001641.html (as of September 25, 2006).
Lakdawalla, Darius N., and George Zanjani, Insurance, Self-Protection, and the Economics of Terror-ism, Santa Monica, Calif.: RAND Corporation, WR-171-ICJ, 2004. Online at http://www.rand.org/pubs/working_papers/WR171/index.html (as of September 23, 2006).
LaTourrette, Tom, Edward Wei-Min Chan, Jennifer Brower, Jamison Jo Medby, and K. Scott McMa-hon, Emergency Response to Terrorist Attacks: An Analysis of Mission Performance Requirements, Santa Monica, Calif.: RAND Corporation, 2006. Limited distribution.
Laustra, Mark, Smiths Detection, telephone conversation with the authors, March 17, 2006.
References 105
Lesser, Ian O., Bruce Hoffman, John Arquilla, David Ronfeldt, Michele Zanini, and Brian Michael Jenkins, Countering the New Terrorism, Santa Monica, Calif.: RAND Corporation, MR-989-AF, 1999. Online at http://www.rand.org/pubs/monograph_reports/MR989/ (as of September 23, 2006).
Life Safety Associates, undated homepage. Online at http://www.lifesafety.com (as of September 25, 2006).
Mair, Julie Samia, and Michael Mair, “Violence Prevention and Control Through Environmental Modifications,” Annual Review of Public Health, Vol. 24, January 2003, pp. 209–225.
Mallonee, Sue, Sheryll Shariat, Gail Stennies, Rick Waxweiler, David Hogan, and Fred Jordan, “Phys-ical Injuries and Fatalities Resulting from the Oklahoma City Bombing,” The Journal of the Ameri-can Medical Association, Vol. 276, No. 5, August 7, 1996, pp. 382–387.
Memorial Institute for the Prevention of Terrorism, Terrorism Knowledge Base, undated Web page. Online at http://www.tkb.org (as of September 23, 2006).
MIPT—see Memorial Institute for the Prevention of Terrorism.Moore, Sean, HiEnergy Technologies, Inc., telephone conversation with the authors, April 3, 2006.National Institute for Occupational Safety and Health, Guidance for Filtration and Air-Cleaning Sys-
tems to Protect Building Environments from Airborne Chemical, Biological, or Radiological Attacks,Cincinnati, Ohio: Department of Health and Human Services, Centers for Disease Control and Protection, NIOSH, Publication No. 2003-136, 2003. Online at http://purl.access.gpo.gov/GPO/LPS66157 (as of September 25, 2006).
OSI Security Devices, Inc., undated homepage. Online at http://www.omnilock.com (as of September 25, 2006).
Quick Mask, “Commercial Pricing,” undated Web page. Online at http://www.quickmask.com/comm_pricing.htm (as of September 25, 2006).
Reaver, David, Adlerhorst International, Inc., telephone call with the authors, March 15, 2006.Riley, K. Jack, Gregory F. Treverton, Jeremy Wilson, and Lois M. Davis, State and Local Intelligence
in the War on Terrorism, Santa Monica Calif.: RAND Corporation, MG-394-RC, 2005. Online at http://www.rand.org/pubs/monographs/MG394/index.html (as of September 23, 2006).
Sauter, Mark, and James Jay Carafano, Homeland Security: A Guide to Understanding, Preventing, and Surviving Terrorism, New York: McGraw-Hill, 2005.
Shapland, Joanna, “Preventing Retail-Sector Crimes,” in Michael H. Tonry and David P. Farrington, eds., Building a Safer Society: Strategic Approaches to Crime Prevention, Crime and Justice Series,Vol. 19, Chicago, Ill.: University of Chicago Press, 1995, pp. 263–342.
Stevens, Donald, Terry Schell, Tom Hamilton, Richard Mesic, Michael Scott Brown, Edward W. Chan, Mel Eisman, Eric V. Larson, Marvin Schaffer, Bruce Newsome, John Gibson, and Elwyn Harris, Near-Term Options for Improving Security at Los Angeles International Airport, Santa Monica, Calif.: RAND Corporation, DB-468-1-LAWA, 2004. Online at http://www.rand.org/pubs/documented_briefings/DB468-1/ (as of September 23, 2006).
Stonewear Force Protection, undated homepage. Online at http://www.planterbarrier.com (as of Sep-tember 25, 2006).

106 Reducing Terrorism Risk at Shopping Centers: An Analysis of Potential Security Options
Taylor, Brian D., Designing and Operating Safe and Secure Transit Systems: Assessing Current Practices in the United States and Abroad, San Jose, Calif.: Mineta Transportation Institute, College of Business, San Jose University, MTI Report 04-05, 2005.
Texas Security Gates, undated homepage. Online at http://www.texassecuritygates.com (as of Septem-ber 25, 2006).
U.S. Army Corps of Engineers, Estimating Damage to Structures from Terrorist Bombs Field Operations Guide, Washington, D.C.: The Corps, July 14, 1999.
U.S. Bureau of Labor Statistics, National Compensation Survey: Occupational Wages in the United States, July 2004, Washington, D.C.: The Bureau, September 2005. Online at http://www.bls.gov/ncs/ocs/sp/ncbl0757.pdf (as of September 23, 2006).
U.S. Department of Defense, Unified Facilities Criteria (UFC): DoD Minimum Antiterrorism Standards for Buildings, Washington, D.C.: Department of Defense, UFC 4-010-01, October 8, 2003. Online at http://www.acq.osd.mil/ie/irm/irm_library/UFC4_010_01.pdf (as of September 23, 2006).
Willis, Henry H., Andrew R. Morral, Terrence K. Kelly, and Jamison Jo Medby, Estimating Terrorism Risk, Santa Monica, Calif.: RAND Corporation, MG-388-RC, 2005. Online at http://www.rand.org/pubs/monographs/MG388/index.html (as of September 23, 2006).
Yang, Debra W., “Tanzanian Man Who Called in Bogus Tip About Plot to Bomb Los Angeles Shop-ping Malls Enters Guilty Plea to Federal Charges,” press release 04-159, U.S. Attorney, Central District of California, December 21, 2004. Online at http://www.usdoj.gov/usao/cac/pr2004/159.html (as of September 23, 2006).