energy and sustainable development by a. anantha gm, rec
TRANSCRIPT

ENERGY AND SUSTAINABLE DEVELOPMENT
By
A. Anantha
GM, REC

Sustainable Development
Sustainable Development means ‘Development that meets the needs of the present day without compromising the ability of future generations to meet their needs’
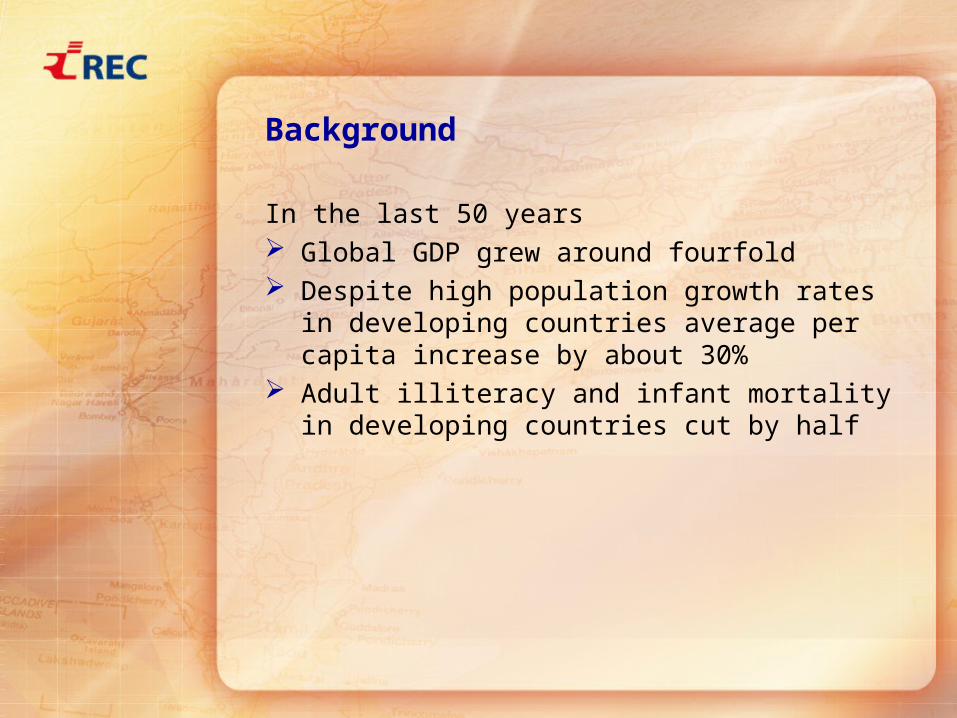
Background
In the last 50 years Global GDP grew around fourfold Despite high population growth rates in
developing countries average per capita increase by about 30%
Adult illiteracy and infant mortality in developing countries cut by half

Concerns
Growing social stresses due to conflicts and inequality, poverty etc
Environmental degradation
For Next 50 years
The global economy may grow further more than four folds
Poverty may reduce considerably

Govt. Attention Needed
To reduce poverty Maintain Growth Improve social cohesion Protecting Environment
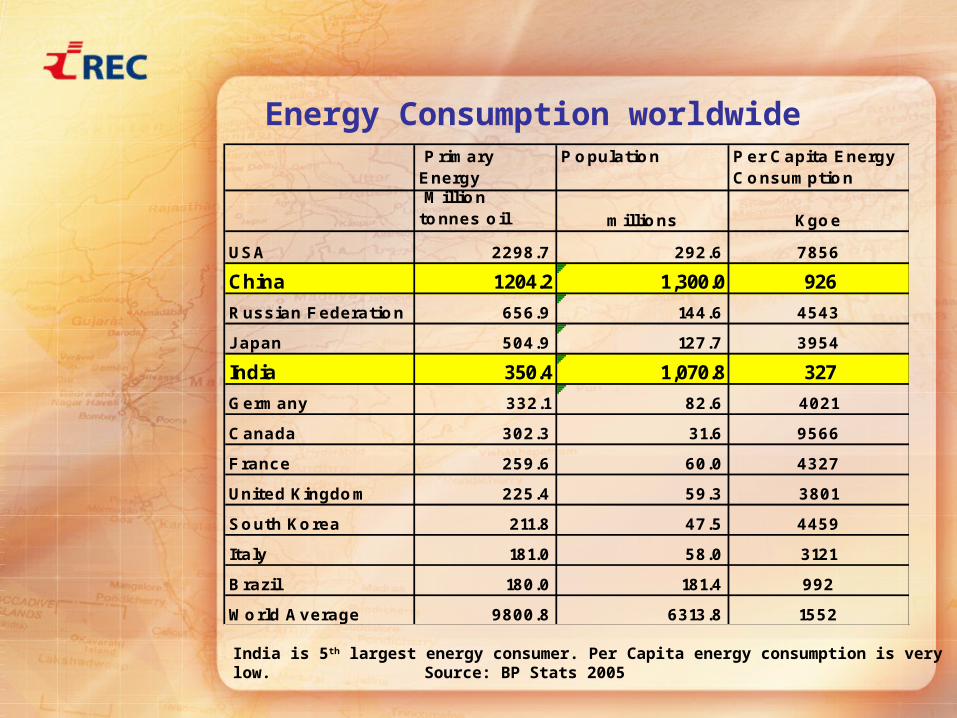
Energy Consumption worldwide P rimary Energy Consumption
Population Per Capita Energy Consumption
Million tonnes oil millions Kgoe
USA 2298.7 292.6 7856
China 1204.2 1,300.0 926
Russian Federation 656.9 144.6 4543
J apan 504.9 127.7 3954
India 350.4 1,070.8 327
Germany 332.1 82.6 4021
Canada 302.3 31.6 9566
France 259.6 60.0 4327
United Kingdom 225.4 59.3 3801
South Korea 211.8 47.5 4459
Italy 181.0 58.0 3121
Brazil 180.0 181.4 992
World Average 9800.8 6313.8 1552
India is 5th largest energy consumer. Per Capita energy consumption is very low. Source: BP Stats 2005

Energy Consumption in India
Consumption in million
tonnes of oil equivalent
% of total
Oil 113.1 32.3
Natural Gas 26.9 7.7
Coal 190.6 54.4
Nuclear 4.1 1.2
Hydro 15.7 4.5
Total 350.4 100
Consumption by energy type in 2003 Source: BP Stats 2005

Energy Challenges
Improve access to energy which is Sustainable Reliable Affordable
In order to Alleviate poverty Promote energy savings Promote renewable and sustainable technologies

Energy Challenges for Sustainable Development
Tackling climate change Promoting environmentally sound energy Use of efficient technologies Meeting growing energy needs Capacity building

Energy Efficiency and DSM
Energy efficient technologies Compulsory energy audit annually End use efficiency Demand Side Management measures like
peak saving, time of the day metering etc

Energy Needs
For Urban areas- High Demand For Rural areas- Varies from life line to
medium demand

Sources of Energy
In rural Areas (villages) Fuel wood, biomass, biogas, kerosene etc Decentralised electricity generation locally Electricity supply through grid

The status of village electrification in India as on 31.03.2004
Total No. of census villages – 587556 Total No. of census villages electrified –474982
(81%) Balance villages to be electrified – 112401 *
(19%)
* As per the new definition of village electrification (effective from 2004-05) total no. Of un-electrified villages is estimated to be 1,25,000
The status of household electrification in India
Total No. of households – 13.8 Cr. (2001 census) Total No. of household electrified – 6.02 Cr. (44%) Balance household to be electrified – 7.78 Cr.
(56%)

Rajiv Gandhi Gramin Vidyutikaran Yojana (2005)
Create Rural Electricity Backbone
Wire villages/hamlets
Power to all BPL families – last mile connectivity
Electrify public places
Develop franchisees

Policy TargetsAs per Rajiv Gandhi Grameen Vidyutikaran
Yojna, April 2005.in 5 years….
Electrify all villages and habitants Provide access to electricity to all households Give electricity connection to Below Poverty Line
(BPL) families free of charge. Through creation of :
Rural Electricity Distribution Backbone (REDB) with at least one 33/11 kV (or 66/11kV) sub station in each block.
Village Electrification Infrastructure (VEI) with at least one distribution transformer in each village/habitation.
Decentralised Distributed Generation (DDG) system where Grid supply is not feasible or cost effective.

Work in hand
States 22Districts 196Villages 51,284 unelectrified +
74,615 electrifiedHouseholds 72,78,758As on 31.03.06 Additional 10,000 villages electrified under RGGVY
(05-06)

581 207 0 122 76510000
40000
230000220000
50000
20000
350
35000
0
50000
100000
150000
200000
250000
00-01 01-02 02-03 03-04 04-05 05-06 06-07 07-08 08-09
Electrification of Unelectrified Villages
Intensive Electrification
Electrification of Villages
(Projected)
38

Achievements/ Targets
10,000 villages electrified by March 2006
40,000 villages targeted to be electrified by March 2007
Additional 25,000 villages targeted for intensive electrification
Funds required Rs. 7500 crores i.e. about Rs. 600 crores per month

Challenges
Timely flow of funds
Holding price line of equipments
Creation of viable franchisees
Availability of reliable power

Sl.No. State / Utility 2002-03 2003-04 2004-051a APCPDCL (Andhra Pradesh) 29.68* 19.12* 23.95b APEPDCL (Andhra Pradesh) 19.32* 17.79* 14.27c APNPDCL (Andhra Pradesh) 26.84* 10.41* 21.91d APSPDCL (Andhra Pradesh) 27.26* 17.17* 20.552 Arunachal Pradesh 61.8 16.26* 37.263 Assam 39.44 43.35 40.40*4 Bihar 77.64 77 74.095 Chattisgarh 38.68* 38.87* 45.07*
6a BSES Rajdhani (Delhi) 47.40* 45.07* 40.64*b BSED Yamuna (Delhi) 61.89* 54.29* 50.12*c NPDL (Delhi) 47.79* 44.86* 33.79*7 Goa 22.98 21.28 17.278 Gujarat 31.24 30.98 30.32
9a DHBVNL (Haryana) 41.39 48.68* 36.39b UHBVNL (Haryana) 42.54 52.84* 43.12
10 Himachal Pradesh 29.52 9.27 21.7111 Jammu & Kashmir 61.71* 67.56* 68.3312 Jharkhand 53.00* 65.00* 69.23
13a BESCOM (Karnataka) 35.7 28.91 24.83b GESCOM (Karnataka) 43.54 43.86 42.99c HESCOM (Karnataka) 47.73 31.66 41.64d MESCOM (Karnataka) 35.68 25.82 26.62
14 Kerala 29.08* 27.44* 32.1215a Poorva KVVCL (MP) 34.05 42.68* 44.37*
b Pashchim KVVNL (MP) 43.41* 45.66* 38.86*c Madhya KVVCL (MP) 51.13* 57.06* 53.17*
AT&C Losses-Present statusAT&C Losses-Present status ( (All India AT&C loss )
Source: MOP site/Power Finance Corporation / * State Electricity Regulatory Commission

Sl.No. State / Utility 2002-03 2003-04 2004-0516 Maharashtra 44.3 44.18* 26.6217 Manipur 76.86 69.73 88.5018 Meghalaya 42.34 39.31 38.1619 Mizoram 49.55 40.75 22.1120 Nagaland 53.82 55.59 39.53
21a CESCO (Orissa) 55.04* 51.10* 49.37*b NESCO (Orissa) 52.25* 50.36* 42.96*c SESCO (Orissa) 49.76* 51.56* 45.71*d WESCO (Orissa) 47.30* 46.18* 40.60*
22 Pondicherry 41.66 41.01 40.4923 Punjab 23.19 22.40* 20.62*
24a AVVNL (Rajasthan) 41.22* 44.57* 49.75b JDVVNL (Rajasthan) 41.97* 41.56* 47.56c JVVNL (Rajasthan) 39.99* 38.62* 43.22
25 Sikkim 80.43 66.54 63.6026 Tamilnadu 18.00* 18.00* 18.00*27 Tripura 34.31 31.53 30.87
28a Dakhinachal VVN (U.P) 48.00* 43.21* 48.00*b Madhayanchal VVN (U.P) 48.00* 43.21* 38.00*c Pashchimanchal VVN (U.P) 48.00* 43.21* 43.00*d Poorvanchal VVN (U.P) 48.00* 43.21* 38.00*
29 Uttaranchal 40.74 43.38 42.8530a West Bengal 34.53* 43.92* 35.66*
b CESC (WB) 19.30* 17.90* 16.80*
AT&C Losses-Present statusAT&C Losses-Present statusAll India AT&C loss (contd..)
Source: MOP site/Power Finance Corporation / * State Electricity Regulatory Commission

Less than 20%
Between 20% and 30%
Between 30% and 40%
Above 40%
Goa Andhra Pradesh Karnataka Delhi Tamil Nadu West Bengal Kerala UP Himachal
Pradesh Assam Bihar
Maharashtra Meghalaya J harkhand Punjab Arunachal MP Mizoram Gujarat Uttaranachal Nagaland Rajasthan Tripura Haryana Manipur Assam J &K Chattisgarh Orissa Pondicherry Sikkim
AT&C Loss % of various states (based on 04-05 figures)

Year Billion kWhr Installed Capacity (GW)
7% 8% 7% 8%
2006-07 700 700 140500 140500
2011-12 982 1029 197060 206440
2016-17 1377 1511 276385 303330
2021-22 1931 2221 387645 445690
2026-27 2709 3263 543690 654865
2031-32 3799 4793 762555 962210
Projections for Electricity requirement by MOP
1010
Source: Draft Integrated Energy Policy document

Plan-wise Projected Installed Capacity (MW)
0
50000
100000
150000
200000
250000
XI Plan(2007-12)
XII Plan(2012-17)
XIII Plan(2017-22)
IVX Plan(2022-27)
VX Plan(2027-32)
7% 8%
1111
Source: Draft Integrated Energy Policy document

Fuel Type Physical Units MTOE
Rural Urban Total Rural Urban Total
Fire Wood & chips (Mt.)
158.87
18.08 176.95
71.49 8.13 79.62
Electricity (BkWh) 40.76 57.26 98.02 3.51 4.92 8.43
Dung Cake (Mt.) 132.95
8.03 140.98
27.92 1.69 29.61
Kerosene (Mltrs) 7.38 4.51 11.89 6.25 3.82 10.07
Coal (Mt.) 1.20 1.54 2.74 0.49 0.63 1.12
L.P.G. (Mt.) 1.25 4.43 5.68 1.41 5.00 6.41
Household Energy Consumption in India (July 1999- June 2000)
Source: Derived from NSS 55th Round, (July 1999- June 2000 data, National Sample Survey Organisation, Ministry of Statistics and Programme Implementation, Government of India
1212

The Current Situation Large parts of rural India not electrified Poor service levels – 12 to 15 hour power cuts
common in several large states Erratic voltage and rampant breakdowns High AT&C losses
Average Hours of Supply
0
5
10
15
20
25
30
25% 28
%
28%
29% 30%
32% 34
%
35% 38
% 40% 43
% 47% 50
% 55%
56%
56%
68%
70%
80%
80%
81% 83
% 90% 95
%
0%10%20%30%40%50%60%70%80%90%
100%
J&K
K'taka
Guj
TN Chattisgarh
Andaman
Kerala
M'tra
MP
AP Nagaland
Manipur
Uttaranchal
Arunachal
Mizoram
Rajasthan
Tripura
Meghalaya
WB
UP Orissa
Assam
Jharkhand
Bihar
% of Rural Households Unelectrified% of Rural Households Unelectrified
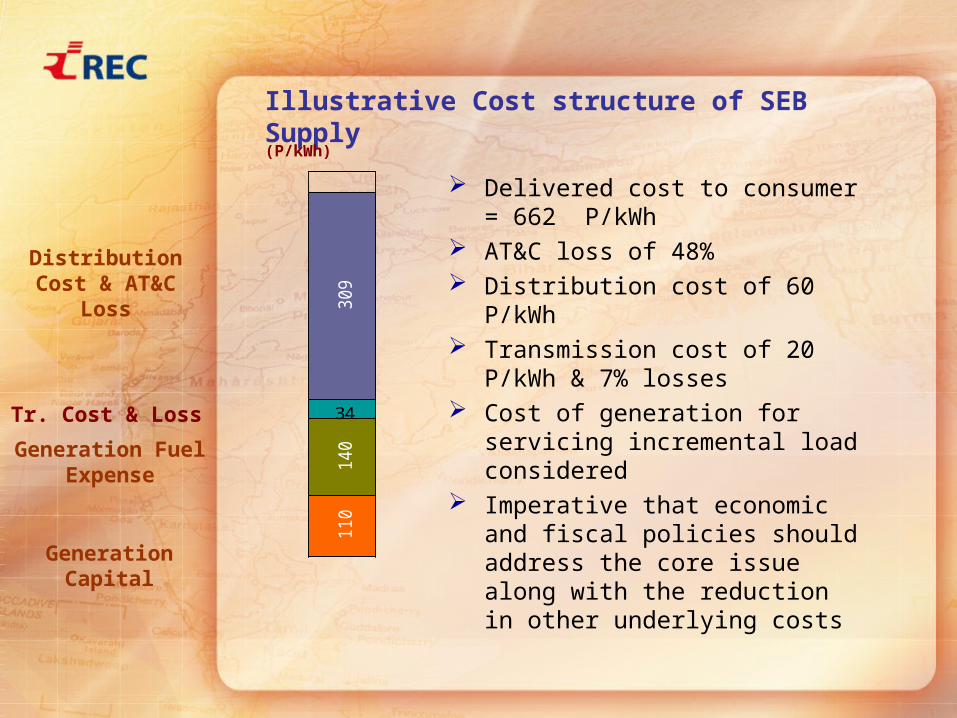
Illustrative Cost structure of SEB Supply
Delivered cost to consumer = 662 P/kWh
AT&C loss of 48% Distribution cost of 60 P/kWh Transmission cost of 20 P/kWh
& 7% losses Cost of generation for servicing
incremental load considered Imperative that economic and
fiscal policies should address the core issue along with the reduction in other underlying costs
11
01
40
34
30
9
(P/kWh)
Distribution Cost & AT&C Loss
Tr. Cost & Loss
Generation Fuel Expense
Generation Capital

Franchisee
The Energy/ Electricity distribution and
collection models should be on the basis of
franchisees for a sustainable development

Indian Energy Scenario
Revenue Collection problems
India- 17% of world population, 4% of primary
energy
Present pattern- predominantly fossil based
56% of households unelectrified
Linkage between energy services and quality
of life

Power Generation Options
Power Generation
Centralized
(Grid Connected)
Decentralized Distributed Generation (Isolated/ Grid
interconnected)
Cogeneration
( Export)
Demand Side Management
(Solar water heater, passive solar, Energy Conservation etc.)
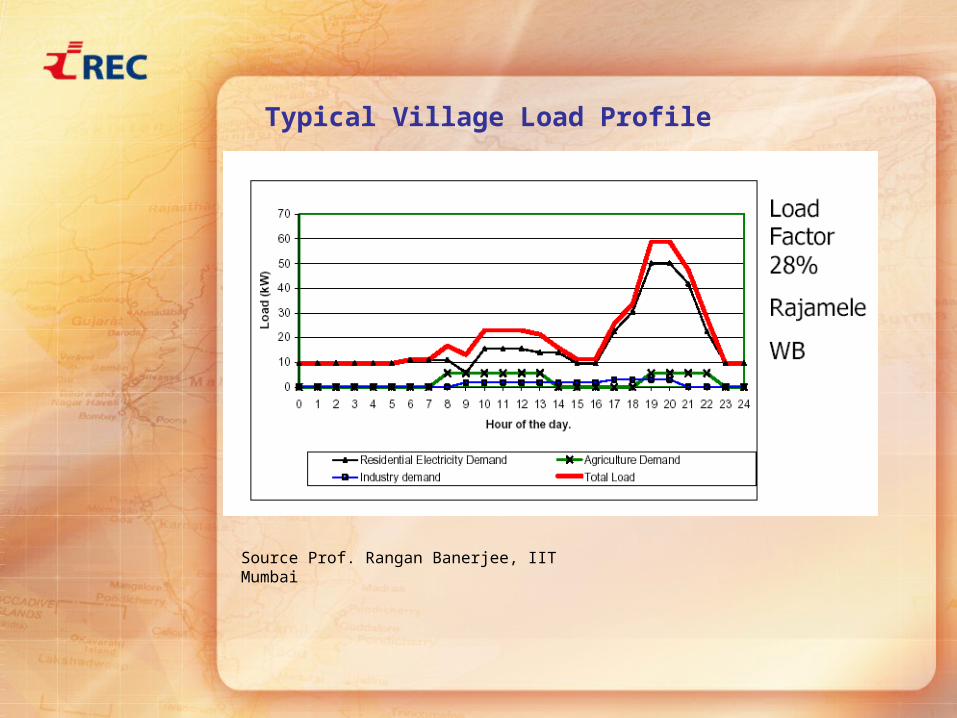
Typical Village Load Profile
Source Prof. Rangan Banerjee, IIT Mumbai
DDG- Issues
Execution at mass level To contain tariff within affordable limits To pursue/encourage private companies and
local bodies Local/ Consumer participation Inconsistent SEBs policy Mapping of energy resources Low load factor Standardization of units

Combination Of Grid And Off Grid Operations
DDG also to support grid power as a supplement
Minimum guarantee of supply hours to be given by the States/ State utilities at normal rates
Balance hours supply through DDG at DDG’s determined tariff
Average cost of supply through grid and off grid to be reasonable and affordable
To improve the PLF, if required, Power may also be exported to the grid or third party by paying wheeling charges, wherever applicable

Regulatory Issues - DDG
As per the Electricity ACT 2003 no license requirement for stand alone generation and distribution in notified rural areas
Interconnection with grid may bring State Regulatory Commissions in picture- Matter needs to be addressed
For stand alone system the tariff can be fixed by the operator, regulatory commission has no jurisdiction in such areas notified as rural
Private operators of DDG systems must follow certain guidelines to be notified by the Govt. of India regarding periodicity of increasing the tariff and the basis of increase
Safety regulations to be followed even for DDG as per the Electricity Act 2003

DDG- Policy Interventions
No Customs or Excise Duty to be charged
Income tax holiday for 10 years
No Electricity Duty or other levies

Talukas as Rural Economic Hubs
Talukas are manageable Talukas can be self sufficient with local resources Talukas may be converted to Rural Economic
Hubs DDG can meet the supplementary energy needs
of the Talukas Employment generation in Talukas would reduce
migration to cities Decentralization would work well for
developmental goals and against economic deprivation
Give equal opportunity to all Talukas Rural industries will get a boost It will be sustainable

REC LTD. SHOULD BE THE APEX AGENCY FOR RURAL DEVELOPMENT AND REFINANCING BEING ALREADY SPREAD ACROSS THE COUNTRY AND BEING CONSIDERED FOR NAVARATNA STATUS

Way Forward…..
Need to improve Rural Energy Delivery systems Encourage DDG as supplementary power option Framing of Decentralised Distributed Generation
Policy at National level Develop talukas/ blocks as rural economic hubs
for sustainability Utilise RGGVY infrastructure for feeding power
through DDG as supplementary power to protect the investments made under RGGVY
Priority to energy efficiency and DSM measures Investments to be made in T&D sector to cut
down AT&C losses drastically Concrete efforts required by all stakeholders for
sustainable development

Conclusion
Growing energy demand and shortage of resources call for the urgency to focus attention on energy efficiency and demand side management besides reducing AT&C losses. Energy generation to be more decentralised also for meeting local needs through grid or off grid. Investments have to be made now with a vision for sustainability. All energy options to be exploited to the extent feasible

Thank You