energy and transportation sustainability plan
TRANSCRIPT

4
ENERGY AND TRANSPORTATION
SUSTAINABILITY PLAN
August 2011

SALT LAKE CITY ENERGY AND TRANSPORTATION SUSTAINABILITY PLAN
i
The Salt Lake City Corporation would like to acknowledge the following individuals for
their time and expertise in contributing to this plan:
Salt Lake City Energy and Carbon
Advisory Committee (ECAC) Jason Berry, State Energy Office
Ann Ober, Salt Lake County Mayor’s Office
Kimi Barnett, Salt Lake County
Lis Cohen, Governor’s Energy Office
Rusty Lundberg, Department of
Environmental Quality
Myron Willson, University of Utah
Kerry Case, Westminster College
Troy Justesen, Salt Lake Community College
Eric Hunter, Salt Lake Community College
Greg Libecci, Salt Lake School District
Alene Bentley, Rocky Mountain Power
Dan Dent, Questar Gas
Barrie McKay, Questar Gas
Steve Bateson, Questar Gas
Laura Briefer, Salt Lake City Utilities
Jeff Edwards, Economic Development
Corporation of Utah
Bill Krause, Salt Lake Convention and Visitor’s
Bureau
Sarah Wright, Utah Clean Energy
Sarah Baldwin, Utah Clean Energy
Carrie Giles, Utah Clean Energy
Alan Matheson, Envision Utah
Jeff Grant, Utah Chapter of the Utah Green
Building Council
Doug Hattery, Wasatch Front Regional
Council
Kip Billings, Wasatch Front Regional Council
Kevin Young, Salt Lake City Transportation
Division
Patty Nelis, Salt Lake City International Airport
Kevin Staples, Salt Lake City International
Airport
Grantley Martelly, Utah Transportation
Authority (UTA)
Jeff Sokol, Varian Medical Systems
J.C. Smith Varian Medical Systems
Babs Delay, Urban Utah Homes & Real Estate
Natalie Gochnour, Salt Lake Chamber of
Commerce
Dru Whitlock, CH2M Hill
Jim Holtkamp, Holland & Hart
Diana Johnson, Interfaith Power and Light
Brian Farr, Interfaith Roundtable
Ron Daniels, Energy Advisor’s Office for the
Governor
Salt Lake City Division of Sustainability
and Environment Vicki Bennett, Director
Renee Zollinger, Environmental Programs
Manager
Debbie Lyons, Recycling Program Manager
Bridget Stuchly, Outreach Coordinator
Data Sources and Assistance Salt Lake City Corporation
Rocky Mountain Power
Questar Gas Company
Wasatch Front Regional Council
Environmental Protection Agency
ACE Recycling and Disposal
Waste Management
Utah Governor’s Office of Planning and
Budget
Salt Lake Convention and Visitor’s Bureau
Blue Ribbon Advisory Council on Climate
Change
U.S. Census Bureau
Energy Information Administration
Bureau of Labor Statistics
Bureau of Transportation Statistics
U.S. Department of Transportation
Bureau of Economic Analysis
Utah Department of Environmental Quality
Additional Thanks To Maria Vyas, Fehr and Peers
Julie Bjornstad, Fehr and Peers
Kyle Cook, Fehr and Peers
Joyce Allgaier, Clarion Associates
Erika Brown, Independent Consultant
Judy Dorsey, Brendle Group
Becky Fedak, Brendle Group
Seth Jansen, Brendle Group

SALT LAKE CITY ENERGY AND TRANSPORTATION SUSTAINABILITY PLAN
ii
TABLE OF CONTENTS
letter Of Introduction ......................................................................................................................... iv
Executive Summary ............................................................................................................................. v
1 Energy, Sustainability, and Salt Lake City .............................................................................. 1
1.1 Community Greenhouse Gas Inventory ........................................................................ 1
1.2 Impacts of Climate Change ............................................................................................ 2
1.3 Potential Co-benefits of Addressing Energy Consumption and Climate Change 2
1.4 Adaptation .......................................................................................................................... 3
2 Forecast and Targets ................................................................................................................. 4
2.1 Forecast of Greenhouse Gas Emissions .......................................................................... 4
2.2 Target for Reducing Greenhouse Gas Emissions .......................................................... 4
3 Energy and Transportation Sustainability Plan Framework ................................................. 6
3.1 Relationship to Broader Sustainability ............................................................................. 6
3.2 Process .................................................................................................................................. 6
3.3 Strategy Identification ....................................................................................................... 7
3.4 Framework............................................................................................................................ 7
3.5 Existing Practices ................................................................................................................. 8
4 Energy And Transportation Sustainability Plan .................................................................... 11
4.1 Energy Conservation and Renewable Energy ........................................................... 13
4.2 Transportation and Mobility ............................................................................................ 22
4.3 Climate Change and Air Quality ................................................................................... 32
5 Adaptation ................................................................................................................................ 33
5.1 Projected Consequences of Climate Change .......................................................... 33
5.2 Hydrology and Water Resources ................................................................................... 34
5.3 Biodiversity and Ecosystems ........................................................................................... 35
5.4 Recreation/Tourism........................................................................................................... 36
5.5 Energy ................................................................................................................................. 37
5.6 Stormwater Management .............................................................................................. 38
5.7 Public Health ...................................................................................................................... 38
6 Framework for Continued Progress ....................................................................................... 40

SALT LAKE CITY ENERGY AND TRANSPORTATION SUSTAINABILITY PLAN
iii
APPENDIX
Appendix A: Energy Strategy Assumptions ................................................................................. 41
Appendix B: Transportation Strategy Assumptions ..................................................................... 45
Appendix C: Acronyms and Abbreviations ................................................................................. 49
LIST OF TABLES AND FIGURES
Table 1. Existing Practices to Mitigate Energy Consumption and Greenhouse Gas
Emissions ...................................................................................................................................... 10
Table 2. Plan Potential to Address Target ..................................................................................... 12
Table 3. Plan Sensitivity to Growth Assumptions .......................................................................... 12
Table 4. Energy Conservation and Renewable Energy Strategies .......................................... 14
Table 5. Transportation and Mobility Strategies........................................................................... 23
Figure 1. Business-As-Usual Forecast and Target Scenarios ........................................................ vi
Figure 2. Illustration of Energy and Transportation Sustainability Plan ..................................... vii
Figure 3. 2009 Community Greenhouse Gas Emissions by Sector ............................................. 1
Figure 4. Business-As-Usual Forecast and Target Scenarios ......................................................... 5
Figure 5. Sustainability Topics ............................................................................................................ 6
Figure 6. Illustration of Energy and Transportation Sustainability Plan ....................................... 8

SALT LAKE CITY ENERGY AND TRANSPORTATION SUSTAINABILITY PLAN
iv
LETTER OF INTRODUCTION
We are not leaving our future to chance. Having completed a comprehensive analysis of
current activities and identified a wide range of potential strategies, we will carry out this plan
for creating an even cleaner, more livable, and responsible community. The strategies
proposed in this plan are a reflection of the extensive expertise and commitment of
community members and experts using the highest quality data available, local knowledge,
and best practices from around the country. Salt Lake City has already been recognized as
a leader in sustainable development, a great place to do business, and an exceptional
community in which to live and recreate. The approaches detailed in this plan will ensure we
continue to lead and thrive in accordance with our values.
Our recently completed Community Carbon Footprint quantified all significant emissions
resulting from residential, commercial, and industrial activities in our community. It gave us
our first ever baseline and is invaluable for the insights it provides into where we can make the
biggest difference. In 2009, we emitted 4.75 million metric tons of carbon dioxide equivalent
– or 26 metric tons per person, which is just above the national average. Most of these
emissions, 54 percent, resulted from electricity use. Consequently, there is great opportunity
for drastically reducing emissions if we can improve energy efficiency, particularly in buildings
where most electricity is consumed, and use cleaner sources of electricity.
Another result this inventory tells us is that Salt Lake City residents drive less than the average
American in large part because we live in a relatively small urban area with increasing access
to transit and other alternatives to the single occupant automobile. We are committed to
further reducing vehicle miles traveled and reducing traffic by making biking, walking, transit,
carpooling, and car sharing as convenient and enjoyable as possible.
Armed with this information, we are committing to reduce our greenhouse gas emissions to 17
percent below 2005 levels by 2020. This plan details how six key strategies and a host of
supporting strategies for reducing emissions will get us there. They reduce our contribution to
climate change; clean the air; provide greater energy security; support a green energy
economy; reduce traffic; and protect our water supply, wildlife, and other natural resources.
In essence, these strategies create a stronger and more livable community. Additionally, this
plan provides suggestions for adapting to the impacts of climate change, which are already
being observed in Utah.
Salt Lake City is proud to be a leader in the area of sustainable development. We believe
that our thoughtful, collaborative, and quantified approach will ensure even greater success
in the future. This effort is just the beginning. Annually, we will report on our carbon emissions
and analyze our performance with respect to our goal, current initiatives, and new potential
strategies. Additionally, new activities will be considered based on their impact to our
carbon footprint. The city will also continue to depend upon the depth of knowledge and
passion of our citizens to help drive us to our goals.
Thank you for all you do,
Mayor Ralph Becker

SALT LAKE CITY ENERGY AND TRANSPORTATION SUSTAINABILITY PLAN
v
EXECUTIVE SUMMARY
Salt Lake City, as Utah’s economic, cultural, and political hub, has and continues to
experience strong population growth. Investments in housing, education, and
commercial infrastructure are fueling economic expansion, population growth, and
tourism. Along with the benefits of such growth come challenges: air pollution, traffic,
energy consumption, water supply, stormwater management, and pressures on open
space and agriculture among others. Meeting these challenges responsibly is at the
heart of the city’s desire to maintain a high quality of life for its citizens. Effective
planning and management of energy sources and consumption are keys to growing
responsibly.
Beyond simply meeting challenges, Salt Lake City is committed to continued leadership
in sustainable development. This Energy and Transportation Sustainability Plan (ETSP) has
been developed based on the firm belief that thoughtful planning and solutions can
benefit the financial, physical, and social health of our citizens. It is also embedded in
the notion that we must assess the impacts of our actions.
Based on the first Community Carbon Footprint, this ETSP pursues meaningful
improvements while minimizing unnecessary risk or harm. It also serves as a way to
prioritize actions based on the costs and impacts. The ETSP is guided by data obtained
for the Community Carbon Footprint, which detailed emissions resulting from of all
activities within the city’s boundaries from 2005 to 2009, to create informed and
reasonable strategies for similarly reducing the carbon footprint of the entire community.
The Community Carbon Footprint will serve as a benchmark by which to annually assess
progress in reaching reduction goals.
Salt Lake City is not alone in this effort. Other Utah communities (Park City, Town of Alta),
universities (University of Utah, Westminster College, Salt Lake Community College), and
businesses (Kennecott Utah Copper, Kennecott Land, the Utah Transit Authority) are also
identifying carbon emission reductions as a goal and integrating it into their decision
making and planning.
Salt Lake City requested the participation of a diverse group of well-informed
stakeholders to form the Energy and Carbon Advisory Committee (ECAC,) whose role
was to validate the process for developing the greenhouse gas inventory, establish a
community greenhouse gas reduction goal, and to create strategies for meeting the
city’s carbon reduction goals.
Using the city’s ten key sustainability areas as a starting point, the ECAC and consultants
brainstormed potential strategies. Surveys and conference calls were used to
consolidate and further define the most effective and feasible measures. Once key
strategies were identified, data from similar programs in other communities were used to
create cost, savings, and impact estimates. Where analogous programs could not be
found, estimates were based on conservative assumptions. Details regarding
assumptions and data used to quantify strategies can be found in Appendices B and C.

SALT LAKE CITY ENERGY AND TRANSPORTATION SUSTAINABILITY PLAN
vi
The ECAC established a community goal to reduce emissions 17 percent below 2005
levels by 2020, which is aligned with some proposed federal targets and slightly more
aggressive than the regional goal for the Western Climate Initiative and Park City of 15
percent below 2005 levels by 2020. Utah has established the goal of reducing emissions
to 2005 levels by 2020. As signatories to the American College and University Presidents’
Climate Commitment, the University of Utah, Westminster College, Utah State University,
and Weber State University have committed to achieving climate neutrality as soon as
possible.
Although this ETSP is the city’s first formal step at assessing strategies with respect to their
impact on reducing carbon emissions, it is not the first effort toward sustainable
development and carbon reduction programs, improving the environment, and building
a strong economy.
Figure 1. Business-As-Usual Forecast and Target Scenarios
Salt Lake City joined the U.S. Conference of Mayors Climate Protection Agreement,
committing to strive to meet or exceed the goals of the Kyoto Protocol targets, urge
state and federal government to enact policies and programs to meet or exceed Kyoto
Protocol targets, and urge congress to pass bipartisan greenhouse gas legislation.
Additionally, the Salt Lake City Corporation set a goal of reducing its own emissions by 2
percent per year, reaching an overall reduction of 80 percent below 2005 levels by 2050.
Toward these goals, the city is compiling an operational greenhouse gas inventory and is

SALT LAKE CITY ENERGY AND TRANSPORTATION SUSTAINABILITY PLAN
vii
taking aggressive actions to minimize the carbon intensity of its own operations, including
fleet vehicle emissions, street and traffic lights, building efficiency, energy monitoring,
and the use of renewable energy.
The Division of Sustainability and the Environment has also implemented a host of
programs, incentives, and educational campaigns along with partners throughout the
city that are assessed in this plan alongside newly proposed strategies. Current initiatives
in the Division, as well as other existing practices around the community (such as energy
efficiency programs, efficiency and planning zoning codes, and strategies in place by
other institutions), are expected to reduce emissions over 4 percent below a business-as-
usual scenario by 2020.
The existing activities and strategies presented in this plan achieve a 14 percent
reduction toward the city’s goal of a 17 percent reduction below 2005 levels by 2020.
Many of the strategies are detailed in terms of emissions reductions, costs, and savings by
2020. Not only are they feasible, but also multifaceted, often achieving additional goals
for the community. Each strategy will require an investment but many achieve a net
cost savings in the short term, leading to long-term savings for the community.
Figure 2. Illustration of Energy and Transportation Sustainability Plan
Reaching the carbon emissions goal will mean keeping 1.3 million metric tons carbon
dioxide equivalent (MTCO2e) out of the atmosphere in 2020. It will save residents and
businesses more than $60 million dollars by 2020, while creating greater energy security.

SALT LAKE CITY ENERGY AND TRANSPORTATION SUSTAINABILITY PLAN
viii
Potential co-benefits of these strategies include improved air quality, more transportation
options, less traffic congestion, greater access to cleaner energy, and lower energy
consumption to balance increasing energy costs.

SALT LAKE CITY ENERGY AND TRANSPORTATION SUSTAINABILITY PLAN
1
1 ENERGY, SUSTAINABILITY, AND SALT LAKE CITY
1.1 COMMUNITY GREENHOUSE GAS INVENTORY
The recently completed Community Carbon Footprint revealed that Salt Lake City was
responsible emitting 4.75 million MTCO2e in 2009. Electricity consumption, the single
largest emission source, accounted for 54 percent of the total and natural gas
combustion, the second largest source, accounted for 20 percent. Together these
emissions, which are primarily from the building sector, account for nearly three quarters
(74 percent) of all emissions. The transportation sector made up 24 percent of 2009
emissions, with waste disposal and other sources accounting for less than 1 percent
each. On-road vehicle emissions, resulting largely from the combustion of gasoline,
accounted for 15 percent of the total, while off-road emissions and airline transportation
accounted for 1.9 percent and 7 percent, respectively.
Figure 3. 2009 Community Greenhouse Gas Emissions by Sector
Over 5 years, from 2005 to 2009, per capita emissions of residents declined by over 3
percent, from 27.1 to 26.3 MTCO2e. These numbers are relatively consistent with per
capita estimates for the State of Utah (27 MTCO2e) and national estimates (25 MTCO2e).
Based on new strategies the city, county, nation, and utility providers are putting in
place, it is expected that this downward trend will continue for Salt Lake City.

SALT LAKE CITY ENERGY AND TRANSPORTATION SUSTAINABILITY PLAN
2
1.2 IMPACTS OF CLIMATE CHANGE
Climate change refers to the wide range of impacts resulting from the increase in
accumulated concentrations of greenhouse gases as a result of human activity, primarily
the combustion of fossil fuels and deforestation. Globally, these impacts include
changes in temperature, precipitation, sea level, ice melt, frequency and severity of
storms, and changes to species and habitats. Human health and economies,
depending on ecosystems and the services they provide, are ultimately affected.
In 2007, Utah Governor Huntsman’s Blue Ribbon Advisory Council on Climate Change
(BRAC) summarized the scientific consensus regarding climate change and the likely
impacts on Utah. Based on BRAC’s report, Utah is anticipated to warm more than the
average region worldwide. This will result in a longer growing season and more heat
waves. Middle of the road assumptions predict this will be an 8 degree Fahrenheit
increase by the end of the century, which is roughly the current difference in annual
mean temperature between Salt Lake City and Park City. More frequent and heavy
precipitation events punctuating periods of longer dry spells are anticipated to
accompany the warming.
Reduced snowfall in the surrounding mountains will drastically change the city’s water
supply, storage, and tourism economy. Snowpack and stream flows supply roughly half
of municipal water requirements. Repercussions of changes to patterns of precipitation
resulting from warming for Salt Lake City include lack of water or reduced storage,
increased floods, more forest fires, and less winter tourism. Winter tourism is estimated to
bring in nearly a billion dollars to the state annually and support 18,000 jobs. Other
impacts may include lower stream flows, resulting in more concentrated pollutants;
altered habitat for fisheries; reduced hydropower capacity; and less water for irrigation,
recreation, and agriculture.
1.3 POTENTIAL CO-BENEFITS OF ADDRESSING ENERGY CONSUMPTION
AND CLIMATE CHANGE
Reducing carbon emissions has benefits beyond mitigating global climate change that
may be more immediate and tangible to many in the community. Perhaps most
notably, reducing greenhouse gas emissions will improve air quality. To the contrary, not
addressing the problem will exacerbate current air quality issues. Ground-level ozone,
known as smog, increases with warmer temperatures and decreased rainfall leads to
higher levels of particulate matter (PM). Both ozone and PM are linked to respiratory
disorders. In 2009, the American Lung Association ranked Salt Lake City the 6th most
polluted city in terms of short-term particulate pollution.
Additional benefits to lowering the city’s reliance on carbon-intensive energy and
transportation include greater energy security, strengthening the local economy, less
volatile energy costs, reduced vulnerability to federal and state energy regulations, and
water security. Protecting the climate also minimizes a range of potential impacts, such

SALT LAKE CITY ENERGY AND TRANSPORTATION SUSTAINABILITY PLAN
3
as forest fires, extreme weather events, insect outbreaks, climate-sensitive diseases, and
agricultural impacts to which response or adaptation could be very costly.
1.4 ADAPTATION
The primary purpose of this ETSP is to identify strategies for reducing energy consumption
and mitigating climate change, thereby guiding the city toward its carbon reduction
goal. The impacts of climate change, however, are already being realized. While
minimizing the effects of climate change is essential, it is crucial to simultaneously adapt
to observed changes and those that are predicted with high certainty. This plan,
therefore, includes an overview of anticipated and observed impacts and goals for
adapting to anticipated climate changes.

SALT LAKE CITY ENERGY AND TRANSPORTATION SUSTAINABILITY PLAN
4
2 FORECAST AND TARGETS
2.1 FORECAST OF GREENHOUSE GAS EMISSIONS
Based on the results of the Community Carbon Footprint (2005-2009) a business-as-usual
scenario forecasts emissions of 5.3 million MTCO2e in 2020. This scenario is based on a
number of assumptions:
One to 1.4 percent growth per year in emissions, depending on source, based on
projected population growth for Salt Lake City
All existing circumstances from today (e.g., energy intensity in buildings and current
vehicle use patterns) continue until 2020
Impacts of technology improvements, existing or planned practices in the
community to reduce energy consumption, and changing growth patterns not
accounted for
2.2 TARGET FOR REDUCING GREENHOUSE GAS EMISSIONS
Salt Lake City is pursuing a target to reduce emissions 17 percent below 2005 levels by
2020, excluding emissions from air travel. This is equivalent to reducing emissions by 26
percent over projected emissions in 2020. This target was selected by the ECAC based
on analysis of the Community Carbon Footprint, consideration of similar regional and
national targets, and the potential reductions that can be achieved by existing practices
and the strategies proposed in this plan. The Salt Lake City Corporation’s aggressive goal
to reduce emissions 2 percent per year, reaching an overall reduction of 80 percent
below 2005 levels by 2050, is included in the community goal.
The ECAC elected to exclude air travel emissions from the target because these
emissions are largely outside of the influence of the community to reduce in a
meaningful way without negatively impacting tourism and the economy. Emissions from
Salt Lake City International Airport, including the buildings and ground operations, are still
included.
For comparison, in 2007 Utah joined the Western Climate Initiative, a comprehensive
initiative for reducing regional greenhouse gas emissions to 15 percent below 2005 levels
by 2020. The initiative also intends to encourage investment in and development of
clean energy technologies, create green jobs, and protect public health. Toward these
goals, the state inventoried its greenhouse gas emissions, established the Blue Ribbon
Advisory Council on Climate Change (which, in October of 2007, released a report
containing 72 policy recommendations for reducing emissions), and set a voluntary
carbon reduction goal of reaching 2005 emissions by 2020.
Park City recently set the goal of reducing emissions 15 percent below 2005 levels by
2020. Similar to Salt Lake City’s efforts, Park City completed a greenhouse gas emissions

SALT LAKE CITY ENERGY AND TRANSPORTATION SUSTAINABILITY PLAN
5
inventory and an action plan comprised of strategies in various sectors that will allow the
city to reach that goal.
Figure 4. Business-As-Usual Forecast and Target Scenarios
As signatories to the American College and University Presidents’ Climate Commitment,
the University of Utah, Westminster College, Utah State University, and Weber State
University have committed to completing a greenhouse gas inventory; setting a target
date and interim milestones for achieving climate neutrality; and taking immediate steps
to reduce greenhouse gas emissions, integrate sustainability into the curriculum, and
make action plans, inventories, and progress reports publicly available.
These simultaneous efforts by municipalities, institutions, businesses, and other
organizations will make it easier for every organization to reach its goals and collectively
minimize the impacts of climate change, air and water pollution, traffic congestion, and
other negative impacts that accompany a business-as-usual energy path. It should also
spur increased development of cleaner energy in the region.

SALT LAKE CITY ENERGY AND TRANSPORTATION SUSTAINABILITY PLAN
6
3 ENERGY AND TRANSPORTATION SUSTAINABILITY
PLAN FRAMEWORK
3.1 RELATIONSHIP TO BROADER
SUSTAINABILITY
The ETSP is one component of Salt Lake City’s
broader Sustainable Salt Lake vision that
addresses the 10 topic areas depicted in
Figure 5. The ETSP specifically deals with the
topics of Energy and Transportation and
Mobility through their shared impact of
greenhouse gas emissions. While the ETSP
focuses on these two topic areas, it has
complimentary benefits with many of the
other topics, including Climate Change and
Air Quality.
3.2 PROCESS
Salt Lake City Corporation requested the
participation of a diverse group of well-
informed stakeholders to form the ECAC to
validate the process for developing the
greenhouse gas inventory as well as to
establish reduction targets and create strategies for meeting those targets. Members
represented the interests of a broad group of organizations, but were also asked to
provide input as members of the community.
Existing activities in the Energy and Transportation and Mobility topic areas were
identified. The ECAC then brainstormed opportunities for each topic and developed a
list of strategies to address gaps between current programs and best practices in other
communities. Through three meetings and a series of conference calls, the ECAC
provided feedback to further refine strategies and identify how to best implement them.
Similar programs in other communities were identified and data regarding costs, savings,
impacts, benefits, scale, and approach were gleaned from the results. Using
conservative assumptions based on these other programs, cost, savings, and impact
were estimated for implementing these strategies in Salt Lake City.
Figure 5. Sustainability Topics

SALT LAKE CITY ENERGY AND TRANSPORTATION SUSTAINABILITY PLAN
7
3.3 STRATEGY IDENTIFICATION
This ETSP presents strategies for energy conservation and renewable
energy and transportation and mobility. Although strategies are
discussed separately, their interdependency should not be
overlooked. Transportation demand and opportunities for greater
efficiency, for instance, are highly dependent on building density
and diversity. Planning, zoning, and technology drive the transit,
parking, biking, walking, and even alternative fueling options.
Beyond the direct use of energy, the information and opportunities
available for citizens to realize and reduce the environmental
impacts of their lifestyle while improving their health and security will
most often create synergies between approaches. Growing and
producing food locally reduces the transportation demand of
imported products, saves money, empowers and nourishes citizens,
creates food security, and supports the local economy. A well-
managed urban forestry program helps ensure clean air and water,
reduces the economic and ecological impact of stormwater run-off,
increases property values and neighborhood aesthetics, creates
habitat, provides local food sources, and improves safety through
lowering automobile speeds. It was essential in this plan to create
distinct approaches to address Energy and Transportation topics for
their most direct impacts, but it does not lessen the amplified effect
they can have if implemented in concert with other sustainability
efforts.
3.4 FRAMEWORK
The organization of this ETSP has been alluded to in previous sections
and is fully described here and illustrated in Figure 2. The ECAC
began with an energy and greenhouse gas emissions inventory for
the years 2005 through 2009, represented in the figure below as
actual emissions. A business-as-usual forecast was then developed,
based on the approach described in Section Forecast of
Greenhouse Gas Emissions2.1, to serve as a benchmark for the
energy and sustainability strategies proposed in the ETSP. The ECAC
then took stock of existing practices in the community to estimate
the long-term benefits of existing energy efficiency, conservation,
renewable energy, and transportation programs. This ETSP then
elaborates on additional proposed strategies, aggressive proposed
strategies, and strategies beyond Salt Lake City’s direct control to
advance the Salt Lake City community toward the proposed target
of a 17 percent reduction under 2005 emissions by 2020.
ENERGY AND CARBON
ADVISORY COMMITTEE
INVITED ORGANIZATIONS
_____________________________
CH2M Hill
Utah Department of
Environmental Quality (DEQ)
Utah DEQ Division of Air Quality
Economic Development
Corporation Utah
Envision Utah
Governor's Energy Office
Holland & Hart
Interfaith Power and Light
Interfaith Roundtable
Questar Gas
Rocky Mountain Power
Salt Lake Chamber of
Commerce
Salt Lake City International
Airport
Salt Lake Community College
Salt Lake Convention & Visitors
Bureau
Salt Lake County
Salt Lake County Mayor’s Office
Salt Lake School District
Salt Lake City Transportation
Division
Salt Lake City Utilities
Department
State Energy Office
University of Utah
Urban Utah Homes & Real Estate
US Green Building Council
Utah Transit Authority
Utah Clean Cities
Utah Clean Energy
Varian Medical Systems
Wasatch Front Regional Council
Westminster College

SALT LAKE CITY ENERGY AND TRANSPORTATION SUSTAINABILITY PLAN
8
Figure 6. Illustration of Energy and Transportation Sustainability Plan
3.5 EXISTING PRACTICES
The community of Salt Lake City, including individuals, businesses, institutions, non-profits,
utilities, and governmental agencies, has already undertaken efforts that will reduce
energy consumption and greenhouse gas emissions between now and 2020. Table 1
summarizes estimated benefits from some of these practices. The list of practices is not
exclusive and insufficient data were available to estimate benefits for some known
programs such as Idle Free Utah, Clear the Air Challenge, asphalt “warm mix”, home
repair program, expedited green building plan reviews, and Questar demand side
management programs. The existing practices for which reductions could be estimated
are projected to reduce emissions by 4.7 percent below the business-as-usual in 2020. A
26 percent total reduction is required in order to achieve the goal of reducing emissions
to 17 percent below 2005 levels.
A number of entities in the Salt Lake City community are purchasing renewable energy
credits (RECs) and/or carbon offsets, including the city’s purchase of offsets for air travel
through the Pax Natura program, resident and business participation in the Rocky
Mountain Power Blue Sky Program, and REC purchases by a number of other major
institutions.

SALT LAKE CITY ENERGY AND TRANSPORTATION SUSTAINABILITY PLAN
9
Since there is still ambiguity on how to fairly account for these instruments and to assure
that no double counting occurs, the benefits of these purchases are not included toward
Salt Lake City’s emission reduction target. Furthermore, this ETSP is intended to focus on
activities that occur in Salt Lake City and bring associated co-benefits to the community,
and RECs may do neither.
However, the importance of these purchases as evidence of the community’s values
and financial commitment to promoting renewable energy and reducing greenhouse
gas emissions is noteworthy. In total, these purchases could account for an emission
reduction of about 48,000 MTCO2e or 1 percent of projected emissions in 2020.

SALT LAKE CITY ENERGY AND TRANSPORTATION SUSTAINABILITY PLAN
10
Table 1. Existing Practices to Mitigate Energy Consumption and Greenhouse Gas Emissions
Existing Practices
2020 Estimated Greenhouse Gas Reduction (MTCO2e) Source
Energy Efficiency Policy Development and
Planning and the Salt Lake City
Corporation Reduction Goal 15,000
Energy Efficiency and Conservation
Block Grant (EECBG) Activity Worksheet
Energy Efficiency Outreach and Education 1,000 EECBG Activity Worksheet
e2-Revolving Loan Fund 6,000
Salt Lake City Corporation (originally
EECBG)
Traffic Signal Management 300 EECBG Activity Worksheet
Bicycle Transit Center 100 EECBG Activity Worksheet
Energy Efficiency and Conservation
Zoning and Planning Codes 16,000 EECBG Activity Worksheet
Bike Lanes 20 EECBG Activity Worksheet
Traffic Signal and Street Lighting Program 1,000 EECBG Activity Worksheet
Renewable Energy Installation at Salt lake
City Fire Station #8 10 EECBG Activity Worksheet
Solar Salt Lake Project 11,000
Roughly 1megawatt (MW) currently
installed and more than 250 kilowatts
(kW) in Salt Lake City. With 2.6MW Salt
Lake Palace project, assume Salt Lake
City will eventually have 10MW of
photovoltaics by 2020.
Rocky Mountain Power Efficiency
Programs 111,000
Estimate based on 80% annual retention
of savings from previous years
Goals Set by Other Institutions 74,000
University of Utah and Westminster
College climate neutral targets
Residential Solid Waste Diversion
Programs 2,000
Projected diversion from existing
residential diversion programs
Total of Existing Mitigation Practices* 237,000
Percentage of Projected (business-as-usual) Emissions in 2020 4.7%
*Values may not sum due to rounding.

SALT LAKE CITY ENERGY AND TRANSPORTATION SUSTAINABILITY PLAN
11
4 ENERGY AND TRANSPORTATION SUSTAINABILITY
PLAN
This ETSP presents strategies for energy conservation and renewable energy and
transportation and mobility.
Some of the high priority strategies proposed are presented with implementation paths –
the first key steps to getting the strategies started; many are evaluated for emission
reduction potential, costs, and benefits; and still others are presented as supporting
strategies. Salt Lake City is currently beginning the process of facilitating implementation
sub-committees for six high priority strategies:
Energy
o Commercial Building Re-commissioning
o Targeted Energy Information for Consumers
o Voluntary Adoption of Above-Code Energy Practices in New Construction
Transportation
o Development of Compact, Transit-Supportive, Mixed-Use Urban Form
o Management of Parking Supply Downtown to Encourage Alternatives to
Driving
o Commuter Reduction Programs
SALT LAKE CITY ENERGY AND TRANSPORTATION SUSTAINABILITY PLAN
12
Table 2 summarizes potential progress toward the reduction target with contributions of
existing practices, proposed strategies with average and aggressive implementations,
and the impact of strategies that are beyond Salt Lake City’s control. Existing practices
and the strategies proposed achieve a 4.2 percent reduction under 2005 emissions. The
aggressive implementation case and strategies beyond the direct control of Salt Lake
City (federal standards for vehicle fuel efficiency and electricity supply) bring the
reduction to 14.2 percent toward the 17 percent target. There is still a gap of about 3
percent or 216,000 MTCO2e.

SALT LAKE CITY ENERGY AND TRANSPORTATION SUSTAINABILITY PLAN
13
Table 2. Plan Potential to Address Target
Summary of Existing Practices and Proposed Strategies
2020 Greenhouse Gas Reduction (MTCO2e)
Percentage of Emissions under 2005
Percentage of Business-as-Usual Emissions in 2020
Existing Practices 237,000 3.1% 4.7%
Proposed Strategies (average implementation) 92,000 1.2% 1.8%
Sub total 329,000 4.2% 6.6%
Proposed Strategies
(additional for aggressive implementation) 169,000 2.2% 3.4%
Strategies Beyond Salt Lake City Control 604,000 7.8% 12.1%
Grand total 1,102,000 14.2% 22.1%
Target (17% below 2005) 1,318,000 17.0% 26.4%
The size of the gap between the reduction potential and the target is dependent on the
growth forecast. Under the projections used for the ETSP in the business-as-usual
scenario, Salt Lake City achieves about 84 percent of the reduction required to meet the
target. Table 3 presents the gap between reduction potential and target based on
various growth projections.
Table 3. Plan Sensitivity to Growth Assumptions
Emissions Growth Scenario
2020
Reduction
from All
Strategies
(MTCO2e)
2020
Target
Reduction
(MTCO2e)
Percentage
of Target
Achieved
0.5% per year, all emission sources 1,076,000 1,012,000 106%
1.02% per year, 1.4% for on-road transportation
(business-as-usual scenario) 1,102,000 1,318,000 84%
1.5% per year, all emission sources 1,125,000 1,551,000 73%
2.0% per year, all emission sources 1,153,000 1,841,000 63%

SALT LAKE CITY ENERGY AND TRANSPORTATION SUSTAINABILITY PLAN
14
4.1 ENERGY CONSERVATION AND RENEWABLE ENERGY
Energy efficiency and conservation are often the most cost effective approaches for
reducing emissions and costs associated with energy consumption. Residents save
money and are more comfortable in their homes or work and businesses reduce
operating costs, maximizing profitability. Efficiency and conservation span both the
technology and the behavioral aspects of how a community consumes energy, and the
following strategies seek to address both aspects.
Utah is fortunate to be rich in renewable energy sources (solar, wind, geothermal) that
create viable options for a wide range of applications and scales. As the cost of
traditional energy sources increase and the technology and markets reduce the cost of
renewables, these opportunities are becoming increasingly relevant for the Salt Lake City
community.
Energy conservation and renewable energy projects can be applied to existing buildings
and infrastructure as well as to the operation of new high efficiency buildings. Because
the building sector is responsible for nearly three quarters of all emissions in the City and
buildings operate for many decades, it is imperative that both existing and new buildings
be targeted. Integrating these concepts into the planning phase of a project is a far
more cost effective way to achieve energy savings that will persist for decades to come.
Energy conservation and renewable energy strategies are detailed in the following section
and were quantified as accurately as possible with respect to cost, savings, and greenhouse
gas reductions through 2020 in Table 4. Details regarding assumptions can be found in
Appendix B. The table presents a range of costs and benefits from an average level of
implementation through an aggressive level of implementation. All values are estimates
based on the performance of similar programs in other communities, or research and
localized assumptions.

SALT LAKE CITY ENERGY AND TRANSPORTATION SUSTAINABILITY PLAN
15
Table 4. Energy Conservation and Renewable Energy Strategies
Strategies1
Average – Aggressive Performance
2020 Estimated Greenhouse Gas Reduction (MTCO2e)
Cumulative Greenhouse Gas Reduction by 2020 (MTCO2e)
Cumulative Cost Savings by 2020 (Million $)
Cumulative Cost to Implement by 2020 (Million $)
Cost Effectiveness by 2020 ($/MTCO2e)
1
Energy Efficiency Assessments
3,000 -
18,000
23,000 -
125,000 $2.7 - $15.0
$14.4 -
$75.0 $510 - $480
Re-commissioning of Small Commercial Buildings
11,000 -
56,000
90,000 -
448,000 $8.3 - $41.4 $7.3 - $36.5 $(10) - $(10)
Re-commissioning of Large Commercial Buildings
25,000 -
49,000
173,000 -
345,000
$19.9 -
$39.8
$12.1 -
$24.3 $(40) - $(40)
Direct Implementation Support for Low-income Residents
3,000 -
7,000
18,000 -
44,000 $2.2 - $5.4 $6.8 - $16.9 $260 - $260
Support for Large Institutions
1,000 -
1,000
8,000 -
8,000 $0.7 - $0.7 $0.7 - $0.7 $10 - $10
After Hours Lighting Control Program
4,000 -
12,000
41,000 -
128,000 $4.8 - $14.8 $6.4 - $3.2 $40 - $(90)
Code Modification 9,000 -
9,000
52,000 -
52,000 $6.4 - $6.4 $4.6 - $4.6 $(40) - $(40)
Voluntary Above-code Adoption
5,000 -
11,000
33,000 -
65,000 $3.9 - $7.8
$13.4 -
$24.5 $290 - $260
Targeted Energy Information for Consumers
5,000 -
24,000
57,000 -
250,000 $7.0 - $30.8 $2.8 - $6.5 $(70) - $(100)
Municipal Opportunities in Renewable Energy
3,000 -
14,000
32,000 -
158,000 $2.1 - $10.4 $4.6 - $23.0 $80 - $80
Biofuels on Unused City Lands
1,000 -
1,000
14,000 -
14,000 $3.2 - $3.2 $2.6 - $2.6 $(40) - $(40)
1Cost Effectiveness = [(Cumulative Cost - Cumulative Savings)/Cumulative GHG Reduction]; negative
equals savings

SALT LAKE CITY ENERGY AND TRANSPORTATION SUSTAINABILITY PLAN
16
4.1.1 Residential, Commercial, and Institutional Buildings
Priority Evaluated Strategies
Re-commissioning of Small Commercial
Buildings
Rocky Mountain Power currently offers a re-
commissioning, or building tune-up, program for
larger buildings (larger than 20,000 square feet).
Offering a similar program for smaller
commercial buildings can greatly expand the
audience for this energy saving process.
Some considerations for this program identified
by the ECAC include the following:
Upgrades for low-hanging opportunities
should be included in the process.
Water conservation opportunities can
also be addressed.
ENERGY STAR’s Portfolio Manager may be
a useful tool for collecting and sharing
information.
The process should be accessible to non-
profits.
Re-commissioning Schedule for Larger
Commercial Buildings
Re-commissioning for larger commercial
buildings (greater than 50,000 square feet) on a
regular schedule (e.g., every 10 years).
Key Parties
Rocky Mountain Power
Questar
Utah State Energy Program (USEP)
Chamber of Commerce
Salt Lake City Corporation
Contractors
Related Efforts
Existing Rocky Mountain Power program
for larger buildings
Questar benchmarking program
Financing mechanism, city may be able
to assist
Recommended Actions
Continue dialogue between Rocky
Mountain Power, Questar, and city
through Demand Side Management
Advisory Group. Create coherent
outreach and advertising with support
structure to guide prospective
participants through process (city).
Investigate opportunities to pilot through
Utah Building Energy Efficiency Strategies
SALT LAKE CITY ENERGY AND TRANSPORTATION SUSTAINABILITY PLAN
17
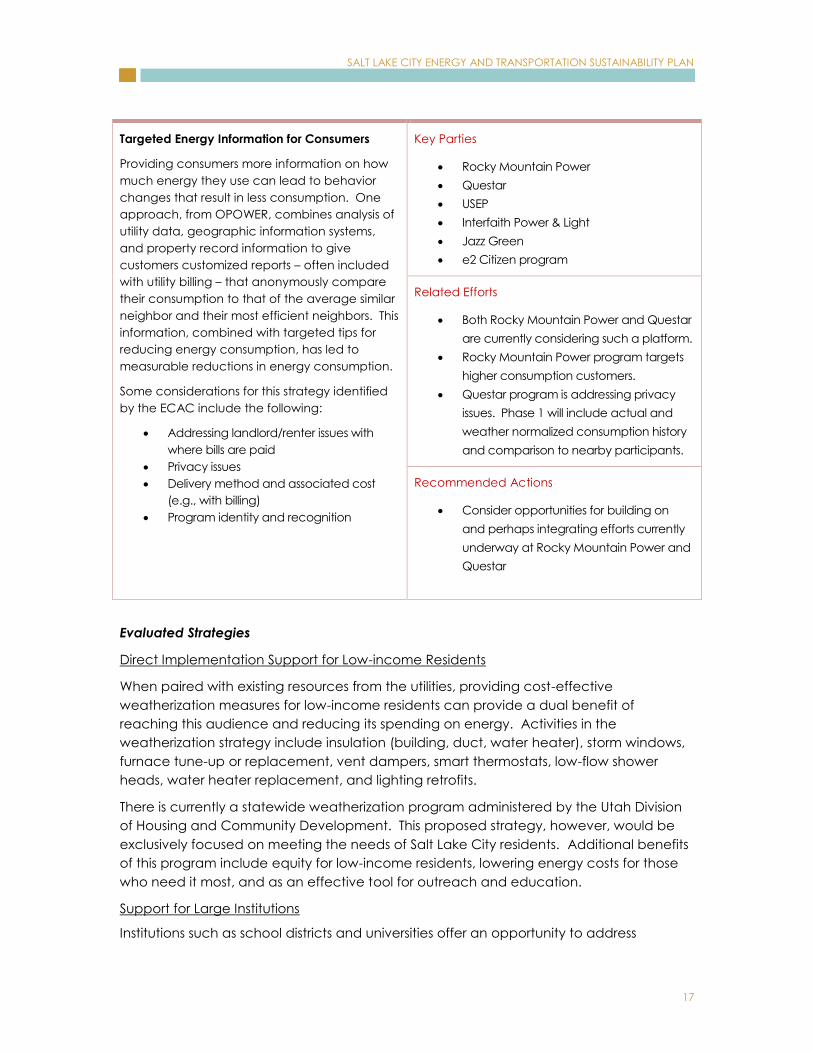
Targeted Energy Information for Consumers
Providing consumers more information on how
much energy they use can lead to behavior
changes that result in less consumption. One
approach, from OPOWER, combines analysis of
utility data, geographic information systems,
and property record information to give
customers customized reports – often included
with utility billing – that anonymously compare
their consumption to that of the average similar
neighbor and their most efficient neighbors. This
information, combined with targeted tips for
reducing energy consumption, has led to
measurable reductions in energy consumption.
Some considerations for this strategy identified
by the ECAC include the following:
Addressing landlord/renter issues with
where bills are paid
Privacy issues
Delivery method and associated cost
(e.g., with billing)
Program identity and recognition
Key Parties
Rocky Mountain Power
Questar
USEP
Interfaith Power & Light
Jazz Green
e2 Citizen program
Related Efforts
Both Rocky Mountain Power and Questar
are currently considering such a platform.
Rocky Mountain Power program targets
higher consumption customers.
Questar program is addressing privacy
issues. Phase 1 will include actual and
weather normalized consumption history
and comparison to nearby participants.
Recommended Actions
Consider opportunities for building on
and perhaps integrating efforts currently
underway at Rocky Mountain Power and
Questar
Evaluated Strategies
Direct Implementation Support for Low-income Residents
When paired with existing resources from the utilities, providing cost-effective
weatherization measures for low-income residents can provide a dual benefit of
reaching this audience and reducing its spending on energy. Activities in the
weatherization strategy include insulation (building, duct, water heater), storm windows,
furnace tune-up or replacement, vent dampers, smart thermostats, low-flow shower
heads, water heater replacement, and lighting retrofits.
There is currently a statewide weatherization program administered by the Utah Division
of Housing and Community Development. This proposed strategy, however, would be
exclusively focused on meeting the needs of Salt Lake City residents. Additional benefits
of this program include equity for low-income residents, lowering energy costs for those
who need it most, and as an effective tool for outreach and education.
Support for Large Institutions
Institutions such as school districts and universities offer an opportunity to address

SALT LAKE CITY ENERGY AND TRANSPORTATION SUSTAINABILITY PLAN
18
efficiency in large quantities of building space under fairly centralized management.
Often, these institutions are already very active in energy efficiency but may benefit from
building better connections with utility rebate programs and grant opportunities.
Facilitating these connections and supporting institutions in their energy efficiency efforts
can be a cost effective way to achieve greater energy efficiency. Some institutions in
Salt Lake City feel this relationship is already well developed while others still see potential
benefits.
Analysis for this strategy includes support for 36 schools in the Salt Lake City School District.
Reducing energy costs for schools frees operating budgets to be used more directly
toward education. Additionally, it creates opportunities for education and outreach to
youth. The impact can also be greatly increased if expanded to other institutions
beyond the Salt Lake City School District, such as private schools, religious organizations,
and hospitals.
After Hours Lighting Control Program
This strategy would require businesses to turn off internal and external lights for a period at
night after business hours. This can be accomplished by installing timers or other
automated control or done manually by building owners/occupants. Security, access,
circulation, and lights needed for safety would be exempted. This strategy is based on a
code modification and there are a number of similar concepts emerging in new green
building codes. The enforcement mechanism would likely be on a complaint basis.
Supporting Strategies
The following strategies support the goal of greater efficiency in the building sector, but
their direct impact could not be assessed. Either data were unavailable or they do not
directly lead to emissions reductions of their own. Nonetheless, these are important
approaches for maximizing the effectiveness of the strategies above.
Enforcement of Existing Building Energy Codes
Improving the enforcement of existing energy codes is an opportunity to get the best
possible performance out of standards that have already been adopted. Issues related
to duct sizing, sealing, and window types can often result in energy savings if addressed
through code compliance. Utah is participating in the Department of Energy's
Compliance Pilot Study to develop a roadmap for states to achieve 90 percent
compliance with International Energy Conservation Code (IECC) 2009.
Commercial Buildings Benchmarking
A program that incentivizes or requires commercial buildings to use a benchmarking tool,
such as ENERGY STAR’s Portfolio Manager,
can increase awareness of energy consumption and relative performance. It has been
demonstrated that information regarding energy use can be very a very effective tool in
energy conservation.
Assessment Follow-up and Implementation Support
This can be a pivotal, and often missing, aspect of a successful energy efficiency

SALT LAKE CITY ENERGY AND TRANSPORTATION SUSTAINABILITY PLAN
19
program. Connecting the enthusiasm of a participant and the knowledge gained
through the assessment process with support in pursuing bids, identifying contractors,
coordinating work, and applying for incentives can increase implementation rates over
an assessment-only approach. Furthermore, an implementation support program that
bypasses the assessment process and focuses directly on supporting business in
implementing more common opportunities (e.g., lighting retrofits) may be an effective
complement to expanding assessment resources. Both residential and commercial
sectors can be included. This strategy supports implementation of recommendations
from assessments in other programs but does not result in a direct impact on its own.
Voluntary Consumption Labeling at Sale
An effort to increase the energy consumption information available to residential and
commercial customers at the time-of-sale can help inform buyers and drive sellers to
increase the efficiency of their properties. This applies to energy and water efficiency
opportunities.
Financial Incentives
Implementation of the above strategies should be closely coordinated with the utilities,
which already have significant incentives, to assure that their programs are prepared for
the increased demand.
Furthermore, additional financial assistance, such as the city’s forthcoming e2 Revolving
Loan Fund, can further increase participation in efficiency activities.
4.1.2 Green Building
Momentum in green building is growing throughout the state and particularly in Salt Lake
City. Above-code commitments have been made by the state for new or renovated
buildings and by the Salt Lake City Corporation for city buildings or public sector buildings
receiving funding from the city. Demand for more energy efficient and environmentally
sensitive design is on the rise in the private sector as well, primarily driven by the U.S.
Green Building Council’s (USGBC) Leadership in Energy and Environmental Design (LEED)
rating system and ENERGY STAR Homes.
The Utah Chapter of the USGBC organizes educational programs and events aimed at
increasing knowledge and demand in the local building sector. It also provides access
to additional resources and opportunities through its website. Annually, the city is host to
the Salt Lake Sustainable Building Conference, a forum to encourage a dialogue about
regional green building topics and provide educational opportunities for a wide range of
building professionals.

SALT LAKE CITY ENERGY AND TRANSPORTATION SUSTAINABILITY PLAN
20
Priority Evaluated Strategies
Voluntary Above-code Adoption
Additional voluntary adoption of above-code
or third-party green building certifications, such
as LEED and Home Performance with ENERGY
STAR, can be encouraged through additional
incentives. One path for incentives is to reduce
permitting fees and provide additional
outreach regarding expedited permit reviews
for green building.
Key Parties
Utah Chapter of the USGBC
USEP
Local home builders associations
Progressive residential and commercial
builders
Related Efforts
Existing outreach and education by
USGBC
Recommended Actions
Promote and differentiate green builders.
Generate case studies of green buildings
and owners.
Provide workshops for the building
community, including designers, builders,
trades, and inspectors.
Evaluated Strategies
Code Modification
Though jurisdictions in Utah can modify their local building codes with approval from the
Uniform Building Code Commission and the legislature, this may not be a feasible
approach for Salt Lake City to take unilaterally. However, Salt Lake City can continue to
actively work with other organizations to support the adoption of more stringent codes at
the state level. Adjustments to building codes that can lead to greater efficiency and
lower operating costs include the following:
Adopting the 2009 IECC for residential buildings. The 2009 IECC was just made
effective for commercial buildings on July 1, 2010
Adopting green building codes, such as National Green Building Standard and
International Green Construction Code
Adopting amendments to existing code that require elements of green building
(e.g., green or cool roofs, increased insulation, improved sealing, higher
efficiency equipment)

SALT LAKE CITY ENERGY AND TRANSPORTATION SUSTAINABILITY PLAN
21
4.1.3 Renewable Energy in the Community
Since the consumption of electricity results in about 54 percent of the greenhouse gas
emissions for the Salt Lake City community, reducing the carbon intensity of this
consumed electricity is an enormous opportunity for the city to reduce emissions.
Introducing additional renewable energy generation both at the utility and local scales is
one approach to reducing these emissions.
Evaluated Strategies
Reduced Carbon Intensity in Electricity Supply
This strategy considers that there are a range of approaches for the Salt Lake City
community to have more influence on its electrical supply, including current discussions
with Rocky Mountain Power on ways to direct funding to community projects, additional
incentives for renewable energy, third-party financing and power purchase agreements,
and others.
As a community served by an investor-owned utility (IOU), Rocky Mountain Power, Salt
Lake City does not have significant direct influence over the energy resources that
contribute to its electricity supply. However, in March 2008, Utah enacted The Energy
Resource and Carbon Emission Reduction Initiative (S.B. 2020) that requires IOUs and
other utilities to use eligible renewables to account for 20 percent of their 2025 adjusted
retail electricity sales to the extent that renewables are cost effective.
Because of this and other internal initiatives, Rocky Mountain Power has increased the
use of less carbon-intensive natural gas and wind resources in its generation mix.
Greenhouse gas emissions intensity per unit of electricity delivered dropped by 5.7
percent between 2005 and 2009. Rocky Mountain Power’s Integrated Resource Plan
indicates the potential for ongoing decreases in carbon intensity with a 15 percent
reduction by 2018 as part of the preferred portfolio scenario.
This strategy assumes that a trend of lower carbon intensity in the electricity supply will
continue1.
1 The emission factor applied in the GHG Inventory and this ETSP is a California Climate
Action Registry (CCAR) verified efficiency metric for PacifiCorp, which operates as Rocky
Mountain Power in Utah. This metric includes wind energy generated by Rocky Mountain
Power for which RECs are subsequently sold. In accordance with guidance from CCAR
and The Climate Registry (TCR), consumers of these RECs are not to claim a reduction in
their own emissions resulting from the REC purchase. Therefore, emission reductions
should not be double counted.
SALT LAKE CITY ENERGY AND TRANSPORTATION SUSTAINABILITY PLAN
22
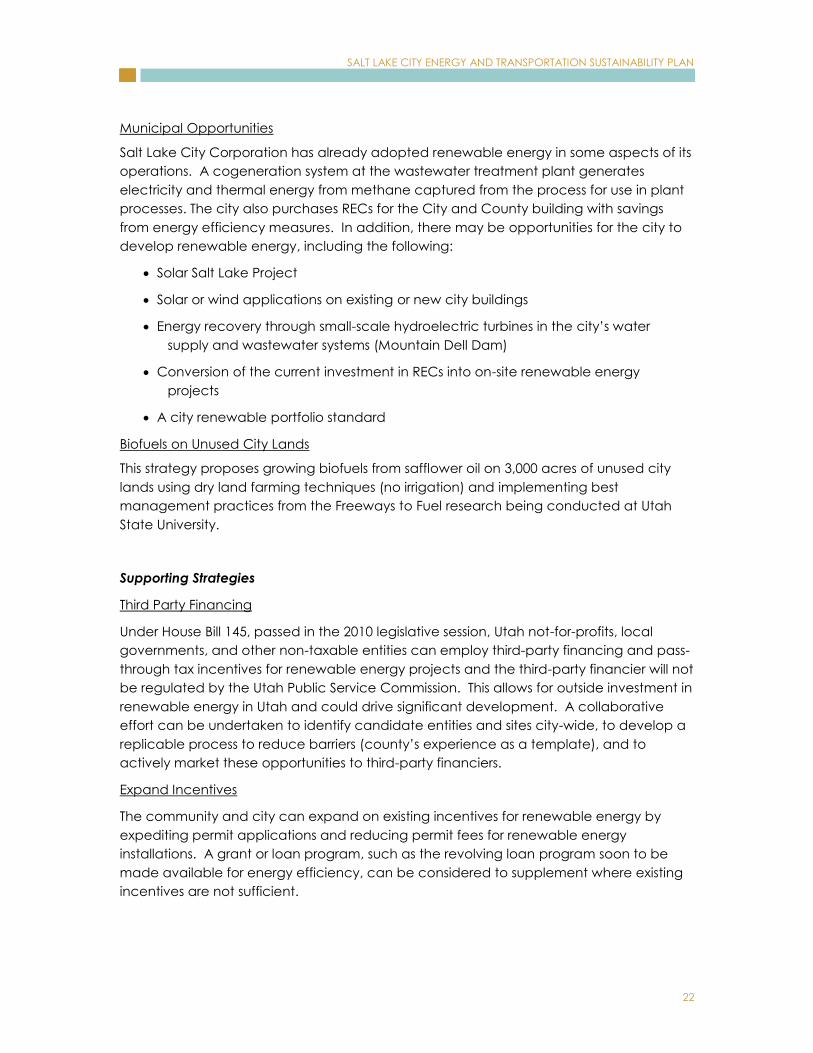
Municipal Opportunities
Salt Lake City Corporation has already adopted renewable energy in some aspects of its
operations. A cogeneration system at the wastewater treatment plant generates
electricity and thermal energy from methane captured from the process for use in plant
processes. The city also purchases RECs for the City and County building with savings
from energy efficiency measures. In addition, there may be opportunities for the city to
develop renewable energy, including the following:
Solar Salt Lake Project
Solar or wind applications on existing or new city buildings
Energy recovery through small-scale hydroelectric turbines in the city’s water
supply and wastewater systems (Mountain Dell Dam)
Conversion of the current investment in RECs into on-site renewable energy
projects
A city renewable portfolio standard
Biofuels on Unused City Lands
This strategy proposes growing biofuels from safflower oil on 3,000 acres of unused city
lands using dry land farming techniques (no irrigation) and implementing best
management practices from the Freeways to Fuel research being conducted at Utah
State University.
Supporting Strategies
Third Party Financing
Under House Bill 145, passed in the 2010 legislative session, Utah not-for-profits, local
governments, and other non-taxable entities can employ third-party financing and pass-
through tax incentives for renewable energy projects and the third-party financier will not
be regulated by the Utah Public Service Commission. This allows for outside investment in
renewable energy in Utah and could drive significant development. A collaborative
effort can be undertaken to identify candidate entities and sites city-wide, to develop a
replicable process to reduce barriers (county’s experience as a template), and to
actively market these opportunities to third-party financiers.
Expand Incentives
The community and city can expand on existing incentives for renewable energy by
expediting permit applications and reducing permit fees for renewable energy
installations. A grant or loan program, such as the revolving loan program soon to be
made available for energy efficiency, can be considered to supplement where existing
incentives are not sufficient.

SALT LAKE CITY ENERGY AND TRANSPORTATION SUSTAINABILITY PLAN
23
4.2 TRANSPORTATION AND MOBILITY
Reducing transportation related carbon emissions can involve a wide range of strategies,
including shortening the number and length of trips, reducing the carbon intensity of
travel, and incentivizing the most efficient modes of travel. Many strategies can be
implemented immediately, while others such as increasing development density are
longer-term solutions.
People primarily move between buildings: home, work, shopping, entertainment, and
the homes of others. Therefore transportation must be addressed in concert with the
built environment. Increasingly, developments are integrating more transportation
options into design through proximity and access to transit, bike lanes, fueling stations,
car sharing, and shuttles. Pricing and availability for parking are also being more
thoughtfully addressed.
The automobile is the most common form of personal transportation today, but cities
throughout the country are experiencing a renaissance of biking, walking, and transit.
These modes are less expensive and carbon intensive, as well as healthier since exercise
is integrated into daily transportation. These modes also encourage more social
interaction with strangers and a more intimate relationship with the communities in which
people live and work. Such connections, along with simply having more eyes on the
streets, can lead to safer communities.
On-road vehicle transportation accounts for 15 percent of Salt Lake City’s greenhouse
gas emissions (2009) resulting from 1.35 billion vehicle miles. At 7,400 vehicle miles
travelled (VMT) per capita, Salt Lake City is lower per capita than Utah (10,143) or the
larger Salt Lake Metropolitan area (9,339).
The Wasatch Front Regional Council’s Regional Travel Model predicts a 1.4 percent
annual increase in greenhouse gas emissions through 2030 resulting from on-road vehicle
emissions, which includes light rail, commuter rail, and local bus lines.
Salt Lake City has already undertaken a number of efforts to promote demand
management strategies and increase the use of alternative modes to single occupancy
vehicles in an effort to reduce greenhouse gas emissions and improve air quality in the
community. The following table includes a summary of these activities and their
projected benefits in 2020. The table presents a range of benefits from an average level
of implementation through an aggressive level of implementation. All values are
estimates based on the performance of similar programs in other communities, or
research and localized assumptions.

SALT LAKE CITY ENERGY AND TRANSPORTATION SUSTAINABILITY PLAN
24
Table 5. Transportation and Mobility Strategies
Strategies1
Average – Aggressive Performance
2020 Estimated Greenhouse Gas Reduction (MTCO2e)
Cumulative Greenhouse Gas Reduction by 2020 (MTCO2e)
Cumulative Cost Savings by 2020 (Million $)
Cumulative Cost to Implement by 2020 (Million $)
Cost Effectiveness by 2020 ($/MTCO2e)
1
Land Use and
Location: Density,
Diversity, Design
10,000 -
21,000
Neighborhood/Site
Enhancements:
Increase Bike
Infrastructure
1,000 - 3,000
Parking Programs:
Park & Ride,
Cashout,
Unbundled
Parking
4,000 -
10,000
Transportation
Improvements/
Increased Mobility
Options: Last-Mile
Solutions and
Commuter
Reduction
Programs
7,000 -
15,000
1Cost Effectiveness = [(Cumulative Cost - Cumulative Savings)/Cumulative GHG Reduction];
negative equals savings
4.2.1 Land Use and Location
Land use and transportation have a close and dynamic relationship. To achieve many of
the transportation goals Salt Lake City wishes to accomplish, appropriate development
should occur. The beginnings of this land use/transportation focus within the city are
occurring with recent transit-oriented development projects, dense residential projects in
the urban core, and redevelopment in the Sugar House area. A comprehensive vision
for the city would further strengthen the connection between land use and
transportation. To this end, the following strategies are proposed.
SALT LAKE CITY ENERGY AND TRANSPORTATION SUSTAINABILITY PLAN
25
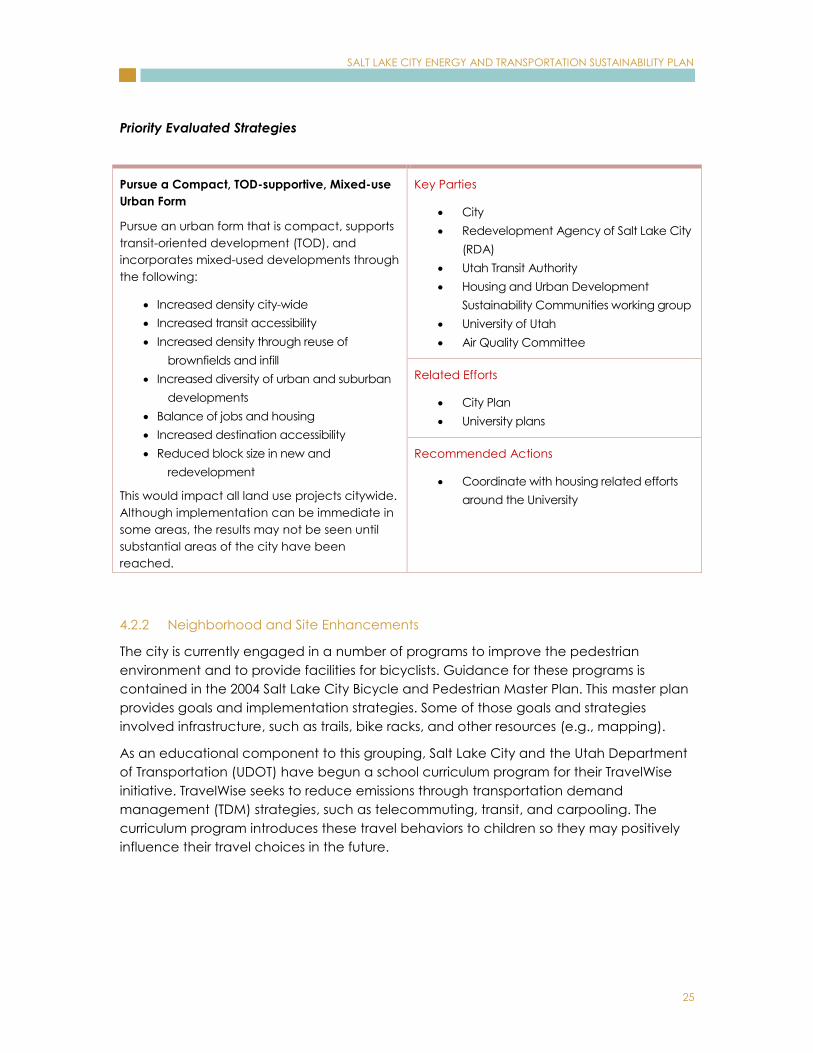
Priority Evaluated Strategies
Pursue a Compact, TOD-supportive, Mixed-use
Urban Form
Pursue an urban form that is compact, supports
transit-oriented development (TOD), and
incorporates mixed-used developments through
the following:
Increased density city-wide
Increased transit accessibility
Increased density through reuse of
brownfields and infill
Increased diversity of urban and suburban
developments
Balance of jobs and housing
Increased destination accessibility
Reduced block size in new and
redevelopment
This would impact all land use projects citywide.
Although implementation can be immediate in
some areas, the results may not be seen until
substantial areas of the city have been
reached.
Key Parties
City
Redevelopment Agency of Salt Lake City
(RDA)
Utah Transit Authority
Housing and Urban Development
Sustainability Communities working group
University of Utah
Air Quality Committee
Related Efforts
City Plan
University plans
Recommended Actions
Coordinate with housing related efforts
around the University
4.2.2 Neighborhood and Site Enhancements
The city is currently engaged in a number of programs to improve the pedestrian
environment and to provide facilities for bicyclists. Guidance for these programs is
contained in the 2004 Salt Lake City Bicycle and Pedestrian Master Plan. This master plan
provides goals and implementation strategies. Some of those goals and strategies
involved infrastructure, such as trails, bike racks, and other resources (e.g., mapping).
As an educational component to this grouping, Salt Lake City and the Utah Department
of Transportation (UDOT) have begun a school curriculum program for their TravelWise
initiative. TravelWise seeks to reduce emissions through transportation demand
management (TDM) strategies, such as telecommuting, transit, and carpooling. The
curriculum program introduces these travel behaviors to children so they may positively
influence their travel choices in the future.

SALT LAKE CITY ENERGY AND TRANSPORTATION SUSTAINABILITY PLAN
26
Evaluated Strategies
Increase Overall Bike Infrastructure
This strategy includes increasing and improving the overall bike infrastructure within the
city through the following methods:
Bicycle Boulevards
o Bicycle boulevards are corridors where the emphasis is on bicycle
mobility. Bicycle mobility is created by reducing delay for bicycles through
reversing stop signs away from the corridor and through applying
necessary bike detectors at signals. Bike boulevards are well-marked as
bicycle routes, have low vehicular volume, and low travel speeds. Often,
they are parallel to high-volume roads or near commercial corridors. Safe
and convenient biking routes encourages biking as a viable mode
alternative.
Land Dedication for Bike Trails
o Land dedication for bike trails sets aside land from development for
guaranteed future bike trails. This can occur through purchase or by
ordinance requiring larger projects to provide for, contribute to, or
dedicate land for the provision of off-site bicycle trails linking the project
to designated bicycle commuting routes.
Bike Signal Detection
o Bike signal detection will help reduce delay for cyclists through detection
of bicycles at intersections. Detector loops can be placed within the
pavement on City streets and paired with a pavement mark to show
cyclists where to stand to be detected.
End-of-Trip Facilities
o End-of-trip facilities encourage the use of bicycling as a viable form of
travel to destinations, especially to work. Often there are no specified
places to store or park bicycles. Bicyclists are often also unable to shower
and change after riding to work and therefore may be disinclined to
commute using bicycles. End-of-trip facilities provide the added
convenience and security needed to encourage bicycle commuting.
One method to address these disincentives is to require new
developments to provide bicycle lockers and showers on site. This can be
accomplished by increasing requirements to the city’s zoning code. The
Bicycle Transit Center at the Intermodal Hub is a good example of an
end-of-trip facility.
Bicycle Accommodations on Transit Vehicles
o Currently, Utah Transit Authority (UTA) allows two bikes per bus and two
bikes per light rail TRAX vehicle. If these spaces are full, bicyclists must wait

SALT LAKE CITY ENERGY AND TRANSPORTATION SUSTAINABILITY PLAN
27
for the next transit vehicle, which can take anywhere from 15 minutes to 1
hour. To encourage bicycling and transit use throughout the city, transit
vehicles should be retrofitted to increase bicycle capacity. Salt Lake City
can encourage UTA to implement such retrofits.
The Bicycle and Pedestrian Master Plan addresses many strategies and implementation
activities that should continue in the city. The strategies listed below can help the city
further build on the master plan’s existing momentum.
Supporting Strategies
Urban Non-motorized Zones
Urban non-motorized zones are areas of the city that are, effectively, pedestrian- and
bicycle-only corridors. Non-motorized zones can be permanent or time-limited.
Suggested corridors for non-motorized zones are Main Street in Downtown and Rio
Grande Street. Other corridors should be considered and pursued. Time-limited non-
motorized zones are often known as “car-free days” and are generally tied to a festival-
like event. These elements encourage non-motorized travel and thus a reduction in VMT.
Non-motorized zones are more effective when applied with multiple design elements.
4.2.3 Parking Programs
The city is actively participating in programs to reduce parking and to prioritize existing
parking for carpools and energy conservative vehicles. An example of one such
program is free metered parking for electric vehicles displaying clean energy license
plates.
The Salt Lake City Zoning Ordinance has a number of exemptions that reduce parking
requirements in certain zones that have pedestrian and bicycle facilities, as well other
appropriate transportation demand management strategies, such as employer-
sponsored public transportation subsidies and off-site parking. Some zones within the city
can supplement off-street parking requirements with available on-street parking.
However, parking throughout the city is determined by the minimum off-street parking
requirements.

SALT LAKE CITY ENERGY AND TRANSPORTATION SUSTAINABILITY PLAN
28
Strategic Management of Parking Supply
Downtown
Pursue a parking strategy city-wide that reduces
parking lots and encourages other forms of
transportation. In many jurisdictions, reducing
parking requirements are thought to have a
beneficial effect on the transportation system.
For example, a worker at an office building
where there is limited parking might be inclined
to take transit or carpool if he/she knows that
there is a limited amount of available parking.
Key Parties
City
RDA
Downtown business community
Chamber of Commerce
Related Efforts
Parking study underway by city
Recommended Actions
Reduce parking requirements by
establishing parking maximums rather
than minimums. Convert current
surface parking to higher uses,
especially along street fronts.
Locate all parking for new developments
at the rear of buildings rather than the
front.
Implement a market-based price
structure for public parking that varies
according to demand (high use
periods would cost more).
Evaluated Strategies
Cashout Program
For many residents and workers in Salt Lake City, parking is provided free of charge. In
other cities, charging for parking has been shown to reduce vehicular use by increasing
the cost of driving, thereby shifting travelers to other modes, usually carpooling and
transit. The issues that relate to parking pricing are charges for municipal/public parking
and parking cashout. Under a parking cashout program, the employee exchanges
his/her right to park for a cash payment. Typically this cash payment is related to the
amount of parking charge the employer pays to the building owner for the parking
spaces. The cash payment can also be substituted for a subsidized transit pass. It should
be noted that this program typically is entirely voluntary and exists as a transaction
between an employee and his/her employer. However, Salt Lake City can implement
this type of program with its own employees and encourage development projects and
businesses in the city to do the same.
Unbundled Parking
Unbundling separates parking from property costs, requiring those who wish to purchase
parking spaces to do so at an additional cost from the property cost. This removes the

SALT LAKE CITY ENERGY AND TRANSPORTATION SUSTAINABILITY PLAN
29
burden from those who do not wish to use a parking space. Parking would then be
priced separately from home rents/purchase prices or office leases. An assumption is
made that the parking costs are passed through to the vehicle owners/drivers using the
parking spaces. While Salt Lake City cannot immediately control implementation of this
strategy, it can pursue development strategies that would incentivize unbundled parking
in new developments.
Remote Parking/Park and Ride
A way of preserving the urban core is to relocate parking to outlying areas, to areas
around transit stops, and to areas near High Occupancy Vehicle lanes. In addition to
promoting transit ridership, park-and-ride lots also facilitate car- and vanpooling. Remote
parking can also be used in suburban areas to create clusters of density. The benefits of
this strategy can be increased through bike-sharing programs at the destination.
Supporting Strategies
Satellite Parking and Employer Shuttles
The combination of satellite parking and employer shuttles can reduce VMT for large
office buildings. The strategy promotes parking at off-site facilities with shuttles bringing
employees to the work site. Additionally, employer shuttles can work between transit
stations and the work site, which can further reduce VMT. Every effort should be made to
use electric vehicles for shuttles.
4.2.4 Increased Mobility/Transportation Improvements
Programs like Clear the Air Challenge, EcoPasses for city and University employees, and
UTA rideshare provide increased mobility options to area residents. These programs are
effective at reducing VMT and greenhouse gas emissions. The proposed strategies
below can further improve transit operations and increase commuting options.

SALT LAKE CITY ENERGY AND TRANSPORTATION SUSTAINABILITY PLAN
30
Commuter Reduction
Programs
Provide financial and
other incentives to
encourage employees
to use transit, carpool,
vanpooling, and other
modes of
transportation.
Key Parties
City
Clear The Air Challenge
Related Efforts
UTA Global Positioning System Fare Determination
Recommended Actions
Implement a Commuter Reduction Program (CRP) to encourage
workers to use alternative modes of travel, including ride-matching
assistance, vanpool assistance, preferential carpool parking transit
subsidies, parking cash-out or priced parking, shuttles, emergency
rides home, and improved on-site amenities.
Facilitate a CRP by implementing a Commute Trip Reduction
ordinance.
Evaluated Strategies
Local Circulators for “First Mile/Last Mile” Travel
Local circulators of several types can be used to link people from regional transit lines to
local destinations around Salt Lake City. These options include pedi-cabs (cabs powered
by bicyclists), streetcars, local minibus shuttles, or other options. Salt Lake City is already
considering streetcars in Sugar House and downtown. Streetcars are recognized for their
ability to provide short-distance mobility options as well as spur economic growth.
Streetcars can be seen as a replacement for busses in heavily-used corridors because
they have higher seating capacity and are electric, which improves local air quality.
In areas where there are significant origins and destinations, such as the Convention
Center and surrounding hotels, shuttles can be a practical alternative. Local shuttle
service can be provided through coordination with the UTA or a private contractor and
can service transit hubs, commercial centers, and residential areas. Every effort should
be made to use electric vehicles for shuttles.
Supporting Strategies
Telecommute/Alternative Work Schedules
A successful TDM strategy is to implement alternative work schedules and telecommuting
to reduce the need for employees to travel to their work locations. Alternative schedules
are becoming increasingly common as employees and employers are able to take
advantage of technological advances like email, video conferencing, cell phones, and
other related items to work even when they are outside of the traditional office.

SALT LAKE CITY ENERGY AND TRANSPORTATION SUSTAINABILITY PLAN
31
Currently, the State of Utah has a 4-40 workweek during which employees work 40 hours
over 4 days, with Fridays off.
Create Downtown Traffic Management Association with a Funded Coordinator
A Traffic Management Association (TMA) is a non-profit, member-controlled organization
independent of the city that helps local business and employees find transportation
alternatives. The TMA provides assistance to downtown businesses in educating
employees on transportation programs, as well as offering ride-sharing assistance for
carpools and vanpools. Additionally, the TMA can provide monitoring services for
mandatory TDM programs, and collect funding for a TDM coordinator position that
would run programs for the association.
Regional or local governments and other management authorities can help create and
provide funding for a TMA. Generally, stakeholders include regional and local
government agencies, transit providers, business organizations, businesses, employees,
and customers. Many TMAs start as a result of a downtown business association, which
unite local businesses through common goals. A good resource for establishing TMAs is
the TMA Handbook: A Guide to Successful Transportation Management Associations,
written by the National Center for Transit Research’s National TDM and Telework
Clearinghouse on behalf of the Association for Commuter Transportation’s TMA Council.
It can be found here:
http://www.nctr.usf.edu/clearinghouse/pdf/tma_handbook_final.pdf.
Fund City Transportation Demand Management Coordinator position
At this time, the city does not have a central person who coordinates TDM activities. A
TDM coordinator who oversees these programs on a full-time basis can provide several
benefits. First, this person can provide information about carpooling, transit, and other
alternative modes to city employees, which would encourage their use of alternative
modes of travel. Second, this person can oversee any of the existing and future
transportation management agencies in the city. This oversight can include reviewing
any annual reports prepared by the TMA and providing any technical assistance as
needed. Third, this person can serve as a resource for individual developments that are
not included in a TMA but are implementing TDM strategies.
Transit Enhancement – Transit Signal Priority
Transit-passenger travel time can be reduced through decreased headways and
increased speed and reliability. Transit signal priority increases transit speeds by giving
transit vehicles signal priority and decreasing their wait time at intersections. Salt Lake
City can encourage and support UTA efforts to provide transit signal priority along transit
routes.
User Information (Next Bus Notification)
Next bus notifications allow transit users to know when the next bus is coming, alerting
them to delays in the system. This notification can take place through a phone
application, a website, and through message boards at transit stops. These

SALT LAKE CITY ENERGY AND TRANSPORTATION SUSTAINABILITY PLAN
32
enhancements make transit service more attractive and may result in a mode shift from
auto to transit to reduce VMT. Salt Lake City can encourage and support UTA efforts to
provide enhanced user information at transit stations in the city.
Promotional and Partnership Activities for Transit
Transit ridership can increase through the use of promotional and partnership activities.
Salt Lake City has days of extremely bad air, know as red days. On red days, residents
are encouraged to carpool, take transit, bicycle, or telecommute to avoid exacerbating
the air quality. The city and UTA can facilitate alternate modes by providing free transit
on red days, reducing greenhouse gas emissions and helping to improve air quality. In
addition, providing free or discounted transit with the purchase of an event ticket can
promote transit use to large events, such as sporting events and concerts. Partnerships
between UTA and businesses to provide a transit validation instead of parking validation
can also benefit system-wide ridership.
4.2.5 Road Pricing/Management
With the installation of the I-15 Express Lanes system, UDOT is now using road pricing as a
management strategy. The Express Lanes system charges tolls based on congestion level.
In addition, the city is currently conducting a signal re-timing analysis. Education
campaigns, such as Idle Free Utah − an educational program created by the state to
increase awareness of the effects of idling and to encourage people to turn off their cars
− have also recently been created.
Road pricing and intelligent transportation systems that are currently being applied to I-
15 can be used throughout the city and in various fashions to better manage Salt
Lake’s road system. The strategies below provide financial and operational opportunities
to manage these resources and to reduce greenhouse gases.
Supporting Strategies
Intelligent Transportation Systems
Intelligent transportation systems provide real-time information regarding road conditions
and directions. This information can be used to help motorists avoid congested areas,
reduce idling, and avoid driving aimlessly by directing motorists to available parking.
Arterial Speed Management (Smoothing, Optimum Speed)
Constant acceleration and braking reduces vehicle efficiency. A strategy for managing
this pattern is arterial speed management that can occur through real-time response,
alerting motorists of the optimum speed to travel smoothly, miss multiple red lights in a
row, and avoid bunching of vehicles.

SALT LAKE CITY ENERGY AND TRANSPORTATION SUSTAINABILITY PLAN
33
4.2.6 Fleet Management
The city is actively engaged in upgrading its fleet’s fuel efficiency, adding alternative fuel
vehicles to the fleet, and looking for ways to reduce driving.
Supporting Strategies
Install Charging Stations
As electric vehicles gain in popularity, installing charging stations at major employment
and activity centers should be assessed. Residents and businesses will be more likely to
purchase and lease electric vehicles if charging them is convenient.
4.3 CLIMATE CHANGE AND AIR QUALITY
The strategies proposed above will go a long way toward mitigating climate change
and improving air quality. Beyond direct actions, creating awareness in the community
about these issues can be a strong signal in motivating change. The recently
completed Community Carbon Footprint is a major step in expanding awareness.
Programs directed specifically at air quality, such as the Department of Environmental
Quality’s Choose Clean Air, are also improving awareness and changing behaviors.

SALT LAKE CITY ENERGY AND TRANSPORTATION SUSTAINABILITY PLAN
34
5 ADAPTATION
Through the Community Carbon Footprint and the ETSP process, Salt Lake City is actively
taking steps to measure its environmental impact and take steps to reduce that impact.
Though climate mitigation strategies are extremely important, the city also recognizes
that climate change will have impact on the Salt Lake region and steps need to be
taken to adapt to the changing environment.
This section is meant to provide a brief overview of the anticipated impacts climate
change will have on the Salt Lake City region, the main adaptation focus areas as a
result of the anticipated impacts, and some high level goals for each focus area.
Because Salt Lake City is a Local Governments for Sustainability, or ICLEI, partner, it can
take advantage of the many tools that ICLEI provides for climate adaptation planning
(http://www.iclei.org/index.php?id=10832). One specific tool that may be helpful is the
Climate Resilient Communities program for which ICLEI is currently seeking inaugural
participants. For the purposes of this ETSP, ICLEI’s 2007 Adaptation Guidebook has been
used as the main reference in identifying the (1) climate change impacts in Salt Lake
City, (2) the sectors to be most likely impacted by climate change, and (3) high level
adaptation strategies and action items.
5.1 PROJECTED CONSEQUENCES OF CLIMATE CHANGE
In 2000, a national assessment of the climate change impacts on the United States was
released. Many of the findings of the assessment are more regionally focused; however,
there are some common national concerns, including the following (ICLEI, 2007):
Increased average annual air temperature
Lower snowpack in some regions
Increased risk of drought
Sea level rise and increased storm surges
Shifts in types and distributions of forest species
Near-term forest growth but long term decrease in forests
Impacts to natural ecosystems
Exacerbation of non-climate stresses (e.g., habitat fragmentation and patterns of
human development)
Within the Mountain West region where Salt Lake City is located, “higher winter
temperatures are very likely to reduce snowpack and peak runoff and shift the peak to
earlier in the spring, reducing summer runoff and complicating water management for
flood control, fish runs, cities, and irrigation (ICLEI, 2007).” The magnitude of these
impacts in Salt Lake City should be researched further and in more detail as part of a
complete Climate Adaptation Plan.

SALT LAKE CITY ENERGY AND TRANSPORTATION SUSTAINABILITY PLAN
35
5.2 HYDROLOGY AND WATER RESOURCES
It is anticipated that water resources in Salt Lake City will be impacted significantly by
climate change. Some of these impacts, such as increased drought and reduced
snowpack, have already begun. A brief list of anticipated impacts includes the
following:
Earlier spring snowmelt and peak runoff, increasing flooding risk
Decreased snowpack, resulting in reduced summer stream flows and increased
drought risk
Increased competition for water
Warmer water temperature in lakes and rivers
Changes in water quality
5.2.1 Adaptation Strategies
WR-1: Expand and Diversity Water Supply
Salt Lake City relies heavily on surface water supplies from local mountain streams to
meet the needs of the city as well as the east bench of Salt Lake County, South Salt Lake,
and Murray. Surface water is supplemented with deep wells during the summer months
when stream flows are lower and demand is at its peak. With the anticipation of
reduced snowpack as a result of climate change, Salt Lake City should begin exploring
options for diversifying its water supply portfolio. Potential considerations include:
Developing new groundwater sources
Constructing new surface water reservoirs and expanding existing reservoirs (for
supply and flood management)
Exploring aquifer storage and recovery to enhance existing groundwater supplies
and provide alternative storage capacity
Implementing water reuse (gray water) both through advanced municipal
wastewater treatment and on-site treatment
WR-2: Modify Water Law
In the western United States, water laws are based on the principles of prior
appropriation, often referred to as “first in time, first in right.” This water law structure
grants senior water rights holders their full appropriation before more junior holders
receive any water. However, all allocated water must be put to beneficial uses,
otherwise the right can be lost to more junior holders. This structure leads to difficulty in
transferring water rights and also promotes water waste. In order to ensure the limited
water supplies in Salt Lake City can be used as efficiently and effectively as possible, the
following actions should be considered:
Broaden the concept of beneficial use to allow for more efficient use.
Address issues with the “use-it-or-lose-it” principle and its impacts on water waste.

SALT LAKE CITY ENERGY AND TRANSPORTATION SUSTAINABILITY PLAN
36
WR-3: Reduce Demand/Improve Efficiency
Due to the combination of population growth and reduced water supplies in Salt Lake
City, strategies that reduce overall demand and promote efficiency are needed to
ensure that water demands can be met into the future.
Increase billing rates for water as a means to encourage reduced demand and
address full cost pricing. Work with third party entity to set pricing.
Change building codes to require low-flow plumbing fixtures and high efficiency
irrigation systems.
Provide financial incentives (e.g., tax breaks, rebates) for switching to more efficient
manufacturing processes, irrigation practices, and appliances.
Increase authority to implement water restrictions during drought.
Reduce the city’s demand target to focus on critical human needs (limited indoor
water use only.
Increase public awareness about the impacts of climate change on water supplies
and what individuals can do to reduce their water use.
WR-4: Improve Hydrologic Data and Models
One of the major challenges in preparing for the impacts of climate change is
understanding what the changes will be. In order to more accurately predict impacts to
the region and develop more accurate adaptive management strategies, Salt Lake City
should do the following:
Work with the climate science community to conduct additional research and
develop down-scaled climate models that better predict climate change impacts
on the local level.
Implement climate forecasting tools available for water resources planning and
management.
Monitor hydrology trends in the region.
5.3 BIODIVERSITY AND ECOSYSTEMS
Though there is a high level of uncertainty regarding the localized impacts of climate
change on biodiversity and ecosystems, some of the general anticipated impacts are
listed below:
Shift in the distribution and range of species
Loss of species not able to adapt to changes
Increased competition from invasive species
Loss of habitat
Increased stress on cold water species in lakes and rivers
Increased risk of insect outbreaks
Increased risk of forest fire

SALT LAKE CITY ENERGY AND TRANSPORTATION SUSTAINABILITY PLAN
37
5.3.1 Adaptation Strategies
BE-1: Improve Species Survival Rates and Carrying Capacities
The impacts of climate change will create an environment in which some species adapt
and thrive while others decline. To counteract the impacts of anthropogenic (or human
induced) climate change, Salt Lake City should provide an environment that assists
native species in the adaptation process and encourages biodiversity. Some activities
are listed below:
Evaluate vulnerability, sensitivity, exposure, and adaptive capacity to determine
what species to address in an adaptation plan.
Promote and use natural features in urban areas to assist adaptation.
Increase the extent and diversity of protected and natural areas (aquatic and
terrestrial)
Improve the management and restoration of existing protected and natural areas to
counteract the impacts of climate change (e.g., riparian forest plantings to shade
streams and reduce warming, prescribed fires to reduce fuel loads, etc.).
Take actions to protect native species threatened by climate change.
Reduce the spread of invasive species.
Protect and restore in-stream flows.
Manage forests to reduce susceptibility to fire, invasive insects, and drought.
Reduce non-climate change anthropogenic impacts.
BE-2: Improve Data
The impacts of climate change on ecosystems are still largely unknown. In order to more
accurately predict impacts to the region and develop more accurate adaptive
management strategies, Salt Lake City should do the following:
Monitor regional trends in ecosystem and biodiversity changes.
Work with the climate science community to conduct additional research and
develop down-scaled climate models to better predict climate change impacts at
the local level.
Develop modeling tools to better predict climate change impacts on regional
ecosystems.
5.4 RECREATION/TOURISM
The recreation and tourism sector in Salt Lake City is at least partially focused on outdoor
activities and is expected to be impacted by climate change in a variety of ways:
Increased opportunities for warm season activities
Reduced opportunities for cold season recreation due to decreased snowpack
Increased reliance on snow-making at ski areas

SALT LAKE CITY ENERGY AND TRANSPORTATION SUSTAINABILITY PLAN
38
5.4.1 Adaptation Strategies
RT-1: Diversify Tourism Offerings
Salt Lake City is a well-known ski destination and also provides access to surrounding
national parks and recreational areas. The city already has a diverse portfolio of tourism
offerings however, to address potential impacts of climate change the City should adjust
tourism and recreation marketing campaigns to align with the changes in climate. This
may include additional or improved options during the summer season.
5.5 ENERGY
The majority of Salt Lake City’s electricity is supplied by Rocky Mountain Power, which
generates 93 percent of its electricity from coal-powered plants. Fossil fuels, like coal, are
the largest man-made source of greenhouse gas emissions and significantly contribute to
anthropogenic climate change. However, in addition to the impacts Salt Lake City
energy use has on climate change, climate change is also expected to impact energy
demand by reducing heating demand during winter months and increasing demand
during the cooling season.
5.5.1 Adaptation Strategies
E-1: Modify Building Infrastructure
To address the anticipated increased summer temperatures as a result of climate
change, Salt Lake City should make the following modifications to new and existing
buildings:
Install green roofs to provide cooling and stormwater management.
Increase urban green spaces to reduce the heat island effect and encourage
ecosystem adaptation.
Increase appropriate, low-water shade trees.
E-2: Reduce Energy Demand
In addition to adapting to the increased temperatures through building modifications,
Salt Lake City should also take steps to reduce overall energy demand through the
following activities:
Establish stringent energy efficiency standards for new construction and existing
buildings.
Promote high efficiency appliances and products.
Establish stringent air conditioning efficiency standards.
Increase renewable energy sources.

SALT LAKE CITY ENERGY AND TRANSPORTATION SUSTAINABILITY PLAN
39
5.6 STORMWATER MANAGEMENT
In Salt Lake City, climate change is expected to result in earlier spring snowmelt and
peak runoff, increasing flooding risk and the need for stormwater management in the
region. The anticipated impacts of climate change on stormwater management
include the following:
Need for new or upgraded flood and erosion control structures
More frequent road washouts and flooding
Increased demands on stormwater management systems with the potential for more
sewer overflows
5.6.1 Adaptation Strategies
SW-1: Reduce Flooding and Erosion Impacts
The Salt Lake City Department of Public Works is responsible for flood control, stormwater,
and stream water quality within city boundaries. The impacts of climate change will
require the Department to modify the existing stormwater management system to
address changes in precipitation patterns and stream runoff in the following ways:
Increase capacity of stormwater collection systems
Increase requirements for on-site stormwater management to reduce runoff
Preserve ecological buffers (e.g., wetlands)
Update data used in managing stormwater to reflect the impacts of climate change
SW-2: Reduce Property Damage
Floodplains in Salt Lake City were determined based on hydrology that does not consider
the impacts of climate change, and zoning within the city was based on these defined
floodplains. In order to protect property from increased stormwater and flooding, the
following steps should be taken:
Update floodplain maps to reflect changes to the hydrology as a result of climate
change.
Encourage relocation or abandonment of infrastructure located within the new
floodplain.
Update building code requirements to include flood-proofing for all infrastructure in
the floodplain.
Require insurance for development in flood hazard areas.
5.7 PUBLIC HEALTH
The anticipated impacts of climate change on public health include the following:
More heat-related stress, particularly among the elderly, the poor, and other
vulnerable populations
Fewer extreme cold-related health risks
Increase in vector-borne (transmitted by insects) illnesses (e.g., West Nile)

SALT LAKE CITY ENERGY AND TRANSPORTATION SUSTAINABILITY PLAN
40
Reduced summer air quality in urban areas due to increased production of ground-
level ozone
5.7.1 Adaptation Strategies
PH-1: Reduce Impacts of Extreme Heat Events
An increase in summer temperatures is likely to result in an increase in extreme heat
events, which Salt Lake City should address with the following actions:
Improve early warning systems.
Increase the number of cooling centers and provide transport services for at-risk
communities (elderly, economically disadvantaged, etc.).
PH-2: Reduce Impacts of Reduced Air Quality
Increased temperatures along with an increase in population are expected to result in
poorer urban air quality, which Salt Lake City should address with the following actions:
Improve alert system for high air pollution days.
Develop incentive programs to discourage driving on high air pollution days.
Increase public education and awareness of the risk of air pollutants.
PH-3: Improve Disease Surveillance and Protection
Changes in weather patterns and temperatures as a result of climate change are
expected to result in an increase in such vector-borne illnesses as West Nile. Salt Lake
City should take the following actions to address this impact of climate change:
Improve monitoring of diseases of concern for the region.
Increase public education and awareness of diseases of concern.
Increase emergency planning for disease outbreaks.

SALT LAKE CITY ENERGY AND TRANSPORTATION SUSTAINABILITY PLAN
41
6 FRAMEWORK FOR CONTINUED PROGRESS
The ETSP is intended to provide a framework for developing strategies to reduce building
and transportation energy consumption and associated greenhouse gas emissions, as
well as to begin to prioritize and suggest next implementation steps for those strategies.
Taking these next steps will require leadership and accountability across multiple fronts,
including political, commercial, non-profit, and individual groups. The city’s Division of
Sustainability and the Environment, in concert with the ECAC, will be facilitating the
creation of a number of sub-committees to pursue the priority strategies identified in this
plan.
The success of these priority strategies and the ETSP will be measured in an annual report
card summarizing the performance across all 10 sustainability topic areas illustrated in
Figure 5. Future updates of the greenhouse gas inventory and this inventory will also be
used to consider progress toward the goals established in this ETSP.

SALT LAKE CITY ENERGY AND TRANSPORTATION SUSTAINABILITY PLAN
42
APPENDIX A: ENERGY STRATEGY ASSUMPTIONS
Re-commissioning of Small Commercial Buildings
Implementa
-tion Cost
Electricity
Savings
Natural Gas Savings CO2e Savings Savings
Depreciation Rate
$4,692/bldg $1,593/bldg n/a (elec only) 19 tons/bldg 20%
1. Commercial buildings under 20,000 square feet included.
2. Penetration rate estimated to be 2% average, 10% above average.
3. Savings and cost data from Boulder, CO small building tune-up program results.
4. Future costs and savings do not consider impacts of population growth, inflation, etc.
Re-commissioning Schedule for Larger Commercial Buildings
Implementa
-tion Cost
Electricity
Savings
Natural Gas Savings Savings
Depreciation Rate
$0.25/sq ft 10% n/a (elec only) 10%
1. Commercial buildings under 50,000 square feet included.
2. Average assumes 5% of square footage per year, above-average 10%.
3. Only includes electricity, no natural gas.
4. Potential savings based on ENERGY STAR estimates; cost ranges from $0.10 to $1.00
per square foot. in review of different programs.
5. Future costs and savings do not consider impacts of population growth, inflation, etc.
Targeted Energy Information for Consumers
1. Implementation of this approach has shown 1.5 to3.5 percent savings over electric
and gas baselines; average case 1.5 percent electricity, above average case 3.5
percent gas.
2. Can also be applied to natural gas (assumed savings to be 1.0 percent).
3. Cost to implement is $0.03/kWh saved.
Voluntary Above-code Adoption
Cooling & Lighting
Savings
Heating
Savings
Implementation
Costs
Savings Depreciation Rate
$0.01/sq ft $0.06/sq ft $1.79/sq ft 0%
1. ENERGY STAR projected savings for 2011 ENERGY STAR for NEW HOMES over 2009
IECC.
2. Incremental cost from ENERGY STAR, not amortized.

SALT LAKE CITY ENERGY AND TRANSPORTATION SUSTAINABILITY PLAN
43
3. Market penetration rate for ENERGY STAR at 50 percent for average and 75 percent
for above average, was 38 percent in 2009.
4. Future costs and savings do not consider impacts of population growth, inflation, etc.
Cooling & Lighting
Savings
Heating
Savings
Implementation
Costs
Savings Depreciation Rate
11.9 kBtu/sq ft 17.0
kBtu/sq ft
$5/sq ft 0%
1. Projected savings at LEED-Silver equivalent.
2. Implementation cost based on federal General Services Administration (GSA)
implementations of LEED.
3. Market penetration rate for average case 10 percent, for above-average cast 30
percent.
4. Future costs and savings do not consider impacts of population growth, inflation, etc.
Energy Efficiency Assessments
Category Implementa
-tion Cost
Electricity
Savings
Natural
Gas
Savings
Penetration
Rate
Savings
Depreciation Rate
Residential $1,200/HH +
$75,000 staff
260
kWh/yr/HH
30
therms/
yr/HH
1% 10%
Commer-
cial
$1,800/HH +
$75,000 staff
10% 5% 2% + 30%
Implmnt Rate
10%
1. Residential data from EPA regional examples.
2. Commercial cost and rate of penetration data from EPA regional examples.
3. Commercial savings data from experience with similar programs
4. Only include commercial properties under 100,000 square feet.
5. Future costs and savings do not consider impacts of population growth, inflation, etc.
Direct Implementation Support for Low-income Residents
Low Income
Households
Implementation Cost Electricity
Savings
Natural Gas
Savings
Savings Depreciation
Rate
19,260 $1,598/HH 8.7% 14% 5%
1. Number of low income households based on Salt Lake City income stats; poverty
level assuming 3 people per household; definition of low income as 150% of poverty
level.

SALT LAKE CITY ENERGY AND TRANSPORTATION SUSTAINABILITY PLAN
44
2. Annual percent penetration based on Utah Division of Housing and Community
Development state-wide weatherization program.
3. Cost and savings from average of similar programs with reported results.
4. Future costs and savings do not consider impacts of population growth, inflation, etc.
5. Five percent savings depreciation rate applied, year-over-year.
Support for Large Institutions
Size Electricity
Consump-
tion
Natural
Gas
Consump-
tion
Electri-
city
Savings
Natural
Gas
Savings
Implementa
-tion Cost
Savings
Depreciation
Rate
40,000 sq
ft
8.5
kWh/sq ft
54.7kWtu/s
q ft
7% 3% $500,000 1%
1. Includes support for 36 schools in Salt Lake City School District.
2. Average size and energy consumption data from Commercial Buildings Energy
Consumption Survey.
3. Energy savings and implementation cost scaled to a 10-year simple payback; actual
potential is unknown.
4. Future costs and savings do not consider impacts of population growth, inflation, etc.
5. Full project implemented in 2010.
Lights Out Program
Impacted
Hours
Hardware
Costs
Enforcement Costs Savings Depreciation Rate
4,000 $400/bldg $75,000/yr 0%
1. Used modeling rule-of-thumb for exterior lighting density (0.1 W per square foot); less
than 2009 IECC for small commercial building.
2. Fifty percent of commercial lighting already shut off at night (manual or automatic).
3. Future costs and savings do not consider impacts of population growth, inflation, etc.
4. Full project implemented in 2010.
Code Modification
Cooling &
Lighting Savings
Heating
Savings
Implementation
Costs
Savings Depreciation Rate
$0.04/sq ft $0.05/sq ft $0.39/sq ft 0%
1. Residential square footage growth based on Salt Lake City Generalized Future Land
Use Plan.
2. Savings potential based on DOE modeling of 2009 IECC versus 2006 IECC.

SALT LAKE CITY ENERGY AND TRANSPORTATION SUSTAINABILITY PLAN
45
3. Linear rate of implementation between 2010 and 2020.
4. Future costs and savings do not consider impacts of population growth, inflation, etc.
Municipal Opportunities in Renewable Energy
1. Benefits of Solar Salt Lake City are already projected under Existing Practices.
2. Wind potential in Salt Lake City is outstanding. This strategy is based on implementing
5MW of wind by the city ($2,100/kW installed cost, $20/kW annual O&M, $0.04/kWh
avoided electricity rate, 27 methane capacity factor).
3. More than 99 percent of methane at wastewater treatment plants already used for
thermal or electric energy generation.
4. Hydroelectric at Mountain Dell Dam is being studied by the city.
5. The city’s current investment in RECs has a minimal monetary value for application to
on-site renewable projects.
Biofuels on Unused City Lands
1. Three thousand acres of unused land in Salt Lake City.
2. All unused land would be used for growing safflower biofuel crop starting in 2010.
3. Data to calculate cost and savings from Utah State University Freeways To Fuel
program.
4. Diesel and biodiesel emissions factors from TCR.
Increased Influence on Electricity Supply
1. Since the means of achieving reduced carbon intensity in electricity are numerous,
this strategy generically estimates the benefit of a 15 percent reduction in
greenhouse gas intensity of electricity between now and 2020.
2. Reduction is based on Rocky Mountain Power Integrated Resource Plan.
3. Costs and savings are not estimated because the means are not specific.

SALT LAKE CITY ENERGY AND TRANSPORTATION SUSTAINABILITY PLAN
46
APPENDIX B: TRANSPORTATION STRATEGY
ASSUMPTIONS
TECHNICAL MEMORANDUM
To: Brendle Group
Date: January 27, 2011
From: Fehr & Peers
Subject: Reduction Strategy Quantification UT10-846
Introduction
This memorandum describes the process and methodology used to estimate emission
reductions from several strategies proposed as part of the Salt Lake City Community
Carbon Footprint (SLCCCF). This memorandum identifies the sources used as reference
materials, provides an overview of the quantification of the reductions, and estimates
the total amount of vehicle miles traveled (VMT) and greenhouse gas (GHG) reductions
associated with the strategies.
Data Sources
To quantify reduction strategies proposed in the SLCCCF, the report Quantifying
Greenhouse Gas Mitigation Measures – A Resource for Local Government to Assess
Emission Reduction from Greenhouse Gas Mitigation Measures from the California Air
Pollution Control Officers Association was used. This work incorporated previous research
conducted by Fehr & Peers. Supplemental information came from the Sacramento
Blueprint, Growing Cooler, and the Bicycle Transit Center Study for Salt Lake Central
Station.
Quantification of Reduction Strategies
Using the sources outlined above, Fehr & Peers estimated the amount of VMT and GHG
reductions associated with several emission reduction strategies. For the purposes of
quantifying reductions, Fehr & Peers grouped strategies into major categories, as
described below. Fehr & Peers provided a range of effectiveness in reducing emissions
for each major category.

SALT LAKE CITY ENERGY AND TRANSPORTATION SUSTAINABILITY PLAN
47
Category 1: Pursue a compact, TOD-supportive, mixed-use urban form
Research shows that implementing land use patterns that are compact and efficient,
with a mix of land uses and connectivity to transit networks, can reduce VMT through
shorter trip lengths and a greater share of bicycle, pedestrian, and transit trips.
Quantification of this strategy required calculating the difference between Salt Lake City
VMT in 2005 (the base year) and 2020 (the future year threshold), to determine the
amount of VMT attributable to new growth. This was due to the assumption that existing
land use patterns would not change significantly between the base year and future
year, and that the opportunity for changing land use patterns lay in new developments
only. VMT from new growth was then reduced by a range of 7% - 15%, based on review
of the data sources listed above.
Category 2: Bicycle Infrastructure
Existing literature on bicycle infrastructure and commuters shows that a 1% increase in
bicycle commuters can be expected for every additional 1 mile per square mile of bike
lanes implemented by a jurisdiction. Using available information on the number of bike
lanes miles in 2005 and proposed by 2020, Fehr & Peers calculated the baseline and
future ratios of bike lane miles to city square miles, and applied the ratio to increase the
percentage of bicycle commuters. Average trip lengths from the WFRC travel demand
model and data sources were applied to the cyclist commuter trips to identify VMT for
this category.
Category 3: Park and Ride
Park-and-ride strategies were assumed to apply primarily to work trips of commuters
traveling into Salt Lake City from other jurisdictions. Salt Lake City is the major
employment center for the region and is also relatively small in area; residents of Salt
Lake City are relatively unlikely to use park-and-ride facilities to travel within the city or to
outlying areas. The WFRC travel demand model provided information on the average
trip length for these incoming work trips. Data sources indicated a range of effectiveness
to calculate the percentage of work trips into Salt Lake City that can be intercepted by
peripheral park-and-ride lots.
Category 4: Parking Cashout and Parking Unbundling
Parking cashout strategies are most applicable in areas where parking pricing is tied to
tenant costs. For this reason, the analysis of parking cashout strategies focused on eligible
employees in the Salt Lake City Central Business District (CBD). Work trips made within,
SALT LAKE CITY ENERGY AND TRANSPORTATION SUSTAINABILITY PLAN
48
into, and out of Salt Lake City were isolated using the WFRC travel demand model, and
Fehr & Peers assumed a range of percentages for workers participating in a parking
cashout program (from 5% to 20%), who would mostly be centered in the CBD. VMT
reduction was applied to commuting VMT only.
Category 5: Parking Pricing
The strategic pricing of parking supply has the ability to reduce GHG through modal shift
to bicycle, pedestrian, and transit modes, and through reducing unnecessary driving
while finding available parking. The analysis of on-street parking pricing focused on trips
that were attracted to the Salt Lake City CBD, since the CBD is the only place where
parking is metered in the City. This strategy assumed a 25% to 50% increase in on-street
parking costs, from $1.00 per hour to $1.25 and $1.50 per hour. VMT reduction was based
on elasticity of VMT with respect to parking pricing from the literature.
Category 6: Local Circulators and Last-Mile Solutions
Local circulators and other last-mile solutions, such as pedi-cabs and bike sharing, can
be integral to long-distance transit trips. The methodology for this strategy assumed an
increase in transit network coverage in Salt Lake City of 2% to 10%. Transit mode split was
determined from the WRF travel demand model. VMT reduction percentages were
applied to all SLC VMT based on literature reviews from the previously-mentioned
sources.
Category 7: Transportation Demand Management
Research shows that transportation demand management (TDM) strategies can be
effective in reducing VMT and emissions, but the ability to isolate and quantify specific
measures is limited because TDM strategies are typically implemented in packages and
in tandem with other measures (i.e. parking pricing, park-and-ride lots, transit
investments). The literature reviewed for the SLCCCF provided a range of effectiveness
for a group of TDM measures, including carpooling, ride-matching, transportation
coordinators, end-of-trip facilities, vanpool assistance, and flex scheduling. Fehr & Peers
applied reduction percentages to work trips made within, into, and out of Salt Lake City
(using information from the travel demand model), and assumed a range of
participation of commuters in TDM programs.

SALT LAKE CITY ENERGY AND TRANSPORTATION SUSTAINABILITY PLAN
49
Emission Reduction Estimates
The following table identifies the low-range and high-range estimates of emission
reductions based on the categories and strategies described above.
Category Description
VMT Reduction/Day
in 2020
GHG Reduction/Day in 2020
(metric tons)
Low High Low High
Density, Diversity, and Design
1 Pursue a Compact, TOD-Supportive,
Mixed-Use Urban Form 48,469 103,862 27.24 58.38
Increase Bike Infrastructure
2 Increase Overall Bike Infrastructure 5,793 14,482 3.26 8.14
Park/Ride
3 Remote Parking/Park & Ride 689 1,378 0.39 0.77
Parking Cashout
4 Parking Cashout and Unbundling 3,699 14,795 2.08 8.32
On-Street Parking Pricing
5 Strategic Management of Downtown
Parking Supply 15,069 30,138 8.47 16.94
Expand Local Bus & Other Last-Mile Solutions
6 Local Circulators for "First Mile/Last Mile"
Travel 2,579 12,895 1.45 7.25
TDM Coordination
7 Commuter Reduction Programs 29,801 59,601 16.75 33.50
Totals
Total Reduction 106,098 237,151 59.63 133.29
% of Total 2020 SLC VMT 3% 6% - -
Improved CAFÉ standards will effectively decrease emissions by 15%
Total Reduction with CAFÉ standards 106,098 237,151 463.79 601.39

SALT LAKE CITY ENERGY AND TRANSPORTATION SUSTAINABILITY PLAN
50
APPENDIX C: ACRONYMS AND ABBREVIATIONS
BAU: Business As Usual
BRAC: Blue Ribbon Advisory Council on Climate Change
CCAR: California Climate Action Registry
CNG: Compressed Natural Gas
CRP: Commuter Reduction Program
DEQ: Department of Environmental Quality
ECAC: Energy and Carbon Advisory Committee
EECBG: Energy Efficiency and Conservation Block Grant
ETSP: Energy Sustainability Plan
GHG: Greenhouse Gas(es)
GWP: Global Warming Potential
HOV: High Occupancy Vehicle
ICLEI: Local Governments for Sustainability
IECC: International Energy Conservation Code
IOU: Investor Owned Utility
ITS: Intelligent transportation systems
MTCO2e: Metric Tons of Carbon Dioxide equivalent
MW: Megawatt
TCR: The Climate Registry
TDM: Transportation Demand Management
TMA: Transit Management Association
TSP: Transit Signal Priority
UDOT: Utah Department of Transportation
LEED: Leadership in Energy and Environmental Design
PM: Particulate Matter
RDA: Redevelopment Agency
RECs: Renewable Energy Credits
RMP: Rocky Mountain Power
TOD: Transit Oriented Development
UTA: Utah Transit Authority
USEP: Utah State Energy Program
USGBC: United States Green Building Council
VMT: Vehicle Miles Travelled
WCI: Western Climate Initiative