energy audit report - akenergy efficiency industry, inc. soldotna library energy audit report akwarm...
TRANSCRIPT

ENERGY AUDIT REPORT
Soldotna Public Library 235 North Binkley Street
Soldotna AK 99669
CAEC Project No. CIRI‐SXQ‐CAEC‐05 May 2012
SUBMITTED BY: PRIMARY CONTACT:
22010 SE 51st Street 32266 Lakefront Drive Issaquah, WA 98029 Soldotna, Alaska 99669
Phone (425)281‐4706 Fax (425)507‐4350 Phone (907) 260‐5311 Fax (907) 260‐5312 Email: [email protected] Email: [email protected]
CONTACT: Andrew Waymire, C.E.M. CONTACT: Jerry P. Herring, P.E., C.E.A.

REPORT DISCLAIMER
Privacy The information contained within this report, including any attachment(s), was produced under contract to Alaska Housing Finance Corporation (AHFC). IGAs are the property of the State of Alaska, and may be incorporated into AkWarm-C, the Alaska Retrofit Information System (ARIS), or other state and/or public information systems. AkWarm-C is a building energy modeling software developed under contract by AHFC. This material is based upon work supported by the Department of Energy under Award Number DE-EE0000095. This report was prepared as an account of work sponsored by an agency of the United States Government. Neither the United States Government nor any agency thereof, nor any of their employees, makes any warranty, express or implied, or assumes any legal liability or responsibility for the accuracy, completeness, or usefulness of any information, apparatus, product, or process disclosed, or represents that its use would not infringe privately owned rights. Reference herein to any specific commercial product, process, or service by trade name, trademark, manufacturer, or otherwise does not necessarily constitute or imply its endorsement, recommendation, or favoring by the United States Government or any agency thereof. The views and opinions of authors expressed herein do not necessarily state or reflect those of the United States Government or any agency thereof. Limitations of Study This energy audit is intended to identify and recommend potential areas of energy savings, estimate the value of the savings, and provide an opinion of the costs to implement the recommendations. This audit meets the criteria of a Level 2 Investment Grade Audit (IGA) per the American Society of Heating, Refrigeration, Air-conditioning Engineers (ASHRAE) and the Association of Energy Engineers (AEE), and is valid for one year. The life of the IGA may be extended on a case-by-case basis, at the discretion of AHFC. In preparing this report, the preparers acted with the standard of care prevalent in this region for this type of work. All results are dependent on the quality of input data provided. Not all data could be verified and no destructive testing or investigations were undertaken. Some data may have been incomplete. This report is not intended to be a final design document. Any modifications or changes made to a building to realize the savings must be designed and implemented by licensed, experienced professionals in their fields. Lighting upgrades should undergo a thorough lighting analysis to assure that the upgrades will comply with State of Alaska Statutes as well as Illuminating Engineering Society (IES) recommendations. All liabilities for upgrades, including but not limited to safety, design, and performance are incumbent upon the professional(s) who prepare the design. Siemens Industry, Inc (SII) and Central Alaska Engineering Company (CAEC) bear no responsibility for work performed as a result of this report. Financial ratios may vary from those forecasted due to the uncertainty of the final installed design, configuration, equipment selected, installation costs, related additional work, or the operating schedules and maintenance provided by the owner. Furthermore, many ECMs are interactive, so implementation of one ECM may impact the performance of another ECM. SII and CAEC accept no liability for financial loss due to ECMs that fail to meet the forecasted financial ratios.

The economic analyses for the ECMs relating to lighting improvements are based solely on energy savings. Additional benefits may be realized in reduced maintenance cost, deferred maintenance, and improved lighting quality. The new generation lighting systems have significantly longer life leading to long term labor savings, especially in high areas like Gyms and exterior parking lots. Lighting upgrades displace re-lamping costs for any fixtures whose lamps would otherwise be nearing the end of their lifecycle. This reduces maintenance costs for 3-10 years after the upgrade. An overall improvement in lighting quality, quantified by numerous studies, improves the performance of students and workers in the built environment. New lighting systems can be designed to address all of the above benefits.
Table of Contents REPORT DISCLAIMER.....................................................................................................................................2 1. EXECUTIVE SUMMARY ..............................................................................................................................5 2. AUDIT AND ANALYSIS BACKGROUND .......................................................................................................7 3. Soldotna Public Library ...........................................................................................................................10 4. ENERGY COST SAVING MEASURES..........................................................................................................20 Appendix A – Major Equipment Inventory ...........................................................................................28 Appendix B – Partial Lighting Inventory...............................................................................................29 Appendix C – IR Photos / Heat Loss Signature .................................................................................30 Appendix D – REAL Utility Data.............................................................................................................32

Siemens Industry, Inc. Soldotna Library Energy Audit Report
AkWarm ID No. CIRI‐SXQ‐CAEC‐05 Page 5 of 38
1. EXECUTIVE SUMMARY This report was prepared for the City of Soldotna using ARRA funds as part of a contract for:
City of Soldotna Alaska Housing Finance Corporation Contact: Kyle Kornelis Contact: Rebekah Luhrs 177 North Birch P.O. Box 10120 Soldotna, Alaska 99669 Anchorage, Alaska 99510 Phone (907) 262‐9107 Phone (907)330‐8141 Email: [email protected] Email: [email protected] The scope of the audit focused on Soldotna Public Library. The scope of this report is a comprehensive energy study, which included an analysis of building shell, interior and exterior lighting systems, HVAC systems, and plug loads. Based on electricity and fuel oil prices in effect at the time of the audit, the annual predicted energy costs for the buildings analyzed are as follows: $17,789 for Electricity $9,265 for Natural Gas The total energy costs are $27,054 per year. Table 1.1 below summarizes the energy efficiency measures analyzed for the Soldotna Public Library. Listed are the estimates of the annual savings, installed costs, and two different financial measures of investment return. With all of these energy efficiency measures in place, the annual utility cost can be reduced by $4,622 per year, or 38.9% of the buildings’ total energy costs.
Table 1.1 PRIORITY LIST – ENERGY EFFICIENCY MEASURES
Rank
Feature
Improvement Description
Annual Energy Savings
Installed Cost
Savings to Investment Ratio, SIR1
Simple Payback (Years)2
TOTAL, cost-effective measures
$0 $0 999.90 999.9
The following measures were not found to be cost-effective: 1 Ventilation Apply demand ventilation
CO2 25% cost of DDC $2,261 $42,973 0.67 19.0
2 HVAC And DHW Replace Boiler and HW reset
$2,361 $76,035 0.50 32.2
TOTAL, all measures $4,622 $119,008 0.56 25.7 Table Notes:

Siemens Industry, Inc. Soldotna Library Energy Audit Report
AkWarm ID No. CIRI‐SXQ‐CAEC‐05 Page 6 of 38
1 Savings to Investment Ratio (SIR) is a life‐cycle cost measure calculated by dividing the total savings over the life of a project (expressed in today’s dollars) by its investment costs. The SIR is an indication of the profitability of a measure; the higher the SIR, the more profitable the project. An SIR greater than 1.0 indicates a cost‐effective project (i.e. more savings than cost). Remember that this profitability is based on the position of that Energy Efficiency Measure (EEM) in the overall list and assumes that the measures above it are implemented first.
2 Simple Payback (SP) is a measure of the length of time required for the savings from an EEM to payback the investment cost, not counting interest on the investment and any future changes in energy prices. It is calculated by dividing the investment cost by the expected first‐year savings of the EEM.
With all of these energy efficiency measures in place, the annual utility cost can be reduced by $4,622 per year, or 17.1% of the buildings’ total energy costs. These measures are estimated to cost $119,008, for an overall simple payback period of 25.7 years. Table 1.2 below is a breakdown of the annual energy cost across various energy end use types, such as Space Heating and Water Heating. The first row in the table shows the breakdown for the building as it is now. The second row shows the expected breakdown of energy cost for the building assuming all of the retrofits in this report are implemented. Finally, the last row shows the annual energy savings that will be achieved from the retrofits.
Table 1.2 Annual Energy Cost Estimate
Description Space Heating
Space Cooling
Water Heating
Lighting Refrigera
tion Other
Electrical Cooking
Clothes Drying
Ventilation Fans
Service Fees
Total Cost
Existing Building
$10,975
$427 $319 $10,960
$0 $3,735 $0 $0 $0 $637 $27,054
With All Proposed Retrofits
$6,331 $450 $319 $10,960
$0 $3,735 $0 $0 $0 $637 $22,432
SAVINGS $4,644 ‐$22 $0 $0 $0 $0 $0 $0 $0 $0 $4,622

Siemens Industry, Inc. Soldotna Library Energy Audit Report
AkWarm ID No. CIRI‐SXQ‐CAEC‐05 Page 7 of 38
2. AUDIT AND ANALYSIS BACKGROUND
2.1 Program Description This audit included services to identify, develop, and evaluate energy efficiency measures at the Soldotna Public Library. The scope of this project included evaluating building shell, lighting and other electrical systems, motors and pumps, and HVAC equipment. Measures were analyzed based on life‐cycle‐cost techniques, which include the initial cost of the equipment, life of the equipment, annual energy cost, annual maintenance cost, and a discount rate of 3.0%/year in excess of general inflation.
2.2 Audit Description Preliminary audit information was gathered in preparation for the site survey including actual utility bills. The site survey provides critical information in deciphering where energy is used and what opportunities exist within a building. The entire site was surveyed to inventory the following to gain an understanding of how each building operates:
• Building envelope (roof, windows, etc.) • Heating, ventilation, and air conditioning equipment (HVAC) • Lighting systems and controls • Building‐specific equipment • Water consumption, treatment (optional) & disposal
The building site visit was performed to survey all major building components and systems. The site visit included detailed inspection of energy consuming components. Summary of building occupancy schedules, operating and maintenance practices, and energy management programs provided by the building manager were collected along with the system and components to determine a more accurate impact on energy consumption. Details collected from Soldotna Public Library enable a model of the building’s energy usage to be developed, highlighting the building’s total energy consumption, energy consumption by specific building component, and equivalent energy cost. The analysis involves distinguishing the different fuels used on site, and analyzing their consumption in different activity areas of the building. Soldotna Public Library is classified as being made up of the following activity areas:
1) Library: 10,727 square feet a. 1972 Original Building approximately 3500 Sq Ft single story b. 2001 Addition approximately 7200 Sq Ft single story with conditioned basement

Siemens Industry, Inc. Soldotna Library Energy Audit Report
AkWarm ID No. CIRI‐SXQ‐CAEC‐05 Page 8 of 38
In addition, the methodology involves taking into account a wide range of factors specific to the building. These factors are used in the construction of the model of energy used. The factors include: • Occupancy hours • Local climate conditions • Prices paid for energy
2.3. Method of Analysis Data collected was processed using AkWarm© Energy Use Software to estimate energy savings for each of the proposed energy efficiency measures (EEMs). The recommendations focus on the building envelope; HVAC; lighting, plug load, and other electrical improvements; and motor and pump systems that will reduce annual energy consumption. EEMs are evaluated based on building use and processes, local climate conditions, building construction type, function, operational schedule, existing conditions, and foreseen future plans. Energy savings are calculated based on industry standard methods and engineering estimations. Our analysis provides a number of tools for assessing the cost effectiveness of various improvement options. These tools utilize Life‐Cycle Costing, which is defined in this context as a method of cost analysis that estimates the total cost of a project over the period of time that includes both the construction cost and ongoing maintenance and operating costs. Savings to Investment Ratio (SIR) = Savings divided by Investment Savings includes the total discounted dollar savings considered over the life of the improvement. When these savings are added up, changes in future fuel prices as projected by the Department of Energy are included. Future savings are discounted to the present to account for the time‐value of money (i.e. money’s ability to earn interest over time). The Investment in the SIR calculation includes the labor and materials required to install the measure. An SIR value of at least 1.0 indicates that the project is cost‐effective—total savings exceed the investment costs. Simple payback is a cost analysis method whereby the investment cost of a project is divided by the first year’s savings of the project to give the number of years required to recover the cost of the investment. This may be compared to the expected time before replacement of the system or component will be required. For example, if a boiler costs $12,000 and results in a savings of $1,000 in the first year, the payback time is 12 years. If the boiler has an expected life to replacement of 10 years, it would not be financially viable to make the investment since the payback period of 12 years is greater than the project life. The Simple Payback calculation does not consider likely increases in future annual savings due to energy price increases. As an offsetting simplification, simple payback does not consider the need to earn interest on the investment (i.e. it does not consider the time‐value of money). Because of these simplifications, the SIR figure is considered to be a better financial investment indicator than the Simple Payback measure.
Siemens Industry, Inc. Soldotna Library Energy Audit Report
AkWarm ID No. CIRI‐SXQ‐CAEC‐05 Page 9 of 38
Measures are implemented in order of cost‐effectiveness. The program first calculates individual SIRs, and ranks all measures by SIR, higher SIRs at the top of the list. An individual measure must have an individual SIR>=1 to make the cut. Next the building is modified and re‐simulated with the highest ranked measure included. Now all remaining measures are re‐evaluated and ranked, and the next most cost‐effective measure is implemented. AkWarm goes through this iterative process until all appropriate measures have been evaluated and installed. It is important to note that the savings for each recommendation is calculated based on implementing the most cost effective measure first, and then cycling through the list to find the next most cost effective measure. Implementation of more than one EEM often affects the savings of other EEMs. The savings may in some cases be relatively higher if an individual EEM is implemented in lieu of multiple recommended EEMs. For example implementing a reduced operating schedule for inefficient lighting will result in relatively high savings. Implementing a reduced operating schedule for newly installed efficient lighting will result in lower relative savings, because the efficient lighting system uses less energy during each hour of operation. If multiple EEM’s are recommended to be implemented, AkWarm calculates the combined savings appropriately. Cost savings are calculated based on estimated initial costs for each measure. Installation costs include labor and equipment to estimate the full up‐front investment required to implement a change. Costs are derived from Means Cost Data, industry publications, and local contractors and equipment suppliers.
2.4 Limitations of Study All results are dependent on the quality of input data provided, and can only act as an approximation. In some instances, several methods may achieve the identified savings. This report is not intended as a final design document. The design professional or other persons following the recommendations shall accept responsibility and liability for the results.

Siemens Industry, Inc. Soldotna Library Energy Audit Report
AkWarm ID No. CIRI‐SXQ‐CAEC‐05 Page 10 of 38
3. Soldotna Public Library
3.1. Building Description
(Photo From Google Maps)
The 10,727 square foot Soldotna Public Library was constructed in 1972, with a normal occupancy of 15‐20 people. The number of hours of operation for this building average 9 hours per day, considering all seven days of the week. The library facility is a single story structure comprised of an original section constructed in 1974. An addition was constructed in 2001 that roughly doubled the usable interior space. The addition includes a conditioned basement space that is currently used as storage. 3.1.A Building Shell The exterior walls are constructed of masonry tied to stud framing. The wall insulation is estimated at R19 (ref original drawings) The roof of the building is constructed of built up composite. The average thermal rating of the combined roof and ceiling elements is estimated at R25 The floor/foundation of the building is constructed of poured concrete. The entrance main door consists of aluminum frame with half lite glass section and thermal break. Utility doors are insulated metal door and frame. Typical windows throughout the building are dual glazed tinted thermal pane. It was found that some wood was present on the original windows. It is estimated the thermal rating is R1.4‐R1.9

Siemens Industry, Inc. Soldotna Library Energy Audit Report
AkWarm ID No. CIRI‐SXQ‐CAEC‐05 Page 11 of 38
3.1.B Heating and Cooling Plants Boiler: Weil‐McLain Serving: Original building AHU and all radiant elements M/N: PFG‐6 Input 325 Mbtu Output 260 Mbtu Fuel Type: Natural Gas Steady State Efficiency: 70 % Idle Loss: 10 % Heat Distribution Type: Water Boiler Operation: All Year RTU‐1 Lennox Serves 1st Floor Addition Input 200,000 btuh (heating) Air flow 4000 cfm Motor 3hp Cooling 10 ton Steady State Efficiency: 75 % Fuel Type: Natural Gas Idle Loss: 5 % Heat Distribution Type: Air RTU‐1 Operation: All Year RTU‐2 Lennox Serves Lower Level Addition Input 125,000 btuh (heating) Air flow 2100 cfm Motor 1.5hp Cooling 5 ton Steady State Efficiency: 75 % Fuel Type: Natural Gas Idle Loss: 5 % Heat Distribution Type: Air RTU‐1 Operation: All Year DHW Heater US Water Heater Fuel Type: Natural Gas Input Rating: 34,000 BTU/hr Steady State Efficiency: 85 % Idle Loss: 1.5 % Heat Distribution Type: Water Boiler Operation: All Year

Siemens Industry, Inc. Soldotna Library Energy Audit Report
AkWarm ID No. CIRI‐SXQ‐CAEC‐05 Page 12 of 38
The Cooling Plants used in the building are: RTU1 Nameplate Information: Lennox Cooling Capacity: 10.0 Tons Cooling Distribution Type: Air Seasonal Efficiency, SEER: 10.00 (estimate) RTU2 Nameplate Information: Lennox Cooling Capacity: 5.0 Tons Cooling Distribution Type: Air Seasonal Efficiency, SEER: 10.00 (estimate)
3.1.C Space Heating and Cooling Distribution Systems Hot water from the boiler is circulated by an electric pump to the hot water coil in AHU‐1 that provides primary heat to the original library area. AHU is a PACE 1.5hp/320cfm system that is cycled by a mechanical time clock. Hot water is also circulated via another piping loop to the perimeter radiant heating system. The radiant heat serves both the original and addition building sections. The system temperature is constant and does not reset with outside air temperature. The heating hot water systems was operating when the space temperature was satisfied and outside air temperatures were between 50‐55’f. RTU‐1 and RTU‐2 are both Lennox gas fired roof top units with economizer air and DX cooling sections. RTU‐1 serves as primary heating source for the first floor addition. RTU‐2 serves as primary heating source for the basement of the addition. Each RTU is cycled by programmable wall thermostat that includes night setback.

Siemens Industry, Inc. Soldotna Library Energy Audit Report
AkWarm ID No. CIRI‐SXQ‐CAEC‐05 Page 13 of 38
3.1.D Domestic Hot Water System Domestic hot water is distributed via copper piping including 65w return/recirculating pump. 3.1.E Description of Building Ventilation System The existing building ventilation system consists of AHU‐1 serving the original building. Air is distributed via metal ductwork and supplied through grills incorporated into the lights. AHU includes OA/RA/ dampers that are modulated by basic pneumatic controls. RTU‐1 and RTU‐2 serve the addition and include mixing dampers with discrete analog electronic controls. RTU‐1 air is distributed via metal ductwork and supplied through grills incorporated into the lights. RTU‐2 utilizes simple vent diffusers that serve to temper the basement, which is not finished and is used a storage space. 3.1.F Controls The building control system is pneumatic consisting of a Honeywell duplex compressor with unit mounted discrete controls and pneumatic valves and damper motors. Pneumatic valves and thermostats control terminal equipment. RTU‐1,2 are controlled by unit mounted manufacturer’s electronic controls and cycled by programmable thermostats. 3.1G Lighting Interior lighting generally consists of a variety of 4’ florescent fixtures fitted with standard ballasts and 34w energy savings tubes. Lights are manually controlled with wall switches.
3.1.H Plug Loads Plug loads generally consist of approximately 25 computers monitors and printers. Major Equipment The equipment list, available in Appendix A, is composed of major energy consuming equipment which through energy conservation measures could yield substantial energy savings. The list shows the major equipment in the building and pertinent information utilized in energy savings calculations.

Siemens Industry, Inc. Soldotna Library Energy Audit Report
AkWarm ID No. CIRI‐SXQ‐CAEC‐05 Page 14 of 38
3.2 Predicted Energy Use
3.2.1 Energy Usage / Tariffs
The electric usage profile charts (below) represents the predicted electrical usage for the building. If actual electricity usage records were available, the model used to predict usage was calibrated to approximately match actual usage. The electric utility measures consumption in kilowatt‐hours (kWh) and maximum demand in kilowatts (kW). One kWh usage is equivalent to 1,000 watts running for one hour. One KW of electric demand is equivalent to 1,000 watts running at a particular moment. The basic usage charges are shown as generation service and delivery charges along with several non‐utility generation charges. The natural gas usage profile shows the predicted natural gas energy usage for the building. If actual gas usage records were available, the model used to predict usage was calibrated to approximately match actual usage. Natural gas is sold to the customer in units of 100 cubic feet (CCF), which contains approximately 100,000 BTUs of energy. The following is a list of the utility companies providing energy to the building and the class of service provided: Electricity: Homer Electric Assn (Homer) ‐ Commercial ‐ Sm Natural Gas: Enstar Natural Gas ‐ Commercial ‐ Sm The average cost for each type of fuel used in this building is shown below in Table 3.1. This figure includes all surcharges, subsidies, and utility customer charges:
Table 3.1 – Average Energy Cost Description Average Energy Cost
Electricity $ 0.1386/kWh Natural Gas $ 0.71/ccf

Siemens Industry, Inc. Soldotna Library Energy Audit Report
AkWarm ID No. CIRI‐SXQ‐CAEC‐05 Page 15 of 38
3.2.1.1 Total Energy Use and Cost Breakdown At current rates, City of Soldotna pays approximately $27,054 annually for electricity and other fuel costs for the Soldotna Public Library. Figure 3.1 below reflects the estimated distribution of costs across the primary end uses of energy based on the AkWarm© computer simulation. Comparing the “Retrofit” bar in the figure to the “Existing” bar shows the potential savings from implementing all of the energy efficiency measures shown in this report.
Figure 3.1 Annual Energy Costs by End Use
Figure 3.2 below shows how the annual energy cost of the building splits between the different fuels used by the building. The “Existing” bar shows the breakdown for the building as it is now; the “Retrofit” bar shows the predicted costs if all of the energy efficiency measures in this report are implemented.
Figure 3.2 Annual Energy Costs by Fuel Type

Siemens Industry, Inc. Soldotna Library Energy Audit Report
AkWarm ID No. CIRI‐SXQ‐CAEC‐05 Page 16 of 38
Figure 3.3 below addresses only Space Heating costs. The figure shows how each heat loss component contributes to those costs; for example, the figure shows how much annual space heating cost is caused by the heat loss through the Walls/Doors. For each component, the space heating cost for the Existing building is shown (blue bar) and the space heating cost assuming all retrofits are implemented (yellow bar) are shown.
Figure 3.3 Annual Space Heating Cost by Component
$0 $2,000 $4,000 $6,000 $8,000
Floor
Wall/Door
Window
Ceiling
Air
Existing Retrofit
Annual Space Heating Cost by Component
The tables below show AkWarm’s estimate of the monthly fuel use for each of the fuels used in the building. For each fuel, the fuel use is broken down across the energy end uses. Note, in the tables below “DHW” refers to Domestic Hot Water heating. Electrical Consumption (kWh) Jan Feb Mar Apr May Jun Jul Aug Sept Oct Nov Dec
Lighting 6823 6218 6823 6603 6823 6603 6823 6823 6603 6823 6603 6823 Other_Electrical 2325 2119 2325 2250 2325 2250 2325 2325 2250 2325 2250 2325 Ventilation_Fans 0 0 0 0 0 0 0 0 0 0 0 0
DHW 48 44 48 47 48 47 48 48 47 48 47 48 Space_Heating 1549 1412 1549 1499 1549 1209 1292 852 1369 1549 1499 1549 Space_Cooling 0 0 0 0 0 585 471 1822 254 0 0 0
Natural Gas Consumption (ccf) Jan Feb Mar Apr May Jun Jul Aug Sept Oct Nov Dec
DHW 30 27 30 29 30 29 30 30 29 30 29 30 Space_Heating 1501 1766 1512 1032 849 616 551 578 657 948 1187 1465

Siemens Industry, Inc. Soldotna Library Energy Audit Report
AkWarm ID No. CIRI‐SXQ‐CAEC‐05 Page 17 of 38
3.2.2 Energy Use Index (EUI) Energy Use Index (EUI) is a measure of a building’s annual energy utilization per square foot of building. This calculation is completed by converting all utility usage consumed by a building for one year, to British Thermal Units (Btu) or kBtu, and dividing this number by the building square footage. EUI is a good measure of a building’s energy use and is utilized regularly for comparison of energy performance for similar building types. The Oak Ridge National Laboratory (ORNL) Buildings Technology Center under a contract with the U.S. Department of Energy maintains a Benchmarking Building Energy Performance Program. The ORNL website determines how a building’s energy use compares with similar facilities throughout the U.S. and in a specific region or state. Source use differs from site usage when comparing a building’s energy consumption with the national average. Site energy use is the energy consumed by the building at the building site only. Source energy use includes the site energy use as well as all of the losses to create and distribute the energy to the building. Source energy represents the total amount of raw fuel that is required to operate the building. It incorporates all transmission, delivery, and production losses, which allows for a complete assessment of energy efficiency in a building. The type of utility purchased has a substantial impact on the source energy use of a building. The EPA has determined that source energy is the most comparable unit for evaluation purposes and overall global impact. Both the site and source EUI ratings for the building are provided to understand and compare the differences in energy use. The site and source EUIs for this building are calculated as follows. (See Table 3.4 for details): Building Site EUI = (Electric Usage in kBtu + Gas Usage in kBtu + similar for other fuels) Building Square Footage Building Source EUI = (Electric Usage in kBtu X SS Ratio + Gas Usage in kBtu X SS Ratio + similar for other fuels) Building Square Footage where “SS Ratio” is the Source Energy to Site Energy ratio for the particular fuel.
Table 3.4
Soldotna Public Library EUI Calculations
Energy Type Building Fuel Use per Year Site Energy Use per Year, kBTU
Source/Site Ratio
Source Energy Use per Year, kBTU
Electricity 128,363 kWh 438,102 3.340 1,463,260 Natural Gas 13,012 ccf 1,301,241 1.047 1,362,399 Total 1,739,343 2,825,660 BUILDING AREA 10,727 Square Feet BUILDING SITE EUI 162 kBTU/Ft²/Yr BUILDING SOURCE EUI 263 kBTU/Ft²/Yr * Site ‐ Source Ratio data is provided by the Energy Star Performance Rating Methodology for Incorporating Source Energy Use document issued March 2011.

Siemens Industry, Inc. Soldotna Library Energy Audit Report
AkWarm ID No. CIRI‐SXQ‐CAEC‐05 Page 18 of 38
3.3 AkWarm© Building Simulation An accurate model of the building performance can be created by simulating the thermal performance of the walls, roof, windows and floors of the building. The HVAC system and central plant are modeled as well, accounting for the outside air ventilation required by the building and the heat recovery equipment in place. The model uses local weather data and is trued up to historical energy use to ensure its accuracy. The model can be used now and in the future to measure the utility bill impact of all types of energy projects, including improving building insulation, modifying glazing, changing air handler schedules, increasing heat recovery, installing high efficiency boilers, using variable air volume air handlers, adjusting outside air ventilation and adding cogeneration systems. For the purposes of this study, the Soldotna Public Library was modeled using AkWarm© energy use software to establish a baseline space heating and cooling energy usage. Climate data from Soldotna was used for analysis. From this, the model was be calibrated to predict the impact of theoretical energy savings measures. Once annual energy savings from a particular measure were predicted and the initial capital cost was estimated, payback scenarios were approximated. Equipment cost estimate calculations are provided in Appendix D. Limitations of AkWarm© Models • The model is based on typical mean year weather data for Soldotna. This data represents the average ambient weather profile as observed over approximately 30 years. As such, the gas and electric profiles generated will not likely compare perfectly with actual energy billing information from any single year. This is especially true for years with extreme warm or cold periods, or even years with unexpectedly moderate weather.

Siemens Industry, Inc. Soldotna Library Energy Audit Report
AkWarm ID No. CIRI‐SXQ‐CAEC‐05 Page 19 of 38
Figure 3.4 Difference in Weather Data
Soldotna, AK Weather Data
-20
-10
0
10
20
30
40
50
60
70
80
12/3/2009 1/22/2010 3/13/2010 5/2/2010 6/21/2010 8/10/2010 9/29/2010 11/18/2010 1/7/2011 2/26/2011
Date
Dry
Bul
b Te
mpe
ratu
re (F
)
Actual Dry Bulb (F) TMY3 Dry Bulb (F)
• The heating and cooling load model is a simple two‐zone model consisting of the building’s core interior spaces and the building’s perimeter spaces. This simplified approach loses accuracy for buildings that have large variations in cooling/heating loads across different parts of the building. • The model does not model HVAC systems that simultaneously provide both heating and cooling to the same building space (typically done as a means of providing temperature control in the space). The energy balances shown in Section 3.1 were derived from the output generated by the AkWarm© simulations.
Siemens Industry, Inc. Soldotna Library Energy Audit Report
AkWarm ID No. CIRI‐SXQ‐CAEC‐05 Page 20 of 38
4. ENERGY COST SAVING MEASURES
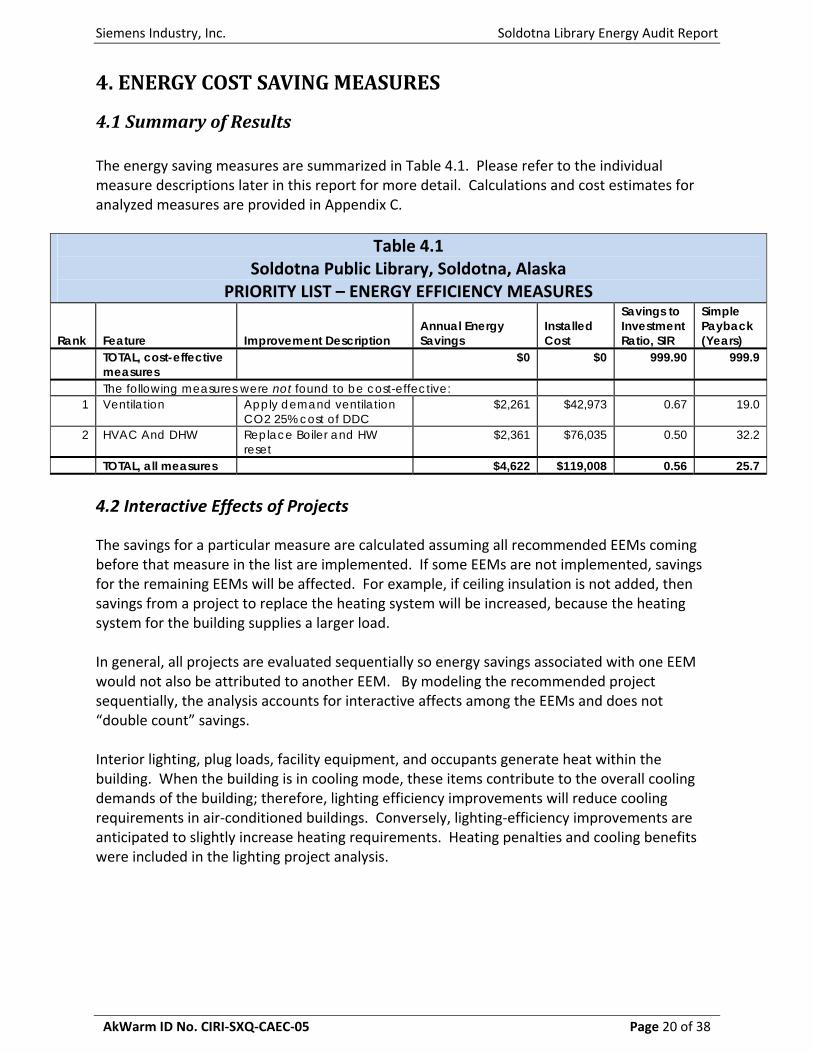
4.1 Summary of Results The energy saving measures are summarized in Table 4.1. Please refer to the individual measure descriptions later in this report for more detail. Calculations and cost estimates for analyzed measures are provided in Appendix C.
Table 4.1 Soldotna Public Library, Soldotna, Alaska
PRIORITY LIST – ENERGY EFFICIENCY MEASURES Rank
Feature
Improvement Description
Annual Energy Savings
Installed Cost
Savings to Investment Ratio, SIR
Simple Payback (Years)
TOTAL, cost-effective measures
$0 $0 999.90 999.9
The following measures were not found to be cost-effective: 1 Ventilation Apply demand ventilation
CO2 25% cost of DDC $2,261 $42,973 0.67 19.0
2 HVAC And DHW Replace Boiler and HW reset
$2,361 $76,035 0.50 32.2
TOTAL, all measures $4,622 $119,008 0.56 25.7 4.2 Interactive Effects of Projects The savings for a particular measure are calculated assuming all recommended EEMs coming before that measure in the list are implemented. If some EEMs are not implemented, savings for the remaining EEMs will be affected. For example, if ceiling insulation is not added, then savings from a project to replace the heating system will be increased, because the heating system for the building supplies a larger load. In general, all projects are evaluated sequentially so energy savings associated with one EEM would not also be attributed to another EEM. By modeling the recommended project sequentially, the analysis accounts for interactive affects among the EEMs and does not “double count” savings. Interior lighting, plug loads, facility equipment, and occupants generate heat within the building. When the building is in cooling mode, these items contribute to the overall cooling demands of the building; therefore, lighting efficiency improvements will reduce cooling requirements in air‐conditioned buildings. Conversely, lighting‐efficiency improvements are anticipated to slightly increase heating requirements. Heating penalties and cooling benefits were included in the lighting project analysis.

Siemens Industry, Inc. Soldotna Library Energy Audit Report
AkWarm ID No. CIRI‐SXQ‐CAEC‐05 Page 21 of 38
4.3 Building Shell Measures
No building shell improvements are recommended at this time. Primarily Envelope Measures such as windows, doors, weather stripping, and insulation are only considered cost effective if there is a visible deficiency which is noted during the audit. However it is recommended that any time the facility replaces doors or windows that it uses a replacement with a high efficiency rating. Also when renovating or constructing additions to the facility a energy cost analysis should be taken when determining if a material with a greater R‐value should be used instead of that of the code requirements.
4.4 Mechanical Equipment Measures
4.4.1 Heating/Cooling/Domestic Hot Water Measure
Observation
The existing boiler is old and inefficient. It appears that the existing heating system does not meet the heating needs of the building.
Recommendation Replacement of existing boilers with high efficiency boilers will significantly reduce the fuel consumption for the buildings. The efficiency and operating life of a boiler is influenced by numerous factors. Boiler failure is typically a slow, progressive process that happens over a long period of time. Materials begin to fail with repeated thermal stress, boiler tubes gradually begin to leak, and scaling buildup prevents the boiler from meeting the heating load. When deciding whether to replace or repair an inefficient boiler, one should assess its overall condition and determine where losses are occurring. Combustion efficiency should be analyzed, since too much combustion air will decrease boiler efficiency.
Scaling within the boiler tubes should also be investigated, since scaling decreases the overall heat transfer ability of the boiler. Benefits include:
• More efficient boiler operation
• Lower operating costs
• Greater comfort for building occupants
Observations During low load times (warm winter weather) the boiler cycles on and off more to maintain the hot water supply temperature setpoint. The boilers have a purge cycle prior to firing that reduces the
Rank Recommendation 2 Replace Boiler and HW reset
Installation Cost $76,035 Estimated Life of Measure (yrs) 20 Energy Savings (/yr) $2,361Breakeven Cost $37,905 Savings‐to‐Investment Ratio 0.5 Simple Payback yrs 32Auditors Notes:
High Efficiency Boiler

Siemens Industry, Inc. Soldotna Library Energy Audit Report
AkWarm ID No. CIRI‐SXQ‐CAEC‐05 Page 22 of 38
overall efficiency of the system. In colder temperatures the boiler stays on longer minimizing purge losses.
Recommendations Siemens recommends applying hot water reset technology to mitigate energy consumption. The water temperature required to heat a building varies with outdoor temperature. In very cold weather, the heating water temperature needs to be hot. As the outdoor temperature increases, the heating water temperature can be reduced. Most building operators do not manually adjust their

Siemens Industry, Inc. Soldotna Library Energy Audit Report
AkWarm ID No. CIRI‐SXQ‐CAEC‐05 Page 23 of 38
4.4.2 Ventilation System Measures
Observation – AHU Controls
The existing controls are pneumatic and electric. In general, the existing controls provide space level control. Day to day temperature fluctuations in the spaces can be a distraction to the occupants and the staff. The controls are in fair condition for their age.
Recommendations Recommend that a new direct digital control system be installed to provide automatic control to the air handling units, the roof top units, the boilers and the VAV boxes in the classrooms and the office area. The new system will improve the building engineer's ability to maintain comfort and enhance the learning environment in the classrooms. An Insight Workstation will be included to allow the Building Engineer access to this control system and its functions. Improvements will be made in response time and troubleshooting of occupant comfort problems. The following summarizes the building automation system controls: discovered, bringing it to the attention of the client
• Each air handling unit will have the following control sequences: economizer control, mixed air reset control, discharge air reset based on return air/space temperatures, optimal start/stop, night setback/morning warm‐up, IAQ monitoring of return air, demand ventilation control and alarming upon system failures. (Maintain factory for RTU‐1,2)
• The pumps and the boilers will be enabled and disabled based on the demand for heating. The operation of the pumps will be proofed and alarmed when failure occurs. In the heating plant, the boilers will be sequenced to maintain a hot water supply temperature reset by outside air temperature.
• The Insight Workstation will be located in the boiler mechanical room. The operators will have the capability to monitor HVAC systems district wide. At the Insight Workstation, the operator will be able to input the building operating schedule and specific after hours functions, specific holidays and days when classes end early.
• The security system will be integrated into the building automation system for monitoring and trending.
• Logging, recording, run time tracking and trending operation of equipment.
• A digital input from a photocell will be used to enable and disable exterior lighting.
• The optimal start/stop and scheduling programming will be incorporated into all the systems. These schedules will be software adjustable so that the engineer can adjust the schedule to the changing needs of the building through the central operator station.
• This system will be equipped for remote communication for ease of trouble shooting and system monitoring by the staff during the day as well as after hours.
Rank Description Recommendation 1 Apply demand ventilation CO2 25% cost of DDC
Installation Cost $42,973 Estimated Life of Measure (yrs) 15 Energy Savings (/yr) $2,261Breakeven Cost $28,783 Savings‐to‐Investment Ratio 0.7 Simple Payback yrs 19Auditors Notes:

Siemens Industry, Inc. Soldotna Library Energy Audit Report
AkWarm ID No. CIRI‐SXQ‐CAEC‐05 Page 24 of 38
• This measure also includes on‐site training for the Building Engineers. There are also extensive training classes available on the system for all levels of expertise.
Observation – Pneumatic zone Control • Library has stand‐alone systems with non‐programmable thermostats.
Recommendations • For some stand‐alone systems, it may not be economical to add
DDC control points. For these systems, Siemens may recommend installing either programmable thermostats or plug‐and‐play controllers for PTAC units to set‐back temperatures during unoccupied periods. The PTAC controllers utilize a wireless occupancy sensor to reduce space temperatures at night and during weekends while allowing occupants to control the temperature when they are in the spaces

Siemens Industry, Inc. Soldotna Library Energy Audit Report
AkWarm ID No. CIRI‐SXQ‐CAEC‐05 Page 25 of 38
4.4 Electrical & Appliance Measures EEM‐3 Lighting Measures The goal of this section is to present any lighting energy conservation measures that may also be cost beneficial. It should be noted that replacing current bulbs with more energy‐efficient equivalents will have a small effect on the building heating and cooling loads. The building cooling load will see a small decrease from an upgrade to more efficient bulbs and the heating load will see a small increase, as the more energy efficient bulbs give off less heat. 4.4.1a Lighting Measures – Replace Existing Fixtures/Bulbs
Rank Location Existing Condition Recommendation 11 3 FLUOR (4) T12 4' F40T12 40W Standard (2)
Magnetic with Manual Switching Replace with 3 FLUOR (4) T8 4' F32T8 25W Energy‐Saver (2) Instant StdElectronic
Installation Cost $450 Estimated Life of Measure (yrs) 7 Energy Savings (/yr) $9Breakeven Cost $59 Savings‐to‐Investment Ratio 0.1 Simple Payback yrs 49Auditors Notes:
Rank Location Existing Condition Recommendation 10 9 FLUOR (2) T12 8' F96T12 75W Standard Magnetic
with Manual Switching Replace with 9 FLUOR (2) T8 4' F32T8 25W Energy‐Saver Instant StdElectronic
Installation Cost $1,350 Estimated Life of Measure (yrs) 7 Energy Savings (/yr) $33Breakeven Cost $210 Savings‐to‐Investment Ratio 0.2 Simple Payback yrs 41Auditors Notes:
Rank Location Existing Condition Recommendation 8 161 FLUOR (2) T12 4' F40T12 40W Standard
Magnetic with Manual Switching Replace with 161 FLUOR (2) T8 4' F32T8 25W Energy‐Saver Instant StdElectronic
Installation Cost $46,361 Estimated Life of Measure (yrs) 7 Energy Savings (/yr) $4,065Breakeven Cost $25,828 Savings‐to‐Investment Ratio 0.6 Simple Payback yrs 11Auditors Notes:
Rank Location Existing Condition Recommendation 6 2 FLUOR (2) T12 4' F40T12 40W Standard Magnetic
with Manual Switching Replace with 2 FLUOR (2) T8 4' F32T8 25W Energy‐Saver Program StdElectronic
Installation Cost $300 Estimated Life of Measure (yrs) 7 Energy Savings (/yr) $37Breakeven Cost $237 Savings‐to‐Investment Ratio 0.8 Simple Payback yrs 8Auditors Notes:

Siemens Industry, Inc. Soldotna Library Energy Audit Report
AkWarm ID No. CIRI‐SXQ‐CAEC‐05 Page 26 of 38
Rank Location Existing Condition Recommendation 5 15 FLUOR (2) T12 4' F40T12 40W Standard (2)
Magnetic with Manual Switching Replace with 15 FLUOR (2) T8 4' F32T8 25W Energy‐Saver (2) Instant StdElectronic
Installation Cost $2,250 Estimated Life of Measure (yrs) 7 Energy Savings (/yr) $352Breakeven Cost $2,237 Savings‐to‐Investment Ratio 1.0 Simple Payback yrs 6Auditors Notes:
Rank Location Existing Condition Recommendation 4 3 MH 150 Watt StdElectronic with Manual Switching Replace with 3 LED 34W Module StdElectronic
Installation Cost $1,200 Estimated Life of Measure (yrs) 7 Energy Savings (/yr) $230Breakeven Cost $1,466 Savings‐to‐Investment Ratio 1.2 Simple Payback yrs 5Auditors Notes:
Rank Location Existing Condition Recommendation 3 7 MH 175 Watt StdElectronic with Manual Switching Replace with 7 LED 34W Module StdElectronic
Installation Cost $2,800 Estimated Life of Measure (yrs) 7 Energy Savings (/yr) $652Breakeven Cost $4,163 Savings‐to‐Investment Ratio 1.5 Simple Payback yrs 4Auditors Notes:
Rank Location Existing Condition Recommendation 1 4 INCAN A Lamp, Std 100W with Manual Switching Replace with 4 FLUOR CFL, A Lamp 20W
Installation Cost $400 Estimated Life of Measure (yrs) 7 Energy Savings (/yr) $191Breakeven Cost $1,222 Savings‐to‐Investment Ratio 3.1 Simple Payback yrs 2Auditors Notes:
Rank Location Existing Condition Recommendation 2 9 FLUOR (4) T12 4' F40T12 40W Standard (2)
Magnetic with Manual Switching Replace with 9 FLUOR (4) T8 4' F32T8 25W Energy‐Saver (2) Instant StdElectronic
Installation Cost $1,350 Estimated Life of Measure (yrs) 7 Energy Savings (/yr) $363Breakeven Cost $2,307 Savings‐to‐Investment Ratio 1.7 Simple Payback yrs 4Auditors Notes:

Siemens Industry, Inc. Soldotna Library Energy Audit Report
AkWarm ID No. CIRI‐SXQ‐CAEC‐05 Page 27 of 38
Observations All or parts of the library have energy efficient 34W T12 lamps with magnetic ballasts.
Recommendations Replace lower efficiency fluorescent lamps and magnetic ballasts with second generation T‐8 fluorescent lamps and electronic ballasts. T‐12 and T‐8 lamps fit into the same size sockets, so some of the existing fixtures can be easily retrofitted with the latest lamp and ballast technologies. In areas with old and inefficient fixtures, Siemens will replace the fixture with a new, efficient and aesthetically pleasing fixture. Electronic ballasts use less energy and reduce flicker, glare, noise, and heat output. Older T12 magnetic ballasts may also contain PCB’s that cannot be disposed of in ordinary waste streams. The proper disposal of these PCB ballast is a maintenance cost that is eliminated when fixtures are retrofitted with new electronic ballast. Note: There may be other lighting retrofit opportunities available when individual retrofit pricing is combined with the items noted herein thus reducing installed cost of each individual EEM

Siemens Industry, Inc. Soldotna Library Energy Audit Report
AkWarm ID No. CIRI‐SXQ‐CAEC‐05 Page 28 of 38
Appendix A – Major Equipment Inventory
MAJOR EQUIPMENT INVENTORY Tag LOCATION FUNCTION MAKE MODEL TYPE CAPACITY
(input) EFFICIENCY MOTOR ASHRAE
SERVICE LIFE
ESTIMATED REMAINING LIFE
NOTES
Blr‐1 Boiler Room Bldg Heat Weil McLain PFG‐6 Gas Hot Water
325 mbh 75% est n/a 20 0 Original
AHU‐1 Boiler Room Ventilation PACE n/a Electric 3200 cfm 82% est 1.5hp 20 0 Original RTU‐1 Addition Roof HVAC Lennox n/a Gas ‐Htg
Electric‐Clg 200 mbh ‐htg 10 ton ‐clg
85% est 15 5 Estimated Capacity
RTU‐2 Addition Roof HVAC Lennox n/a Gas ‐Htg Electric‐Clg
125 mbh ‐htg 5 ton ‐clg
85% est 15 5 Estimated Capacity
HWH‐1 Boiler Room Domestic HW US Water Heater
M-I-RG40T5LN-8
Gas 34,000 /40 gal 80% est 12 2‐5 Est age
Comp‐1 Boiler Room Pneumatic Cntr Honeywell 230A2B0B1a Electric n/a n/a 0.25hp 20 0 t/c compressor
P1 Boiler Rm Radiant Heat n/a n/a Electric n/a n/a 240w 15 2‐5 Est age P2 Boiler Rm Ahu‐1 n/a n/a Electric n/a n/a 80w 15 2‐5 Est age P3 Boiler Rm Dhw
recirculation n/a n/a Electric n/a n/a 240w 15 2‐5 Est age

Siemens Industry, Inc. Soldotna Library Energy Audit Report
AkWarm ID No. CIRI‐SXQ‐CAEC‐05 Page 29 of 38
Appendix B – Partial Lighting Inventory
LIGHTING INVENTORY Location 100W Incandescent 150 W MH 1x2x2 T12 1x4x2 T12 1x8x2 T12 250 W MH 2x4x2 T12 2x4x4 T12 32W MH Grand Total Basement 13 9 1 23 Main Area 4 2 158 8 172 Exterior 4 3 7 9 23 Storage 2 3 5 Grand Total 4 3 4 17 9 7 158 12 9 223

Siemens Industry, Inc. Soldotna Library Energy Audit Report
AkWarm ID No. CIRI‐SXQ‐CAEC‐05 Page 30 of 38
Appendix C – IR Photos / Heat Loss Signature
Heat loss around windows.
Heat loss from RTU.

Siemens Industry, Inc. Soldotna Library Energy Audit Report
AkWarm ID No. CIRI‐SXQ‐CAEC‐05 Page 31 of 38
Heat loss around book drop and main entrance.
Siemens Industry, Inc. Soldotna Library Energy Audit Report
AkWarm ID No. CIRI‐SXQ‐CAEC‐05 Page 32 of 38
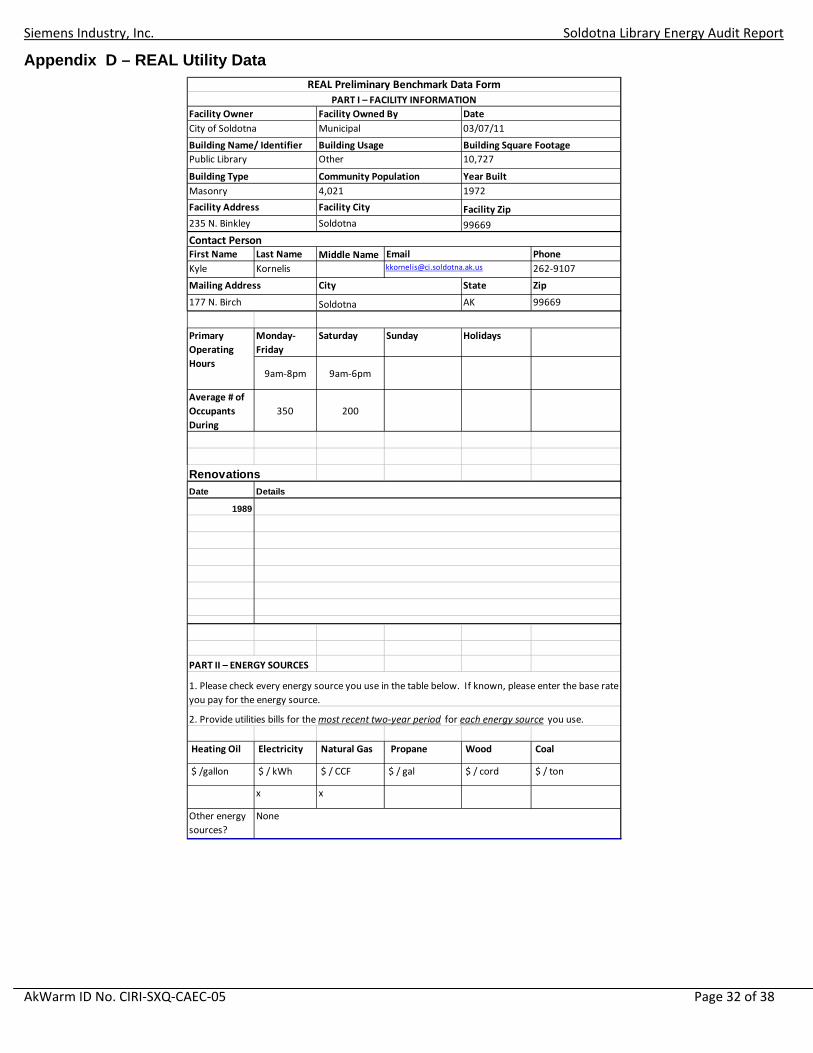
Appendix D – REAL Utility Data
First Name Last Name Middle Name PhoneKyle Kornelis 262‐9107
State Zip
AK 99669
Monday‐Friday
Saturday Sunday Holidays
9am‐8pm 9am‐6pm
Average # of Occupants During
350 200
RenovationsDate
1989
PART II – ENERGY SOURCES
Heating Oil Electricity Natural Gas Propane Wood Coal
$ /gallon $ / kWh $ / CCF $ / gal $ / cord $ / ton
x x
Other energy sources?
None
2. Provide utilities bills for the most recent two‐year period for each energy source you use.
1. Please check every energy source you use in the table below. If known, please enter the base rate you pay for the energy source.
Soldotna
Details
Soldotna
4,021
Contact Person
City
Facility City
1972
Facility Zip
99669
Building Usage Building Square Footage
Facility Owned By03/07/11Municipal Date
Primary Operating Hours
235 N. Binkley
177 N. Birch
Building Name/ Identifier
Mailing Address
REAL Preliminary Benchmark Data FormPART I – FACILITY INFORMATION
Facility OwnerCity of Soldotna
Public Library Other 10,727
Facility Address
Building TypeMasonry
Community Population Year Built

Siemens Industry, Inc. Soldotna Library Energy Audit Report
AkWarm ID No. CIRI‐SXQ‐CAEC‐05 Page 33 of 38
Soldotna Public Library
Buiding Size Input (sf) = 10,727
2009 Natural Gas Consumption (Therms) 10,8442009 Natural Gas Cost ($) 11,3532009 Electric Consumption (kWh) 130,6002009 Electric Cost ($) 22,8302009 Oil Consumption (Therms)2009 Oil Cost ($)2009 Propane Consumption (Therms)2009 Propane Cost ($)2009 Coal Consumption (Therms)2009 Coal Cost ($)2009 Wood Consumption (Therms)2009 Wood Cost ($)2009 Thermal Consumption (Therms)2009 Thermal Cost ($)2009 Steam Consumption (Therms)2009 Steam Cost ($)2009 Total Energy Use (kBtu) 1,530,1382009 Total Energy Cost ($) 34,184Annual Energy Use Intensity (EUI)
2009 Natural Gas (kBtu/sf) 101.12009 Electricity (kBtu/sf) 41.62009 Oil (kBtu/sf) 2009 Propane (kBtu/sf) 2009 Coal (kBtu/sf) 2009 Wood (kBtu/sf) 2009 Thermal (kBtu/sf) 2009 Steam (kBtu/sf) 2009 Energy Utilization Index (kBtu/sf) 142.6
Annual Energy Cost Index (ECI)2009 Natural Gas Cost Index ($/sf) 1.062009 Electric Cost Index ($/sf) 2.132009 Oil Cost Index ($/sf)2009 Propane Cost Index ($/sf)2009 Coal Cost Index ($/sf)2009 Wood Cost Index ($/sf)2009 Thermal Cost Index ($/sf)2009 Steam Cost Index ($/sf)2009 Energy Cost Index ($/sf) 3.19

Siemens Industry, Inc. Soldotna Library Energy Audit Report
AkWarm ID No. CIRI‐SXQ‐CAEC‐05 Page 34 of 38
2010 Natural Gas Consumption (Therms) 12,9902010 Natural Gas Cost ($) 11,5212010 Electric Consumption (kWh) 127,8002010 Electric Cost ($) 20,1602010 Oil Consumption (Therms)2010 Oil Cost ($)2010 Propane Consumption (Therms)2010 Propane Cost ($)2010 Coal Consumption (Therms)2010 Coal Cost ($)2010 Wood Consumption (Therms)2010 Wood Cost ($)2010 Thermal Consumption (Therms)2010 Thermal Cost ($)2010 Steam Consumption (Therms)2010 Steam Cost ($)2010 Total Energy Use (kBtu) 1,735,1812010 Total Energy Cost ($) 31,681Annual Energy Use Intensity (EUI)
2010 Natural Gas (kBtu/sf) 121.12010 Electricity (kBtu/sf) 40.72010 Oil (kBtu/sf)2010 Propane (kBtu/sf)2010 Coal (kBtu/sf)2010 Wood (kBtu/sf)2010 Thermal (kBtu/sf)2010 Steam (kBtu/sf)2010 Energy Utilization Index (kBtu/sf) 161.8
Annual Energy Cost Index (ECI)2010 Natural Gas Cost Index ($/sf) 1.072010 Electric Cost Index ($/sf) 1.882010 Oil Cost Index ($/sf)2010 Propane Cost Index ($/sf)2010 Coal Cost Index ($/sf)2010 Wood Cost Index ($/sf)2010 Thermal Cost Index ($/sf)2010 Steam Cost Index ($/sf)20010 Energy Cost Index ($/sf) 2.95
Note:1 kWh = 3,413 Btu's1 Therm = 100,000 Btu's1 CF ≈ 1,000 Btu's

Siemens Industry, Inc. Soldotna Library Energy Audit Report
AkWarm ID No. CIRI‐SXQ‐CAEC‐05 Page 35 of 38
Soldotna Public Library
Natural Gas Btus/CCF = 100,000Provider Customer # Month Start Date End Date Billing Days Consumption (CCF) Consumption (Therms) Demand Use Natural Gas Cost ($) Unit Cost ($/Therm) Demand Cost ($)
Enstar NGC 103542 Dec‐08 12/16/2008 1/14/2009 28 1,389 1,389 $1,446 $1.04Enstar NGC 103542 Jan‐09 1/14/2009 2/16/2009 32 1,111 1,111 $1,159 $1.04Enstar NGC 103542 Feb‐09 2/16/2009 3/18/2009 32 969 969 $1,012 $1.04Enstar NGC 103542 Mar‐09 3/18/2009 4/16/2009 28 672 672 $706 $1.05Enstar NGC 103542 Apr‐09 4/16/2009 5/19/2009 33 861 861 $901 $1.05Enstar NGC 103542 May‐09 5/19/2009 6/12/2009 23 858 858 $898 $1.05Enstar NGC 103542 Jun‐09 6/12/2009 7/15/2009 33 283 283 $314 $1.11Enstar NGC 103542 Jul‐09 7/15/2009 8/12/2009 27 272 272 $293 $1.08Enstar NGC 103542 Aug‐09 8/12/2009 9/14/2009 32 555 555 $585 $1.05Enstar NGC 103542 Sep‐09 9/14/2009 10/15/2009 31 980 980 $1,025 $1.05Enstar NGC 103542 Oct‐09 10/15/2009 11/17/2009 32 1,446 1,446 $1,506 $1.04Enstar NGC 103542 Nov‐09 11/17/2009 12/16/2009 29 1,448 1,448 $1,508 $1.04
Enstar NGC 103542 Dec‐09 12/16/2009 1/14/2010 28 1,489 1,489 $1,289 $0.87Enstar NGC 103542 Jan‐10 1/14/2010 2/16/2010 32 1,822 1,852 $1,574 $0.85Enstar NGC 103542 Feb‐10 2/16/2010 3/17/2010 31 1,505 1,505 $1,302 $0.87Enstar NGC 103542 Mar‐10 3/17/2010 4/14/2010 27 1,272 1,272 $1,115 $0.88Enstar NGC 103542 Apr‐10 4/14/2010 5/19/2010 35 1,219 1,219 $1,069 $0.88Enstar NGC 103542 May‐10 5/19/2010 6/15/2010 26 442 442 $396 $0.90Enstar NGC 103542 Jun‐10 6/15/2010 7/20/2010 35 667 667 $591 $0.89Enstar NGC 103542 Jul‐10 7/20/2010 8/19/2010 29 450 450 $389 $0.86Enstar NGC 103542 Aug‐10 8/19/2010 9/15/2010 26 466 466 $401 $0.86Enstar NGC 103542 Sep‐10 9/15/2010 10/21/2010 36 1,138 1,138 $938 $0.82Enstar NGC 103542 Oct‐10 10/21/2010 11/18/2010 27 1,057 1,057 $641 $0.61Enstar NGC 103542 Nov‐10 11/18/2010 12/15/2010 27 1,433 1,433 $1,815 $1.27
Dec ‐ 08 to Nov ‐ 09 total: 10,844 10,844 0 $11,353 $0.00Dec ‐ 08 to Nov ‐ 10 total: 12,960 12,990 0 $11,521 $0.00
$1.05$0.88
Dec ‐ 08 to Nov ‐ 09 avg:Dec ‐ 08 to Nov ‐ 10 avg:

Siemens Industry, Inc. Soldotna Library Energy Audit Report
AkWarm ID No. CIRI‐SXQ‐CAEC‐05 Page 36 of 38
Soldotna Public Library ‐ Natural Gas Consumption (Therms) vs. Natural Gas Cost ($)
0
200
400
600
800
1,000
1,200
1,400
1,600
1,800
2,000
Dec‐08
Jan‐09
Feb‐09
Mar‐09
Apr‐09
May‐09
Jun‐09
Jul‐09
Aug‐09
Sep‐09
Oct‐09
Nov‐09
Dec‐09
Jan‐10
Feb‐10
Mar‐10
Apr‐10
May‐10
Jun‐10
Jul‐10
Aug‐10
Sep‐10
Oct‐10
Nov‐10
Date (Mon ‐ Yr)
Natural Gas Con
sumption (The
rms)
$0
$200
$400
$600
$800
$1,000
$1,200
$1,400
$1,600
$1,800
$2,000
Natural Gas Cost ($)
Natural Gas Consumption(Therms)
Natural Gas Cost ($)

Siemens Industry, Inc. Soldotna Library Energy Audit Report
AkWarm ID No. CIRI‐SXQ‐CAEC‐05 Page 37 of 38
Soldotna Public Library
Electricity Btus/kWh = 3,413Provider Customer # Month Start Date End Date Billing Days Consumption (kWh) Consumption (Therms) Demand Use Electric Cost ($) Unit Cost ($/kWh) Demand Cost ($)HEA 2002781 Jan‐09 12/2/2008 1/5/2009 33 13,720 468 $2,841 $0.21HEA 2002781 Feb‐09 1/5/2009 2/3/2009 28 12,240 418 $2,537 $0.21HEA 2002781 Mar‐09 2/3/2009 3/3/2009 30 11,200 382 $2,323 $0.21HEA 2002781 Apr‐09 3/3/2009 4/2/2009 29 11,440 390 $1,921 $0.17HEA 2002781 May‐09 4/2/2009 4/30/2009 28 9,800 334 $1,649 $0.17HEA 2002781 Jun‐09 4/30/2009 6/1/2009 31 10,440 356 $1,755 $0.17HEA 2002781 Jul‐09 6/1/2009 7/2/2009 31 10,480 358 $1,788 $0.17HEA 2002781 Aug‐09 7/2/2009 7/30/2009 28 8,080 276 $1,384 $0.17HEA 2002781 Sep‐09 7/30/2009 8/31/2009 30 10,520 359 $1,794 $0.17HEA 2002781 Oct‐09 8/31/2009 9/30/2009 30 9,840 336 $1,459 $0.15HEA 2002781 Nov‐09 9/30/2009 11/2/2009 32 11,320 386 $1,675 $0.15HEA 2002781 Dec‐09 11/2/2009 12/3/2009 31 11,520 393 $1,704 $0.15
HEA 2002781 Jan‐10 12/3/2009 1/4/2010 29 12,360 422 $1,606 $0.13HEA 2002781 Feb‐10 1/4/2010 2/2/2010 25 11,400 389 $1,483 $0.13HEA 2002781 Mar‐10 2/2/2010 3/2/2010 32 10,120 345 $1,319 $0.13HEA 2002781 Apr‐10 3/2/2010 3/31/2010 35 10,680 365 $1,627 $0.15HEA 2002781 May‐10 3/31/2010 5/4/2010 28 11,320 386 $1,723 $0.15HEA 2002781 Jun‐10 5/4/2010 6/1/2010 27 9,320 318 $1,423 $0.15HEA 2002781 Jul‐10 6/1/2010 7/2/2010 35 9,840 336 $1,517 $0.15HEA 2002781 Aug‐10 7/2/2010 8/2/2010 29 10,400 355 $1,602 $0.15HEA 2002781 Sep‐10 8/2/2010 9/1/2010 31 10,200 348 $1,572 $0.15HEA 2002781 Oct‐10 9/1/2010 10/1/2010 31 10,080 344 $1,470 $0.15HEA 2002781 Nov‐10 10/1/2010 11/2/2010 32 11,000 375 $1,602 $0.15HEA 2002781 Dec‐10 11/2/2010 12/2/2010 30 11,080 378 $3,216 $0.29
Jan ‐ 09 to Dec ‐ 09 total: 130,600 4,457 0 $22,830 $0Jan ‐ 10 to Dec ‐ 10 total: 127,800 4,362 0 $20,160 $0
$0.17$0.16Jan ‐ 10 to Dec ‐ 10 avg:
Jan ‐ 09 to Dec ‐ 09 avg:

Siemens Industry, Inc. Soldotna Library Energy Audit Report
AkWarm ID No. CIRI‐SXQ‐CAEC‐05 Page 38 of 38
Soldotna Public Library ‐ Electric Consumption (kWh) vs. Electric Cost ($)
0
2,000
4,000
6,000
8,000
10,000
12,000
14,000
16,000
Jan‐09
Feb‐09
Mar‐09
Apr‐09
May‐09
Jun‐09
Jul‐09
Aug‐09
Sep‐09
Oct‐09
Nov‐09
Dec‐09
Jan‐10
Feb‐10
Mar‐10
Apr‐10
May‐10
Jun‐10
Jul‐10
Aug‐10
Sep‐10
Oct‐10
Nov‐10
Dec‐10
Date (Mon ‐ Yr)
Electric Con
sumption (kWh)
$0
$500
$1,000
$1,500
$2,000
$2,500
$3,000
$3,500
Electric Cost ($)
Electric Consumption (kWh)
Electric Cost ($)