energy consumption and fishing efficiency for … consumption and fishing efficiency for lobstermen...
TRANSCRIPT
Energy Consumption andFishing Efficiency for Lobstermen
1
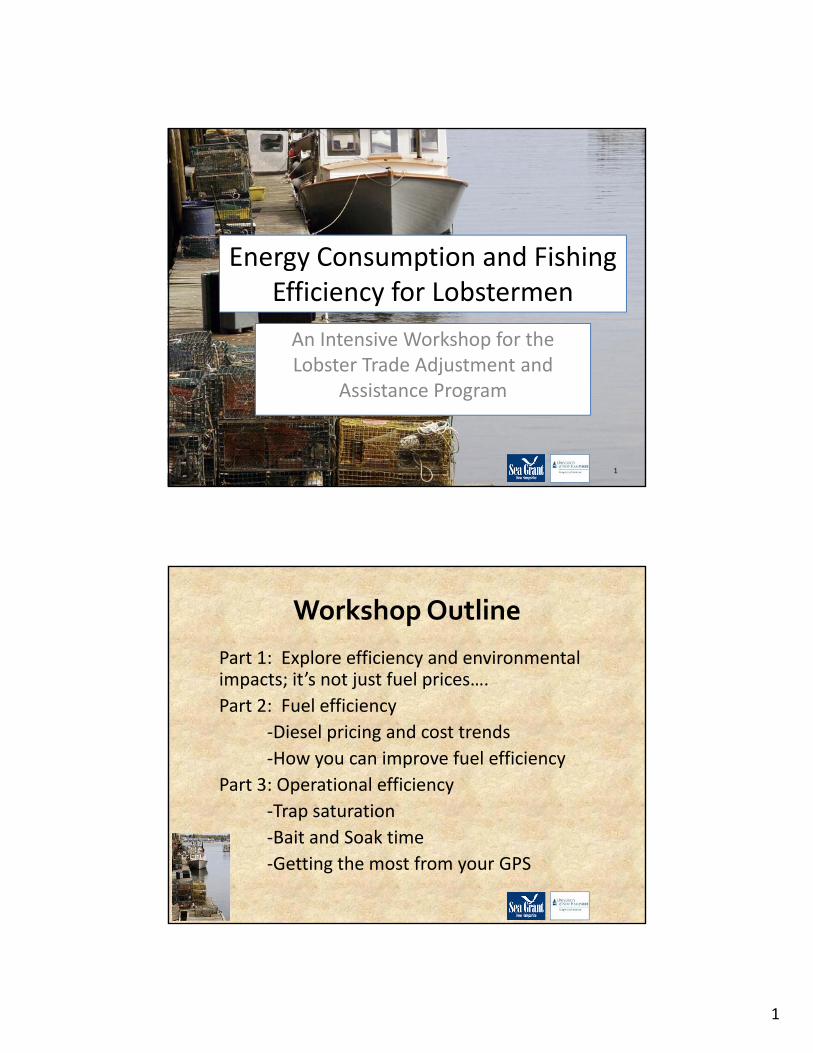
Energy Consumption and Fishing Efficiency for Lobstermen
1
An Intensive Workshop for the Lobster Trade Adjustment and
Assistance Program
Workshop Outline
Part 1: Explore efficiency and environmental impacts; it’s not just fuel prices….
Part 2: Fuel efficiency
‐Diesel pricing and cost trends
‐How you can improve fuel efficiency
Part 3: Operational efficiency
‐Trap saturation
‐Bait and Soak time
‐Getting the most from your GPS
2
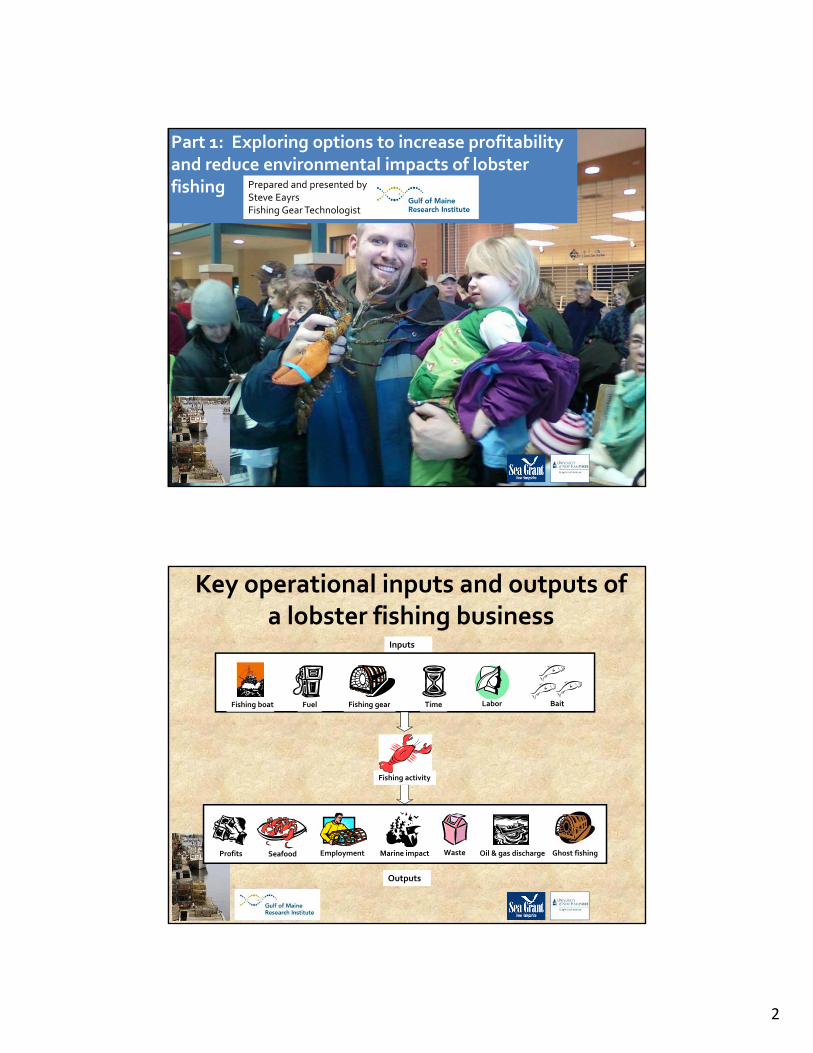
Part 1: Exploring options to increase profitability and reduce environmental impacts of lobster fishing Prepared and presented by
Steve Eayrs Fishing Gear Technologist
Key operational inputs and outputs of a lobster fishing business
Outputs
Oil & gas dischargeProfits Marine impact Ghost fishingEmployment WasteSeafood
Inputs
Fishing gearFishing boat TimeFuel Labor Bait
Fishing activity

3
How do define efficiency?
timeshandling haulingfishingsettingsearchingtravelseaattimeotal t
seabedtheonistraptimefishedtime
lobstersofcatchcatch
where,
seaattimetotal
lobsters)(#catch
seaattimetotal
fishedtimex
fishedtime
traptoattractedlobsters #x
traptoattractedlobsters #
lobsters)(#catch
efficiencytimexefficiencygearxefficiencycatchingefficiencyFishing
What is an Environmental Management System (EMS)?
An EMS is:
• a systematic and holistic process used to identify, manage and reduce environmental
impact of fishing activity
• a continuous process of improvement and refinement
• a tool to help an industry meet current and future challenges , and therefore should
include risk assessments, goals, objectives, milestones, thresholds, & responses
• helps flag areas requiring additional resources and effort
• helps identify and address regulatory and non‐regulatory responsibilities
• profit driven (reduce costs, enhance product value)……but which simultaneously has
positive environmental outcomes
* the environment is considered to be the physical surroundings and conditions that affect the lives of people
4
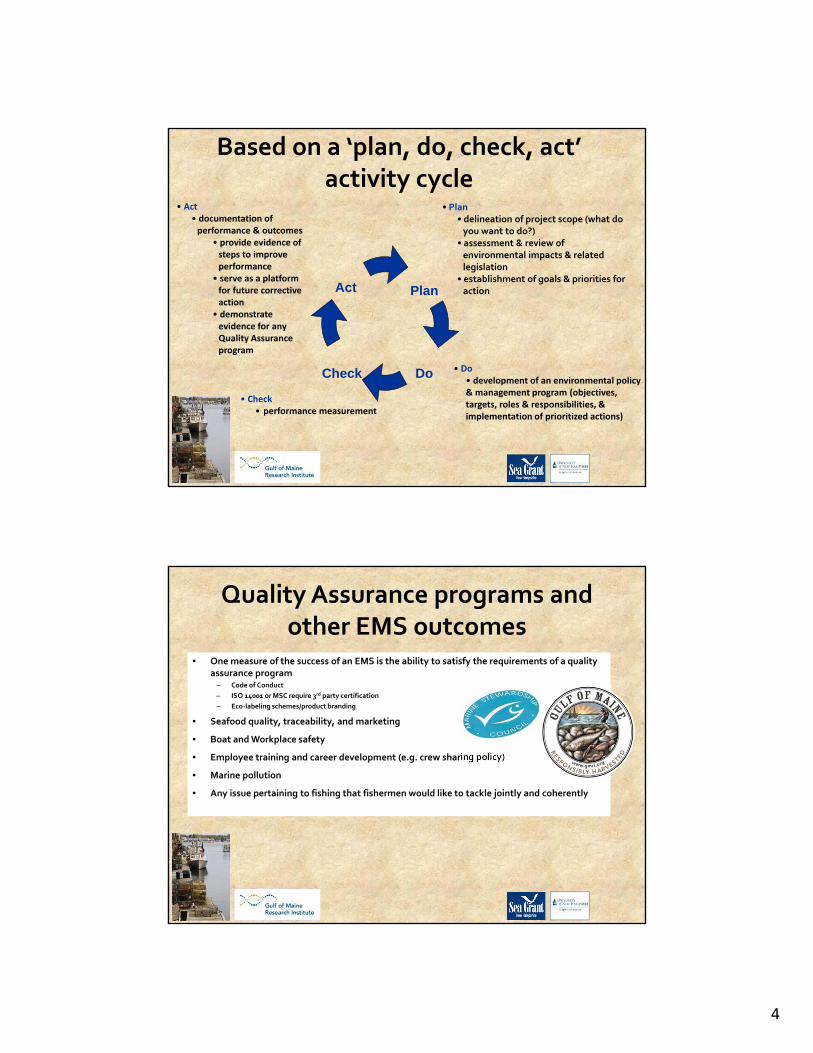
Based on a ‘plan, do, check, act’ activity cycle
• Plan• delineation of project scope (what do you want to do?)
• assessment & review of environmental impacts & related legislation
• establishment of goals & priorities for action Plan
DoCheck
Act
• Act• documentation of performance & outcomes
• provide evidence of steps to improve performance
• serve as a platform for future corrective action
• demonstrate evidence for any Quality Assurance program
• Check• performance measurement
• Do• development of an environmental policy & management program (objectives, targets, roles & responsibilities, & implementation of prioritized actions)
Quality Assurance programs and other EMS outcomes
• One measure of the success of an EMS is the ability to satisfy the requirements of a quality assurance program
– Code of Conduct
– ISO 14001 or MSC require 3rd party certification
– Eco‐labeling schemes/product branding
• Seafood quality, traceability, and marketing
• Boat and Workplace safety
• Employee training and career development (e.g. crew sharing policy)
• Marine pollution
• Any issue pertaining to fishing that fishermen would like to tackle jointly and coherently

5
Risk assessment….in response to a perceived or real threat
Likelihood x Consequence = RiskConsequence levels of impact
Consequence Score Definition
Negligible 0 Very insignificant impacts. Unlikely to be measureable
Minor 1 Possible detectable but minimal impact on structure or function
Moderate 2 Max acceptable level of impact, recovery measured in months or years
Severe 3 This level will result in wider and longer term impacts, recovery measured in years
Major 4 Very serious impacts with relatively long timeframe likely to be needed to restore to acceptable level, recovery measured in years to decades
Catastrophic 5 Widespread and permanent/irreversible damage or loss will occur, unlikely to ever be fixed
Likelihood levels of impact
Likelihood Score Definition
Likely 6 It is expected to occur
Occasional 5 May occur
Possible 4 Some evidence to suggest this may possibly occur
Unlikely 3 Uncommon, but has been known to occur
Rare 2 May occur in exception circumstances
Remote 1 Never heard of, but not impossible
Risk ranking category
Score Category
0 = Negligible risk
1 ‐ 6 = Low risk
8 ‐ 12 = Moderate risk
14 ‐ 18 = High risk
20 ‐ 30 = Extreme risk
Energy audits – a 3‐stage process
• Stage 1– Broad overview of energy consumption, operational inputs and outputs– Is the consumption excessive? When is it excessive?
• Stage 2– Detail evaluation including mapping of relative sources of
consumption– Identify major consumers and recommend options
• Stage 3– Detailed focus on major sources of
consumption– Costed recommendations for potential
savings
Accuracy of assessment of costs and savings
6
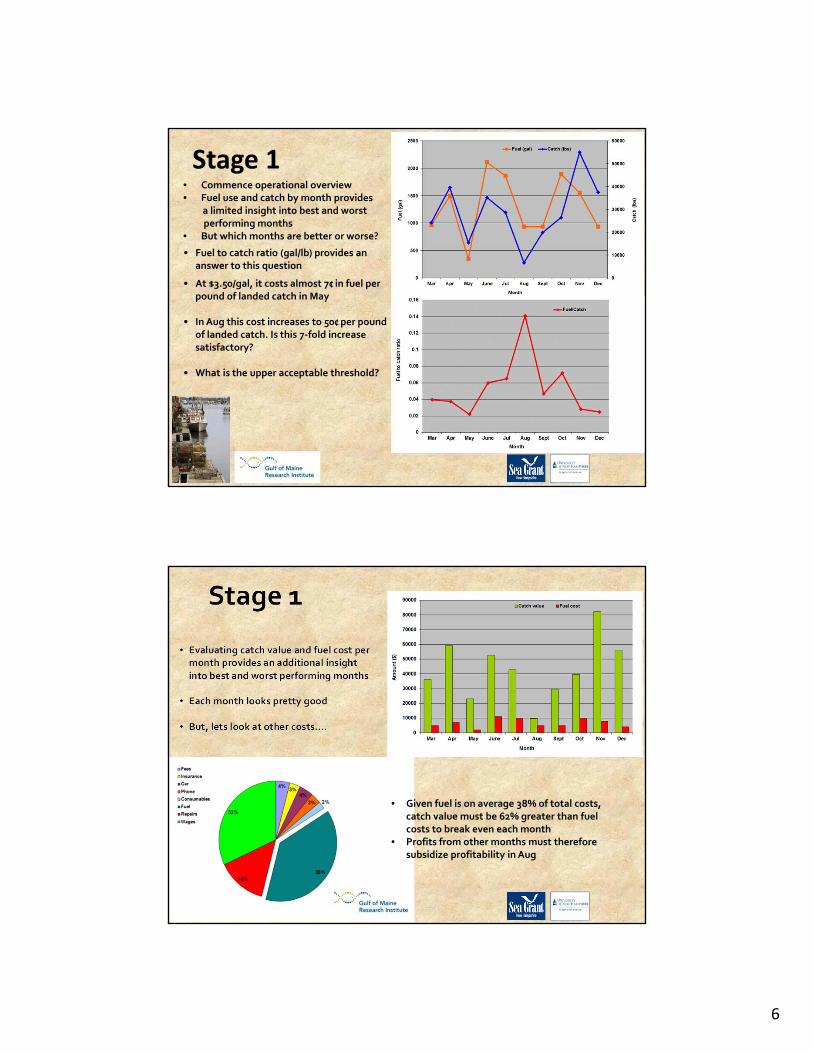
Stage 1• Commence operational overview• Fuel use and catch by month provides
a limited insight into best and worst performing months
• But which months are better or worse?
• Fuel to catch ratio (gal/lb) provides ananswer to this question
• At $3.50/gal, it costs almost 7₵ in fuel per pound of landed catch in May
• In Aug this cost increases to 50₵ per pound of landed catch. Is this 7‐fold increase satisfactory?
• What is the upper acceptable threshold?
Stage 1
• Evaluating catch value and fuel cost per month provides an additional insightinto best and worst performing months
• Each month looks pretty good
• But, lets look at other costs….
• Given fuel is on average 38% of total costs, catch value must be 62% greater than fuel costs to break even each month
• Profits from other months must therefore subsidize profitability in Aug
7
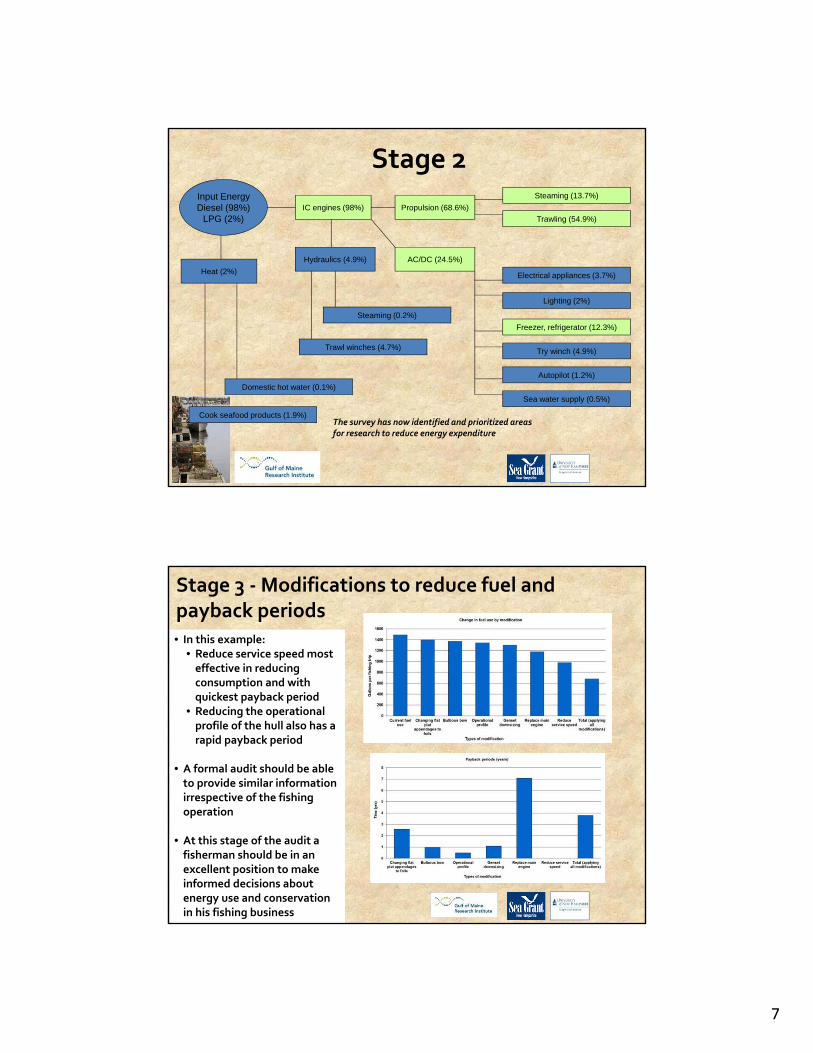
Stage 2Input EnergyDiesel (98%)
LPG (2%)
Cook seafood products (1.9%)
Domestic hot water (0.1%)
IC engines (98%)
Heat (2%)
Propulsion (68.6%)
AC/DC (24.5%)Hydraulics (4.9%)
Trawl winches (4.7%)
Freezer, refrigerator (12.3%)
Trawling (54.9%)
Steaming (13.7%)
Lighting (2%)
Electrical appliances (3.7%)
Try winch (4.9%)
Steaming (0.2%)
Sea water supply (0.5%)
Autopilot (1.2%)
The survey has now identified and prioritized areas for research to reduce energy expenditure
Stage 3 ‐Modifications to reduce fuel and payback periods• In this example:
• Reduce service speed most effective in reducing consumption and with quickest payback period
• Reducing the operational profile of the hull also has a rapid payback period
• A formal audit should be able to provide similar information irrespective of the fishing operation
• At this stage of the audit a fisherman should be in an excellent position to make informed decisions about energy use and conservation in his fishing business
8
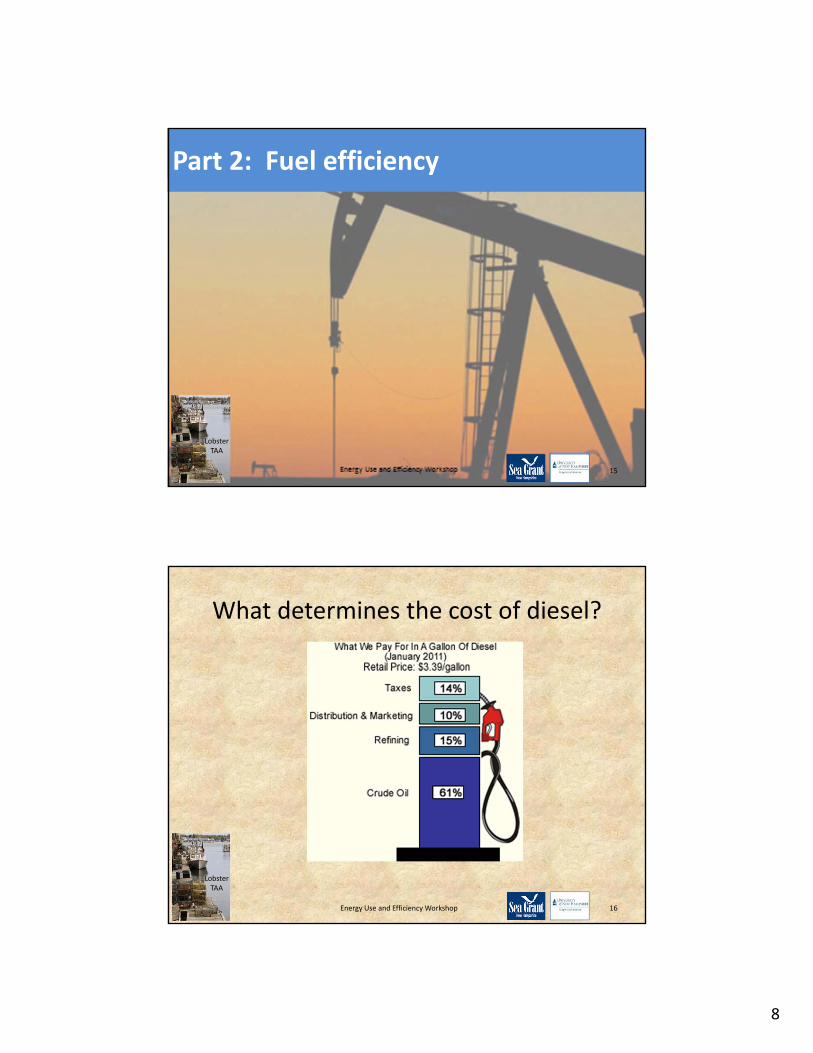
Part 2: Fuel efficiency
Lobster TAA
15
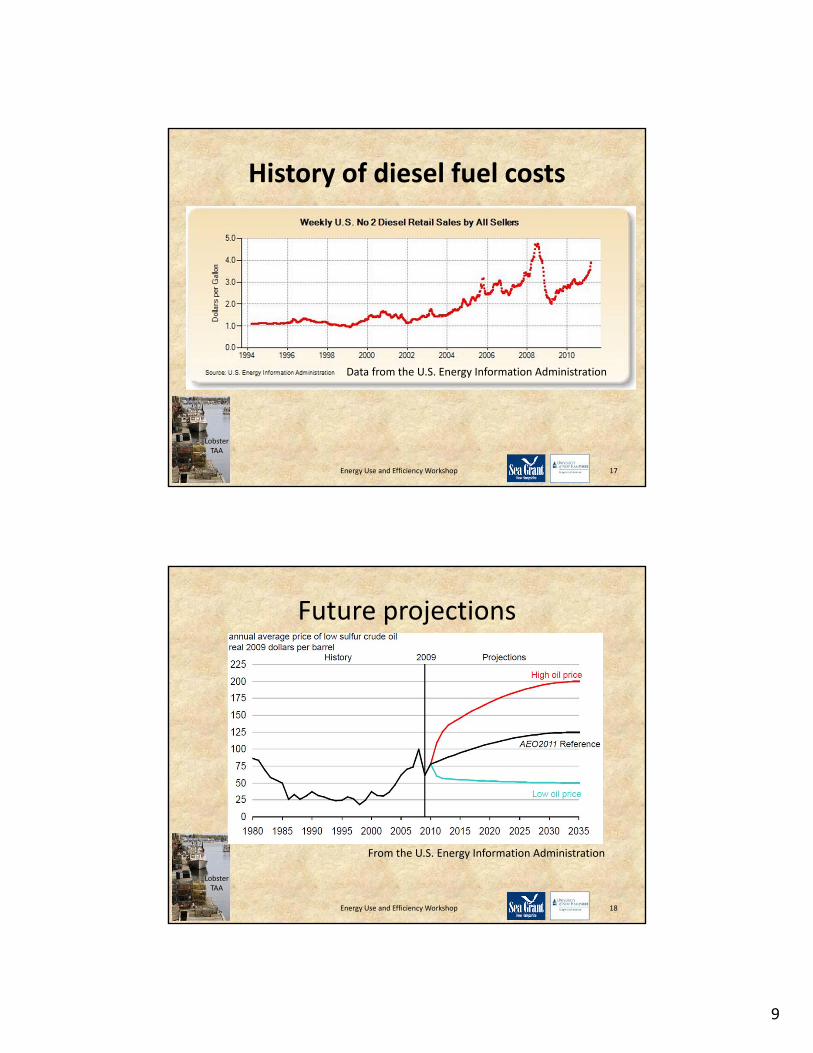
What determines the cost of diesel?
Lobster TAA
Energy Use and Efficiency Workshop 16
9
History of diesel fuel costs
Lobster TAA
Energy Use and Efficiency Workshop 17
Data from the U.S. Energy Information Administration
Future projections
Lobster TAA
Energy Use and Efficiency Workshop 18
From the U.S. Energy Information Administration
10
Main causes of fuel inefficiency
Lobster TAA
Energy Use and Efficiency Workshop 19
• Vessel operations– Working against tide– Traveling too fast (high rpms)
• Vessel maintenance– Hulls & engines
• Hull designs – Wider is not better (L:W)
• Propellers– Type– Pitch– Maintenance
What can I do to save fuel?
• Focus on short term
• What is practical?
• What is affordable?
• What is measurable?
• What will give the best rate of return?
Lobster TAA
Energy Use and Efficiency Workshop 20
11
What can I do to save fuel?Fuel Meters
• What do they do?
• What information can you get from them?
• What kinds are available?
• What do they cost and what are installation costs?
Lobster TAA
Energy Use and Efficiency Workshop 21
What can I do to save fuel?Fuel Meters
What do they do?
• Fuel flow or consumption meters allow a vessel operator to;
– Monitor fuel
– Ration fuel consumption
– Monitor real‐time fuel consumption;
– Test engine fuel consumption
Lobster TAA
Energy Use and Efficiency Workshop 22
12
What can I do to save fuel?Fuel Meters
What kinds are available?• Float and gauge
– Indicates fuel remaining in tank– Poor accuracy – Relatively inexpensive usually part of a standard
electronics array
• Fuel flow/consumption meters and management systems– show exactly how much fuel you've used, and how fast
you're using it at your engine.– receive immediate and accurate data– More expensive than float and gauge $300 ‐ $3,000.00
Lobster TAA
Energy Use and Efficiency Workshop 23
What can I do to save fuel?Fuel Meters
Types of fuel flow or consumption meters?• Fuel flow
– Provides real‐time fuel consumption and fuel usage rates as well as vessel rpm’s.
– Lower cost alternative to fuel management system
• Electronic fuel management system– Monitors fuel use and records data for long‐term usage and evaluation statistics.
– More costly to purchase and install.Lobster TAA
Energy Use and Efficiency Workshop 24
13
What can I do to save fuel?Change Operator Behavior
• Use a fuel consumption meter or management system to;– Understand the benefit of reducing RPM’s to minimize fuel consumption when steaming to fishing grounds and returning to shore.
– Make better overall operation decisions to maintain and enhance fuel efficiency.
(10% reduction in RPM’s from full throttle can reduce fuel consumption by 20%)
Lobster TAA
Energy Use and Efficiency Workshop 25
What can I do to save fuel?Maintenance
• Hull Fouling – significantly increases vessels drag and fuel consumption by up to 24%
• Propeller Fouling – a fouled propeller can increase fuel consumption by 14%
Lobster TAA
Energy Use and Efficiency Workshop 26
14
What can I do to save fuel?Maintenance
Recommendations
• Annual hull and propeller cleaning
• Anti‐fouling paint on hull (smoother the less drag)
Lobster TAA
Energy Use and Efficiency Workshop 27
What can I do to save fuel?Engine Maintenance
• Do you have a regular engine maintenance schedule?
– fuel filters
– oil changes
• How regularly are your engine stacks cleaned?
Lobster TAA
Energy Use and Efficiency Workshop 28
15
What can I do to save fuel?Propellers
Key element – diameter and pitch
• Wider diameter can improve fuel economy
• Studies demonstrated 30% reduction in fuel consumption at cruising speed, and a 27 percent increase in bollard pull (maximum towing force) with a larger diameter propeller.
Lobster TAA
Energy Use and Efficiency Workshop 29
What can I do to save fuel?Propellers
How Diameter and Pitch Affect Performance• Propeller diameter increases with the size of the vessel– Larger vessel larger diameter
• Producing more power or propulsive force
• Pitch– Check to see that you have the right pitch for your
boat and the way you use your boat.• A vessel that stops and starts may benefit from having a
lower pitch. A vessel that operates more continuously may benefit having a higher pitch.
Lobster TAA
Energy Use and Efficiency Workshop 30
16
What can I do to save fuel?Propellers
How to Pick the Right Replacement Prop
1. Find the recommended prop diameter. This should be included in your owner's manual. It is also usually stamped near the original prop's shaft hole (if you are replacing an older prop).
2. There are two numbers. The first is the recommended diameter (in inches). The second is pitch (how far the boat travels with each revolution).
3. Use a measuring tape to measure the distance from the edge of one blade to the center of the shaft hole. This will give you the prop's radius.
Lobster TAA
Energy Use and Efficiency Workshop 31
What can I do to save fuel?Propellers
How to Pick the Right Boat Prop
4. Multiply this number by (2) to obtain the prop's diameter. Match this to your manufacturer's recommendations to ensure your new prop is a perfect fit.
5. Check the pitch of your new prop. This is stamped either on the package or near the shaft hole. Match this to your manufacturer's recommendations.
Lobster TAA
Energy Use and Efficiency Workshop 32
17
Bulbous Bows – How do they Work?
Lobster TAA
Energy Use and Efficiency Workshop 33
The vessel hull pushes water aside as the vessel moves through the water
– This creates a “bow wave”
• Bow Waves
– Produce drag on the vessel causing the engine to work harder (i.e. burn more fuel) to move through the water
Bulbous Bows – How do they Work?
Lobster TAA
Energy Use and Efficiency Workshop 34
• Hull Speed
– The length of the bow wave matches the length of the vessel hull
– Therefore, the boat operates in the trough of the wave
18
Bulbous Bows – How do they Work?
Lobster TAA
Energy Use and Efficiency Workshop 35
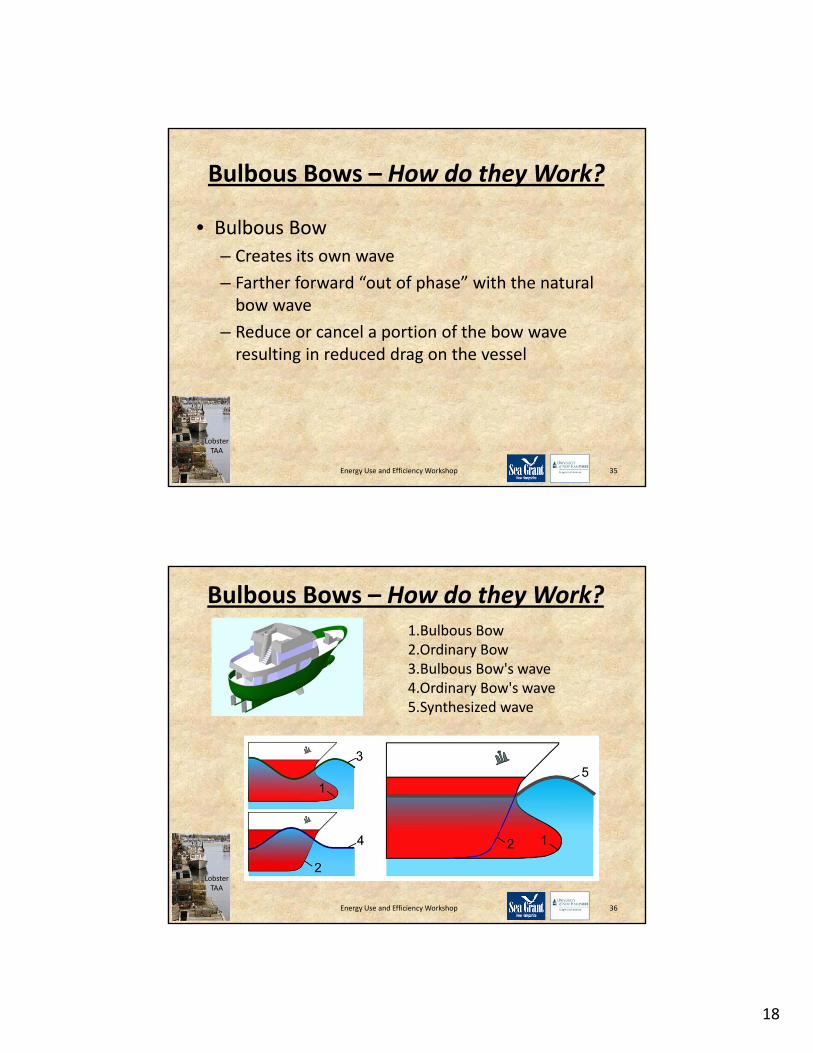
• Bulbous Bow
– Creates its own wave
– Farther forward “out of phase” with the natural bow wave
– Reduce or cancel a portion of the bow wave resulting in reduced drag on the vessel
Bulbous Bows – How do they Work?
Lobster TAA
Energy Use and Efficiency Workshop 36
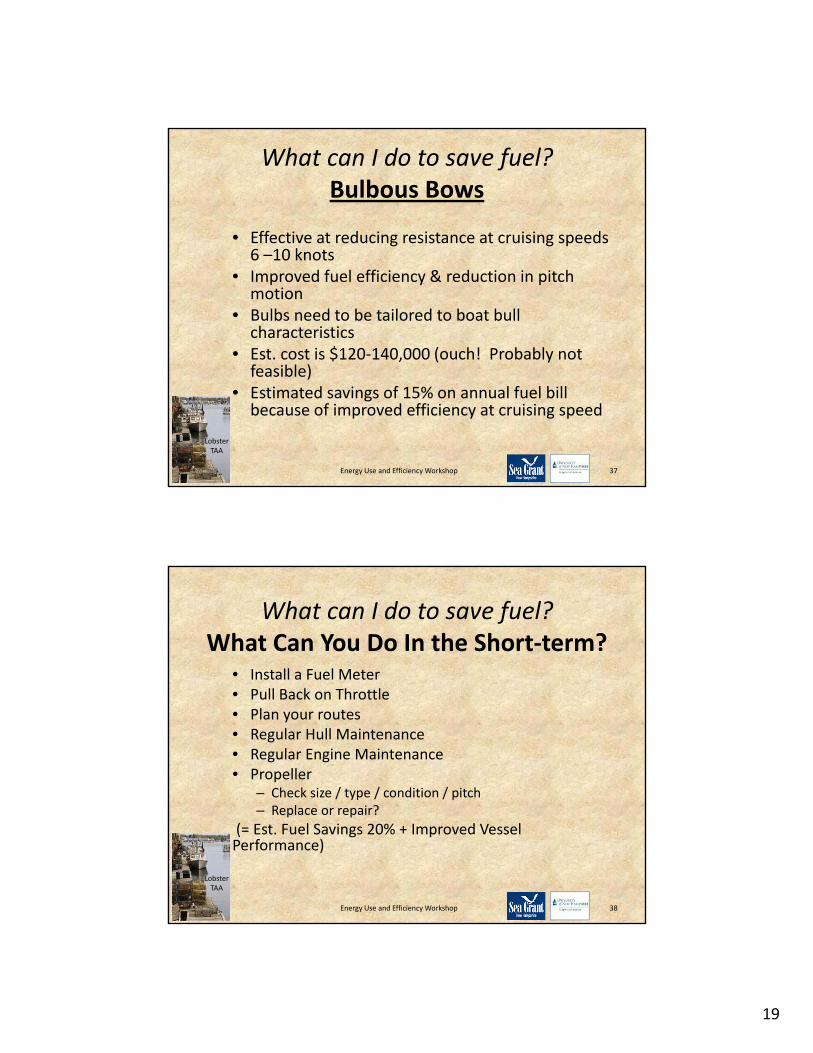
1.Bulbous Bow 2.Ordinary Bow 3.Bulbous Bow's wave 4.Ordinary Bow's wave 5.Synthesized wave
19
What can I do to save fuel?Bulbous Bows
• Effective at reducing resistance at cruising speeds 6 –10 knots
• Improved fuel efficiency & reduction in pitch motion
• Bulbs need to be tailored to boat bull characteristics
• Est. cost is $120‐140,000 (ouch! Probably not feasible)
• Estimated savings of 15% on annual fuel bill because of improved efficiency at cruising speed
Lobster TAA
Energy Use and Efficiency Workshop 37
What can I do to save fuel?What Can You Do In the Short‐term?
• Install a Fuel Meter• Pull Back on Throttle• Plan your routes• Regular Hull Maintenance• Regular Engine Maintenance• Propeller
– Check size / type / condition / pitch– Replace or repair?
(= Est. Fuel Savings 20% + Improved Vessel Performance)
Lobster TAA
Energy Use and Efficiency Workshop 38
20
What can I do to save fuel?What Can You Do In the Longer‐term?
• New vessel construction
• Designed for energy efficiency & performance
Lobster TAA
Energy Use and Efficiency Workshop 39
Part 3: Other ways to increase operational efficiency…
Trap Saturation
• So you have 800 traps, do you need them all, or should you be using more?
• How to evaluate trap efficiency and identify if trap saturation is occurring
Lobster TAA
Energy Use and Efficiency Workshop 40
21
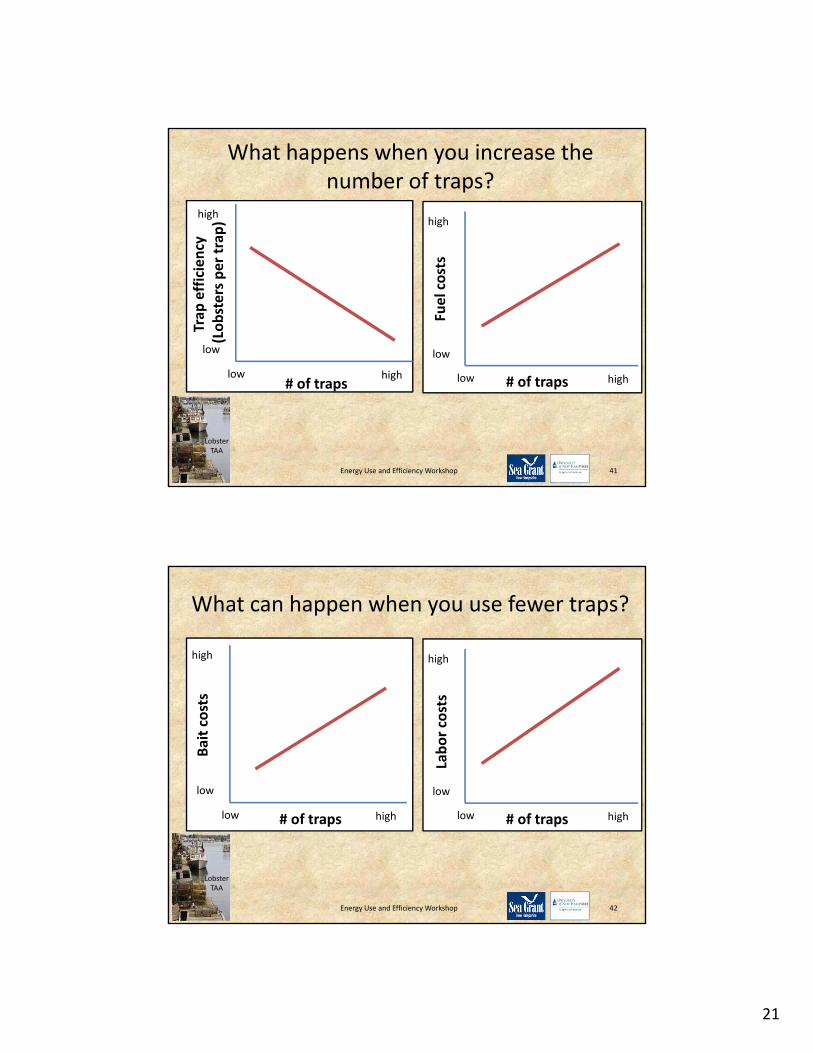
What happens when you increase the number of traps?
Lobster TAA
Energy Use and Efficiency Workshop 41
# of traps
Trap
efficiency
(Lobsters per trap
)
low
low high
high
# of traps
Fuel costs
low
low high
high
What can happen when you use fewer traps?
Lobster TAA
Energy Use and Efficiency Workshop 42
# of traps
Bait costs
low
low high
high
# of traps
Labor costs
low
low high
high
22
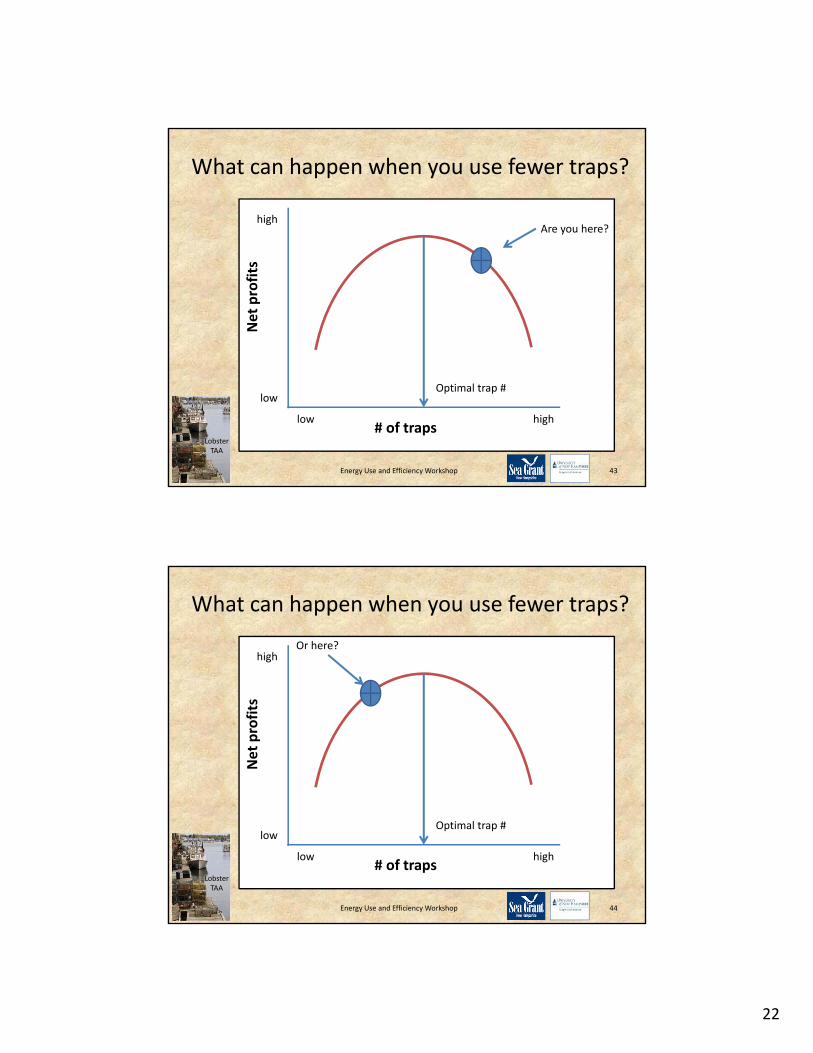
What can happen when you use fewer traps?
Lobster TAA
Energy Use and Efficiency Workshop 43
# of traps
Net profits
low
low high
high
Optimal trap #
Are you here?
What can happen when you use fewer traps?
Lobster TAA
Energy Use and Efficiency Workshop 44
# of traps
Net profits
low
low high
high
Optimal trap #
Or here?
23
What can I do to save fuel?Improve Trap Efficiency (example)
• Monhegan Island example
Lobster TAA
Energy Use and Efficiency Workshop 45
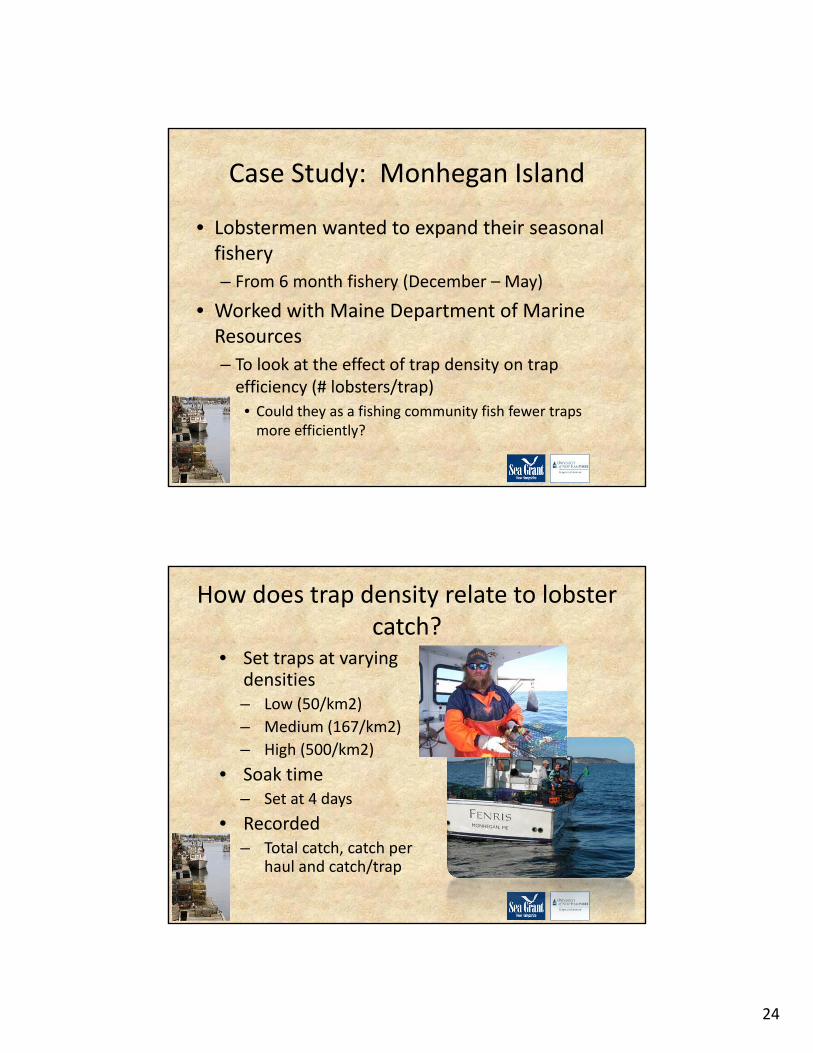
Case Study: Monhegan Island• Monhegan Island Conservation Area (MILCA)– Seasonal winter fishery since 1907
• Remains as the only area closed to fishing during summer and fall
– Was officially recognized as a conservation area in 1998
• Limited to 17 lobstermen
• 95 km2 immediately surrounding MonheganIsland, ME.
24
• Lobstermen wanted to expand their seasonal fishery
– From 6 month fishery (December – May)
• Worked with Maine Department of Marine Resources
– To look at the effect of trap density on trap efficiency (# lobsters/trap)
• Could they as a fishing community fish fewer traps more efficiently?
Case Study: Monhegan Island
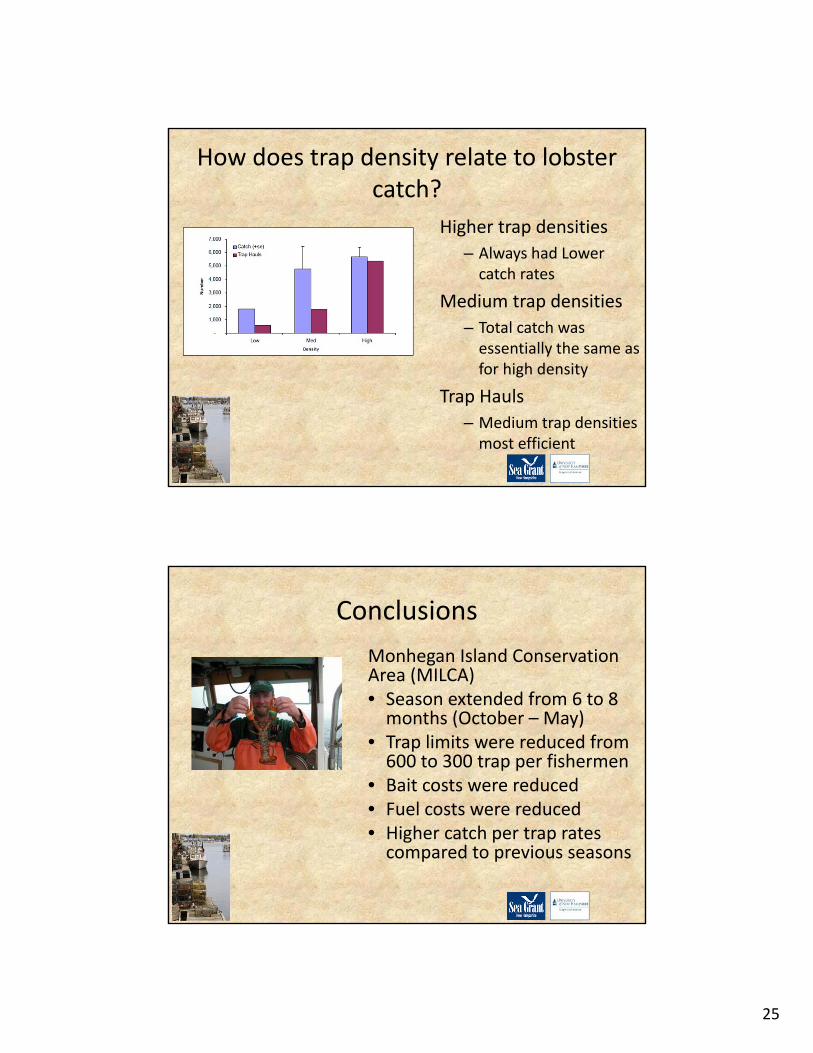
How does trap density relate to lobster catch?
• Set traps at varying densities– Low (50/km2)
– Medium (167/km2)
– High (500/km2)
• Soak time– Set at 4 days
• Recorded – Total catch, catch per
haul and catch/trap
25
Higher trap densities
– Always had Lower catch rates
Medium trap densities
– Total catch was essentially the same as for high density
Trap Hauls
– Medium trap densities most efficient
How does trap density relate to lobster catch?
Conclusions
Monhegan Island Conservation Area (MILCA)• Season extended from 6 to 8 months (October – May)
• Trap limits were reduced from 600 to 300 trap per fishermen
• Bait costs were reduced• Fuel costs were reduced• Higher catch per trap rates compared to previous seasons
26
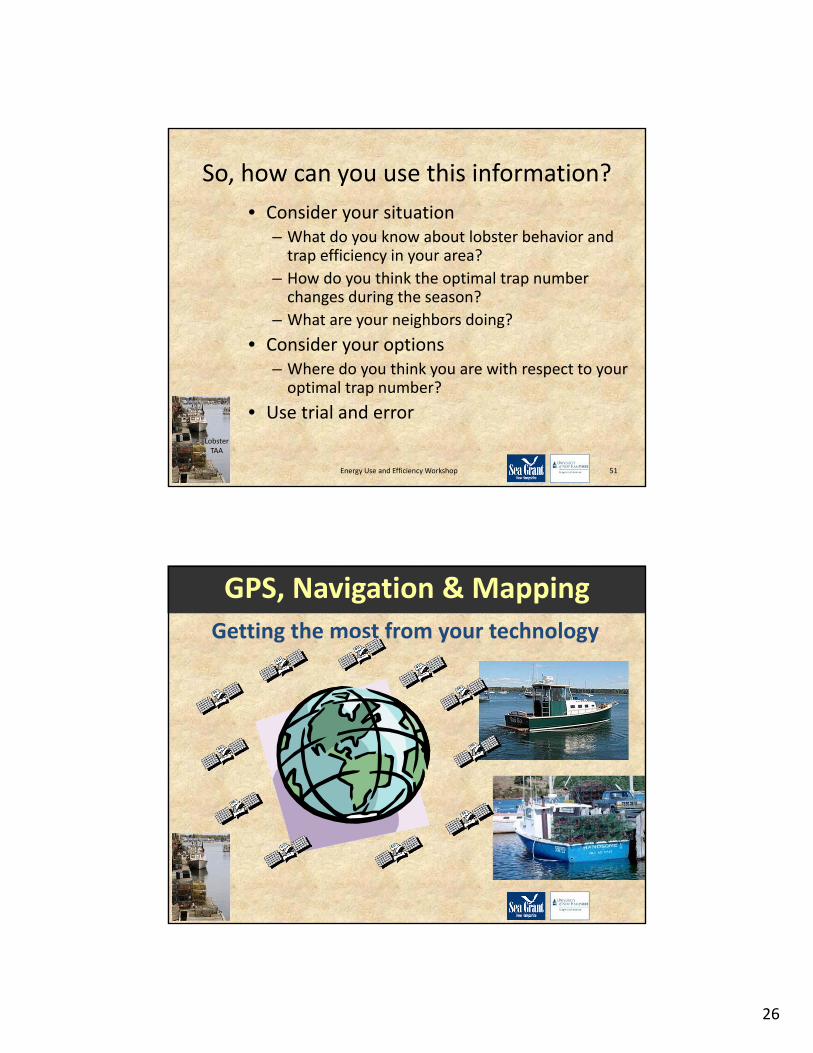
So, how can you use this information?
• Consider your situation– What do you know about lobster behavior and trap efficiency in your area?
– How do you think the optimal trap number changes during the season?
– What are your neighbors doing?
• Consider your options– Where do you think you are with respect to your optimal trap number?
• Use trial and error
Lobster TAA
Energy Use and Efficiency Workshop 51
GPS, Navigation & Mapping
Getting the most from your technology
27
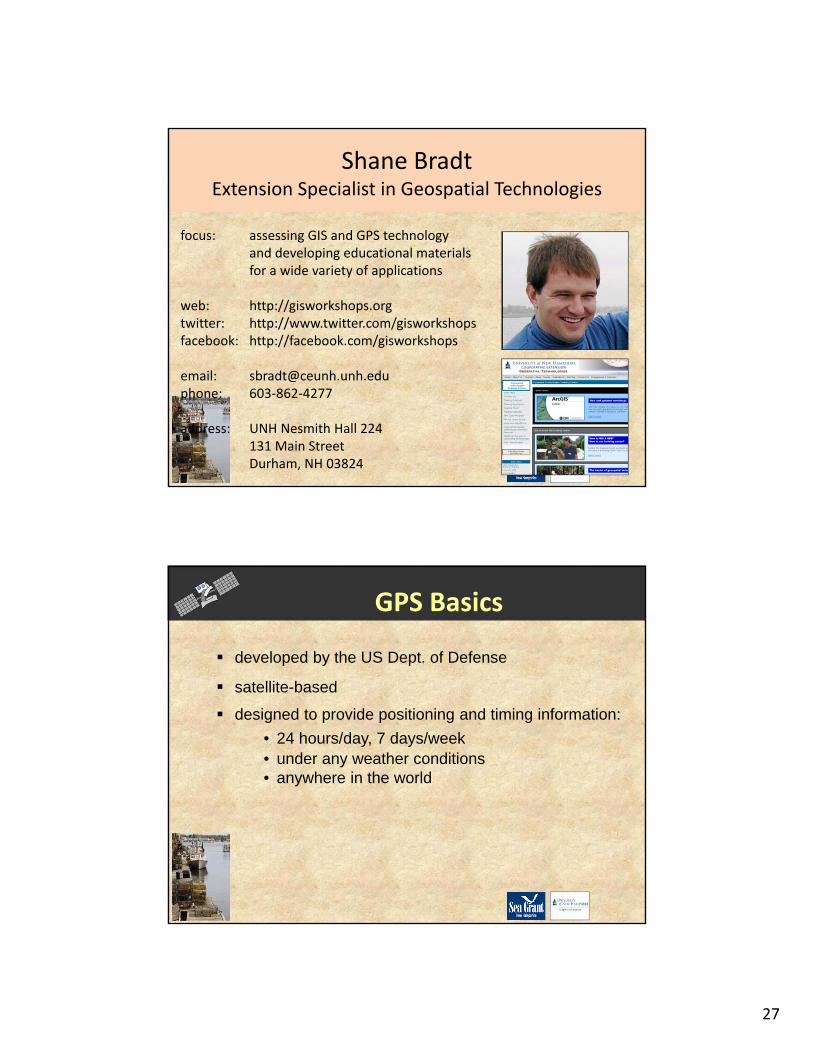
Shane BradtExtension Specialist in Geospatial Technologies
focus: assessing GIS and GPS technologyand developing educational materialsfor a wide variety of applications
web: http://gisworkshops.orgtwitter: http://www.twitter.com/gisworkshops facebook: http://facebook.com/gisworkshops
email: [email protected]: 603‐862‐4277
address: UNH Nesmith Hall 224131 Main StreetDurham, NH 03824
GPS Basics
developed by the US Dept. of Defense
satellite-based
designed to provide positioning and timing information:
• 24 hours/day, 7 days/week• under any weather conditions• anywhere in the world
28
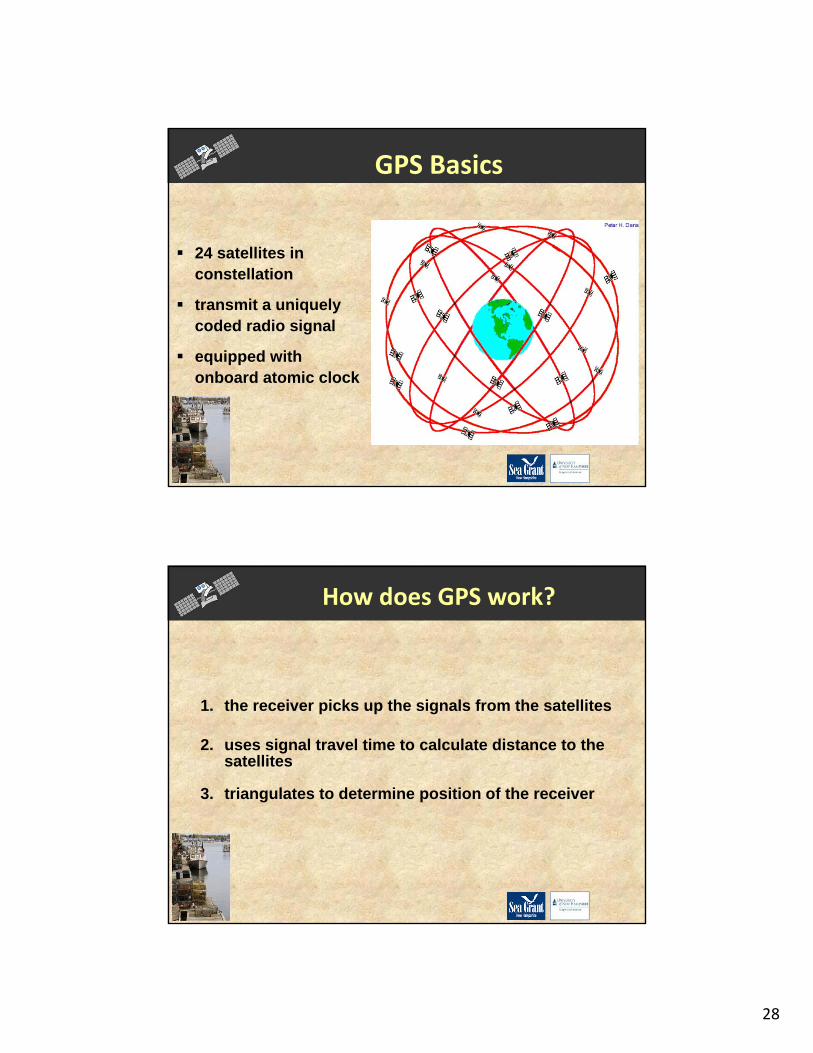
24 satellites in constellation
transmit a uniquely coded radio signal
equipped with onboard atomic clock
GPS Basics
1. the receiver picks up the signals from the satellites
2. uses signal travel time to calculate distance to the satellites
3. triangulates to determine position of the receiver
How does GPS work?
29
Earth
Space
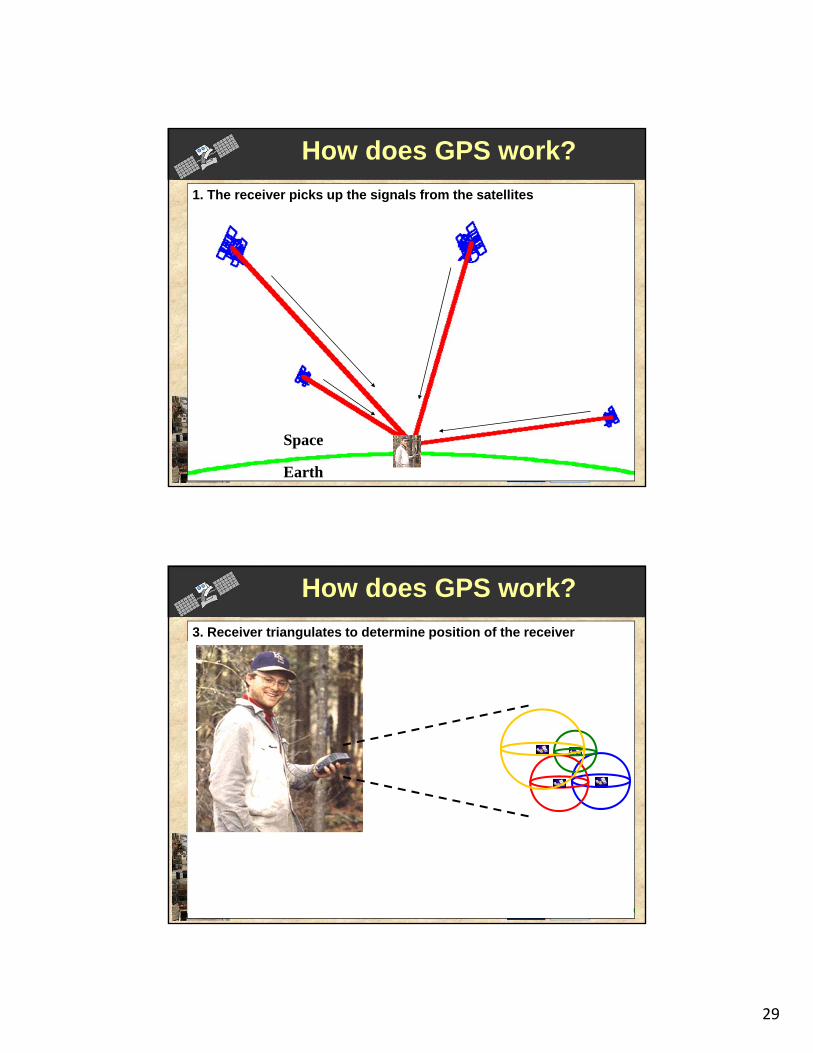
1. The receiver picks up the signals from the satellites
How does GPS work?
Earth
Space
2. Travel time of signal from satellite used to calculate distance3. Receiver triangulates to determine position of the receiver
How does GPS work?
30
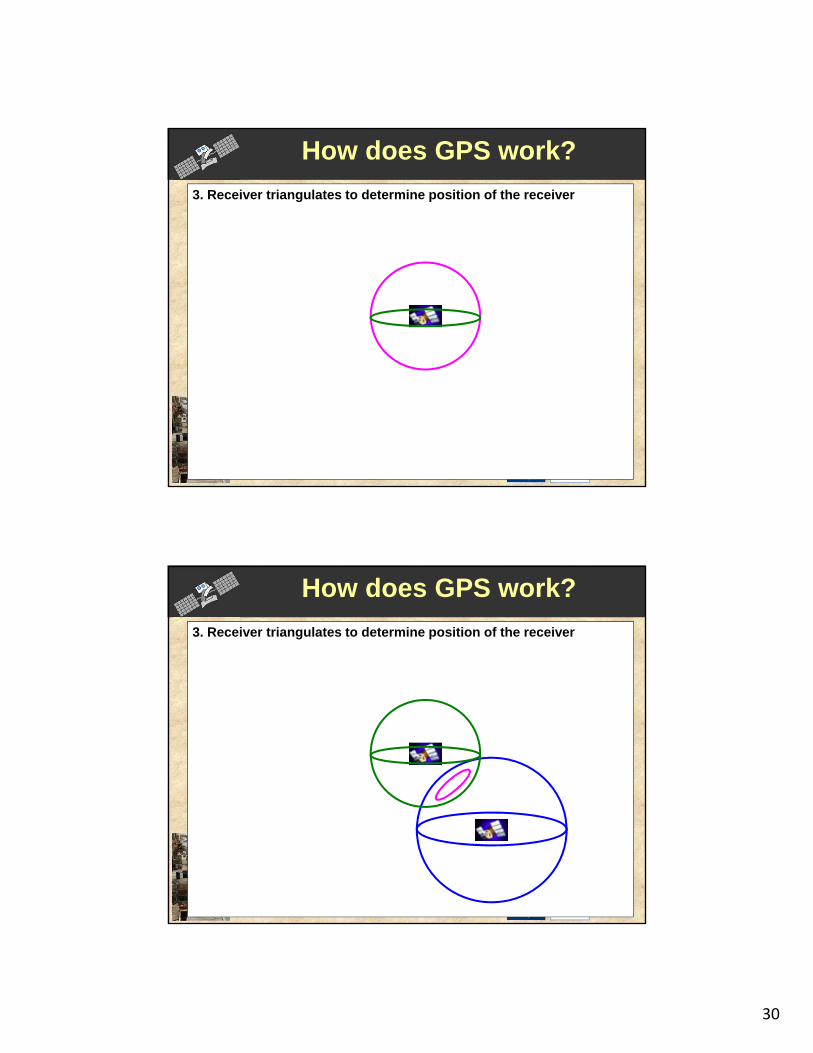
3. Receiver triangulates to determine position of the receiver
How does GPS work?
3. Receiver triangulates to determine position of the receiver
How does GPS work?
31
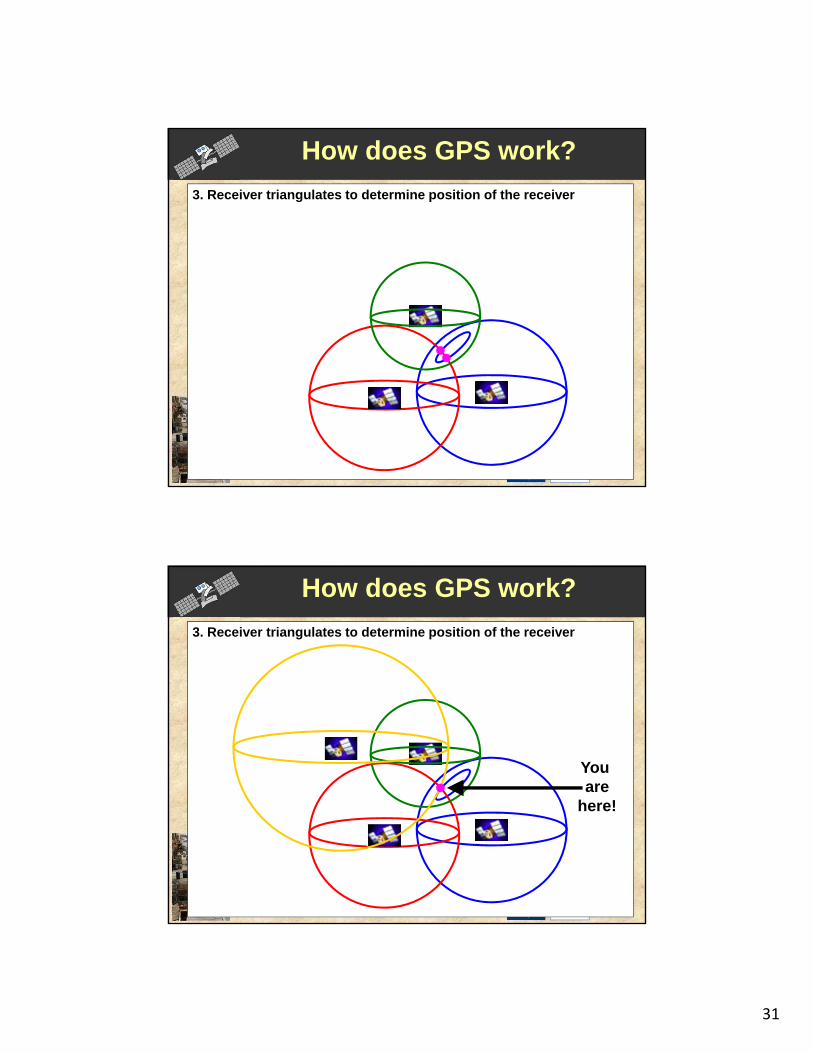
How does GPS work?
3. Receiver triangulates to determine position of the receiver
GPSHow does GPS work?
3. Receiver triangulates to determine position of the receiver
You are
here!
How does GPS work?
32
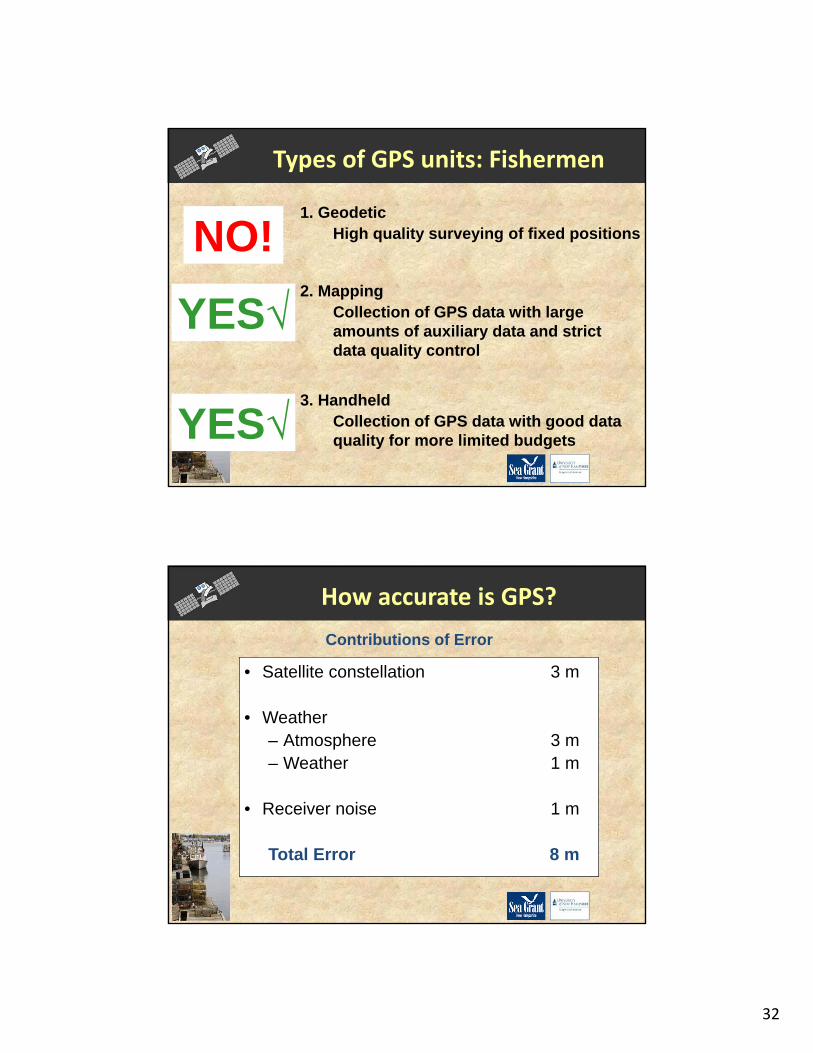
1. GeodeticHigh quality surveying of fixed positions
2. Mapping Collection of GPS data with large amounts of auxiliary data and strict data quality control
3. HandheldCollection of GPS data with good data quality for more limited budgets
Types of GPS units: Fishermen
NO!
YES√
YES√
• Satellite constellation 3 m
• Weather– Atmosphere 3 m– Weather 1 m
• Receiver noise 1 m
Total Error 8 m
How accurate is GPS?
Contributions of Error
33
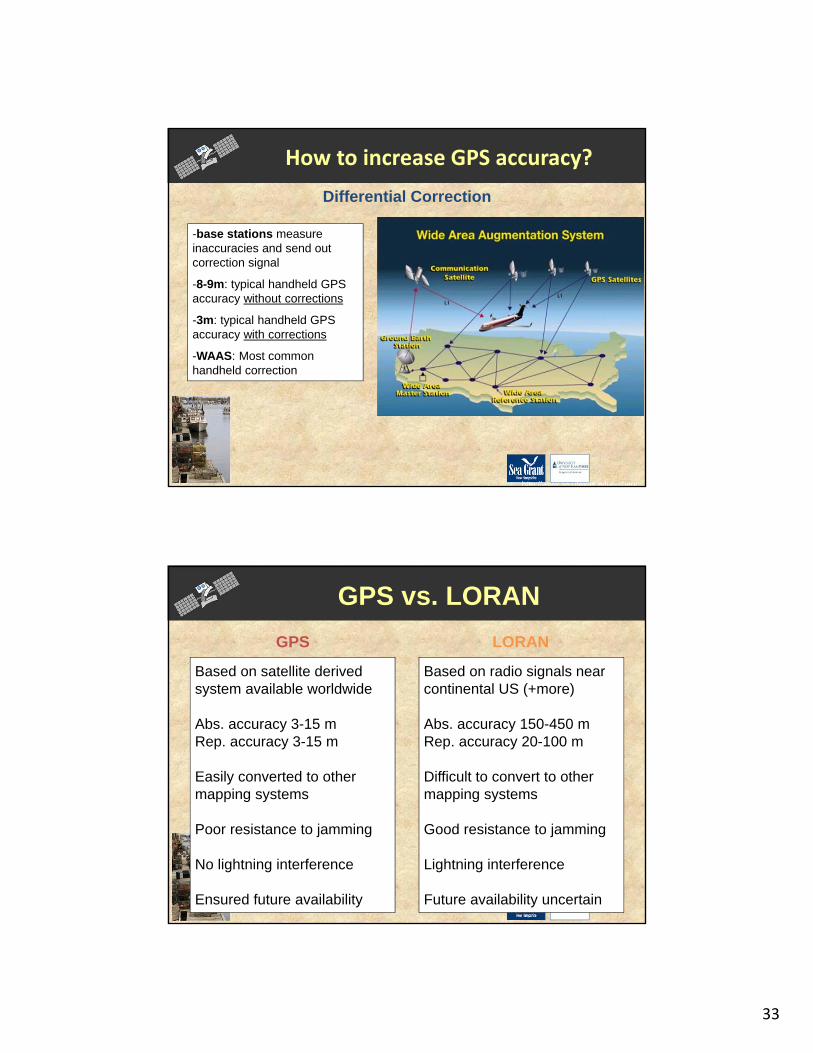
-base stations measure inaccuracies and send out correction signal
-8-9m: typical handheld GPS accuracy without corrections
-3m: typical handheld GPS accuracy with corrections
-WAAS: Most common handheld correction
http://www.ae.utexas.edu/~shep/
How to increase GPS accuracy?
Differential Correction
Based on radio signals near continental US (+more)
Abs. accuracy 150-450 mRep. accuracy 20-100 m
Difficult to convert to other mapping systems
Good resistance to jamming
Lightning interference
Future availability uncertain
GPS vs. LORAN
GPS
Based on satellite derived system available worldwide
Abs. accuracy 3-15 mRep. accuracy 3-15 m
Easily converted to other mapping systems
Poor resistance to jamming
No lightning interference
Ensured future availability
LORAN
34
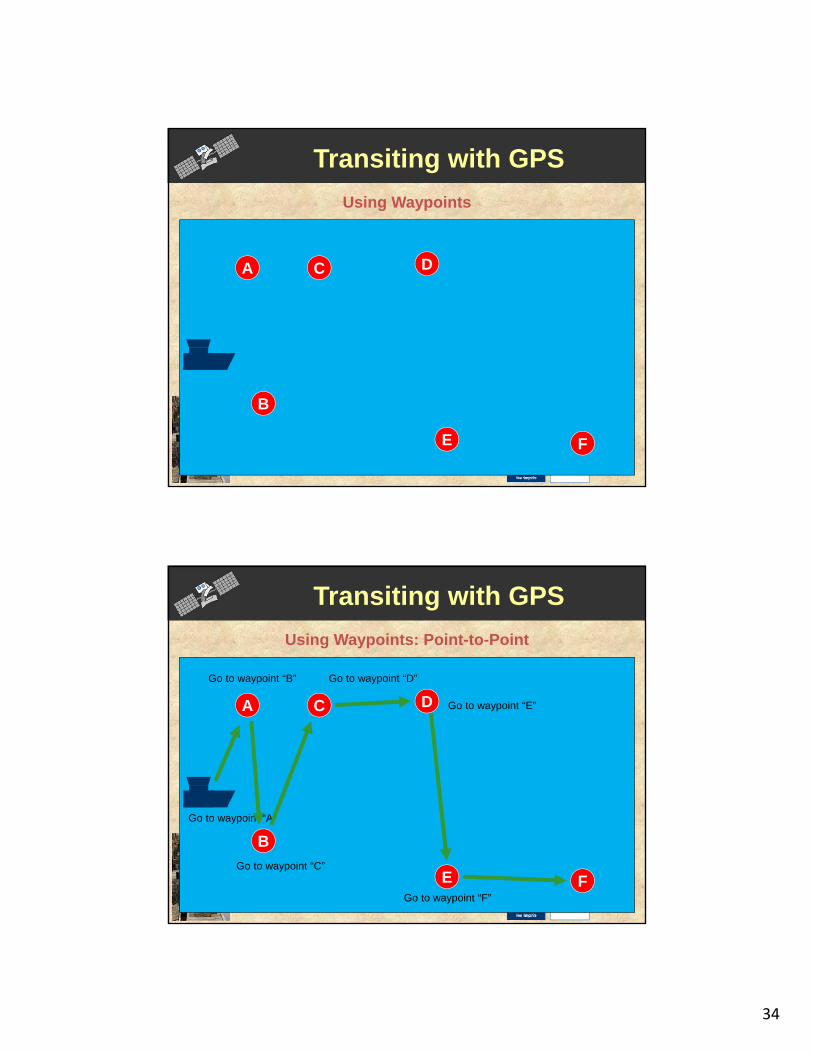
Transiting with GPS
A
B
C D
FE
Using Waypoints
Transiting with GPS
Using Waypoints: Point-to-Point
A
B
C D
FE
Go to waypoint “A”
Go to waypoint “B”
Go to waypoint “C”
Go to waypoint “D”
Go to waypoint “E”
Go to waypoint “F”
35
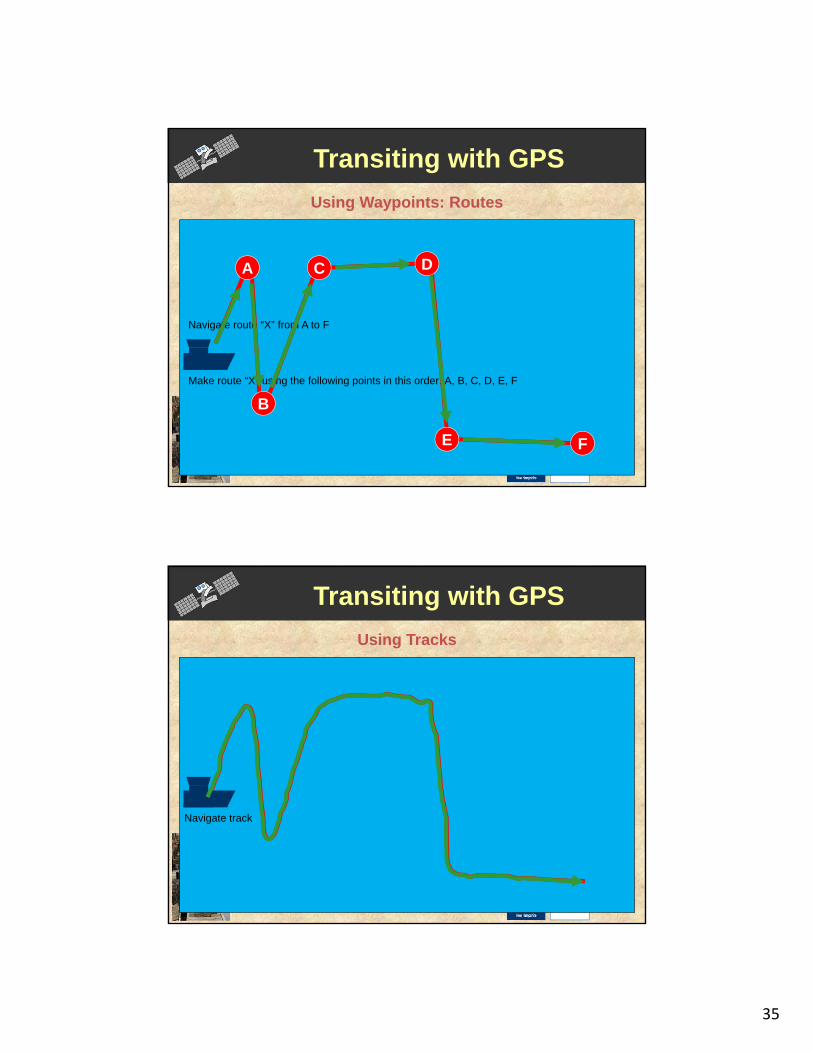
Transiting with GPS
Using Waypoints: Routes
Make route “X” using the following points in this order: A, B, C, D, E, F
A
B
C D
FE
Navigate route “X” from A to F
Transiting with GPS
Using Tracks
Navigate track
36
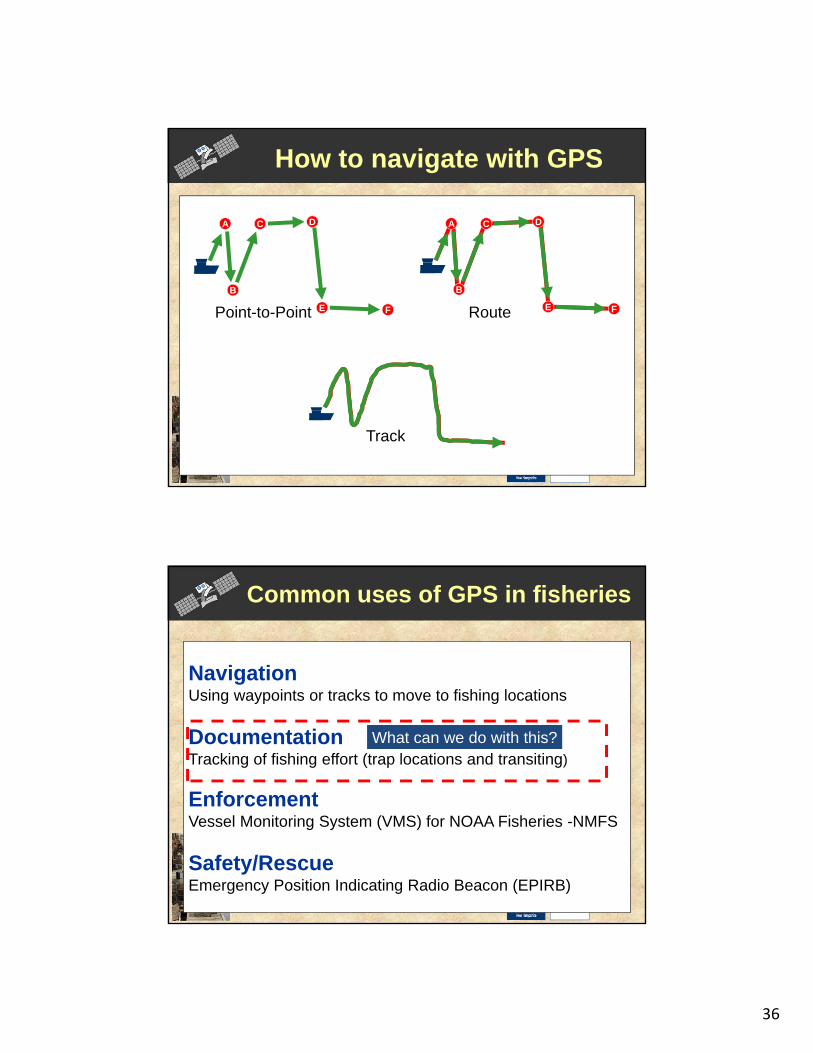
How to navigate with GPS
A
B
C D
FEPoint-to-Point
A
B
C D
FERoute
Track
NavigationUsing waypoints or tracks to move to fishing locations
DocumentationTracking of fishing effort (trap locations and transiting)
EnforcementVessel Monitoring System (VMS) for NOAA Fisheries -NMFS
Safety/RescueEmergency Position Indicating Radio Beacon (EPIRB)
Common uses of GPS in fisheries
What can we do with this?
37
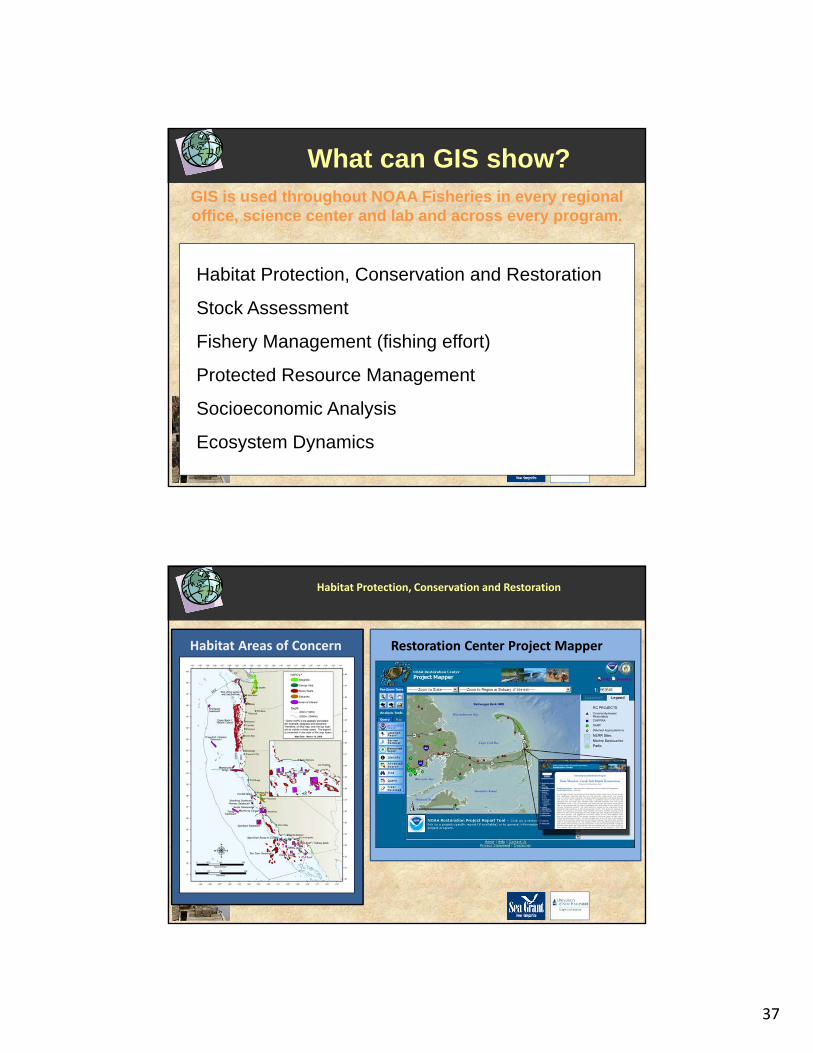
What can GIS show?GIS is used throughout NOAA Fisheries in every regional office, science center and lab and across every program.
Habitat Protection, Conservation and Restoration
Stock Assessment
Fishery Management (fishing effort)
Protected Resource Management
Socioeconomic Analysis
Ecosystem Dynamics
Habitat Protection, Conservation and Restoration
Habitat Areas of Concern Restoration Center Project Mapper
38
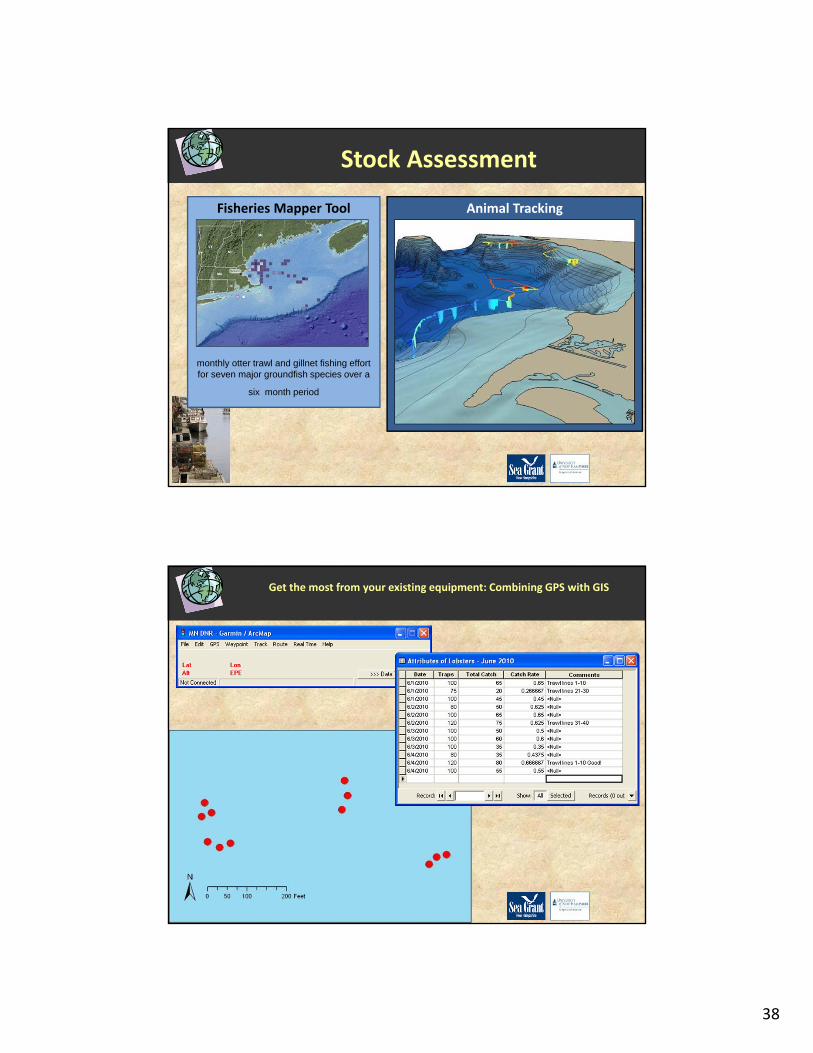
Stock Assessment
Fisheries Mapper Tool Animal Tracking
monthly otter trawl and gillnet fishing effort for seven major groundfish species over a
six month period
Get the most from your existing equipment: Combining GPS with GIS
39
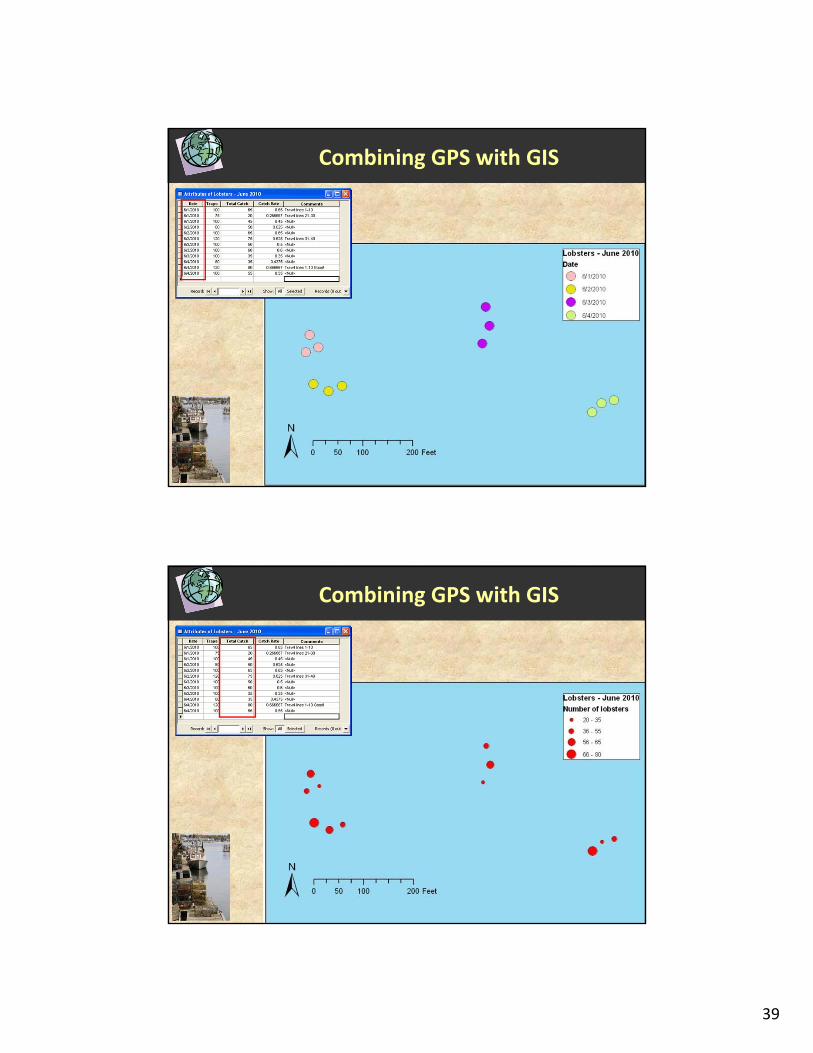
Combining GPS with GIS
Combining GPS with GIS
40
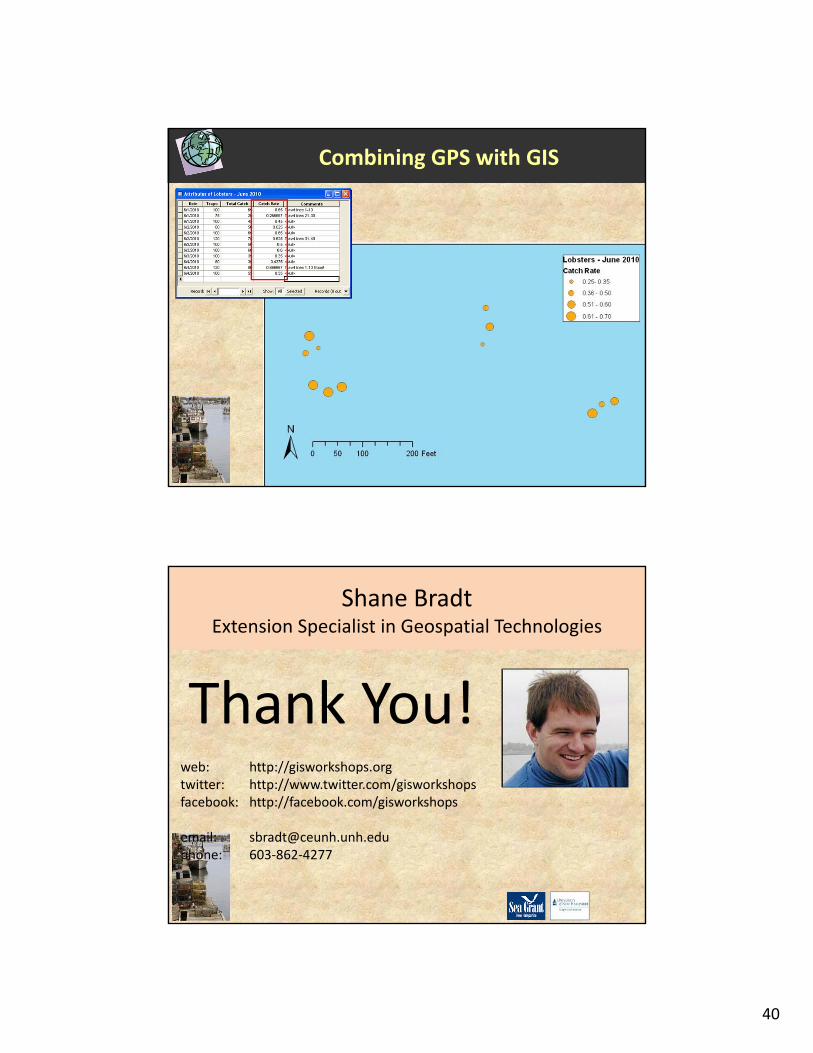
Combining GPS with GIS
Shane BradtExtension Specialist in Geospatial Technologies
Thank You!web: http://gisworkshops.orgtwitter: http://www.twitter.com/gisworkshops facebook: http://facebook.com/gisworkshops
email: [email protected]: 603‐862‐4277
41
Thank you!!