energy efficiency analysis in agricultural productions: parametric
TRANSCRIPT

7
Energy Efficiency Analysis in Agricultural Productions: Parametric
and Non-Parametric Approaches
S. H. Mousavi Avval, Sh. Rafiee and A. Keyhani Department of Agricultural Machinery Engineering Faculty of Agricultural Engineering and Technology
University of Tehran Karaj,
Iran
1. Introduction
The relation between agriculture and energy is very close. Agricultural sector itself is an
energy user and energy supplier in the form of bio-energy (Alam et al., 2005). It uses large
quantities of locally available non-commercial energies, such as seed, farmyard manure and
animate energy, and commercial energies directly and indirectly in the form of electricity,
diesel fuel, chemical fertilizers, plant protections, irrigation water and farm machinery
(Kizilaslan, 2009).
Nowadays, energy usage in agricultural activities has been intensified in response to
continued growth of human population, tendency for an overall improved standard of
living and limited supply of arable land. Consequently, additional use of energy causes
problems threatening public health and environment (Rafiee et al., 2010). However,
increased energy use in order to obtain maximum yields may not bring maximum profits
due to increasing production costs. In addition, both the natural resources are rapidly
decreasing and the amount of contaminants on the environment is considerably increasing
(Esengun et al., 2007).
Efficiency is defined as the ability to produce the outputs with a minimum resource level
required (Sherman, 1988). In production, efficiency is a normative measure and is defined as
the ratio of weighted sum of outputs to inputs or as the actual output to the optimal output
ratio. The weights for inputs and outputs are estimated to the best advantage for each unit
so as to maximize its relative efficiency. In order to measure the optimal input or output, it is
necessary to first specify the production frontier (Mukherjee, 2008).
Efficient use of energy resources in agriculture is one of the principal requirements for sustainable agricultural productions; it provides financial savings, fossil resources preservation and air pollution reduction; for enhancing the energy efficiency it must be attempted to increase the production yield or to conserve the energy input without affecting the output (Singh et al., 2004). Therefore, energy saving has been a crucial issue for
www.intechopen.com

Energy Efficiency – A Bridge to Low Carbon Economy
136
sustainable development in agricultural systems. Development of energy efficient agricultural systems with low input energy compared to the output of food can reduces the greenhouse gas emissions from agricultural production systems.
Improvements in the efficiency of resource use in agriculture require not only the definition of spatial and temporal use of current resources but also the development of tightly defined and broadly applicable indices (Topp et al., 2007).
In some studies the indicators of output energy to input energy ratio and energy productivity (i.e. yield to input energy ratio) in crop production systems have been used to evaluate the performance of farmers (Mohammadi et al., 2010; Unakitan et al., 2010). Energy productivity is an important indicator for more efficient use of energy although higher energy productivity does not mean in general, more economic feasibility (Mohammadi et al., 2010). The energy input-output analysis is usually made to measure the energy efficiency and environmental aspects. This analysis will determine how efficient the energy is used. In current years, several researches have been conducted on energy use for production of different agricultural crops (Jianbo, 2006; Meul et al., 2007; Kizilaslan, 2009).
Moreover, in some studies the parametric and non-parametric approaches have been used to analyze the efficiency of farmers in agricultural productions. In parametric approach, an econometric model is used to identify the relationship between energy inputs and yield values of crop productions. In this method, the parameters of the production or cost functions are estimated statistically.
Establishing the functional forms between energy inputs and output for agricultural crops are very useful in terms of determining elasticity of different energy inputs on yield (Turhan et al., 2008). Development of a model consists of several logical steps; one of them is the sensitivity analysis to ascertain how a given model depends on its input factors (Hamby, 1994). Sensitivity analysis quantifies the sensitivity of a model's state variables to the parameters defining the model. It refers to changes in the response of each of the state variables which result from small changes in the parameter values. Sensitivity analysis for the parameters of a developed model is valuable because it identifies those parameters which have most influence on the response of the model (Chalabi and Bailey, 1991). The sensitivity analysis of energy inputs on crop production is essential because it revealed what changes in energy inputs cause greater impacts on the output. Furthermore, it is of especial importance for the policy-makers to frame suitable policies for improving energy use efficiency (Lamoureux et al., 2006).
In recent years, many researchers have developed econometric models between energy inputs and output for different agricultural crops (Banaeian et al., 2010; Mohammadi and Omid, 2010). Singh et al. (2004) and Rafiee et al. (2010) investigated energy inputs and crop yield relationship to develop an econometric model for wheat and apple productions, respectively. Moreover, they applied the marginal physical productivity (MPP) technique to analyze the sensitivity of energy inputs on yield. Kulekci (2010) applied the stochastic frontier analysis technique in the Cobb-Douglas form to determine the technical efficiency for a sample of 117 randomly selected sunflower farms in Erzurum, Turkey. This method is parametric and uses statistical techniques to estimate the parameters of the function; however, this approach requires a pre-specification of the functional form and an explicit distributional assumption for the technical inefficiency term.
www.intechopen.com

Energy Efficiency Analysis in Agricultural Productions: Parametric and Non-Parametric Approaches
137
Mousavi-Avval et al. (2011b) analyzed the energy efficiency of soybean producers using parametric approach. In this study the Cobb-Douglas production function was applied to develop an aconometric model between inputs and output. The inputs were human labor, machinery, diesel fuel, chemicals, fertilizers, water for irrigation, electricity and seed energies; while, the soybean yield was the single output.
Data Envelopment Analysis (DEA) is a non-parametric linear programming (LP) based technique of frontier estimation for measuring the relative efficiency of a number of decision making units (DMUs) on the basis of multiple inputs and outputs (Zhang et al., 2009). The main advantage of non-parametric method of DEA compared to parametric approaches is that it does not require any prior assumption on the underlying functional relationship between inputs and outputs. It is, therefore, a non-parametric approach. In addition, DEA is a data-driven frontier analysis technique that floats a piecewise linear surface to rest on top of the observations (Zhou et al., 2008).
Due to the high advantages of DEA, there are a large number of its applications for evaluating the performances of DMUs in different issues. Also, it currently has been employed in some agricultural enterprises. In an earlier and related study, DEA was utilized to evaluate the technical efficiency of irrigated dairy farms in Australia. The results from this study proposed that DEA was a useful tool in helping to benchmark the dairy industry, which is continually striving to improve the productive efficiency of farms (Fraser and Cordina, 1999). Also, Dawson et al. (2000) presented technical and overall economic efficiencies for 22 rice farms in Philippines, using a frontier production function approach. The results of their study showed that the overall efficiency was changed from 84% to 95% between the farms.
In another study, DEA was applied to investigate the efficiency of individual farmers and to identify the efficient units for citrus farming in Spain (Reig-Martínez and Picazo-Tadeo, 2004); also, Barnes (2006) identified the technical efficiency scores of Scottish dairy farms by applying the DEA approach. Malana and Malano (2006) employed the DEA technique to benchmark the productive efficiency of irrigated wheat area in Pakistan and India.
In another study by Nassiri and Singh (2009), the DEA technique was subjected to the data of energy use from different inputs by individual paddy producers and the technical, pure technical and scale efficiencies of farmers were estimated. The results showed that, there was high correlation between technical efficiency and energy-ratio, however comparison between correlation coefficient of farmers in different farm categories and different zones showed that energy-ratio and specific energy were not enhanced indices for explaining of all kinds of the technical, pure technical and scale efficiency of farmers. Omid et al. (2010) employed this technique to analyze technical and scale efficiencies of cucumber producers.
Oilseed sunflower (Helianthus annuus L.) is one of the most widely cultivated and important oilseed crops in the world (Latif and Anwar, 2009). Sunflower seeds are mainly used for the production of oil for human consumptions. They contain a high amount of oil (26%) which is an important source of polyunsaturated fatty acid (linoleic acid) of potential health benefits (Pimentel and Patzek, 2005). The seeds are also used as a protein source for non-ruminant and ruminant animals. Iran produced more than 43000 tones of sunflower seeds from about 67000 ha harvested land area, in 2008 (FAO, 2008). In Iran, sunflower is mainly grown in Golestan province in the north-east of the country (Anonymous, 2010).
www.intechopen.com

Energy Efficiency – A Bridge to Low Carbon Economy
138
This study focuses on the capability of parametric and non-parametric approaches in energy efficiency analysis for agricultural crop productions. For this purpose the energy balance for sunflower production was investigated and the efficiency of energy use was analyzed using the parametric Cobb-Douglass production function and non-parametric data envelopment analysis techniques.
2. Materials and methods
2.1 Data collection
In this study Golestan province was chosen as a representative of the Iranian sunflower production enterprises since it is the main center of oilseed productions, especially sunflower crop, in the country, mainly due to the very favorable ecological conditions. Other oilseed crops cultivated in this province are soybean and canola.
Golestan province is located in the north-east of Iran, within 36° 30' and 38° 08' north latitude and 53° 57' and 56° 22' east longitude. A survey approach was used to collect the quantitative information on energy inputs used for the production of sunflower in the production period of 2009/10. The required sample size was determined using simple random sampling method as below (Cochran, 1977):
2 2
2 2 2
N s tn
(N 1)d (s t )
(1)
where n is the required sample size, N is the number of oilseed sunflower producers in
target population, s is the standard deviation, t is the t-value at 95% confidence limit (1.96),
and d is the acceptable error. The permissible error in the sample size was defined to be 5%
for 95% confidence. Thus the sample size was found to be 95, and then, 95 farmers from the
population were randomly selected. Before collecting data, the survey form was pre-tested
by a group of randomly selected farmers and these pre-tested surveys were not included in
the final data set. The reliability of the questionnaires was tested using Cronbach's alpha. So,
the Cronbach's alpha level of 0.7 demonstrated adequate construct reliability.
2.2 Energy balance analysis method
A standard procedure was used to convert each agricultural input and output into energy
equivalents. The inputs used in sunflower production were in the form of chemical
fertilizers (nitrogen, phosphate, potassium and sulfur), chemical biocides (herbicides,
fungicides and insecticides), diesel fuel, electricity, farmyard manure, water for irrigation,
human labor and machine power. Also, the grain yield was considered as output.
The energy equivalent may thus be defined as the energy input taking into account all forms of energy in agricultural productions. The energy equivalents were computed for all inputs and outputs using the conversion factors indicated in Table 1. Multiplying the quantity of the inputs used per hectare with their conversion factors gave the energy equivalents.
The energy equivalent associated with labor vary considerably, depending on the approach chosen; it must be adapted to the actual living conditions in the target region (Moore, 2010). In this study the energy coefficient of 1.96 MJ h-1 was applied. It means only the muscle
www.intechopen.com

Energy Efficiency Analysis in Agricultural Productions: Parametric and Non-Parametric Approaches
139
power used in different field operations of crop production. Total energy embodied in machinery included energy for raw materials, manufacturing, repairs and maintenance, and energy for transportation. Taking into account the total weight and the life of machinery as used in practice, the energy required for each operation was calculated assuming that the embodied energy of tractors and agricultural machinery be depreciated during their economical life time (Beheshti Tabar et al., 2010); so, the embodied energy in machinery was calculated by multiplying the depreciated weight of machinery (kg ha-1) with their energy equivalents (MJ kg-1). Also, the weight of machinery depreciated per hectare of sunflower production during the production period was calculated as follows (Mousavi Avval et al., 2011):
hG WTW
T
(2)
where TW is the depreciated machinery weight (kg ha-1); G is the total machine weight (kg); Wh is the time that machine used per unit area (h ha-1) and T is the economical life time of machine (h).
Depending on the context, manure may be considered either a valuable source of nutrients replacing synthetic fertilizers, a waste product from livestock production, or a potential energy source, e.g. for biogas production. In this study, we regarded manure as a source of nutrients, and the substitution method was used to calculate the energy input of animal manure, which equates the energy equivalent of farmyard manure with that of mineral fertilizer equivalents corresponding to its fertilization effect (Liu et al., 2010).
The energy equivalent of water for irrigation input means indirect energy of irrigation consist of the energy consumed for manufacturing the materials for the dams, canals, pipes, pumps, and equipments as well as the energy for constructing the works and building the on-farm irrigation systems (Khan et al., 2009).
Following the calculation of energy input and output equivalents, the indices of energy ratio (energy use efficiency), energy productivity, specific energy (energy intensity) and net energy were calculated as follow (Rafiee et al., 2010):
1
1
( )
( )
Energy output MJ haEnergy ratio
Energy input MJ ha
(3)
1
1
( )
( )
Sunflower yield kg haEnergy productivity
Energy input MJ ha
(4)
1
1
( )
( )
Energy input MJ haSpecific energy
Sunflower yield kg ha
(5)
1 1( ) ( )Net energy Energy output MJ ha Energy input MJ ha (6)
Energy ratio index is the ratio between the caloric heat of the output products and the total sequestered energy in the production factors. This index allows us to know the influence of inputs expressed in energy units in obtaining output energy. To improve energy ratio in a
www.intechopen.com

Energy Efficiency – A Bridge to Low Carbon Economy
140
Inputs Unit Energy equivalent (MJ unit-1)
Reference
A. Inputs 1. Human labor h 1.96 ( Rafiee et al., 2010) 2. Machinery kg
a. Tractor 93.61 ( Canakci et al., 2005) b. Self propelled combine 87.63 ( Canakci et al., 2005) c. Other machinery 62.70 ( Canakci et al., 2005)
3. Diesel fuel L 47.80 ( Canakci et al., 2005) 4. Chemicals kg
a. Herbicides 238.00 ( Erdal et al., 2007) b. Fungicides 216.00 ( Erdal et al., 2007) c. Insecticides 101.20 ( Erdal et al., 2007)
5. Fertilizer kg a. Nitrogen 66.14 ( Rafiee et al., 2010) b. Phosphate (P2O5) 12.44 ( Rafiee et al., 2010) c. Potassium (K2O) 11.15 ( Rafiee et al., 2010) d. Sulfur (S) 1.12 ( Rafiee et al., 2010) e. Farmyard manure 0.30 ( Rafiee et al., 2010)
6. Water for irrigation m3 1.02 ( Rafiee et al., 2010) 7. Seed kg 3.60 (Beheshti Tabar et al., 2010) 8. Electricity kWh 11.93 (Mobtaker et al., 2010) B. Output 1. Sunflower kg 25.00 (Beheshti Tabar et al., 2010)
Table 1. Energy equivalent of inputs and output in sunflower production.
process, it is possible either to reduce the energy sequestered in the inputs by optimization of energy use or to increase the yield of product by reducing the losses (Kitani, 1999). Energy productivity is the measure of the amount of a product obtained per unit of input energy. Also, net energy gain is the difference between the gross energy output produced and the total energy required for obtaining it.
The energy associated with inputs comes from different sources which classified as renewable and non-renewable energy forms. Renewable energy (RE) consists of water for irrigation, human labor and seeds, whereas non-renewable energy (NRE) includes machinery, diesel fuel, electricity, fertilizers and chemicals energy inputs. On the other hand, energy demand in agricultural productions can be classified in two main groups including direct and indirect forms. Direct energy (DE) form covers human labor, diesel fuel, water for irrigation and electrical energy; while, indirect energy (IDE) includes energy embodied in fertilizers, chemicals, seeds and machinery (Mobtaker et al., 2010).
2.3 Parametric approach
2.3.1 Model development
There are several parametric and non-parametric techniques to measure productive efficiency. Parametric methods assume a particular functional form (e. g., Cobb-Douglas production function or a Translog function) between inputs and output and estimate the
www.intechopen.com

Energy Efficiency Analysis in Agricultural Productions: Parametric and Non-Parametric Approaches
141
parameters of the production or cost functions statistically; however, in this approach it is difficult to separate inefficiency from random error.
In this study following the estimation of energy balance, the relation between energy inputs and output was investigated using a prior mathematical function relation. In specifying a fit relation, the Cobb-Douglass production function was selected as the best function in terms of statistical significance and expected signs of parameters.
The Cobb-Douglass function is a power relation has been used by several authors to investigate the relationship between energy inputs and output in agricultural crop productions (Singh et al., 2004; Mobtaker et al., 2010).
It can be specified in a mathematical form as follows (Singh et al., 2004):
01
1 2 1 2 )j i
k┙ u
i ijj
Y ┙ X e ( i , ,...,n; j , ,...,
k (7)
Using a linear presentation, the function to be estimated could be written as:
01
ln lnk
i j ij ij
Y ┙ ┙ X u
(8)
where: Yi, denotes the yield of the ith farmer, Xij, is the jth input used by the ith farmer for the
cultivation of crop, α0, is a constant term, αj, represent the regression coefficients of jth input,
which is estimated from the model and ui, is the error term.
In this functional form the parameters to be estimated αj represent the elasticity of output
with respect to each input j which implies the percent change in output augmentation from
a 1% increase in the jth input.
Assuming that when the energy input is zero, the crop production is also zero, Eq. (8)
reduces to (Mousavi-Avval et al., 2011b; Samavatean et al., 2011):
1
ln lnk
i j ij ij
Y ┙ X u
(9)
Assuming that yield is a function of energy inputs, for investigating the impact of each input energy on sunflower yield, the Eq. (9) can be expanded in the following form;
1 1 2 2 3 3 4 4 5 5
6 7 7 8 8
ln ln ln ln ln ln
ln ln lni
i
Y ┙ X ┙ X ┙ X ┙ X ┙ X
┙ X ┙ X ┙ X u
(10)
where Xj (i=1, 2, …, 8) stand for energy inputs of human labor (X1), machinery (X2),diesel fuel (X3), chemicals (X4), total fertilizers (X5), water for irrigation (X6), electricity (X7) and seed (X8) in MJ per hectare unit.
With respect to this pattern, the impacts of DE and IDE, and the effect of RE and NRE forms on the production yield were investigated. So, the Cobb-Douglass function was selected and specified as the following forms:
www.intechopen.com

Energy Efficiency – A Bridge to Low Carbon Economy
142
1 2ln ln lniY ┚ DE ┚ IDE u
i (11)
1 2ln ln lniY ┛ RE ┛ NRE u i (12)
where Yi is the ith farmer's yield (kg ha-1), ┚ and ┛ are coefficient of exogenous variables. Eqns. (10) to (12) were estimated using Ordinary Least Square (OLS) technique.
2.3.2 Returns to scale
Following the estimation of econometric model, in order to describe the changes in output
subsequent to a proportional change in all the inputs (when all inputs change by a constant
factor) the return to scale index was investigated (Rafiee et al., 2010). In a Cobb-Douglas
production function, the sum of elasticity values derived in the form of regression
coefficients represent the degree of returns to scale. If the sum of coefficients is more than,
equal to, or less than one, implying that there is increasing, constant, or decreasing returns
to scale, respectively (Rafiee et al., 2010). Increasing (decreasing) returns to scale indicate
that an increase in the input resources produces more (less) than proportionate increase in
outputs. In this study, an increasing, constant and decreasing return to scale indicate that
when all of the energy inputs are increased by X value, then the sunflower yield increases
by more than, exactly and less than X value, respectively.
2.3.3 Sensitivity analysis
Since several parameters affect the model output, the sensitivity analysis of energy inputs on
yield was used to identify which factors had a greater effect on the production yield. For this
purpose, the marginal physical productivity (MPP) method, based on the response
coefficients of the inputs was utilized. The MPP of a factor implies the change in the total
output with a unit change in the factor input, assuming all other factors are fixed at their
geometric mean level.
A positive value of MPP of any input variable identifies that the total output is increasing
with an increase in input; so, one should not stop increasing the use of variable inputs so
long as the fixed resource is not fully utilized. A negative value of MPP of any variable input
indicates that every additional unit of input starts to diminish the total output of previous
units; therefore, it is better to keep the variable resource in surplus rather than utilizing it as
a fixed resource.
The MPP of the various inputs was calculated using the ┙j of the various energy inputs as follows (Singh et al., 2004; Rafiee et al., 2010):
xj jj
GM(Y)MPP ┙
GM(X ) (13)
where MPPxj is the marginal physical productivity of jth input, ┙j, the regression coefficient of
jth input, GM(Y), geometric mean of yield, and GM (Xj), the geometric mean of jth input
energy on per hectare basis.
www.intechopen.com

Energy Efficiency Analysis in Agricultural Productions: Parametric and Non-Parametric Approaches
143
2.4 Non-parametric approach
Apart from the parametric approach, in this study a non-parametric method of DEA was
employed to evaluate the technical, pure technical and scale efficiencies of individual
farmers which use similar inputs, produce the same product (sunflower) and operate in a
relatively homogenous region (e. g., topography, soil type, climatic conditions, etc.). So,
energy consumptions from different inputs including human labor, machinery, diesel fuel,
chemicals, total fertilizers, water for irrigation, electricity and seed energies in terms of MJ
ha-1 were considered as inputs; while, the grain yield of sunflower was the single output;
also, each farmer called a DMU.
DEA technique builds a linear piece-wise function from empirical observations of inputs
and outputs. DEA is a nonparametric approach for estimating productive efficiency based
on mathematical linear programming techniques. Unlike parametric methods, DEA does not
require a function to relate inputs and outputs. The DEA envelops the data in such a way
that all observed data points lie on or below the efficient frontier (Coelli, 1996). The efficient
frontier is established by efficient units from a group of observed units. Efficient units are
those with the highest level of productive efficiency.
In DEA an inefficient DMU can be made efficient either by minimizing the input levels
while maintaining the same level of outputs (input oriented), or, symmetrically, by
maximizing the output levels while holding the inputs constant (output oriented).
Sunflower production similar to wheat (Malana and Malano, 2006), paddy (Chauhan et al.,
2006) and greenhouse cucumber (Omid et al., 2010) productions relies on finite and scarce
resources; therefore the use of input-oriented DEA models is more appropriate to reduce
inputs consumed in the production process.
In this study, the technical, pure technical and scale efficiencies of farmers were analyzed.
2.4.1 Technical efficiency (TE)
TE can be defined as the ability of a DMU (e.g. a farm) to produce maximum output given a
set of inputs and technology level. The TE score (θ) in the presence of multiple-input and
output factor can be calculated by the ratio of sum of weighted outputs to the sum of
weighted inputs or in a mathematical expression as follows (Cooper et al., 2004):
1 1 2 2 1
1 1 2 21
...
...
sj j s sj r rjr
mj j m mj i iji
u y u y u y u y
v x v x v x v x
(14)
Let the DMUj to be evaluated on any trial be designated as DMUo (o = 1, 2, . . ., n). To measure the relative efficiency of a DMUo based on a series of n DMUs, the model is structured as a fractional programming problem as follows (Cooper et al., 2006):
Max: 1
1
sr ror
mi ioi
u y
v x
(15)
www.intechopen.com

Energy Efficiency – A Bridge to Low Carbon Economy
144
S.t:
1
1
1
sr rjr
mi iji
u y
v x
j = 1, 2, . . ., n
0ru
, 0iv
where n is the number of DMUs in the comparison, s the number of outputs, m the number
of inputs, ur (r = 1, 2, …, s) the weighting of output yr in the comparison, vi (i = 1, 2, …, m)
the weighting of input xi, and yrj and xij represent the values of the outputs and inputs yj and
xi for DMUj, respectively. Eq. (15) can equivalently be written as a linear programming (LP)
problem as follows (Cooper et al., 2006):
Max: 1
s
r ror
u y
(16)
S.t:
1 1
0s m
r rj i ijr iu y v x j = 1, 2, . . ., n
11
mi ioi
v x
0ru , 0iv
The dual linear programming (DLP) problem is simpler to solve than Eq. (16) due to fewer
constraints. Mathematically, the DLP problem is written in vector–matrix notation as
follows (Cooper et al., 2006):
Min :θ (17)
S.t:
Yλ ≥ yo
Xλ- θxo ≤ 0
λ ≥ 0
where yo is the 1s vector of the value of original outputs produced and xo is the 1m
vector of the value of original inputs used by the oth DMU. Y is the s n matrix of outputs
and X is the m n matrix of inputs of all n units included in the sample. λ is a 1n
vector
of weights and θ is a scalar with boundaries of one and zero which determines the technical
efficiency score of each DMU. Model (17) is known as the input-oriented CCR DEA model.
It assumes constant returns to scale (CRS), implying that a given increase in inputs would
result in a proportionate increase in outputs.
www.intechopen.com

Energy Efficiency Analysis in Agricultural Productions: Parametric and Non-Parametric Approaches
145
2.4.2 Pure technical efficiency (PTE)
The TE derived from CCR model, comprehend both the technical and scale efficiencies. So, Banker et al. (1984) developed a model in DEA, which was called BCC model to calculate the PTE of DMUs. The BCC model is provided by adding a restriction on λ (λ =1) in the model (17), resulted to no condition on the allowable returns to scale. This model assums variable returns to scale (VRS), indicating that a change in inputs is expected to result in a disproportionate change in outputs.
2.4.3 Scale efficiency (SE)
SE relates to the most efficient scale of operations in the sense of maximizing the average productivity. An scale efficient farmer has the same level of technical and pure technical efficiency scores. It can be calculated as below (Nassiri and Singh, 2009):
TE
SEPTE
(18)
SE gives the quantitative information of scale characteristics. It is the potential productivity gained from achieving optimum size of a DMU. However, scale inefficiency can be due to the existence of either IRS or DRS. A shortcoming of the SE score is that it does not indicate if a DMU is operating under IRS or DRS conditions. This problem is resolvable by solving a non-increasing returns of scale (NIRS) DEA model, which is obtained by substituting the VRS constraint of λ =1 in the BCC model with λ ≤ 1 (Scheel, 2000). IRS and DRS can be determined by comparing the efficiency scores obtained by the BCC and NIRS models; so that, if the two efficiency scores are equal, then DRS apply, else IRS prevail (Omid et al., 2010). The information on whether a farmer operates at IRS, CRS or DRS status is particularly helpful in indicating the potential redistribution of resources between the farmers, and thus, enables them to achieve to the higher output (Chauhan et al., 2006).
The results of standard DEA models divide the DMUs into two sets of efficient and inefficient units. The inefficient units can be ranked according to their efficiency scores; while, DEA lacks the capacity to discriminate between efficient units. A number of methods are in use to enhance the discriminating capacity of DEA (Adler et al., 2002). In this study, the bencmarking method was applied to overcome this problem. In this method, an efficient unit which is chosen as the useful target for many inefficient DMUs and so appears frequently in the referent sets, is highly ranked.
In the analysis of efficient and inefficient DMUs, the energy saving target ratio (ESTR) was used to specify the inefficiency level of energy usage for the DMUs under consideration. The formula is as follows (Hu and Kao, 2007):
( arg )
(%) 100( )
Energy savingt etESTR
Actual energy input (19)
where energy saving target is the total reducing amount of energy inputs which could be saved without reducing the output level. A higher ESTR percentage implies higher energy use inefficiency, and thus, a higher energy saving amount (Hu and Kao, 2007). In this study, the Microsoft Excel spreadsheet, SPSS 17.0 software and the DEA software Efficiency Measurement Systems (EMS), Version 1.3 (Scheel, 2000) were employed to analyze the data.
www.intechopen.com
Energy Efficiency – A Bridge to Low Carbon Economy
146
3. Results and discussions
3.1 Energy balance in sunflower production
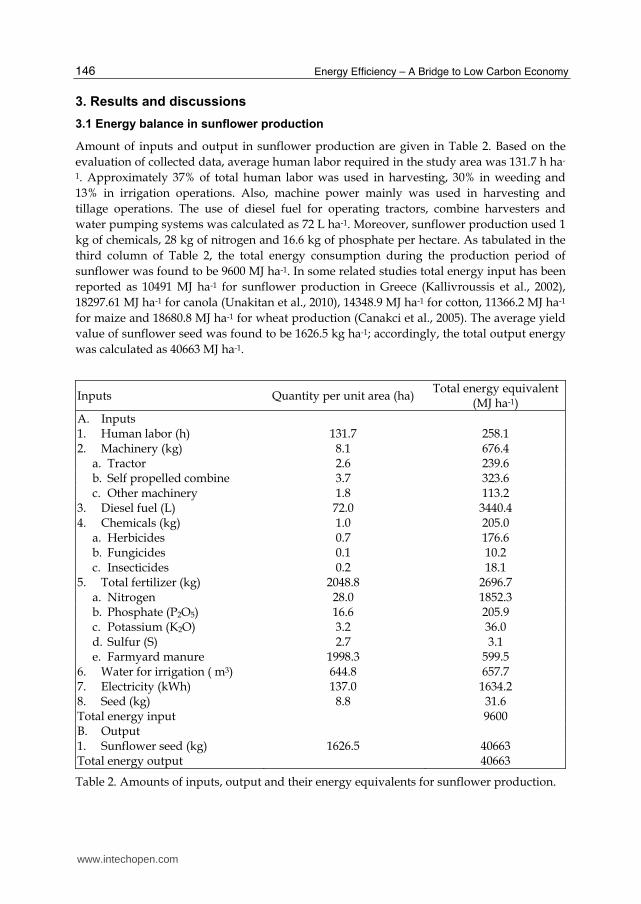
Amount of inputs and output in sunflower production are given in Table 2. Based on the
evaluation of collected data, average human labor required in the study area was 131.7 h ha-
1. Approximately 37% of total human labor was used in harvesting, 30% in weeding and
13% in irrigation operations. Also, machine power mainly was used in harvesting and
tillage operations. The use of diesel fuel for operating tractors, combine harvesters and
water pumping systems was calculated as 72 L ha-1. Moreover, sunflower production used 1
kg of chemicals, 28 kg of nitrogen and 16.6 kg of phosphate per hectare. As tabulated in the
third column of Table 2, the total energy consumption during the production period of
sunflower was found to be 9600 MJ ha-1. In some related studies total energy input has been
reported as 10491 MJ ha-1 for sunflower production in Greece (Kallivroussis et al., 2002),
18297.61 MJ ha-1 for canola (Unakitan et al., 2010), 14348.9 MJ ha-1 for cotton, 11366.2 MJ ha-1
for maize and 18680.8 MJ ha-1 for wheat production (Canakci et al., 2005). The average yield
value of sunflower seed was found to be 1626.5 kg ha-1; accordingly, the total output energy
was calculated as 40663 MJ ha-1.
Inputs Quantity per unit area (ha) Total energy equivalent
(MJ ha-1)
A. Inputs 1. Human labor (h) 131.7 258.1 2. Machinery (kg) 8.1 676.4
a. Tractor 2.6 239.6 b. Self propelled combine 3.7 323.6 c. Other machinery 1.8 113.2
3. Diesel fuel (L) 72.0 3440.4 4. Chemicals (kg) 1.0 205.0
a. Herbicides 0.7 176.6 b. Fungicides 0.1 10.2 c. Insecticides 0.2 18.1
5. Total fertilizer (kg) 2048.8 2696.7 a. Nitrogen 28.0 1852.3 b. Phosphate (P2O5) 16.6 205.9 c. Potassium (K2O) 3.2 36.0 d. Sulfur (S) 2.7 3.1 e. Farmyard manure 1998.3 599.5
6. Water for irrigation ( m3) 644.8 657.7 7. Electricity (kWh) 137.0 1634.2 8. Seed (kg) 8.8 31.6 Total energy input 9600 B. Output 1. Sunflower seed (kg) 1626.5 40663 Total energy output 40663
Table 2. Amounts of inputs, output and their energy equivalents for sunflower production.
www.intechopen.com

Energy Efficiency Analysis in Agricultural Productions: Parametric and Non-Parametric Approaches
147
The percentage distribution of the energy associated with the inputs is seen in Fig. 1. It is evident that, the greatest part of total energy input was consumed by diesel fuel (35.8%); followed by total fertilizer (29%). The distribution of total fertilizers energy input was 68.7% nitrogen, 7.7% phosphate, 1.3% potassium, 0.1% sulfur and 22.2% farmyard manure. Similar studies have also reported that diesel fuel and fertilizer were the most intensive energy inputs (Erdal et al., 2007; Kizilaslan, 2009; Mobtaker et al., 2010); Kallivroussis et al. (2002) reported that the main energy consuming inputs for sunflower production in Greece were nitrogen fertilizer (42.4%) and diesel fuel (33.9%). Excessive use of chemical fertilizers energy input in agriculture may create serious environmental consequences such as nitrogen loading in the environment and receiving waters, poor water quality, carbon emissions and contamination of the food chain (Khan et al., 2009). Integrating a legume into the crop rotation, application of composts, chopped residues or other soil amendments may increases soil fertility in the medium term and so reduces the need for chemical fertilizer energy inputs. Moreover, applying a better machinery management technique, employing the conservation tillage methods or technological upgrade to substitute fossil fuels with renewable energy resources may be the pathways to minimize the fossil fuel usage and thus to reduce its environmental footprints.
Fig. 1. The shares of energy inputs for sunflower production.
The energy indices including energy output to input ratio, energy productivity, specific energy and net energy gain are presented in Table 3. Energy ratio in sunflower production was found to be 4.24; showing that output energy of sunflower is obtained 4.24 times greater than total input energy. Also, specific energy was accounted as 5.90 MJ kg-1. Energy output to input ratio and specific energy are integrative indices indicating the potential environmental impacts associated with the production of crops (Khan et al., 2009); also, these parameters can be used to determine the optimum intensity of land and crop management from an environmental point of view. Energy ratio in some agricultural crop productions were reported as 1.5 for sesame, 2.8 for wheat, 3.8 for maize, 4.8 for cotton (Canakci et al., 2005) and 4.68 for canola production (Unakitan et al., 2010). The average energy productivity of sunflower production was 0.17 kg MJ-1. This means that 0.17 unit (kg) output is obtained per unit energy (MJ). Calculation of energy productivity for other
www.intechopen.com

Energy Efficiency – A Bridge to Low Carbon Economy
148
oilseed crops has been reported as 0.17 kg MJ-1 for canola (Unakitan et al., 2010) and 0.18 kg MJ-1 for soybean production (De et al., 2001).
Item Unit Quantity
Energy ratio - 4.24 Energy productivity kg MJ-1 0.17 Specific energy MJ kg-1 5.90 Net energy MJ ha-1 31062.7 Direct energy MJ ha-1 5990.4 Indirect energy MJ ha-1 3609.6 Renewable energy MJ ha-1 1546.8 Non-renewable energy MJ ha-1 8053.3 Total energy input MJ ha-1 9600
Table 3. Some energy indices in sunflower production.
The input energy classification used for sunflower production according to direct, indirect, renewable and non-renewable energy forms are presented in Table 3 and Fig. 2. It is evident that, the ratios of direct and indirect energy forms are nearly the same; but the ratios of renewable and non-renewable energy forms are fairly different from each other (Fig. 2). The ratio of non-renewable energy is very high (83.9%), indicating that sunflower production in the region depends mainly on fossil fuels. Several researchers have founded the ratio of DE higher than that of IDE, and the rate of NRE much greater than that of RE in production of different agricultural crops (Erdal et al., 2007; Mobtaker et al., 2010).
Fig. 2. Distribution of energy forms in sunflower production.
3.2 Econometric model estimation for sunflower production
The results of econometric model estimation of sunflower production are show in Table 4. For the data used in this study presence of autocorrelation in the residuals from the regression analysis was tested using the Durbin–Watson statistical test (Rafiee et al., 2010). The test result revealed that Durbin–Watson value was as 1.66 for Eq. (10); indicating that
www.intechopen.com

Energy Efficiency Analysis in Agricultural Productions: Parametric and Non-Parametric Approaches
149
there was no autocorrelation in the estimated model. The R2 (coefficient of determination) was as 0.98 for this linear regression model. This implies that all the explanatory variables included in the regression equation had contributed to the yield by 98%.
The estimated regression coefficients for the model 1 are presented in the second column of Table 4. The results revealed that, human labor machinery, diesel fuel, chemicals and seed energy inputs were the most important inputs, significantly contributed to yield. Also, all of the statistically significant inputs showed the positive relationships with output. Moreover, diesel fuel energy input had the highest elasticity on output (0.95). The second and third important energy inputs were machinery and seed with the elasticity values of 0.25 and 0.14, respectively. With respect to the obtained results, increasing 10% in the consumed energy from diesel fuel, machinery and seed energies, would led to 9.5%, 2.5% and 1.4%, increase in sunflower seed yield, respectively. On the other hand, the impacts of electricity, total fertilizer and water for irrigation energies on yield were estimated statistically insignificant and in the cases of total fertilizer and water for irrigation, the coefficients showed the negative relationship with output.
Endogenous variable: yield Exogenous variables
Coefficient t-ratio MPP
Model 1: i 1 1 2 2 3 3 4 4 5 5 6 6 7 7 8 8 ilnY ┙ lnX ┙ lnX ┙ lnX ┙ lnX ┙ lnX ┙ lnX ┙ lnX ┙ lnX e
Human labor 0.06c 1.59 0.52 Machinery 0.25b 2.18 0.69 Diesel fuel 0.95a 5.58 0.47 Chemicals 0.02b 1.98 0.12 Total fertilizer -0.01 -0.11 -0.01 Water for irrigation -0.01 -0.71 -0.01 Electricity 0.02 1.42 0.00 Seed 0.14a 3.01 7.06 Durbin-Watson 1.66 R2 0.98 Return to scale 1.42
a Indicates significance at 1% level. b Indicates significance at 5% level. c Indicates significance at 10% level.
Table 4. Econometric model estimation for sunflower production.
Mobtaker et al. (2010) developed an econometric model for barley production in Hamedan province of Iran. They reported that human labor, total fertilizer, machinery, diesel fuel, electricity and water for irrigation energies were the important inputs, significantly contributed to yield and machinery energy had highest elasticity. Singh et al. (2004) found that the use of electricity and fertilizers energy inputs in zone 4 of Punjab was inconsistent with output of wheat production.
The degree of returns to scale for the model (1) was calculated by summation of the regression coefficients as 1.42. The value of return to scale more than unity implies increasing return to scale for sunflower production in the region. These results indicate that 1% increase in all the energy inputs would result by 1.42% increase in the sunflower production.
www.intechopen.com

Energy Efficiency – A Bridge to Low Carbon Economy
150
3.3 Sensitivity analysis of energy inputs on sunflower yield
The sensitivity of energy inputs was analyzed using the MPP method and partial regression coefficients on output level. The results are presented in the last column of Table 4. As it is seen, the major MPP value was drown by seed (7.06) and it followed by machinery (0.69) and human labor energies (0.52). This implies that an additional use of 1 MJ ha-1 from each of the seed, machinery and human labor energies would lead to an additional increase in yield value of sunflower by 7.06, 0.69 and 0.52 kg ha-1, respectively. In other words, there is a higher potential for increasing output by additional use of these inputs for sunflower production in the surveyed region. On the other hand, the MPP value of total fertilizer and water for irrigation energies were found negative, indicating that use of these inputs is high for sunflower production, resulting in energy dissipation as well as imposing negative effects to environment and human health. The results of sensitivity analysis indicate that which variables should be identified and measured most carefully to assess the state of the environmental system, and which environmental factors should be managed preferentially (Drechsler, 1998). Within this framework, sensitivity analysis of energy inputs is important for improving energy use efficiency and lowering the environmental footprints of energy consumption.
For investigating the relationship between energy forms (i. e. direct, indirect, renewable and non-renewable) and the yield value of sunflower the models (2) and (3) were estimated using Eqs. (11) and (12), respectively. For these models the estimated coefficients, t-values, MPP values and validation statistical parameters are presented in Table 5. Durbin–Watson statistical test revealed that Durbin–Watson values were 1.31 and 1.15 for the models (2) and (3), respectively; indicating that there is no autocorrelation in the estimated models. The R2 values were 0.98 for both the estimated models.
The results of model development between direct and indirect energies showed that both the forms of energy had the expected sign and the impact of direct energy was statistically significant, with an elasticity value of 0.84; while indirect energy form had no statistically significant impact on yield. These imply that a 10% increase in direct energy inputs would led to 8.4% increase in yield.
Looking at the Table 5 it also can be seen that, the regression coefficients of non-renewable energy forms was positive and significant at 1% level, while the impact of renewable energies was insignificant; also, the elasticity of non-renewable energy was higher than that of renewable energy (0.85 versus 0.02), implying that a 10% increase in non-renewable energy inputs would led to 8.4% increase in yield, while 10% increase in renewable energy resources increases the output by only 0.2%.
In the literature, similar results have been reported. For example, the impact of direct energy was more than the impact of indirect energy on yield (Hatirli et al., 2005), and the impact of non-renewable energy was higher than that of renewable energy (Mousavi-Avval et al., 2011a).
As can be seen from Table 5, the MPP values of direct and indirect energy forms were 0.29 and 0.02, respectively. Moreover, the sensitivity analysis of renewable and non-renewable energy forms showed that additional use of 1 MJ in non-renewable energies would lead to an additional increase in yield by 0.22 kg; while in the case of renewable energy forms only 0.04 kg is obtained by additional use of 1 MJ. Rafiee et al. (2010) reported that sensitivity of
www.intechopen.com

Energy Efficiency Analysis in Agricultural Productions: Parametric and Non-Parametric Approaches
151
Endogenous variable: yield Exogenous variables
Coefficient t-ratio MPP
Model 2: i 1 2 ilnY ┚ lnDE ┚ lnIDE e
Direct energy 0.84a 3.01 0.29 Indirect energy 0.03 0.37 0.02 Durbin-Watson 1.31 R2 0.98
Model 3: i 1 2 ilnY ┛ lnRE ┛ lnNRE e
Renewable energy 0.02 0.36 0.04 Non-renewable energy 0.85a 3.52 0.22 Durbin-Watson 1.15 R2 0.98
a Indicates significant at 1% level.
Table 5. Econometric model estimation of energy forms in sunflower production.
direct energy was higher than that of indirect energy; also it was higher for non-renewable energy compared to renewable energy forms.
These results may be due to the fact that renewable energy forms such as human labor and
farmyard manure were used partially by only some of the farmers and its share was very
low; while, non-renewable energy forms especially diesel fuel and machinery were used
intensively by majority of the farmers. Additional use of non-renewable energy sources to
boost agricultural productions in developing countries with low levels of technological
knowledge not only results in environmental deterioration, but also confronts us with the
dilemma of a rapid rate of depletion of energetic resources; while, renewable energy sources
can be used indefinitely with minimal environmental impacts associated with their
production and use (Fadai, 2007). Development of renewable energy usage technologies
such as farm machinery or water pumping systems using biodiesel or solar power,
employing integrated pest management technique and utilization of alternative sources of
energy such as organic fertilizers (compost, manure, etc.) may be the pathways to substitute
the non-renewable energy forms with renewable resources and to reduce their
environmental footprints.
3.4 Measuring the efficiency of farmers
The results of distribution of farmers based on the efficiency score obtained by the
application of CCR and BCC DEA models are shown in Fig. 3. As it is evident, about 33%
(31 farmers) and 54% (51 farmers) from total farmers were recognized as the efficient
farmers under constant and variable returns to scale assumptions, respectively. Moreover,
33% and 32%, with respect, had their technical and pure technical efficiency scores between
0.8 and 1 range. Also, when the BCC model is assumed, only 1% had an efficiency score of
less than 0.6; whereas, when the CCR model is applied, 11% had the efficiency scores of less
than 0.6. The results of returns to scale estimation indicated that all of the technically
efficient farmers (based on the CCR model) were operating at CRS, showing the optimum
scale of their practices.
www.intechopen.com

Energy Efficiency – A Bridge to Low Carbon Economy
152
Fig. 3. Distribution of sunflower producers based on efficiency scores
The summarized statistics for the three estimated measures of efficiency are presented in
Table 6. The results revealed that the average values of technical and pure technical
efficiency scores were 0.83 and 0.93, respectively. Also, the technical efficiency varied from
0.33 to 1 range. The wide variation in the technical efficiency implies that all the farmers
were not fully aware of the right production techniques or did not apply them properly.
Based on the literature, the technical efficiency scores of 0.77 for paddy production
(Chauhan et al., 2006), 0.75 for tomato, 0.81 for asparagus production (Iráizoz et al., 2003)
and 0.74 for canola production (Mousavi-Avval et al., 2011c) have been reported.
The average scale efficiency score was relatively low as 0.89, showing the disadvantagiouse
conditions of scale size. This indicates that if all of the inefficient farmers operated at the
most productive scale size, about 11% savings in energy use from different sources would
be possible without affecting the yield level.
Particular Average SD Min Max
Technical efficiency 0.83 0.17 0.33 1 Pure technical efficiency 0.93 0.10 0.54 1 Scale efficiency 0.89 0.14 0.43 1
Table 6. Average efficiencies of farmers for sunflower production in Golestan, Iran
3.5 Setting realistic input levels for inefficient farmers
A pure technical efficiency score of less than one for a farmer indicates that, at present conditions, he is using higher values of energy than required. Therefore, it is desired to suggest realistic levels of energy to be used from each source for every inefficient farmer in order to avert wastage of energy. The summarized information for setting realistic input levels are given in Table 7. It gives the average energy usage in target conditions (MJ ha-1), possible energy savings and ESTR percentage for different energy sources. It is evident that, total energy input could be reduced to 8028.4 MJ ha-1; while, maintaining the current production level and also assuming no other constraining factors. Diesel fuel, total fertilizer and electricity energies were required as 3311.5, 2145.1 and 987.3 MJ ha-1, respectively. Moreover, machinery, water for irrigation, human labor, chemicals and seeds energy inputs were required as 627.9, 500.9, 248.1, 187.2 and 31.4 MJ ha-1, respectively.
www.intechopen.com

Energy Efficiency Analysis in Agricultural Productions: Parametric and Non-Parametric Approaches
153
The results of ESTR calculations showed that if all farmers operated efficiently, the reduction of electricity, water for irrigation and total fertilizer energy inputs, with respect, by 39.6%, 23.8% and 20.5% would have been possible without affecting the yield level. These energy inputs had the highest inefficiency which was owing mainly to the excess use of water and also electricity in water pumping systems. High percentage of fertilizer energy inputs can also be interpreted by the low prices and freely availability of these inputs in surveyed region. Accurate fertilizer management by increasing its profitability with the crops and reducing losses by improving management practices can improve energy use. These results are consistent with the results of energy efficiency analysis in parametric approach, in which, the use of these inputs was inconsistent with output (Section 3.3). On the other hand, the ESTR for human labor and seeds energy inputs was found to be 3.9% and 0.5%, respectively; indicating that these inputs were mainly used efficiently by the farmers in the region. This is consistent with the previouse results, in which, the seed and human labor energies had the relatively high MPP values on output of sunflower (Section 3.3). Similar results also had been reported in the literature by Omid et al. (2010).
Moreover, the results revealed that, the ESTR percentage for total energy input was 16.4%, indicating that by adopting the recommendations resulted from this study, on average, about 16.4% (1571.6 MJ ha-1) from total input energy in sunflower production could be saved without affecting the yield level. Singh et al. (2004) reported that 15.9% (11305 MJ ha-1) from total energy input for wheat production could be saved without affecting the yield level. Also, Mousavi-Avval et al. (2011d) found that about 20% of overall resources in soybean production could be reduced if all of the farmers operate efficiently. Using the information of Table 7, it is possible to advise the inefficient farmers regarding the better operating practices followed by his peers in order to reduce the input energy levels to the target values indicated in the analysis while achieving the output level presently achieved by him.
Input Target use (MJ ha-1)
Saving energy (MJ ha-1)
ESTR (%)
1. Human labor 248.1 10.0 3.9 2. Machinery 627.9 48.5 7.2 3. Diesel fuel 3300.5 139.9 4.1 4. Chemicals 187.2 17.8 8.7 5. Total fertilizer 2145.1 551.6 20.5 6. Water for irrigation 500.9 156.7 23.8 7. Electricity 987.3 646.9 39.6 8. Seeds 31.4 0.2 0.5 Total energy 8028.4 1571.6 16.4
Table 7. Optimum energy requirement and saving energy for sunflower production.
Fig. 4 shows the distribution of saving energy from different sources for sunflower production. It is evident that the maximum contribution to the total saving energy is 41.2% from electricity. Also, electricity, total fertilizer, water for irrigation and diesel fuel energy inputs contributed to the total saving energy by about 95%. This is consistent with the results of previous studies that diesel fuel and electricity had the highest potential for improving energy productivity in the production of different agricultural crops (Chauhan et
www.intechopen.com

Energy Efficiency – A Bridge to Low Carbon Economy
154
al., 2006; Omid et al., 2010). From these results it is strongly suggested that improving the usage pattern of these inputs be considered as priorities providing significant improvement in energy productivity for sunflower production in surveyed region. Improving energy use efficiency of water pumping systems, employing new irrigation systems and leveling farms properly can be suggested to prevent from electrical energy wastage by inefficient farmers. Applying a better machinery management technique, employing the conservation tillage methods and also, controlling input usage by performance monitoring can help to reduce the diesel fuel and fertilizer energy inputs and minimize their environmental impacts. Also, integrating a legume into the crop rotation, application of composts, chopped residues or other soil amendments may increases soil fertility in the medium term and so reduces the need for chemical fertilizer energy inputs.
Fig. 4. Distribution of saving energy from different sources for sunflower production.
3.6 Improvement of energy indices
The energy indices for sunflower production in target use of energy are presented in Table 8. It is evident that by optimization of energy use, both the energy ratio and energy productivity indicators can improve by 19.6%. Also, in optimum consumption of energy inputs, the net energy indicator by improvement of 5.1% would increase to 32634.4 MJ ha-1.
Items Unit Quantity in optimum use Change (%)
Energy ratio - 5.06 19.6 Energy productivity kg MJ-1 0.20 19.6 Specific energy MJ kg-1 4.94 -16.4 Net energy MJ ha-1 32634.4 5.1 Total input energy MJ ha-1 8028.4 -16.4
Table 8. Improvement of energy indices for sunflower production in Golestan, Iran.
www.intechopen.com

Energy Efficiency Analysis in Agricultural Productions: Parametric and Non-Parametric Approaches
155
To sum it up, oilseed sunflower is a crop with relatively high requirements on non-renewable energy resources; its fertilizer and electrical energy requirements are high and it needs a high amount of diesel fuel consumption. The farmers mainly don’t have enough knowledge on more efficient input use and there is a common belief that increased use of energy resources will increase the yield. The methodologies presented in this study demonstrate how energy use efficiency in sunflower production may improve by applying the operational management tools to assess the performance of farmers. On an average, considerable savings in energy inputs may be obtained by adopting the best practices of high-performing ones in crop production process. Adoption of more energy-efficient cultivation systems would help in energy conservation and better resource allocation.
Some strategies such as providing better extension and training programs for farmers and use of advanced technologies should be developed in order to increase the energy efficiency of agricultural crop productions in the region. The farmers should be trained with regard to the optimal use of inputs, especially, fertilizers and water for irrigation as well as employing the new production technologies. The local agricultural institutes in the region have an important role in these cases to establish the more energy efficient and environmentally healthy sunflower production systems in the region.
4. Conclusion
The study describes the application of parametric and non-parametric approaches to analyze energy efficiency in agricultural production. Therefore, energy use pattern for oilseed sunflower production in Iran was investigated and the parametric method of Cob-Douglas production function and non-parametric method of data envelopment analysis were applied to analyze efficiency of farmers. These methologies helped to identify the impact of energy use from different inputs on output, measure efficiency scores of farmers, segregate efficient farmers from inefficient farmers and to find the wasteful uses of energy by inefficient farmers. The results from both the parametric and non-parametric techniques revealed that the use of machinery, human labor and seed energies had higher impacts on output. In other words, there is higher potential for increasing output by additional use of these inputs for sunflower production. On the other hand, the use of fertilizer, water for irrigation and electrical energy was inconsistent with output, indicating that use of these inputs is high, resulting in energy dissipation as well as imposing negative effects to environment and human health. The results of DEA application further indicated that there are substantial production inefficiencies for farmers; so that, a potential of almost 16% reduction in total energy input use may be achieved if all farmers operated efficiently and assuming no other constraints on this adjustment. Moreover, the results revealed that sunflower production in the region showed a high sensitivity on non-renewable energy sources which may resulted in both the environmental deterioration and rapid rate of depletion of these energetic resources. Therefore, policies should emphasize on development of new technologies to substitute fossil fuels with renewable energy sources aiming efficient use of energy and lowering the environmental footprints. From this study, development of renewable energy usage technologies such as farm machinery or water pumping systems using biodiesel or solar power, applying a better machinery management technique, employing the conservation tillage methods, utilization of alternative sources of energy such as organic fertilizers may be suggested to reduce the environmental footprints of energy inputs and to obtain sustainable food production systems.
www.intechopen.com

Energy Efficiency – A Bridge to Low Carbon Economy
156
5. References
Adler, N.; Friedman, L. & Sinuany-Stern, Z. (2002). Review of ranking methods in the data envelopment analysis context. European Journal of Operational Research 140:249-265
Alam, M.S.; Alam, M.R. & Islam, K.K. (2005). Energy Flow in Agriculture: Bangladesh. American Journal of Environmental Sciences 1:213-220
Anonymous, (2010). Annual agricultural statistics. Ministry of Jihad-e-Agriculture of Iran. www.maj.ir
Banaeian, N.; Omid, M. & Ahmadi, H. (2010). Energy and economic analysis of greenhouse strawberry production in Tehran province of Iran. Energy Conversion and Management 52:1020-1025
Banker, R.; Charnes, A. & Cooper, W. (1984). Some models for estimating technical and scale inefficiencies in data envelopment analysis. Management Science 30:1078–1092
Barnes, A.P. (2006). Does multi-functionality affect technical efficiency? A non-parametric analysis of the Scottish dairy industry. Journal of Environmental Management 80:287-294
Barr, S.I.; McCarron, D.A.; Heaney, R.P.; Dawson-Hughes, B.; Berga, S.L.; Stern, J.S. & Oparil, S. (2000). Effects of Increased Consumption of Fluid Milk on Energy and Nutrient Intake, Body Weight, and Cardiovascular Risk Factors in Healthy Older Adults. Journal of the American Dietetic Association 100:810-817
Beheshti Tabar, I.; Keyhani, A. & Rafiee, S. (2010). Energy balance in Iran's agronomy (1990-2006). Renewable and Sustainable Energy Reviews 14:849-855
Canakci, M.; Topakci, M.; Akinci, I. & Ozmerzi, A. (2005). Energy use pattern of some field crops and vegetable production: Case study for Antalya Region, Turkey. Energy Conversion and Management 46:655-666
Chalabi, Z.S. & Bailey, B.J. (1991). Sensitivity analysis of a non-steady state model of the greenhouse microclimate. Agricultural and Forest Meteorology 56:111-127
Chauhan, N.S.; Mohapatra, P.K.J. & Pandey, K.P. (2006). Improving energy productivity in paddy production through benchmarking--An application of data envelopment analysis. Energy Conversion and Management 47:1063-1085
Cochran, W.G. (1977). Sampling techniques. 3rd Edition, John Wiley & Sons, NY, USA Coelli, T.J. (1996). A Guide to DEAP Ver. 2.1, A data envelopment analysis
(computer)program. Centre for efficiency and productivity analysis. University of New England <www.une.edu.au/econometrics/cepa.htm>
Cooper, L.M.; Seiford, L.M. & Tone, K., (2006). Introduction to data envelopment analysis and its uses. New York: Springer
Cooper, W.; Seiford L, M. & Tone, K. (2004). Data Envelopment Analysis, A comprehensive text with models, applications, references and DEA-solver software. Massachusetts, USA: Kluwer Academic Publishers
De, D.; Singh, R.S. & Chandra, H. (2001). Technological impact on energy consumption in rainfed soybean cultivation in Madhya Pradesh. Applied Energy 70:193-213
Drechsler, M. (1998). Sensitivity analysis of complex models. Biological Conservation 86:401-412 Erdal, G.; Esengün, K.; Erdal, H. & Gündüz, O. (2007). Energy use and economical analysis of
sugar beet production in Tokat province of Turkey. Energy 32:35-41 Esengun, K.; Erdal, G.; Gündüz, O. & Erdal, H., (2007). An economic analysis and energy use
in stake-tomato production in Tokat province of Turkey. Renewable Energy 32:1873-1881
Fadai, D. (2007). Utilization of renewable energy sources for power generation in Iran. Renewable and Sustainable Energy Reviews 11:173-181
FAO, (2008). Food and Agricultural Organization. www.fao.org
www.intechopen.com

Energy Efficiency Analysis in Agricultural Productions: Parametric and Non-Parametric Approaches
157
Fraser, I. & Cordina, D. (1999). An application of data envelopment analysis to irrigated dairy farms in Northern Victoria, Australia. Agricultural Systems 59:267-282
Hamby, D.M. (1994). A review of techniques for parameter sensitivity analysis of environmental models. Environmental Monitoring and Assessment 32:135-154
Hatirli, S.A.; Ozkan, B. & Fert, C. (2005). An econometric analysis of energy input-output in Turkish agriculture. Renewable and Sustainable Energy Reviews 9:608-623
Hu, J.-L. & Kao, C.-H. (2007). Efficient energy-saving targets for APEC economies. Energy Policy 35:373-382
Iráizoz, B.; Rapún, M. & Zabaleta, I. (2003). Assessing the technical efficiency of horticultural production in Navarra, Spain. Agricultural Systems 78:387-403
Jianbo, L. (2006). Energy balance and economic benefits of two agroforestry systems in northern and southern China. Agriculture, Ecosystems & Environment 116:255-262
Kallivroussis, L.; Natsis, A. & Papadakis, G. (2002). The energy balance of sunflower production for biodiesel in Greece. Biosystems Engineering 81:347-354
Khan, S.; Khan, M.A.; Hanjra, M.A. & Mu, J. (2009). Pathways to reduce the environmental footprints of water and energy inputs in food production. Food Policy 34:141-149
Kitani, O. (1999). CIGR handbook of agricultural engineering, Volume 5: Energy and biomass engineering. ASAE Publications, St Joseph, MI
Kizilaslan, H. (2009). Input-output energy analysis of cherries production in Tokat Province of Turkey. Applied Energy 86:1354-1358
Kulekci, M. (2010). Technical efficiency analysis for oilseed sunflower farms: a case study in Erzurum, Turkey. Journal of the Science of Food and Agriculture 90:1508-1512
Lamoureux, J., Tiersch, T.R. & Hall, S.G. (2006). Sensitivity analysis of the pond heating and temperature regulation (PHATR) model. Aquacultural Engineering 34:117-130
Latif, S. & Anwar, F. (2009). Effect of aqueous enzymatic processes on sunflower oil quality. Journal of the American Oil Chemists' Society 86:393-400
Liu, Y.; Høgh-Jensen, H.; Egelyng, H. & Langer, V. (2010). Energy efficiency of organic pear production in greenhouses in China. Renewable Agriculture and Food Systems 25:196-203
Malana, N.M. & Malano, H.M. (2006). Benchmarking productive efficiency of selected wheat areas in Pakistan and India using data envelopment analysis. Irrigation and Drainage 55:383-394.
Meul, M.; Nevens, F.; Reheul, D. & Hofman, G. (2007). Energy use efficiency of specialised dairy, arable and pig farms in Flanders. Agriculture, Ecosystems & Environment 119:135-144
Mobtaker, H.G.; Keyhani, A.; Mohammadi, A.; Rafiee, S. & Akram, A. (2010). Sensitivity analysis of energy inputs for barley production in Hamedan Province of Iran. Agriculture, Ecosystems & Environment 137:367-372
Mohammadi, A. & Omid, M. (2010). Economical analysis and relation between energy inputs and yield of greenhouse cucumber production in Iran. Applied Energy 87:191-196
Mohammadi, A., Rafiee, S., Mohtasebi, S.S. & Rafiee, H. (2010). Energy inputs - yield relationship and cost analysis of kiwifruit production in Iran. Renewable Energy 35:1071-1075
Moore, S.R. (2010). Energy efficiency in small-scale biointensive organic onion production in Pennsylvania, USA. Renewable Agriculture and Food Systems 25:181-188
Mousavi-Avval, S.H.; Rafiee, S.; Jafari, A. & Mohammadi, A. (2011a). Energy flow modeling and sensitivity analysis of inputs for canola production in Iran. Journal of Cleaner Production 19:1464-1470
www.intechopen.com

Energy Efficiency – A Bridge to Low Carbon Economy
158
Mousavi-Avval, S.H.; Rafiee, S.; Jafari, A. & Mohammadi, A. (2011b). The Functional Relationship Between Energy Inputs and Yield Value of Soybean Production in Iran. International Journal of Green Energy 8:398-410
Mousavi-Avval, S.H.; Rafiee, S.; Jafari, A. & Mohammadi, A. (2011c). Improving energy use efficiency of canola production using data envelopment analysis (DEA) approach. Energy 36:2765-2772
Mousavi-Avval, S.H.; Rafiee, S.; Jafari, A. & Mohammadi, A. (2011d). Optimization of energy consumption for soybean production using Data Envelopment Analysis (DEA) approach. Applied Energy 88:3765-3772
Mousavi Avval, S.H.; Rafiee, S.; Jafari, A. & Mohammadi, A. (2011). Improving energy productivity of sunflower production using data envelopment analysis (DEA) approach. Journal of the Science of Food and Agriculture 91:1885-1892
Mukherjee, K. (2008). Energy use efficiency in the Indian manufacturing sector: An interstate analysis. Energy Policy 36:662-672
Nassiri, S.M. & Singh, S. (2009). Study on energy use efficiency for paddy crop using data envelopment analysis (DEA) technique. Applied Energy 86:1320-1325
Omid, M.; Ghojabeige, F.; Delshad, M. & Ahmadi, H. (2010). Energy use pattern and benchmarking of selected greenhouses in Iran using data envelopment analysis. Energy Conversion and Management 52:153-162
Pimentel, D. & Patzek, T.W. (2005). Ethanol Production Using Corn, Switchgrass, and Wood; Biodiesel Production Using Soybean and Sunflower. Natural Resources Research 14:65-76
Rafiee, S.; Mousavi Avval, S.H. & Mohammadi, A. (2010). Modeling and sensitivity analysis of energy inputs for apple production in Iran. Energy 35:3301-3306
Reig-Martínez, E. & Picazo-Tadeo, A.J. (2004). Analysing farming systems with Data Envelopment Analysis: citrus farming in Spain. Agricultural Systems 82:17-30
Samavatean, N.; Rafiee, S.; Mobli, H. & Mohammadi, A. (2011). An analysis of energy use and relation between energy inputs and yield, costs and income of garlic production in Iran. Renewable Energy 36:1808-1813
Scheel, H. (2000). EMS: efficiency measurement system users manual, Ver. 1.3, Operations Research and Wirtschaftsinformatik, University of Dortmund. Dortmund, Germany; <http://www.wiso.uni-dortmund.de/lsfg/or/scheel/ems>
Sherman, H.D. (1988). Service organization productivity management. The Society of Management Accountants of Canada, Hamilton, Ontario
Singh, G.; Singh, S. & Singh, J. (2004). Optimization of energy inputs for wheat crop in Punjab. Energy Conversion and Management 45:453-465
Topp, C.F.E.; Stockdale, E.A.; Watson, C.A. & Rees, R.M. (2007). Estimating resource use efficiencies in organic agriculture: a review of budgeting approaches used. Journal of the Science of Food and Agriculture 87:2782-2790
Turhan, S.; Ozbag, B.C. & Rehber, E. (2008). A comparison of energy use in organic and conventional tomato production. Journal of Food Agriculture & Environment 6:318-321
Unakitan, G.; Hurma, H. & Yilmaz, F. (2010). An analysis of energy use efficiency of canola production in Turkey. Energy 35:3623-3627
Zhang, X.; Huang, G.H.; Lin, Q. & Yu, H., (2009). Petroleum-contaminated groundwater remediation systems design: A data envelopment analysis based approach. Expert Systems with Applications 36:5666-5672
Zhou, P.; Ang, B.W. & Poh, K.L. (2008). A survey of data envelopment analysis in energy and environmental studies. European Journal of Operational Research 189:1-18
www.intechopen.com

Energy Efficiency - A Bridge to Low Carbon EconomyEdited by Dr. Zoran Morvaj
ISBN 978-953-51-0340-0Hard cover, 344 pagesPublisher InTechPublished online 16, March, 2012Published in print edition March, 2012
InTech EuropeUniversity Campus STeP Ri Slavka Krautzeka 83/A 51000 Rijeka, Croatia Phone: +385 (51) 770 447 Fax: +385 (51) 686 166www.intechopen.com
InTech ChinaUnit 405, Office Block, Hotel Equatorial Shanghai No.65, Yan An Road (West), Shanghai, 200040, China
Phone: +86-21-62489820 Fax: +86-21-62489821
Energy efficiency is finally a common sense term. Nowadays almost everyone knows that using energy moreefficiently saves money, reduces the emissions of greenhouse gasses and lowers dependence on importedfossil fuels. We are living in a fossil age at the peak of its strength. Competition for securing resources forfuelling economic development is increasing, price of fuels will increase while availability of would graduallydecline. Small nations will be first to suffer if caught unprepared in the midst of the struggle for resourcesamong the large players. Here it is where energy efficiency has a potential to lead toward the natural next step- transition away from imported fossil fuels! Someone said that the only thing more harmful then fossil fuel isfossilized thinking. It is our sincere hope that some of chapters in this book will influence you to take a freshlook at the transition to low carbon economy and the role that energy efficiency can play in that process.
How to referenceIn order to correctly reference this scholarly work, feel free to copy and paste the following:
S. H. Mousavi Avval, Sh. Rafiee and A. Keyhani (2012). Energy Efficiency Analysis in Agricultural Productions:Parametric and Non-Parametric Approaches, Energy Efficiency - A Bridge to Low Carbon Economy, Dr. ZoranMorvaj (Ed.), ISBN: 978-953-51-0340-0, InTech, Available from: http://www.intechopen.com/books/energy-efficiency-a-bridge-to-low-carbon-economy/energy-efficiency-analysis-in-agricultural-productions-parametric-and-non-parametric-approaches

© 2012 The Author(s). Licensee IntechOpen. This is an open access articledistributed under the terms of the Creative Commons Attribution 3.0License, which permits unrestricted use, distribution, and reproduction inany medium, provided the original work is properly cited.