energy efficiency climate action plan
TRANSCRIPT

Energy EfficiencyClimate Action Plan
CITY OF AMERICAN CANYON December 2012
City of American Canyon, California
Energy Efficiency Climate Action Plan
Community Development Department
December 2012
American Canyon City Council Leon Garcia, Mayor Cindy Coffey, Vice Mayor Joan Bennett, Councilmember Mark Joseph, Councilmember Belia Ramos Bennett, Councilmember
American Canyon Planning Commission Katharine Bourassa, Chair Chelle Castagnola, Vice Chair Jack Meck, Commissioner Pamela Quiroz, Commissioner Eric Altman, Commissioner
American Canyon City Staff Brent Cooper, AICP, Community Development Director Michael W. Throne, P.E., Public Works Director, Interim Parks and Recreation Director Deanna Parness, Management Analyst Taresa Murphy, Administrative Assistant, Community Development Department Mary Holstein, Administrative Assistant, Public Works Department
Consultants to the City Environmental Science Associates (ESA): Jeff Caton, Claire Myers, Judith Silver, John Hanscom,
Joshua Smith, Lesley Lowe DNV KEMA: Betty Seto, Amy Jewel, Brad Haydel Pacific Gas and Electric (PG&E) Company: Jillian Rich, Jessica Waggoner, Justin Real, Allan
Lacson, Armando Navarro, Katie Davis
Contents American Canyon Energy Efficiency Climate Action Plan i
Contents
Glossary of Terms and Acronyms v
Executive Summary ES-1
ES.1 Document Summary ES-2 ES.2 Baseline Energy Use and GHG Emissions ES-3 ES.3 GHG Reduction Targets ES-6 ES.4 Energy and GHG Strategies and Measures ES-7 ES.5 Reaching the 2020 Reduction Target ES-7
1 Planning for Energy Needs and Climate Change 1-1 1.1 EECAP Purpose, Goal, and Benefits 1-2 1.2 EECAP Development 1-2 1.3 Regulatory Environment 1-3
2 Energy and GHG Emissions Baseline Forecast, and Target Reductions 2-1 2.1 Community-wide Energy Usage and GHG Emissions 2-2 2.2 Municipal Energy Usage and GHG Emissions 2-4 2.3 GHG Emissions Projects 2-7 2.4 Emissions Reduction Targets 2-9
3 Community Strategies and Measures 3-1 3.1 Community Energy Reduction Opportunities 3-1 3.2 Strategy and Measure Development 3-2 3.3 Community Strategies and Measures 3-3
ii American Canyon Energy Efficiency Climate Action Plan Contents
4 Municipal Strategies and Measures 4-1 4.1 Municipal Energy Reduction Opportunities 4-1 4.2 Strategy and Measure Development 4-2 4.3 Municipal Strategies and Measures 4-3
5 Implementation and Monitoring 5-1 5.1 Achieving the GHG Reduction Target 5-1 5.2 Implementation Responsibility and Outreach Channels 5-3 5.3 Schedule and First Steps 5-4 5.4 Monitoring and Plan Updates 5-6
6 Conclusion 6-1
Appendices (bound separately) A. Stakeholder Outreach and Engagement Plan for City of
American Canyon Energy Efficient Climate Action Plan A-1
B. Outreach and Stakeholder Engagement Report B-1
C. Policy Gap Analysis and Framework for Prioritizing Reduction Measures C-1
D. Energy and GHG Inventory Methodology D-1
E. Cost Benefit Analysis Methodology E-1
List of Figures ES-1 2005 Baseline Community GHG Emissions by Sector ES-4
ES-2 Community-wide Energy-related GHG Emissions under 2005 Baseline, 2010 Update, 2020 BAU, and 2020 Reduction Target ES-6
ES-3 Community-wide Energy-Related GHG Emissions Reductions, by Source ES-8
2-1 2005 Baseline Community GHG Emissions by Sector 2-3
2-2 2005 and 2010 Community GHG Emissions by Sector 2-4
2-3 2005 Baseline and 2010 Updated Municipal Emissions by Sector 2-7
2-4 Community-wide Energy-related GHG Emissions under 2005 Baseline, 2010 Update, 2020 BAU, and 2020 Reduction Target 2-10
5-1 Community-wide Energy-related GHG Emissions Reductions, by Source 5-2
List of Tables ES-1 2005 Baseline and 2010 Updated Community Energy Use by
Sector ES-3
ES-2 Community-wide Baseline and Projected GHG Emissions 2005-2035 ES-4
ES-3 2005 and 2010 Municipal Energy Use by Category ES-5
ES-4 Municipal Baseline and Projected GHG Emissions 2005-2035 ES-5
2-1 2005 Baseline and 2010 Updated Community Energy Use by Sector 2-2
Contents American Canyon Energy Efficiency Climate Action Plan iii
List of Tables (continued) 2-2 2005 Baseline and 2010 Updated Community GHG Emissions
by Sector 2-3
2-3 2005 and 2010 Municipal Energy Use by Category 2-5
2-4 Ten Highest Municipal Consumers of Electricity in 2010 2-5
2-5 2005 and 2010 Municipal Consumers of Natural Gas 2-6
2-6 2005 Baseline and 2010 Updated Municipal Emissions by Sector 2-6
2-7 American Canyon Historic and Projected Growth Estimates 2-8
2-8 Community-wide Baseline and Projected GHG Emissions 2005-2035 2-8
2-9 Municipal Baseline and Projected GHG Emissions 2005-2035 2-9
3-1 Prioritization of Community Measures 3-2
3-2 Summary of Community Energy Strategies and Measures 3-4
4-1 Prioritization of Municipal Measures 4-2
4-2 Summary of Municipal Energy Strategies and Measures 4-3
5-1 Annual Citywide Events 5-4
5-2 EECAP Measure Implementation Schedule 5-5

iv American Canyon Energy Efficiency Climate Action Plan Contents
This page intentionally left blank
Glossary of Terms and Acronyms American Canyon Energy Efficiency Climate Action Plan v
Glossary of Terms and Acronyms
AB 32 Assembly Bill 32, the California Global Warming Solutions Act of 2006. Establishes a comprehensive program of regulatory and market mechanisms to achieve real, quantifiable, cost-effective reductions of greenhouse gases for the state of California. Makes the California Air Resources Board responsible for monitoring and reducing statewide greenhouse gas emissions, with a target to reduce emissions to 1990 levels by 2020.
ABAG Association of Bay Area Governments
BAAQMD Bay Area Air Quality Management District
Baseline Inventory The base year for assessment of energy trends against which future progress can be measured for a single calendar year (2005), consistent with legislative guidance and the Assembly Bill 32 Scoping Plan.
BAU Business as Usual. A scenario that assumes that no new local actions will be taken to reduce energy usage or associated greenhouse gas emissions from current and future residents and businesses within the City.
CAP Climate Action Plan
CalEPA California Environmental Protection Agency
vi American Canyon Energy Efficiency Climate Action Plan Glossary of Terms and Acronyms
CALGreen Refers to CALGreen component of the California Building Code. See California Building Code
CalPOP California Wastewater Process Optimization Project
California Building Code California Code of Regulations, Title 24, also known as the California Building Standards Code (composed of 12 parts). Title 24, Part 6 sets forth California’s energy efficiency standards for residential and nonresidential buildings and was established in 1978 in response to a legislative mandate to reduce California’s energy consumption. The standards are updated periodically to allow consideration and possible incorporation of new energy efficiency technologies and methods.
CARB California Air Resources Board
CCA Community Choice Aggregation
CEC California Energy Commission
CEESP California Long Term Energy Efficiency Strategic Plan. A plan adopted by the California Public Utilities Commission in 2008 that presents a single roadmap to achieve maximum energy savings across all major groups and sectors in California. This comprehensive plan for 2009 to 2020 is the state’s first integrated framework of goals and strategies for saving energy, covering government, utility, and private sector actions, and holds energy efficiency to its role as the highest priority resource in meeting California’s energy needs.
CEQA California Environmental Quality Act
CFL Compact fluorescent light
CH4 Methane
CO2 Carbon dioxide
CO2e Carbon dioxide equivalent. A metric measure used to compare the emissions of various greenhouse gases based upon their global warming potential (GWP). The carbon dioxide equivalent for a gas is derived by multiplying the tons of the gas by the associated GWP factor. For example, the GWP factor for methane is 21. This means that emissions of one million metric tons (MT) of methane are equivalent to emissions of 21 million MTCO2e.
Community-wide Refers to all activities within a city’s geographic boundary. Typical sectors include government and civic, residential, commercial, and industrial energy use, transportation, off-road equipment, waste generation, and energy associated with water delivery and treatment.
CPUC California Public Utilities Commission
Glossary of Terms and Acronyms American Canyon Energy Efficiency Climate Action Plan vii
DEER Database on Energy Efficient Resources. This CEC and CPUC database provides estimates for electricity and natural gas savings associated with energy efficiency measures.
Demand Response Mechanism for managing end-user electricity consumption in response to energy supply conditions, especially during summer periods when electricity demand on the California power grid is high. A demand response system directly or remotely controls electrical equipment such as lights or air conditioning to reduce electricity consumption during times of increased energy demand and/or constrained energy availability.
Direct Access Electricity Direct access service is an optional choice that customers can select to purchase electricity and other services from an electric service provider (ESP), instead of from a public or private utility company. An ESP is an entity that contracts directly with its customers to provide electric service, and is responsible for arranging an adequate supply of electricity. ESPs are required to meet certain requirements with the California Public Utilities Commission in addition to meeting financial and technical requirements with individual utility companies.
DOE United States Department of Energy
DOT California Department of Transportation
EECAP Energy Efficiency Climate Action Plan
EECBG Energy Efficiency and Conservation Block Grant. The Energy Efficiency and Conservation Block Grant program was funded through the American Recovery and Reinvestment Act and managed by the US Department of Energy to assist cities, counties, states, and territories to develop, promote, and implement energy efficiency and conservation programs and projects.
ENERGY STAR A joint program of the U.S. Environmental Protection Agency and the U.S. Department of Energy to provide consumers with energy efficiency information and incentives to purchase the most energy-efficient products available.
ESA Environmental Science Associates
First Cost Immediate purchase and installation cost. First costs do not include lifecycle or long-term operating costs, which may result in long-term cost savings from increased efficiency, reduced maintenance, and other factors.
Forecast Energy and GHG emissions are forecast to future years based on current consumption patterns and projected increases in population, job growth and other local trends.

viii American Canyon Energy Efficiency Climate Action Plan Glossary of Terms and Acronyms
GHG Greenhouse Gases. Gases which cause heat to be trapped in the atmosphere, generally warming the Earth. Greenhouse gases are necessary to keep the Earth warm, but increasing concentrations of these gases are implicated in global climate change. The majority of greenhouse gases come from natural sources, although human activity is also a major contributor. The principal greenhouse gases that enter the atmosphere because of human activities are carbon dioxide (CO2), methane (CH4), nitrous Oxide (N2O) and fluorinated Gases (hydrofluorocarbons, perfluorocarbons, and sulfur hexafluoride).
Green Building Sustainable or “green” building is a holistic approach to design, construction, and demolition that minimizes the building’s impact on the environment, the occupants, and the community.
Green Team A formal or informal group of people within an organization or community that promotes more environmentally sustainable practices and sustainability plans and management approaches.
Greenhouse Gas Inventory A greenhouse gas inventory provides estimates of the amount of greenhouse gases emitted to and removed from the atmosphere by human activities. A city or county that conducts an inventory looks at both community emissions sources as well as emissions from government operations.
GWh Gigawatt hour
GWP Global warming potential
HPS High pressure sodium
HVAC Heating, ventilation and cooling
ICLEI Local Governments for Sustainability
JPA Joint Powers Agency
kWh Kilowatt-hour. A unit of energy equivalent to one kilowatt (kW) of energy used for an hour. For example, if an appliance requires a kW of energy to function, leaving the appliance on for one hour would consume one kWh of energy.
LED Light emitting diode
LEED Leadership in Energy and Environmental Design. An internationally recognized green building certification system, which provides third-party verification that a building or community was designed and built using sustainable approaches, with particular regard to energy savings, water efficiency, CO2 emissions reductions, and improved indoor environmental quality, among others.
Glossary of Terms and Acronyms American Canyon Energy Efficiency Climate Action Plan ix
Measure An action or procedure to achieve a strategy. EECAP Programs provide the foundation for quantification of energy reduction potential and assignment of responsibility for implementation.
Municipal Refers to energy use and greenhouse gas emissions from City-owned and operated facilities and equipment.
MH Metal halide
MT Million tons
MT CO2e Metric tons of carbon dioxide equivalent
N2O Nitrous oxide
NCEW Napa County Energy Watch
OPR California Governor’s Office of Planning and Research
PACE Property-Assessed Clean Energy. A form of long-term financing that creates municipal finance districts to provide loans to homeowners and businesses for energy-efficient retrofits and renewable energy system installations. Loans are repaid through an annual surcharge on property tax assessments.
PG&E Pacific Gas and Electric. An investor-owned utility that is the primary electricity and natural gas provider to City of American Canyon and Napa County.
PNNL Pacific Northwest National Laboratory
PPA Power Purchase Agreement
PV Photovoltaic
Rebate Offered by the state, utility, or local government to promote the installation of renewables and energy efficiency projects.
Renewable Energy Energy from sources that regenerate and are less damaging to the environment, such as solar, wind, biomass, and small-scale hydroelectric power.
RPS Renewable Portfolio Standard. Requires utility providers to increase the portion of generated energy that comes from renewable sources to 20% by 2010 and to 33% by 2020.
SB 375 Senate Bill 375: Enhances California’s ability to reach its AB 32 goals by planning more sustainable communities.
SB 97 Senate Bill 97: Requires the Governor’s Office of Planning and Research (OPR) to develop and adopt CEQA guidelines for the mitigation of GHG emissions.
SNC Sustainable Napa County

x American Canyon Energy Efficiency Climate Action Plan Glossary of Terms and Acronyms
Strategy An active tense statement that sets a specific course of action for decision-makers to achieve a goal.
Title 24 California Code of Regulations, Title 24, also known as the California Building Standards Code (composed of 12 parts). Title 24, Part 6 established California’s energy efficiency standards for residential and nonresidential buildings. See California Building Standards.
UWMP Urban Water Management Plan
U.S. EPA United States Environmental Protection Agency
Zero Net Energy For buildings, use of no more energy over the course of a year than can be generated onsite through renewable resources such as solar, wind, or geothermal power.

Executive Summary American Canyon Energy Efficiency Climate Action Plan ES-1
Executive Summary
The City of American Canyon recognizes the importance of planning for future energy needs and reducing dependence on energy sources that contribute to climate change. The effects of climate change on the City’s landscape and on its citizens could be significant, and the City acknowledges the role that local governments must play in reducing greenhouse gas (GHG) emissions. To date, the City has incorporated energy efficiency, renewable energy, and water conservation-related goals and policies into its General Plan and other planning documents, and has worked with Pacific Gas and Electric Company (PG&E) to disseminate energy efficiency information and technical information assistance throughout the community.
The City is now committed to developing a coordinated approach to energy efficiency and GHG reductions within the community and the local (municipal) government. This Energy Efficiency Climate Action Plan (EECAP, or the Plan) serves as the first step in that process, providing feasible strategies and measures that cost-effectively reduce energy use and energy-related GHG emissions in both municipal operations and across the community. In addition, successful implementation of the EECAP will result in myriad co- benefits to members of the community, such as:
Reduced utility bills
Reduced maintenance costs
Reduced water usage
American Canyon General Plan Goal 8F
Reduce consumption of
nonrenewable energy
sources and support the
development and
utilization of new energy
sources.
ES-2 American Canyon Energy Efficiency Climate Action Plan Executive Summary
Increased indoor comfort in homes and buildings
Increased home and building values
Improved air quality
More beautiful neighborhoods
Conservation of natural resources
Support for local jobs
Increased educational opportunities and training
Ultimately, the EECAP provides the foundation for a comprehensive Climate Action Plan that will cover all sources of GHG emissions in the community, including waste and transportation, and will provide community measures to combat broader climate change issues such as water reliability and sea level rise.
ES.1 Document Summary
Chapter 1of the EECAP is an introduction that provides the City’s reasons for developing this plan, including the EECAP’s purpose, goal, and benefits. This chapter discusses the City’s approach to developing the Plan, which included these steps:
1. Establish 2005 baseline, 2010 update, and 2020 future projections of energy consumption and associated GHG emissions.
2. Develop energy reduction and renewable energy strategies and measures.
3. Develop GHG reduction target.
4. Identify implementation steps.
5. Conduct outreach and stakeholder engagement.
Chapter 2 includes baselines of community and municipal energy use (electricity and natural gas) for 2005 and 2010, and an inventory of GHG emissions from all sectors in the community for those years. This chapter presents forecasts of anticipated GHG emissions for years 2020 and 2035 under a business-as-usual (BAU) scenario that takes into consideration current consumption patterns, as well as population and job projections. In this chapter, the City establishes a reduction target for energy-related GHG emissions, for both the community and for municipal operations, of 15 percent below the 2005 baseline.
Chapter 3 provides a set of energy strategies and measures designed to decrease community-wide energy use and energy-related GHG emissions and increase renewable energy generation, while Chapter 4 provides corresponding strategies and measures for municipal operations. To develop these strategies and measures, the City reviewed the baseline data, GHG BAU projections, existing community and municipal programs and policies pertaining to energy efficiency, stakeholder feedback, and other available information.
Chapter 5 provides a summary of how the EECAP measures, in conjunction with California statewide actions, will contribute towards energy efficiency and reaching the City’s energy-related GHG reduction target. The chapter discusses implementation responsibility, outreach channels the City will employ, and the City’s schedule for measure implementation, including first steps.

Executive Summary American Canyon Energy Efficiency Climate Action Plan ES-3
Finally, the chapter describes monitoring procedures, processes for updating the plan, and other steps needed to ensure that measures are implemented and the City achieves its energy goals and GHG reduction target.
Chapter 6 provides conclusions and describes the challenge the City faces to achieve its 2020 energy-related GHG target. This chapter includes a brief discussion about the City’s plans to develop a comprehensive Climate Action Plan (CAP) in the coming years, and how the EECAP provides a solid foundation for the comprehensive CAP, which will target reductions from all sources of GHGs across the community, including energy, transportation, solid waste, and water.
ES.2 Baseline Energy Use and GHG Emissions
ES 2.1 Community-Wide Energy Use and GHG Emissions
American Canyon’s community-wide energy and GHG emissions inventories encompass the energy consumption and GHG emissions resulting from activities taking place within the City limits, where the local government has jurisdictional authority. Table ES-1 provides 2005 and 2010 community-wide energy use aggregated by Residential and Non-Residential1 sectors.
Table ES-1: 2005 Baseline and 2010 Updated Community Energy Use by Sector (MT CO2e)
Emission Sector
2005 Electricity
(kWh)
2010 Electricity
(kWh)
% Increase in
Electricity
2005 Natural Gas
(therms)
2010 Natural Gas
(therms)
% Increase in
Electricity
Residential 33,089,639 38,523,051 16% 2,334,933 2,769,981 19%
Non-Residential 40,273,744 64,084,298 59% 3,827,445 4,609,425 20%
Total 73,363,383 102,607,349 40% 6,162,378 7,379,406 20%
Source: PG&E, 2012a
As shown in Table ES-1, the Non-Residential sector has historically used more electricity and natural gas than the Residential sector, using 55 percent and 62 percent of total community-wide electricity and natural gas, respectively, in 2005, and 62 percent of electricity and natural gas in 2010. For both sectors, the City experienced growth in energy consumption between 2005 and 2010, with a 40 percent increase in total electricity use and a 20 percent increase in total natural gas use during that time.
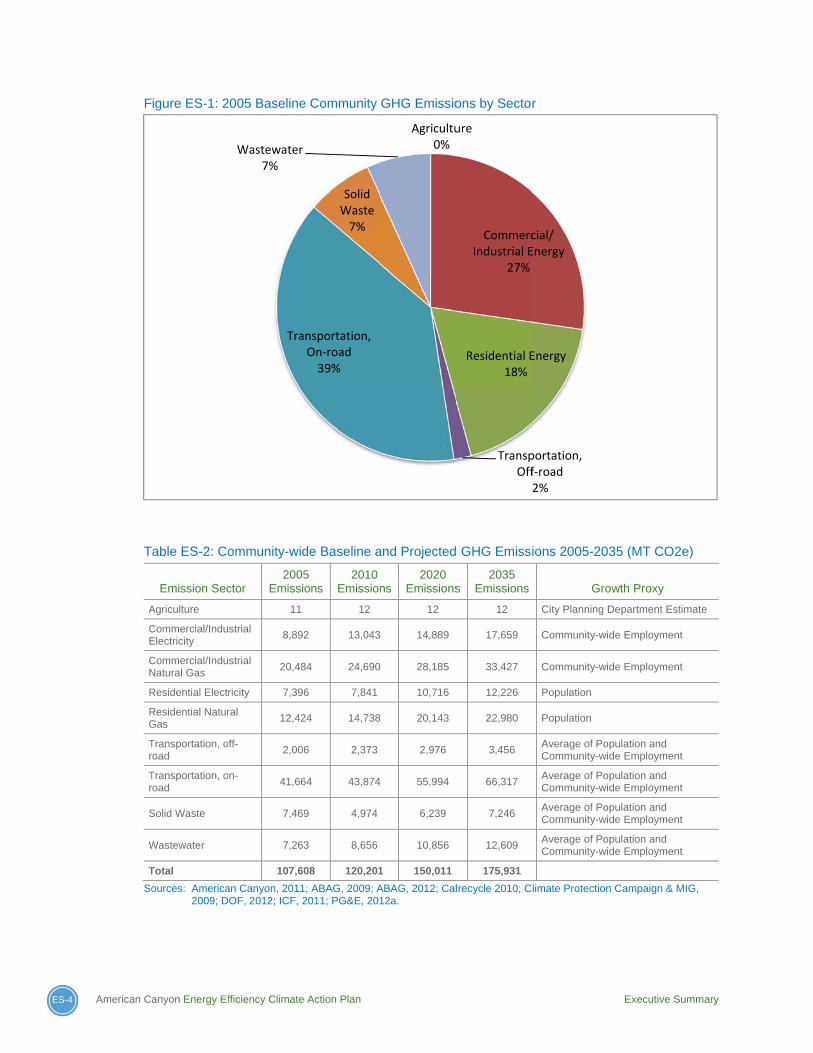
Figure ES-1 shows 2005 baseline community GHG emissions for energy and non-energy sectors, including Commercial/Industrial energy (electricity and natural gas), Residential energy (electricity and natural gas), On-road Transportation, Off-road Transportation, Solid Waste, Agriculture, and Wastewater.
Table ES-2 shows 2005 baseline, 2010 updated, and future projected GHG emissions for the nine sectors included in the City’s community-wide 2005 and 2010 GHG inventories. The table includes a description of the specific growth projections used as a proxy to project future emissions for each sector.
1
The Non-Residential Sector includes commercial, industrial, municipal, and all other non-residential consumers of energy.
ES-4 American Ca
F
T
A
CE
CN
R
RG
Tr
Tr
S
W
T
So
anyon Energy Ef
igure ES-1: 2
able ES-2: Co
Emission Sec
Agriculture
Commercial/InduElectricity
Commercial/InduNatural Gas
Residential Elect
Residential NaturGas
Transportation, oroad
Transportation, oroad
Solid Waste
Wastewater
Total
ources: America2009; D
fficiency Climate
2005 Baseline
ommunity-wid
ctor 2005
Emissi
11
strial 8,892
strial 20,48
ricity 7,396
ral 12,42
off-2,006
on-41,66
7,469
7,263
107,60
an Canyon, 2011OF, 2012; ICF, 2
Tra
Wastewater7%
Action Plan
e Community
de Baseline a
5 ons
2010 Emission
12
2 13,043
84 24,690
6 7,841
24 14,738
6 2,373
64 43,874
9 4,974
3 8,656
08 120,201
; ABAG, 2009; A2011; PG&E, 201
nsportation, On‐road39%
Solid Waste7%
GHG Emissio
and Projected
ns 2020
Emissions
12
14,889
28,185
10,716
20,143
2,976
55,994
6,239
10,856
1 150,011
ABAG, 2012; Cal12a.
Agricultu0%
ons by Sector
GHG Emissi
s 2035
Emissions
12
17,659
33,427
12,226
22,980
3,456
66,317
7,246
12,609
175,931
lrecycle 2010; C
ure
CommercIndustrial E
27%
Residential E18%
TranspOff
r
ions 2005-20
Gro
City Planning D
Community-wi
Community-wi
Population
Population
Average of PoCommunity-wi
Average of PoCommunity-wi
Average of PoCommunity-wi
Average of PoCommunity-wi
limate Protection
cial/ Energy
Energy
portation, f‐road2%
Executive Su
35 (MT CO2e
owth Proxy
Department Estim
de Employment
de Employment
pulation and de Employment
pulation and de Employment
pulation and de Employment
pulation and de Employment
n Campaign & M
ummary
e)
mate
IG,
Executive Summary American Canyon Energy Efficiency Climate Action Plan ES-5
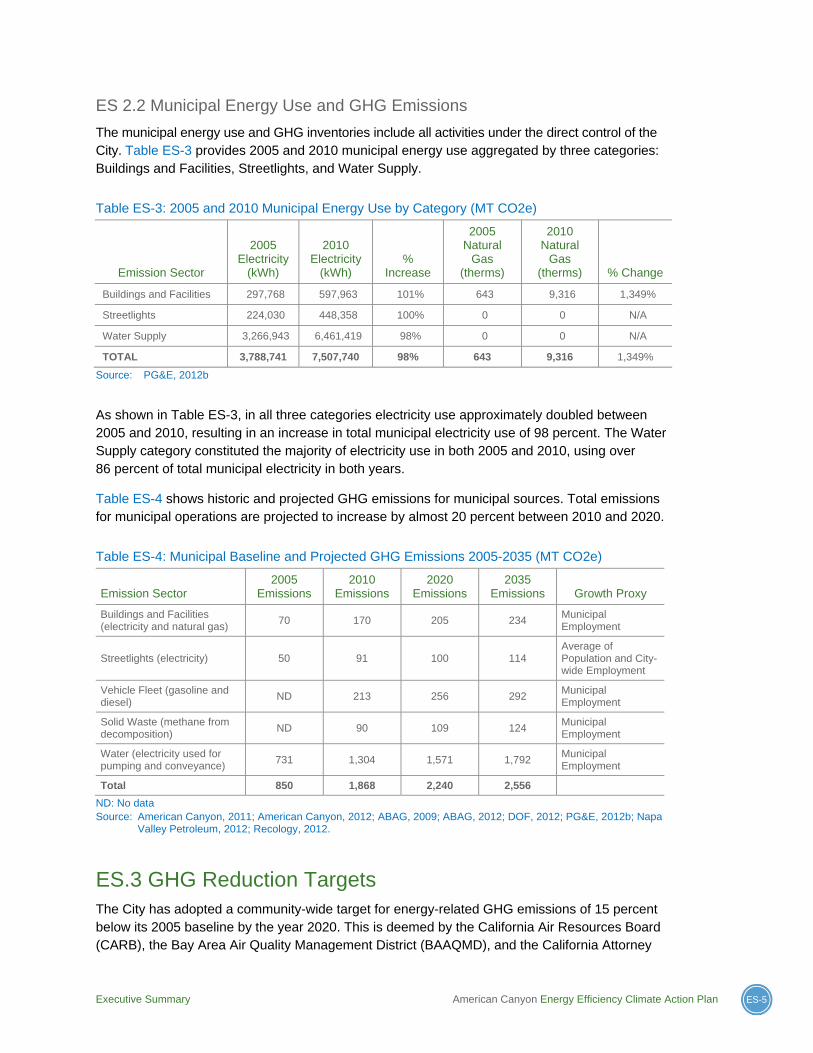
ES 2.2 Municipal Energy Use and GHG Emissions
The municipal energy use and GHG inventories include all activities under the direct control of the City. Table ES-3 provides 2005 and 2010 municipal energy use aggregated by three categories: Buildings and Facilities, Streetlights, and Water Supply.
Table ES-3: 2005 and 2010 Municipal Energy Use by Category (MT CO2e)
Emission Sector
2005 Electricity
(kWh)
2010 Electricity
(kWh) %
Increase
2005 Natural
Gas (therms)
2010 Natural
Gas (therms) % Change
Buildings and Facilities 297,768 597,963 101% 643 9,316 1,349%
Streetlights 224,030 448,358 100% 0 0 N/A
Water Supply 3,266,943 6,461,419 98% 0 0 N/A
TOTAL 3,788,741 7,507,740 98% 643 9,316 1,349%
Source: PG&E, 2012b
As shown in Table ES-3, in all three categories electricity use approximately doubled between 2005 and 2010, resulting in an increase in total municipal electricity use of 98 percent. The Water Supply category constituted the majority of electricity use in both 2005 and 2010, using over 86 percent of total municipal electricity in both years.
Table ES-4 shows historic and projected GHG emissions for municipal sources. Total emissions for municipal operations are projected to increase by almost 20 percent between 2010 and 2020.
Table ES-4: Municipal Baseline and Projected GHG Emissions 2005-2035 (MT CO2e)
Emission Sector 2005
Emissions 2010
Emissions 2020
Emissions 2035
Emissions Growth Proxy
Buildings and Facilities (electricity and natural gas)
70 170 205 234 Municipal Employment
Streetlights (electricity) 50 91 100 114 Average of Population and City-wide Employment
Vehicle Fleet (gasoline and diesel)
ND 213 256 292 Municipal Employment
Solid Waste (methane from decomposition)
ND 90 109 124 Municipal Employment
Water (electricity used for pumping and conveyance)
731 1,304 1,571 1,792 Municipal Employment
Total 850 1,868 2,240 2,556
ND: No data Source: American Canyon, 2011; American Canyon, 2012; ABAG, 2009; ABAG, 2012; DOF, 2012; PG&E, 2012b; Napa
Valley Petroleum, 2012; Recology, 2012.
ES.3 GHG Reduction Targets The City has adopted a community-wide target for energy-related GHG emissions of 15 percent below its 2005 baseline by the year 2020. This is deemed by the California Air Resources Board (CARB), the Bay Area Air Quality Management District (BAAQMD), and the California Attorney
ES-6 American Canyon Energy Efficiency Climate Action Plan Executive Summary
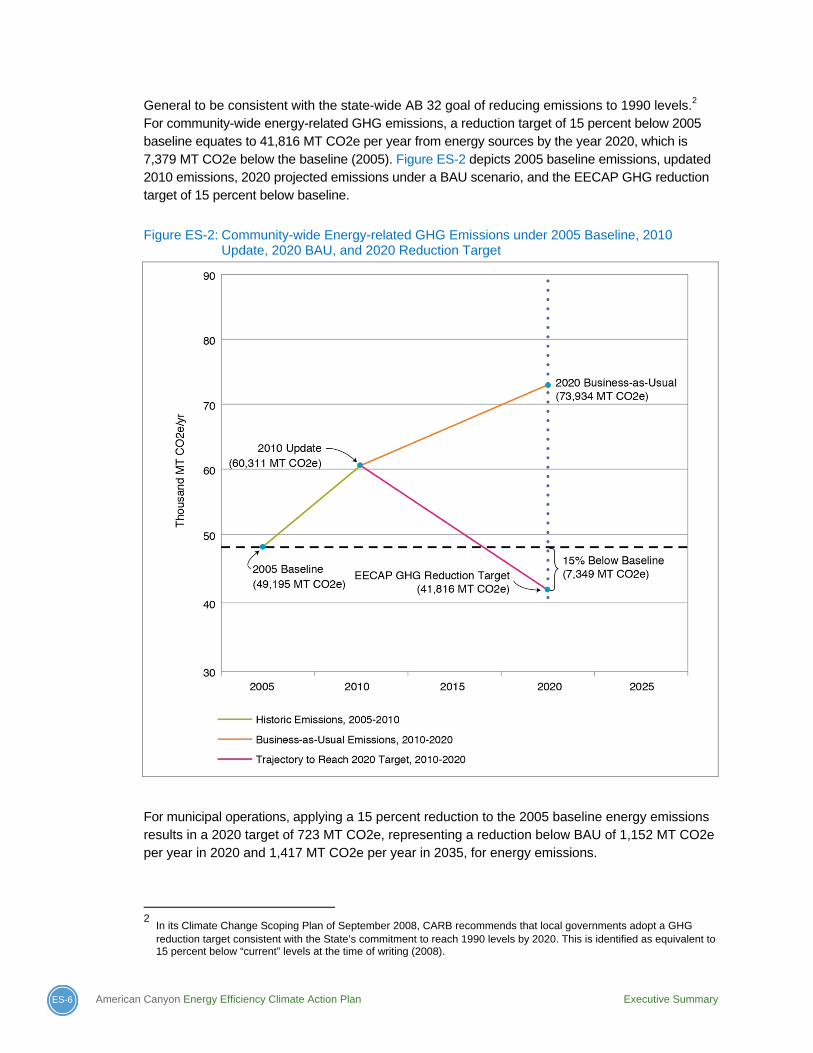
General to be consistent with the state-wide AB 32 goal of reducing emissions to 1990 levels.2 For community-wide energy-related GHG emissions, a reduction target of 15 percent below 2005 baseline equates to 41,816 MT CO2e per year from energy sources by the year 2020, which is 7,379 MT CO2e below the baseline (2005). Figure ES-2 depicts 2005 baseline emissions, updated 2010 emissions, 2020 projected emissions under a BAU scenario, and the EECAP GHG reduction target of 15 percent below baseline.
Figure ES-2: Community-wide Energy-related GHG Emissions under 2005 Baseline, 2010 Update, 2020 BAU, and 2020 Reduction Target
For municipal operations, applying a 15 percent reduction to the 2005 baseline energy emissions results in a 2020 target of 723 MT CO2e, representing a reduction below BAU of 1,152 MT CO2e per year in 2020 and 1,417 MT CO2e per year in 2035, for energy emissions.
2 In its Climate Change Scoping Plan of September 2008, CARB recommends that local governments adopt a GHG
reduction target consistent with the State’s commitment to reach 1990 levels by 2020. This is identified as equivalent to 15 percent below “current” levels at the time of writing (2008).
Executive Summary American Canyon Energy Efficiency Climate Action Plan ES-7
ES.4 Energy and GHG Strategies and Measures The EECAP would reduce energy use in existing and future buildings and landscapes through the promotion of construction, operations, and maintenance practices that incorporate energy efficiency and renewable energy. For example, the EECAP would ensure that new construction activity is planned and designed to maximize energy and water efficiency and conservation.
For reducing community energy use, the EECAP proposes seven overarching energy strategies and 13 measures pertaining to the following categories:
1. Existing Facilities- Non Residential
2. Existing Facilities- Residential
3. New Development- Non Residential
4. New Development- Residential
5. Renewable Energy
6. Outreach and Education
7. Water Conservation and Efficiency
For reducing municipal energy use, the EECAP proposes five overarching strategies and 10 measures pertaining to the following categories:
1. Existing Municipal Facilities
2. New Municipal Construction
3. Renewable Energy
4. Outreach and Education
5. Water Conservation and Efficiency
EECAP Chapters 3 and 4 provide a detailed description of what each measure includes and how it should be implemented, as well as estimates of anticipated energy, GHG and cost savings, and anticipated upfront costs of implementation. EECAP Chapter 5 contains a plan for measure implementation, including identification of responsible City departments and implementation prioritization based on a cost-benefit analysis.
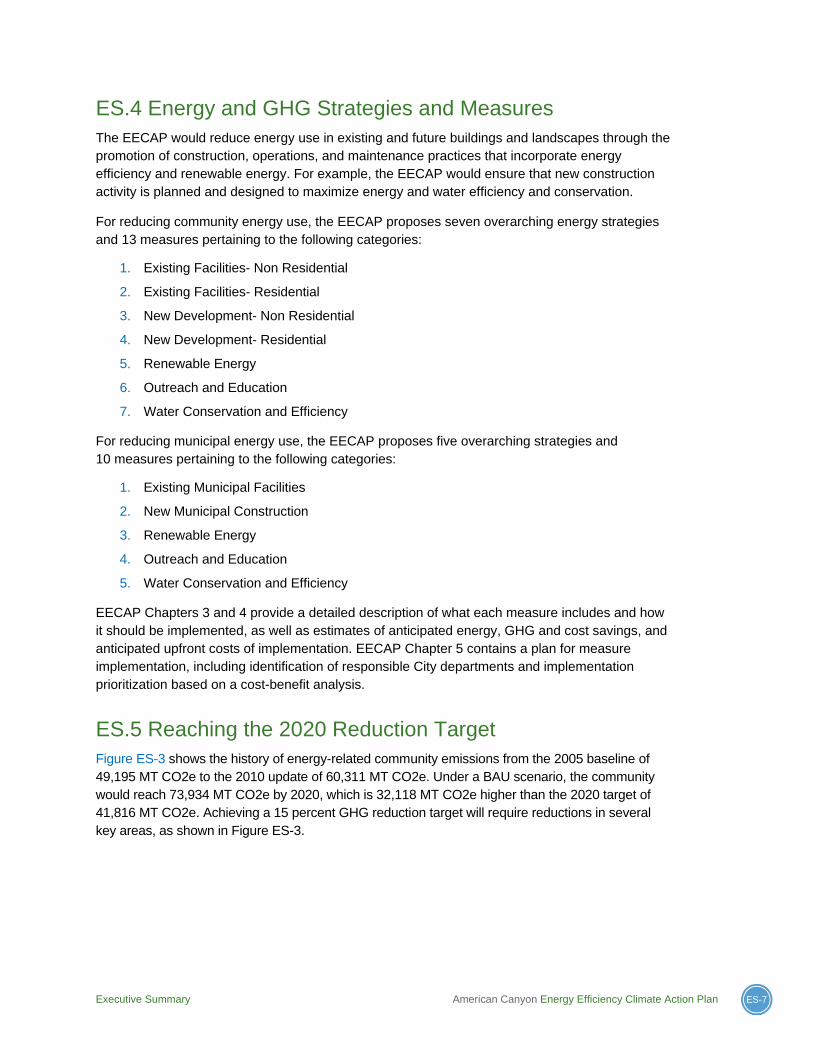
ES.5 Reaching the 2020 Reduction Target Figure ES-3 shows the history of energy-related community emissions from the 2005 baseline of 49,195 MT CO2e to the 2010 update of 60,311 MT CO2e. Under a BAU scenario, the community would reach 73,934 MT CO2e by 2020, which is 32,118 MT CO2e higher than the 2020 target of 41,816 MT CO2e. Achieving a 15 percent GHG reduction target will require reductions in several key areas, as shown in Figure ES-3.
ES-8 American Canyon Energy Efficiency Climate Action Plan Executive Summary
Figure ES-3: Community-wide Energy-Related GHG Emissions Reductions, by Source
Approximately 29.4 percent of the required reductions will come from California statewide measures, including the statewide Renewable Portfolio Standard (RPS) and updates to Title 24. Roughly 29.0 percent of the required reductions will come from implementation of EECAP measures identified as Priority 1, as described in Chapters 3 and 4 of the EECAP.
The remaining 41.7 percent of the required reductions will come from measures to be determined. Implementation of EECAP measures designated as Priority 2 and 3 will contribute to this target. However, in order to fully close the gap, the City recognizes that it will have to develop more aggressive programs, mandatory energy efficiency measures, and/or achieve higher-than-anticipated voluntary participation in the programs already included in the EECAP. The City plans to develop a comprehensive Climate Action Plan (CAP) in the coming years, providing more opportunity for constructive dialogue with the community and other stakeholders regarding energy use and reducing GHG emissions. In that wider context, the reduction target for energy-related GHG emissions will likely be adjusted higher or lower depending on the opportunities and constraints represented by the other sectors. The comprehensive CAP is likely to include additional energy-related measures, as necessary, to enable community-wide GHG reductions that are consistent with the goals of AB 32 and SB 375.
1 Planning for Energy Needs and Climate Change American Canyon Energy Efficiency Climate Action Plan 1-1
1. Planning for Energy Needs and Climate Change
The City of American Canyon recognizes the importance of planning for future energy needs and reducing dependence on energy sources that contribute to climate change. The effects of climate change on the City’s landscape and on its citizens could be significant. In the long run, being located adjacent to the Napa River and in close proximity to the San Pablo Bay may leave the City vulnerable to sea level rise. Water supply reliability, a current challenge for the City, may worsen if drinking water supplies diminish as a result of a decrease in the Sierra Mountain snowpack. Moreover, the City recognizes that as demand for energy rises, its cost may also rise, with economic impacts on the City’s residents and local businesses.
The City has long recognized the role that local governments must play in reducing greenhouse gas (GHG) emissions to combat climate change, consistent with the goals of the California Global Warming Act of 2006 (AB 32). The City has incorporated energy efficiency, renewable energy, and water conservation-related goals and policies into its General Plan and other planning documents, and has worked with Pacific Gas and Electric Company (PG&E) to disseminate energy efficiency information and technical information assistance throughout the community. However, the City is ready to commit its fair share to combat climate change and develop a coordinated approach to energy efficiency and GHG reductions within the community and the local (municipal) government. This Energy Efficiency Climate Action Plan (EECAP) serves as the first step in that process.
American Canyon General Plan Goal 8F
Reduce consumption of
nonrenewable energy
sources and support the
development and
utilization of new energy
sources.
1-2 American Canyon Energy Efficiency Climate Action Plan 1 Planning for Energy Needs and Climate Change
1.1 EECAP Purpose, Goal, and Benefits
This EECAP will enable the City to lead the community with innovative programs for energy efficiency, sustainability, and climate change. The plan was designed to support General Plan Goal 8F:
Reduce consumption of nonrenewable energy sources and support the development and utilization of new energy sources.
To this end, the plan proposes feasible strategies and measures that cost-effectively reduce energy use and energy-related GHG emissions in both municipal operations and across the community. However, the benefits of enacting these measures go well beyond energy and GHG reduction: successful implementation will result in myriad co- benefits to members of the community, such as:
Reduced utility bills
Reduced maintenance costs
Reduced water usage
Increased indoor comfort in homes and buildings
Increased home and building values
Improved air quality
More beautiful neighborhoods
Conservation of natural resources
Support for local jobs
Increased educational opportunities and training
Ultimately, the EECAP represents the first step in the City’s broader climate change planning efforts. Addressing energy consumption and associated GHG emissions, the plan provides the foundation for a comprehensive Climate Action Plan that will cover all sources of GHG emissions in the community, including waste and transportation, and will provide community measures to combat broader climate change issues such as water reliability and sea level rise. The City’s future Climate Action Plan will be consistent with the Bay Area Air Quality Management District’s (BAAQMD) California Environmental Quality Act (CEQA) Guidelines, to allow for streamlined CEQA review of future projects in the City.
1.2 EECAP Development The City’s approach to developing the EECAP emphasizes long-term strategic investment of time and resources, maximizing economic returns, and feasibility of implementation. Strategies and measures to support Goal 8F were developed with meaningful input from the community, and were specifically tailored to local needs and concerns. Importantly, the EECAP builds on the City’s current energy and building policies and programs, and other programs with the intent of also leveraging outside programs and resources to improve energy efficiency and conservation.
The City developed EECAP by following these steps:
1. Establish 2005 baseline, 2010 update, and 2020 future projections of energy consumption and associated GHG emissions.
The EECAP includes community-wide and municipal (i.e., local government) energy baselines that quantify electricity and natural gas consumption in 2005, and an inventory of GHG emissions from all sectors in the community, not just electricity. The year 2005 was chosen as the baseline based on guidance from the California Statewide Energy Efficiency Collaborative (SEEC), and is consistent with most local government climate
1 Planning for Energy Needs and Climate Change American Canyon Energy Efficiency Climate Action Plan 1-3
action plans in California. The EECAP also summarizes energy consumption and GHG emissions information for 2010, to include more recent data and show trends from the 2005 baseline. The EECAP presents forecasts of anticipated GHG emissions for years 2020 and 2035 under a business-as-usual (BAU) scenario that takes into consideration current consumption patterns, population projections from the City of American Canyon Urban Water Management Plan, and job projections published by the Association of Bay Area Governments (ABAG).
2. Develop energy reduction and renewable energy strategies and measures.
The City reviewed the baseline data, GHG BAU projections, existing community and municipal programs and policies pertaining to energy efficiency, stakeholder feedback, and other available information to develop a set of energy strategies designed to decrease energy use and energy-related GHG emissions and increase renewable energy generation.
3. Develop GHG reduction target.
The City established reduction targets for energy-related GHG emissions, for both the community and for municipal operations. The targets are based on the 2005 energy and GHG baselines, future BAU projections, state regulatory requirements, and anticipated GHG reductions from EECAP measures.
4. Identify implementation steps.
The City prioritized EECAP measures based on a cost-benefit analysis and feedback received from public outreach efforts. The EECAP outlines measures as high, medium, and low priority for implementation, and identifies the City departments responsible for implementation.
5. Conduct outreach and stakeholder engagement.
The EECAP process included several outreach and stakeholder engagement events, to obtain feedback on proposed energy strategies and measures, and to communicate the benefits of and opportunities for energy efficiency. Two community workshops were conducted in American Canyon, one in September of 2012 and one in October of 2012 concurrent with a Planning Commission Meeting. In addition, City consultants attended three community meetings to present information about the EECAP and solicit public feedback: the Chamber of Commerce Government Affairs Committee in October, 2012, the Kiwanis in November 2012, and the American Canyon Mom’s Club in November of 2012. Appendix A provides the Public Engagement Plan for coordinating public outreach regarding the EECAP. Appendix B provides a summary of results and input from public engagement.
1.3 Regulatory Environment The EECAP is consistent with local planning priorities, which are provided in Appendix C as a summary of General Plan Goals and Policies and Municipal Codes pertaining to energy efficiency, renewable energy, and water conservation.
On a larger scale, the EECAP provides a clear road map for reducing GHG emissions and achieving reduction targets that are consistent with State of California goals and measures regarding climate change, including AB 32 and SB 375. The following section provides a summary of the key statewide legislation and state guidance to directly address the risk of climate change by reducing GHG emissions.

1-4 American Canyon Energy Efficiency Climate Action Plan 1 Planning for Energy Needs and Climate Change
State of California Executive Order S-3-05
In June 2005, the Governor of California signed Executive Order S-3-05, which identified the California Environmental Protection Agency (CalEPA) as the lead coordinating state agency for establishing climate change emission reduction targets in California. A “Climate Action Team,” a multi-agency group of state agencies, was set up to implement Executive Order S-3-05. The Governor’s Executive Order established aggressive emissions reductions goals: by 2010, GHG must be reduced to 2000 levels; by 2020, GHG emissions must be reduced to 1990 levels; and by 2050, GHG must be reduced to 80 percent below 1990 levels. GHG emission reduction strategies and measures to reduce global warming were identified by the California Climate Action Team in 2006.
Assembly Bill 32, the California Global Warming Solutions Act of 2006
In September 2006, the California Legislature passed Assembly Bill (AB) 32, which set the goal of reducing GHG emissions to 1990 levels by 2020. AB 32 finds and declares that “global warming poses a serious threat to economic well-being, public health, natural resources and the environment of California.” The legislation granted authority to the California Air Resources Board (CARB) to establish multiple mechanisms (regulatory, reporting, voluntary and market) to achieve quantifiable reductions in GHG emissions to meet the statewide goal.
The Climate Change Scoping Plan, adopted in 2008, outlines the State’s plan to achieve the GHG reductions required in AB 32. The actions include direct regulations, alternative compliance mechanisms, incentives, voluntary actions, and other mechanisms. The Scoping Plan identifies local governments as “essential partners” in achieving California’s goals to reduce GHG emissions, encouraging the adoption of reduction targets for community and municipal operations emissions that are consistent with the State’s commitment (identified as equivalent to 15 percent below “current” levels). CARB recommended a GHG reduction goal for local governments of 15 percent below today’s levels by 2020 to ensure that municipal and community-wide emissions match the State’s reduction target.
Senate Bill 375 (SB 375)
In 2008, SB 375 was enacted to address indirect GHG emissions caused by urban sprawl. SB 375 develops emissions-reduction goals that regions can apply to planning activities. SB 375 provides incentives for local governments and developers to create new walkable and sustainable communities, revitalize existing communities, and implement conscientiously planned growth patterns that concentrate new development around public transportation nodes. CARB has been working with the state’s metropolitan planning organizations (MPOs) to align their regional transportation, housing, and land use plans to reduce vehicle miles traveled. SB 375 enhances CARB’s ability to reach the goals of AB 32 by directing the agency to develop regional GHG emission reduction targets to be achieved from the land use and transportation sector for 2020 and 2035.
The emissions reduction target for the ABAG region, which includes the City of American Canyon, is 7 percent for 2020 and 15 percent for 2035, relative to 2005 levels. In contrast to the AB 32 targets, the SB 375 targets are per capita emissions reduction targets for GHG emissions from automobiles and light trucks.

1 Planning for Energy Needs and Climate Change American Canyon Energy Efficiency Climate Action Plan 1-5
Senate Bill 97, Amendments to California Environmental Quality Act
CEQA requires public agencies to review the environmental impacts of proposed projects, including General Plans, Specific Plans and specific kinds of development projects. Recognizing that AB 32 did not discuss how GHGs should be addressed in documents prepared under CEQA, the legislature enacted SB 97 to require the Governor’s Office of Planning and Research (OPR) to develop and adopt CEQA guidelines for the mitigation of emissions. The draft guidelines were formalized on March 18, 2010, and all CEQA documents prepared after this date are required to comply with the OPR-approved amendments to the CEQA Guidelines.
OPR Guidance for California Environmental Quality Act
OPR provides guidance for agency compliance with CEQA, which requires that lead agencies analyze and document the environmental impacts of proposed projects. OPR has developed guidance on the analysis and mitigation of GHG emissions in CEQA documents. This guidance states that lead agencies should develop their own approach to performing climate change analysis for projects that generate GHG emissions, and that compliance with CEQA can be achieved by identification and quantification of GHG emissions, assessment of significance of the impact on clime change, and identification of mitigation measures and/or alternatives if the impact is found to be significant.
OPR developed, and the California Resources Agency has adopted, amendments to the CEQA Guidelines to incorporating this guidance. CEQA Guidelines Section 15183.5(b) states that a lead agency may choose to analyze and mitigate significant greenhouse gas emissions in a plan for the reduction of GHGs or similar document, and that such a plan may be used in a cumulative impacts analysis of a project. A lead agency may determine that an individual project’s incremental contribution to a cumulative effect on climate change is not cumulatively considerable if the project complies with the requirement of the previously adopted plan to reduce GHGs. This plan should:
1. Quantify GHG emissions, both existing and projected over a specified time period, resulting from activities within a defined geographic area;
2. Establish a level, based on substantial evidence, below which the contribution to GHG emissions from activities covered by the plan would not be cumulatively considerable;
3. Identify and analyze the GHG emissions resulting from specific actions or categories of actions anticipated within the geographic area;
4. Specify measures or a group of measures, including performance standards, that substantial evidence demonstrates, if implemented on a project-by-project basis, would collectively achieve the specified emissions level;
5. Establish a mechanism to monitor the plan’s progress toward achieving the level and to require amendment if the plan is not achieving specified levels; and
6. Be adopted in a public process following environmental review.
The City of American Canyon EECAP fulfills steps (1) through (5) related to energy, encompassing electricity and natural gas consumption in the community and municipal operations. In the future, the City will incorporate GHG emissions reduction strategies associated with transportation, solid waste, and direct industrial GHG emissions into a climate action plan. In developing the American Canyon Climate Action Plan, the City will fulfill OPR steps (1) through (6) for the full spectrum of community GHG emissions.
2 Energy and GHG Baseline, Forecast, and Target American Canyon Energy Efficiency Climate Action Plan 2-1
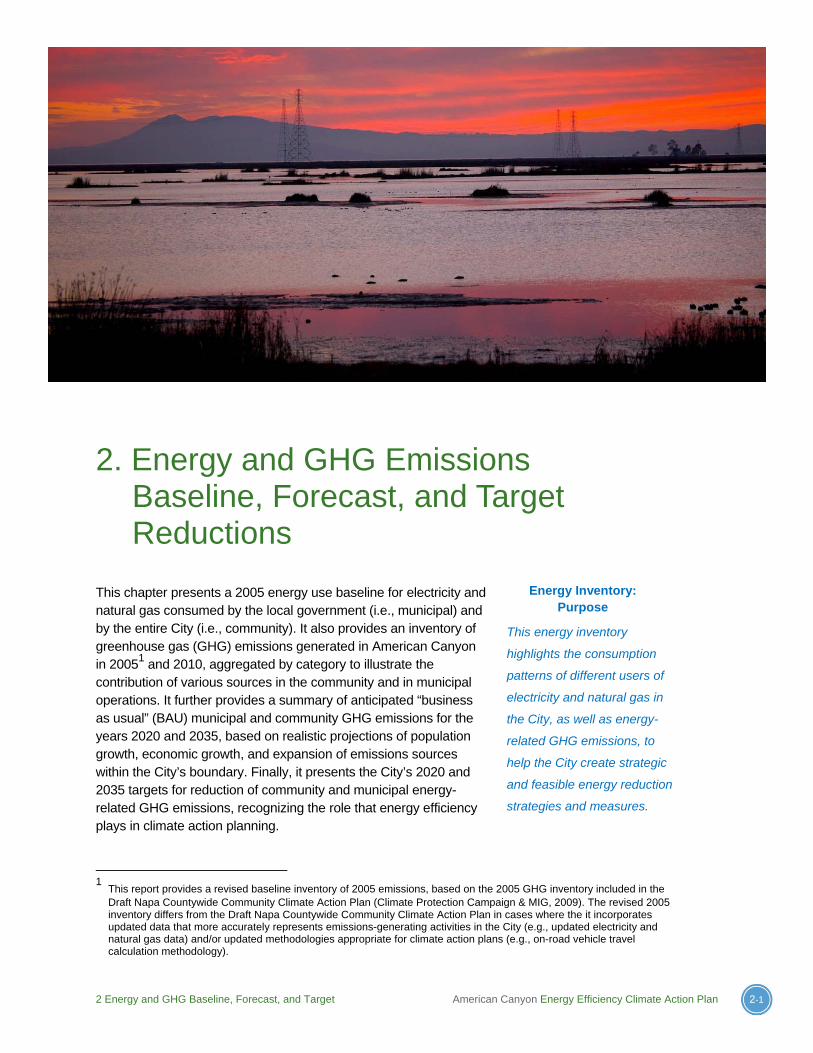
2. Energy and GHG Emissions Baseline, Forecast, and Target Reductions
This chapter presents a 2005 energy use baseline for electricity and natural gas consumed by the local government (i.e., municipal) and by the entire City (i.e., community). It also provides an inventory of greenhouse gas (GHG) emissions generated in American Canyon in 20051 and 2010, aggregated by category to illustrate the contribution of various sources in the community and in municipal operations. It further provides a summary of anticipated “business as usual” (BAU) municipal and community GHG emissions for the years 2020 and 2035, based on realistic projections of population growth, economic growth, and expansion of emissions sources within the City’s boundary. Finally, it presents the City’s 2020 and 2035 targets for reduction of community and municipal energy-related GHG emissions, recognizing the role that energy efficiency plays in climate action planning.
1
This report provides a revised baseline inventory of 2005 emissions, based on the 2005 GHG inventory included in the Draft Napa Countywide Community Climate Action Plan (Climate Protection Campaign & MIG, 2009). The revised 2005 inventory differs from the Draft Napa Countywide Community Climate Action Plan in cases where the it incorporates updated data that more accurately represents emissions-generating activities in the City (e.g., updated electricity and natural gas data) and/or updated methodologies appropriate for climate action plans (e.g., on-road vehicle travel calculation methodology).
Energy Inventory: Purpose
This energy inventory
highlights the consumption
patterns of different users of
electricity and natural gas in
the City, as well as energy-
related GHG emissions, to
help the City create strategic
and feasible energy reduction
strategies and measures.

2-2 American Canyon Energy Efficiency Climate Action Plan 2 Energy and GHG Baseline, Forecast, and Target
For a comprehensive description of the boundaries of analysis and the methodology and assumptions used to develop American Canyon’s energy and GHG inventories, see Appendix D.
2.1 Community-wide Energy Usage and GHG Emissions
American Canyon’s community-wide energy and GHG emissions inventories encompass the energy consumption and GHG emissions resulting from activities taking place within the City limits, where the local government has jurisdictional authority. Although the City government has limited control over many of the energy consumption and emissions-producing activities of its residents and businesses, the City limits is appropriate for a community-wide inventory because it represents energy use and GHG emissions for the entire City, not just those of the local government.
2.1.1 Community Energy Use
Table 2-1 provides 2005 and 2010 community-wide energy use aggregated by Residential and Non-Residential sectors. The Non-Residential Sector includes commercial, industrial, municipal, and all other non-residential consumers of energy.
Table 2-1: 2005 Baseline and 2010 Updated Community Energy Use by Sector (MT CO2e)
Emission Sector
2005 Electricity
(kWh)
2010 Electricity
(kWh)
% Increase in
Electricity
2005 Natural Gas
(therms)
2010 Natural Gas
(therms)
% Increase in
Electricity
Residential 33,089,639 38,523,051 16% 2,334,933 2,769,981 19%
Non-Residential 40,273,744 64,084,298 59% 3,827,445 4,609,425 20%
Total 73,363,383 102,607,349 40% 6,162,378 7,379,406 20%
Source: PG&E, 2012a
As shown in Table 2-1, the Non-Residential sector has historically used more electricity and natural gas than the Residential sector, using 55 percent and 62 percent of total community-wide electricity and natural gas, respectively, in 2005, and 62 percent of electricity and natural gas in 2010. For both sectors, the City experienced growth in energy consumption between 2005 and 2010, with a 40 percent increase in total electricity use and a 20 percent increase in total natural gas use during that time.
2.1.2 Community GHG Emissions
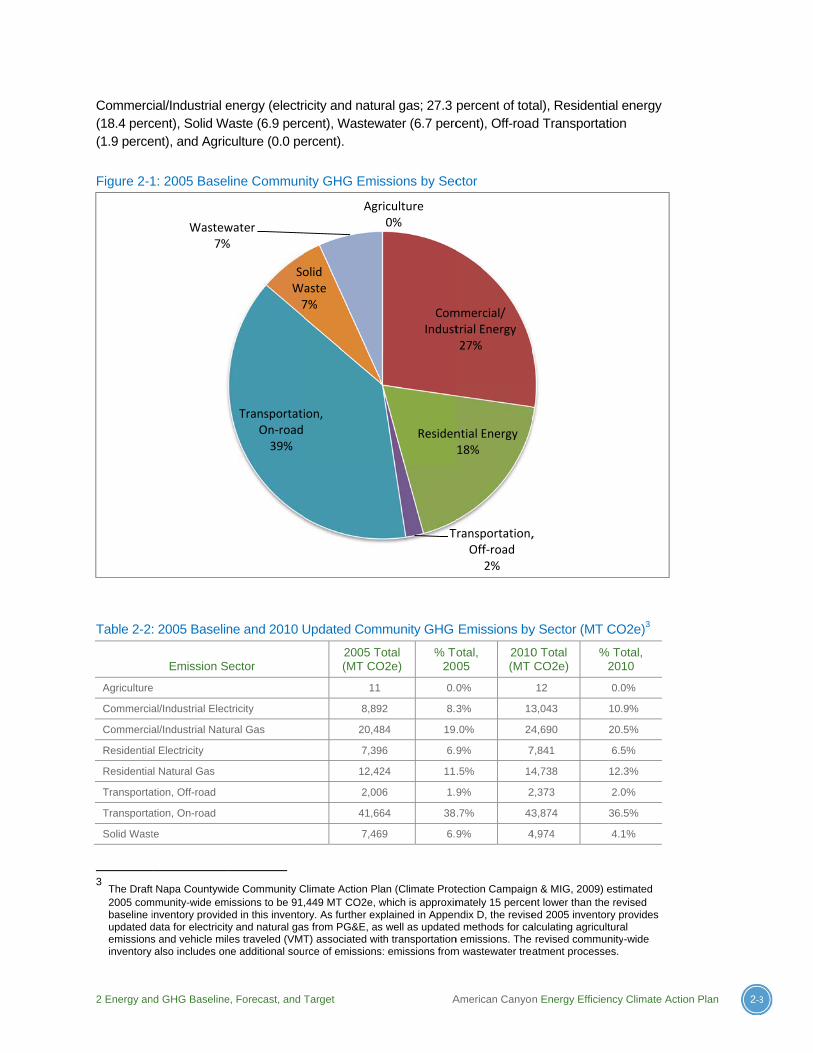
For community-wide GHG emissions, this inventory provides emissions from the following sectors for 2005 and 2010: Commercial/Industrial energy (electricity and natural gas), Residential energy (electricity and natural gas), On-road Transportation, Off-road Transportation, Solid Waste, Agriculture, and Wastewater.
The baseline 2005 GHG Inventory for the community of American Canyon totals 107,608 metric tons (MT) of carbon dioxide equivalent (CO2e)2. Figure 2-1 and Table 2-2 show total GHG emissions by sector. In 2005, On-road Transportation accounted for of the largest portion of overall community-wide emissions, at 38.7 percent. Contributions from other sectors include:
2 Carbon dioxide equivalent (CO2e) includes carbon dioxide, methane and/or nitrous oxide.
2 Energy an
Commerc(18.4 perc(1.9 perce
Figure 2-1
Table 2-2
Agriculture
Commercia
Commercia
Residentia
Residentia
Transporta
Transporta
Solid Wast
3 The Draft
2005 combaseline iupdated demissionsinventory
nd GHG Baseline
cial/Industrial ecent), Solid Went), and Agric
1: 2005 Base
: 2005 Baselin
Emission S
e
al/Industrial Elec
al/Industrial Natu
al Electricity
al Natural Gas
ation, Off-road
ation, On-road
te
t Napa Countywidmmunity-wide eminventory providedata for electricitys and vehicle milalso includes on
Wastew7%
e, Forecast, and T
energy (electrWaste (6.9 perc
culture (0.0 pe
line Commun
ne and 2010 U
ector
ctricity
ural Gas
de Community Cmissions to be 91,ed in this inventoy and natural gases traveled (VMT
ne additional sou
TransportatiOn‐road39%
SoW7
water%
Target
ricity and natucent), Wastewercent).
nity GHG Emis
Updated Com
2005 T(MT CO
11
8,89
20,48
7,39
12,42
2,00
41,66
7,46
Climate Action Pl,449 MT CO2e, w
ory. As further exs from PG&E, asT) associated witrce of emissions
Agr
ion,
olid aste7%
A
ral gas; 27.3 water (6.7 perc
ssions by Sec
mmunity GHG
Total O2e)
% To20
0.0
92 8.3
84 19
96 6.9
24 11
06 1.9
64 38
69 6.9
an (Climate Protwhich is approxim
xplained in Appens well as updatedth transportation
s: emissions from
riculture0%
ComIndust
Residen
T
American Canyon
percent of totcent), Off-road
ctor
Emissions by
otal, 05
2010(MT
0%
3% 13
.0% 24
9% 7
.5% 14
9% 2
.7% 43
9% 4
tection Campaignmately 15 percenndix D, the revised methods for ca
n emissions. The m wastewater trea
mmercial/ trial Energy27%
ntial Energy18%
Transportation,Off‐road
2%
n Energy Efficien
tal), Residentid Transportat
y Sector (MT C
0 Total CO2e)
%2
12
3,043
4,690
7,841
4,738
2,373
3,874
4,974
n & MIG, 2009) ent lower than theed 2005 inventor
alculating agricultrevised commun
atment processe
,
ncy Climate Actio
al energy tion
CO2e)3
% Total, 2010
0.0%
10.9%
20.5%
6.5%
12.3%
2.0%
36.5%
4.1%
estimated e revised ry provides tural nity-wide es.
on Plan 2-33

2-4 American Ca
W
T
So
A12thot(1(2anin
F
2EanusalCA
anyon Energy Ef
Wastewater
Total
ources: PG&E, 2
As shown in Ta2 percent to 1
he largest souther sectors in19 percent), S2 percent), annd natural ga
n 2010.
igure 2-2 sho
Figure 2
2.2 Municmissions fromnd GHG invese and GHG ll energy-cons
City governmeAppendix D.
0
10000
20000
30000
40000
50000
60000
70000
80000
90000
100000
fficiency Climate
2012a; Climate P
able 2-2, betw120,201 MT Curce of emissinclude: Comm
Solid Waste (4nd Agricultures) make up 4
ows increases
2-2: 2005 and
cipal Enem American Cntories preseemissions frosuming activitnt operations
Action Plan
Protection Campa
ween 2005 anCO2e. In 2010ions, comprismercial/Indus4 percent), W (0 percent).
46 percent of t
s in GHG emis
d 2010 Comm
ergy UsaCanyon municnted in Sectio
om municipal ies under the categories in
7,263
107,608
aign & MIG, 2009
nd 2010 comm0, emissions fing over 36 ptrial energy (3
Wastewater (7Emissions frototal emission
ssions by sec
munity GHG E
age and cipal operationon 2.1. This soperations. Tdirect controlcluded in the
2 Energy an
6.7%
100%
9; Calrecycle 201
munity-wide efrom On-road
percent of tota31 percent), Rpercent), Off
om energy-rens in 2005, an
ctor between
missions by S
GHG Emns are include
section providThe municipal l of the City. Fmunicipal ene
nd GHG Baseline
8,656
120,201
10; ABAG, 2009
emissions rosd Transportatal emissions. Residential enf-road Transplated sourcesnd 50 percent
2005 and 20
Sector (MT C
missionsed in the com
des added det energy use in
For a completeergy and GHG
e, Forecast, and
7.2%
100%
; ICF, 2011
se by over ion continue tContributionsnergy
portation s (i.e., electrict of total emis
10.
CO2e)
mmunity energtail on the enenventory inclue description oG inventories,
200201200
Target
to be s from
city ssions
gy ergy udes of see
505

2 Energy and GHG Baseline, Forecast, and Target American Canyon Energy Efficiency Climate Action Plan 2-5
2.2.1 Municipal Energy Use
Table 2-3 provides 2005 and 2010 municipal energy use aggregated by three categories: Buildings and Facilities, Streetlights, and Water Supply. All three categories saw substantial increases in energy use between 2005 and 2010, for both electricity and natural gas use.
Table 2-3: 2005 and 2010 Municipal Energy Use by Category (MT CO2e)
Emission Sector
2005 Electricity
(kWh)
2010 Electricity
(kWh) %
Increase
2005 Natural Gas
(therms)
2010 Natural Gas
(therms) %
Change
Buildings and Facilities 297,768 597,963 101% 643 9,316 1,349%
Streetlights 224,030 448,358 100% 0 0 N/A
Water Supply 3,266,943 6,461,419 98% 0 0 N/A
TOTAL 3,788,741 7,507,740 98% 643 9,316 1,349%
Source: PG&E, 2012b
As shown in Table 2-3, in all three categories electricity use approximately doubled between 2005 and 2010, resulting in an increase in total municipal electricity use of 98 percent. The Water Supply category constituted the majority of electricity use in both 2005 and 2010, using over 86 percent of total municipal electricity in both years.
Table 2-4 shows the ten municipal service accounts with the highest electricity consumption in 2010. These ten locations used approximately 53 percent of total municipal electricity in 2010.
Table 2-4: Ten Highest Municipal Consumers of Electricity in 2010
Premise Type Business Activity4 Service Address 2010 kWh (electricity)
Commercial or industrial Wastewater Plant 151 Mezzetta Ct 2,889,000
Commercial or industrial Water Treatment Plant 250 Kirkland Ranch Rd 413,760
Commercial or industrial Wastewater Treatment Plant W/O Rancho del Mar-sub 196,320
Commercial or industrial Police/Fire Department 911 Donaldson Way East 143,520
Commercial or industrial ND 396 Wetlands Edge Rd 80,350
Commercial or industrial City Hall 4381 Broadway Ste 107 74,636
Streetlight site Civic Center Complex 300 Crawford Way 58,550
Commercial or Industrial City Hall 4381 Broadway St 55,826
Streetlight site ND 3423 Broadway St Ste D6 51,631
Streetlight site Civic Center Complex 300 Crawford way 47,152
TOTAL 4,010,745
ND: No data Source: PG&E, 2012b
As shown in Table 2-3, the only municipal category that uses natural gas is Buildings and Facilities. Between 2005 and 2010 natural gas use increased more than ten-fold, from
4 Business activities described here are updated from the original PG&E data to reflect more specific information.
2-6 American Canyon Energy Efficiency Climate Action Plan 2 Energy and GHG Baseline, Forecast, and Target
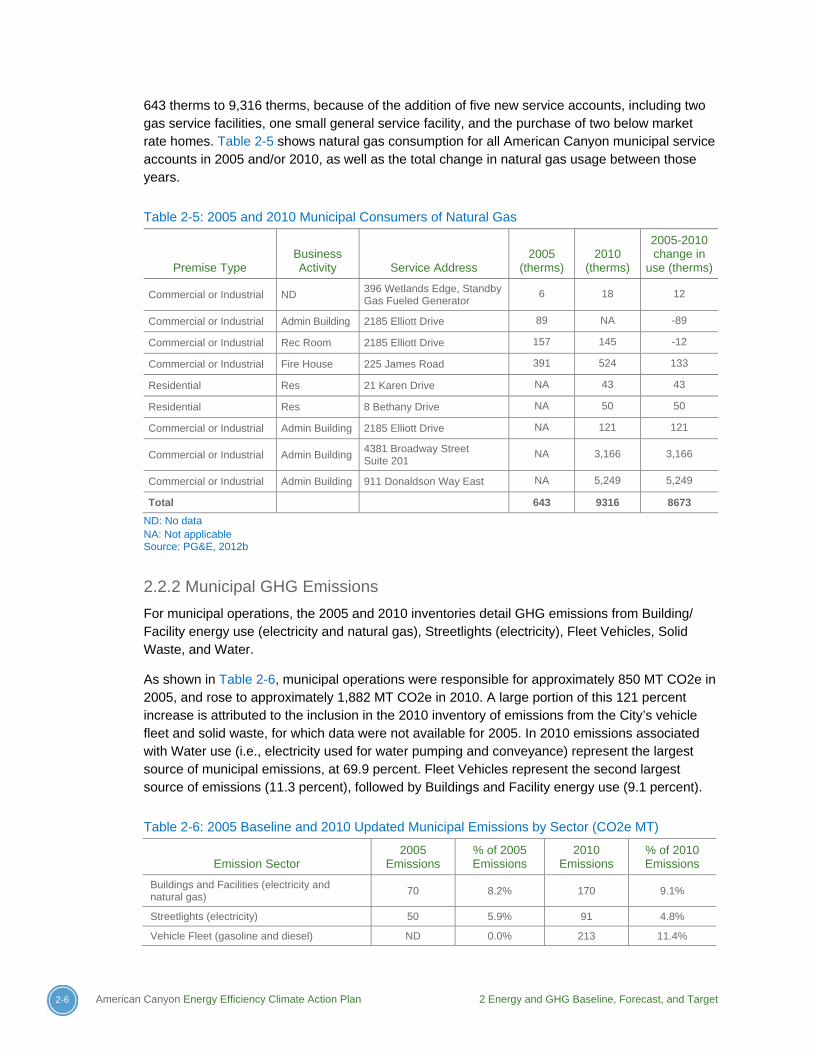
643 therms to 9,316 therms, because of the addition of five new service accounts, including two gas service facilities, one small general service facility, and the purchase of two below market rate homes. Table 2-5 shows natural gas consumption for all American Canyon municipal service accounts in 2005 and/or 2010, as well as the total change in natural gas usage between those years.
Table 2-5: 2005 and 2010 Municipal Consumers of Natural Gas
Premise Type Business Activity Service Address
2005 (therms)
2010 (therms)
2005-2010 change in
use (therms)
Commercial or Industrial ND 396 Wetlands Edge, Standby Gas Fueled Generator
6 18 12
Commercial or Industrial Admin Building 2185 Elliott Drive 89 NA -89
Commercial or Industrial Rec Room 2185 Elliott Drive 157 145 -12
Commercial or Industrial Fire House 225 James Road 391 524 133
Residential Res 21 Karen Drive NA 43 43
Residential Res 8 Bethany Drive NA 50 50
Commercial or Industrial Admin Building 2185 Elliott Drive NA 121 121
Commercial or Industrial Admin Building 4381 Broadway Street Suite 201
NA 3,166 3,166
Commercial or Industrial Admin Building 911 Donaldson Way East NA 5,249 5,249
Total 643 9316 8673
ND: No data NA: Not applicable Source: PG&E, 2012b
2.2.2 Municipal GHG Emissions
For municipal operations, the 2005 and 2010 inventories detail GHG emissions from Building/ Facility energy use (electricity and natural gas), Streetlights (electricity), Fleet Vehicles, Solid Waste, and Water.
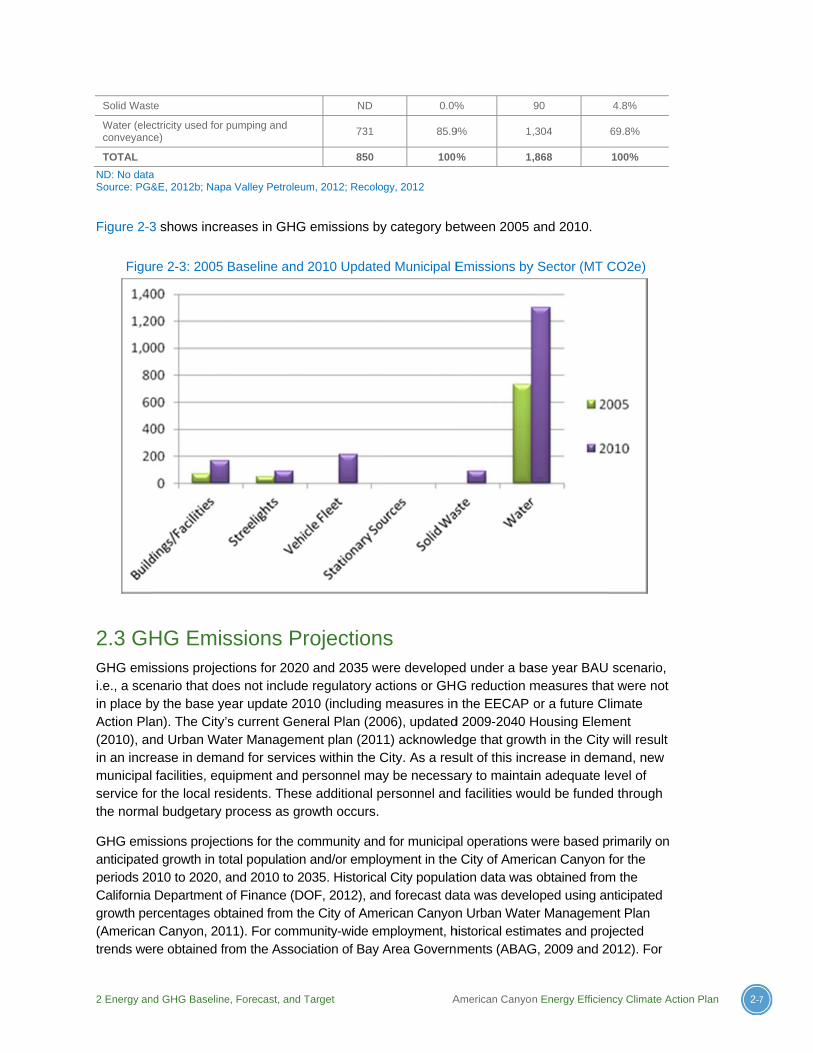
As shown in Table 2-6, municipal operations were responsible for approximately 850 MT CO2e in 2005, and rose to approximately 1,882 MT CO2e in 2010. A large portion of this 121 percent increase is attributed to the inclusion in the 2010 inventory of emissions from the City’s vehicle fleet and solid waste, for which data were not available for 2005. In 2010 emissions associated with Water use (i.e., electricity used for water pumping and conveyance) represent the largest source of municipal emissions, at 69.9 percent. Fleet Vehicles represent the second largest source of emissions (11.3 percent), followed by Buildings and Facility energy use (9.1 percent).
Table 2-6: 2005 Baseline and 2010 Updated Municipal Emissions by Sector (CO2e MT)
Emission Sector 2005
Emissions % of 2005 Emissions
2010 Emissions
% of 2010 Emissions
Buildings and Facilities (electricity and natural gas)
70 8.2% 170 9.1%
Streetlights (electricity) 50 5.9% 91 4.8%
Vehicle Fleet (gasoline and diesel) ND 0.0% 213 11.4%
2 Energy an
Solid Wast
Water (elecconveyanc
TOTAL
ND: No dataSource: PG&
Figure 2-3
Figu
2.3 GHGHG emisi.e., a scein place bAction Pla(2010), anin an incremunicipalservice fothe norma
GHG emisanticipatedperiods 20California growth pe(Americantrends we
nd GHG Baseline
te
ctricity used for pce)
a &E, 2012b; Napa
3 shows incre
re 2-3: 2005 B
HG Emisssions projec
enario that doeby the base yean). The City’snd Urban Watease in demafacilities, equ
or the local resal budgetary p
ssions projectd growth in to010 to 2020, aDepartment o
ercentages obn Canyon, 201re obtained fr
e, Forecast, and T
pumping and
a Valley Petroleu
eases in GHG
Baseline and
ssions Prctions for 2020es not includeear update 20s current Genter Managem
and for serviceuipment and psidents. Thesprocess as gr
tions for the cootal populationand 2010 to 2of Finance (Dtained from th11). For commrom the Assoc
Target
ND
731
850
um, 2012; Recolo
G emissions b
2010 Update
rojection0 and 2035 we regulatory a010 (includingneral Plan (20
ment plan (201es within the Cpersonnel mae additional p
rowth occurs.
ommunity andn and/or emplo035. HistoricaOF, 2012), anhe City of Amemunity-wide emciation of Bay
A
0.0%
85.9
100
ogy, 2012
y category be
ed Municipal E
ns were developeactions or GHg measures in006), updated11) acknowledCity. As a res
ay be necessapersonnel and
d for municipaoyment in theal City populatnd forecast daerican Canyonmployment, hArea Govern
American Canyon
%
9% 1,
% 1,
etween 2005
Emissions by
ed under a baG reduction m
n the EECAP d 2009-2040 Hdge that growsult of this incary to maintaid facilities wo
al operations we City of Amertion data wasata was develon Urban Wate
historical estimments (ABAG
n Energy Efficien
90
,304
,868
and 2010.
y Sector (MT C
ase year BAUmeasures thaor a future ClHousing Elem
wth in the Citycrease in demin adequate le
ould be funded
were based prican Canyon obtained fromoped using aner Managememates and proG, 2009 and 2
ncy Climate Actio
4.8%
69.8%
100%
CO2e)
scenario, at were not limate
ment y will result mand, new
evel of d through
primarily on for the
m the nticipated
ent Plan ojected 2012). For
on Plan 2-77
2-8 American Canyon Energy Efficiency Climate Action Plan 2 Energy and GHG Baseline, Forecast, and Target
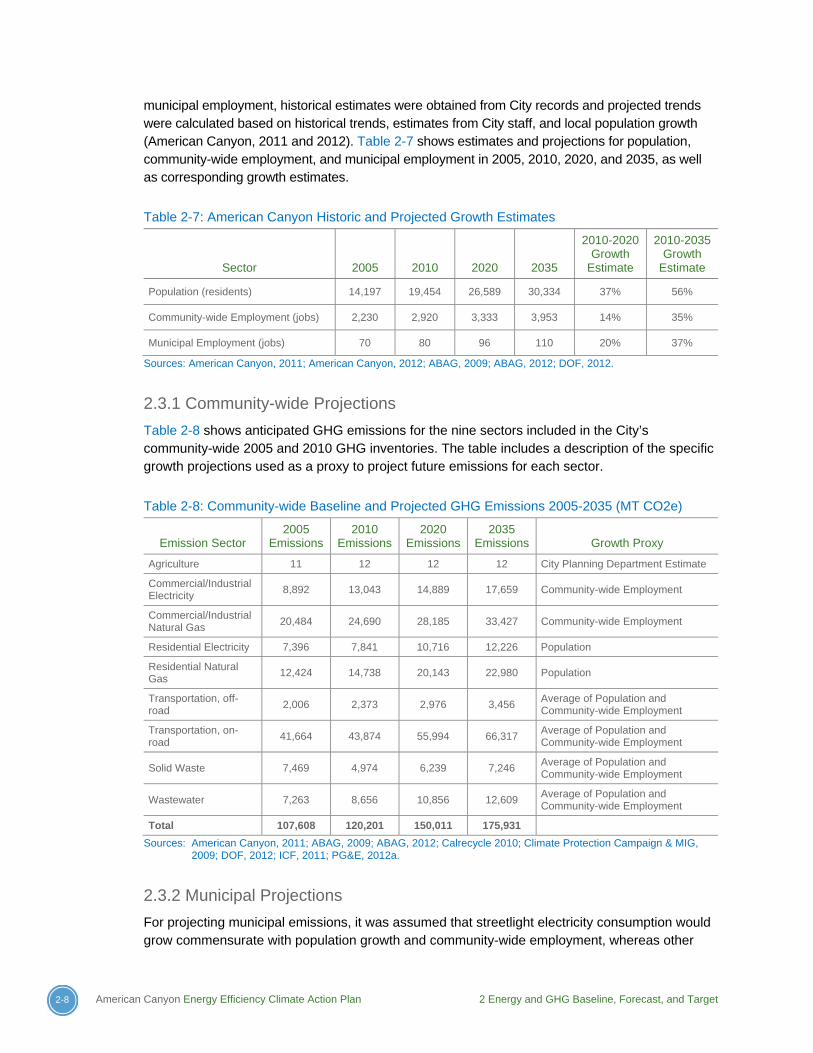
municipal employment, historical estimates were obtained from City records and projected trends were calculated based on historical trends, estimates from City staff, and local population growth (American Canyon, 2011 and 2012). Table 2-7 shows estimates and projections for population, community-wide employment, and municipal employment in 2005, 2010, 2020, and 2035, as well as corresponding growth estimates.
Table 2-7: American Canyon Historic and Projected Growth Estimates
Sector 2005 2010 2020 2035
2010-2020 Growth
Estimate
2010-2035 Growth
Estimate
Population (residents) 14,197 19,454 26,589 30,334 37% 56%
Community-wide Employment (jobs) 2,230 2,920 3,333 3,953 14% 35%
Municipal Employment (jobs) 70 80 96 110 20% 37%
Sources: American Canyon, 2011; American Canyon, 2012; ABAG, 2009; ABAG, 2012; DOF, 2012.
2.3.1 Community-wide Projections
Table 2-8 shows anticipated GHG emissions for the nine sectors included in the City’s community-wide 2005 and 2010 GHG inventories. The table includes a description of the specific growth projections used as a proxy to project future emissions for each sector.
Table 2-8: Community-wide Baseline and Projected GHG Emissions 2005-2035 (MT CO2e)
Emission Sector 2005
Emissions 2010
Emissions 2020
Emissions 2035
Emissions Growth Proxy
Agriculture 11 12 12 12 City Planning Department Estimate
Commercial/Industrial Electricity
8,892 13,043 14,889 17,659 Community-wide Employment
Commercial/Industrial Natural Gas
20,484 24,690 28,185 33,427 Community-wide Employment
Residential Electricity 7,396 7,841 10,716 12,226 Population
Residential Natural Gas
12,424 14,738 20,143 22,980 Population
Transportation, off-road
2,006 2,373 2,976 3,456 Average of Population and Community-wide Employment
Transportation, on-road
41,664 43,874 55,994 66,317 Average of Population and Community-wide Employment
Solid Waste 7,469 4,974 6,239 7,246 Average of Population and Community-wide Employment
Wastewater 7,263 8,656 10,856 12,609 Average of Population and Community-wide Employment
Total 107,608 120,201 150,011 175,931
Sources: American Canyon, 2011; ABAG, 2009; ABAG, 2012; Calrecycle 2010; Climate Protection Campaign & MIG, 2009; DOF, 2012; ICF, 2011; PG&E, 2012a.
2.3.2 Municipal Projections
For projecting municipal emissions, it was assumed that streetlight electricity consumption would grow commensurate with population growth and community-wide employment, whereas other
2 Energy and GHG Baseline, Forecast, and Target American Canyon Energy Efficiency Climate Action Plan 2-9
municipal departments, facilities, and services would grow in proportion to municipal employment trends. Municipal employment is anticipated to grow at a slightly slower rate than the City population over the next 25 years. According to City records, municipal employment saw a steady increase between 2002 and 2008, reaching a high in 2008 and 2009 of 81 employees. However, between 2009 and 2011, municipal staff shrank to 75.5 employees. The projections in this report assume that by 2015, municipal employment will return to 2009 levels of 81 employees, and will grow proportionate to population from 2015 through 2035.
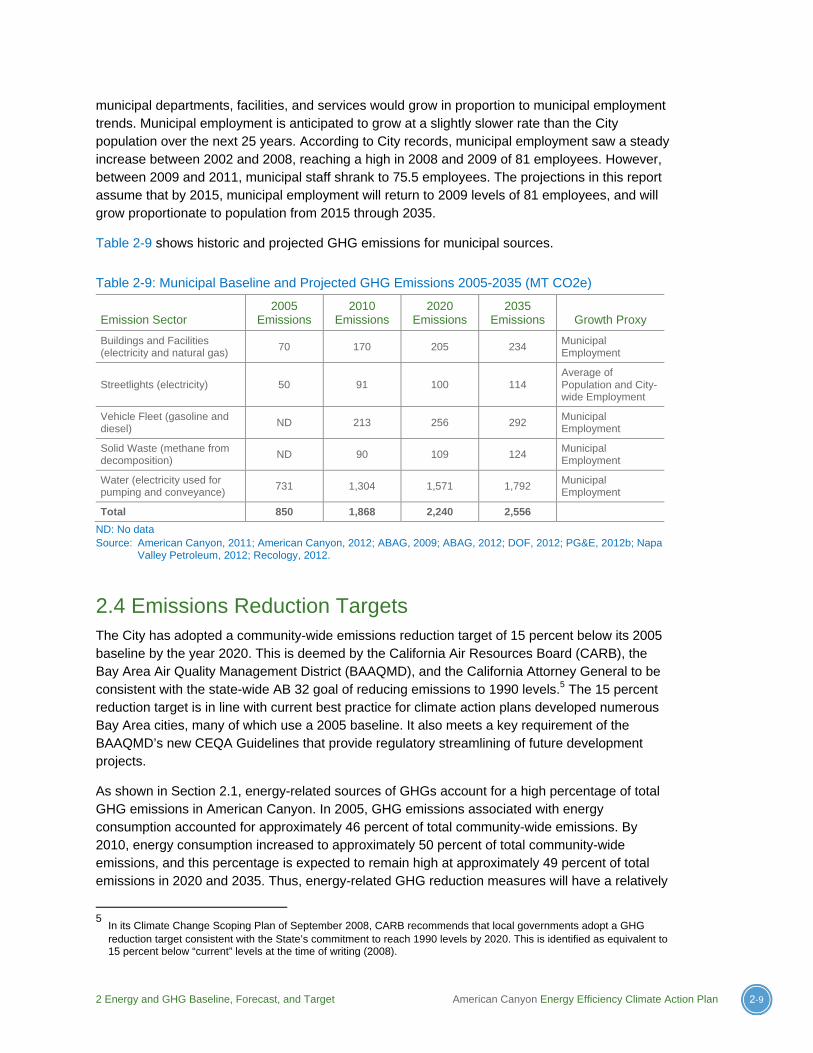
Table 2-9 shows historic and projected GHG emissions for municipal sources.
Table 2-9: Municipal Baseline and Projected GHG Emissions 2005-2035 (MT CO2e)
Emission Sector 2005
Emissions 2010
Emissions 2020
Emissions 2035
Emissions Growth Proxy
Buildings and Facilities (electricity and natural gas)
70 170 205 234 Municipal Employment
Streetlights (electricity) 50 91 100 114 Average of Population and City-wide Employment
Vehicle Fleet (gasoline and diesel)
ND 213 256 292 Municipal Employment
Solid Waste (methane from decomposition)
ND 90 109 124 Municipal Employment
Water (electricity used for pumping and conveyance)
731 1,304 1,571 1,792 Municipal Employment
Total 850 1,868 2,240 2,556
ND: No data Source: American Canyon, 2011; American Canyon, 2012; ABAG, 2009; ABAG, 2012; DOF, 2012; PG&E, 2012b; Napa
Valley Petroleum, 2012; Recology, 2012.
2.4 Emissions Reduction Targets The City has adopted a community-wide emissions reduction target of 15 percent below its 2005 baseline by the year 2020. This is deemed by the California Air Resources Board (CARB), the Bay Area Air Quality Management District (BAAQMD), and the California Attorney General to be consistent with the state-wide AB 32 goal of reducing emissions to 1990 levels.5 The 15 percent reduction target is in line with current best practice for climate action plans developed numerous Bay Area cities, many of which use a 2005 baseline. It also meets a key requirement of the BAAQMD’s new CEQA Guidelines that provide regulatory streamlining of future development projects.
As shown in Section 2.1, energy-related sources of GHGs account for a high percentage of total GHG emissions in American Canyon. In 2005, GHG emissions associated with energy consumption accounted for approximately 46 percent of total community-wide emissions. By 2010, energy consumption increased to approximately 50 percent of total community-wide emissions, and this percentage is expected to remain high at approximately 49 percent of total emissions in 2020 and 2035. Thus, energy-related GHG reduction measures will have a relatively
5 In its Climate Change Scoping Plan of September 2008, CARB recommends that local governments adopt a GHG
reduction target consistent with the State’s commitment to reach 1990 levels by 2020. This is identified as equivalent to 15 percent below “current” levels at the time of writing (2008).

2-10 American Canyon Energy Efficiency Climate Action Plan 2 Energy and GHG Baseline, Forecast, and Target
high impact on overall GHG reductions. However, when preparing comprehensive Climate Action Plans that include all GHG sectors in a community, many cities find that energy-related measures must contribute a higher proportion of emissions reductions compared to other sectors. This is because local governments typically have a greater capacity to enact changes in the energy sector (e.g., building codes and energy efficiency incentive programs) than in other sectors such as transportation where there is less direct influence over community actions, or for which the authority to control emissions is shared by multiple agencies and stakeholders. Thus, when the City develops its comprehensive climate action plan, it may consider adopting a GHG reduction target for energy-related sources that is greater than 15 percent, for both the community and municipal operations. A higher energy-related reduction target would set the stage for the City to achieve an overall 15 percent reduction in total GHG emissions by 2020 while anticipating a smaller reduction percentage from the transportation sector.
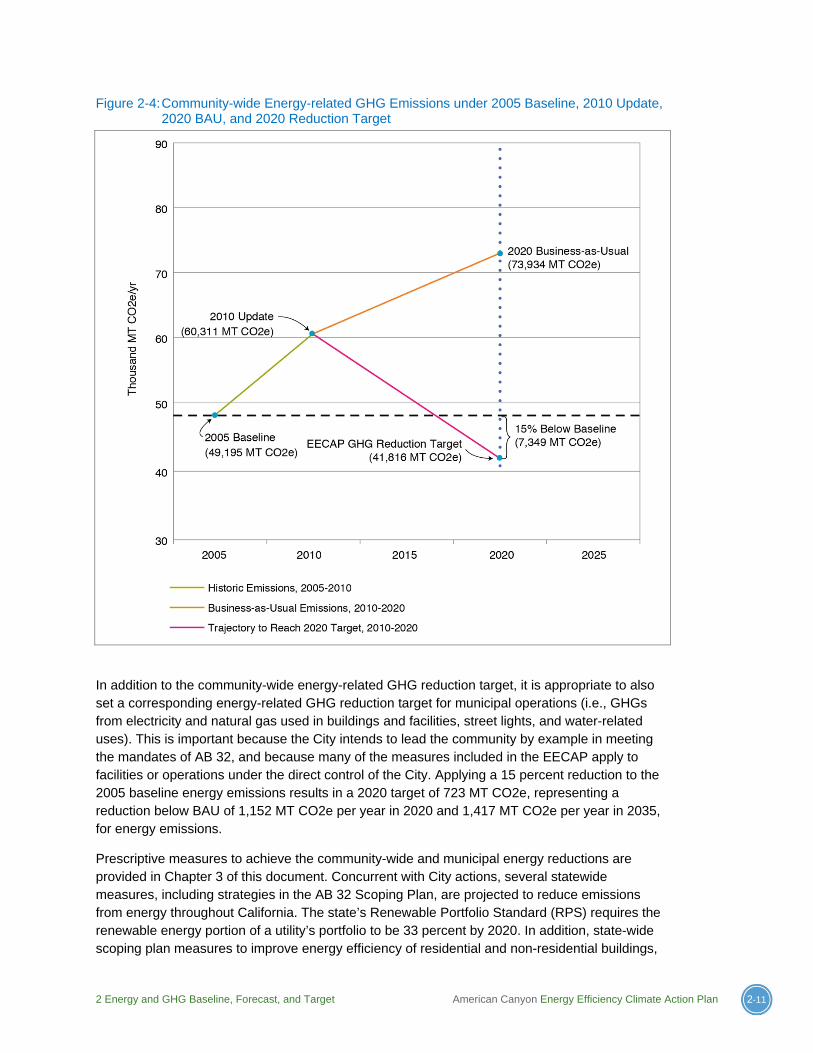
For community-wide energy-related GHG emissions, a reduction goal of 15 percent below 2005 baseline equates to 41,816 MT CO2e per year from energy sources by the year 2020, which is 7,379 MT CO2e below the baseline (2005), 32,118 MT CO2e below the 2020 BAU energy emissions, and 44,476 MT CO2e below the 2035 business-as-usual energy emissions. Figure 2-4 depicts 2005 baseline emissions, updated 2010 emissions, 2020 projected emissions under a BAU scenario, and the EECAP GHG reduction target of 15% below baseline.
2 Energy and GHG Baseline, Forecast, and Target American Canyon Energy Efficiency Climate Action Plan 2-11
Figure 2-4: Community-wide Energy-related GHG Emissions under 2005 Baseline, 2010 Update, 2020 BAU, and 2020 Reduction Target
In addition to the community-wide energy-related GHG reduction target, it is appropriate to also set a corresponding energy-related GHG reduction target for municipal operations (i.e., GHGs from electricity and natural gas used in buildings and facilities, street lights, and water-related uses). This is important because the City intends to lead the community by example in meeting the mandates of AB 32, and because many of the measures included in the EECAP apply to facilities or operations under the direct control of the City. Applying a 15 percent reduction to the 2005 baseline energy emissions results in a 2020 target of 723 MT CO2e, representing a reduction below BAU of 1,152 MT CO2e per year in 2020 and 1,417 MT CO2e per year in 2035, for energy emissions.
Prescriptive measures to achieve the community-wide and municipal energy reductions are provided in Chapter 3 of this document. Concurrent with City actions, several statewide measures, including strategies in the AB 32 Scoping Plan, are projected to reduce emissions from energy throughout California. The state’s Renewable Portfolio Standard (RPS) requires the renewable energy portion of a utility’s portfolio to be 33 percent by 2020. In addition, state-wide scoping plan measures to improve energy efficiency of residential and non-residential buildings,
2-12 American Canyon Energy Efficiency Climate Action Plan 2 Energy and GHG Baseline, Forecast, and Target
such as updates to Title 24, are anticipated to improve energy performance. The impact of these and other state measures on projected emissions reductions in American Canyon are highlighted in Chapter 5 the EECAP.
References ABAG, 2012. Plan Bay Area, Jobs-Housing Connection Strategy. Revised May 16, 2012.
American Canyon, 2006. City of American Canyon General Plan, adopted November 1994, amended December 2006.
American Canyon, 2010. City of American Canyon Policy Document, 2009-2014 Housing Element, December 2010.
American Canyon, 2011. Final Urban Water Management Plan. Published September, 2011.
American Canyon, 2012. Schedule 16, City of American Canyon Full-Time Equivalent City Government Employees by Function/Program Last Ten Fiscal Years.
Association of Bay Area Governments (ABAG), 2009. American Canyon Demographic Data and Projections for Population, Household, and Jobs.
California Department of Finance (DOF), 2012. City/County Population and Housing Estimates 2000-2010 and 2010-2012. Available at: http://www.dof.ca.gov/research/demographic/ reports/view.php. Accessed July 24, 2012.
CalRecycle, 2010. Jurisdiction Diversion/Disposal Rate Detail for American Canyon 2010. Accessed July 9, 2012. Publically available at: http://www.calrecycle.ca.gov/LGCentral/ reports/diversionprogram/JurisdictionDiversionDetail.aspx?JurisdictionID=14&Year=2010
Climate Protection Campaign & MIG, 2009. Draft Napa Countywide Community Climate Action Plan (Internal Review Only, Not for Public Distribution). October 2009.
ICF, 2011. Draft Napa County Climate Action Plan. 2005 Baseline Daily VMT Estimates by Speed Bin. January 2011.
Napa Valley Petroleum, 2012. Corp Yard, Police, Fire Department, and Card Lock fuel consumption for American Canyon fleet vehicles 2010. Provided July 2, 3, and 5, 2012.
Pacific Gas & Electric (PG&E), 2012a. Community Wide GHG Inventory Report for City of American Canyon 2003 to 2011. May 27, 2012.
PG&E, 2012b. Municipal GHG Inventory Report for City of American Canyon 2005 to 2010. May 18, 2012.
PG&E, 2012c. 2010 Renewables. Available at: http://www.pge.com/b2b/energysupply/wholesaleelectricsuppliersolicitation/renewables2010/. Accessed July 31, 2012.
Recology, 2012. City of American Canyon Government Operations Solid Waste Data. Received June 19, 2012.

3 Community Strategies and Measures American Canyon Energy Efficiency Climate Action Plan 3-1
3. Community Strategies and Measures
This chapter presents 7 overarching strategies and 13 measures to help the City reduce its energy use and reach its energy-related GHG reduction target of 15 percent below 2005 baseline levels. These strategies and measures were developed based on the unique needs of the various energy use sectors in American Canyon, and they support the City’s overarching goals of reducing consumption of nonrenewable energy sources and supporting the development and utilization of new energy sources. The strategies and measures build upon the success of previously implemented projects, are designed to increase participation in existing programs that lead to energy efficiency and new renewable energy sources, and create new programs to address sectors not currently served by existing initiatives.
3.1 Community Energy Reduction Opportunities
The City of American Canyon contains a diverse mix of residential, commercial, and industrial land uses, and the energy profile of the City reflects this diverse mix. As described in Chapter 2, a little over half of the community’s total energy consumption is attributed to the Non-Residential (commercial and industrial) sector, while the rest is consumed in the Residential sector. Thus, the energy conservation and renewable energy strategies and measures in this chapter focus equally on the Non-Residential and Residential sectors.
In addition, in the last several years the City has participated in a number of initiatives related to energy performance. Appendix C provides a summary of the existing policies, programs, projects, and plans related to energy performance and energy efficiency in the City, including several programs sponsored by PG&E. Historically, the Non-Residential sector has been more active in participating in PG&E energy efficiency programs than has the Residential sector. Since 2006, the Non-Residential sector, through its participation in PG&E programs, has reduced annual GHG
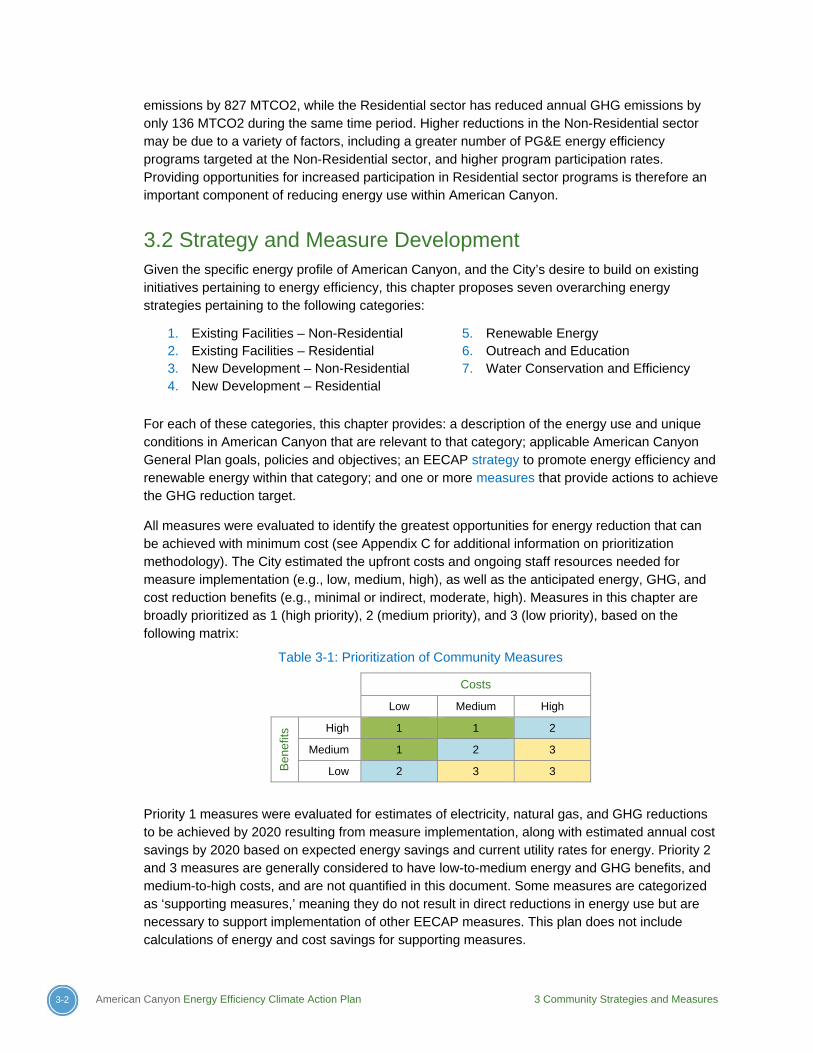
3-2 American Canyon Energy Efficiency Climate Action Plan 3 Community Strategies and Measures
emissions by 827 MTCO2, while the Residential sector has reduced annual GHG emissions by only 136 MTCO2 during the same time period. Higher reductions in the Non-Residential sector may be due to a variety of factors, including a greater number of PG&E energy efficiency programs targeted at the Non-Residential sector, and higher program participation rates. Providing opportunities for increased participation in Residential sector programs is therefore an important component of reducing energy use within American Canyon.
3.2 Strategy and Measure Development Given the specific energy profile of American Canyon, and the City’s desire to build on existing initiatives pertaining to energy efficiency, this chapter proposes seven overarching energy strategies pertaining to the following categories:
1. Existing Facilities – Non-Residential 2. Existing Facilities – Residential 3. New Development – Non-Residential 4. New Development – Residential
5. Renewable Energy 6. Outreach and Education 7. Water Conservation and Efficiency
For each of these categories, this chapter provides: a description of the energy use and unique conditions in American Canyon that are relevant to that category; applicable American Canyon General Plan goals, policies and objectives; an EECAP strategy to promote energy efficiency and renewable energy within that category; and one or more measures that provide actions to achieve the GHG reduction target.
All measures were evaluated to identify the greatest opportunities for energy reduction that can be achieved with minimum cost (see Appendix C for additional information on prioritization methodology). The City estimated the upfront costs and ongoing staff resources needed for measure implementation (e.g., low, medium, high), as well as the anticipated energy, GHG, and cost reduction benefits (e.g., minimal or indirect, moderate, high). Measures in this chapter are broadly prioritized as 1 (high priority), 2 (medium priority), and 3 (low priority), based on the following matrix:
Table 3-1: Prioritization of Community Measures
Costs
Low Medium High
Ben
efits
High 1 1 2
Medium 1 2 3
Low 2 3 3
Priority 1 measures were evaluated for estimates of electricity, natural gas, and GHG reductions to be achieved by 2020 resulting from measure implementation, along with estimated annual cost savings by 2020 based on expected energy savings and current utility rates for energy. Priority 2 and 3 measures are generally considered to have low-to-medium energy and GHG benefits, and medium-to-high costs, and are not quantified in this document. Some measures are categorized as ‘supporting measures,’ meaning they do not result in direct reductions in energy use but are necessary to support implementation of other EECAP measures. This plan does not include calculations of energy and cost savings for supporting measures.

3 Community Strategies and Measures American Canyon Energy Efficiency Climate Action Plan 3-3
For all measures this EECAP provides anticipated upfront costs of implementation for the City of American Canyon. Upfront cost estimates include the dollar equivalent of American Canyon staff-time and/or actual capital investment needed to implement the measure, and are broadly categorized as falling within one of two ranges: less than $50,000, or $50,000 to $250,000. For example, Measure C-6 is categorized as costing less than $50,000, as it would require minor staff time to implement the measure and no upfront capital.
3.3 Community Strategies and Measures
Table 3-2 presents a summary of community strategies and measures. Following Table 3-2 is a section on each category that includes a description of the category, its energy strategy, and detailed information about measures including specific implementing actions.
3.3.1 Existing Uses – Non-Residential
As described in Chapter 2, in 2010 the Non-Residential sector was responsible for 55 percent of electricity consumption and 62 percent of natural gas consumption in the community. This sector has experienced growth in both natural gas and electricity consumption in five of the past six years, for an overall increase in energy use of 33 percent between 2005 and 2011. During the same period, the number of jobs in the City increased by 31 percent, so the increase in energy use is likely tied to general economic growth in the City.
Within the Non-Residential sector, four Non-Residential segments1 were responsible for over 80 percent of the energy usage in 2011: food processing, offices, retail, and hospitality. The next three largest segments were: uncategorized accounts2, manufacturing and transportation, and wastewater and water treatment.
Food processing, the largest energy consuming segment, currently has a high participation rate in PG&E programs (90 percent) and a medium savings-to-use ratio,3 meaning that additional opportunities for energy savings may be limited in this segment. However, in general, additional outreach to the food processing segment is appropriate given its large contribution to total Non-Residential energy usage. In contrast, offices exhibit a medium (24 percent) participation rate and a high savings-to-use ratio (55 percent) while retail has a medium (28 percent) participation rate and a low savings-to-use ratio (6 percent). Thus, increasing the program participation rates of existing office and retail establishments could be an effective strategy for improving energy efficiency in the Non-Residential sector.
In addition to addressing opportunities for improvement in the customer segments identified above, the following Community Strategy 1 and Measures C-1, C-2, and C-3 support General Plan Objective 8.23, which states that the City will reduce energy consumption in buildings.
1
PG&E uses the term ‘segment’ to denote customer groups, including food processing, offices, retail, hospitality, manufacturing and transportation, wastewater and water treatment, schools, high tech, and government.
2 Uncategorized accounts include customers that do not provide a business type when they sign up for electricity and
natural gas service, and as such cannot be categorized within a specific PG&E segment. Unspecified accounts are usually smaller businesses.
3 ‘Savings-to-use ratio’ represents the total energy efficiency savings for a customer sector divided by the total electric
and/or gas use for that customer sector. A high savings-to-use ratio indicates a large amount of energy saved, in proportion to total energy use.

3-4 American Canyon Energy Efficiency Climate Action Plan 3 Community Strategies and Measures
Table 3-2: Summary of Community Energy Strategies and Measures
Measure Title and Description Measure
Type Priority Annual GHG
Reduction by 2020
Community Strategy 1. Existing Uses - Non-Residential. Increase voluntary energy efficiency efforts and participation in PG&E energy efficiency programs by targeting sectors that are responsible for the largest portions of energy use, currently have low or medium participation rates, and/or have low savings-to-use ratios.
C-1 Targeted Energy Efficiency Outreach to Non-Residential Energy Customers. Use PG&E data to target specific Non-Residential customer sectors for participation in PG&E programs or other local, regional, or state programs.
Incentive or rebate, outreach and education
1 3,005 MT CO2e
C-2 Develop a Voluntary Non-Residential Energy Efficiency Checklist. Build upon the energy disclosure requirements of AB 1103 to develop a voluntary Non-Residential energy efficiency checklist that will be available at the time of building sale.
Outreach and education
1 118 MT CO2e
C-3 Participate in a Non-residential Property Assessed Clean Energy (PACE) Program. Provide additional financing opportunities for energy efficiency improvements for commercial structures by participating in a Property Assessed Clean Energy (PACE) program.
Outreach and education/ incentive
1 1,841 MT CO2e
Community Strategy 2. Existing Uses - Residential. Increase residential participation in Energy Upgrade California, PG&E rebate programs, and other existing state and local programs; increase residential voluntary energy efficiency audits and upgrades.
C-4 Targeted Energy Efficiency Outreach to Residential Energy Customers. Increase participation in the residential customer sector for participation in PG&E programs, including Energy Upgrade California, and programs that provide rebates for energy efficient appliances and retrofits. Increase participation in weatherization programs.
Incentive or rebate/ outreach and education
1 1,084 MT CO2e
C-5 Voluntary Energy Efficiency Checklist for Residential Development. Develop a voluntary energy efficiency checklist that will be available at the time of residential home sale.
Outreach and education
1 356 MT CO2e
Community Strategy 3: New Development - Non-Residential. Ensure new development exceeds California’s Title 24 energy efficiency standard by 15 percent or more.
C-6 Savings By Design for New Non-Residential Construction. Require participation in PG&E’s Savings by Design Program (or future iterations of such a program) for all new Non-Residential new construction projects.
Mandatory requirement
1 Supporting Measure
C-7 Require Energy Efficiency Beyond State Code for New Non-Residential Construction. Through 2013, provide a streamlined permit process for new Non-Residential construction projects that incorporate energy efficiency improvements over Title 24, include all items on a voluntary energy efficiency checklist, or include renewable energy improvements. Starting in 2014 or 2017, require that all new construction achieve Tier 1 of Title 24 standards (15 percent more stringent than the mandatory standards.)
Incentive through 2016; Mandatory starting in 2017
1 399 MT CO2e

3 Community Strategies and Measures American Canyon Energy Efficiency Climate Action Plan 3-5
Table 3-2: Summary of Community Energy Strategies and Measures (continued)
Measure Title and Description Measure
Type Priority Annual GHG
Reduction by 2020
Community Strategy 4: New Development - Residential. Ensure new development exceeds California’s Title 24 energy efficiency standard by 15 percent or more.
C-8 Require Energy Efficiency Beyond State Code for New Residential Construction. Through 2013, provide a streamlined permit process for new residential construction projects that incorporate energy efficiency improvements over Title 24, include all items on a voluntary energy efficiency checklist, or include renewable energy improvements. Starting in 2014 or 2017, require that all new residential construction achieve Tier 1 of Title 24 standards (15 percent more stringent than the mandatory standards.)
Incentive through 2016; Mandatory starting in 2017
1 497 MT CO2e
Community Strategy 5. Education and Outreach. Increase local knowledge and training opportunities related to energy efficiency and renewable energy.
C-9 American Canyon “Green Team”. Create an American Canyon “Green Team” to support rollout and implementation of all EECAP programs.
Education and outreach
1 Supporting Measure
C-10 Work with NCEW and PG&E to Expand Outreach. Work with Napa County Energy Watch (NCEW) and PG&E to expand education and outreach to developers, architects, students, contractors, and the community at large.
Education and outreach
1 Supporting Measure
Community Strategy 6. Renewable Energy. Increase the number of distributed renewable energy installations on residential and Non-Residential properties to 3 new non-residential sites/year and 15 residential sites/year by 2020.
C-11 Solar Ready Roofs for New Construction. For new construction: Require solar ready roofs that are pre-wired and ready for the installation of solar photovoltaic panels and solar water heating systems.
Mandatory requirement
2 Supporting Measure
C-12 Promote the installation of Solar PV on Existing Buildings. Promote new solar photovoltaic installations on existing buildings by providing and disseminating information on available state and federal rebates, solar leases, and Power Purchase Agreements (PPAs). Participate in a PACE program to provide additional financing opportunities.
Incentive 1 1,809 MT CO2e
Community Strategy 7. Water Conservation. Reduce per capita community water use 20 percent by 2020 from the 2005 baseline.
C-13 Community Water Reduction. Reduce community water use through building and landscape design and improvements.
Education and Outreach; Rebates and incentives
2 Low

3-6 American Canyon Energy Efficiency Climate Action Plan 3 Community Strategies and Measures
Community Strategy 1. Existing Uses – Non-Residential
Increase voluntary energy efficiency efforts and participation in PG&E energy efficiency programs by targeting sectors that are responsible for the largest portions of energy use, currently have low or medium participation rates, and/or have low savings-to-use ratios.
Measure C-1: Targeted Energy Efficiency Outreach to Non-Residential Energy Customers
Priority: 1
Measure type: Incentive or rebate; outreach and education
Annual energy savings by 2020: Electricity: 5,126,744 kWh Natural gas: 368,754 therms GHGs: 3,005 MTCO2e
Annual cost savings by 2020: $1,265,755
Implementation cost: <$50,000
Potential source of funding: PG&E Local Government Partnership, PG&E rebates, energy efficiency tax credits
Implementation date: 2013
Responsibility: Community Development Department
Co-benefits: Reduced maintenance costs, reduced water usage, increased indoor comfort in buildings
Description and implementing actions: The City will use PG&E data to target specific non-residential customer sectors for participation in PG&E programs or other local, regional, or state programs. The City will target sectors that represent a large portion of the energy use, which currently include the food processing, offices, retail, and hospitality sectors.
Implementing Actions will include:
Communicate with PG&E’s American Canyon Account Manager to develop a ‘heat map’ that identifies customer segments with high energy savings potential and high feasibility of program implementation. Update the heat map annually.
Use PG&E’s interactive Tableau data report to annually monitor the savings-to-use ratios of the various customer segments, and target outreach accordingly.
Target participation in the food processing, office, retail, and hospitality sectors by providing information to appropriate trade groups. Actions may include, but not be limited to:
Working with the Chamber of Commerce to provide quarterly reminders of available programs.
Mailing informational flyers to all businesses in these sectors on an annual or semi-annual basis.
Phone outreach to the twenty largest energy consumers in American Canyon on an annual or semi-annual basis.
Work with Napa County Energy Watch (NCEW) to target reductions in the small business community.
Long-term implementation may include a Small Business Energy and Water Makeover to create partnerships among small business, and assemble members
3 Community Strategies and Measures American Canyon Energy Efficiency Climate Action Plan 3-7
into a cost effective “bundle” of energy upgrade jobs. This way, many small jobs will compete with single large jobs (big box retail) for rebates and resources.4
Develop an energy and sustainability web page on the City’s website and provide up-to-date links to current energy rebates, incentives, and audit programs. Review and update the website content on a semi-annual basis.
Support the work being done by the Bay Area Green Business Program by providing program information to local businesses during local events and outreach efforts.
Case studies and/or supporting information: Most of the food processing businesses in American Canyon are focused on wine processing. A case study of the Sonoma Wine Company, based in the Town of Graton, found that the company was able to achieve a savings of $30,000/year on utility bills while undergoing a major expansion that would double the capacity of the operation. 5 The company utilized PG&E incentives and participated in the Savings by Design program to achieve these savings.
Another case study found that the J Vineyards and Winery, also located in Sonoma County, was able to implement numerous projects that saved energy and lowered costs.6 The company conducted full audits of all its facilities to identify opportunities for energy efficiency. They partnered with Energy Industries, a local sustainability engineering firm, to conduct a pilot program at the La Crema winery. They implemented a half dozen measures at La Crema, including a lighting retrofit, recommissioning refrigeration and compressed-air systems, installing new fan motors with variable frequency drives (VFDs) and installing zero-loss drains on receiver tanks. Finally, the company found major savings in the amount spent on refrigeration by increasing the insulation beyond code requirements, and adding computerized controls that adjust operations according to actual loads.
Measure C-2: Develop a Voluntary Non-Residential Energy Efficiency Checklist
Priority: 1
Measure type: Outreach and education
Annual energy savings by 2020: Electricity: 201,866 kWh Natural gas: 14,520 therms GHGs: 118 MTCO2e
Annual cost savings by 2020: $49,839
Implementation cost: <$50,000
Potential source of funding: PG&E
Implementation date: 2014
Responsibility: Community Development Department
Co-benefits: Reduced maintenance costs, reduced water usage, increased indoor comfort in buildings, increased community energy knowledge and training
Description and implementing actions: AB1103, now superceded by AB 531, will create the state’s Commercial Building Energy Use Disclosure Program. At the writing of this plan, the state’s 4 See http://www.coolcalifornia.org/article/energy-makeover 5 http://www.sustainablewinegrowing.org/docs/cswa_may07_swc_article.pdf 6 http://www.fypower.org/bpg/case_study.html?b=food_and&c=J_Vineyards_and_Winery
3-8 American Canyon Energy Efficiency Climate Action Plan 3 Community Strategies and Measures
proposed regulation will take effect on July 1, 2013. The Program will require the owner of a non-residential building to benchmark the building’s energy use using the U.S. Environmental Protection Agency’s Portfolio Manager system in advance of building sale. Once a building is benchmarked, it will receive a score on a scale of 1 – 100. The Program will also require the disclosure of statements of the building’s energy use to potential buyers, lessees, and lenders when the entire building is sold or leased. Furthermore, utilities serving the building will be required to release the most recent 12 months of energy use data to the owner’s Portfolio Manager account. Once the regulation is fully implemented, buildings of 5,000 square feet or larger will be required to comply.
The City will build upon the energy disclosure requirements of AB 1103 to develop a voluntary non-residential energy efficiency checklist that will be available at the time of building sale. The checklist will include a list of high-priority, low-cost measures that may be implemented to increase efficiency and reduce operational costs. The checklist will also provide a list of potential funding resources. If the checklist proves to be popular and successful, and sufficient training occurs to educate local stakeholders on using the checklist, the City may consider creating a mandatory checklist in the future.
Implementing actions will include:
Develop a draft of the checklist, possibly multiple versions targeted at different kinds or sizes of businesses. Review PG&E sample checklists for different kinds of businesses as a starting point.
Provide the checklist on the City’s website and distribute to local real estate industry representatives and other stakeholders. Attend or host at least one real estate industry meeting each year to discuss opportunities related to the non-residential sector.
Provide information and rebate applications for PG&E-eligible equipment during point of sale transaction, and/or links to the City website with up-to-date information.
Case studies and/or supporting information: The City of Berkeley implemented a mandatory commercial energy conservation ordinance (CECO) in 1994, and has achieved modest savings of approximately 13%. (Unlike the Berkeley ordinance, the proposed American Canyon energy efficiency checklist is voluntary.) The Berkeley ordinance requires a building to receive an audit, and then requires a set of energy efficiency measures to be implemented, and applies to all buildings being sold or undergoing $50,000 or more of renovations. The audit determines the applicability, cost and benefits of various energy conservation improvements related to a building’s HVAC, furnaces, boilers, lighting and building envelope. Then the seller must implement upgrades with a cost ceiling of 1 percent of the sale price or assessed value, not to exceed $150,000. Exemptions are available for newer construction or low energy users. One study completed for the City of San Francisco stated that the CECO requirement would pay for itself in four to five years.7
7 http://www.spur.org/publications/library/report/critical_cooling/option4
3 Community Strategies and Measures American Canyon Energy Efficiency Climate Action Plan 3-9
Measure C-3: Participate in a Non-residential Property Assessed Clean Energy (PACE) Program
Priority: 1
Measure type: Incentive or rebate; outreach and education
Annual energy savings by 2020: Electricity: 3,140,131 kWh Natural gas: 225,862 therms GHGs: 1,841 MTCO2e
Annual cost savings by 2020: $775,275
Implementation cost: $50,000-$250,000
Potential source of funding: External financing will fund the PACE program
Implementation date: 2014
Responsibility: City Manager’s Office
Co-benefits: Reduced maintenance costs, reduced water usage, increased indoor comfort in buildings, increased community energy knowledge and training. PACE funding may also be used to purchase renewable energy generation equipment
Description and implementing actions: A Property Assessed Clean Energy (PACE) program is a financing tool used by local governments to provide property owners with funds for energy efficiency improvements and retrofits, or for renewable energy systems (e.g., solar panels and small wind turbines). PACE funds may also be used for water-savings measures. Property owners receive 100% financing, and then repay the cost of the improvements as a property tax assessment over the course of 20 years. PACE programs provide significant advantages by eliminating upfront costs, providing low-cost long-term financing and making it easy for building owners to transfer repayment obligations to a new owner upon the building’s sale.
The City’s participation in the PACE program will provide additional financing opportunities for energy efficiency improvements for commercial structures. This measure strongly supports measures C-1 and C-2, as PACE is a key funding mechanism that may be used at time of property sale or to build upon other rebates and tax incentives that may be identified for energy efficiency improvements.
Implementing actions will include:
Implement a PACE program by linking with the existing Napa County program.8
Provide at least one case study related to PACE improvements on the City’s energy webpage.
Case studies and/or supporting information: In the Sonoma County PACE program, 671 projects have been completed; approximately half were energy efficiency upgrades. The average loan was $30,000 per project. Napa County is developing a non-residential PACE program that is expected to begin in Spring 2013.
8 Financing through CaliforniaFIRST is available up to $75,000 for businesses in 20 year loans with interest rates from 7
to 8 percent.
3-10 American Canyon Energy Efficiency Climate Action Plan 3 Community Strategies and Measures
3.3.2 Existing Uses – Residential
The Residential sector has experienced growth in both natural gas and electricity consumption in five of the past six years, for an overall increase of 19 percent between 2005 and 2011. During the same period, the City’s population increased by 37 percent, so the increase in energy use is likely tied to general population growth, although energy use is not growing as fast as population growth.
Single-family households represent a larger portion of City residences than multi-family households, consuming on average 85 percent of natural gas and 89 percent of electricity among all residential uses (for the period 2005 to 2011). This breakdown matches recent Census data from 2010, which shows that 81.5 percent of American Canyon residents live in single-family homes, and 4.4 percent of residents live in multifamily housing. In addition, according to this Census data, 14.1 percent of residents live in mobile homes. In 2011, the average monthly household electricity use was 559 and 411 kWh per month for single family and multifamily homes, respectively. For the same year, residential customers used 38 and 39 therms per month for single family and multifamily homes, respectively. Thus, multifamily homes use significantly less electricity but slightly more natural gas, on average, than do single family homes.
Annual electricity use by American Canyon residents averages 6,708 kWh/year for single-family homes and 4,932 kWh/year for multifamily homes. In the state of California, average household electricity use was 6,960 kWh/household in 2010. Thus, residents living in single-family homes in the City of American Canyon use slightly less electricity than the average California household, while residents living in multifamily homes use about 29 percent less electricity than the average California household.
The average monthly utility bill (electricity and natural gas) in American Canyon is $117/month, which equates to $1,404/year. Monthly bills are typically higher in the winter and lower in the summer. On average, a 20 percent reduction in energy use would save each residential utility customer $280/year.
The Housing Element of the City’s General Plan (2010) includes numerous goals, objectives and policies that support energy efficiency including the following:
Goal 2G: Encourage energy conservation in new housing and existing housing.
Objective 2.22: Improve energy conservation in existing residential development.
Policy 2.22.1: Promote the weatherization of existing residential units.
Policy 2.22.2: Promote a weatherization and retrofit program for existing housing units that fall below current state performance standards for energy efficiency.
Policy 2.22.4: Promote energy conservation through education and outreach programs provided by the Community Development Department.
To build upon these policies, this EECAP presents an overall strategy to increase participation in existing residential-focused programs, which will depend heavily upon education and outreach to local residents. The potential for energy reduction is highest in the single-family housing sector, which uses more energy per household than the multifamily housing sector.
On average, a 20 percent
reduction in energy use
would save each
residential utility
customer $280/year.
3 Community Strategies and Measures American Canyon Energy Efficiency Climate Action Plan 3-11
Community Strategy 2. Existing Uses – Residential
Increase residential participation in Energy Upgrade California, PG&E rebate programs, and other existing state and local programs; increase residential voluntary energy efficiency audits and upgrades.
Measure C-4: Targeted Energy Efficiency Outreach to Residential Energy Customers
Priority: 1
Measure type: Incentive or rebate; outreach and education
Annual energy savings by 2020: Electricity: 1,849,106 kWh Natural gas: 132,959 therms GHGs: 1,084 MTCO2e
Annual cost savings by 2020: $487,072
Implementation cost: <$50,000
Potential source of funding: PG&E Local Government Partnership, PG&E rebates, energy efficiency tax credits
Implementation date: 2013
Responsibility: Community Development
Co-benefits: Reduced maintenance costs, reduced water usage, increased indoor comfort in homes, increased home values
Description and implementing actions: The City will increase participation in the residential customer sector for participation in PG&E programs, including Energy Upgrade California, and programs that provide rebates for energy efficient appliances and retrofits. The City will also Increase participation in weatherization programs.
Energy Upgrade California is a statewide program that offers up to $4,000 in incentives to homeowners who complete energy efficiency home improvements. The incentive packages are based on a “whole house” approach by combining several related improvements at once to increase a home’s overall energy efficiency and achieve greater savings. Furthermore, homeowners can receive additional financing through an energy efficiency loan to pay for the cost of the upgrades that are not covered by the incentive payments. 30% energy savings are common in the most aggressive package that is available. Based on the average household’s energy use and costs in American Canyon, a 30% savings in energy would result in annual savings of $510 per household.
Other rebates and incentives are available from PG&E; many of these rebates apply to specific types of equipment, such as furnaces, hot water heaters, pool pumps, and refrigerators. Rebates are also available for certain “cool” roofs. These programs should be considered when a homeowner is replacing major appliances or replacing a roof.
Implementing actions will include:
Keep the City energy website up-to-date with links to current energy rebates, incentives, and audit programs. Review and update the website content on a semi-annual basis.
Provide and disseminate resources through specific newsletters, websites, social media, or other outlets that could be used to educate residents about energy efficiency.

3-12 American Canyon Energy Efficiency Climate Action Plan 3 Community Strategies and Measures
Inform qualifying residents about weatherization programs.
Case studies and/or supporting information: Other cities have found marketing success for energy efficiency programs by providing very simple, non-glossy flyers or informational brochures. Such flyers could be included with the monthly water bill. Many residents see their city as a trusted source of information, and will respond to simple flyers from the City while ignoring glossy or highly produced marketing materials from other sources.
Measure C-5: Voluntary Energy Efficiency Checklist for Residential Development
Priority: 1
Measure type: Outreach and education
Annual energy savings by 2020: Electricity: 606,738 kWh Natural gas: 43,627 therms GHGs: 356 MTCO2e
Annual cost savings by 2020: $159,820
Implementation cost: <$50,000
Potential source of funding: To be determined
Implementation date: 2013
Responsibility: Community Development
Co-benefits: Reduced maintenance costs, reduced water usage, increased indoor comfort in homes, increased community energy knowledge and training, increased home values
Description and implementing actions: The City will develop a voluntary residential energy efficiency checklist that will be available at the time of the home sale. The checklist will include a list of high-priority, low-cost measures that may be implemented to increase efficiency and reduce energy costs. The checklist will also provide a list of potential funding resources. If the checklist proves to be popular and successful, and sufficient training occurs to educate local stakeholders on using the checklist, the City may consider creating a mandatory checklist in the future.
Implementing actions will include:
Develop a draft of the checklist, possibly two versions: one for single family homes, and one for multifamily buildings.
Provide the checklist on the City’s website and distribute to local real estate industry representatives and other stakeholders. Attend or host at least one real estate industry meeting each year to discuss opportunities related to the residential sector.
Provide information and rebate applications for PG&E eligible equipment during point of sale transaction, and/or links to the City website with up-to-date information.
Case studies and/or supporting information: While a Residential Energy Conservation Ordinance (RECO) requires energy efficiency upgrades at the time of a home’s sale, this measure promotes the use of a voluntary checklist made available at the time of home sale. The City of Berkeley has a RECO that requires a set of 10 fairly simple energy efficiency measures to be implemented at the time of home sale or during a major renovation. For example, measures include duct sealing, adding weather stripping to exterior doors, and adding insulation to water heaters. The cost of the improvements is capped at three-quarters of 1% of the home’s final purchase price.
3 Community Strategies and Measures American Canyon Energy Efficiency Climate Action Plan 3-13
Energy savings from the RECO are not measured or verified, but are estimated at 10-20% per household. The City has found that while the total number of households increased by 2% from 2000 to 2010, total energy consumption in the residential sector decreased by 10% in the same time period.
The Energy Trust of Oregon developed a voluntary checklist called the Smart Homebuyer Checklist.9 This checklist educates homeowners about know what to look and ask for when searching for a new home. The checklist includes a series of questions, such as “What are the estimated monthly and annual energy costs for this home?” as well as a checklist used to determine what high-efficiency features are already installed in the home.
Funding resources could be included on the checklist. One resource available is an energy efficient mortgage (EEM), which gives borrowers the opportunity to finance cost-effective, energy-saving measures as part of a single mortgage. EEMs also stretch debt-to-income qualifying ratios on loans, thereby allowing borrowers to qualify for a larger loan amount and a better, more energy-efficient home. EEMs are typically used to purchase a new home that is already energy efficient such as an ENERGY STAR certified home. Another type of EEM is an Energy Improvement Mortgage (EIM), which is used to purchase existing homes that will have energy efficiency improvements made to them. EIMs allow borrowers to include the cost of energy-efficiency improvements to an existing home in the mortgage without increasing the down payment. EIMs also allow the borrower to use the money saved in utility bills to finance energy improvements. Both EEMs and EIMs typically require a home energy rating to provide the lender with the estimated monthly energy savings and the value of the energy efficiency measures. EEMs (and EIMs) are sponsored by federally insured mortgage programs and the conventional secondary mortgage market.
3.3.3 New Development – Non-Residential
American Canyon has grown rapidly in recent years. Growth is expected to continue, though at a slower rate. Population increased by 37 percent in just five years between 2005 and 2010, and is projected to increase by another 37 percent between 2010 and 2020. The number of jobs in the community increased by 31 percent between 2005 and 2010, and jobs are projected to increase by 14 percent between 2010 and 2020.
If these growth projections prove to be correct, then new construction will be occurring in both the Residential and Non-Residential sectors. This new construction presents a significant opportunity for more efficient buildings, as there are numerous possibilities for incorporating energy efficiency features into the design of new buildings before they are built. Many studies have attempted to quantify financial benefits related to green building, including energy-related benefits. Studies cite Leadership in Energy and Environmental Design (LEED) building operating costs as being 30-40 percent below operating costs for standard buildings; much of the savings comes from lower energy and water utility bills. Additional benefits include higher morale and better indoor air quality.
The City’s General Plan includes Objective 8.23, which states that the City will reduce energy consumption in buildings. This objective is supported by Policy 8.23.1, which requires that developers employ energy-efficient subdivision and site planning methods as well as building
9 http://energytrust.org/library/forms/nh_lt_smarthomebuyerchecklist.pdf

3-14 American Canyon Energy Efficiency Climate Action Plan 3 Community Strategies and Measures
design, including optimal building orientation and shading, landscaping, building reflectance, use of active and passive solar heating and hot water system, etc.
The strategy and measures provided below build upon this objective and policy, and include a mix of mandatory and voluntary incentive-based approaches.
Community Strategy 3: New Development – Non-Residential
Ensure new development exceeds California’s Title 24 energy efficiency standard by 15 percent or more.
Measure C-6: Savings By Design for New Non-Residential Construction
Priority: 1
Measure type: Mandatory requirement
Annual energy savings by 2020: Not Applicable; Supports Measures C-7
Implementation cost: <$50,000
Potential source of funding: PG&E
Implementation date: 2013
Responsibility: Community Development Department: Building Division
Co-benefits: Reduced maintenance costs, reduced water usage, increased indoor comfort in homes, increased community energy knowledge and training
Description and implementing actions: Savings By Design is a statewide program offered by PG&E to encourage high-performance new building design and construction for commercial buildings. The program offers building owners and their design teams a wide range of services, such as Design Assistance, Design Team Incentives, Owner Incentives, and educational resources such as Energy Design Resources (EDR) and Zero Net Energy.
The City will require participation in PG&E’s Savings By Design Program (or future iterations of such a program) for all non-residential new construction projects. New construction projects will not be required to implement the energy efficiency or green building strategies suggested by the Savings By Design team. However, this measure will ensure that developers are well educated and made aware of building best practices, and of all incentives and resources available to maximize energy efficiency in non-residential structures.
Implementing actions will include:
Coordinate with PG&E representatives to ensure that all non-residential new construction projects comply with this requirement.
Determine a method for enforcing compliance as part of the City’s planning process.
Case studies and/or supporting information: Sonoma State University’s Salazar Hall reduced its energy usage by 42.7 percent through participation in PG&E’s energy-efficiency programs, including Savings By Design. Additional information on the Savings By Design Program is available by calling the Savings By Design team at 415-973-3803, or by visiting PG&E’s website at http://www.pge.com/mybusiness/energysavingsrebates/rebatesincentives/inc/.
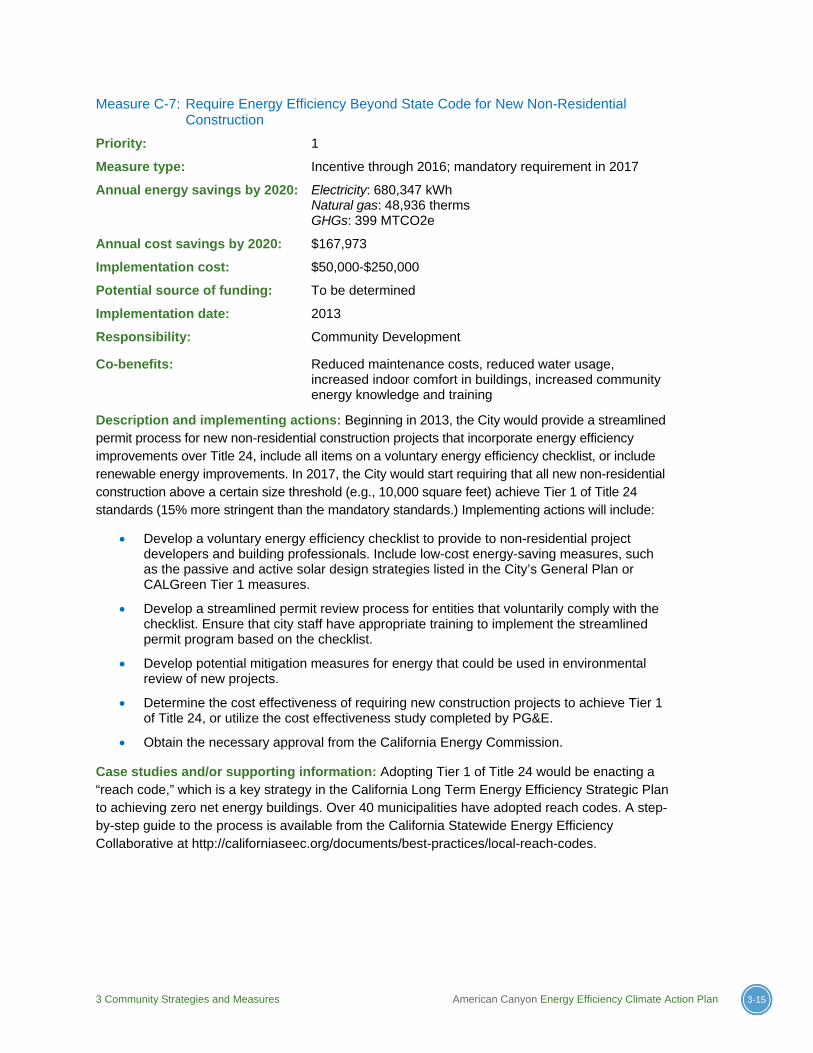
3 Community Strategies and Measures American Canyon Energy Efficiency Climate Action Plan 3-15
Measure C-7: Require Energy Efficiency Beyond State Code for New Non-Residential Construction
Priority: 1
Measure type: Incentive through 2016; mandatory requirement in 2017
Annual energy savings by 2020: Electricity: 680,347 kWh Natural gas: 48,936 therms
GHGs: 399 MTCO2e
Annual cost savings by 2020: $167,973
Implementation cost: $50,000-$250,000
Potential source of funding: To be determined
Implementation date: 2013
Responsibility: Community Development
Co-benefits: Reduced maintenance costs, reduced water usage, increased indoor comfort in buildings, increased community energy knowledge and training
Description and implementing actions: Beginning in 2013, the City would provide a streamlined permit process for new non-residential construction projects that incorporate energy efficiency improvements over Title 24, include all items on a voluntary energy efficiency checklist, or include renewable energy improvements. In 2017, the City would start requiring that all new non-residential construction above a certain size threshold (e.g., 10,000 square feet) achieve Tier 1 of Title 24 standards (15% more stringent than the mandatory standards.) Implementing actions will include:
Develop a voluntary energy efficiency checklist to provide to non-residential project developers and building professionals. Include low-cost energy-saving measures, such as the passive and active solar design strategies listed in the City’s General Plan or CALGreen Tier 1 measures.
Develop a streamlined permit review process for entities that voluntarily comply with the checklist. Ensure that city staff have appropriate training to implement the streamlined permit program based on the checklist.
Develop potential mitigation measures for energy that could be used in environmental review of new projects.
Determine the cost effectiveness of requiring new construction projects to achieve Tier 1 of Title 24, or utilize the cost effectiveness study completed by PG&E.
Obtain the necessary approval from the California Energy Commission.
Case studies and/or supporting information: Adopting Tier 1 of Title 24 would be enacting a “reach code,” which is a key strategy in the California Long Term Energy Efficiency Strategic Plan to achieving zero net energy buildings. Over 40 municipalities have adopted reach codes. A step-by-step guide to the process is available from the California Statewide Energy Efficiency Collaborative at http://californiaseec.org/documents/best-practices/local-reach-codes.
3-16 American Canyon Energy Efficiency Climate Action Plan 3 Community Strategies and Measures
3.3.4 New Development – Residential
New development in the Residential sector will support the growth of the City’s population, which is forecast to increase by 37 percent between 2010 and 2020. Similar to the Non-Residential sector, new construction provides a significant opportunity for energy efficiency, as there are numerous possibilities for incorporating energy efficiency features into the design of new homes before they are built.
Homes meeting the LEED for Homes prerequisite of 15 percent greater energy efficiency than required by Title 24 (2008 code) can expect annual cost savings that will cover the incremental first costs of energy efficient equipment in a payback period of about 15 to 20 years. Homes that incorporate green building features are also associated with a price premium far beyond the cost of installed energy efficiency measures. A 2012 joint UC Berkeley/UC Los Angeles study analyzed home prices of all California single family homes sold from 2007 to 2012 and found that “green labeled” homes (ENERGY STAR, GreenPoint Rated or LEED for Homes) sell for a 9 percent ($35,000 on average) premium compared to non-labeled homes. This price premium varies considerably from region to region and is correlated with the environmental values present in the specific market. Another 2012 study found that California homes with solar panels sell for about 3.5 percent more than homes without solar panels.
The Housing Element of the City’s General Plan, updated in 2010, includes numerous goals, objectives, and policies pertaining to energy use in new residential structures, including:
Goal 2G: Encourage energy conservation in new housing and existing housing;
Objective 2.21: Promote the use of energy conservation features in the design of residential development;
Policy 2.21.1: Ensure that the design of development is consistent with state laws regarding energy conservation;
Policy 2.21.2: Promote the planting of trees in residential areas to provide cooling during the summer months;
Policy 2.21.3: Encourage innovative site designs and orientation techniques, which incorporate passive and active solar designs and natural cooling techniques; and
Policy 2.21.4: Promote energy efficient land use planning by incorporating energy conservation as a major criterion for future decision making.
The aforementioned goal, objective, and policies in the General Plan rely on voluntary approaches that promote or encourage energy efficiency in new residential development. The strategy and measure provided in this EECAP rely on a voluntary, incentive-based approach initially, which becomes a mandatory policy several years into implementation.
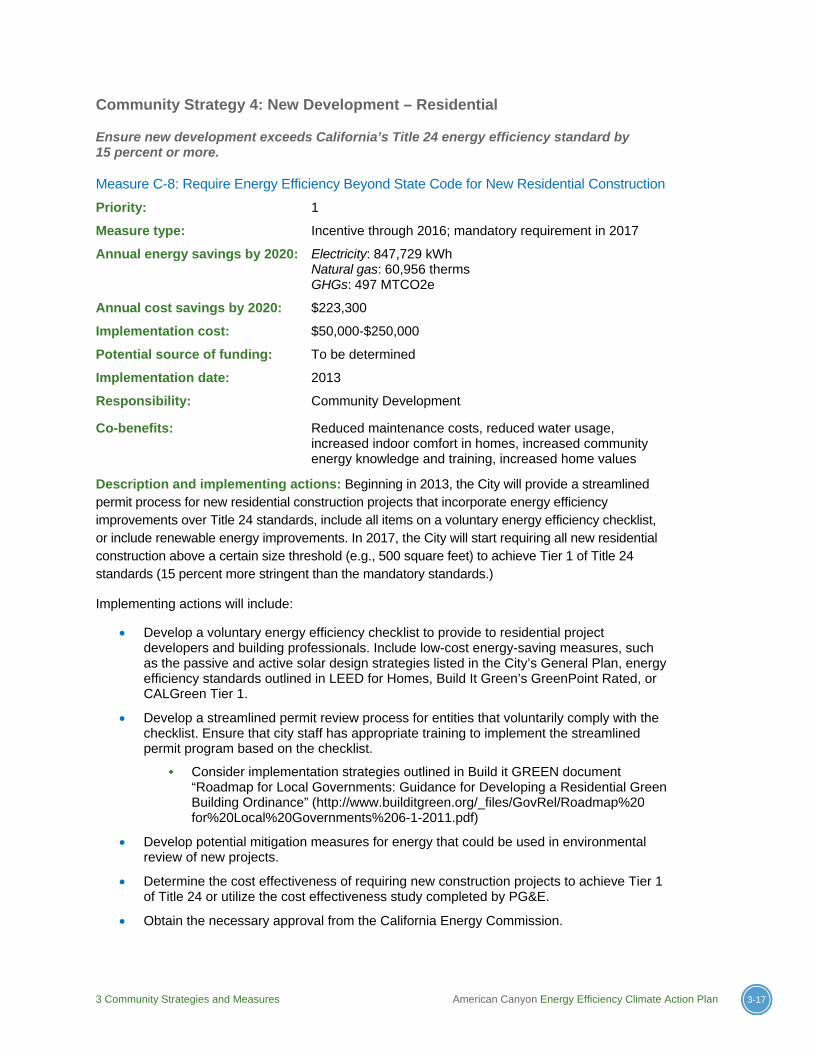
3 Community Strategies and Measures American Canyon Energy Efficiency Climate Action Plan 3-17
Community Strategy 4: New Development – Residential
Ensure new development exceeds California’s Title 24 energy efficiency standard by 15 percent or more.
Measure C-8: Require Energy Efficiency Beyond State Code for New Residential Construction
Priority: 1
Measure type: Incentive through 2016; mandatory requirement in 2017
Annual energy savings by 2020: Electricity: 847,729 kWh Natural gas: 60,956 therms GHGs: 497 MTCO2e
Annual cost savings by 2020: $223,300
Implementation cost: $50,000-$250,000
Potential source of funding: To be determined
Implementation date: 2013
Responsibility: Community Development
Co-benefits: Reduced maintenance costs, reduced water usage, increased indoor comfort in homes, increased community energy knowledge and training, increased home values
Description and implementing actions: Beginning in 2013, the City will provide a streamlined permit process for new residential construction projects that incorporate energy efficiency improvements over Title 24 standards, include all items on a voluntary energy efficiency checklist, or include renewable energy improvements. In 2017, the City will start requiring all new residential construction above a certain size threshold (e.g., 500 square feet) to achieve Tier 1 of Title 24 standards (15 percent more stringent than the mandatory standards.)
Implementing actions will include:
Develop a voluntary energy efficiency checklist to provide to residential project developers and building professionals. Include low-cost energy-saving measures, such as the passive and active solar design strategies listed in the City’s General Plan, energy efficiency standards outlined in LEED for Homes, Build It Green’s GreenPoint Rated, or CALGreen Tier 1.
Develop a streamlined permit review process for entities that voluntarily comply with the checklist. Ensure that city staff has appropriate training to implement the streamlined permit program based on the checklist.
Consider implementation strategies outlined in Build it GREEN document “Roadmap for Local Governments: Guidance for Developing a Residential Green Building Ordinance” (http://www.builditgreen.org/_files/GovRel/Roadmap%20 for%20Local%20Governments%206-1-2011.pdf)
Develop potential mitigation measures for energy that could be used in environmental review of new projects.
Determine the cost effectiveness of requiring new construction projects to achieve Tier 1 of Title 24 or utilize the cost effectiveness study completed by PG&E.
Obtain the necessary approval from the California Energy Commission.
3-18 American Canyon Energy Efficiency Climate Action Plan 3 Community Strategies and Measures
Case studies and/or supporting information: Adopting Tier 1 of Title 24 would be enacting a “reach code,” which is a key strategy in the California Long Term Energy Efficiency Strategic Plan to achieving zero net energy buildings. Over 40 municipalities have adopted reach codes. A step-by-step guide to the process is available from the California Statewide Energy Efficiency Collaborative at http://californiaseec.org/documents/best-practices/local-reach-codes.
3.3.5 Education and Outreach
Since 2006, energy efficiency actions have saved 120,000 kWh of electricity and 6,000 therms of natural gas in American Canyon’s Residential sector, and 2,780,000 kWh of electricity and 23,000 therms of natural gas in the Non-Residential sector. The City recognizes the role that increased outreach and education will play in expanding upon these achievements. The City is committed to increasing the number of developers, architects, students, contractors, and other community members who are knowledgeable about energy efficiency and renewable energy, and capable of implementing energy performance improvements throughout the community.
Myriad policies in the City’s General Plan Housing Element and Natural & Historic/Cultural Element address energy-related education and outreach, including:
Policy 2.22.4: Promote energy conservation through education and outreach programs provided by the Community Development Department;
Objective 8.24: Increase public awareness of energy conservation needs and means in order to encourage informed choices about energy conservation by the general public;
Policy 8.24.1: Cooperate with local utilities to provide energy conservation information to the public; and
Policy 8.24.2: Develop public and/or public-private energy conservation educational programs for City employees and the public.
The strategy and measure provided below build upon the City’s General Plan objective and policies, and include an education and outreach-based approach to increasing local knowledge about energy efficiency and renewable energy opportunities.
Community Strategy 5. Outreach and Education
Increase local knowledge and training opportunities related to energy efficiency and renewable energy.
Measure C-9: American Canyon “Green Team”
Priority: 1
Measure type: Education and Outreach
Annual energy savings by 2020: Not applicable; supporting measure
Implementation cost: <$50,000
Potential source of funding: To be determined
Implementation date: 2013
Responsibility: Organized by Community Development Department with representatives from all City departments
3 Community Strategies and Measures American Canyon Energy Efficiency Climate Action Plan 3-19
Co-benefits: Efficient implementation of the EECAP; knowledge gained during community outreach can be applied to municipal operations, resulting in reduced operating costs
Description and implementing actions: The City will create an American Canyon “Green Team” to support rollout and implementation of all EECAP programs. The Green Team will monitor progress, provide information, ensure the completion of the EECAP measures, and help the City reach its 2020 GHG reduction target.
Implementing actions will include:
Choose at minimum one individual from each City department to serve as department representative on the Green Team.
The Green Team will elect a “Sustainability Coordinator” from among the Green Team representatives, to coordinate the group and implementation of the EECAP.
The Green Team will work directly with the City departments to facilitate successful implementation of the EECAP, coordinate with community partners and stakeholders, and monitor and measure the City’s progress in meeting its GHG reduction target.
Case studies and/or supporting information: “Green Teams,” Sustainability Coordinators, and Environmental Committees are common in California cities. See, for example:
City of Pasadena: http://www.ci.pasadena.ca.us/GreenCity/Green_Team/
City of Napa, CleanGreenNapa: http://www.cityofnapa.org
City of Santa Rosa: http://ci.santa-rosa.ca.us/environmental_stewardship/env_committee/
City of Oxnard: http://www.ci.oxnard.ca.us/page/22/963/
Measure C-10: Work with NCEW and PG&E to Expand Outreach
Priority: 1
Measure type: Education and outreach
Annual energy savings by 2020: Not applicable; supporting program
Implementation cost: <$50,000
Potential source of funding: To be determined
Implementation date: 2013
Responsibility: Community Development Department
Co-benefits: Promote education and develop green jobs in the City
Description and implementing actions: Sustainable Napa County (SNC) is a local initiative that offers tips and resources for reducing energy consumption, including links to the U.S. Green Building Council, U.S. Department of Energy, and Energy Star (SNC, 2012). Napa County Energy Watch (NCEW), a three-year program administered by SNC, was formed as a partnership between SNC and PG&E to bring energy efficiency and conservation resources, rebates and incentives to municipal and special district customers, nonprofits, and small commercial/businesses. SNC is also working with partners in the Napa County community on programs to reach residential customers, including promoting PG&E’s Energy Upgrade California Program.
3-20 American Canyon Energy Efficiency Climate Action Plan 3 Community Strategies and Measures
The City will work with NCEW and PG&E to expand education and outreach to developers, architects, students, contractors, and the community at large.
Implementing actions will include:
Coordinate with NCEW to promote comprehensive energy audits for small commercial customers, to provide education on how to understand energy use, and to use PG&E data (such as My Energy) to track changes in energy use. Use education efforts to motivate staff and building occupants to modify behavior to maintain and improve savings.
The City will meet with NCWE to learn more about how they interface with the development community, and how the City can help facilitate that coordination.
The City may appoint a person to attend NCEW and/or Sustainable Napa County meetings.
The City will include information about NCEW in outreach efforts coordinated under Measure C-1.
Promote local training of contractors and construction workers, perhaps in partnership with NCEW, to improve and expand local green building workforce. Establish a Green City Corps (or equivalent, using high school students, interns, etc.) to support NCEW’s lead in outreach and education, and perform simple energy efficiency projects.
Provide case studies from NCEW highlighting local businesses and residents that have successfully reduced energy use and related utility costs.
Case studies and/or supporting information: Additional information is available on the SNC website at http://www.sustainablenapacounty.org/. Information about PG&E’s free energy efficiency workshops, classes, and trainings is available at http://www.pge.com/myhome/ edusafety/workshopstraining/.
3.3.6 Renewable Energy
Increases in new solar photovoltaic (PV) renewable energy installations have been fairly steady in American Canyon’s Non-Residential sector, with an average of new PV installed on 1.3 new sites per year since 2003. In most years, PV was installed on no more than one non-residential site. However, in the Residential sector new solar PV installations have increased in recent years. Between 2002 and 2008, PV was installed on an average 1.7 residential sites per year. The number increased to an average of 9 new sites per year between 2009 and 2011, and the trend appears to be continuing into 2012.
The Housing Element of the City’s General Plan (2010) includes Policy 2.22.3, which states that the City will promote opportunities for the use of solar energy by assuring solar access by expediting solar installation through a ministerial review. Goal 8F in the Natural and Historic/Cultural Element states the City will support the development and utilization of new energy sources.
The EECAP strategy and measures provided below support the City’s General Plan, and include a mix of mandatory and voluntary, incentive-based approaches for promoting renewable energy in the community.

3 Community Strategies and Measures American Canyon Energy Efficiency Climate Action Plan 3-21
Community Strategy 6. Renewable Energy
Increase the number of distributed renewable energy installations on residential and Non-Residential properties to 3 new non-residential sites/year and 15 residential sites/year by 2020.
Measure C-11: Solar Ready Roofs for New Construction
Priority: 2
Measure type: Mandatory requirement
Annual energy savings by 2020: Indirect energy and GHG reductions; the measure itself does not result in direct reductions, but it facilitates future action that will.
Implementation cost: <$50,000
Potential source of funding: To be determined
Implementation date: 2014
Responsibility: Community Development Department: Building Division
Co-benefits: Reduces future installation costs
Description and implementing actions: For all new construction starting in 2014, building roofs must be constructed to readily accommodate the installation of installation of solar PV panels and solar water heating systems, including all necessary conduit, chases, roof penetrations, roof pitch, and roof orientation.
Implementing actions will include:
Develop a mandatory requirement by 2014 that will be applicable to all new construction.
Train city staff to enforce the mandatory requirement.
Case studies and/or supporting information: For examples of ‘Solar Ready’ ordinances, see http://www.planning.org/pas/infopackets/open/pdf/30part5.pdf. For information on solar water heating systems and rebates, see http://gosolarcalifornia.com/equipment/solar_water/.
Measure C-12: Promote the installation of Solar PV on Existing Buildings
Priority: 1
Measure type: Incentive
Annual energy savings by 2020: Electricity: 8,887,292 kWh Natural gas: 0 therms GHGs: 1,809 MTCO2e
Annual cost savings by 2020: $1,599,713
Implementation cost: $50,000-$250,000
Potential source of funding: PACE Program
Implementation date: 2014
Responsibility: Community Development
Co-benefits: Improved air quality, increased resilience
3-22 American Canyon Energy Efficiency Climate Action Plan 3 Community Strategies and Measures
Description and implementing actions: The City will promote new solar PV installations on existing buildings by providing and disseminating information on available state and federal rebates, solar leases, and Power Purchase Agreements (PPAs). The City will participate in a PACE program to provide additional financing opportunities.
Implementing actions will include:
Provide information on solar rebates and financing on the city’s webpage and other appropriate outlets. Review and update the website content on a semi-annual basis.
Provide information at local events.
Develop a local Property Assessed Clean Energy (PACE) for renewable energy program and provide information about PACE and other financing opportunities to property owners.
Case studies and/or supporting information: Currently, solar PV systems are estimated to have a payback period of 10-20 years. The total cost and payback are dependent on the size of the system, as well as the amount that electricity rates will rise in future years. Beyond a PACE program, which is described under Measure C-3, other financing tools are available for renewable energy.
A Solar PPA is a financial arrangement in which a third-party developer owns, operates, and maintains the PV system, and a host customer agrees to site the system on its roof or elsewhere on its property and purchases the system’s electric output from the solar services provider for a predetermined period. This financial arrangement allows the host customer to receive stable, and sometimes lower cost electricity than what is available from the utility, while the solar services provider or another party acquires valuable financial benefits such as tax credits and income generated from the sale of electricity to the host customer.
Current rebates are available for solar PV systems, of up to $0.20 per Watt installed. With an average system size of 4kw on residential sites and 17kw on non-residential sites, this rebate is equal to $800 and $3,400 for residential and commercial systems, respectively. Rebates are also available for solar hot water heating systems; a rebate of $1,875 is currently available for each single-family home, and up to $500,000 is available for multifamily residences or non-residential buildings.
Federal tax incentives equal to 30% of the cost of the system are available to residential homeowners; this tax credit can be used for a solar PV system, solar water heating system, geothermal heat pumps, small wind turbines, or fuel cells.
3.3.7 New Development – Water Conservation and Efficiency
Water conservation is an important issue to all communities in California, and will become even more critical with climate change. Although water does not directly emit GHGs, the transport, distribution, and treatment of water and wastewater all involve significant energy consumption. Therefore, reducing water use within American Canyon has multiple benefits for the City by reducing environmental impacts along with operational costs, as well as improving the outlook for the City’s long-term water security.
The City is actively working to reduce water demands through a variety of means. The American Canyon Urban Water Management Plan (UWMP) identifies policies that will reduce water
3 Community Strategies and Measures American Canyon Energy Efficiency Climate Action Plan 3-23
consumption and the energy associated with its transport, and identifies when, how, and with what measures the City will meet the State Legislature’s call for a 20 percent per capita reduction in urban water use statewide by 2020 (see Appendix C). Under the UWMP the City has implemented a recycled water project, adopted a zero water footprint policy, and adopted several administrative policies to promote the use of recycled water. Furthermore, the City’s municipal code includes several chapters that directly and indirectly influence energy related to water consumption, including establishing ordinances and policies requiring the installation of purple (i.e., recycled water) pipes, maximum allowable water usages, and a water conservation plan and guidelines.
In addition, the American Canyon General Plan provides myriad policies promoting water conservation and wastewater reuse, including but not limited to the following from the Utilities Element:
Policy 5.2.4: Promote water conservation and wastewater reclamation as additional water supply sources.
Objective 5.4: Establish a water management program to promote water conservation and wastewater reuse.
Policy 5.4.1: Promote the use of water-saving plumbing fixtures and water-saving landscaping.
Policy 5.4.2: Develop a rate schedule structured to promote water conservation.
Policy 5.4.3: Conduct a leak detection survey to identify water lost within the distribution system.
Policy 5.4.4: Investigate potential uses for and costs of supplying reclaimed wastewater.
Policy 5.4.5: Require that development projects consider the appropriateness of the channelization of storm water runoff to facilitate its possible capture and re-use for on-site irrigation and other purposes.
Policy 5.7.7: Develop a program of public education to encourage water conservation practices.
The following strategy and measure supports and enhance the City’s existing efforts to reduce water consumption and related energy usage within the community.
Community Strategy 7. Water Conservation
Reduce per capita community water use 20 percent by 2020 from the 2005 baseline.
Measure C-13: Community Water Reduction
Priority: 2
Measure type: Education and outreach; rebates and incentives
Annual energy savings by 2020: Low energy savings, but high water and cost savings benefits.
Implementation cost: <$50,000; a rebate program would add to implementation costs
Potential source of funding: To be determined

3-24 American Canyon Energy Efficiency Climate Action Plan 3 Community Strategies and Measures
Implementation date: 2013
Responsibility: Public Works Department
Co-benefits: Cost savings from water reduction, lower maintenance of landscaping, improved long-term water security in the City
Description and implementing actions: The City will strive to reduce community water use through building and landscape design and improvements.
Implementing actions will include:
Work with SNC and the City of Napa to expand the Water Wise Home Survey Program to American Canyon to provide water system audits to residents and businesses.
Increase promotion of the City’s ultra-low flush toilet rebate program by putting information on the City’s website and sending flyers to local businesses and residences.
Review and update the website content on a semi-annual basis.
Include information in semi-annual outreach efforts as described under Measure C-1.
Strive to double program participation from 2013 levels by 2015, and triple participation by 2020.
Consider developing rebate programs for low-flow shower heads and aerators, and/or providing City water customers with free indoor water conservation devices.
Increase awareness of rebates and incentives for water efficient appliances and fixtures, efficient residential landscapes, gray-water systems, and high-efficiency commercial irrigation systems.
Work with the Blue Ribbon Committee on Water Resources as a key group to identify ways to reduce both water and energy use and to conduct appropriate outreach to the community. Ensure that at least one person from the City’s Green Team attends the Blue Ribbon Committee on Water Resources at least once per quarter.
Case studies and/or supporting information: Additional information is available on the Napa Water Wise Home Survey Program webpage at http://www.cityofnapa.org/index.php? option=com_content&view=article&id=435&Itemid=574.
4 Municipal Strategies and Measures American Canyon Energy Efficiency Climate Action Plan 4-1
4. Municipal Strategies and Measures
This chapter presents 5 overarching strategies and 10 measures to help the City reduce its municipal energy use and reach its municipal energy-related GHG reduction target of 15 percent below 2005 baseline levels. These strategies and measures were developed based on historic and projected energy use trends for municipal facilities. The strategies and measures build upon the success of previously implemented municipal projects, and are designed to increase participation in existing programs that lead to energy efficiency and new renewable energy sources, as well as create new programs to address energy uses not currently served by existing initiatives.
4.1 Municipal Energy Reduction Opportunities
As described in Chapter 2, between 2005 and 2010, energy use for American Canyon municipal operations increased significantly. Electricity use nearly doubled, primarily due to the addition of new municipal facilities. Natural gas use increased more than ten-fold because of the addition of two gas service facilities and one small general service facility. The City anticipates growth in residential population and local jobs by 2020; if current projections prove to be correct, then municipal operations and its associated energy use can be expected to increase to support that growth.
In the last several years the City has participated in a number of initiatives related to improving energy performance for municipal facilities, and developed ordinances and plans to support reductions in energy use. Appendix C provides a summary of the existing policies, programs, and plans related to energy performance and energy efficiency in the City, such as the City’s Urban Water Management Plan (UWMP), relevant sections of municipal code, and City participation in PG&E programs such as the California Wastewater Process Optimization (CalPOP) Project for its
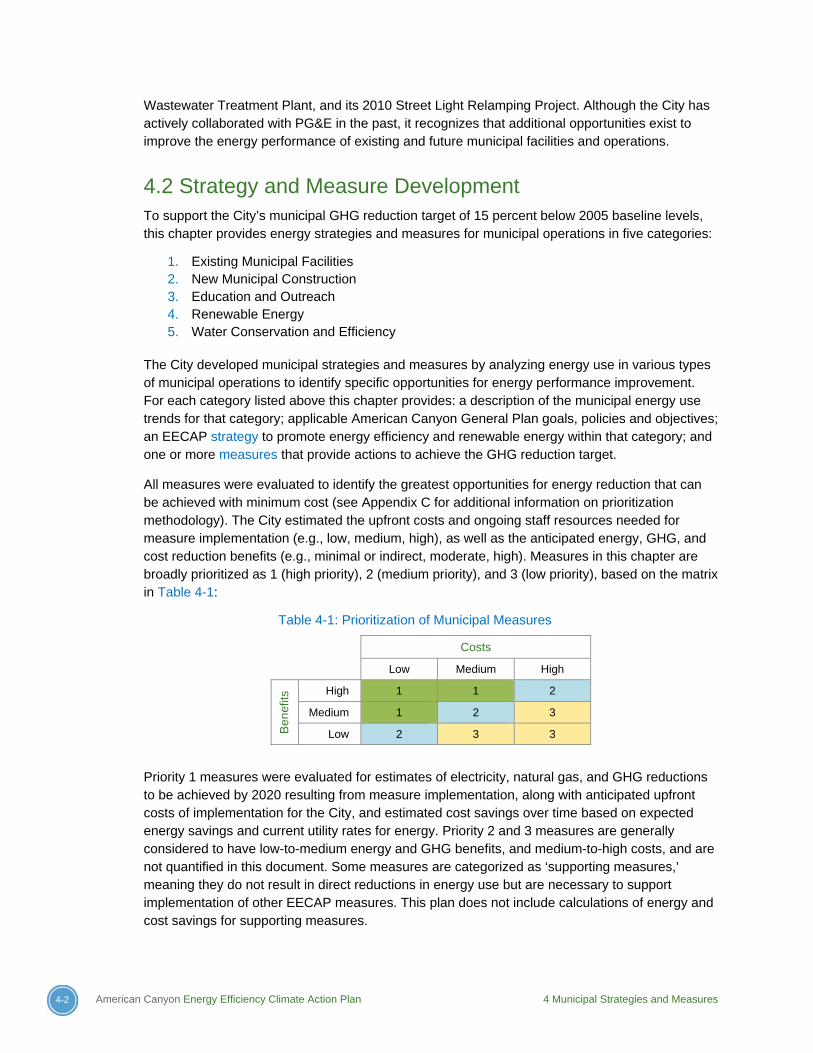
4-2 American Canyon Energy Efficiency Climate Action Plan 4 Municipal Strategies and Measures
Wastewater Treatment Plant, and its 2010 Street Light Relamping Project. Although the City has actively collaborated with PG&E in the past, it recognizes that additional opportunities exist to improve the energy performance of existing and future municipal facilities and operations.
4.2 Strategy and Measure Development To support the City’s municipal GHG reduction target of 15 percent below 2005 baseline levels, this chapter provides energy strategies and measures for municipal operations in five categories:
1. Existing Municipal Facilities 2. New Municipal Construction 3. Education and Outreach 4. Renewable Energy 5. Water Conservation and Efficiency
The City developed municipal strategies and measures by analyzing energy use in various types of municipal operations to identify specific opportunities for energy performance improvement. For each category listed above this chapter provides: a description of the municipal energy use trends for that category; applicable American Canyon General Plan goals, policies and objectives; an EECAP strategy to promote energy efficiency and renewable energy within that category; and one or more measures that provide actions to achieve the GHG reduction target.
All measures were evaluated to identify the greatest opportunities for energy reduction that can be achieved with minimum cost (see Appendix C for additional information on prioritization methodology). The City estimated the upfront costs and ongoing staff resources needed for measure implementation (e.g., low, medium, high), as well as the anticipated energy, GHG, and cost reduction benefits (e.g., minimal or indirect, moderate, high). Measures in this chapter are broadly prioritized as 1 (high priority), 2 (medium priority), and 3 (low priority), based on the matrix in Table 4-1:
Table 4-1: Prioritization of Municipal Measures
Costs
Low Medium High
Ben
efits
High 1 1 2
Medium 1 2 3
Low 2 3 3
Priority 1 measures were evaluated for estimates of electricity, natural gas, and GHG reductions to be achieved by 2020 resulting from measure implementation, along with anticipated upfront costs of implementation for the City, and estimated cost savings over time based on expected energy savings and current utility rates for energy. Priority 2 and 3 measures are generally considered to have low-to-medium energy and GHG benefits, and medium-to-high costs, and are not quantified in this document. Some measures are categorized as ‘supporting measures,’ meaning they do not result in direct reductions in energy use but are necessary to support implementation of other EECAP measures. This plan does not include calculations of energy and cost savings for supporting measures.
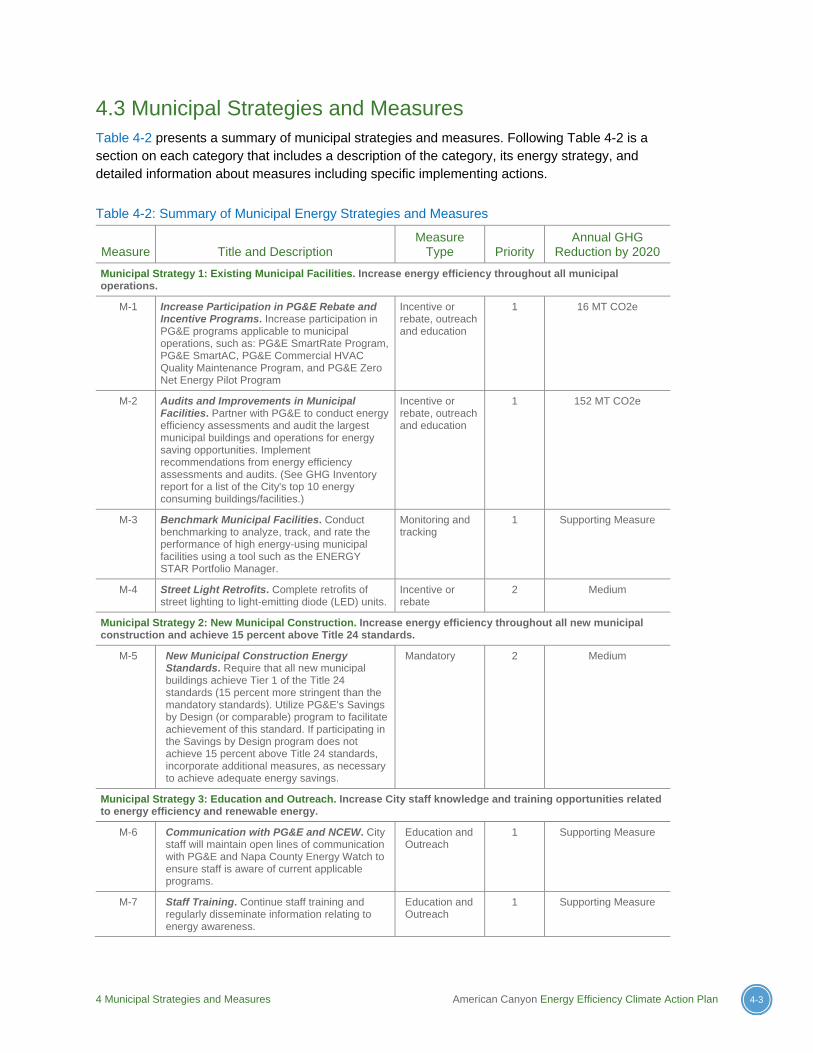
4 Municipal Strategies and Measures American Canyon Energy Efficiency Climate Action Plan 4-3
4.3 Municipal Strategies and Measures
Table 4-2 presents a summary of municipal strategies and measures. Following Table 4-2 is a section on each category that includes a description of the category, its energy strategy, and detailed information about measures including specific implementing actions.
Table 4-2: Summary of Municipal Energy Strategies and Measures
Measure Title and Description Measure
Type Priority Annual GHG
Reduction by 2020
Municipal Strategy 1: Existing Municipal Facilities. Increase energy efficiency throughout all municipal operations.
M-1 Increase Participation in PG&E Rebate and Incentive Programs. Increase participation in PG&E programs applicable to municipal operations, such as: PG&E SmartRate Program, PG&E SmartAC, PG&E Commercial HVAC Quality Maintenance Program, and PG&E Zero Net Energy Pilot Program
Incentive or rebate, outreach and education
1 16 MT CO2e
M-2 Audits and Improvements in Municipal Facilities. Partner with PG&E to conduct energy efficiency assessments and audit the largest municipal buildings and operations for energy saving opportunities. Implement recommendations from energy efficiency assessments and audits. (See GHG Inventory report for a list of the City's top 10 energy consuming buildings/facilities.)
Incentive or rebate, outreach and education
1 152 MT CO2e
M-3 Benchmark Municipal Facilities. Conduct benchmarking to analyze, track, and rate the performance of high energy-using municipal facilities using a tool such as the ENERGY STAR Portfolio Manager.
Monitoring and tracking
1 Supporting Measure
M-4 Street Light Retrofits. Complete retrofits of street lighting to light-emitting diode (LED) units.
Incentive or rebate
2 Medium
Municipal Strategy 2: New Municipal Construction. Increase energy efficiency throughout all new municipal construction and achieve 15 percent above Title 24 standards.
M-5 New Municipal Construction Energy Standards. Require that all new municipal buildings achieve Tier 1 of the Title 24 standards (15 percent more stringent than the mandatory standards). Utilize PG&E's Savings by Design (or comparable) program to facilitate achievement of this standard. If participating in the Savings by Design program does not achieve 15 percent above Title 24 standards, incorporate additional measures, as necessary to achieve adequate energy savings.
Mandatory 2 Medium
Municipal Strategy 3: Education and Outreach. Increase City staff knowledge and training opportunities related to energy efficiency and renewable energy.
M-6 Communication with PG&E and NCEW. City staff will maintain open lines of communication with PG&E and Napa County Energy Watch to ensure staff is aware of current applicable programs.
Education and Outreach
1 Supporting Measure
M-7 Staff Training. Continue staff training and regularly disseminate information relating to energy awareness.
Education and Outreach
1 Supporting Measure
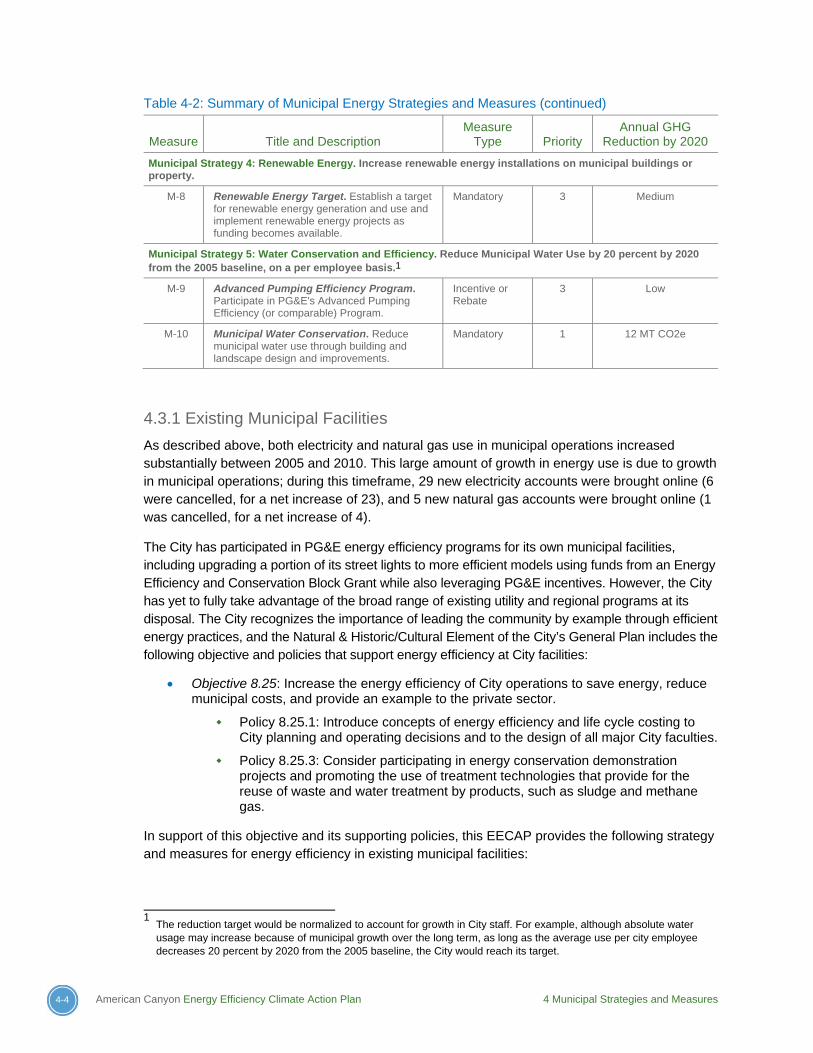
4-4 American Canyon Energy Efficiency Climate Action Plan 4 Municipal Strategies and Measures
Table 4-2: Summary of Municipal Energy Strategies and Measures (continued)
Measure Title and Description Measure
Type Priority Annual GHG
Reduction by 2020
Municipal Strategy 4: Renewable Energy. Increase renewable energy installations on municipal buildings or property.
M-8 Renewable Energy Target. Establish a target for renewable energy generation and use and implement renewable energy projects as funding becomes available.
Mandatory 3 Medium
Municipal Strategy 5: Water Conservation and Efficiency. Reduce Municipal Water Use by 20 percent by 2020 from the 2005 baseline, on a per employee basis.1
M-9 Advanced Pumping Efficiency Program. Participate in PG&E's Advanced Pumping Efficiency (or comparable) Program.
Incentive or Rebate
3 Low
M-10 Municipal Water Conservation. Reduce municipal water use through building and landscape design and improvements.
Mandatory 1 12 MT CO2e
4.3.1 Existing Municipal Facilities
As described above, both electricity and natural gas use in municipal operations increased substantially between 2005 and 2010. This large amount of growth in energy use is due to growth in municipal operations; during this timeframe, 29 new electricity accounts were brought online (6 were cancelled, for a net increase of 23), and 5 new natural gas accounts were brought online (1 was cancelled, for a net increase of 4).
The City has participated in PG&E energy efficiency programs for its own municipal facilities, including upgrading a portion of its street lights to more efficient models using funds from an Energy Efficiency and Conservation Block Grant while also leveraging PG&E incentives. However, the City has yet to fully take advantage of the broad range of existing utility and regional programs at its disposal. The City recognizes the importance of leading the community by example through efficient energy practices, and the Natural & Historic/Cultural Element of the City’s General Plan includes the following objective and policies that support energy efficiency at City facilities:
Objective 8.25: Increase the energy efficiency of City operations to save energy, reduce municipal costs, and provide an example to the private sector.
Policy 8.25.1: Introduce concepts of energy efficiency and life cycle costing to City planning and operating decisions and to the design of all major City faculties.
Policy 8.25.3: Consider participating in energy conservation demonstration projects and promoting the use of treatment technologies that provide for the reuse of waste and water treatment by products, such as sludge and methane gas.
In support of this objective and its supporting policies, this EECAP provides the following strategy and measures for energy efficiency in existing municipal facilities:
1
The reduction target would be normalized to account for growth in City staff. For example, although absolute water usage may increase because of municipal growth over the long term, as long as the average use per city employee decreases 20 percent by 2020 from the 2005 baseline, the City would reach its target.

4 Municipal Strategies and Measures American Canyon Energy Efficiency Climate Action Plan 4-5
Municipal Strategy 1. Existing Municipal Facilities
Increase energy efficiency throughout all municipal operations.
Measure M-1: Increase Participation in PG&E Rebate and Incentive Programs
Priority: 1
Measure Type: Incentive or rebate; outreach and education
Annual energy savings by 2020: Electricity: 57,606 kWh Natural gas: 897 therms GHGs: 16 MTCO2e
Annual cost savings by 2020: $11,204
Implementation cost: $50,000-$250,000
Potential source of funding: PG&E programs
Implementation date: 2013
Responsibility: Public Works Department
Co-Benefits: Reduced maintenance costs, reduced water usage, increased indoor comfort in municipal buildings
Description and Implementing Actions: The City will increase participation in PG&E energy efficiency and demand response programs applicable to municipal operations, such as: PG&E SmartRate Program, PG&E SmartAC, PG&E Commercial HVAC Quality Maintenance Program, and PG&E Zero Net Energy Pilot Program. While specific PG&E programs and rebates available might change from year to year, numerous options are typically available that target different technologies and different types of buildings, including:
Indoor lighting upgrades
Outdoor lighting upgrades, including street lights
HVAC motors and pumps
Package terminal air conditioner and heat pumps
Lighting controls, such as occupancy sensors
Refrigeration equipment
Water pumping
Business computing
Participation in Demand Response
Implementing actions will include:
Meet quarterly with the PG&E account representative to discuss additional or alternate appropriate programs, incentives, and rebates available for municipal operations, particularly as programs change and evolve over time. Continue regular discussions and communication with PG&E as needed.
Consider energy efficiency improvements during annual municipal budget planning.
Document savings from each program, incentive or rebate (annually).
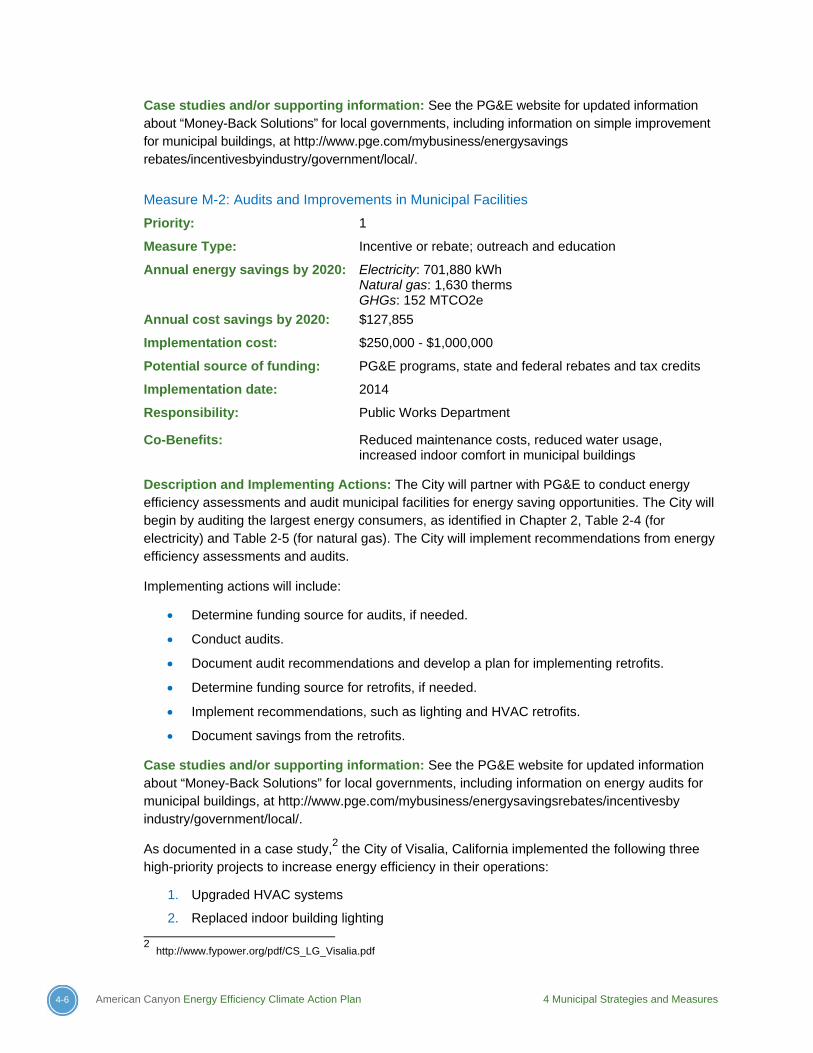
4-6 American Canyon Energy Efficiency Climate Action Plan 4 Municipal Strategies and Measures
Case studies and/or supporting information: See the PG&E website for updated information about “Money-Back Solutions” for local governments, including information on simple improvement for municipal buildings, at http://www.pge.com/mybusiness/energysavings rebates/incentivesbyindustry/government/local/.
Measure M-2: Audits and Improvements in Municipal Facilities
Priority: 1
Measure Type: Incentive or rebate; outreach and education
Annual energy savings by 2020: Electricity: 701,880 kWh Natural gas: 1,630 therms GHGs: 152 MTCO2e
Annual cost savings by 2020: $127,855
Implementation cost: $250,000 - $1,000,000
Potential source of funding: PG&E programs, state and federal rebates and tax credits
Implementation date: 2014
Responsibility: Public Works Department
Co-Benefits: Reduced maintenance costs, reduced water usage, increased indoor comfort in municipal buildings
Description and Implementing Actions: The City will partner with PG&E to conduct energy efficiency assessments and audit municipal facilities for energy saving opportunities. The City will begin by auditing the largest energy consumers, as identified in Chapter 2, Table 2-4 (for electricity) and Table 2-5 (for natural gas). The City will implement recommendations from energy efficiency assessments and audits.
Implementing actions will include:
Determine funding source for audits, if needed.
Conduct audits.
Document audit recommendations and develop a plan for implementing retrofits.
Determine funding source for retrofits, if needed.
Implement recommendations, such as lighting and HVAC retrofits.
Document savings from the retrofits.
Case studies and/or supporting information: See the PG&E website for updated information about “Money-Back Solutions” for local governments, including information on energy audits for municipal buildings, at http://www.pge.com/mybusiness/energysavingsrebates/incentivesby industry/government/local/.
As documented in a case study,2 the City of Visalia, California implemented the following three high-priority projects to increase energy efficiency in their operations:
1. Upgraded HVAC systems
2. Replaced indoor building lighting 2
http://www.fypower.org/pdf/CS_LG_Visalia.pdf
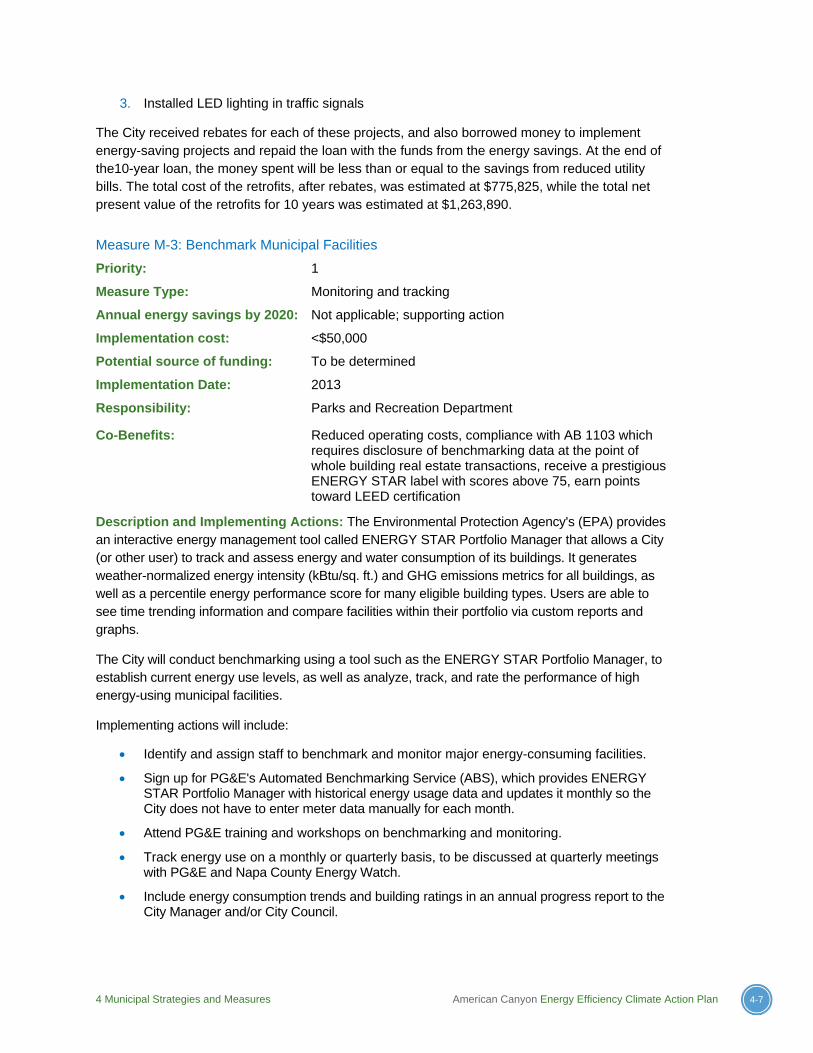
4 Municipal Strategies and Measures American Canyon Energy Efficiency Climate Action Plan 4-7
3. Installed LED lighting in traffic signals
The City received rebates for each of these projects, and also borrowed money to implement energy-saving projects and repaid the loan with the funds from the energy savings. At the end of the10-year loan, the money spent will be less than or equal to the savings from reduced utility bills. The total cost of the retrofits, after rebates, was estimated at $775,825, while the total net present value of the retrofits for 10 years was estimated at $1,263,890.
Measure M-3: Benchmark Municipal Facilities
Priority: 1
Measure Type: Monitoring and tracking
Annual energy savings by 2020: Not applicable; supporting action
Implementation cost: <$50,000
Potential source of funding: To be determined
Implementation Date: 2013
Responsibility: Parks and Recreation Department
Co-Benefits: Reduced operating costs, compliance with AB 1103 which requires disclosure of benchmarking data at the point of whole building real estate transactions, receive a prestigious ENERGY STAR label with scores above 75, earn points toward LEED certification
Description and Implementing Actions: The Environmental Protection Agency's (EPA) provides an interactive energy management tool called ENERGY STAR Portfolio Manager that allows a City (or other user) to track and assess energy and water consumption of its buildings. It generates weather-normalized energy intensity (kBtu/sq. ft.) and GHG emissions metrics for all buildings, as well as a percentile energy performance score for many eligible building types. Users are able to see time trending information and compare facilities within their portfolio via custom reports and graphs.
The City will conduct benchmarking using a tool such as the ENERGY STAR Portfolio Manager, to establish current energy use levels, as well as analyze, track, and rate the performance of high energy-using municipal facilities.
Implementing actions will include:
Identify and assign staff to benchmark and monitor major energy-consuming facilities.
Sign up for PG&E's Automated Benchmarking Service (ABS), which provides ENERGY STAR Portfolio Manager with historical energy usage data and updates it monthly so the City does not have to enter meter data manually for each month.
Attend PG&E training and workshops on benchmarking and monitoring.
Track energy use on a monthly or quarterly basis, to be discussed at quarterly meetings with PG&E and Napa County Energy Watch.
Include energy consumption trends and building ratings in an annual progress report to the City Manager and/or City Council.
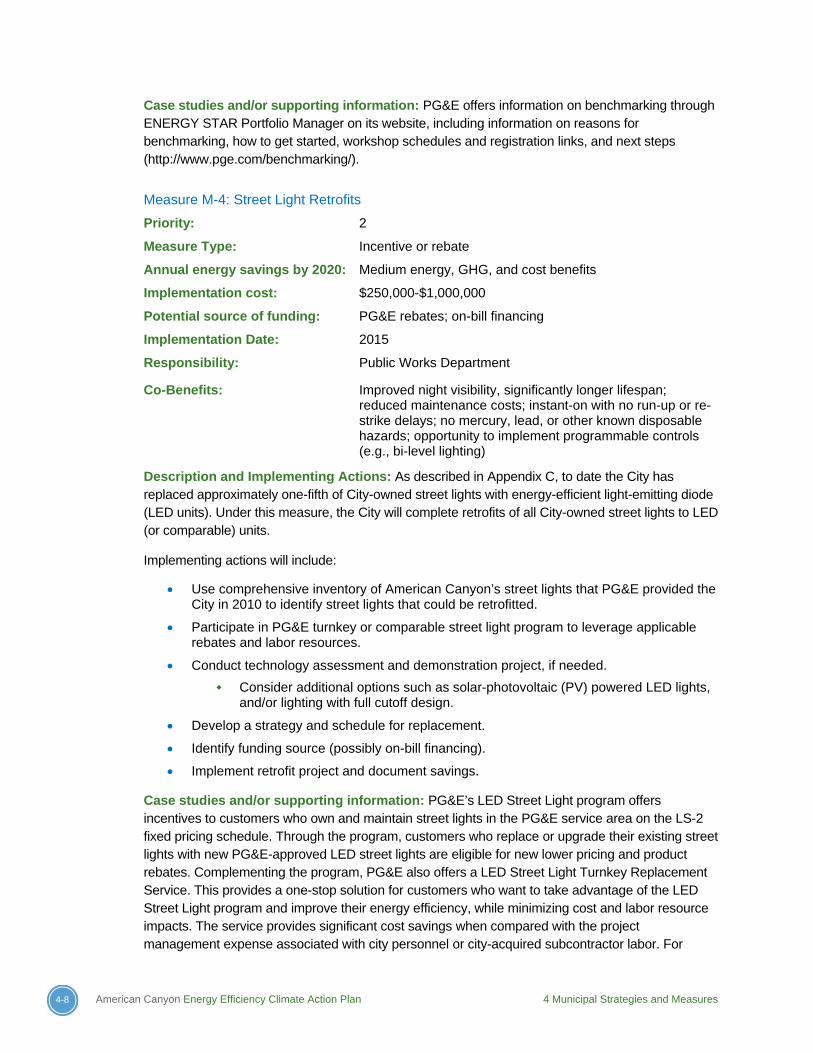
4-8 American Canyon Energy Efficiency Climate Action Plan 4 Municipal Strategies and Measures
Case studies and/or supporting information: PG&E offers information on benchmarking through ENERGY STAR Portfolio Manager on its website, including information on reasons for benchmarking, how to get started, workshop schedules and registration links, and next steps (http://www.pge.com/benchmarking/).
Measure M-4: Street Light Retrofits
Priority: 2
Measure Type: Incentive or rebate
Annual energy savings by 2020: Medium energy, GHG, and cost benefits
Implementation cost: $250,000-$1,000,000
Potential source of funding: PG&E rebates; on-bill financing
Implementation Date: 2015
Responsibility: Public Works Department
Co-Benefits: Improved night visibility, significantly longer lifespan; reduced maintenance costs; instant-on with no run-up or re-strike delays; no mercury, lead, or other known disposable hazards; opportunity to implement programmable controls (e.g., bi-level lighting)
Description and Implementing Actions: As described in Appendix C, to date the City has replaced approximately one-fifth of City-owned street lights with energy-efficient light-emitting diode (LED units). Under this measure, the City will complete retrofits of all City-owned street lights to LED (or comparable) units.
Implementing actions will include:
Use comprehensive inventory of American Canyon’s street lights that PG&E provided the City in 2010 to identify street lights that could be retrofitted.
Participate in PG&E turnkey or comparable street light program to leverage applicable rebates and labor resources.
Conduct technology assessment and demonstration project, if needed.
Consider additional options such as solar-photovoltaic (PV) powered LED lights, and/or lighting with full cutoff design.
Develop a strategy and schedule for replacement.
Identify funding source (possibly on-bill financing).
Implement retrofit project and document savings.
Case studies and/or supporting information: PG&E’s LED Street Light program offers incentives to customers who own and maintain street lights in the PG&E service area on the LS-2 fixed pricing schedule. Through the program, customers who replace or upgrade their existing street lights with new PG&E-approved LED street lights are eligible for new lower pricing and product rebates. Complementing the program, PG&E also offers a LED Street Light Turnkey Replacement Service. This provides a one-stop solution for customers who want to take advantage of the LED Street Light program and improve their energy efficiency, while minimizing cost and labor resource impacts. The service provides significant cost savings when compared with the project management expense associated with city personnel or city-acquired subcontractor labor. For
4 Municipal Strategies and Measures American Canyon Energy Efficiency Climate Action Plan 4-9
additional information see the PG&E website at http://www.pge.com/ mybusiness/energysavingsrebates/rebatesincentives/ref/lighting/lightemittingdiodes/ledturnkey/.
Another option is to replace street lights with solar-PV powered LED lights. This combination of technologies can help save energy and reduce energy costs. However, according to a report from the Department of Energy (DOE),3 there are some challenges to using these technologies. Weather conditions and geographic location can limit the how much solar power can be collected and solar power systems must be designed to handle extended cloudy or stormy periods. Responding to this challenge involves careful battery capacity design; auxiliary electrical grid connection may also be required. Another key challenge is cost. Solar panels and batteries are expensive when compared to electrical grid systems. However, continued improvements to both PV and LED technology can reduce the costs. In general, the DOE recommends PV lighting be considered for remote sites not yet served by power lines, and for locations that require low levels of light and that are more than 50 feet from a power sources (e.g., signs and bus shelter lights).4
The City of American Canyon likely does not currently have suitable sites for solar PV-powered LED street lights, as most lighting locations are easily tied to the electrical grid. The City will continue to evaluate the cost effectiveness of this option as the technologies improve and as costs are reduced.
Lighting classified as “full cutoff” limits light pollution by shielding light from being emitted above the fixture. Full cutoff lights have zero intensity at or above horizontal (90 degrees above nadir, or the light pole), and are limited to a value not exceeding 10 percent of lamp lumens at or above 80 degrees from the light pole. In addition to limiting spill light and reducing glare, benefits of full cutoff lighting can include energy benefits from reducing over-illumination, and saving money that was being used to light up the sky.5
4.3.2 New Municipal Construction
Although the City has no immediate plans to construct new municipal facilities, new construction in the municipal operations sector could be required in the future to support anticipated growth in the City’s population and local economy. New construction might include facilities such as new fire stations, libraries, recreation facilities, and more.
The Natural & Historic/Cultural Element of the City’s General Plan includes Policy 8.23.2, which requires that new City buildings be energy efficient. The strategy and measure provided below build upon Policy 8.23.2 by including specific actions to achieve energy efficiency.
3 DOE, Pacific Northwest National Laboratory. Solar Powered Exterior LED Lighting Systems: Considerations for Federal
Energy Managers. August 2011. Available at http://www1.eere.energy.gov/femp/pdfs/ssl_lighting_systems.pdf
4 DOE EERE. 2001. Greening Federal Facilities: An Energy, Environmental, and Economic Resource Guide for Federal Facility Managers and Designers. May 2001. U.S. Department of Energy, Office of Energy Efficiency and Renewable Energy, Washington, D.C. Available at http://www1.eere.energy.gov/femp/pdfs/29267.pdf. 5 My LED Lighting Guide: The Complete Guide to LED Street Lights – Part 1. Available at:
http://www.myledlightingguide.com/Article.aspx?ArticleID=33.
4-10 American Canyon Energy Efficiency Climate Action Plan 4 Municipal Strategies and Measures
Municipal Strategy 2: New Municipal Construction.
Increase energy efficiency throughout all new municipal construction and achieve 15 percent above Title 24 standards.
Measure M-5: New Municipal Construction Energy Standards
Priority: 2
Measure Type: Mandatory
Annual energy savings by 2020: Medium energy and GHG benefits. High cost benefits.
Implementation cost: $50,000-$250,000
Potential source of funding: To be determined
Implementation Date: 2014
Responsibility: Public Works Department
Co-Benefits: Reduced maintenance costs, reduced water usage, increased indoor comfort in buildings, increased community energy knowledge and training
Description and Implementing Actions: The City will require that all new municipal buildings achieve Tier 1 of the Title 24 standards (15 percent more stringent than the mandatory standards). The City will utilize PG&E's Savings by Design (or comparable) program to facilitate achievement of this standard. If participating in the Savings by Design program does not achieve 15 percent above Title 24 standards, the City will incorporate additional measures as necessary to achieve adequate energy savings.
As described in Chapter 3, this EECAP also contains a community measure requiring participation in PG&E’s Savings By Design Program for all new non-residential construction (Measure C-6), and measures requiring Tier 1 of the Title 24 standards for all new development in the City (see Measures C-7, and C-8). The City will lead by example by ensuring that its own facilities comply with these requirements prior to the adoption of community-wide measures.
Implementing actions will include:
Contact PG&E program representative prior to design of the new facility.
Incorporate appropriate design features, such as passive solar techniques, into all new facilities.
Incorporate additional measures if necessary to achieve Tier 1 of the Title 24 standards.
See the US Green Building Council’s LEED for New Construction program for recommended energy efficient design and construction practices.
Calculate resulting savings from energy efficiency measures in kWh, therms, and dollars per year.
Showcase all new energy efficient buildings; conduct outreach to the community to educate others on energy reductions that are possible in new facilities, as well as associated cost savings.
Case studies and/or supporting information: Sonoma State University’s Salazar Hall reduced its energy usage by 42.7 percent through participation in PG&E’s energy-efficiency programs,

4 Municipal Strategies and Measures American Canyon Energy Efficiency Climate Action Plan 4-11
including Savings By Design. Additional information on the Savings By Design Program is available by calling the Savings By Design team at 415-973-3803, or by visiting PG&E’s website at http://www.pge.com/mybusiness/energysavingsrebates/rebatesincentives/inc/.
4.3.3 Education and Outreach
While City staff have experience implementing energy efficiency through various programs and projects, additional energy reductions are possible through ongoing training and education. Moreover, Policy 8.24.2 of the City’s General Plan Natural & Historic/Cultural Element requires the City to develop public and/or public-private energy conservation educational programs for City employees and the public.
The following strategy and measure provide an education and outreach-based approach to increasing City staff knowledge about energy efficiency and renewable energy opportunities.
Municipal Strategy 3. Education and Outreach
Increase City staff knowledge and training opportunities related to energy efficiency and renewable energy.
Measure M-6: Communication with PG&E and NCEW
Priority: 1
Measure Type: Outreach and education
Annual energy savings by 2020: Supporting measure
Implementation cost: <$50,000
Potential source of funding: To be determined
Implementation Date: 2013
Responsibility: Community Development Department
Co-Benefits: Increased community energy knowledge and training; leveraging existing resources; demonstrating leadership
Description and Implementing Actions: Given the wide range of existing energy efficiency and renewable energy programs, and the rate at which programs, rebates, and incentives change, City staff will maintain open lines of communication with PG&E and SNC/NCEW to ensure staff is always aware of current applicable programs.
Implementing actions will include:
Develop appropriate points-of-contact in various City departments with PG&E and SNC/NCEW representatives.
Conduct quarterly meetings with PG&E and SNC/NCEW to track progress, and ensure the City remains up-to-date regarding available or upcoming programs and opportunities.
Case studies and/or supporting information: American Canyon’s PG&E Account Executive is Allan Lacson, who can be reached at 707-648-5675, or [email protected]. Additional information on SNC is available on the SNC website at http://www.sustainablenapacounty.org/, or by contacting Sally Seymour at [email protected].
4-12 American Canyon Energy Efficiency Climate Action Plan 4 Municipal Strategies and Measures
Measure M-7: Staff Training
Priority: 1
Measure Type: Education and outreach
Annual energy savings by 2020: Supporting measure
Implementation cost: <$50,000
Potential source of funding: To be determined
Implementation Date: 2014
Responsibility: Parks and Recreation, Community Development, and Public Works Departments
Co-Benefits: Increased community energy knowledge and training; leveraging existing resources; demonstrating leadership
Description and Implementing Actions: To ensure the City remains up-to-date regarding energy efficiency and renewable energy best practices, the City will continue staff training and regularly disseminate information relating to energy awareness.
Implementing actions will include:
Utilize free PG&E trainings to educate building department and/or other applicable City staff on new CALGreen codes.
Identify staff training needs to support continuous improvement in energy performance related to municipal operations, based on results of energy audits.
Compile free or low-cost training resources for energy efficiency topics and disseminate to city staff.
Work with PG&E, NCEW and other groups to facilitate at least one training session per year on appropriate topics, such as benchmarking, or additional energy efficiency opportunities within facility operations at American Canyon.
Case studies and/or supporting information: Additional information about PG&E’s free energy efficiency workshops, classes, and trainings is available at http://www.pge.com/myhome/ edusafety/workshopstraining/.
4.3.4 Renewable Energy
The City does not currently have any renewable energy installations on City property or infrastructure. However, the City owns and operates a number of facilities that have available roof space for solar PV systems, as well as parking facilities with the potential for canopy structures. Installations in surface lots provide additional shaded parking areas for City employees and visitors, and increase PV visibility. On a larger scale, solar canopies can reduce a site's contribution to the local "urban heat island" effect, where heat is retained by paved surfaces.
After implementing all feasible energy efficiency programs, the City will consider renewable energy as a viable option to reduce escalating energy costs and increase local generation of energy. The following strategy and measure support increased capacity of renewable energy within City operations, and support Policy 8.25.2 of the City’s General plan, which requires the City to work with other agencies and utility companies to develop safe, economical and renewable energy resources.
4 Municipal Strategies and Measures American Canyon Energy Efficiency Climate Action Plan 4-13
Municipal Strategy 4. Renewable Energy
Increase renewable energy installations on municipal buildings or property.
Measure M-8: Renewable Energy Target
Priority: 3
Measure Type: Mandatory
Annual energy savings by 2020: Medium energy and GHG benefits
Implementation cost: $250,000-$1,000,000
Potential source of funding: To be determined
Implementation Date: 2015
Responsibility: Public Works Department
Co-Benefits: Reduction of urban heat island effect, shaded parking areas, increase visibility of solar renewable energy
Description and Implementing Actions: The City will establish a target for renewable energy generation and use and implement renewable energy projects as funding becomes available.
Implementing actions will include:
Evaluate the feasibility of installing solar PV panels or vertical wind turbines at City-owned facilities.
For sites conducive to renewable energy projects, obtain bids from Power Purchase Agreement (PPA) firms to compare with an ownership model.
Identify opportunities for virtual net metering6 across multiple municipal facilities.
Develop an appropriate renewable generation capacity target (either percentage of total municipal energy used or a number of kW to be installed) based on the feasibility study.
Secure financing.
Install renewable energy generation technologies and track energy generation.
Require a solar feasibility (solar thermal and PV) study for all municipal re-roofing projects, new construction and major retrofits.
Case studies and/or supporting information: The City of San José, California, set a goal of providing 100 percent renewable electricity to City facilities by 2022. To achieve this goal, the City plans to install approximately 50 MW of solar installations around the City. Staff is evaluating proposals for solar installation partners, and is identifying the most feasible sites. Recent successes include:7
In December 2010, construction was completed on a 1.2 MW solar installation at the City's Central Service Yard at Senter Road and Phelan Ave, across from Kelley Park. The installation produces an estimated 1.8 million kWh of energy annually, which is
6
Virtual net metering is a tariff arrangement that enables a multi-meter property owner to allocate a solar system's energy credits to other tenants. The electricity does not flow directly to any tenant meter, but rather it feeds directly back onto the grid. The participating utility then allocates the kilowatt hours from the energy produced by the solar PV generating system to both the building owner's and tenants' individual utility accounts, based on a pre-arranged allocation agreement. For more information, see http://www.cpuc.ca.gov/PUC/energy/DistGen/vnm.htm 7
http://energy.sanjoseca.gov/municipal-energy/default.asp
4-14 American Canyon Energy Efficiency Climate Action Plan 4 Municipal Strategies and Measures
approximately 85% of the energy needs at the site. Under a solar PPA, the City of San José will purchase the energy produced from the solar PV system from SunEdison at predictable energy rates for 20 years. In return, SunEdison will finance, operate and maintain the system for that time period. The City of San José paid no upfront capital costs for the system.
At the Water Pollution Control Plant, the City plans to install a 1.4 MW fuel cell system (with an option to increase to a 2.8 MW system), fueled by a combination of waste gasses from the on-site digesters and the adjacent landfill. Environmental Services selected a team lead by UTS BioEnergy to develop a gas-cleaning system and fuel cell power plant to replace the plant's aging combustion engines. The new power plant will produce emission-free electricity and will provide additional heat to the plant for use in the wastewater treatment process.
4.3.5 Water Conservation and Efficiency
Over 86 percent of municipal energy use is attributed to water-related resources. As such, water conservation and efficiency represent a significant opportunity to reduce energy consumption at City facilities. The majority of water-related energy use (approximately 80 percent) is related to operation of the City’s Wastewater Treatment Plant. The remaining use is attributed to various water-related operations including pumping stations, sprinklers, and irrigation control.
The City is actively working to reduce water demands through a variety of means. As further described in Appendix C (Policy Gap Analysis), the American Canyon UWMP identifies policies that will reduce water consumption and the energy associated with its transport, and identifies when, how, and with what measures the City will meet the State Legislature’s call for a 20 percent per capita reduction in urban water use statewide by 2020. Pursuant to the UWMP the City has implemented a recycled water project, adopted a zero water footprint policy, and adopted several administrative policies to promote the use of recycled water. Furthermore, the City’s municipal code includes several chapters that directly and indirectly influence energy related to water consumption, including establishing ordinances and policies requiring the installation of purple (i.e., recycled water) pipes, maximum allowable water usages, and a water conservation plan and guidelines.
In addition, in 2012 the American Canyon Wastewater Treatment Plant participated in the California Wastewater Process Optimization (CalPOP) Program. CalPOP provides no-cost engineering services to identify energy saving measures, and provides incentives for the installation of measures that improve wastewater processes, reduce operating costs and save energy. This program resulted in a savings of 800,000 kWh/year at the American Canyon Wastewater Treatment Plant.
Finally, the American Canyon General Plan provides myriad policies promoting water conservation and wastewater reuse, including but not limited to the following from the Utilities Element:
Policy 5.2.4: Promote water conservation and wastewater reclamation as additional water supply sources.
Objective 5.4: Establish a water management program to promote water conservation and wastewater reuse.
Policy 5.4.1: Promote the use of water-saving plumbing fixtures and water-saving landscaping.
4 Municipal Strategies and Measures American Canyon Energy Efficiency Climate Action Plan 4-15
Policy 5.4.2: Develop a rate schedule structured to promote water conservation.
Policy 5.4.3: Conduct a leak detection survey to identify water lost within the distribution system.
Policy 5.4.4: Investigate potential uses for and costs of supplying reclaimed wastewater.
Policy 5.4.5: Require that development projects consider the appropriateness of the channelization of storm water runoff to facilitate its possible capture and re-use for on-site irrigation and other purposes.
Policy 5.7.7: Develop a program of public education to encourage water conservation practices.
The following strategy and measures support and enhance the City’s existing efforts to reduce municipal water consumption and related energy usage.
Municipal Strategy 5. Water Conservation and Efficiency
Reduce Municipal Water Use by 20 percent by 2020 from the 2005 baseline, on a per employee basis.8
Measure M-9: Advanced Pumping Efficiency Program
Priority: 3
Measure Type: Incentive or Rebate
Annual energy savings by 2020: Low energy and GHG savings
Implementation cost: To be determined
Potential source of funding: To be determined
Implementation Date: 2015
Responsibility: Public Works Department
Co-Benefits: Improved air and water quality
Description and Implementing Actions: PG&E is funding the Advanced Pumping Efficiency program (APEP) through 2012 using the Public Purpose Programs Fund under the auspices of the CPUC. Eligibility includes all owners or users of a non-residential, PG&E electric or natural gas account that is primarily used for pumping water for the following: production agriculture; landscape or turf irrigation; municipal purposes, including potable and tertiary-treated (reclaimed) water but excluding pumps used for industrial processes, raw sewage, or secondary-treated sewage.
APEP is a continuing effort by the Center for Irrigation Technology, intended as a multi-level program addressing the important resource management problems in California including energy and water conservation, water quality and air quality. The goals of APEP are:
Get highly efficient hardware in the field, including pumping plants, irrigation systems, and water distribution systems.
Ensure that this hardware is managed correctly.
8
The reduction target would be normalized to account for growth in City staff. For example, although absolute water usage may increase because of municipal growth over the long term, as long as the average use per city employee decreases 20 percent by 2020 from the 2005 baseline, the City would reach its target.

4-16 American Canyon Energy Efficiency Climate Action Plan 4 Municipal Strategies and Measures
The City will participate in PG&E's APEP, or comparable program, assuming such a program is available in 2015, the identified year of implementation.
Implementing actions will include:
Work with PG&E account representatives to enroll in water-conservation programs for applicable municipal facilities.
Track water savings.
Case studies and/or supporting information: PG&E provides information about APEP on its website at http://www.pumpefficiency.org/.
Measure M-10: Municipal Water Conservation
Priority: 1
Measure Type: Incentive or Rebate
Annual energy savings by 2020: Electricity: 59,779 kWh Natural gas: 0 therms GHGs: 12 MTCO2e
Annual cost savings by 2020: $10,760
Implementation cost: $50,000-$250,000
Potential source of funding: PG&E programs, state and federal rebates and tax credits
Implementation Date: 2014
Responsibility: Public Works; Parks and Recreation
Co-Benefits: Reduced maintenance costs, reduced water usage
Description and Implementing Actions: The City will reduce municipal water use through building and landscape design and improvements. The City will determine appropriate drought-tolerant landscaping plantings, and develop building water fixture standards for existing and new municipal buildings that reduce water use per fixture.
Implementing actions will include:
Install “smart” water-efficient irrigation systems and devices for City parks and landscaping, such as soil moisture-based irrigation controls and water-efficient irrigation methods.
Require the installation of water conservation devices in new construction and major renovations (e.g., low-flow fixtures and toilets).
Case studies and/or supporting information: Outdoor water usage typically comprises 60 percent of water usage in most California cities. All new irrigation equipment should consider products that have earned the WaterSense label from the U.S. EPA. This label is only provided to products that are certified to reduce water by 20 percent without sacrificing performance. Furthermore, for irrigation, water efficiency must be considered from the initial irrigation system design phase through installation to ensure optimal performance. Consistent management and maintenance is also essential. Failure to do so can result in losing more than 50 percent of irrigation water due to evaporation, wind, poor management, and/or improper system design, installation, or maintenance. A case study from the Federal Energy Management Program
4 Municipal Strategies and Measures American Canyon Energy Efficiency Climate Action Plan 4-17
highlights the Ground Maintenance program of the Pacific Northwest National Laboratory (PNNL); this case study found that the PNNL was able to reduce water used for landscaping by 30 percent.9
The efficiency of indoor water usage can be addressed by replacing older fixtures, such as faucet aerators and toilets. Using the water fixture flow rates found in the LEED for Existing Buildings Standard, a set of buildings serving 80 employees that upgrades from the Uniform Plumbing Code water fixtures to high efficiency water fixtures would save 104,000 gallons per year.
9
http://www1.eere.energy.gov/femp/pdfs/water_pnnl.pdf
5 Implementation and Monitoring American Canyon Energy Efficiency Climate Action Plan 5-1
5. Implementation and Monitoring
Successful implementation of EECAP strategies and measures will require coordinated efforts
between City staff (in several departments) and residents, businesses, PG&E, and local non-
governmental organizations. The City is committed to working with these stakeholder groups to
ensure that measures are implemented effectively, efficiently, and in the time-frame necessary to
achieve the City’s 2020 GHG reduction target related to energy consumption.
This chapter provides a summary of how the EECAP measures, in conjunction with California
statewide actions, will contribute towards energy efficiency and reaching the City’s energy-related
GHG reduction target. The chapter then discusses implementation responsibility, outreach
channels the City will employ, and the City’s schedule for measure implementation, including first
steps. Finally, the chapter describes monitoring procedures, processes for updating the plan, and
other steps needed to ensure that measures are implemented and the City achieves its energy
goals and GHG reduction target.
5.1 Achieving the GHG Reduction Target
As described in Chapter 2, the City has set a 2020 energy-related GHG reduction target of
15 percent below 2005 baseline emissions for both the community and municipal operations. This
section describes how far the EECAP measures and state-wide measures will take the City
towards reaching that target. Because municipal emissions are captured in the community
inventory, this section focuses on community-wide emissions from energy use.
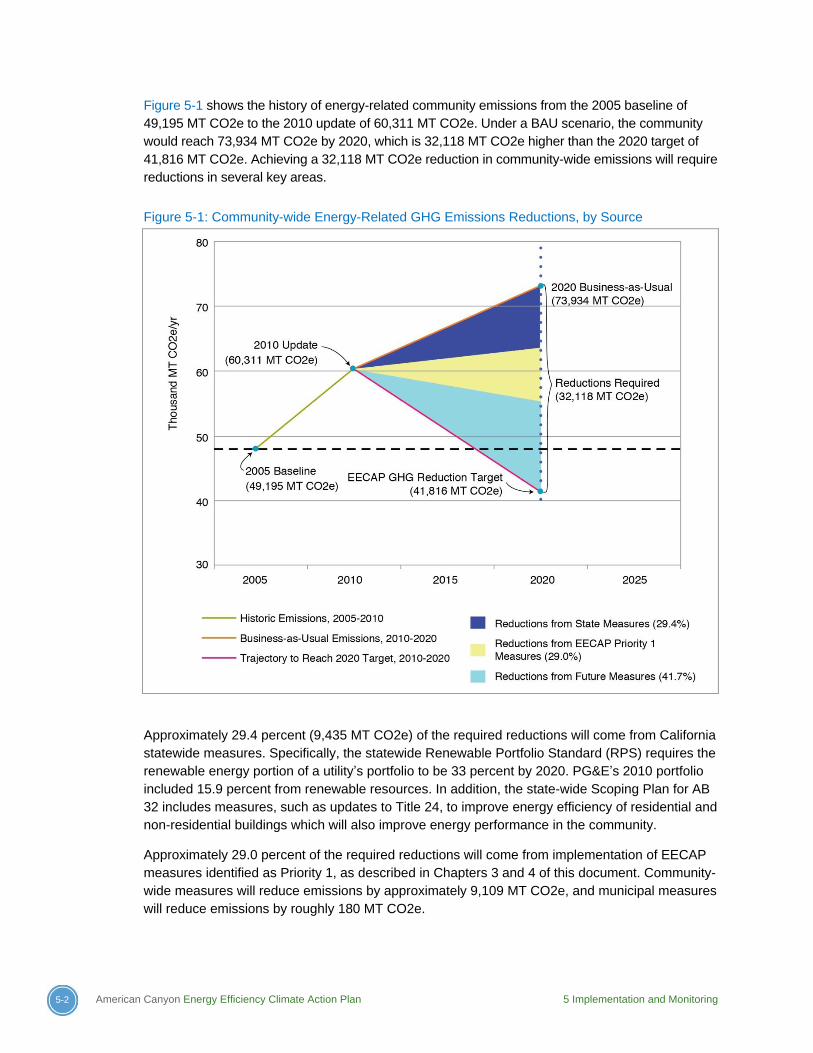
5-2 American Canyon Energy Efficiency Climate Action Plan 5 Implementation and Monitoring
Figure 5-1 shows the history of energy-related community emissions from the 2005 baseline of
49,195 MT CO2e to the 2010 update of 60,311 MT CO2e. Under a BAU scenario, the community
would reach 73,934 MT CO2e by 2020, which is 32,118 MT CO2e higher than the 2020 target of
41,816 MT CO2e. Achieving a 32,118 MT CO2e reduction in community-wide emissions will require
reductions in several key areas.
Figure 5-1: Community-wide Energy-Related GHG Emissions Reductions, by Source
Approximately 29.4 percent (9,435 MT CO2e) of the required reductions will come from California
statewide measures. Specifically, the statewide Renewable Portfolio Standard (RPS) requires the
renewable energy portion of a utility’s portfolio to be 33 percent by 2020. PG&E’s 2010 portfolio
included 15.9 percent from renewable resources. In addition, the state-wide Scoping Plan for AB
32 includes measures, such as updates to Title 24, to improve energy efficiency of residential and
non-residential buildings which will also improve energy performance in the community.
Approximately 29.0 percent of the required reductions will come from implementation of EECAP
measures identified as Priority 1, as described in Chapters 3 and 4 of this document. Community-
wide measures will reduce emissions by approximately 9,109 MT CO2e, and municipal measures
will reduce emissions by roughly 180 MT CO2e.

5 Implementation and Monitoring American Canyon Energy Efficiency Climate Action Plan 5-3
The remaining 41.7 percent of the required reductions (13,394 MT CO2e) will come from
measures to be determined. Implementation of EECAP measures designated as Priority 2 and 3
will contribute to this target. However, in order to fully close the gap, the City recognizes that it will
have to develop more aggressive programs, mandatory energy efficiency measures, and/or
achieve higher-than-anticipated voluntary participation in the programs already included in the
EECAP. The last section of this chapter provides guidance on where the City may focus its efforts
to ensure that the 15 percent GHG target is met by the year 2020.
5.2 Implementation Responsibility and Outreach Channels
Successful implementation of EECAP measures will require commitment and coordination from
staff throughout American Canyon’s local government. As described under Measure C-9, the City
will develop an American Canyon Green Team whose responsibilities include rollout,
implementation, and monitoring of EECAP measures. The Green Team will be established by the
Community Development Department, starting in 2013. Because EECAP measures require
integrated actions across staff departments, the Green Team will include at minimum one
individual from each City department to serve as department representative. The Green Team will
elect a “Sustainability Coordinator” from among the representatives, to coordinate the group and
overall implementation of the EECAP.
The Green Team will work directly with City departments to facilitate successful implementation of
the EECAP, coordinate with community partners and stakeholders, and monitor and measure the
City’s progress in meeting its GHG reduction targets.
The City commits to providing staff resources to ensure that measures are implemented according
to the schedule outlined in Section 5.3. However, ultimate success will depend on public
participation, and the City recognizes that coordinating with outside agencies, such as PG&E and
SNC/NCEW is critical for maximizing public participation. The City will continue to partner with these
agencies to leverage support for energy efficiency and renewable energy measures. At the same
time, the City will also use its existing community outreach channels to communicate with all sectors
of the City of American Canyon community, including traditionally underrepresented or underserved
groups. Engagement strategies and outreach channels may include:
1. American Canyon City Website, such as City pages on Energy Efficiency Climate Action Plan, Latest News, City Calendar, and development of a new Energy Efficiency and Renewable Energy page.
2. Email blasts, such as the City Manager’s Friday Update, and the www.AmCanlive.com mailing list.
3. Regulations/Discretionary Review Process, such as permitting, inspections, and environmental compliance (e.g., CEQA).
4. Utility bills, such as water bills.
5. Community stakeholder groups, such as:
Neighborhood groups and Homeowner Associations
American Canyon Chamber of Commerce
City’s large employers, such as: Walmart Supercenter, Amcan Beverages Inc, G.L. Mezzetta Inc, Kona Coast Food Products, American Canyon High School,
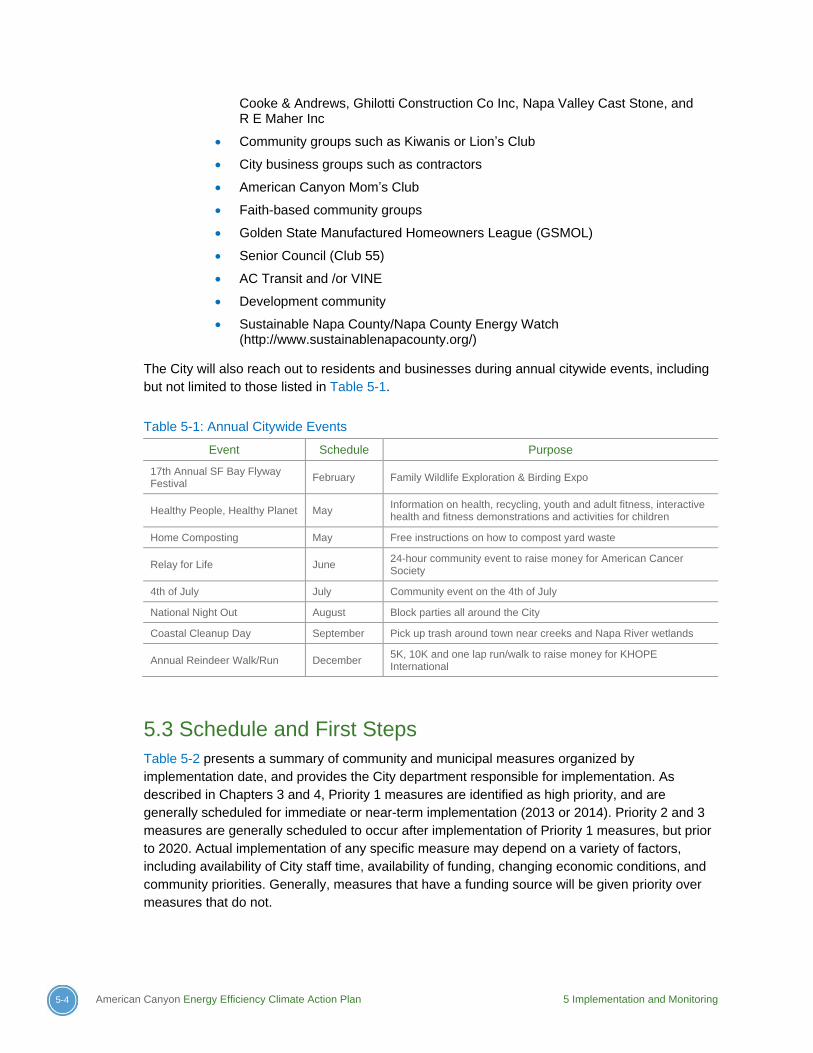
5-4 American Canyon Energy Efficiency Climate Action Plan 5 Implementation and Monitoring
Cooke & Andrews, Ghilotti Construction Co Inc, Napa Valley Cast Stone, and R E Maher Inc
Community groups such as Kiwanis or Lion’s Club
City business groups such as contractors
American Canyon Mom’s Club
Faith-based community groups
Golden State Manufactured Homeowners League (GSMOL)
Senior Council (Club 55)
AC Transit and /or VINE
Development community
Sustainable Napa County/Napa County Energy Watch (http://www.sustainablenapacounty.org/)
The City will also reach out to residents and businesses during annual citywide events, including
but not limited to those listed in Table 5-1.
Table 5-1: Annual Citywide Events
Event Schedule Purpose
17th Annual SF Bay Flyway Festival
February Family Wildlife Exploration & Birding Expo
Healthy People, Healthy Planet May Information on health, recycling, youth and adult fitness, interactive health and fitness demonstrations and activities for children
Home Composting May Free instructions on how to compost yard waste
Relay for Life June 24-hour community event to raise money for American Cancer Society
4th of July July Community event on the 4th of July
National Night Out August Block parties all around the City
Coastal Cleanup Day September Pick up trash around town near creeks and Napa River wetlands
Annual Reindeer Walk/Run December 5K, 10K and one lap run/walk to raise money for KHOPE International
5.3 Schedule and First Steps
Table 5-2 presents a summary of community and municipal measures organized by
implementation date, and provides the City department responsible for implementation. As
described in Chapters 3 and 4, Priority 1 measures are identified as high priority, and are
generally scheduled for immediate or near-term implementation (2013 or 2014). Priority 2 and 3
measures are generally scheduled to occur after implementation of Priority 1 measures, but prior
to 2020. Actual implementation of any specific measure may depend on a variety of factors,
including availability of City staff time, availability of funding, changing economic conditions, and
community priorities. Generally, measures that have a funding source will be given priority over
measures that do not.
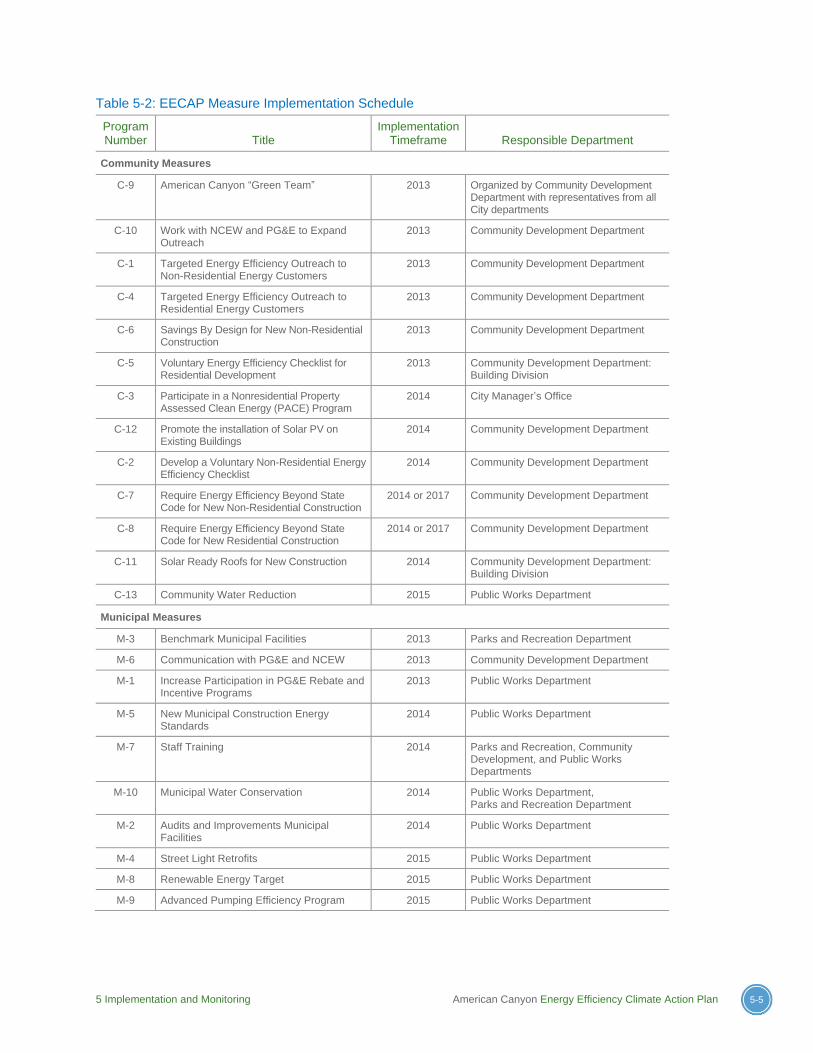
5 Implementation and Monitoring American Canyon Energy Efficiency Climate Action Plan 5-5
Table 5-2: EECAP Measure Implementation Schedule
Program Number Title
Implementation Timeframe Responsible Department
Community Measures
C-9 American Canyon “Green Team” 2013 Organized by Community Development Department with representatives from all City departments
C-10 Work with NCEW and PG&E to Expand Outreach
2013 Community Development Department
C-1 Targeted Energy Efficiency Outreach to Non-Residential Energy Customers
2013 Community Development Department
C-4 Targeted Energy Efficiency Outreach to Residential Energy Customers
2013 Community Development Department
C-6 Savings By Design for New Non-Residential Construction
2013 Community Development Department
C-5 Voluntary Energy Efficiency Checklist for Residential Development
2013 Community Development Department: Building Division
C-3 Participate in a Nonresidential Property Assessed Clean Energy (PACE) Program
2014 City Manager’s Office
C-12 Promote the installation of Solar PV on Existing Buildings
2014 Community Development Department
C-2 Develop a Voluntary Non-Residential Energy Efficiency Checklist
2014 Community Development Department
C-7 Require Energy Efficiency Beyond State Code for New Non-Residential Construction
2014 or 2017 Community Development Department
C-8 Require Energy Efficiency Beyond State Code for New Residential Construction
2014 or 2017 Community Development Department
C-11 Solar Ready Roofs for New Construction 2014 Community Development Department: Building Division
C-13 Community Water Reduction 2015 Public Works Department
Municipal Measures
M-3 Benchmark Municipal Facilities 2013 Parks and Recreation Department
M-6 Communication with PG&E and NCEW 2013 Community Development Department
M-1 Increase Participation in PG&E Rebate and Incentive Programs
2013 Public Works Department
M-5 New Municipal Construction Energy Standards
2014 Public Works Department
M-7 Staff Training 2014 Parks and Recreation, Community Development, and Public Works Departments
M-10 Municipal Water Conservation 2014 Public Works Department, Parks and Recreation Department
M-2 Audits and Improvements Municipal Facilities
2014 Public Works Department
M-4 Street Light Retrofits 2015 Public Works Department
M-8 Renewable Energy Target 2015 Public Works Department
M-9 Advanced Pumping Efficiency Program 2015 Public Works Department

5-6 American Canyon Energy Efficiency Climate Action Plan 5 Implementation and Monitoring
The energy, GHG, and cost savings associated with each measure, as provided in Chapters 3
and 4, are based on the assumed implementation dates in Table 5-2. If measure implementation
occurs ahead or behind schedule, the measure’s energy, GHG and cost savings would be
affected accordingly.
First steps for the City include:
1. Implementation of Measure C-9 to establish the American Canyon Green Team, who will
lead implementation of measures;
2. Implementation of Measures C-10 and M-6 to begin coordination with PG&E and
SNC/NCEW, to leverage existing resources and develop plans for community and
municipal outreach; and
3. Implementation of Measure M-3 to benchmark municipal facilities to ensure accurate and
complete data collection for future tracking.
5.4 Monitoring and Plan Updates
The City will monitor progress of measure implementation and meeting its energy-related GHG
reduction target. For all measures, the City will define, monitor, and report on measurable
indicators of success, including program participation rates. The City will work with PG&E to
determine program participation rates, and will use PG&E’s Tableau Reporting System to monitor
opportunities to promote outreach to various community sectors and business segments. The
City will track community-wide and municipal energy use and associated GHGs by obtaining a
GHG inventory report from PG&E on an annual basis, via the utility’s Green Community Data
Reports service.1 The City may quantify savings using the California Energy Commission (CEC)
and California Public Utilities Commission (CPUC) Database on Energy Efficient Resources
(DEER), which provides estimates for electricity and natural gas savings associated with energy
efficiency measures.
Once a year the Sustainability Coordinator will present a progress report to the City Manager
and/or City Council that provides an update on program implementation, remaining tasks, next
steps, and community-wide and municipal GHG emissions from the prior calendar year. The
progress report and/or information from the report will be provided to the public on the City’s
website, and may be disseminated to stakeholders such as SNC/NCEW, American Canyon
residents and businesses, and others as appropriate.
The City will update the EECAP at least every five years. As explained in section 6.1, successful
implementation of the Priority 1 measures quantified in this EECAP, in conjunction with the state’s
RPS, will only achieve roughly 58 percent of the City’s targeted GHG emission reduction.
Achieving the remaining 42 percent will require close monitoring of programs in place, along with
strategic planning by the City. The City may choose to implement additional programs, more
aggressive programs, or convert voluntary energy efficiency measures to mandatory measures,
to meet the City’s GHG reduction target of 15 percent by 2020. Future planning efforts should
focus on the following actions, which would increase the City’s annual energy-related GHG
reductions:
1
http://www.pge.com/mybusiness/environment/whatyoucando/greencommunities/
5 Implementation and Monitoring American Canyon Energy Efficiency Climate Action Plan 5-7
1. Quantify the savings associated with implementation of Priority 2 and 3 measures. For
various reasons, including budget constraints and the perception that these measures
are less cost-effective than Priority 1 measures, this EECAP does not quantify GHG
reductions associated with Priority 2 and 3 measures. Implementation of these medium
and long-term measures would result in additional community-wide and municipal GHG
reductions.
2. Increase voluntary participation in the measures listed in this EECAP. Chapters 3 and 4
provide anticipated energy and GHG reductions associated with each EECAP measure,
based on measure-specific assumptions about participation rates. Increasing
participation rates would result in correspondingly higher levels of energy and GHG
reductions. Additional outreach and education, as well as additional incentives, may be
needed to boost participation rates.
3. Develop new community and government programs. Additional programs to consider
include:
Investigate opportunities to develop public-private partnerships for renewable
energy generation in the community, especially related to large electricity users,
to increase City renewable energy consumption beyond the PG&E power mix:
Community Choice Aggregation (CCA): The California CCA program,
established in 2002, allows cities and counties to purchase blocks of
power to sell to residents and businesses. In this program, cities
aggregate the buying power of individual customers within a defined
jurisdiction in order to secure alternative energy supply contracts. A CCA
can charge ratepayers less per kilowatt hour than investor-owned
utilities. Formation of a CCA or municipal utility in California requires a
majority vote and would require the City to thoroughly investigate and
understand the associated legal and operational requirements.
Municipal Utility: Alternatively, the City could consider forming a
municipal renewable energy production utility, with the freedom to own
and operate power plants and potentially purchase a higher percentage
of renewable energy renewable energy. The City, as a municipal utility,
might be able to increase its renewable portfolio without raising electricity
prices for customers. Formation of a municipal utility would be cost and
time-intensive and would require a major feasibility analysis.
Investigate opportunities to develop public-public partnerships for renewable
energy generation and energy efficiency in the community:
Aggregated Procurement: The City could consider joining together with
other municipalities to secure bulk purchasing in order to bring lower
costs to all participants. Joint procurement simplifies a city’s bidding
requirements, and project management services can also be gained by
this procurement process. Aggregated Procurement can help the City
achieve savings by pooling together similar projects, performing
economic analysis, coordinating the procurement process, identifying
attractive financing, assisting with rebates, and implementing the
retrofits.
Demonstration Pilot Projects: American Canyon would collaborate with
adjacent municipal organizations, agencies, and non-profit organizations
to share programs, procurement, project management, financing

5-8 American Canyon Energy Efficiency Climate Action Plan 5 Implementation and Monitoring
opportunities, successes, and lessons learned to advance municipal
energy efficiency.
Aggregated Municipal Funding Opportunities: American Canyon would
collaborate with adjacent municipal organizations, agencies, and non-
profit organizations to pool resources to secure attractive financing terms
negotiated with a variety of lenders.
Consider a more aggressive PV measure for large footprint buildings such as
food warehouses.
Explore the feasibility of wind energy generation at municipal facilities.
Support the California Green Business program, which certifies local green
businesses and provides on-site assessments that address issues such as
environmental purchasing policies, energy conservation, pollution prevention,
and waste.
Require municipal facilities and/or new development to purchase “white tags” or
“energy efficiency certificates.”
Establish community lighting standards that provide specified lighting levels while
reducing excessive lighting and conserving electricity.
Implement a City-wide tree planting program to provide free or low-cost trees,
with a focus on shade trees, to reduce the urban heat island effect.
The City will consider these and other options during future planning efforts, including regular
updates of the EECAP (not to exceed every five years), during the annual GHG inventory
update, and during development of the Climate Action Plan.
6 Conclusion American Canyon Energy Efficiency Climate Action Plan 6-1
6. Conclusion
The American Canyon EECAP provides a roadmap to reduce energy consumption and GHG
emissions in American Canyon. While addressing the significant global challenge of climate
change, the plan also connects American Canyon residents and businesses to resources that will
help them use energy more efficiently, save money, and improve the quality of life for current and
future residents.
The City recognizes the challenge it faces to achieve its 2020 energy-related GHG target, as the
reductions associated with EECAP measures are estimated to fall short of the target by roughly
13,000 MT CO2e. Based on current growth projections, the City will need to find additional
energy-related GHG reductions by developing and implementing additional measures, or by
strengthening the currently planned measures through additional funding or staffing, and more
aggressive outreach and promotion.
Meanwhile, the City plans to develop a comprehensive Climate Action Plan (CAP) in the coming
years, providing more opportunity for constructive dialogue with the community and other
stakeholders regarding energy use and reducing GHG emissions. This EECAP provides a solid
foundation for the comprehensive CAP, which will target reductions from all sources of GHGs
across the community, including energy, transportation, solid waste, and water. In that wider
context, the reduction target for energy-related GHG emissions will likely be adjusted higher or
lower depending on the opportunities and constraints represented by the other sectors. The
comprehensive CAP is likely to include additional energy-related measures, as necessary, to
enable community-wide GHG reductions that are consistent with the goals of AB 32 and SB 375.
The City recognizes the tremendous benefit that energy efficiency and clean energy sources have
in supporting local values and goals, and is committed to demonstrating leadership at the local
level, to provide feasible solutions and real action to achieve long-term sustainable development.