energy efficiency in buildings a griha approach
TRANSCRIPT

Energy Efficiency in Buildings – A GRIHA Approach
Pradeep Kumar Associate Director
Building Energy System
Sustainable Habitat Division
TERI, New Delhi

Design Challenge

Room Temperature :
Up to 38 0 C
EPI
45 kWh/m2-yr
Non-Air conditioned Buildings
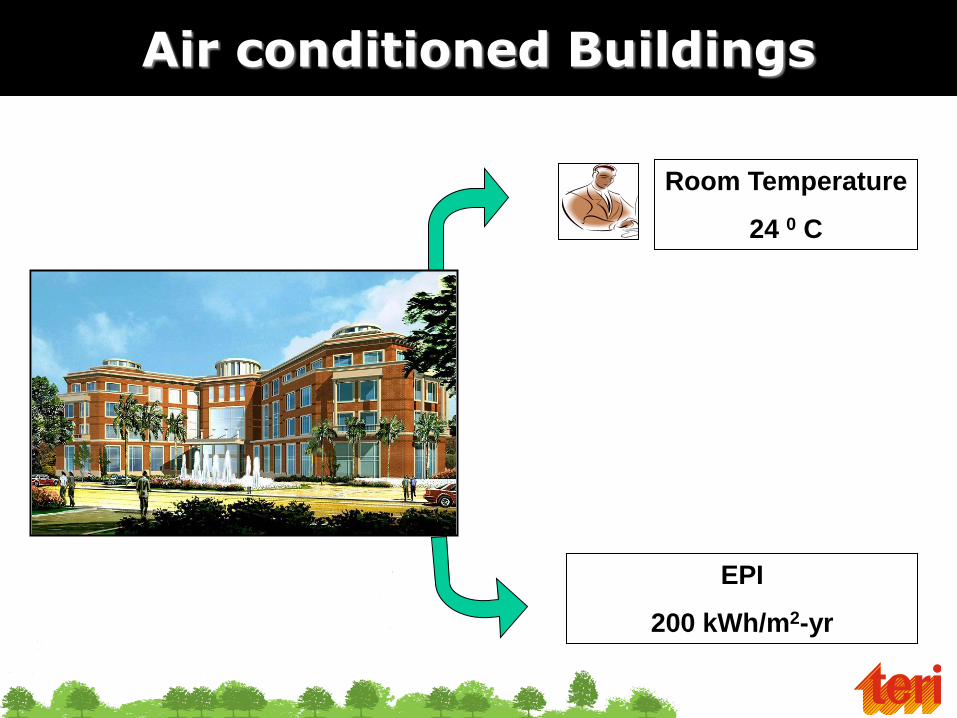
Room Temperature
24 0 C
EPI
200 kWh/m2-yr
Air conditioned Buildings

Room conditions
26~28 0 C
Room conditions
24 0 C
EPI
200 kWh/m2-yr
EPI
< 90 kWh/m2-yr
Energy Efficient Building

Room conditions
26~28 0 C
EPI
90 kWh/m2-yr
Design Approach
45 kWh 45 kWh

Inefficiency in Building

Why?
Efficient building
Regulation
Analysis
Inefficient buildings

Energy Efficiency in Green Building

Green Buildings
200 kWh/m2-yr
350 kWh/m2-yr 210 kWh/m2-yr
40% reduction
120 kWh/m2-yr
40% reduction

Energy Efficiency – GRIHA Approach
WWR – Criterion 13
High Performance
Materials - ECBC
Reduce demand on Non-Renewable Energy Sources – Criterion 18 & 19
Energy Performance Benchmark – Criterion 14
Energy Consumption Breakup in Existing Building

Luxury Hotel

Office Building
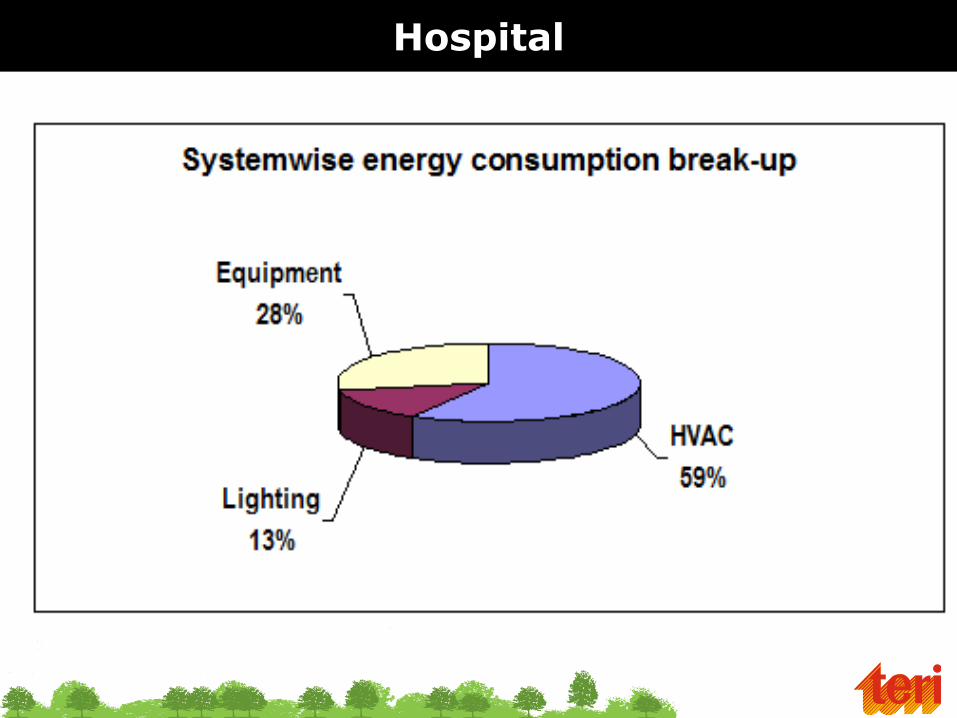
Hospital

Efficient HVAC System
Adequate comfort
Reduced energy demand
Use renewable energy sources
Adequate control to optimize part load performance

Adequate comfort condition in India
NBC recommends temperature range of 23 o C ~ 26 o C
and RH range of 50 ~ 60%
LEED India accepts comfort range 26 +/- 2 o C and RH
60%
Many people in favor of 27+2 o C and RH 65%
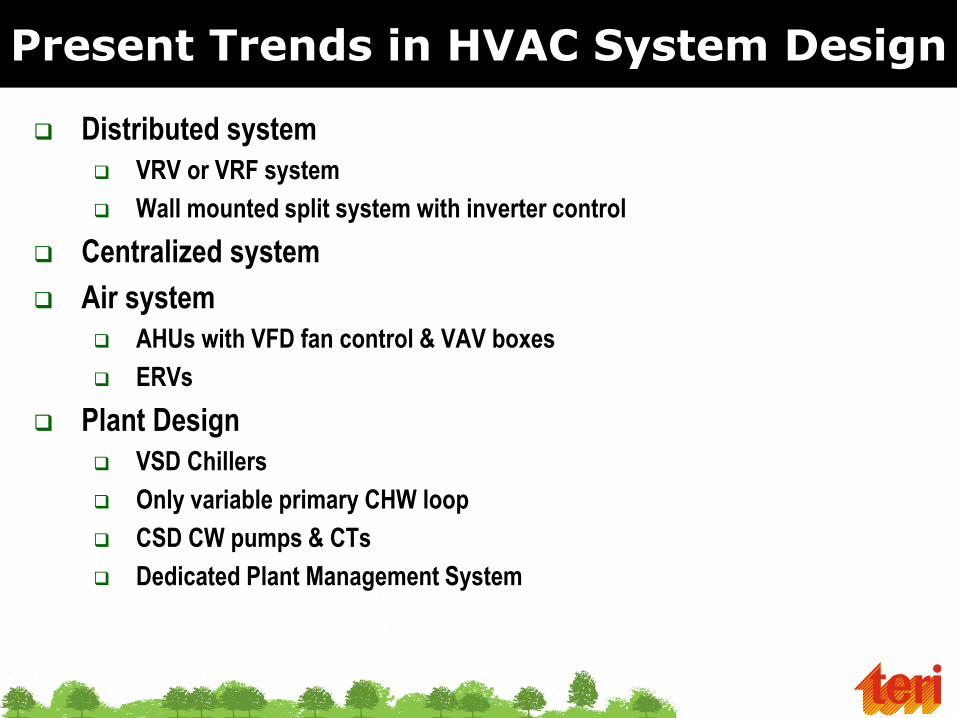
Present Trends in HVAC System Design
Distributed system
VRV or VRF system
Wall mounted split system with inverter control
Centralized system
Air system
AHUs with VFD fan control & VAV boxes
ERVs
Plant Design
VSD Chillers
Only variable primary CHW loop
CSD CW pumps & CTs
Dedicated Plant Management System
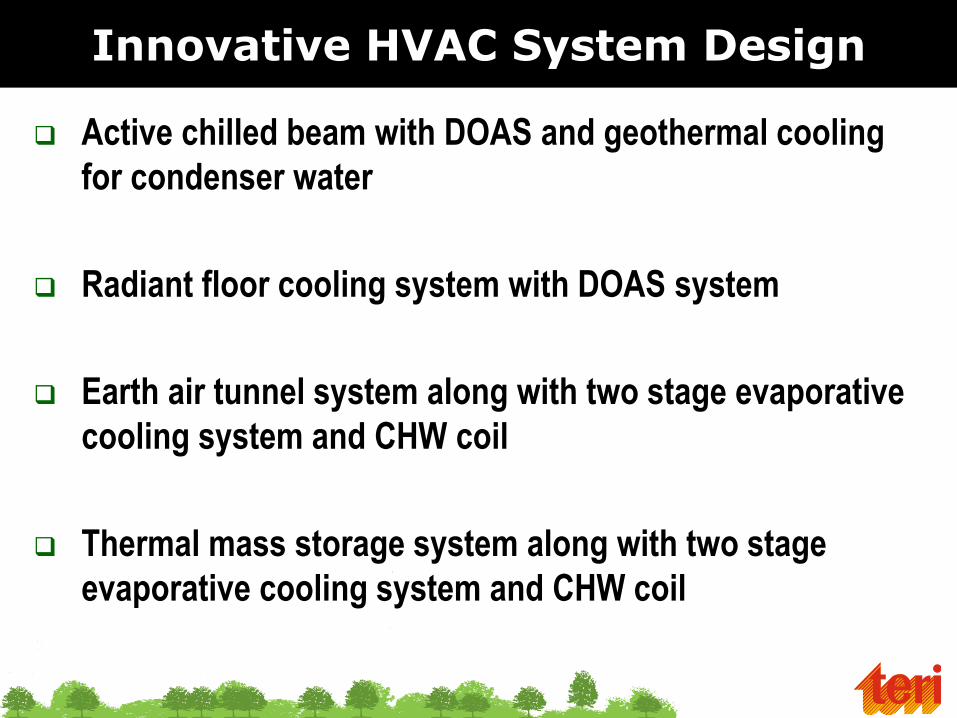
Innovative HVAC System Design
Active chilled beam with DOAS and geothermal cooling
for condenser water
Radiant floor cooling system with DOAS system
Earth air tunnel system along with two stage evaporative
cooling system and CHW coil
Thermal mass storage system along with two stage
evaporative cooling system and CHW coil

Energy Efficiency in HVAC System

Project Description
Building type: 600 room 5-star luxury hotel
Location: Chennai
Total AC built-up area: 820000 ft2

Load estimation
Total coil load: 3930 TR
Peak building load: 2950 TR (Diversity @ 0.75)
Variable centrifugal chiller
Variable primary pumps
Constant condenser pumps
Constant cooling tower

Case-1 : Only Chiller performance optimized
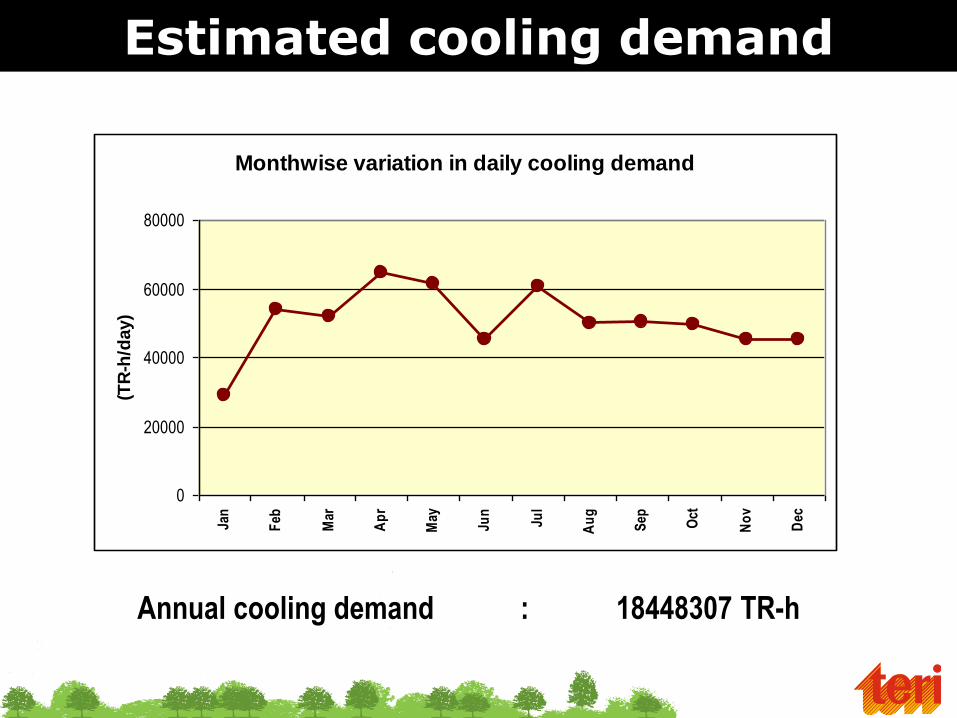
Estimated cooling demand
Annual cooling demand : 18448307 TR-h
Monthwise variation in daily cooling demand
0
20000
40000
60000
80000Ja
n
Feb
Mar
Ap
r
May
Jun
Jul
Au
g
Sep Oct
No
v
Dec
(TR
-h/d
ay)

Performance analysis
January 6#600 TR CSD ChillerHour DBT (0F) WBT (0F) Cooling
load (TR)
ECWT (0F) No of
operating
chillers
Capacity
of each
chiller
(TR)
IKW/TR kW
0 67.1 65.8 1183 72.8 2 592 0.512 606
1 66.6 64.6 1083 71.6 2 542 0.501 543
2 65.5 64 1083 71 2 542 0.497 538
3 65.1 63.7 1063 70.7 2 532 0.497 528
4 64.2 63.1 1002 70.1 2 501 0.503 504
5 63.7 60.8 845 67.8 2 423 0.504 426
Total daily load * No. of days* DF = Monthly kWh

Chiller sizing
11264940 kWh/yr
6*600 CSD Chiller
10750300 kWh/yr
6*600 VSD Chiller
10407327 kWh/yr
5*750 VSD Chiller

Avg. operating Chiller COP
10407327 kWh/yr
?
Annual cooling demand: 18448307 TR-h
Monthwise variation in daily cooling demand
0
20000
40000
60000
80000
Jan
Feb
Mar
Ap
r
May
Jun
Jul
Au
g
Sep Oct
No
v
Dec
(TR
-h/d
ay)
IKW/TR : 10407327/18448307 = 0.564
COP : 6.23
4 * 750 VSD Chillers

Avg. operating plant COP
Annual cooling demand: 18448307 TR-h
10407327 kWh/yr
3224794 kWh/yr
IKW/TR : 13632121/18448307 = 0.739
COP : 4.76

Case-2 : Chiller & Auxiliaries performance optimized

Simulated hourly cooling demand
0
500
1000
1500
2000
2500
3000
3500
1 1001 2001 3001 4001 5001 6001 7001 8001
Hours
(TR
)
Annual cooling demand: 19623809 TR-h

Energy Performance of Chiller
Hour Cooling
demand
(TR)
Chiller
(kW)
1 1759 767
2 1697 728
3 1671 714
4 1657 706
5 1605 660
6 1589 652

Chiller Sizing
9000
000
9500
000
1000
0000
1050
0000
1100
0000
1150
0000
1200
0000
6#500 VSD (Screw) Make-2
5#600 VSD Make-1
5#625 CSD Make-3
5#650 VSD Make-2
4#750 VSD Make-2
4#800 VSD Make-1
4#800 CSD Make-3
4#900 CSD Make-3
4#900 CSD Make-1
4#900 VSD Make-1
4#1000 VSD Make-2

Equipment Sizing
Total coil load: 3930 TR
Peak building load: 2950 TR (Diversity @ 0.75)
4 # 900 VSD centrifugal chillers
CHW flow @2gpm/TR
CDW flow @ 3gpm/TR
4 # 1800 gpm/135’
4 # 2700 gpm/105
4 # 900 TR

Energy performance of auxiliary equipment
Hour Cooling
demand
(TR)
Variable
primary
chilled
water
(KW)
CW pump
(KW)
Cooling
tower
fan (KW)
1 1759 91.46 110 60
2 1697 88.24 110 60
3 1671 86.89 110 60
4 1657 86.14 110 60
5 1605 83.45 110 60
6 1589 82.65 110 60

CT Selection
0
10000000
20000000
30000000
40000000
50000000
60000000
0 2 4 6 8 10 12 14 16
Make-1 Type-1 Make-2 Type-1 Make-2 Type-2 Make-1 Type-2 Make-1 Type-2
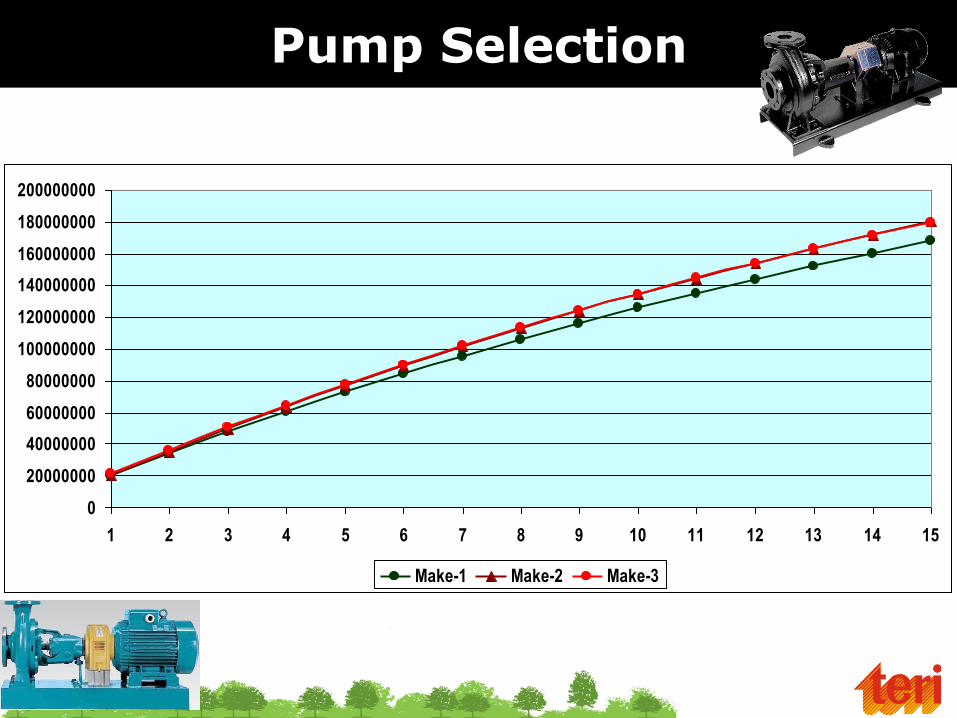
Pump Selection
0
20000000
40000000
60000000
80000000
100000000
120000000
140000000
160000000
180000000
200000000
1 2 3 4 5 6 7 8 9 10 11 12 13 14 15
Make-1 Make-2 Make-3
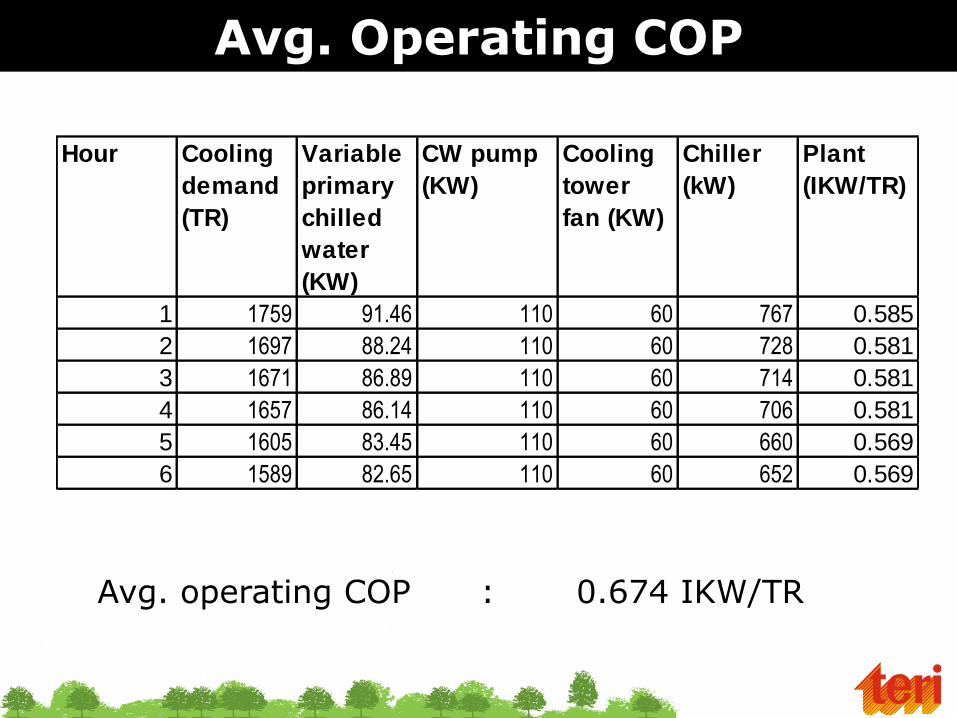
Avg. Operating COP
Hour Cooling
demand
(TR)
Variable
primary
chilled
water
(KW)
CW pump
(KW)
Cooling
tower
fan (KW)
Chiller
(kW)
Plant
(IKW/TR)
1 1759 91.46 110 60 767 0.585
2 1697 88.24 110 60 728 0.581
3 1671 86.89 110 60 714 0.581
4 1657 86.14 110 60 706 0.581
5 1605 83.45 110 60 660 0.569
6 1589 82.65 110 60 652 0.569
Avg. operating COP : 0.674 IKW/TR

Case-3 : Plant performance optimized

Plant Optimization
Case-1: 4 # 900 VSD Centrifugal Chiller with PIDs controls
Case-2: 4 # 900 VSD Centrifugal Chiller with all variable system with demand based controls

Load curve
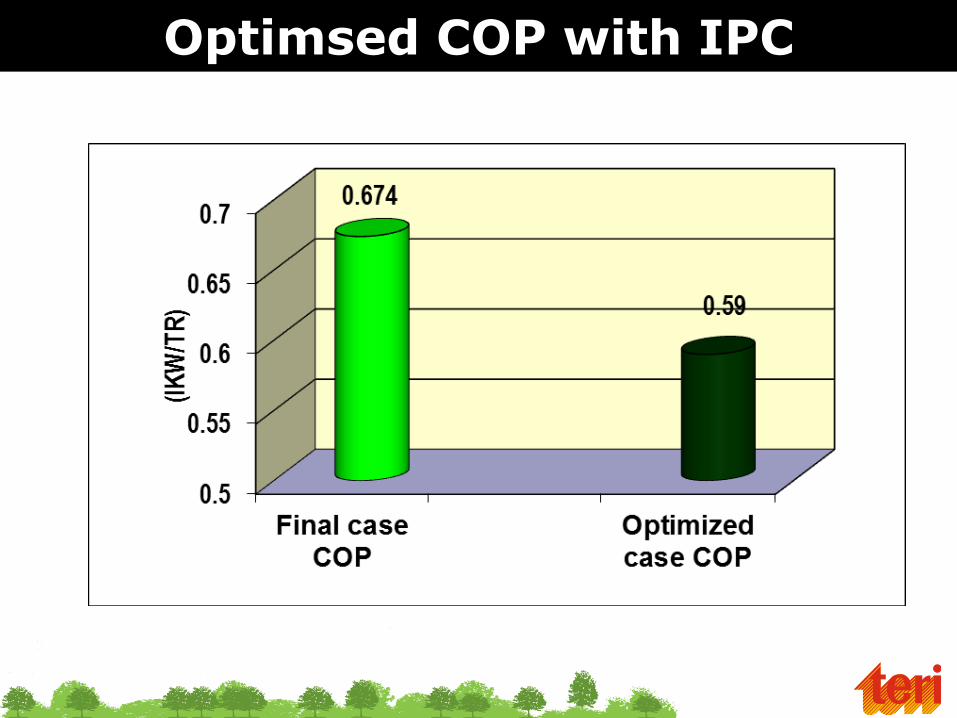
Optimsed COP with IPC

Plant Selection
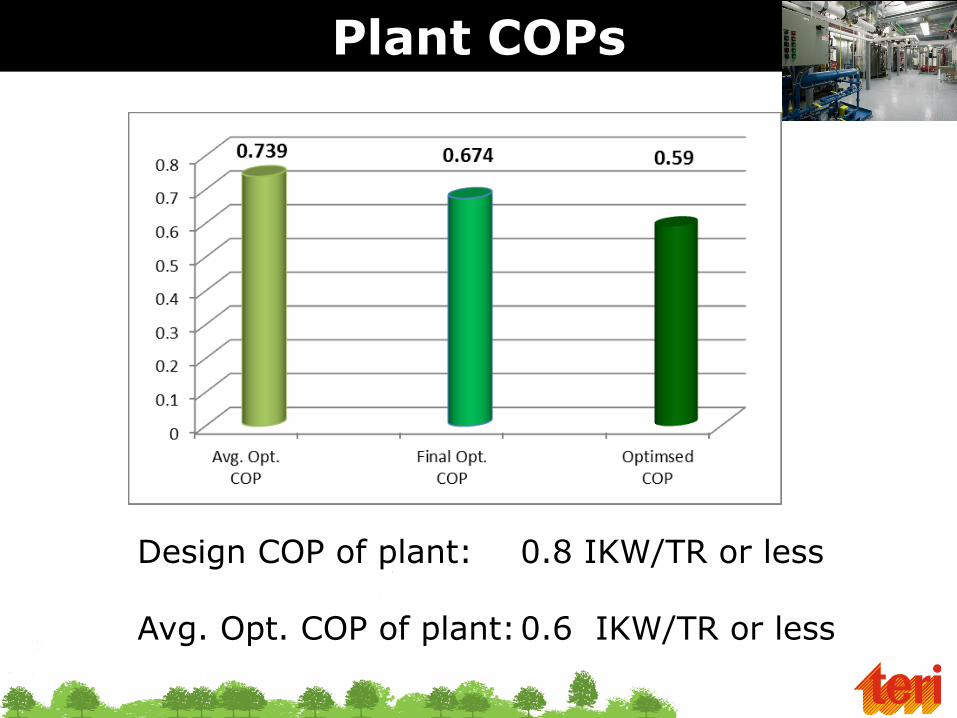
Plant COPs
Design COP of plant: 0.8 IKW/TR or less Avg. Opt. COP of plant: 0.6 IKW/TR or less

Recommendation
Optimize WWR as per CRIHA criterion -13
Select building materials as recommended by ECBC
Target cooling load (> 500 ft2/TR) and energy performance
(< 95 kWh/m2-yr) – CRIHA criterion-14
Take plant efficiency as a measure of cooling system
efficiency
Target plant efficiency (< 0.8 kW/TR) * avg. opt. plant
efficiency (< 0.6 kW/TR)
Reduce dependence on Non – Green Power – GRIHA
criterion 18 & 19
