energy efficiency in electrical distribution
TRANSCRIPT

Schneider Electric - Electrical installation guide 2007
K - Energy Efficiency in electrical distribution
K10
The energy efficiency performance in terms of electricity can only be expressed in terms of fundamental physical measurements – voltage, current, harmonics, etc. These physical measurements are then reprocessed to become digital data and then information.
In the raw form, data are of little use. Unfortunately, some energy managers become totally immersed in data and see data collection and collation as their primary task. To gain value from data they must be transformed into information (used to support the knowledge development of all those managing energy) and understanding (used to action energy savings).The operational cycle is based on four processes: data collection; data analysis; communication; and action (Fig. K8). These elements apply to any information system. The cycle works under condition that an adequate communication network has been set up.
The data processing level results in information that can be understood by the recipient profile: the ability to interpret the data by the user remains a considerable challenge in terms of decision making.The data is then directly linked to loads that consume electricity – industrial process, lighting, air conditioning, etc. – and the service that these loads provide for the company – quantity of products manufactured, comfort of visitors to a supermarket, ambient temperature in a refrigerated room, etc.The information system is then ready to be used on a day to day basis by users to achieve energy efficiency objectives set by senior managers in the company.
4.1 Physical value acquisition
The quality of data starts with the measurement itself: at the right place, the right time and just the right amount.
Basically, electrical measurement is based on voltage and current going through the conductors. These values lead to all the others: power, energy, power factor, etc.
Firstly we will ensure consistency of the precision class of current transformers, voltage transformers and the precision of the measurement devices themselves. The precision class will be lower for higher voltages: an error in the measurement of high voltage for example represents a very large amount of energy.
The total error is the quadratic sum of each error.
of error = error error ... error2 2 2+ + +∑Example: a device with an error of 2% connected on a CT ’s with an error of 2% that means:
of error = 2,828%2 22 2( ) + ( ) =∑That could mean a loss of 2 828KWh for 100 000KWh of consumption.
4 From electrical measurement to electrical information
Fig. K8 : The operational cycle
Data analysis(data to information)
Action(understanding
to results)
Communication(information tounderstanding)
Data collection

Schneider Electric - Electrical installation guide 2007
K - Energy Efficiency in electrical distribution
K11
4 From electrical measurement to electrical information
Voltage measurementIn low voltage, the voltage measurement is directly made by the measurement device. When the voltage level becomes incompatible with the device capacity, for example in medium voltage, we have to put in voltage transformers.
A VT (Voltage transformer) is defined by:b its primary voltage and secondary voltageb its apparent power b its precision class
Current measurementCurrent measurement is made by split or closed-core CT’s placed around the phase and neutral conductors as appropriate.According to the required precision for measurement, the CT used for the protection relay also allows current measurement under normal conditions.
In particular, to measure energy, we consider two objectives:b A contractual billing objective, e.g. between an electricity company and its client or even between an airport manager (sub-billing) and stores renting airport surface areas. In this case IEC 62053-21 for Classes 1 and 2 and IEC 62053-22 for Classes 0.5S and 0.2S become applicable to measure active energy.The full measurement chain – CT, VT and measurement unit – can reach a precision class Cl of 1 in low voltage, Cl 0.5 in medium voltage and 0.2 in high voltage, or even 0.1 in the future.b An internal cost allocation objective for the company, e.g. to break-down the cost of electricity for each product produced in a specific workshop. In this case of a precision class between 1 and 2 for the whole chain (CT, VT and measurement station) is sufficient.
It is recommended to match the full measurement chain precision with actual measurement requirements: there is no one single universal solution, but a good technical and economic compromise according to the requirement to be satisfied. Note that the measurement precision also has a cost, to be compared with the return on investment that we are expecting.
Generally gains in terms of energy efficiency are even greater when the electrical network has not been equipped in this way until this point. In addition, permanent modifications of the electrical network, according to the company’s activity, mainly cause us to search for significant and immediate optimizations straight away.
Example:A class 1 analogue ammeter, rated 100 A, will display a measurement of +/-1 A at 100 A. However if it displays 2 A, the measurement is correct to within 1 A and therefore there is uncertainty of 50%.A class 1 energy measurement station such as PM710 Merlin Gerin – like all other Merlin Gerin Power Meter and Circuit Monitor Measurement Units – is accurate to 1% throughout the measurement range as described in IEC standards 62053.
Other physical measurements considerably enhance the data:b on/off, open/closed operating position of devices, etc.b energy metering impulseb transformer, motor temperatureb hours operation, quantity of switching operationsb motor loadb UPS battery loadb event logged equipment failuresb etc
4.2 Electrical data for real objectives
Electrical data is transformed into information that is usually intended to satisfy several objectives:b It can modify the behaviour of users to manage energy wisely and finally lowers overall energy costs.b It can contribute to field staff efficiency increaseb It can contribute to decrease the cost of Energyb It can contribute to save energy by understanding how it is used and how assets and process can be optimized to be more energy efficient
A CT is defined by:b its transformation ratio. For example: 50/5Ab precision class Cl. Example: Cl=0.5 generallyb precision power in VA to supply power to the measurement devices on the secondary. Example: 1.25 VAb limit precision factor indicated as a factor applied to In before saturation. Example: FLP (or Fs) =10 for measurement devices with a precision power that is in conformity.
PM700 measurement unit

Schneider Electric - Electrical installation guide 2007
K - Energy Efficiency in electrical distribution
K12
b It may help in optimizing and increasing the life duration of the assets associated to the electrical networkb And finally it may be a master piece in increasing the productivity of the associated process (industrial process or even office, building management), by preventing, or reducing downtime, or insuring higher quality energy to the loads.
Facility utility costs parallel the visualization of an iceberg (Fig. K9). While an iceberg seems large above the surface, the size is completely overwhelming beneath the surface. Similarly, electrical bills are brought to the surface each month when your power provider sends you a bill. Savings in this area are important and can be considerable enough to be the only justification needed for a power monitoring system. However, there are other less obvious yet more significant savings opportunities to be found below the surface if you have the right tools at your disposal.
Modify the behaviour of energy usersUsing cost allocation reports, you can verify utility billing accuracy, distribute bills internally by department, make effective fact-based energy decisions and drive accountability in every level of your organization. Then providing ownership of electricity costs to the appropriate level in an organization, you modify the behaviour of users to manage energy wisely and finally lowers overall energy costs.
Increase field staff efficiencyOne of the big challenges of field staff in charge of the electrical network is to make the right decision and operate in the minimum time.The first need of such people is then to better know what happens on the network, and possibly to be informed everywhere on the concerned site.This site-wise transparency is a key feature that enables a field staff to:b Understand the electrical energy flows – check that the network is correctly set-up, balanced, what are the main consumers, at what period of the day, or the week…b Understand the network behaviour – a trip on a feeder is easier to understand when you have access to information from downstream loads.b Be spontaneously informed on events, even outside the concerned site by using today’s mobile communicationb Going straight forward to the right location on the site with the right spare part, and with the understanding of the complete pictureb Initiate a maintenance action taking into account the real usage of a device, not too early and not too lateb Therefore, providing to the electrician a way to monitor the electrical network can appear as a powerful mean to optimize and in certain case drastically reduce the cost of power.
Here are some examples of the main usage of the simplest monitoring systems:b Benchmark between zones to detect abnormal consumption.b Track unexpected consumption.b Ensure that power consumption is not higher that your competitors.b Choose the right Power delivery contract with the Power Utility.b Set-up simple load-shedding just focusing on optimizing manageable loads such as lights.b Be in a position to ask for damage compensation due to non-quality delivery from the Power Utilities – The process has been stopped because of a sag on the network.
Implementing energy efficiency projectsThe Power monitoring system will deliver information that support a complete energy audit of a factility. Such audit can be the way cover not only electricity but also Water, Air, Gas and Steam. Measures, benchmark and normalized energy consumption information will tell how efficient the industrial facilities and process are. Appropriate action plans can then be put in place. Their scope can be as wide as setting up control lighting, Building automation systems, variable speed drive, process automation, etc.
Optimizing the assetsOne increasing fact is that electrical network evolves more and more and then a recurrent question occurs : Will my network support this new evolution?This is typically where a Monitoring system can help the network owner in making the right decision.By its logging activity, it can archive the real use of the assets and then evaluate quite accurately the spare capacity of a network, or a switchboard, a transformer…A better use of an asset may increase its life duration.Monitoring systems can provide accurate information of the exact use of an asset and then the maintenance team can decide the appropriate maintenance operation, not too late, or not too early.In some cases also, the monitoring of harmonics can be a positive factor for the life duration of some assets (such as motors or transformers).
4 From electrical measurement to electrical information
Fig. K9 : Facility utility costs parallel the visualisation of an iceberg

Schneider Electric - Electrical installation guide 2007
K - Energy Efficiency in electrical distribution
K13
Increasing the productivity by reducing the downtimeDowntime is the nightmare of any people in charge of an electrical network. It may cause dramatic loss for the company, and the pressure for powering up again in the minimum time – and the associated stress for the operator – is very high.A monitoring and control system can help reducing the downtime very efficiently.Without speaking of a remote control system which are the most sophisticatedsystem and which may be necessary for the most demanding application, a simple monitoring system can already provide relevant information that will highly contribute in reducing the downtime:b Making the operator spontaneously informed, even remote, even out of the concerned site (Using the mobile communication such as DECT network or GSM/SMS)b Providing a global view of the whole network statusb Helping the identification of the faulty zoneb Having remotely the detailed information attached to each event caught by the field devices (reason for trip for example)
Then remote control of a device is a must but not necessary mandatory. In many cases, a visit of the faulty zone is necessary where local actions are possible.
Increasing the productivity by improving the Energy QualitySome loads can be very sensitive to electricity quality, and operators may face unexpected situations if the Energy quality is not under control.Monitoring the Energy quality is then an appropriate way to prevent such event and / or to fix specific issue.
4.3 Measurement starts with the “stand alone product” solution
The choice of measurement products in electrical equipment is made according to your energy efficiency priorities and also current technological advances: b measurement and protection functions of the LV or MV electrical network are integrated in the same device,Example: Sepam metering and protection relays, Micrologic tripping unit for Masterpact, TeSys U motor controller, NRC12 capacitor bank controller, Galaxy UPSs b the measurement function is in the device, separate from the protection function, e.g. built on board the LV circuit breaker.Example: PowerLogic Circuit Monitor high performance metering unit
The progress made in real time industrial electronics and IT are used in a single device:b to meet requirements for simplification of switchboardsb to reduce acquisition costs and reduce the number of devicesb to facilitate product developments by software upgrade procedures
4 From electrical measurement to electrical information
TeSys U motor controllerMicrologic tripping unit for Masterpact

Schneider Electric - Electrical installation guide 2007
K - Energy Efficiency in electrical distribution
K14
Below we give examples of measurements available via Modbus, RS485 or Ethernet Fig. K10:
Measurement units MV protection and measurement relays
LV protection and measurement relays
Capacitor bank regulators
Insulation monitors
Examples Power Meter, Circuit Monitor
SEPAM Masterpact & Compact Micrologic trip units
Varlogic Vigilohm System
Keep control over power consumption
Power, inst., max., min. b b b b -
Energy, reset capability b b b - -
Power factor, inst. b b b - -
Cos φ inst. - - - b -
Improve power supply availability
Current, inst., max., min., unbalance b b b b -
Current, wave form capture b b b - -
Voltage, inst., max., min., unbalance b b b b -
Voltage, wave form capture b b b - -
Device status b b b b -
Faults history b b b - -
Frequency, inst., max., min. b b b - -
THDu, THDi b b b b -
Manage electrical installation better
Load temperature, load and device thermal state
b b - b -
Insulating resistance - - - - b
Motor controllers LV speeddrives LV softstarters MV softstarters UPSs
Examples TeSys U ATV.1 ATS.8 Motorpact RVSS Galaxy
Keep control over power consumption
Power, inst., max., min. - b - b b
Energy, reset capability - b b b -
Power factor, inst. - - b b b
Improve power supply availability
Current, inst., max., min., unbalance b b b b b
Current, wave form capture - - - b b
Device status b b b b b
Faults history b b b b -
THDu, THDi - b - - -
Manage electrical installation better
Load temperature, load and device thermal state
b b b b b
Motor running hours - b b b -
Battery follow up - - - - b
4 From electrical measurement to electrical information
Fig. K10 : Examples of measurements available via Modbus, RS485 or Ethernet
Schneider Electric - Electrical installation guide 2007
K - Energy Efficiency in electrical distribution
K15
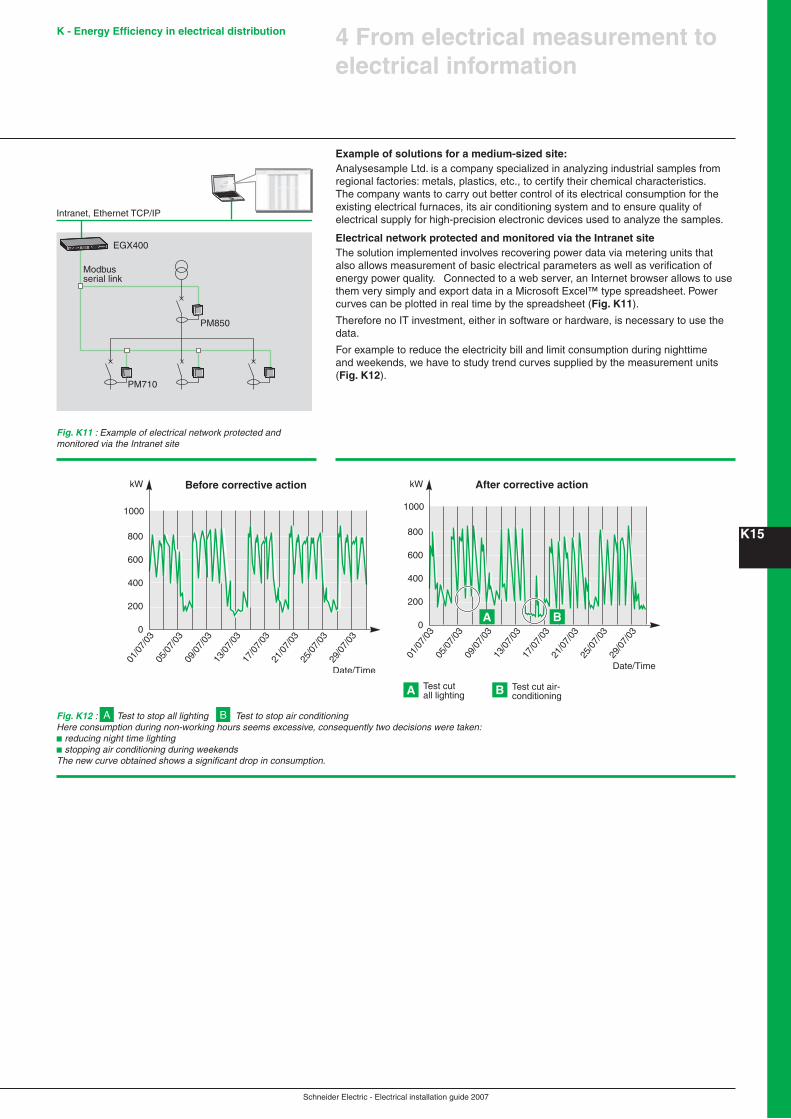
Example of solutions for a medium-sized site: Analysesample Ltd. is a company specialized in analyzing industrial samples from regional factories: metals, plastics, etc., to certify their chemical characteristics. The company wants to carry out better control of its electrical consumption for the existing electrical furnaces, its air conditioning system and to ensure quality of electrical supply for high-precision electronic devices used to analyze the samples.
Electrical network protected and monitored via the Intranet siteThe solution implemented involves recovering power data via metering units that also allows measurement of basic electrical parameters as well as verification of energy power quality. Connected to a web server, an Internet browser allows to use them very simply and export data in a Microsoft Excel™ type spreadsheet. Power curves can be plotted in real time by the spreadsheet (Fig. K11).
Therefore no IT investment, either in software or hardware, is necessary to use the data.
For example to reduce the electricity bill and limit consumption during nighttime and weekends, we have to study trend curves supplied by the measurement units (Fig. K12).
Fig. K12 : A Test to stop all lighting B Test to stop air conditioning Here consumption during non-working hours seems excessive, consequently two decisions were taken: b reducing night time lighting b stopping air conditioning during weekends The new curve obtained shows a significant drop in consumption.
4 From electrical measurement to electrical information
Fig. K11 : Example of electrical network protected and monitored via the Intranet site

Schneider Electric - Electrical installation guide 2007
K - Energy Efficiency in electrical distribution
K16
Most organisations will already have some level of energy information system, even if it is not identified or managed as one. It should be appreciated that in a changing working world, any information system will need to develop to meet its prime objective - supporting management decision making: a key point is to make the energy information visible at any level of the organization through the communication infrastructure.
Energy data is important data, it is one of the company’s assets. The company has IT managers who are already in charge of managing its other IT systems. These are important players in the power monitoring system and above all in that for data exchange within the corporate organization.
5.1 Communication network at product, equipment and site level
The day-to-day working of the energy information system can be illustrated by aclosed loop diagram (Fig. K13).
5 Communication and Information System
Various resources are used to send data from metering and protection devices installed in the user’s electrical cabinets, e.g. via Schneider ElectricTransparent Ready™.
The Modbus communication protocolModbus is an industrial messaging protocol between equipment that is interconnected via a physical transmission link e.g. RS 485 or Ethernet (via TCP/IP) or modem (GSM, Radio etc). This protocol is very widely implemented on metering and protection products for electrical networks.
Initially created by Schneider Electric, Modbus is now a public resource managed by an independent organization Modbus-IDA – enabling total opening up of its specification. An industrial standard since 1979, Modbus allows millions of products to communicate with one another. The IETF, international authority managing the Internet, has approved the creation of a port (502) for products connected to the Internet/Intranet and using the Ethernet Modbus TCP/IP communication protocol.
Modbus is a query/reply process between two pieces of equipment based on data reading and writing services (function codes).The query is emitted by a single “master”, the reply is sent only by the “slave” equipment identified in the query (Fig. K14).Each “slave” product connected to the Modbus network is set by the user with an ID number, called the Modbus address, between 1 and 247.The “master” – for example a web server included in an electrical cabinet – simultaneously queries all of the products with a message comprising its target’s address, function code, memory location in the product and quantity of information, at most 253 octets.Only a product set with the corresponding address answers the request for data.Exchange is only carried out on the initiative of the master (here the web server): this is the master-slave Modbus operating procedure.
Fig. K13 : System hierarchy
Data
Information
Understanding
* Communication network
Modbus*Intranet*
Energy information systems
Communicating
measurement device*

Schneider Electric - Electrical installation guide 2007
K - Energy Efficiency in electrical distribution
K17
5 Communication and Information System
This query procedure followed by a reply, implies that the master will have all of the data available in a product when it is queried.The “master” manages all of the transaction queries successively if they are intended for the same product. This arrangement leads to the calculation of a maximum number of products connected to the master to optimize an acceptable response time for the query initiator, particularly when it is a low rate RS485 link.
Fig. K14 : The function codes allow writing or reading of data. A transmission error software detection mechanism called CRC16 allows a message with an error to be repeated and only the product concerned to respond.
Your Intranet network
Data exchange from industrial data basically uses web technologies implemented permanently on the corporate communication network, and more particularly on its Intranet.
The IT infrastructure manages the cohabitation of software applications: the company uses it to operate applications for the office, printing, data backup, for the corporate IT system, accounting, purchasing, ERP, production facility control, API, MES, etc. The cohabitation of data on the same communication network does not pose any particular technological problem.
When several PC’s, printers and servers are connected to one another in the company’s buildings, very probably using the Ethernet local network and web services: this company is then immediately eligible to have energy efficiency data delivered by its electrical cabinets. Without any software development, all they need is an Microsoft Internet Explorer type Internet browser.
The data from these applications cross the local broadband Ethernet network up to 1 Gb/s: the communication media generally used in this world is copper or optic fiber, which allows connection everywhere, in commercial or industrial buildings and in electrical premises.
If the company also has an internal Intranet communication network for emailing and sharing web servers data, it uses an extremely common standardized communication protocol: TCP/IP.
The TCP/IP communication protocol is designed for widely used web services such as HTTP to access web pages, SMTP for electronic messaging between other services.
Applications SNMP NTP RTPS DHCP TFTP FTP HTTP SMTP Modbus
Transport UDP TCP
Link IP
Physical Ethernet 802.3 and Ethernet II

Schneider Electric - Electrical installation guide 2007
K - Energy Efficiency in electrical distribution
K18
Electrical data recorded in industrial web servers installed in electrical cabinets are sent using the same standardized TCP/IP protocol in order to limit the recurrent IT maintenance costs that are intrinsic in an IT network. This is the operating principle of Schneider Electric Transparent Ready TM for communication of data on energy efficiency. The electrical cabinet is autonomous without the need for any additional IT system on a PC, all of the data related to energy efficiency is recorded and can be circulated in the usual way via the intranet, GSM, fixed telephone link, etc.
SecurityEmployees that are well informed, more efficient and working in complete electrical safety: they no longer need to go into electrical rooms or make standard checks on electrical devices - they just have to consult data. Under these conditions, communicative systems give the company’s employees immediate and significant gains and avoid worrying about making mistakes.It becomes possible for electricians, maintenance or production technicians, on-site or visiting managers to work together in complete safety.According to the sensitivity of data, the IT manager will simply give users the appropriate access rights.
Marginal impact on local network maintenanceThe company’s IT manager has technical resources to add and monitor equipment to the local company network.Based on standard web services including the Modbus protocol on TCP/IP, and due to the low level of bandwidth requirement characteristic in electrical network monitoring systems as well as the use of technologies that are not impacted by viruses and worldwide IT standards, the IT manager does not have to make any specific investment to preserve the local network performance level or to protect against any additional security problems (virus, hacking, etc.).
Empowering external partnersAccording to the company’s security policy, it becomes possible to use support services of the usual partners in the electrical sector: contractors, utilities managers, panelbuilders, systems integrators or Schneider Electric Services can provide remote assistance and electrical data analysis to the company consuming electricity.The messaging web service can regularly send data by email or web pages can be remotely consulted using the appropriate techniques.
5 Communication and Information System

Schneider Electric - Electrical installation guide 2007
K - Energy Efficiency in electrical distribution
K19
5.2 From Network Monitoring and Control System to Intelligent Power Equipment
Traditionally and for years, monitoring and control systems have been centralized and based on SCADA (Supervisory, Control and Data acquisition) automation systems. Deciding on investing in such system – noted (3) in Figure K15 – was really reserved for high demanding installation, because either they were big power consumers, or their process was very sensitive to Power non quality. Based on automation technology, such systems were very often designed, customised by a system integrator, and then delivered on site. However the initial cost, the skills needed to correctly operate such system, and the cost of upgrades to follow the evolutions of the network may have discouraged potential users to invest. Then based on a dedicated solution for electrician, the other approach noted (2) is much more fitting the electrical network specific needs and really increases the payback of such system. However, due to its centralised architecture, the level cost of such solution may still appear high.
On some sites Type (2) and (3) can cohabit, providing the most accurate information to the electrician when needed.Nowadays, a new concept of intelligent Power equipment – noted (1) – has come. considered as an entering step for going to level 2 or 3, due the ability of these solutions to co-exist on a site.
Specialised monitoringsuch as Power Logic SMS
Wstandard
eb browser
PowerEquipment
Otherutilities Process
Eqt gateway
1
2
3
IntelligentPowerEquipment
Otherutilities
Eqt server
PowerEquipment
Eqt server
General purposesite monitoring
Functionlevels
Specialisednetworkmonitoring
Basicmonitoring
Standard network Sensitive electrical networks High demanding sites
Systemcomplexity
General purposemonitoring system
Fig. K15 : Monitoring system positioning
5 Communication and Information System

Schneider Electric - Electrical installation guide 2007
K - Energy Efficiency in electrical distribution
K20
Intelligent equipment based architecture (see Fig. K16)This new architecture has appeared recently due to Web technology capabilities, and can really be positioned as an entry point into monitoring systems.Based on Web technologies it takes the maximum benefits of standardcommunication services and protocols, and license-free software.The access to electricity information can be done from everywhere in the site, and electrical staff can gain a lot in efficiency.Openness to the Internet is also offered for out of the site services.
Electrician specialized centralised architecture (see Fig. K17)Dedicated to electrician, this architecture is based on a specific supervision centralised mean that fully match the needs for monitoring an electrical network.Then it offers naturally a lower level of skill to set up and maintain it – all Electrical Distribution devices are already present in a dedicated library. Finally its purchase cost is really minimized, due the low level of system integrator effort.
Fig. K17 : ED specialist monitoring system
5 Communication and Information System
Meter 11 2 3
Circuit breakersMeter 2 Meter 3
Equipment serverGateway
Modbus
Intelligence Power Equipment
Standard remoteWeb browser
Standard local Web browser
Intranet (Ethernet/IP)
Internet
Fig. K16 : Intelligent equipment architecture
Meter 1 Meter 2 Meter 3
Gateway
Modbus
Communicating Power Equipment
Dedicated supervisorfor electrician
Modbus (SL or Ethernet/IP)
Circuit breakers
1 2 3

Schneider Electric - Electrical installation guide 2007
K - Energy Efficiency in electrical distribution
K21
Conventional general purpose centralised architecture (see Fig. K18)Here is a typical architecture based on standard automation pieces such as SCADA systems, and gateways.Despite its real efficiency, such architecture suffered from some drawbacks such as :b The level of skills needed to operate itb The poor upgradabilityb And at the end the risky payback of such solutionsThey have however no equivalent for high demanding sites, and appears very relevant for central operation rooms.
Fig. K18 : Real-time conventional monitoring and control system
5.3 e-Support becomes accessible
The setting up of an information system to support a global energy efficiency approach very quickly leads to economic gains, in general with an ROI of less than 2 years for electricity.
An additional benefit, that is still underestimated today, is the leverage that this leads to in terms of information technologies in the electrical sector. The electrical network can be analyzed from time to time by third parties – in particular using external competencies via the internet for very specific issues:b Electricity supply contracts. Changing of supplier at a given point in time, e.g. permanent economic analysis of the costs related to consumption becomes possible without having to wait for an annual review.b Total management of electrical data – via internet – to transform it into relevant information that is fed back via a personalized web portal. Consumer usage information is now a value-added commodity, available to a wide range of users. It's easy to post customer usage data on the Internet – making it useful to the users is another matter.b Complex electrical fault diagnosis to call in an electotechnical expert, a rare resource that is easily accessible on the web.b Monitoring of consumption and generating alerts in the case of abnormal consumption peaks. b A maintenance service that is no more than necessary to meet pressure on overheads via facility management services.
Energy efficiency is no longer an issue that the company has to face on its own, many e-partners can back up the approach as necessary – in particular when the measurement and decision making assistance stage is reached, on condition that the electrical network is metered and communicative via internet.Implementation can be gradual starting by making a few key pieces of equipment communicative and gradually extending the system so as to be more accurate or to give wider coverage of the installation.
5 Communication and Information System
Meter 1 Meter 2 Meter 3
Gateway
Modbus
Conventionalsupervisor
Modbus (SL or Ethernet/IP)
Communicating Power Equipment
Circuit breakers
1 2 3

Schneider Electric - Electrical installation guide 2007
K - Energy Efficiency in electrical distribution
K22
The company can choose its policy: ask one or more partners to analyze the data, do it itself or combine these options.The company may decide to manage its electrical energy itself, or ask a partner to monitor the quality to ensure active monitoring of performances in terms of aging.
Example:Schneider Electric proposes e-Services that offers load data visualization and analysis application in ASP mode. It simplifies processes for tenants with geographically diverse locations by providing convenient integrated billing and usage information for all locations combined. The system turns customer usage data into useful information, easily accessible to all internal users. It helps control costs by showing customers how their organizations use power.
A wide range of functionality serves the needs of staff from the same platform:Data Access and Analysis , Historical and Estimated Bills, Rate Comparison, What-if Analysis - Assess the impact of operational changes, such as shifting energy between time periods or reducing usage by fixed amounts or percentages, Automatic Alarming, Memorized Reports, Benchmarking - Benchmark usage data from multiple facilities by applying normalization factors such as square footage, operating hours, and units of production. Multiple Commodities - Access usage data for gas and water as well as electricity etc.
5 Communication and Information System
ReportsODBC
XML
ElectricityWater & Gas
Power Quality
Ethernet/VPN Ethernet/VPN
New York Chicago Los Angeles Seattle
Stores data including:- Occupancy rates- Square footage- Other parameters
Normalize data using:- Temperature- Occupancy rates- Rooms- Other parameters
Energy CostAnalysis
WEB
CorporateDatabase
Weather info
Utility tariffs & rates
Real-time pricingWEB
Fig. K19 : Typical solution exemple