energy efficiency in your home”: results … · · 2010-04-23saku (estonia) 114 online and...
TRANSCRIPT

“ENERGY EFFICIENCY IN YOUR HOME”: RESULTS FROM A SURVEY IN 12 CENTRAL AND EASTERN EUROPEAN MUNICIPALITIES
Philipp Engewald Matthias Grätz

Authors:
Philipp Engewald
Baltic Environmental Forum Deutschland e.V.
Osterstraße 58, 20259 Hamburg, Germany
Tel: +49 40 53 30 70 75
E-mail: [email protected]
Matthias Grätz
Baltic Environmental Forum Deutschland e.V.
Osterstraße 58, 20259 Hamburg, Germany
Tel: +49 40 53 30 70 76
E-mail: [email protected]
INTENSE coordinating partner:
Ingrida Bremere
Project manager
Baltic Environmental Forum, Latvia
INTENSE
Intelligent energy saving measures for municipal housing in Central and Eastern European countries
Legal disclaimer
The sole responsibility for the content of this document lies with the authors. The document does not represent the opinion of the Community. The European Commission is not responsible for any use that may be made of the information contained therein.


INTENSE Background Paper Energy efficiency in your home: Survey in 12 Central and Eastern European municipalities 4
Contents
Introduction ................................................................................................................................................................. 7
Methodology ............................................................................................................................................................... 8
Results ............................................................................................................................................................................ 9
Saku (Estonia) ....................................................................................................................................................... 10
General information ...................................................................................................................................... 10
Overview of housing conditions of the respondents ........................................................................ 10
Upgrading old houses .................................................................................................................................. 11
Using renewables........................................................................................................................................... 11
Financing measures ...................................................................................................................................... 11
Energy use: heating and electricity .......................................................................................................... 12
Knowledge and information about energy efficiency ...................................................................... 13
Demographic data ......................................................................................................................................... 15
Cēsis (Latvia) ......................................................................................................................................................... 16
General information: ..................................................................................................................................... 16
Overview of housing conditions of the respondents ........................................................................ 16
Upgrading old houses .................................................................................................................................. 17
Using renewables........................................................................................................................................... 17
Financing measures: ..................................................................................................................................... 17
Energy use: heating and electricity .......................................................................................................... 17
Knowledge and information about energy efficiency ...................................................................... 19
Demographic data ......................................................................................................................................... 21
Riga (Latvia) .......................................................................................................................................................... 22
General information: ..................................................................................................................................... 22
Overview of housing conditions of the respondents ........................................................................ 22
Using renewables........................................................................................................................................... 23
Financing measures: ..................................................................................................................................... 23
Energy use: heating and electricity .......................................................................................................... 23
Knowledge and information about energy efficiency ...................................................................... 25
Demographic data ......................................................................................................................................... 28
Elektrėnai(Lithuania) ......................................................................................................................................... 29
General information ...................................................................................................................................... 29
Overview of housing conditions of the respondents ........................................................................ 29
Upgrading old houses (built before 1990) ............................................................................................ 30
Using renewables........................................................................................................................................... 30
Financing measures: ..................................................................................................................................... 30
Energy use: heating and electricity .......................................................................................................... 31
Knowledge and information about energy efficiency ...................................................................... 32

INTENSE Background Paper Energy efficiency in your home: Survey in 12 Central and Eastern European municipalities 5
Demographic data ......................................................................................................................................... 35
Moravian Karst Region (Czech Republic) .................................................................................................... 36
General information ...................................................................................................................................... 36
Overview of housing conditions of the respondents ........................................................................ 36
Upgrading old houses (built before 1990) ............................................................................................ 37
Using renewables........................................................................................................................................... 37
Financing measures ...................................................................................................................................... 37
Energy use: heating and electricity .......................................................................................................... 37
Knowledge and information about energy efficiency ...................................................................... 38
Demographic data ......................................................................................................................................... 41
Ružomberok (Slovakia) ..................................................................................................................................... 42
General information ...................................................................................................................................... 42
Overview of housing conditions of the respondents ........................................................................ 42
Upgrading old houses (built before 1990) ............................................................................................ 43
Using renewables........................................................................................................................................... 43
Financing measures: ..................................................................................................................................... 43
Energy use: heating and electricity .......................................................................................................... 43
Knowledge and information about energy efficiency ...................................................................... 44
Demographic data ......................................................................................................................................... 47
Veszprém (Hungary) .......................................................................................................................................... 48
General information ...................................................................................................................................... 48
Overview of housing conditions of the respondents ........................................................................ 48
Upgrading old houses .................................................................................................................................. 49
Using renewables........................................................................................................................................... 49
Financing measures: ..................................................................................................................................... 49
Energy use: heating and electricity .......................................................................................................... 50
Knowledge and information about energy efficiency ...................................................................... 51
Demographic data ......................................................................................................................................... 53
Ptuj (Slovenia) ...................................................................................................................................................... 54
General information ...................................................................................................................................... 54
Overview of housing conditions of the respondents ........................................................................ 54
Upgrading old houses (built before 1990) ............................................................................................ 55
Using renewables........................................................................................................................................... 55
Financing measures ...................................................................................................................................... 55
Energy use: heating and electricity .......................................................................................................... 55
Knowledge and information about energy efficiency ...................................................................... 56
Demographic data ......................................................................................................................................... 59
Băile Tuşnad (Romania) .................................................................................................................................... 60
General information ...................................................................................................................................... 60

INTENSE Background Paper Energy efficiency in your home: Survey in 12 Central and Eastern European municipalities 6
Overview of housing conditions of the respondents ........................................................................ 60
Upgrading old houses (built before 1990) ............................................................................................ 61
Using renewables........................................................................................................................................... 61
Financing measures ...................................................................................................................................... 62
Energy use: heating and electricity .......................................................................................................... 62
Knowledge and information about energy efficiency ...................................................................... 63
Demographic data ......................................................................................................................................... 66
Koprivnica (Croatia) ........................................................................................................................................... 67
General information ...................................................................................................................................... 67
Overview of housing conditions of the respondents ........................................................................ 67
Upgrading old houses (built before 1990) ............................................................................................ 68
Using renewables........................................................................................................................................... 68
Financing measures ...................................................................................................................................... 69
Energy use: heating and electricity .......................................................................................................... 69
Knowledge and information about energy efficiency ...................................................................... 70
Demographic data ......................................................................................................................................... 72
Samobor (Croatia) .............................................................................................................................................. 73
General information: ..................................................................................................................................... 73
Overview of housing conditions of the respondents ........................................................................ 73
Upgrading old houses (built before 1990) ............................................................................................ 74
Using renewables........................................................................................................................................... 74
Financing measures ...................................................................................................................................... 74
Energy use: heating and electricity .......................................................................................................... 75
Knowledge and information about energy efficiency ...................................................................... 76
Demographic data ......................................................................................................................................... 78
Sapareva Banya (Bulgaria) ............................................................................................................................... 79
General information ...................................................................................................................................... 79
Overview of housing conditions of the respondents ........................................................................ 79
Using renewables........................................................................................................................................... 80
Financing measures ...................................................................................................................................... 80
Energy use: heating and electricity .......................................................................................................... 81
Knowledge and information about energy efficiency ...................................................................... 82
Demographic data ......................................................................................................................................... 84
Conclusions ............................................................................................................................................................... 85
Annex 1: The questionnaire ................................................................................................................................. 87

INTENSE Background Paper Energy efficiency in your home: Survey in 12 Central and Eastern European municipalities 7
Introduction
Global environmental and financial developments have put energy issues not only onto the political but also on the public agenda. Rising energy prices, concerns about global warming and dependency of Central and Eastern-Europe on energy imports from Russia urge many countries to leave trodden paths and look for new solutions to satisfy their energy demands. Facing these new challenges on the one hand, Central and Eastern European countries have still to cope with their socialist heritage and with the aftermath of the transition period. Many houses are still insufficiently insulated and waste enormous amounts of energy. Consumption patterns have drastically changed during the past 20 years: From years of scarcity to the appar-ently unlimited, and often not reflected, possibilities of consumption of today. Energy saving is a relatively new issue for many of the citizens which suddenly became important due to in-creasing prices, and even energy shortages (stop of the gas delivery from Russia in the winter 2007/08).
By now, it is apparent that massive efforts are necessary to reduce the energy demand and to increase the overall energy efficiency. Such a Herculean task requires efforts from each and every one and it is high time for a change in consumption patterns. In the light of these chal-lenges, this publication get an indication about the state of knowledge and awareness on en-ergy efficiency and the behaviour of citizens with respect to consuming energy of citizens. For that purpose, a survey was conducted in selected municipalities Central and Eastern Europe which results are presented in this publication.
The first chapter will explain the applied methodology and provide the reader with details how the survey was carried out. Following the introductory part, the second chapter will present the results from each of the 12 municipalities that took part in the survey. Conclusions will com-plete this chapter. In the annex, the reader will find the questionnaire for reference.
Hamburg, March 2010.

INTENSE Background Paper Energy efficiency in your home: Survey in 12 Central and Eastern European municipalities 8
Methodology
The questionnaire which was used in the frame of the survey was first developed in English. It was then translated into the local languages and adjusted to the local cir-cumstances. The mode of distribution was not prescribed. Each municipality could freely decide how to distribute the ques-tionnaires and collect the data, provided a random sample is ensured. Consequently the methods used by the municipality were quite diverse, starting from collecting an-swers on the streets to running a competi-tion. The surveys were conducted from September 2009 until January 2010.
The selected municipalities are the partner municipalities of the INTENSE project.
Despite innovative approaches and large efforts by the participating municipalities it proved to be difficult to reach citizens and to convince them to participate in the sur-
vey. In the case of the Polish municipality, it was impossible to motivate a sufficient number of citizens to fill in the question-naire. The initial goal for the survey was to reach 2.700 inhabitants. This threshold was unfortunately not met. Due to the different modes of distribution it is not possible to say how many citizens were addressed ei-ther with the paper version or electroni-cally, however, from the data given by the municipalities we know that in total more than 6.600 inhabitants have been ap-proached.
After collecting the data, paper versions were entered into the online version. All questionnaires were evaluated using statis-tical software following the same proce-dure for all countries (See also Annex 1 for more information about availability of translations and raw data).
Municipality Aumount. of ques-tionnaires used for
evaluation
Method of collecting the data
Saku (Estonia) 114 Online and paper version distributed
Cēsis (Latvia) 111 Online and paper version distributed
Rīga (Latvia) 158 Online and paper version distributed
Elektrėnai (Lithuania) 191 Paper version distributed
Ożarów (Poland — Online, paper versions distributed; due to low feedback this municipality will not be included in the evaluation
Moravian Karst region (Czech Republic) 225 Distributed through schools and online
Ružomberok (Slovakia) 148 Online and paper version distributed
Veszprém (Hungary) 365 Survey in the streets (Paper)
Ptuj (Slovenia) 101 Online
Băile Tuşnad (Romania) 55 Paper versions distributed
Koprivnica (Croatia) 136 Online
Samobor (Croatia) 100 Online
Sapareva Banya (Romania) 130 Paper version distributed
TOTAL 1834

INTENSE Background Paper Energy efficiency in your home: Survey in 12 Central and Eastern European municipalities 9
Results
The following chapter will present the re-sults of the 12 municipalities which have taken part in the survey. The municipalities are sorted approximately from North to South.
The questionnaire as it was used in 11 mu-nicipalities is attached as a reference in annex 1. The Hungarian version of the questionnaire differs slightly in a few, neg-ligible points. All surveys were evaluated following a common scheme, in which all question blocks were evaluated step by step. The first section provides an overview about the municipality in general and gives some key figures about the structure of the building stock, such as type of buildings, age or size. After that, two small paragraphs about upgrading, using renewables and financing investments into homes will fol-low. The third part deals with energy use, i.e. heating and cooling, metering and thermal comfort. The following section outlines the level of knowledge about en-
ergy issues and some behaviour patterns, such as sources of information used or trust in stakeholders. Finally, some demographic data about the respondents will be given.
It should be pointed out some questions were not evaluated for several reasons. On the one hand, a selection was made by the authors to keep the publication in a rea-sonable length. On the other hand, some questions were left out because they did not deliver any useable results. A typical example is the question about the electric-ity consumption of the respondents. From the data it was clear that most of the resi-dents do have no idea about their electric-ity consumption and the data suggest that many respondents have entered wrong or random figures.
Saku (Estonia)
INTENSE Background Paper Energy efficiency in your home: Survey in 12 Central and Eastern European municipalities 10
Saku (Estonia)
General information
By its territory Saku Municipality is a small rural municipality in Estonia, covering 171 km² and situated nearby the country’s capi-tal Tallinn. But the population of almost 9,000 citizens makes Saku one of the big-gest among Estonian rural municipalities. Due to its close proximity to Tallinn, Saku is a relatively young municipality. It is the s administrative centre is a small town Saku (approx 4,700 inhabitants), which is called ―Beer Culture Capital‖ because Estonia’s biggest brewery is situated here. The al-most 200 years old historical Saku Manor main building (designed by Carlo Rossi) is a great example of classicism and it is used as a recreational and conference centre today. During the Soviet period Saku got famous as an important agricultural research cen-tre, nowadays scientific and administrative
work is done by Estonian Research Institute of Agriculture and Estonian Agricultural Board. Still more than a half of Saku citizens are occupied outside of Saku (mainly in Tallinn). Economically Tallinn area is the wealthiest part of country and the average income in Saku is much higher than the Estonian average.
Overview of housing conditions of the respondents
> Number of residents (rural district): 8,900
> Number of valid responses: 114 > Share of house ownership: 99.1% (109
of 110)
Structure of housing:
> 60% detached houses (one or more storeys)
> 40% apartment houses or town houses (neighbouring units on both sides but not above or below)
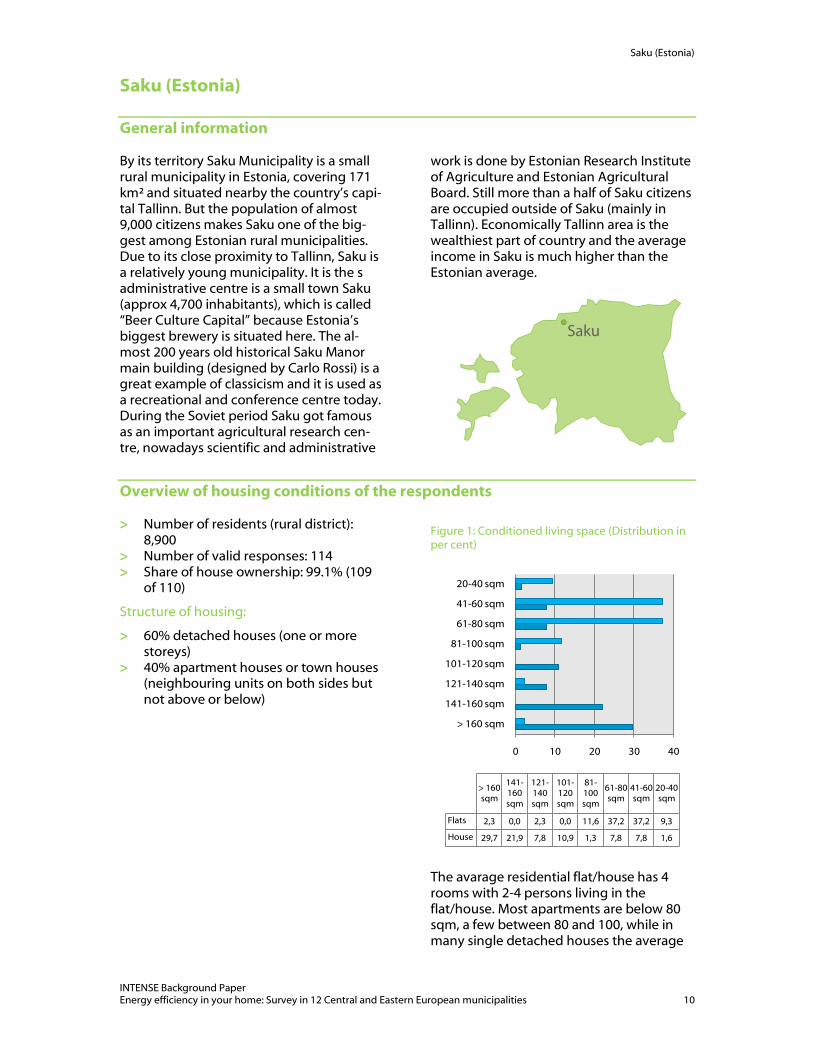
Figure 1: Conditioned living space (Distribution in per cent)
The avarage residential flat/house has 4 rooms with 2-4 persons living in the flat/house. Most apartments are below 80 sqm, a few between 80 and 100, while in many single detached houses the average
0 10 20 30 40
> 160 sqm
141-160 sqm
121-140 sqm
101-120 sqm
81-100 sqm
61-80 sqm
41-60 sqm
20-40 sqm
> 160 sqm
141-160 sqm
121-140 sqm
101-120 sqm
81-100 sqm
61-80 sqm
41-60 sqm
20-40 sqm
Flats 2,3 0,0 2,3 0,0 11,6 37,2 37,2 9,3
House 29,7 21,9 7,8 10,9 1,3 7,8 7,8 1,6

Saku (Estonia)
INTENSE Background Paper Energy efficiency in your home: Survey in 12 Central and Eastern European municipalities 11
living space is around 150 sqm. The figure is a bit less for buildings with one floor, a bit more for buildings with two floors.
More than half of the single detached houses were built after the year 2000, most of them even after 2005. This reflects the
building boom, triggered by rising incomes and attractive bank loans, that took place in all the Baltic States in these years. In con-trast, the apartment buildings were almost exclusively erected between 1961 and 1990. In total 59% of respondents live in buildings built before 1990.
Upgrading old houses
When it comes to upgrading houses, it shows that the most houses have under-gone at least some renovation. The com-mon measure chosen is the exchange of windows. The motivation is probably that this is the cheapest but also least effective measure. In flats/ houses built before 1990, in 63.1% of all cases or 41 flats, new win-dows were installed. The ceiling was insu-lated in 28 flats (43.8%) and the outside will was insulated in 22 cases (33.8%).
Only houses that were built before 1990 were considered:
Figure 2: Upgrading measures (Responses in per cent)
Using renewables
In the past years, some renovation meas-ures were undertaken, which included the use of renewables or alternative energy sources. In 5 homes, solar collectors were added and in 25 homes heat pumps were installed.
7% of all respondents (13 respondents) plan to undertake retrofitting measures or using renewables within the next 5 years
.
Financing measures
The majority of citizens claimed to have invested into their homes in the last 3 years (82.7% of all valid responses). Interestingly most of them financed the measures them-selves; out of all 91 respondents, 61 fi-nanced renovation measures partly by themselves, out of them 43 fully. In 7 cases a bank loan specifically foreseen for retrofit-ting measures was used, in 20 cases an or-dinary bank loan. In no case were both loan types combined. In 10 out of these 27 cases, the investment was fully financed through the bank loan. State of municipal support is practically nonexistent. There is only one case were a national support pro-gramme contributed with 10% of the nec-essary investment sum.
33,8
43,8
63,1
0 10 20 30 40 50 60 70
Wall insulation added
Insulation of ceiling added
New windows installed

Saku (Estonia)
INTENSE Background Paper Energy efficiency in your home: Survey in 12 Central and Eastern European municipalities 12
Energy use: heating and electricity
Figure 3: Heating sources (Responses in per cent
The use of energy sources for heating is diverse. Traditionally, wood is one of the main sources for heating. The share of houses with wood heating differs between the type of building. While the heating sys-tem of 53.8% of all single detached houses is operated by wood, however this is the case in only 9.1% of town houses and multi-storey houses. Wood pellet heating is rarely used so far. Only three single detached houses, built after 2005 employ such a sys-tem.
A different pattern can be found in the typical apartment houses built between 1961 and 1990. 40.5% are heated by central heating and 43.2% by district heating. In very few cases gas, electricity and wood were used as heating sources. The question is however, which resource is used for cen-tral or district heating.
Roughly a third of all respondent make use of additional portable electric heaters. There is a slight tendency of house owners to have more portable heating devices compared to residents in apartments.
Cooling
Approximately 15% of all respondents make use of electronic cooling devices; the remaining respondents only cool by man-ual ventilation. Given the fact, that Estonia is among the coldest regions in CEE, this figure appears comparatively high.
Individual metres and cost control
80% of respondents do not have an indi-vidual heating metre and 43.1% of all re-spondents that do have radiators cannot regulate them at all, almost all of them live in apartment buildings. The low figure of individual metres is a wide-spread problem in the Baltic States and the figures from Saku reflect this situation.
Regarding electricity, the data suggest that the average household pays approximately 5% of the household income for electricity.
Thermal comfort
Figure 4: Typical temperature at which people feel comfortable (Responses in per cent)
Most people state that they feel comfort-able at temperatures between 19-24 °C with a tendency to higher temperatures.
2,6
2,6
4,4
11,4
15,8
19,3
20,2
26,3
36,8
0 10 20 30 40 50 60 70
Coal heating
Wood pellet heating
Oil heating
Gas heating
Heat pump
District heating
Central heating …
Electric heating
Wood heating
1,8
37,2
58,3
2,7
0 10 20 30 40 50 60 70
16-18°C
19-21°C
22-24°C
25-27°C

Saku (Estonia)
INTENSE Background Paper Energy efficiency in your home: Survey in 12 Central and Eastern European municipalities 13
Knowledge and information about energy efficiency
Figure 5: How respondents rate their level of in-formation about energy efficiency (Responses in per cent)
Most Saku citizens feel informed about energy efficiency issues, only 4.6% of all respondents claim to be not informed at all. The average knowledge of Saku citizens on a scale from 1-4 (1=very informed, 4=no information at all) is 2.25.
Information sources used
Figure 6: How frequently respondents use different information sources (Responses in per cent)
Among the most used sources for informa-tion are the general mass media that are easily accessible: Internet, newspa-per/magazines and television. Brochures and guide books are rarely used.
Very informed;
16,5
Informed; 41,2
Somewhat informed;
35,8
Not informed at all; 4,6
0% 10% 20% 30% 40% 50% 60% 70% 80% 90% 100%
Radio
Leaflets
Reference books
TV
Special journals
Newspapers
Internet
Radio LeafletsReference
booksTV
Special journals
Newspapers Internet
Very frequently 5,2 6,3 7,4 7,8 9,4 10,7 14,6
Frequently 24,7 15,8 11,6 41,7 20,8 40,8 37,9
Rarely 34,0 40,0 24,2 29,1 15,6 27,2 26,2
Very rarely 20,6 26,3 26,3 14,6 20,8 13,6 6,8
Not at all 15,5 11,6 30,5 6,8 33,3 7,8 14,6
Saku (Estonia)
INTENSE Background Paper Energy efficiency in your home: Survey in 12 Central and Eastern European municipalities 14
Topics of Interest
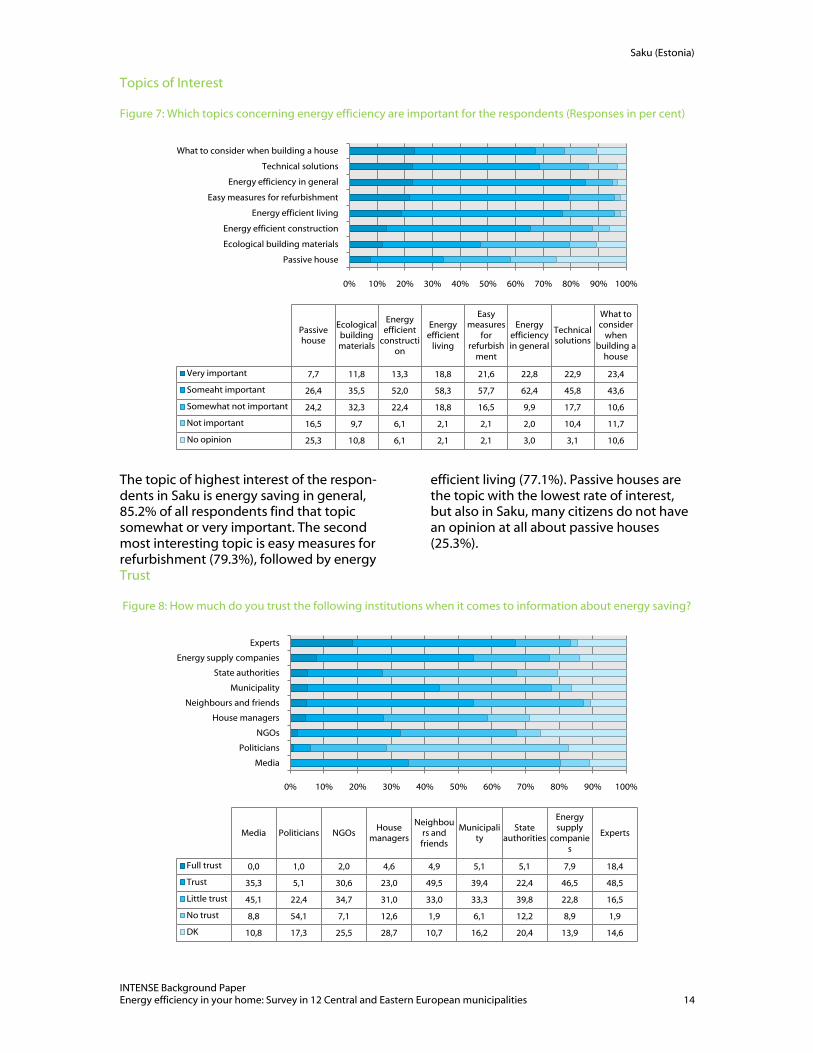
Figure 7: Which topics concerning energy efficiency are important for the respondents (Responses in per cent)
The topic of highest interest of the respon-dents in Saku is energy saving in general, 85.2% of all respondents find that topic somewhat or very important. The second most interesting topic is easy measures for refurbishment (79.3%), followed by energy
efficient living (77.1%). Passive houses are the topic with the lowest rate of interest, but also in Saku, many citizens do not have an opinion at all about passive houses (25.3%).
Trust
Figure 8: How much do you trust the following institutions when it comes to information about energy saving?
0% 10% 20% 30% 40% 50% 60% 70% 80% 90% 100%
Passive house
Ecological building materials
Energy efficient construction
Energy efficient living
Easy measures for refurbishment
Energy efficiency in general
Technical solutions
What to consider when building a house
Passive house
Ecological building materials
Energy efficient
construction
Energy efficient
living
Easy measures
for refurbish
ment
Energy efficiency in general
Technical solutions
What to consider
when building a
house
Very important 7,7 11,8 13,3 18,8 21,6 22,8 22,9 23,4
Someaht important 26,4 35,5 52,0 58,3 57,7 62,4 45,8 43,6
Somewhat not important 24,2 32,3 22,4 18,8 16,5 9,9 17,7 10,6
Not important 16,5 9,7 6,1 2,1 2,1 2,0 10,4 11,7
No opinion 25,3 10,8 6,1 2,1 2,1 3,0 3,1 10,6
0% 10% 20% 30% 40% 50% 60% 70% 80% 90% 100%
Media
Politicians
NGOs
House managers
Neighbours and friends
Municipality
State authorities
Energy supply companies
Experts
Media Politicians NGOsHouse
managers
Neighbours and friends
Municipality
State authorities
Energy supply
companies
Experts
Full trust 0,0 1,0 2,0 4,6 4,9 5,1 5,1 7,9 18,4
Trust 35,3 5,1 30,6 23,0 49,5 39,4 22,4 46,5 48,5
Little trust 45,1 22,4 34,7 31,0 33,0 33,3 39,8 22,8 16,5
No trust 8,8 54,1 7,1 12,6 1,9 6,1 12,2 8,9 1,9
DK 10,8 17,3 25,5 28,7 10,7 16,2 20,4 13,9 14,6

Saku (Estonia)
INTENSE Background Paper Energy efficiency in your home: Survey in 12 Central and Eastern European municipalities 15
It shows that individual experts enjoy the highest trust, followed by energy supply companies, neighbours and friends and the municipality. The media, although an im-portant source of information, as well as politicians enjoy little trust. State institu-tions are considered less trustworthy than municipal ones. Some respondents men-tioned additionally research institutions such as the technical university as trustwor-thy sources of information.
Energy consultancy
Would you be willing to pay for profes-sional advice on increasing the energy efficiency in your home?
Would like to get profes-sional advice for your home on efficiency measures?
Yes, sure
Yes likely
Probably not
Not at all
Yes, for sure 5 6 5 0
Yes, likely 0 19 22 3
57.8% of Saku’s citizens would appreciate pro-fessional advice on energy efficiency. Those who are willing to get such consul-tancy are also inclined to pay for profes-sional advice. This means that the first task is to convince citizens to get support re-garding energy efficiency questions.
Personal situation
Asked about their personal situation and feelings, about 75% responded that they feel affected by the current financial and economic crisis. It is very likely that also renovation projects will be downsized, de-layed or done by the house owners them-selves instead of hiring professionals.
At the moment, people are most anxious about the rise of energy prices (84.4% feel very or somewhat nervous), followed by the living costs in general (77.6%) and the current state of the global economy (72.5%).
Demographic data
The questions were answered by 53 women and 56 men. 61.6% have an aca-demic degree, 28.6% finished their educa-tion after secondary school.
Age In %
Younger than 18 0.9
18-24 5.3
25-34 21.2
35-44 23.9
45-54 19.5
55-64 18.6
65 and older 10.6

Cesis (Latvia)
INTENSE Background Paper Energy efficiency in your home: Survey in 12 Central and Eastern European municipalities 16
Cēsis (Latvia)
General information:
Cesis is an ancient, little town in the north-ern part of the Vidzeme central upland, 90 km from the Latvian capital city Riga. Cesis is built on a series of ridges above the river Gauja, overlooking the ―blue woods‖ below. The population is 18,065 and the total area of the city is 19,280.00 km2.
In 2006, Cesis celebrated its 800th anniver-sary. Cēsis has a rich history, starting from the old Vendi tribe castle, which has given the city its German name ―Wenden‖. During the Hansa union period, counsels of Hansa cities took place here as well. Finally, Cēsis is the origin of the red-white-red Latvian national flag.
Today, events such as the Imant’s Days and the performance by the Latvian State Opera have become tradition in the warmer months. In winter, Cēsis becomes a centre for skiing and snowboarding. Cēsis is
known well for the oldest brewery in Baltic States, it calls ―Cesu alus‖ giving work to almost 200 employees. There are branches of two universities in the town which gives young people the opportunity to study and work in Cēsis. Unfortunately, the current economical situation of Latvia has also af-fected Cēsis, leading to increased unem-ployment.
Overview of housing conditions of the respondents
> Number of residents: 18.300 > Number of valid responses: 111 > Share of house/flat ownership: 86.0%
(86 of 100)
Structure of housing:
> 35.5% detached houses (one or more storeys)
> 63.6% apartment houses (low and high rises)
> 0.9% town houses (neighbouring units on both sides but not above or below)
Looking on the flat size and number of in-habitants, it shows that single households are not widespread yet. Only 13.5% of the respondents live alone, 86.6% of them in apartments. The average size of the apart-ment or house differs substantially be-tween detached houses and apartments.
Figure 9: Conditioned living space (Distribution in per cent)
0 10 20 30 40 50 60
> 160 sqm
141-160 sqm
121-140 sqm
101-120 sqm
81-100 sqm
61-80 sqm
41-60 sqm
20-40 sqm
> 160 sqm
141-160 sqm
121-140 sqm
101-120 sqm
81-100 sqm
61-80
sqm
41-60
sqm
20-40
sqm
Flat 0 0 0 0 4,3 13 58 24,6
House 23,7 10,5 10,5 28,9 10,5 7,9 5,3 2,6

Cesis (Latvia)
INTENSE Background Paper Energy efficiency in your home: Survey in 12 Central and Eastern European municipalities 17
While the majority of flats in apartments are below 60 sqm, most houses have more than 80 sqm. The small size of flats has been one of the reasons for citizens to build their own homes.
The age of the building stock is typical for the region. There is a certain stock of older buildings, built before 1960 (22.7% in Cē-sis). The majority of buildings was built between 1961 and 1990. This is the period were also in Cēsis typical concrete slab block apartment houses were built. 81.4%
of high-rise apartment were erected in this period as well as 42.3% of the low-rise apartment blocks.
Regarding single detached houses, there is a more even distribution. A third was be-fore 1961, a third between 1961 and 1990 and a third after that. Interestingly, only 7.7% of detached houses were built since 2000. This shows that Cēsis is too far from Riga to be influenced by the increased sub-urbanization trend starting around the year 2000.
Upgrading old houses
When it comes to upgrading houses, it shows that the most houses have under-gone at least some renovation. Similar to the other municipalities, most citizens in Cēsis, that have undertaken renovation measures, chose the exchange of windows. More than two thirds of all respondents had new windows installed. 7 respondents consider upgrading their house in the next years.
Only houses that were built before 1990 were considered:
Figure 10: Upgrading measures (Responses in per cent)
Using renewables
Some citizens in Cēsis are using renewable sources of energy. There is one case of solar energy being employed and 10 respon-dents stated that a heat pump is installed in
their house. 9 of these 10 heat pumps are installed in buildings being built between 1961 and 1990, both in single detached houses and in apartment blocks.
Financing measures:
A slight majority of 59.0% of citizens stated that they have had investments into their homes in the last 3 years.
87.1% of all citizens that had invested con-tributed with own resources, 72.6% cov-ered the costs even fully from own re-
sources. A bank loan was used in 11 or 12 cases, in 4 cases the investment was fully financed by a bank loan. Financial support from local, regional or national authorities or programmes, or any other sources, does not play a role at all.
Energy use: heating and electricity
The use of energy sources for heating is diverse in Cēsis as well, but less than in other countries. District heating is the dominant heating system, 77.1% of all apartment houses are connected to a cen-
tral heating system. Wood and wood pel-lets on the other hand are mostly used as a heating source in single detached houses and to a lesser degree in apartment blocks. There is no significant change in the type of
16,5
26,3
71,4
0 20 40 60 80 100
Wall insulation added
Insulation of ceiling added
New windows installed

Cesis (Latvia)
INTENSE Background Paper Energy efficiency in your home: Survey in 12 Central and Eastern European municipalities 18
heating system that is employed for new houses, built after 1990. They are also con-nected to the district heating system, use gas or wood.
Figure 11: Heating sources (Responses in per cent)
Approximately 26.9% of all respondents make use of portable heaters, mostly one (23.1%).
Cooling
Electronic cooling plays a rather negligible role in Cēsis, only five respondents (3.9%) replied that they use such systems, four of them living in a single detached house. There are buildings of all ages until 1999 equipped with electronic buildings sys-tems, so that it can be assumed that in most cases, the system was installed in the last years.
Individual metres and cost control
Typical for the Baltic States, only 35.2% of all respondents have an individual heat metre. The figure is quite different if differ-entiated by type of residence. 71.4 % of all detached houses have an individual metre but so do only 17.4% of the flats in apart-ment houses.
Of those who have radiators installed, 45.9% cannot regulate them at all, 11.8% have one control unit for all radiators, and 42.4% have the possibility to regulate of radiators in their home. Mostly, inhabitants of flats in high-rise apartment buildings lack the opportunity to regulate their radiators - 65.5%.
The survey shows, that the inhabitants of Cēsis pay on average 8.6% of their house-hold income for electricity. 79.7% of inhabi-tants pay 10% or less.
Thermal comfort
Most people state that they feel comfort-able at temperatures between 19-21 °C, the second largest group is between 22-24 °C
Figure 12: Typical temperature at which people feel comfortable (Responses in per cent)
0,9
2,7
3,6
9
19,8
26,1
48,6
0 10 20 30 40 50 60 70
Electric heating
Heat pump
Wood pellet heating
Central heating system
Gas heating
Wood heating
District heating
9,1
51,8
36,4
2,7
0 10 20 30 40 50 60 70
16-18°C
19-21°C
22-24°C
25-27°C

Cesis (Latvia)
INTENSE Background Paper Energy efficiency in your home: Survey in 12 Central and Eastern European municipalities 19
Knowledge and information about energy efficiency
Less than half of the residents of Cēsis feel informed about energy efficiency issues, more than every tenth claims to be not informed at all (13.6%). The average knowl-edge of Cēsis citizens on a scale from 1-4 (1=very informed, 4=no information at all) is 2.57.
Figure 13: How respondents rate their level of infor-mation about energy efficiency (Responses in per cent)
Information sources used
Regarding the sources of information that are used, the pattern of Cēsis is rather nor-mal. Usually mass media are used; espe-cially internet, TV, newspapers, and radio
are used. Other sources of information play a smaller role; reference books are the least used source.
Figure 14: How frequently respondents use different information sources (Responses in per cent)
Very informed;
9,1
Informed; 38,2
Somewhat informed;
39,1
Not informed at all; 13,6
0% 10% 20% 30% 40% 50% 60% 70% 80% 90% 100%
Leaflets
Reference books
Special journals
Newspapers
Radio
TV
Internet
LeafletsReference
booksSpecial journals
Newspapers Radio TV Internet
Very frequently 4,7 4,8 4,9 6,3 6,6 9,3 19,8
Frequently 10,5 9,6 17,1 36,5 28,6 46,4 47,7
Rarely 25,6 18,1 15,9 33,3 39,6 32 19,8
Very rarely 23,3 15,7 17,1 17,7 9,9 7,2 8,3
Not at all 36 51,8 45,1 6,3 15,4 5,2 10,4

Cesis (Latvia)
INTENSE Background Paper Energy efficiency in your home: Survey in 12 Central and Eastern European municipalities 20
Topics of Interest
Figure 15: Which topics concerning energy efficiency are important for the respondents (Responses in per cent)
Energy efficiency and energy saving is a very important topic for citizens in Cēsis. Over half of them find general issues on energy efficiency and energy savings very important (55.2%), another 32.2% find the topic somewhat impor-tant. Those measures that can be implemented with little efforts or costs seem to enjoy the highest importance. 75.9% think that easy measures for refurbishment are very or some-
what important; 74.1% find energy efficient living very or somewhat important. Ecological building materials are considered as important (64.7%) as well. Passive houses are judged as the least important; however, 28.2% have stated that they have no opinion. This suggests that some of them do not exactly know what a pas-sive house actually is.
Trust
Figure 16: How much do you trust the following institutions when it comes to information about energy saving?
0% 10% 20% 30% 40% 50% 60% 70% 80% 90% 100%
Passive house
Energy efficient construction
What to consider when building a house
Energy efficient living
Ecological building materials
Easy measures for refurbishment
Technical solutions
Energy efficiency in general
Passive house
Energy efficient
construction
What to consider
when building a
house
Energy efficient
living
Ecological building materials
Easy measures
for refurbish
ment
Technical solutions
Energy efficiency in general
Very important 14,1 23 34,1 34,8 35,2 36,3 37,1 55,2
Somewhat important 16,5 32,2 29,7 39,3 29,5 39,6 22,5 32,3
Somewhat not important 17,6 23 11 16,9 15,9 12,1 23,6 6,3
Not important at all 23,5 13,8 17,6 3,4 11,4 7,7 11,2 3,1
No opinion 28,2 8 7,7 5,6 8 4,4 5,6 3,1
0% 10% 20% 30% 40% 50% 60% 70% 80% 90% 100%
PoliticiansState authoritiesHouse managers
NGOsMedia
MunicipalityNeighbours and frieds
Energy supply companiesIndividual experts
PoliticiansState
authorities
House managers
NGOs MediaMunicipali
ty
Neighbours and frieds
Energy supply
companies
Individual experts
Full trust 0,0 1,2 2,4 3,7 4,3 4,7 5,4 12,2 13,8
Trust 1,2 12,9 14,1 24,4 35,9 32,6 49,5 36,7 52,1
Little trust 14,3 28,2 42,4 28,0 41,3 39,5 29,0 34,7 21,3
No trust 70,2 44,7 29,4 26,8 13,0 17,4 6,5 8,2 6,4
DK 14,3 12,9 11,8 17,1 5,4 5,8 9,7 8,2 6,4

Cesis (Latvia)
INTENSE Background Paper Energy efficiency in your home: Survey in 12 Central and Eastern European municipalities 21
In Cēsis individual experts enjoy the highest trust, followed by friends and neighbours, and by supply companies. For all other groups, the mistrust (little or no trust) is
bigger than the trust. Politicians and state institutions are considered least trustwor-thy; also house managers are a less trusted group.
Energy consultancy
Most residents of Cēsis would appreciate professional advice on measures to in-crease the energy efficiency of their homes. 83.5% said that they for sure or very likely would like to get such advice.
The table shows that actually a slight major-ity of 52.3% would consider also paying for such advice (―yes, sure‖ and ―yes, likely‖).
Would you be willing to pay for professional advice on increasing the energy efficiency in your home?
Would like to get professional advice for your home on efficiency meas-ures?
Yes, sure
Yes likely
Probably not
Not at all
Yes, for sure 9 17 7 4
Yes, likely 0 19 16 14
Personal situation
Asked about their personal situation and feelings, about 79% responded that they feel affected by the current financial and economic crisis. It is very likely that also renovation projects will be downsized
(53.7%), delayed (69.0%) or done by the house owners themselves instead of hiring professionals (70.3% agree strongly or somewhat).
The overwhelming majority (81.0%) con-firm that they have been saving money and spending a lot less (60.8%) or that they have held off major purchases (76.8%).
This reluctant behaviour is also reflected in the section on attitudes and concerns. The costs of living are of highest concern, al-most everybody seems to be affected by a possible rise of living costs: 89.7% are somewhat or very concerned about that, followed by the rise of energy prices (83.2%).
Other developments that are of high con-cern to the respondents are the political leadership in the country (87.7%), and the state of the global economy (80.2%).
Given the results about concerns, it is only understandable that more than half of Cē-sis’ residents consider themselves very or somewhat eager to save energy (55.4%). The average ―eagerness‖ on a scale from 1…4 is 2.34.
Demographic data
The questions were answered by 83 women and 27 men (plus one without indi-cation). 72.9% have an academic degree, 25.0% finished their education after secon-dary school.
Age In %
Younger than 18 0.9
18-24 10.0
25-34 22.7
35-44 24.5
45-54 26.4
55-64 11.8
65 and older 3.6

Riga (Latvia)
INTENSE Background Paper Energy efficiency in your home: Survey in 12 Central and Eastern European municipalities 22
Riga (Latvia)
General information:
Riga is the capital and largest city of Latvia. It is an important seaport, founded in 1201. With 713,016 inhabitants it is largest city of the Baltic States although its population has decreased since 1991.
The historical core of Riga is situated on the right bank of the Daugava River, about 10 kilometers from where the Daugava flows into the Gulf of the Riga. Riga has unique cultural values due to its rather intact me-dieval architecture and that of later periods, the urban structure, the richness and qual-ity of Art Nouveau architecture and the 19-th century wooden architecture of the city. The historic centre is listed on the World Heritage List of UNESCO.
Riga accounts for about half of the total industrial output of Latvia, focusing on the financial sector, public utilities, food and beverages, pharmaceuticals, wood process-ing, printing and publishing, textiles and furniture, and communications equipment manufacturing. More than 50% of Latvian
companies are registered in the Riga re-gion. The port of Riga is an important cargo shipping centre. It is the main all-weather port in the Baltic and is expected to grow in the next few years due to increased trade with other ex-Soviet states and China.
The city is rich on national scale, the salaries in the capital city is the highest than in other cities, but charges for services (e.g., public transport) and product prices are also the highest in the Latvia.
Overview of housing conditions of the respondents
> Number of residents: 747.200 > Number of valid responses: 158 > Share of house/flat ownership: 71.6%
(106 of 148)
Structure of housing:
> 21.7% detached houses (one or more storeys)
> 75.8% apartment houses (low and high rises)
> 2.5% town houses (neighbouring units on both sides but not above or below)
In most apartments live two (40.8%) or three persons (27.4%); followed by house-holds with four persons (13.3%), and single households (12.7%).
Figure 17: Conditioned living space (Distribution in per cent)
0,0 10,0 20,0 30,0 40,0 50,0
> 160 sqm
141-160 sqm
121-140 sqm
101-120 sqm
81-100 sqm
61-80 sqm
41-60 sqm
20-40 sqm
> 160 sqm
141-160 sqm
121-140 sqm
101-120 sqm
81-100 sqm
61-80 sqm
41-60 sqm
20-40 sqm
Flat 0,0 0,0 0,0 3,4 7,6 32,2 44,1 12,7
House 32,4 5,9 11,8 14,7 17,6 8,8 2,9 5,9

Riga (Latvia)
INTENSE Background Paper Energy efficiency in your home: Survey in 12 Central and Eastern European municipalities 23
The distribution of flats in Riga is quite typi-cal for many East-European cities. The flats tend to be smaller in comparison to houses. Most flats have below 80 sqm, while most houses will have more than 80 sqm floor space.
The housing stock of Riga shows some in-teresting developments. 55.9% of detached houses were built after 1991, slightly more than half of them after 2005. The reason for this is the short but intensive suburbaniza-tion trend that started in the early 2000s and ended with the financial and economic crisis in 2008.
The development of apartment houses shows different peaks. 21.8% were built before the end of the World War II. These buildings will be most likely situated close to the centre in the Art Nouveau districts. A second peak can be found from 1961-1990: 46.2% of buildings, most of them in slab-concrete construction as high rise apart-ment blocks in the outskirts of the town. A smaller, last peak of the building activities of apartment houses is from 2005. 10.9% of apartment houses belong to this youngest category.
Upgrading old houses (built before 1990)
Some houses have undergone a renovation in Riga. The survey data show that in more than half of the cases, new windows have been installed (54.6%). Wall insulation (15.6%) and insulation of the ceiling (12.0%) have been upgraded only in a smaller amount of houses. More retrofitting meas-ures have been undertaken in detached houses. In the vast majority of cases win-dows have been exchanges in detached houses (85.7%), but only in half of the apartment houses. Also for insulation measures, the figures are a bit more in fa-vour of detached houses, although the difference is not as big here.
Only houses that were built before 1990 were considered:
Figure 18: Upgrading measures (Responses in per cent)
Using renewables
Alternative sources of energy are so far hardly used in Riga. In 5 cases, a heat pump was installed; four of them in detached
houses, one in a high-rise apartment block. Solar energy is not used in any of the re-spondents’ flats or houses.
Financing measures:
Less than half of the respondents (35.6%) had any investments in their homes during the last 3 years. There is a significant differ-ence however between detached houses, where the share is 53.1% and apartment blocks where investments were done in only 32.1% of cases.
Not surprising, also in the case of Riga most citizens financed measures themselves – 73.6%. Another 11.3% financed the upgrad-ing measures at least partially by them-selves. A bank loan was used in 17.0% of the cases. Local or state support does not play any role.
Energy use: heating and electricity
Typical for a city in Eastern-Europe with a large share of apartment houses, built be-
tween 1961 and 1990, a majority of houses are connected to district heating. Gas is the
12,0
15,6
54,6
0 20 40 60 80
Insulation of ceiling added
Wall insulation added
New windows installed
Riga (Latvia)
INTENSE Background Paper Energy efficiency in your home: Survey in 12 Central and Eastern European municipalities 24
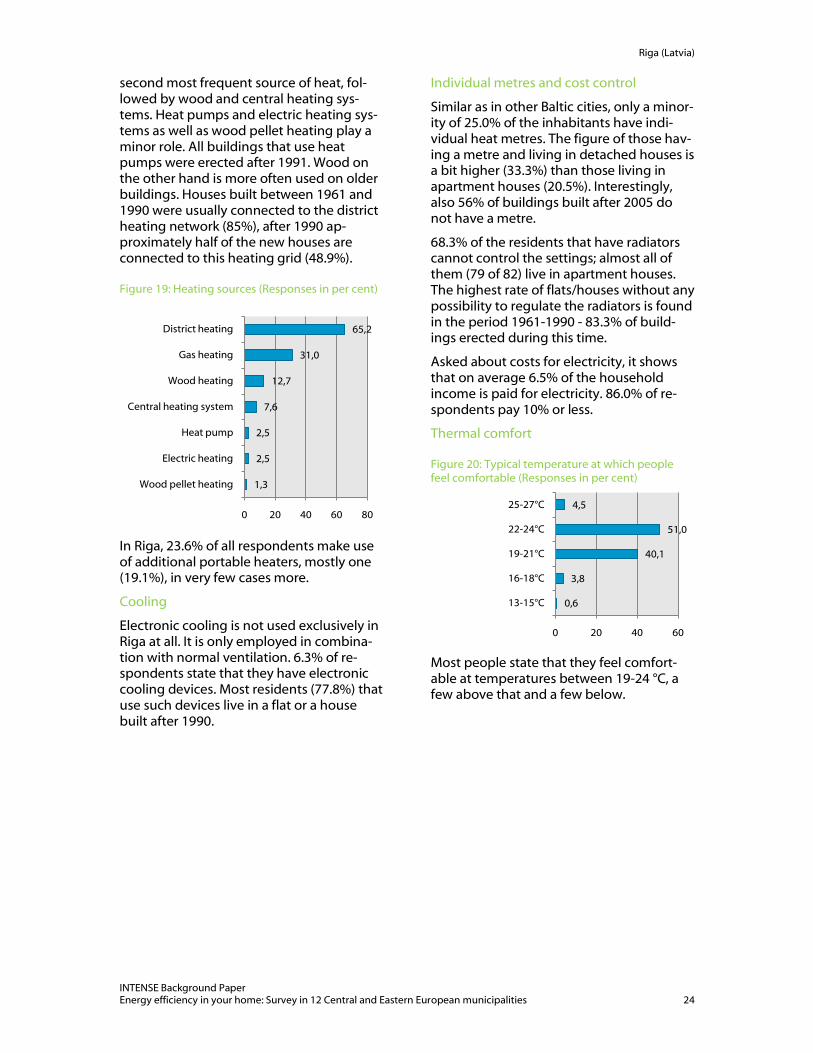
second most frequent source of heat, fol-lowed by wood and central heating sys-tems. Heat pumps and electric heating sys-tems as well as wood pellet heating play a minor role. All buildings that use heat pumps were erected after 1991. Wood on the other hand is more often used on older buildings. Houses built between 1961 and 1990 were usually connected to the district heating network (85%), after 1990 ap-proximately half of the new houses are connected to this heating grid (48.9%).
Figure 19: Heating sources (Responses in per cent)
In Riga, 23.6% of all respondents make use of additional portable heaters, mostly one (19.1%), in very few cases more.
Cooling
Electronic cooling is not used exclusively in Riga at all. It is only employed in combina-tion with normal ventilation. 6.3% of re-spondents state that they have electronic cooling devices. Most residents (77.8%) that use such devices live in a flat or a house built after 1990.
Individual metres and cost control
Similar as in other Baltic cities, only a minor-ity of 25.0% of the inhabitants have indi-vidual heat metres. The figure of those hav-ing a metre and living in detached houses is a bit higher (33.3%) than those living in apartment houses (20.5%). Interestingly, also 56% of buildings built after 2005 do not have a metre.
68.3% of the residents that have radiators cannot control the settings; almost all of them (79 of 82) live in apartment houses. The highest rate of flats/houses without any possibility to regulate the radiators is found in the period 1961-1990 - 83.3% of build-ings erected during this time.
Asked about costs for electricity, it shows that on average 6.5% of the household income is paid for electricity. 86.0% of re-spondents pay 10% or less.
Thermal comfort
Figure 20: Typical temperature at which people feel comfortable (Responses in per cent)
Most people state that they feel comfort-able at temperatures between 19-24 °C, a few above that and a few below.
1,3
2,5
2,5
7,6
12,7
31,0
65,2
0 20 40 60 80
Wood pellet heating
Electric heating
Heat pump
Central heating system
Wood heating
Gas heating
District heating
0,6
3,8
40,1
51,0
4,5
0 20 40 60
13-15°C
16-18°C
19-21°C
22-24°C
25-27°C

Riga (Latvia)
INTENSE Background Paper Energy efficiency in your home: Survey in 12 Central and Eastern European municipalities 25
Knowledge and information about energy efficiency
Figure 21: How respondents rate their level of information about energy efficiency (Responses in per cent)
Approximately half of Riga’s inhabitants feel very informed or informed about en-ergy efficiency issues, 8.2% say that they are not informed at all. The average knowledge on a scale from 1-4 (1=very informed, 4=no information at all) is 2.46.
Information sources used
In Riga, internet is clearly the leading source of information followed by television. Newspapers and radio are still used to
some extent as information sources, while other sources of information are negligible. Specialized literature is hardly used at all.
Figure 22: How frequently respondents use different information sources (Responses in per cent)
Very informed;
12,7
Informed; 37,3
Somewhat informed;
41,8
Not informed at all; 8,2
0% 10% 20% 30% 40% 50% 60% 70% 80% 90% 100%
Leaflets
Radio
Referebce books
Special journals
Newspapers
TV
Internet
Leaflets RadioReferebce
booksSpecial journals
Newspapers TV Internet
Very frequently 1,6 3,8 4 7 10,8 14,1 31,5
Frequently 8 22,6 9,6 13,2 32,4 39,4 28
Rarely 23,2 30,8 16 13,2 27,3 27,5 20,3
Very rarely 24 15 20 14,7 11,5 7,7 8,4
Not at all 43,2 27,8 50,4 51,9 18 11,3 11,9

Riga (Latvia)
INTENSE Background Paper Energy efficiency in your home: Survey in 12 Central and Eastern European municipalities 26
Topics of Interest
Figure 23: Which topics concerning energy efficiency are important for the respondents (Responses in per cent)
The two most important topics are energy efficiency and energy saving in general and energy efficient living. 85.9% respectively 78.9% of all respondents find that these topics very or somewhat important. It also shows that only 6.0% (and 6.3%) of respon-dents did not have any opinion on these two issues.
Other topics that more than half of the re-spondents find very or somewhat impor-
tant are easy measures for refurbishment (66.4%), ecological construction materials (61.5%), technical solutions for refurbish-ments (53.4%), and information about what to consider when building a house (53.0%). Passive houses enjoy little interest, but also here the rate of respondents without any opinion (24.6%) is very high.
0% 10% 20% 30% 40% 50% 60% 70% 80% 90% 100%
Passive house
Energy efficient construction
Technical solutions
Ecological building materials
Easy meas. Refurb.
What to consider when building a house
Energy efficient living
Energy efficiency in general
Passive house
Energy efficient
construction
Technical solutions
Ecological building materials
Easy meas.
Refurb.
What to consider
when building a
house
Energy efficient
living
Energy efficiency in general
Very important 14,3 20,2 20,3 21,5 21,6 26,9 32,4 42,3
Somewhat important 20,6 29,2 33,1 40,0 44,8 26,1 46,5 43,6
Somwhat not important 22,2 23,8 23,3 17,8 14,9 14,2 9,9 7,4
Not important 18,3 13,8 9,0 10,4 8,2 20,1 4,9 0,7
No opinion 24,6 13,1 14,3 10,4 10,4 12,7 6,3 6,0

Riga (Latvia)
INTENSE Background Paper Energy efficiency in your home: Survey in 12 Central and Eastern European municipalities 27
Trust:
Figure 24: How much do you trust the following institutions when it comes to information about energy sav-ing?
Similar to many other cases, experts are considered most trustworthy in Riga, too. Neighbours and friends as well as NGOs are also considered trustworthy. The media, supply companies and municipality are in the middle range, where the mistrust (little
and no trust) already exceeds the trust level (full trust and trust). House managers, state authorities and politicians are least trusted.
Additional institutions that were men-tioned apart from the selection were uni-versities.
Energy consultancy
Most residents of Riga would be interested in getting professional advice on how to increase energy efficiency and save more energy. 79.0% of respondents said that they would for sure or very likely like to get such consultancy.
Would you be willing to pay for professional advice on increasing the energy efficiency in your home?
Would like to get professional advice for your home on efficiency meas-ures?
Yes, sure
Yes likely
Probably not
Not at all
Yes, for sure 6 16 11 10
Yes, likely 0 28 27 20
Asked about if they would also be willing to pay for professional advice, 41.3% say that they would for sure or very likely also do so.
Personal situation
In Riga, a big majority is affected by the financial and economic crises (72.8%). Con-sequently, many residents feel concerned or anxious about certain aspects of their life or environment. The biggest concern is the current political leadership in Latvia. 89.3% are concerned or very concerned about this. The topics with high concern that im-mediately follow this main issue are the costs of living (86.2% are somewhat or very nervous), the current state of the global economy (83.3%), and the rise of energy prices (83.2%).
The concerns about the development of prices and living costs, and the impact of the financial crisis will influence spending and savings of the respondents. 83.9% of respondents say, that they have been sav-ing in all aspects of life and 74.1% claim that that have been spending a bit less as
0% 10% 20% 30% 40% 50% 60% 70% 80% 90% 100%
Politicians
House managers
Municipalities
NGOs
Media
State authorities
Energy supply companies
Neighbours and friends
Individual Experts
PoliticiansHouse
managersMunicipali
tiesNGOs Media
State authoritie
s
Energy supply
companies
Neighbours and friends
Individual Experts
Full trust 0,0 0,8 3,2 4,0 4,5 4,9 6,8 11,3 13,9
Trust 1,6 22,2 25,6 40,0 37,9 14,6 36,4 46,6 47,4
Little trust 16,9 28,6 35,2 28,0 38,6 25,2 25,0 29,3 23,4
No trust 68,5 34,1 22,4 8,0 9,1 39,0 22,7 6,0 5,1
Don’t know 12,9 14,3 13,6 20,0 9,8 16,3 9,1 6,8 10,2

Riga (Latvia)
INTENSE Background Paper Energy efficiency in your home: Survey in 12 Central and Eastern European municipalities 28
well (agree strongly or somewhat). 72.9% of respondents agreed to have held off major purchases and 79.9% confirm that they have been buying more generic brands than usual.
There is an average eagerness to energy saving in Riga. 49.1% consider themselves very or somewhat eager to save energy.
The average ―eagerness‖ on a scale from 1…4 is 2.61 (1=very eager, 4=not eager at all). 67.5% of respondents say that they would be more eager to save energy, if they would save money that way. 56.6% would do this if there were financial incentives, 37.1% if someone told them how to do it properly.
Demographic data
The questions were answered by 99 women and 59 men (plus one without indi-cation). 83.6% have an academic degree, 16.4% finished their education after secon-dary school.
Age In %
Younger than 18 0
18-24 7,6
25-34 41,8
35-44 19,6
45-54 15,8
55-64 8,2
65 and older 7,0

Elektrenai (Lithuania)
INTENSE Background Paper Energy efficiency in your home: Survey in 12 Central and Eastern European municipalities 29
Elektrėnai(Lithuania)
General information
Elektrėnai is a town, situated in Vilnius County, 47 km west from Vilnius, the capital of Lithuania. The town is rather small with a population of 13 686.
Elektrėnai is one of the newest towns in Lithuania. It was founded in 1960 as a result of the construction of a power plant. After the shutdown of the nuclear power plant in Ignalina, the power plant in Elektrėnai be-came the primary source of electricity in Lithuania. The heat and power plant sup-plies the town of Elektrėnai with district heating as well. In 1961, after damming the River Strėva, the water formed an artificial lagoon. Its water is used for cooling in the power plant. Elektrėnai is famous for its ice
hockey tradition. The town’s ice hockey team ―Energija‖ is the strongest one in Lithuania. In 2010 Elektrėnai celebrates its fiftieth anniversary.
Overview of housing conditions of the respondents
> Number of residents: 13,686 > Number of valid responses: 198 > Share of house/flat ownership: 94.0%
Structure of housing:
> 20.2% detached houses (one or more storeys)
> 71.7% apartment houses (low and high rises)
> 8.1% town houses (neighbouring units on both sides but not above or below)
Most households in Elektrėnai consist of three members (27.8%), followed by households with two persons (27.8%) and four persons (19.7%). Single households are negligible (3.5%).
Given the fact that Elektrėnai is a rather young town, the structure of the building stock is not surprising. Most of the respon-dents will most likely live in concrete-slab apartment blocks, which is the most com-mon building type in Elektrėnai. Flats in such blocks tend have same floor plans, therefore most oft the residents will also live in flats of the same size. Almost all flats in apartment and town houses are below 80 sqm, most houses have more than 80 sqm above.
Figure 25: Conditioned living space (Distribution in per cent)
Most of the building stock in Elektrėnai dates from the years 1961-1990: 71.2%. Most of the houses constructed during this period were apartment blocks. 78.9% of all low-rise and high-rise apartment blocks.
0 10 20 30 40 50
> 160 sqm
141-160 sqm
121-140 sqm
101-120 sqm
81-100 sqm
61-80 sqm
41-60 sqm
20-40 sqm
> 160 sqm
141-160 sqm
121-140 sqm
101-120 sqm
81-100 sqm
61-80
sqm
41-60
sqm
20-40
sqm
Flat 0,0 0,0 0,0 0,0 3,2 46,8 43,7 6,3
House 31,6 2,6 7,9 23,7 18,4 7,9 7,9 0,0

Elektrenai (Lithuania)
INTENSE Background Paper Energy efficiency in your home: Survey in 12 Central and Eastern European municipalities 30
As the town was founded in 1960 it is not surprising that just 3.0% of the building stock is older. 16.7% of the buildings were built from 1991-1999. After that, the build-
ing activities came to a halt, only 2.5% of homes – exclusively single detached houses – were built.
Upgrading old houses (built before 1990)
Although the building stock is not very old, the renovation measures undertaken in Elektrėnai are on a similar level compared to other municipalities that took part in this survey. In more than half of the residents’ flats windows were exchanged (58.5%). This quota is a bit higher for detached houses, but still more than half of block houses have undergone an exchange of windows. Upgrading or installing insulation on walls and the ceiling has not been as popular. In 10.9% of flats/houses, the ceiling has been insulated and in 7.5% of flats/houses the walls were upgraded.
Figure 26: Upgrading measures (Responses in per cent)
Using renewables
Interestingly, there are comparatively many heat pumps installed in Elektrėnai. 32 re-spondents answered, that there is a heat pump installed (16.2% of all respondents, if
those who do not know are excluded then it is even 22.7%). Solar energy is used in only one case.
Financing measures:
With regard to investments into people’s homes, the survey shows that 58.2% of respondents have made investments in the last three years.
In most of the cases, investments were fi-nanced by the citizens themselves. Virtually
everybody (96.2%) contributed with own resources; 88.7% financed the investments entirely by themselves. 12 respondents made use of bank loans, in four cases these loans were given specifically for energy improvement measures. There is no single case were local or state support was given.
7,5
10,9
58,5
0 10 20 30 40 50 60 70
Wall insulation added
Insulation of ceiling added
New windows installed

Elektrenai (Lithuania)
INTENSE Background Paper Energy efficiency in your home: Survey in 12 Central and Eastern European municipalities 31
Energy use: heating and electricity
Figure 27: Heating sources (Responses in per cent)
Being close to Elekrėnai power plant it is not surprising that a large share of the town
is supplied by district heating. Most of the apartment blocks and town houses built from 1961-1998 are connected to the dis-trict heating network. On the other hand, just two of 40 detached houses are con-nected to district heating. Those houses that use wood, wood pellets or coal as a heating source are usually single detached houses.
More than a fifth of respondents (23.2%) use additional portable heaters, most of them indicated that they use electricity as a heating source. This might explain the rela-tively high share of 6.6% respondents using electricity for heating.
Cooling
Electronic cooling is hardly used in Elek-rėnai. One respondent uses such devices; four other use them in combination with common ventilation through the windows.
Individual metres and cost control
The overwhelming majority of 88.4% of respondents do not have a heat metre in their house or flat. In apartment houses and block houses the figure is slightly higher than in detached houses, but also there more than three quarter of residents do not have an individual heat metre. This lack is common until 1999, but also since than houses/flats without metre were built.
A high share of respondents does not have any control over their radiators at all. 76.6% of those who have a radiator do not have a possibility to regulate them. This is the case especially in high-rise apartment blocks - here 92.9% are affected - and in town houses the figure is even 93.8%. This miss-ing control of the radiator settings is found in buildings erected until 1999. Houses constructed after that are equipped with control units.
On average, the electricity bill is a higher burden to the citizens of Elektrėnai than for their fellow citizens in the other Baltic States. 11.3% of the household income is paid for electricity in Elektrėnai. 71.2% of citizens have to come up with 10% or less of their household income for electricity.
Thermal comfort
Figure 28: Typical temperature at which people feel comfortable (Responses in per cent)
Most people state that they feel comfort-able at temperatures between 19-24 °C, a few above that and a few below.
2
1
7,1
6,6
7,6
12,1
18,2
22,2
63,6
0 20 40 60 80
Other
Heat pump
Coal heating
Electric heating
Wood pellet heating
Gas heating
Wood heating
Central heating system
Distric heating
0,5
4,0
44,9
46,5
4,0
0 10 20 30 40 50 60 70
13-15°C
16-18°C
19-21°C
22-24°C
25-27°C

Elektrenai (Lithuania)
INTENSE Background Paper Energy efficiency in your home: Survey in 12 Central and Eastern European municipalities 32
Knowledge and information about energy efficiency
The share of citizens of Elektrėnai that feel very informed or informed is rather low compared to other cities participating in the survey, only 37.9%. More than a fifth says they are not informed at all.
The average knowledge on a scale from 1-4 (1=very informed, 4=no information at all) is 2.76.
Figure 29: How respondents rate their level of information about energy efficiency (Responses in per cent)
.
Information sources used
Figure 30: How frequently respondents use different information sources (Responses in per cent)
The most frequently used source of infor-mation in Elektrėnai is television, followed by Internet and newspapers. Other media are significantly less used. Radio is still
somewhat popular Special literature, such as journals, references books or leaflets are used as sources of information just less than 15% of respondents regularly.
Very informed;
9,1
Informed; 28,8
Somewhat informed;
38,9
Not informed at all; 23,2
0% 10% 20% 30% 40% 50% 60% 70% 80% 90% 100%
Reference Books
Special journals
Leaflets
Radio
Newspapers
TV
Internet
Reference Books
Special journals
Leaflets Radio Newspapers TV Internet
Very frequently 2,0 2,5 2,5 5,1 8,1 22,7 27,8
Frequently 3,0 11,1 12,1 25,8 37,9 48,5 38,9
Rarely 13,1 16,7 18,2 25,8 33,3 17,7 19,2
Very rarely 18,7 17,7 35,9 22,2 11,6 6,6 8,1
Not at all 63,1 52,0 31,3 21,2 9,1 4,5 6,1

Elektrenai (Lithuania)
INTENSE Background Paper Energy efficiency in your home: Survey in 12 Central and Eastern European municipalities 33
Topics of Interest
Figure 31: Which topics concerning energy efficiency are important for the respondents (Responses in per cent)
Energy is a topic of very high interest to the citizens of Elektrėnai. Asked about energy efficiency and energy saving in general, 94.1% of respondents said that this issue is very or somewhat important. Given the history of the town, its name and the nearby power plant, this does certainly not come as a big surprise. Other, more specific topics are considered important as well. Easy measures for refurbishment are con-sidered to be very or somewhat important by 84.4%, information on energy-efficient living by 72.2%. Passive houses are the topic which is considered least important. However, more than a third of respondents
(35.9%) do not have any opinion. This is an indication that many citizens are not famil-iar with the concept of passive houses.
Trust:
The trust in most people or institutions is rather low in Elektrėnai. Only for experts the level of trust (sum of full trust and trust, 63.1%) exceeds the mistrust. All other groups, persons or organizations are con-sidered as relatively untrustworthy. This is especially true for the public sector or poli-ticians: 74.2% of citizens have little or no trust in the municipality, 85.3% in politi-cians, and 72.7% in state authorities.
0% 10% 20% 30% 40% 50% 60% 70% 80% 90% 100%
Passive house
Energy efficient construction
Technical solutions
Energy efficient living
Easy measures for refurbishment
Ecological building materials
What to consider when building a house
Energy efficiency in general
Passive house
Energy efficient
construction
Technical solutions
Energy efficient
living
Easy measures
for refurbish
ment
Ecological building materials
What to consider
when building a
house
Energy efficiency in general
Very important 8,6 15,7 22,7 22,7 28,3 28,3 31,8 43,6
Somewhat important 19,2 37,4 45,5 49,5 56,1 39,9 24,2 50,5
Somewhat important2 25,8 23,2 16,2 12,1 6,6 13,6 13,6 2,0
Not important 10,6 10,6 8,1 5,1 4,5 7,1 14,1 0,5
No opinion 35,9 13,1 7,6 10,6 4,5 11,1 16,2 3,0

Elektrenai (Lithuania)
INTENSE Background Paper Energy efficiency in your home: Survey in 12 Central and Eastern European municipalities 34
Figure 32: How much do you trust the following institutions when it comes to information about energy sav-ing?
Energy consultancy
61.1% of Elektrėnai’s citizens would wel-come professional energy advice on how to save energy and how to increase energy efficiency. Out of these, 33.0% of the re-spondents would for sure or very likely also pay for such advice.
Would you be willing to pay for professional advice on increasing the energy efficiency in your home?
Would like to get professional advice for your home on efficiency meas-ures?
Yes, sure
Yes likely
Probably not
Not at all
Yes, for sure 1 16 9 9
Yes, likely 1 13 34 11
Personal situation
Looking at the personal situation and atti-tude of the respondents in Lithuania, it becomes clear that the respondents are generally very nervous about many aspects of their lives and environment. Except when asked about current military hostili-ties around the world, more than 90% of respondents claimed to be nervous or very nervous. The living costs and the rise of
energy prices are the issues with the high-est cause of concern. Almost all respon-dents feel nervous about these two issues (98% and 97% very nervous or nervous).
Looking at the everyday life of respondents, 69.5% say that they are affected by the cur-rent financial and economic crisis. As a con-sequence, residents of Elektrėnai are saving more money in all aspects of their lives (66.0% agree strongly or agree somewhat), are spending a bit less (70.6%), held off major purchases (71.1%), cancelled major vacation plans (64.0%), and tend to do renovation projects rather themselves (57.4%)
75.1% of the respondents consider them-selves very eager or somewhat eager to save energy. The average ―eagerness‖ on a scale from 1…4 is 2.02 (1=very eager, 4=not eager at all). Economic reasons seem to be a central motive for energy saving. 93.4% of all respondents say that they would save more energy of they can save money, too. 78.7% would do it to feel better, 64.5% would do it to be greener. Financial incen-tives would convince 75.6% of the citizens to save more energy and 62.4 would do so if they were told what to do.
0% 10% 20% 30% 40% 50% 60% 70% 80% 90% 100%
NGOs
Energy supply companies
Politicians
House managers
State authorities
Municipalities
Media
Neighbours and friends
Indivudual experts
NGOs
Energy supply
companies
PoliticiansHouse
managers
State authoritie
s
Municipalities
MediaNeighbou
rs and friends
Indivudual experts
Full trust 1,0 1,5 1,5 2,0 2,0 2,5 3,0 7,1 14,1
Trust 21,2 17,7 3,5 11,6 12,1 18,2 30,8 31,3 49,0
Little trust 39,9 41,9 12,6 35,4 32,3 39,9 47,5 43,4 23,7
No trust 21,7 29,3 72,7 33,3 40,4 34,3 12,1 10,1 3,5
Don’t know 16,2 9,6 9,6 17,7 13,1 5,1 6,6 8,1 9,6

Elektrenai (Lithuania)
INTENSE Background Paper Energy efficiency in your home: Survey in 12 Central and Eastern European municipalities 35
Demographic data
The questions were answered by 129 women and 69 men. 62.1% of the respon-dents hold an academic degree, 36.4% fin-ished their education after secondary school.
Age In %
Younger than 18 0
18-24 7.1
25-34 18.7
35-44 30.3
45-54 24.2
55-64 14.1
65 and older 5.6

Moravian Karst Region (Czech Republic)
INTENSE Background Paper Energy efficiency in your home: Survey in 12 Central and Eastern European municipalities 36
Moravian Karst Region (Czech Republic)
General information
The region of Moravian Karst, represented here by the Local Action Group (LAG) Mo-ravský kras, encompasses 54 small munici-palities. The LAG includes furthermore small businesses and NGOs in the Moravský
kras region of Moravia.
Overview of housing conditions of the respondents
> Number of residents: 42,000 > Number of valid responses: 550, a ran-
dom sample of 225 surveys was drawn (50%).
> Share of house/flat ownership: 75.6%
Structure of housing:
> 55.0% detached houses (one or more storeys)
> 31.6% apartment houses (low and high rises)
> 13.3% town houses (neighbouring units on both sides but not above or below)
Approximately a third of residents live in households with three members (32.1%), another third in households consisting of four members (33.0%).
The average heated living space of apart-ments and townhouses is around 61-80 sqm, more than three quarters of the flats and townhouses (76.1%) are in the range of 41-100 sqm. All apartments bigger than 120 sqm are in townhouses. The heated living space in detached houses is larger than in flats and townhouses. There is no clear av-erage, but most houses have at least 81 sqm of heated living space.
Figure 33: Conditioned living space (Distribution in per cent)
The largest share of buildings in the region of Moravian Karst is from the years 1961-1990. 45.7% of all buildings were built in this period. The second biggest share of buildings was built in the 1990s (14.3%), followed by the oldest buildings built be-fore 1945 with 12.4%. There is little differ-ence between the buildings types and the distribution of the age of buildings, except that most of the houses built before 1961 are either detached houses or town houses.
0 10 20 30 40
> 160 sqm
141-160 sqm
121-140 sqm
101-120 sqm
81-100 sqm
61-80 sqm
41-60 sqm
20-40 sqm
> 160 sqm
141-160 sqm
121-140 sqm
101-120 sqm
81-100 sqm
61-80 sqm
41-60 sqm
20-40 sqm
Flats 2,5 2,5 7,5 8,8 19,8 36,3 20,0 1,3
Houses 16,3 18,6 17,4 9,3 17,4 14,0 4,7 2,3

Moravian Karst Region (Czech Republic)
INTENSE Background Paper Energy efficiency in your home: Survey in 12 Central and Eastern European municipalities 37
Upgrading old houses (built before 1990)
Less than half of the respondents have in-stalled additional insulation. 48.2% say that they have added wall insulation; 41.6% have added ceiling insulation. The installa-tion of new windows is also the most cho-sen measure in the Moravian Karst Region. 64.0% of the respondents confirm to have exchanged windows recently. As for the type of houses, detached houses, apart-ment houses and town houses have been upgraded equally.
Figure 34: Upgrading measures (Responses in per cent)
Using renewables
Some respondents are using renewables in their homes. 12 citizens have installed solar collectors, 13 have installed a heat pump.
21 citizens think about upgrading their house or using renewables in the coming
five years. As national funds for energy-efficiency measures were recently made available in the Czech Republic, this figure will likely still grow in the next months or years.
Financing measures
60.3% of the respondents in the Moravian Karst area have had investments into their homes during the last three years. 70.2% of those who invested used private funds, 47.4% financed the measures entirely by themselves. 12.3% used bank loans, specifi-
cally foreseen for improved energy efficient refurbishment. 9.6% used ―ordinary‖ bank loans without specific requirements and 2.6% received support from local or re-gional authorities.
Energy use: heating and electricity
Figure 35: Heating sources (Responses in per cent)
Most of the residents of the Moravian Karst area are using gas and/or wood for heating their homes. Wood heating is mostly used in detached houses and town houses; just in 3 cases also apartment houses use it as a source for heating. In contrast to other mu-nicipalities in the survey, electric heating is quite popular (8.9% make use of it). 80% of those heating with electricity live in de-tached houses.
Central heating systems play a significant part as a supply system of heat energy (28.0%). District heating is less important in the Moravian Karst region (5.8%). This is also understandable given the fact the most municipalities in the region are vil-
41,6
48,2
64,0
0 20 40 60 80
Insulation of ceiling added
Wall insulation added
New windows installed
1,3
1,3
4,9
5,8
8,9
28
54,2
0 10 20 30 40 50 60 70
Wood pellet heating
Heat pump
Coal heating
District heating
Electric heating
Wood heating
Gas heating

Moravian Karst Region (Czech Republic)
INTENSE Background Paper Energy efficiency in your home: Survey in 12 Central and Eastern European municipalities 38
lages or small towns which have a lower population density.
18.1% of the respondents make use of addi-tional portable electric heaters; most of them have one heater. The share of de-tached and town houses with such devices is slightly higher than the share of apart-ment houses.
Cooling
Only very few respondents of the Moravian Karst region employ electronic cooling de-vices at home. Merely 3.7% have such cool-ing systems and only 1.4% of the residents use it exclusively.
Individual metres and cost control
Heat metres are installed only in a minority of homes. 31.4% of the respondents have a heat metre, 55.0% do not, 13.6% do not know.
The costs for electricity per household are high. On average, 11.1% of the household
income is needed to cover the electricity bill. 78.0% of the respondents pay 10% or less (the variance is quite high in the case of Moravian Karst region, it exceeds the aver-age).
Thermal comfort
Figure 36: Typical temperature at which people feel comfortable (Responses in per cent)
Most respondents feel comfortable be-tween 19 and 24 °C (91.9%). Just a small minority stated to feel most comfortable above or below that range.
Knowledge and information about energy efficiency
Figure 37: How respondents rate their level of information about energy efficiency (Responses in per cent)
More than half of the respondents feel in-formed or very informed. 8.3% state that they are very informed, 55.6% feel in-formed. Only 6.5% of the respondents feel not informed at all. The average knowledge on a scale from 1-4 (1=very informed, 4=no information at all) is 2.34.
0,5
3,2
41,0
50,9
4,4
0 10 20 30 40 50 60 70
9-12°C
16-18°C
19-21°C
22-24°C
25-27°C
Very informed;
8,3
Informed; 55,6
Somewhat informed;
29,6
Not informed at all; 6,5
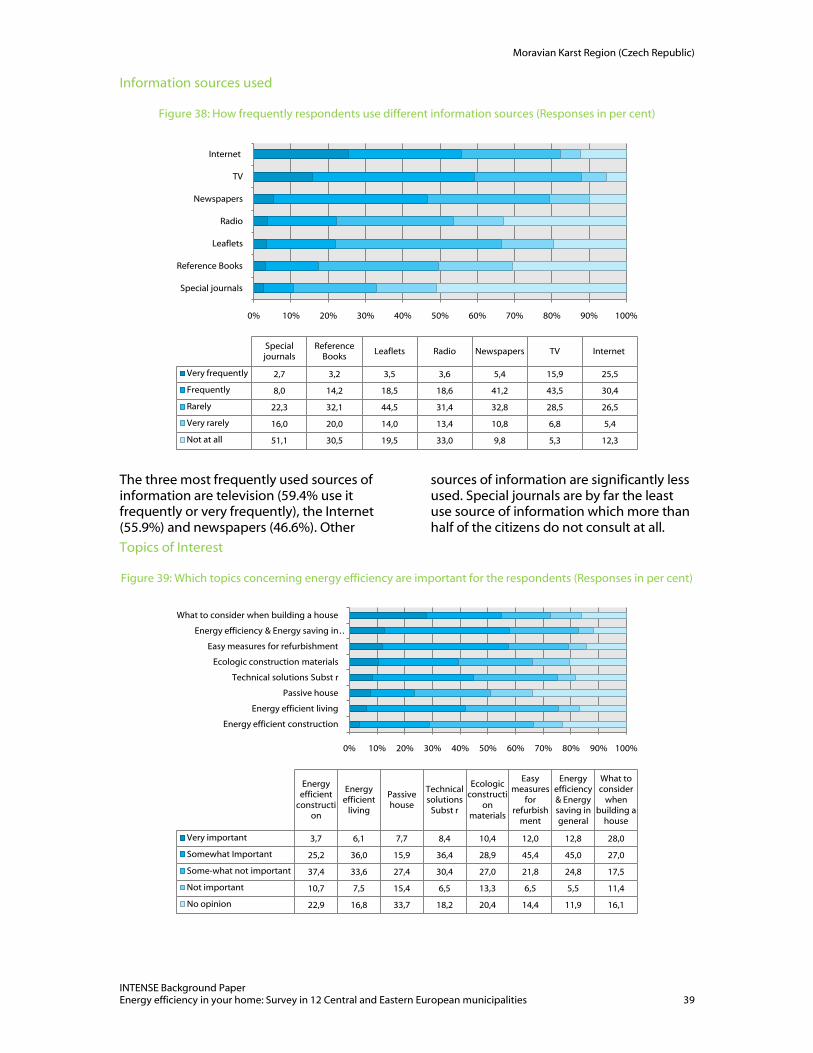
Moravian Karst Region (Czech Republic)
INTENSE Background Paper Energy efficiency in your home: Survey in 12 Central and Eastern European municipalities 39
Information sources used
Figure 38: How frequently respondents use different information sources (Responses in per cent)
The three most frequently used sources of information are television (59.4% use it frequently or very frequently), the Internet (55.9%) and newspapers (46.6%). Other
sources of information are significantly less used. Special journals are by far the least use source of information which more than half of the citizens do not consult at all.
Topics of Interest
Figure 39: Which topics concerning energy efficiency are important for the respondents (Responses in per cent)
0% 10% 20% 30% 40% 50% 60% 70% 80% 90% 100%
Special journals
Reference Books
Leaflets
Radio
Newspapers
TV
Internet
Special journals
Reference Books
Leaflets Radio Newspapers TV Internet
Very frequently 2,7 3,2 3,5 3,6 5,4 15,9 25,5
Frequently 8,0 14,2 18,5 18,6 41,2 43,5 30,4
Rarely 22,3 32,1 44,5 31,4 32,8 28,5 26,5
Very rarely 16,0 20,0 14,0 13,4 10,8 6,8 5,4
Not at all 51,1 30,5 19,5 33,0 9,8 5,3 12,3
0% 10% 20% 30% 40% 50% 60% 70% 80% 90% 100%
Energy efficient construction
Energy efficient living
Passive house
Technical solutions Subst r
Ecologic construction materials
Easy measures for refurbishment
Energy efficiency & Energy saving in …
What to consider when building a house
Energy efficient
construction
Energy efficient
living
Passive house
Technical solutions
Subst r
Ecologic constructi
on materials
Easy measures
for refurbish
ment
Energy efficiency & Energy saving in general
What to consider
when building a
house
Very important 3,7 6,1 7,7 8,4 10,4 12,0 12,8 28,0
Somewhat Important 25,2 36,0 15,9 36,4 28,9 45,4 45,0 27,0
Some-what not important 37,4 33,6 27,4 30,4 27,0 21,8 24,8 17,5
Not important 10,7 7,5 15,4 6,5 13,3 6,5 5,5 11,4
No opinion 22,9 16,8 33,7 18,2 20,4 14,4 11,9 16,1

Moravian Karst Region (Czech Republic)
INTENSE Background Paper Energy efficiency in your home: Survey in 12 Central and Eastern European municipalities 40
The respondents of the Moravian Karst area attribute significantly less importance to energy issues compared to other munici-palities. The issue which is considered as most important is energy efficiency and energy saving in general (57.8% find it somewhat or very important), closely fol-
lowed by easy measures for refurbishment (57.4%) and what to consider when build-ing a house (55.0%). Passive houses are the topic with the least interest (23.6%). A third of respondents (33.7%) had no opinion about passive houses at all.
Trust:
Figure 40: How much do you trust the following institutions when it comes to information about energy sav-ing?
There is only one group in the Moravian Karst region with high levels of trust: ex-perts. 64.2% of the respondents have either trust or full trust in experts. Neighbours and friends is the group the follows: 44.8% of respondents trust them. 34.3% of the resi-dents trust their municipality. Especially low levels of trust are found for NGOs (12.9%), state authorities (11.6%), and politicians (3.3%).
Energy consultancy
Asked if they would welcome professional advice on energy efficiency, 59.0% of the respondents said that they would likely or for sure like to get such advice. However, only 31.8% of these would also consider paying for that.
Would you be willing to pay for professional advice on increasing the energy efficiency in your home?
Would like to get professional advice for your home on efficiency meas-ures?
Yes, sure
Yes likely
Probably not
Not at all
Yes, for sure 1 14 15 2
Yes, likely 1 19 33 15
Personal situation
Asked if they are affected by the interna-tional financial and economic crisis or not, 49.3% of the respondents in the Moravian Karst area say that they are affected. The impact on the lives of respondents is not as strong as in other municipalities participat-ing in the survey. Apart from hoping for the best, spending less money (43.7% agree somewhat or strongly) and saving more
0% 10% 20% 30% 40% 50% 60% 70% 80% 90% 100%
State authorities
NGOs
Politicians
Energy Supply companies
Media
Municipality
House managers
Neighbours and friends
Individual experts
State authoritie
sNGOs Politicians
Energy Supply
companies
MediaMunicipali
tyHouse
managers
Neighbours and friends
Individual experts
Full trust 0,0 0,5 0,9 0,9 1,4 3,8 4,4 7,5 10,7
Trust 11,6 12,4 2,4 22,5 18,8 30,5 23,4 37,3 53,5
Little trust 29,5 23,3 25,5 30,5 35,7 20,5 17,1 20,8 10,7
No trust 26,6 16,2 55,2 16,9 16,4 12,4 15,6 7,1 6,0
Do not know 32,4 47,6 16,0 29,1 27,5 32,9 39,5 27,4 19,1

Moravian Karst Region (Czech Republic)
INTENSE Background Paper Energy efficiency in your home: Survey in 12 Central and Eastern European municipalities 41
(41.2%) are among the most frequently taken measures by the respondents. 49.8% of the respondents have held off purchases and 37.7% have postponed or cancelled major vacation plans. Projects around the house are also affected to a certain extent. 40.9% have delayed or cancelled renova-tion projects, and 46.6% are more likely to carry out renovation measures themselves; and 39.9% think about downsizing a home renovation project.
When asked about anxieties and worries, the issue of highest concern is the rise of energy prices. 87.2% of respondents are somewhat or very nervous about that. Simi-larly, the costs of living are a concern to
75.8% of the resident in the Moravian Karst area. Besides financial and environmental aspects, the current political leadership in Czech Republic makes 84.8% somewhat nervous or very nervous.
44.5% of all respondents consider them-selves somewhat (41.7%) or very (2.8%) eager to save energy. The average ―eager-ness‖ on a scale from 1…4 is 2.76 (1=very eager, 4=not eager at all). Saving money would be a motivation to save more energy for 83.6% of the respondents. Feeling bet-ter is a motivation for 67.9%, to be ―greener‖ for 58.0%. Extra financial incen-tives would motivate 65.4% to save energy.
Demographic data
The survey was filled in by 95 women and 126 men. The questionnaire was distributed in schools, this is the reason that some re-spondents are younger than 18.
13.4% have an academic degree, 57.4% finished their education after secondary school.
Age In %
Younger than 18 12,7
18-24 19,5
25-34 4,5
35-44 43,0
45-54 17,6
55-64 2,3
65 and older 0,5

Ruzomberok (Slovakia)
INTENSE Background Paper Energy efficiency in your home: Survey in 12 Central and Eastern European municipalities 42
Ružomberok (Slovakia)
General information
The City of Ružomberok, 260 km north-east of Bratislava, has about 30,000 inhabitants and is located in Northern Slovakia and it is a centre of the historical region Liptov. Ružomberok is situated on the confluence of the two rivers Váh and Revúca and the town is surrounded by the mountain ranges of Chočské vrchy, Veľká Fatra and Nízke Tatry.
From the second half of the 10th century until 1918, it was part of the Kingdom of Hungary. The first written record about the settlement dates to 1233 as terra Reuche. The town was established by the Germans. It got its town charter in 1318. In 1340, the Hungarian King Charles Robert confirmed the town charter. In the 19th century, Ružomberok was one of the centers of Slo-vak national movement and in the 20th century, Ružomberok was industrialized. The resulting pollution has remained one of the biggest challenges facing the town. Until 2006 the biggest cotton mill in Slova-kia - BZVIL or Texicom – was located in Ružomberok. Today, one of the biggest Slovak exporter businesses - Mondi SCP is still operating in Ružomberok. It is the big-
gest employer in the Ruzomberok district and the Liptov region. Besides others Mondi SCP is the biggest supplier of heat-ing energy, especially for residential houses.
Ružomberok is also a centre for education. The Catholic University in Ružomberok is a public university with religious character. CU performs its activities especially in the areas of the humanities, historical, peda-gogical, and social and health sciences, as well as in the areas of art, economics, man-agement, and law. As of 2009, there were more than 5,000 registered students.
Overview of housing conditions of the respondents
> Number of residents: 30,000 > Number of valid responses: 148 > Share of house/flat ownership: 83.8%
Structure of housing:
> 48.6% detached houses (one or more storeys)
> 45.2% apartment houses (low and high rises)
> 6.1% town houses (neighbouring units on both sides but not above or below)
30.4% off all households in Ružomberok consists of four members. Households with two (16.2%), three (18.2%) of four members (16.2%) are equally common. Single house-holds (6.1%) are rare.
Figure 41: Conditioned living space (Distribution in per cent)
0 10 20 30 40 50
> 160 sqm141-160 sqm121-140 sqm101-120 sqm
81-100 sqm61-80 sqm41-60 sqm20-40 sqm
Less than 20 sqm
> 160 sqm
141-160 sqm
121-140 sqm
101-120 sqm
81-100 sqm
61-80
sqm
41-60
sqm
20-40
sqm
Less than
20 sqm
Flats 1,4 4,3 2,9 4,3 23,2 40,6 14,5 7,2 1,4
Houses 23,3 20,0 8,3 21,7 16,7 5,0 5,0 0,0 0,0
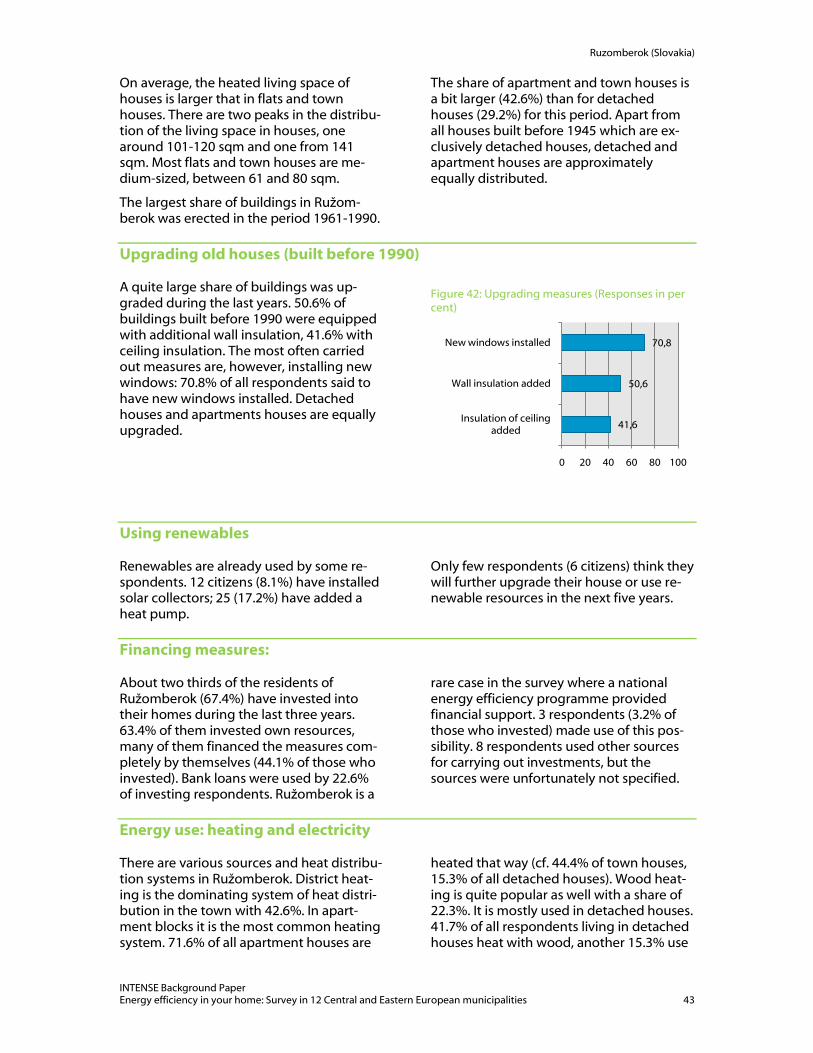
Ruzomberok (Slovakia)
INTENSE Background Paper Energy efficiency in your home: Survey in 12 Central and Eastern European municipalities 43
On average, the heated living space of houses is larger that in flats and town houses. There are two peaks in the distribu-tion of the living space in houses, one around 101-120 sqm and one from 141 sqm. Most flats and town houses are me-dium-sized, between 61 and 80 sqm.
The largest share of buildings in Ružom-berok was erected in the period 1961-1990.
The share of apartment and town houses is a bit larger (42.6%) than for detached houses (29.2%) for this period. Apart from all houses built before 1945 which are ex-clusively detached houses, detached and apartment houses are approximately equally distributed.
Upgrading old houses (built before 1990)
A quite large share of buildings was up-graded during the last years. 50.6% of buildings built before 1990 were equipped with additional wall insulation, 41.6% with ceiling insulation. The most often carried out measures are, however, installing new windows: 70.8% of all respondents said to have new windows installed. Detached houses and apartments houses are equally upgraded.
Figure 42: Upgrading measures (Responses in per cent)
Using renewables
Renewables are already used by some re-spondents. 12 citizens (8.1%) have installed solar collectors; 25 (17.2%) have added a heat pump.
Only few respondents (6 citizens) think they will further upgrade their house or use re-newable resources in the next five years.
Financing measures:
About two thirds of the residents of Ružomberok (67.4%) have invested into their homes during the last three years. 63.4% of them invested own resources, many of them financed the measures com-pletely by themselves (44.1% of those who invested). Bank loans were used by 22.6% of investing respondents. Ružomberok is a
rare case in the survey where a national energy efficiency programme provided financial support. 3 respondents (3.2% of those who invested) made use of this pos-sibility. 8 respondents used other sources for carrying out investments, but the sources were unfortunately not specified.
Energy use: heating and electricity
There are various sources and heat distribu-tion systems in Ružomberok. District heat-ing is the dominating system of heat distri-bution in the town with 42.6%. In apart-ment blocks it is the most common heating system. 71.6% of all apartment houses are
heated that way (cf. 44.4% of town houses, 15.3% of all detached houses). Wood heat-ing is quite popular as well with a share of 22.3%. It is mostly used in detached houses. 41.7% of all respondents living in detached houses heat with wood, another 15.3% use
41,6
50,6
70,8
0 20 40 60 80 100
Insulation of ceiling added
Wall insulation added
New windows installed

Ruzomberok (Slovakia)
INTENSE Background Paper Energy efficiency in your home: Survey in 12 Central and Eastern European municipalities 44
wood pellets. In apartment houses wood or wood pellet heating is used only in individ-ual cases. Surprisingly high is the share of electric heating with 18.2%. Two thirds of the citizens using electric heating live in detached houses; the age of the building does not play any role.
Figure 43: Heating sources (Responses in per cent)
Approximately a fifth (20.7%) makes use of additional portable heaters. Most of the heaters are used on older buildings. 63.6% of those living in buildings built before 1945 have an additional portable electric heater. The share decreases gradually the newer the building is.
Cooling
Just few respondents of Ružomberok make use of electronic cooling devices - 6.8%. Nobody uses them exclusively, but only in combination with ventilation through win-dow.
Individual metres and cost control
Ružomberok is one of the cities where very few respondents do not have an individual metre. Only 11.5% lack a heat metre. Also with regard to regulating the radiators, Ružomberok is one of the most advanced municipalities in the survey. Only one re-spondent does not have any control over the settings of his radiators, 9.3% have one regulation unit for all radiators and 90.0% can regulate each device separately.
The costs for electricity per household are rather high in Ružomberok compared to other municipalities. The average house-hold pays 10.9% of its total income for elec-tricity. 61.1% of the respondents pay 10% or less.
Thermal comfort
More than half of the respondents (54.1%) feel comfortable with an interior tempera-ture between 22 and 24°C, 31.1% between 19-21°C and 11,5% between 25-27°C.
Knowledge and information about energy efficiency
Those who feel informed or very informed are the minority in Ružomberok: 40.4%. Further 32.2% state that they are somewhat informed and more than a quarter (27.4%) says that they are not informed at all.
The average knowledge on a scale from 1-4 (1=very informed, 4=no information at all) is 2.75.
4,7
9,5
9,5
14,9
18,2
20,9
22,3
42,6
0 10 20 30 40 50 60
Heat pump
Coal heating
Wood pellet heating
Gas heating
Electric heating
Central heating system
Wood heating
District heating
1,4
31,1
54,1
11,5
2,0
0 10 20 30 40 50 60 70
16-18°C
19-21°C
22-24°C
25-27°C
Above 27°C
Very informed;
11,6
Informed; 28,8Somewhat
informed; 32,2
Not informed at all; 27,4

Ruzomberok (Slovakia)
INTENSE Background Paper Energy efficiency in your home: Survey in 12 Central and Eastern European municipalities 45
Information sources used
Figure 44: How frequently respondents use different information sources (Responses in per cent)
In Ružomberok, internet is the most fre-quently used source of information with regard to questions on energy efficiency and energy saving. It is used frequently or very frequently by 51.4% of the respon-dents, followed by TV which is at least fre-quently used by 49.7% and newspapers,
frequently or very frequently used by 39.5%.
Interestingly, a comparably large share of the citizens is not using some information sources at all. Reference books and leaflets are never used by more than 40% of all respondents.
Topics of Interest
Figure 45: Which topics concerning energy efficiency are important for the respondents (Responses in per cent)
0% 10% 20% 30% 40% 50% 60% 70% 80% 90% 100%
Leaflets
Reference Books
Newspapers
Radio
Special journals
TV
Internet
LeafletsReference
BooksNewspapers Radio
Special journals
TV Internet
Very frequently 2,9 7,4 8,5 8,5 9,4 13,3 28,5
Frequently 8,6 6,7 31 21,3 17,4 36,4 22,9
Rarely 30,9 23,7 29,6 26,2 24,6 32,2 22,2
Very rarely 16,5 18,5 17,6 24,8 11,6 7,7 4,9
Not at all 41 43,7 13,4 19,1 37 10,5 21,5
0% 10% 20% 30% 40% 50% 60% 70% 80% 90% 100%
Energy efficient constructionPassive house
Energy efficient livingTechnical solutions
What to consider when building a houseEcologic construction materials
Easy neasures for refurbishmentEnergy efficiency in general
Energy efficient
construction
Passive house
Energy efficient
living
Technical solutions
What to consider
when building a
house
Ecologic constructi
on materials
Easy neasures
for refurbish
ment
Energy efficiency in general
Very important 7,9 8,8 11,4 12,1 13,6 13,6 17,0 19,0
Somewhat Important 26,4 19,9 40,0 33,6 28,6 31,4 51,1 41,5
Some-what not important 30,0 30,9 22,9 30,7 29,3 22,1 14,2 16,9
Not important 17,9 16,9 9,3 8,6 11,4 15,0 4,3 4,2
No opinion 17,9 23,5 16,4 15,0 17,1 17,9 13,5 18,3

Ruzomberok (Slovakia)
INTENSE Background Paper Energy efficiency in your home: Survey in 12 Central and Eastern European municipalities 46
Compared to other municipalities in the survey, the respondents in Ružomberok do not attach as great importance to energy topics as others. The topic with the highest importance is easy measures for refurbish-ment. 68.1% of all respondents find that
topic very or somewhat important. Energy efficiency and energy saving are considered as important by 60.5%, technical solutions by 45.7%, ecologic construction materials by 45%, what to consider when building a house by 42.2%
Trust:
Figure 46: How much do you trust the following institutions when it comes to information about energy sav-ing?
Similar to other cases, experts are the most trusted group. 61.0% of respondents have trust or full trust in experts. Several society groups enjoy moderate public confidence: supply companies (45.7%), the media (43.5%), house managers (42.8%) and neighbours and friends (39.3%). The least trusted groups are politicians, NGOs, and state authorities.
Energy consultancy
Citizens of Ružomberok are rather reluctant towards professional advice on energy effi-ciency compared to other municipalities participating in this survey. Only 63.7% of the respondents would for sure or very likely take such advice. Out of these a third (33.3%) would consider paying for the ad-vice as well.
Would you be willing to pay for professional advice on increasing the energy efficiency in your home?
Would like to get professional advice for your home on efficiency meas-ures?
Yes, sure
Yes likely
Probably not
Not at all
Yes, for sure 4 13 15 3
Yes, likely 0 11 37 1
Personal situation
The international financial and economic crisis has affected more than half of the respondents (55.6%). Despite this relatively high figure, only comparatively few re-spondents say that the crisis has an impact on their lives. The most frequently men-tioned consequences are that the respon-dents have hoped for the best (58.2%) and have been saving more in all aspects of live. 45% agree or strongly agree to that latter
0% 10% 20% 30% 40% 50% 60% 70% 80% 90% 100%
NGOs
Municipality
Neighbours and friends
Media
Politicians
State authorities
Supply companies
House managers
Individual Experts
NGOs MunicipalityNeighbours and friends
Media PoliticiansState
authoritiesSupply
companiesHouse
managersIndividual
Experts
Full trust 2,1 3,6 5,7 5,8 5,8 6,4 7,7 10,7 13,5
Trust 19,3 30 33,6 37,7 10,2 23,6 38 32,1 47,5
Little trust 33,6 30,7 31,4 34,1 19,7 34,3 28,9 27,9 12,8
No trust 21,4 11,4 12,9 8 40,1 14,3 9,9 12,1 7,8
Don’t know 23,6 24,3 16,4 14,5 24,1 21,4 15,5 17,1 18,4
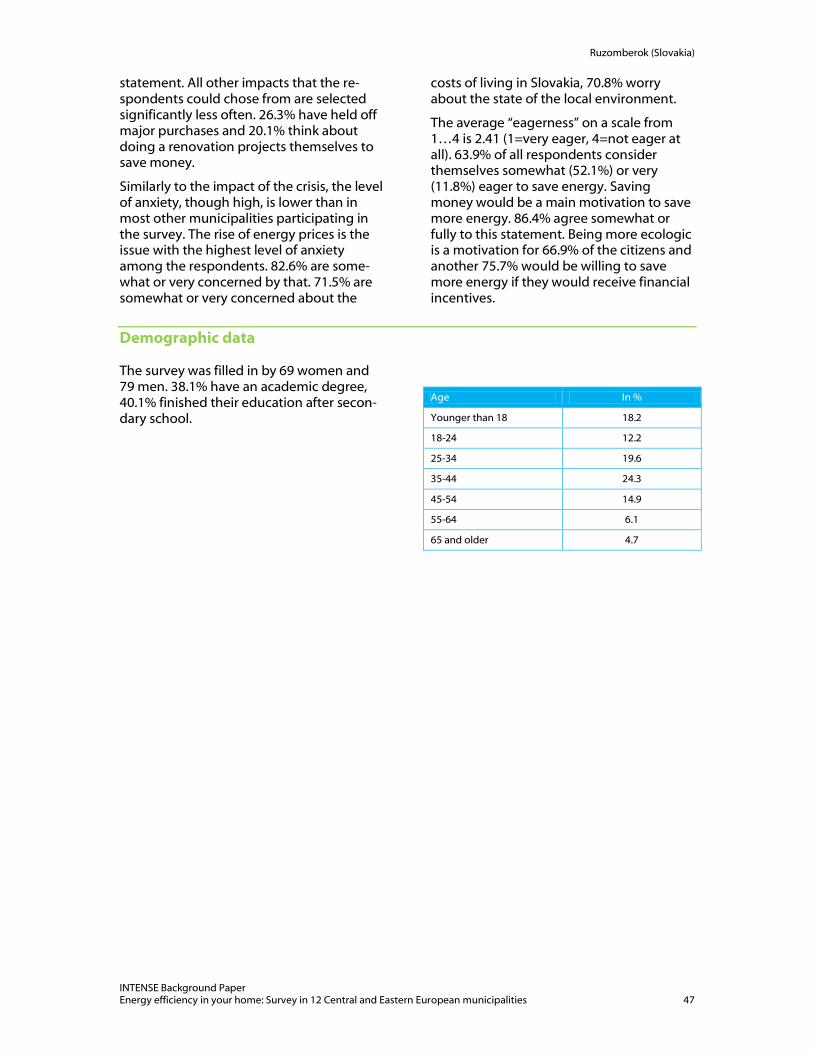
Ruzomberok (Slovakia)
INTENSE Background Paper Energy efficiency in your home: Survey in 12 Central and Eastern European municipalities 47
statement. All other impacts that the re-spondents could chose from are selected significantly less often. 26.3% have held off major purchases and 20.1% think about doing a renovation projects themselves to save money.
Similarly to the impact of the crisis, the level of anxiety, though high, is lower than in most other municipalities participating in the survey. The rise of energy prices is the issue with the highest level of anxiety among the respondents. 82.6% are some-what or very concerned by that. 71.5% are somewhat or very concerned about the
costs of living in Slovakia, 70.8% worry about the state of the local environment.
The average ―eagerness‖ on a scale from 1…4 is 2.41 (1=very eager, 4=not eager at all). 63.9% of all respondents consider themselves somewhat (52.1%) or very (11.8%) eager to save energy. Saving money would be a main motivation to save more energy. 86.4% agree somewhat or fully to this statement. Being more ecologic is a motivation for 66.9% of the citizens and another 75.7% would be willing to save more energy if they would receive financial incentives.
Demographic data
The survey was filled in by 69 women and 79 men. 38.1% have an academic degree, 40.1% finished their education after secon-dary school.
Age In %
Younger than 18 18.2
18-24 12.2
25-34 19.6
35-44 24.3
45-54 14.9
55-64 6.1
65 and older 4.7

Veszprem (Hungary)
INTENSE Background Paper Energy efficiency in your home: Survey in 12 Central and Eastern European municipalities 48
Veszprém (Hungary)
General information
The municipality of Veszprém with 62,000 inhabitants is located in the Northern vicin-ity of the Lake Balaton, 110 km east of the Hungarian capital of Budapest. The history of the city dates back to foundation period of Hungary and according to the local leg-end, Veszprém was founded on seven hills. The city became the first episcopal seat of Hungary in 1009. One of the oldest cathe-drals in Hungary is still located in the for-tress of Veszprém (Szent Mihály, built in 1001, later destroyed and rebuilt).
Veszprém is the regional cultural, eco-nomic, and administrative center. It was among the first Hungarian cities to have a university - students studied law and arts here. Today, the University of Pannonia is the academic centre of the region. There are more than 10.000 students registered in five faculties.
More than 60% of the local GDP comes from the services, nearly 30% from the in-dustry (amongst others building materials), 6% from the building industry, and about 5% from the agriculture. Tourism is an im-portant pillar of the local economy as Vesz-prém is a historic town, close to Lake Bala-ton.
Overview of housing conditions of the respondents
> Number of residents: 62,850 > Number of total responses: 364 > Share of house ownership: 91.1% (319
of 350)
Structure of housing:
> 44% detached houses > 46% apartment houses > 10% row or town houses (neighbouring
units on both sides but not above or below)
The average size of flats is significantly dif-ferent depending on type of house. While inhabitants of detached houses have 3.5 rooms on average, the average for resi-dents of apartment buildings is only 2.4 rooms. This trend is also visible in the aver-age floor space. Most inhabitants of single detached houses have 81-100 sqm, while most of the apartment inhabitants live on 41-60 sqm.
Figure 47: Conditioned living space (Distribution in per cent)
The average age of the buildings is also significantly depending on the type of building. Regarding apartment houses with
0 20 40 60
> 160 sqm
141-160 sqm
121-140 sqm
101-120 sqm
81-100 sqm
61-80 sqm
41-60 sqm
20-40 sqm
Less than 20
> 160 sqm
141-160 sqm
121-140 sqm
101-120 sqm
81-100 sqm
61-80
sqm
41-60
sqm
20-40
sqm
Less than
20
Flat 0,5 0,0 1,0 5,1 7,6 27,9 49,7 7,1 1,0
House 6,0 7,4 8,1 22,1 31,5 14,8 5,4 2,7 2,0
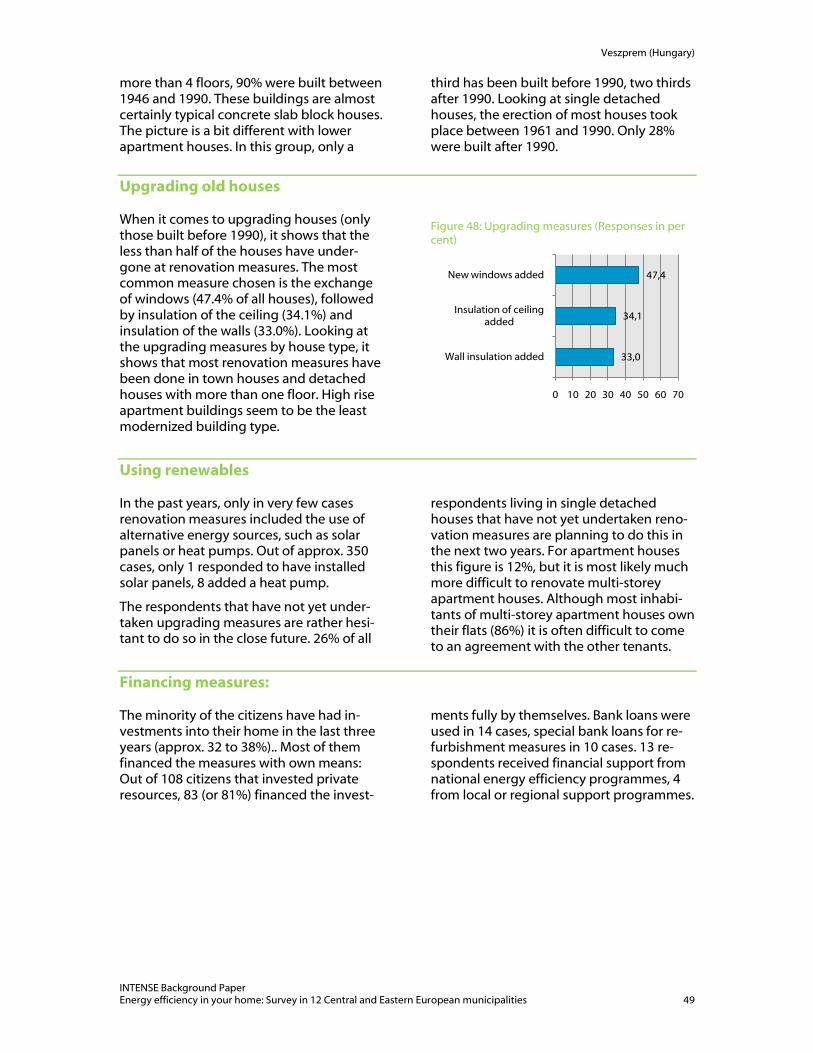
Veszprem (Hungary)
INTENSE Background Paper Energy efficiency in your home: Survey in 12 Central and Eastern European municipalities 49
more than 4 floors, 90% were built between 1946 and 1990. These buildings are almost certainly typical concrete slab block houses. The picture is a bit different with lower apartment houses. In this group, only a
third has been built before 1990, two thirds after 1990. Looking at single detached houses, the erection of most houses took place between 1961 and 1990. Only 28% were built after 1990.
Upgrading old houses
When it comes to upgrading houses (only those built before 1990), it shows that the less than half of the houses have under-gone at renovation measures. The most common measure chosen is the exchange of windows (47.4% of all houses), followed by insulation of the ceiling (34.1%) and insulation of the walls (33.0%). Looking at the upgrading measures by house type, it shows that most renovation measures have been done in town houses and detached houses with more than one floor. High rise apartment buildings seem to be the least modernized building type.
Figure 48: Upgrading measures (Responses in per cent)
Using renewables
In the past years, only in very few cases renovation measures included the use of alternative energy sources, such as solar panels or heat pumps. Out of approx. 350 cases, only 1 responded to have installed solar panels, 8 added a heat pump.
The respondents that have not yet under-taken upgrading measures are rather hesi-tant to do so in the close future. 26% of all
respondents living in single detached houses that have not yet undertaken reno-vation measures are planning to do this in the next two years. For apartment houses this figure is 12%, but it is most likely much more difficult to renovate multi-storey apartment houses. Although most inhabi-tants of multi-storey apartment houses own their flats (86%) it is often difficult to come to an agreement with the other tenants.
Financing measures:
The minority of the citizens have had in-vestments into their home in the last three years (approx. 32 to 38%).. Most of them financed the measures with own means: Out of 108 citizens that invested private resources, 83 (or 81%) financed the invest-
ments fully by themselves. Bank loans were used in 14 cases, special bank loans for re-furbishment measures in 10 cases. 13 re-spondents received financial support from national energy efficiency programmes, 4 from local or regional support programmes.
33,0
34,1
47,4
0 10 20 30 40 50 60 70
Wall insulation added
Insulation of ceiling added
New windows added

Veszprem (Hungary)
INTENSE Background Paper Energy efficiency in your home: Survey in 12 Central and Eastern European municipalities 50
Energy use: heating and electricity
Figure 49: Heating sources (Responses in per cent)
The distribution of energy sources for heat shows a clear tendency towards the use of gas. The heat supply for all apartment houses is from on gas, or flats are con-nected to district or central heating systems (which are most likely also operated on gas). More than half of the single detached houses and approx half of the town houses gain their heat from gas as well. In de-tached houses, wood is the second most frequently used heat source. Wood pellets and electricity are not used at all.
Looking at the age of buildings, there is little difference between the different types of heating. After 1990, wood has slightly lost importance as a heating source. (approx. 10% 1961-1990 vs. 7% after 1990) while gas heating remains popular. District heating has lost its dominant role after 1990. Only 3.7% of respondents of building built after 1990 state to be connected to district heating (cf. 31.5% 1961-1990).
Additional portable electric heaters are used by 13.4% (mostly one device) of all respondents, but the large majority does not use such devices.
Cooling
Approximately 8.2% of all respondents make use of electronic cooling devices; the
remaining respondents only cool by man-ual ventilation.
Individual metres and cost control
A narrow majority of 53.9% of respondents have an individual heating metre. Regard-ing control over radiators, one quarter of the respondents have no control at all. 15.3% have a control unit for all radiators; the remaining 59.7% can set each radiator separately to the desired temperature.
Regarding electricity, the data suggest that the average household pays approximately 5.5% of the household income for electric-ity. 90% of all households pay less then 10% of their household income.
Thermal comfort
Figure 50: Typical temperature at which people feel comfortable (Responses in per cent)
The vast majority of citizens state that they feel comfortable at temperatures between 19-24 °C with a tendency to higher tem-peratures.
0,3
1,1
10,4
15,2
23,6
49,4
0 10 20 30 40 50 60 70
Oil heating
Other or combined …
Wood heating
Central heating system
District heating
Gas heating
0,6
2,5
37,1
55,9
3,9
0 10 20 30 40 50 60 70
Below 16°C
16-18°C
19-21°C
22-24°C
25-27°C

Veszprem (Hungary)
INTENSE Background Paper Energy efficiency in your home: Survey in 12 Central and Eastern European municipalities 51
Knowledge and information about energy efficiency
Figure 51: How respondents rate their level of information about energy efficiency (Responses in per cent)
Less than half of the citizens of Veszprém feel informed about energy efficiency. 38.7% of all residents feel informed or very informed. Looking at this figure in detail, it shows that 39.6% of those who own their flat/house feel very informed or informed, while this is the case for only 31.0% of those who rent a flat.
The average knowledge of Veszprém citi-zens on a scale from 1-4 (1=very informed, 4=no information at all) is 2.71.
Information sources used
Figure 52: How frequently respondents use different information sources (Responses in per cent)
Among the most used sources for informa-tion are the general mass media that are easily accessible: television, newspa-per/magazines and Internet. Radio reaches
a quite large share of the population as well. Special journals and guide books are rarely consulted.
Very informed;
3,2
Informed; 35,5
Somewhat informed;
47,2
Not informed at all; 14,1
0% 10% 20% 30% 40% 50% 60% 70% 80% 90% 100%
Reference books
Special journals
Leaflets
Newspapers
Internet
Radio
TV
Reference books
Special journals
Leaflets Newspapers Internet Radio TV
Very frequently 1,3 1,7 3,2 10,7 11,0 11,4 18,4
Frequently 7,5 13,8 18,0 42,6 35,5 31,1 48,0
Rarely 20,8 31,5 29,6 28,2 26,7 27,7 24,3
Very rarely 22,1 24,1 28,4 12,0 9,9 17,0 6,9
Not at all 48,3 28,9 20,8 6,5 16,8 12,9 2,3

Veszprem (Hungary)
INTENSE Background Paper Energy efficiency in your home: Survey in 12 Central and Eastern European municipalities 52
Topics of Interest
Figure 53: Which topics concerning energy efficiency are important for the respondents (Responses in per cent)
Respondents of Veszprém are generally interested in various energy topics. The issue which is considered most important is energy efficiency and energy saving in general. 85.9% find this topic somewhat or very important. Other topics which are of
high interest to the residents in Veszprém are easy measures for refurbishment (79.7%) and energy efficient living (77.4). The least popular topic is energy efficient construction (43.1%).
Trust
Figure 54: How much do you trust the following institutions when it comes to information about energy sav-ing?
0% 10% 20% 30% 40% 50% 60% 70% 80% 90% 100%
Energy efficiency in generalEasy measures for refurbishment
Technical solutions rEnergy efficient construction
Energy efficient livingWhat to consider when building a house
Passive houseEcological building materials
Energy efficiency in general
Easy measures
for refurbish
ment
Technical solutions
r
Energy efficient
construction
Energy efficient
living
What to consider
when building a
house
Passive house
Ecological building materials
Very important 40,2 33,1 22,5 16,5 33,6 27,9 16,7 16,2
Somewhat important 45,7 46,6 43,9 26,6 43,8 26,0 29,0 32,8
Somewhat not important 8,0 14,1 19,3 22,5 14,2 29,8 33,8 28,7
Not important 2,9 2,8 5,6 8,0 2,9 9,1 9,3 14,3
No opinion 3,2 3,4 2,5 4,1 5,5 7,2 5,8 7,9
0% 10% 20% 30% 40% 50% 60% 70% 80% 90% 100%
Politicians
Media
House managers
State authorities
NGOs
Energy supply companies
Municipalities
Individual experts
Neighbours and friends
Politicians MediaHouse
managers
State authoritie
sNGOs
Energy supply
companies
Municipalities
Individual experts
Neighbours and friends
Full trust 0,0 1,4 1,6 4,1 4,5 7,5 7,8 11,4 13,1
Trust 0,7 16,5 15,2 23,2 40,0 28,2 50,0 47,6 32,5
Little trust 19,6 52,3 32,5 32,5 29,8 35,0 24,0 22,7 35,4
No trust 69,0 21,9 26,7 32,1 15,5 23,6 11,5 9,9 13,4
Don’t know 10,7 7,9 23,9 8,1 10,5 5,7 6,8 8,4 5,6

Veszprem (Hungary)
INTENSE Background Paper Energy efficiency in your home: Survey in 12 Central and Eastern European municipalities 53
It shows that individual experts and the municipality enjoy the highest trust, fol-lowed by NGOs, neighbours and friends. The media and house managers enjoy less
trust. Politicians are the least trustworthy group. State institutions however are rated significantly better than politicians.
Energy consultancy
A large majority of 80.4% would appreciate to get individual professional advice for their home on what concrete measures they could take to increase the energy effi-ciency. However, only a third of those would also consider paying for such advice (―yes, sure‖ and ―yes likely‖)
Would you be willing to pay for profes-sional advice on increasing the energy efficiency in your home?
Would like to get profes-sional advice for your home on efficiency measures?
Yes, sure
Yes likely
Probably not
Not at all
Yes, for sure 7 23 40 21
Yes, likely 2 28 78 41
Personal situation
Asked about their personal situation and feelings, about 58.6% responded that they feel affected by the current financial and economic crisis. 55.5% of citizens claimed to delay or cancel renovation projects, 69.4% said that they are more likely to do renovation works by themselves. 65.5% have held off major purchases. A significant share (around 50%) of citizens are also spending less, buy more generic brands or have re-structured their investments into less risky ones.
Seeing this significant impact of the crisis on the citizens, it is not surprising that 95.4% are somewhat or very nervous about the rise of energy prices. Similarly, 92.6% are worried about the costs of living.
Demographic data
The questions were answered by 224 women and 119 men. 34.5% have an aca-demic degree, 39.0% finished their educa-tion after secondary school.
Age In %
Younger than 18 0.6
18-24 5.8
25-34 17.3
35-44 26.0
45-54 32.7
55-64 14.7
65 and older 2.9

Ptuj (Slovenia)
INTENSE Background Paper Energy efficiency in your home: Survey in 12 Central and Eastern European municipalities 54
Ptuj (Slovenia)
General information
Ptuj is the oldest documented town in Slo-venia and is situated in North-Eastern Slo-venia, in the centre of Lower Podravje re-gion at the border with Prlekija region. The municipality of Ptuj is the second smallest municipality in Slovenia by size with 66.7 km2 and it has 23.741 inhabitants. Ptuj is a partner city in the project ―European Capi-tal of Culture 2012‖, together with the Slovenian city of Maribor.
Today, this important economic centre of the lower Podravje region is a city of fairs, a starting point of excursions into unspoiled nature, a city with a rich culinary offer, wine cellars and thermal springs. Ptuj is the cen-tre place of a ten-day long carnival in the spring, an ancient Slavic pagan rite of spring and fertility, called Kurentovanje. Kurent is believed to be the name of an ancient god of hedonism, the Slavic coun-terpart of the Greek Priapose, although there are no written records.
One of the most important projects of the town is to develop areas for economy and manufacturing activities through European, local and private funds. Among the most important investment project has been The Centre for Waste Management "GAJKE cero", which is planned as one of the most advanced such facilities in Slovenia.
Overview of housing conditions of the respondents
> Number of residents: 23.741 > Number of valid responses: 101 > Share of house/flat ownership: 88.0%
Structure of housing:
> 62.5% detached houses (most of them two stories)
> 34.4% apartment houses (low and high rises)
> 3.1% town houses (neighbouring units on both sides but not above or below)
In Ptuj, most households consist of either two (28%), three (26%) or four members (28%). 11% of households have five mem-bers; other sizes are rare.
Figure 55: Conditioned living space (Distribution in per cent)
Most apartments in Ptuj have an average size of 41-80 sqm. This is a typical value for
0 10 20 30 40 50
> 160 sqm
141-160 sqm
121-140 sqm
101-120 sqm
81-100 sqm
61-80 sqm
41-60 sqm
20-40 sqm
> 160 sqm
141-160 sqm
121-140 sqm
101-120 sqm
81-100 sqm
61-80
sqm
41-60
sqm
20-40
sqm
Flats and town houses 0,0 2,8 0,0 2,8 11,1 47,2 33,3 2,8
Houses 25,0 13,3 8,3 20,0 18,3 11,7 3,3 0,0

Ptuj (Slovenia)
INTENSE Background Paper Energy efficiency in your home: Survey in 12 Central and Eastern European municipalities 55
concrete slab block houses, built between 1961 and 1990. Mose houses have more than 80 sqm, with a peak around 101-120 sqm.
Regarding the age of buildings, most houses or flats of the respondents were
built between 1961 and 1990. In contrast to other municipalities of the survey, Ptuj has a larger share of older buildings. 17.8% of buildings are built before 1960.
Upgrading old houses (built before 1990)
The most frequently implemented measure to increase the energy performance of buildings has been the exchange of win-dows. 60% of the respondents confirmed that they have installed new windows. The second most frequently chosen measure has been the insulation of the ceiling (47.8%), followed by insulation of the wall (28.2%). Detached houses are more likely to have undergone renovation. There was no case where wall insulation was added to apartment houses. Regarding insulation of the ceilings, a much smaller share of apart-ment houses (22.7%) was upgraded com-pared to detached houses (57.1%)
Figure 56: Upgrading measures (Responses in per cent)
Using renewables
Solar collectors are installed by 3 residents, 10 respondents have installed heat pumps.
Only few respondents (6 citizens) think they will further upgrade their house or use re-newable resources in the next five years.
Financing measures
The majority of respondents have had in-vestments in the last 3 years (73.5%). Similar as in other cases, a large share of respon-dents financed the measures with own resources. 53 (73.6%) respondents have
used own means, 42 (58.3% of those who invested) financed the measures entirely by themselves. 11 citizens used bank loans and two citizens used subsidies or loans from the national environmental fund.
Energy use: heating and electricity
There is a variety of different sources for heating and different heating systems pre-sent in Ptuj. The main fuel for heating is oil. More than half of the respondents (51.5%) use it for heating which is rare among the surveyed municipalities. Other frequently used sources are gas (24.8%) and wood (21.8%). The most common heat distribu-tion system is central heating (27.7%), fol-lowed by district heating (13.9%).
As for oil, it is usually used in single de-tached houses. Gas is equally used in de-tached houses and apartment houses, while wood is used exclusively in detached houses. All flats where heat is provided by district heating are in apartment houses, most of them built between 1961 and 1990.
In Ptuj, comparatively many respondents make use of additional portable electric heaters. 31% of the respondents confirm to use such devices, 10% use even 4 or more.
28,2
47,8
60,0
0 10 20 30 40 50 60 70
Wall insulation added
Insulation of ceiling added
New windows installed
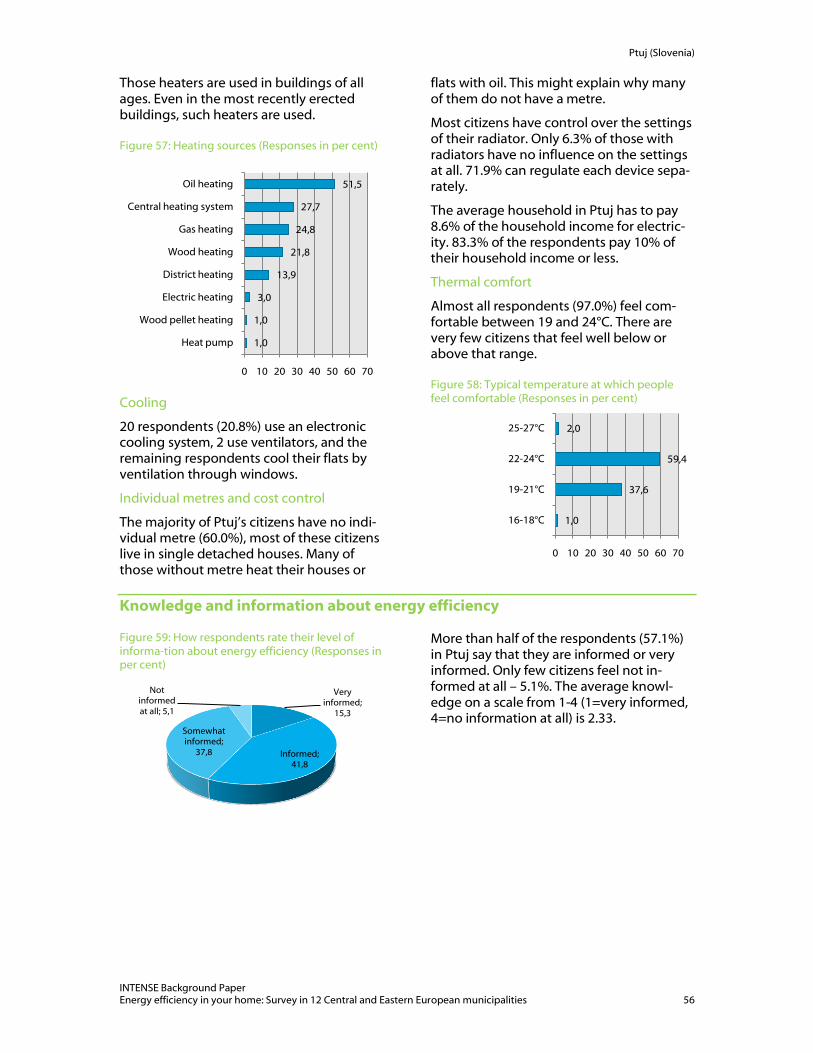
Ptuj (Slovenia)
INTENSE Background Paper Energy efficiency in your home: Survey in 12 Central and Eastern European municipalities 56
Those heaters are used in buildings of all ages. Even in the most recently erected buildings, such heaters are used.
Figure 57: Heating sources (Responses in per cent)
Cooling
20 respondents (20.8%) use an electronic cooling system, 2 use ventilators, and the remaining respondents cool their flats by ventilation through windows.
Individual metres and cost control
The majority of Ptuj’s citizens have no indi-vidual metre (60.0%), most of these citizens live in single detached houses. Many of those without metre heat their houses or
flats with oil. This might explain why many of them do not have a metre.
Most citizens have control over the settings of their radiator. Only 6.3% of those with radiators have no influence on the settings at all. 71.9% can regulate each device sepa-rately.
The average household in Ptuj has to pay 8.6% of the household income for electric-ity. 83.3% of the respondents pay 10% of their household income or less.
Thermal comfort
Almost all respondents (97.0%) feel com-fortable between 19 and 24°C. There are very few citizens that feel well below or above that range.
Figure 58: Typical temperature at which people feel comfortable (Responses in per cent)
Knowledge and information about energy efficiency
Figure 59: How respondents rate their level of informa-tion about energy efficiency (Responses in per cent)
More than half of the respondents (57.1%) in Ptuj say that they are informed or very informed. Only few citizens feel not in-formed at all – 5.1%. The average knowl-edge on a scale from 1-4 (1=very informed, 4=no information at all) is 2.33.
1,0
1,0
3,0
13,9
21,8
24,8
27,7
51,5
0 10 20 30 40 50 60 70
Heat pump
Wood pellet heating
Electric heating
District heating
Wood heating
Gas heating
Central heating system
Oil heating
1,0
37,6
59,4
2,0
0 10 20 30 40 50 60 70
16-18°C
19-21°C
22-24°C
25-27°C
Very informed;
15,3
Informed; 41,8
Somewhat informed;
37,8
Not informed at all; 5,1

Ptuj (Slovenia)
INTENSE Background Paper Energy efficiency in your home: Survey in 12 Central and Eastern European municipalities 57
Information sources used
Figure 60: How frequently respondents use different information sources (Responses in per cent)
Most residents of Ptuj use a mix of media to obtain information about energy issues. Most frequently used are newspapers (70.3% use it frequently or very frequently), the Internet (64.6%) and television (63.2%).
In contrast to other municipalities of the survey, leaflets are rather popular in Ptuj. 42.3% of the respondents use them fre-quently or very frequently as a source of information.
Topics of Interest
Figure 61: Which topics concerning energy efficiency are important for the respondents (Responses in per cent)
0% 10% 20% 30% 40% 50% 60% 70% 80% 90% 100%
Reference Books
Special journals
Radio
Leaflets
TV
Newspapers
Internet
Reference Books
Special journals
Radio Leaflets TV Newspapers Internet
Very frequently 1,5 4,1 6,3 6,4 13,8 16,5 26,6
Frequently 11,9 17,6 27,8 35,9 49,4 53,8 38
Rarely 38,8 28,4 31,6 33,3 25,3 23,1 25,3
Very rarely 22,4 21,6 25,3 19,2 11,5 5,5 5,1
Not at all 25,4 28,4 8,9 5,1 0 1,1 5,1
0% 10% 20% 30% 40% 50% 60% 70% 80% 90% 100%
Technical solutions
Passive house
Energy efficient living
Ecologic construction materials
Easy measures for refurbishment
Energy efficient construction
Energy efficiency in general
What to consider when building a house
Technical solutions
Passive house
Energy efficient
living
Ecologic constructi
on materials
Easy measures
for refurbish
ment
Energy efficient
construction
Energy efficiency in general
What to consider
when building a
house
Very important 33,0 34,1 40,2 40,2 42,0 45,9 46,2 46,4
Somewhat Important 46,6 34,1 48,3 39,1 43,2 36,5 41,9 35,7
Some-what not important 13,6 20,0 5,7 10,3 10,2 10,6 9,7 8,3
Not important 4,5 9,4 3,4 6,9 2,3 4,7 0,0 7,1
No opinion 2,3 2,4 2,3 3,4 2,3 2,4 2,2 2,4

Ptuj (Slovenia)
INTENSE Background Paper Energy efficiency in your home: Survey in 12 Central and Eastern European municipalities 58
The citizens of Ptuj find energy issues im-portant. More than two thirds of the re-spondents find all topics somewhat or very important. The topic of highest importance is energy efficient living. 88.5% of all re-spondents find this issue very of somewhat
important, followed by energy efficiency and energy saving in general (88.2%), easy measures to refurbish the home (85.2%). The topic of least interest is passive houses, but this issue is still important or very im-portant for 68.2% of the respondents.
Trust
Figure 62: How much do you trust the following institutions when it comes to information about energy sav-ing?
The respondents in Ptuj have the most trust in individual experts. 81.5% have trust of full trust in them. The next most trustwor-thy groups are supply companies (51.1%), NGOs (46.4%) and municipalities (35.6%).
The least trustworthy groups according to the survey participants are politicians (2.4%), house managers (20.0%), the media (28.1%), neighbours and friends (28.6%).
Energy consultancy
Most respondents of Ptuj would appreciate professional advice on energy efficiency. 84.8% would welcome such advice likely or for sure. Out of these, slightly more than half (52 %) would consider paying for the advice as well.
Would you be willing to pay for professional advice on increasing the energy efficiency in your home?
Would like to get professional advice for your home on efficiency meas-ures?
Yes, sure
Yes likely
Probably not
Not at all
Yes, for sure 7 15 9 1
Yes, likely 1 16 25 1
0% 10% 20% 30% 40% 50% 60% 70% 80% 90% 100%
House managers
Politicians
Media
State authorities
Neighbours and friends
Municipality
NGOs
Energy supply companies
Individual
House managers
Politicians MediaState
authorities
Neighbours and friends
Municipality
NGOs
Energy supply
companies
Individual
Full trust 0,0 0,0 1,1 1,1 1,2 2,3 4,9 11,1 30,4
Trust 20,0 2,4 27,0 30,3 27,4 33,3 41,5 40,0 51,1
Little trust 51,4 45,2 59,6 53,9 56,0 51,7 46,3 33,3 17,4
No trust 18,6 48,8 11,2 14,6 11,9 12,6 6,1 15,6 1,1
Do n’t know 10,0 3,6 1,1 0,0 3,6 12,6 1,2 0,0 0,0

Ptuj (Slovenia)
INTENSE Background Paper Energy efficiency in your home: Survey in 12 Central and Eastern European municipalities 59
Personal situation
Less than half of the citizens state that they feel affected by the international financial and economic crisis (45.3%). The conse-quences of this are limited to general as-pects of saving and spending of the re-spondents. 70.6% say that they have been saving more in all aspects of live, 66.7% that they have been spending a bit less. 60.2% have held off major purchases and 72.6% just keep their fingers crossed and hope for the best. Renovation projects are partly affected. 42.4% are delaying or cancelling a renovation project around their house, 47% are downsizing their renovation plans and 56.5% say that they are more likely to carry out certain works themselves instead of hiring someone.
When asked about personal worries and anxieties, one issue clearly stands out: 99.0% of the respondents are anxious or very anxious about the state of the envi-ronment in general. Asked about the local
environment, 89.4% are worried or very worried. The rise of energy prices (90.6%) and the rise of living costs in Slovenia (94.8%) are also of high concern to the most of the respondents. Last but not least, the global economy is the reason for 90.5% to be somewhat of very anxious.
Residents of Ptuj are very eager when it comes to energy saving. 97.0% of all re-spondents say that they are eager (55.6%) or very eager (41.4%) to save energy. The average ―eagerness‖ on a scale from 1…4 is 1.62 (1=very eager, 4=not eager at all). Sav-ing money (97.8% agree somewhat of fully) and feeling better (95.5%) are clearly the main motivations for the respondents to save energy. 93.3% would save more en-ergy if there were financial incentives (such as extra funding for renovation) and 83.1% would save more energy if they were told how to do it properly. To be more ecologi-cal is still a motivation for 74.7% of the re-spondents
Demographic data
The survey was filled in by 67 women and 34 men. 77.8% have an academic degree, 21.2% finished their education after secon-dary school.
Age In %
Younger than 18 0,0
18-24 2,0
25-34 45,0
35-44 28,0
45-54 19,0
55-64 6,0
65 and older 0,0

Baile Tusnad (Romania)
INTENSE Background Paper Energy efficiency in your home: Survey in 12 Central and Eastern European municipalities 60
Băile Tuşnad (Romania)
General information
Băile Tuşnad is the smallest town in Roma-nia. It received the town status in May 1968 thanks to its mineral waters and spa, which today make it a touristic holiday destina-tion, particularly for people from Romanian cities (Brasov is 67 km away, and Bucharest it is 240 km to Bucharest, the capital). In 1992 the town had a total number of 1,953 inhabitants, out of which 1,822 Magyars. Since 1992, Băile Tuşnad houses several international conferences. The picturesque environs, the Eagle Rock and its surround-ings, the Lovers' clearing, Saint Ann Lake, the paths of the pine forest, the specialties of the Szekler cuisine, the carriage walks - are only some of the many attractive possi-bilities offered to the guests by Băile Tuş-nad. The spa and climatic resort lies in pe-culiarly beautiful environs at the eastern ending of the volcanic South-Harghita, at the foot of the Ciomad block, in the pass of the Olt in Băile Tuşnad (606 m). It borders the Baraolt Mountains in the south-west, and the Bodoc Mountain range in the south-east. The sub alpine climate, its air rich in negative ions is a significant tourist factor. The average altitude of the spa is 656 m.
Băile Tuşnad lies at the Eastern foot of the Eagle Rock (848 m) and on the Western slopes of the Ciomad Mountain (1301 m). At the way out of the pass we can admire the
Bixad Valley Basin. Ciomad is the youngest volcanic mountain in the Carpathians. The twin craters prove that there was still an active volcanic activity in the Pleistocene period. Today the post-volcanic phenom-ena can be observed. In the crater of the Ciomat is situated the only volcanic lake of Middle Europe that has remained in a good state, Saint Ann Lake, while in the twin cra-ter the Mohos peat bog can be seen.
The main water course of the spa is the Olt River into which several streams flow. The artificial Ciucas Lake was created from the water of the Olt and a small holiday place was also created around it which hosts a skate rink in the winter.
The pass of the Olt at Baile Tusnad (or Tus-nad Pass, 606 m). It was formed on the western side of the Ciomat-Puciosul vol-canic Mountains.
Overview of housing conditions of the respondents
> Number of residents: 1.700 > Number of valid responses: 55 > Share of house/flat ownership: 80.9%
Structure of housing:
> 35.2% detached houses (one or more storeys)
> 55.6% apartment houses (low and high rises)
> 9.3% town houses (neighbouring units on both sides but not above or below)
Most flats or houses are inhabited by 3 (40.0%) or 4 persons (30.9%). Two-person households are also relatively common (16.4%). Households with 5 members or more account for another 7.3%, single households for 5.5%.

Baile Tusnad (Romania)
INTENSE Background Paper Energy efficiency in your home: Survey in 12 Central and Eastern European municipalities 61
Figure 63: Conditioned living space (Distribution in per cent)
Houses are comparatively small in Băile Tuşnad, compared with other cities of the survey. Most houses have below 100 sqm, most flats below 80 sqm.
The majority of buildings were erected be-tween 1961 and 1990. 75.9% of all houses and were built in this period; almost all apartment houses date back to this period. 16.7% were built since 1990, most of them detached houses.
Upgrading old houses (built before 1990)
A part of the houses in Băile Tuşnad were upgraded recently. In some houses, insula-tion of the outside walls (17.4%) or the ceil-ing (19.6%) has been added. The most fre-quently chose measure was however the installation of new windows (in 41.3% of houses built before 1990)
Only houses that were built before 1990 were considered:
Figure 64: Upgrading measures (Responses in per cent)
Using renewables
In some houses, heat pumps were installed. 10 respondents confirmed to have a heat pump.
0 10 20 30 40
> 160 sqm
141-160 sqm
121-140 sqm
101-120 sqm
81-100 sqm
61-80 sqm
41-60 sqm
20-40 sqm
> 160 sqm
141-160 sqm
121-140 sqm
101-120 sqm
81-100 sqm
61-80 sqm
41-60 sqm
20-40 sqm
Flats 0 0 0 0 7,5 13,2 34 11,3
House 3,8 0 0 1,9 11,3 7,5 9,4 0
17,4
19,7
41,3
0 10 20 30 40 50 60
Wall insulation added
Insulation of ceiling added
New windows installed

Baile Tusnad (Romania)
INTENSE Background Paper Energy efficiency in your home: Survey in 12 Central and Eastern European municipalities 62
Financing measures
22 respondents said that they had invest-ments during the last 3 years. Unfortu-nately, the question about which resources have been used, have been answered by
very few respondents so that it will not be possible to provide some further details here.
Energy use: heating and electricity
As only one respondent chose more than one answer, this overview will represent the most used energy source. Gas is the domi-nating heating source for more than half of the respondents. It is used in apartment houses and single detached houses of dif-ferent ages. Wood as the second most used energy source is only used in detached houses and row houses. It is exclusively used in houses built until 1990.
Figure 65: Heating sources (Responses in per cent)
22.2% of all respondents make additional use of portable electric heaters; most of them use just one.
Cooling
Only 21 respondents answered the ques-tion about cooling. 3 of them stated to use electronic cooling devices exclusively, 3 other use them in combination with con-ventional cooling through windows.
Individual metres and cost control
69.1% of the citizens of Băile Tuşnad have an individual heat metre, among them all citizens who live in town houses. However, most of the citizens can adjust the settings of their radiators. There are only two re-spondents who cannot regulate their radia-tors at all. 13 respondents have only one control unit for all radiators, 29 have full control over all radiators.
If those who stated that they pay nothing for electricity are not counted, then the average household needs to pay 7.2% of the household income for electricity. 88.6% of the respondents pay 10% or less of their household income for electricity.
Thermal comfort
Figure 66: Typical temperature at which people feel comfortable (Responses in per cent)
The majority of respondents stated that they feel comfortable at temperatures be-tween 19-24 °C, with a tendency to higher temperatures.
1,8
3,6
5,5
14,5
16,4
58,2
0 10 20 30 40 50 60 70
Electric heating
Heat pump
District heating
Central heating system
Wood heating
Gas heating
1,9
31,5
51,9
13,0
1,9
0 10 20 30 40 50 60 70
16-18°C
19-21°C
22-24°C
25-27°C
Above 27°C

Baile Tusnad (Romania)
INTENSE Background Paper Energy efficiency in your home: Survey in 12 Central and Eastern European municipalities 63
Knowledge and information about energy efficiency
Figure 67: How respondents rate their level of information about energy efficiency (Responses in per cent)
More than 60% of the respondents feel very informed or informed. Very few state that they are not informed at all (3.7%)
The average knowledge on a scale from 1-4 (1=very informed, 4=no information at all) is 2.37.
Information sources used
Television is the most often used source of information when it comes to energy effi-ciency.74.5% of all respondents use it fre-quently or very frequently as an informa-tion source. Internet (51.9%) and newspa-per (50.0%) are often used as well. Radio is
still used quite often, although just in few cases very frequently (6.8% very frequently, but 43.2% frequently). Leaflets, special journals, and reference books are least used.
Figure 68: How frequently respondents use different information sources (Responses in per cent)
Very informed;
3,7
Informed; 59,3
Somewhat informed;
33,3
Not informed at all; 3,7
0% 10% 20% 30% 40% 50% 60% 70% 80% 90% 100%
Special journals
Reference books
Radio
Newspapers
Leaflets
Internet
TV
Special journals
Reference books
Radio Newspapers Leaflets Internet TV
Very frequently 2,4 4,3 6,8 12,5 14,6 25 42,6
Frequemtly 9,8 17,4 43,2 37,5 14,6 26,9 31,9
Rarely 43,9 17,4 20,5 41,7 16,7 26,9 12,8
Very rarely 19,5 19,6 22,7 4,2 35,4 13,5 10,6
Not at all 24,4 41,3 6,8 4,2 18,8 7,7 2,1
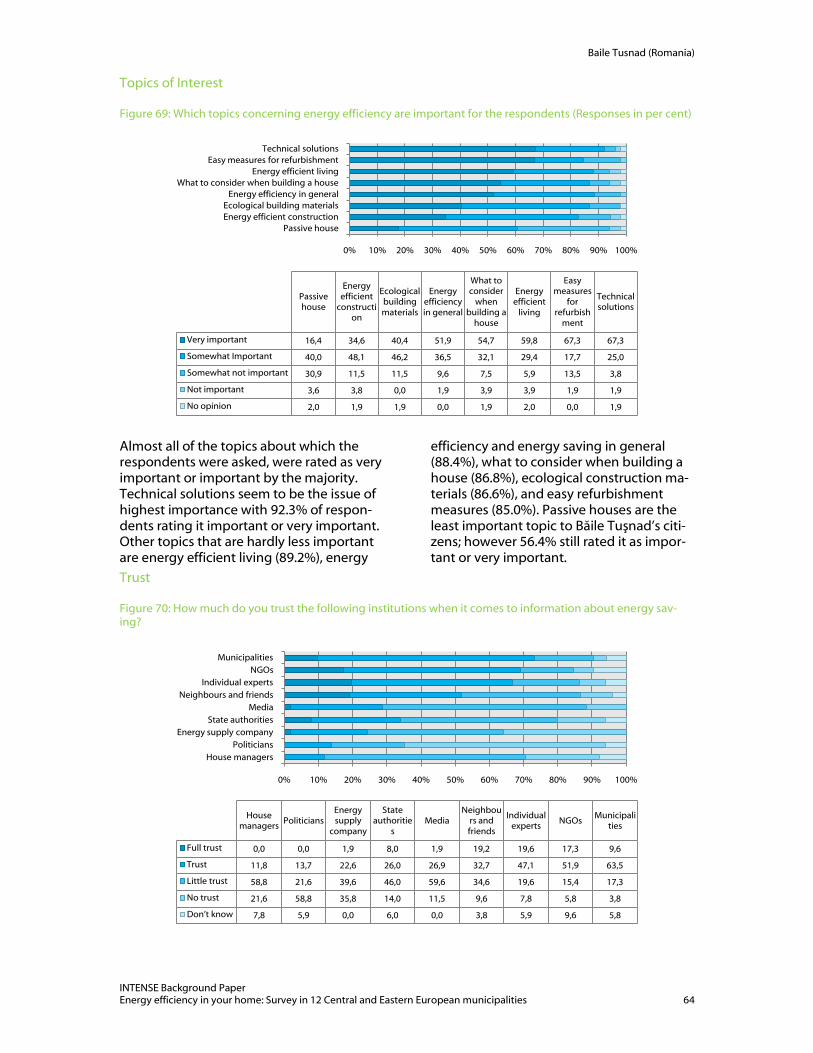
Baile Tusnad (Romania)
INTENSE Background Paper Energy efficiency in your home: Survey in 12 Central and Eastern European municipalities 64
Topics of Interest
Figure 69: Which topics concerning energy efficiency are important for the respondents (Responses in per cent)
Almost all of the topics about which the respondents were asked, were rated as very important or important by the majority. Technical solutions seem to be the issue of highest importance with 92.3% of respon-dents rating it important or very important. Other topics that are hardly less important are energy efficient living (89.2%), energy
efficiency and energy saving in general (88.4%), what to consider when building a house (86.8%), ecological construction ma-terials (86.6%), and easy refurbishment measures (85.0%). Passive houses are the least important topic to Băile Tuşnad’s citi-zens; however 56.4% still rated it as impor-tant or very important.
Trust
Figure 70: How much do you trust the following institutions when it comes to information about energy sav-ing?
0% 10% 20% 30% 40% 50% 60% 70% 80% 90% 100%
Passive houseEnergy efficient constructionEcological building materials
Energy efficiency in generalWhat to consider when building a house
Energy efficient livingEasy measures for refurbishment
Technical solutions
Passive house
Energy efficient
construction
Ecological building materials
Energy efficiency in general
What to consider
when building a
house
Energy efficient
living
Easy measures
for refurbish
ment
Technical solutions
Very important 16,4 34,6 40,4 51,9 54,7 59,8 67,3 67,3
Somewhat Important 40,0 48,1 46,2 36,5 32,1 29,4 17,7 25,0
Somewhat not important 30,9 11,5 11,5 9,6 7,5 5,9 13,5 3,8
Not important 3,6 3,8 0,0 1,9 3,9 3,9 1,9 1,9
No opinion 2,0 1,9 1,9 0,0 1,9 2,0 0,0 1,9
0% 10% 20% 30% 40% 50% 60% 70% 80% 90% 100%
House managers
Politicians
Energy supply company
State authorities
Media
Neighbours and friends
Individual experts
NGOs
Municipalities
House managers
PoliticiansEnergy supply
company
State authoritie
sMedia
Neighbours and friends
Individual experts
NGOsMunicipali
ties
Full trust 0,0 0,0 1,9 8,0 1,9 19,2 19,6 17,3 9,6
Trust 11,8 13,7 22,6 26,0 26,9 32,7 47,1 51,9 63,5
Little trust 58,8 21,6 39,6 46,0 59,6 34,6 19,6 15,4 17,3
No trust 21,6 58,8 35,8 14,0 11,5 9,6 7,8 5,8 3,8
Don’t know 7,8 5,9 0,0 6,0 0,0 3,8 5,9 9,6 5,8

Baile Tusnad (Romania)
INTENSE Background Paper Energy efficiency in your home: Survey in 12 Central and Eastern European municipalities 65
There are three groups that are rated as most trustworthy in Băile Tuşnad. The mu-nicipality enjoys high trust; 73.1% of the residents have trust or full trust in the mu-nicipalities. 69.2% say they trust NGOs, 66.7% trust experts. All other groups are considered as less trustworthy. Neighbors and friends enjoy more trust than mistrust (51.9% trust), in all other groups the mis-trust prevails. The lowest trust enjoy politi-cians and house managers.
Energy consultancy
The overwhelming majority of respondents is interested in obtaining professional ad-vice on energy efficiency and energy sav-ing. 49 out of the 55 respondents said that they would very like or for sure welcome such advice. A majority of them would also consider paying for professional advice (59.6%).
Would you be willing to pay for professional advice on increasing the energy efficiency in your home?
Would like to get professional advice for your home on efficiency meas-ures?
Yes, sure
Yes likely
Probably not
Not at all
Yes, for sure 5 4 2 3
Yes, likely 1 21 8 8
Personal situation
Asked about their current concerns and anxieties, most people are anxious about the rise of energy prices and the costs of living in Romania. In both cases, 88.7% of the respondents are very or somewhat anx-ious. The state of the environment in gen-
eral is an issue that troubles the respon-dents (83.0% are very or somewhat anx-ious) as well. The local environment and the political leadership follow in the list (79.2%). The current economic development is a reason for anxiety for 66.0% of the respon-dents.
Compared to other municipalities of the survey, fewer respondents are affected by the crisis in Băile Tuşnad (51.9%). Conse-quently, also fewer citizens have to adjust to the economic circumstances. The most often chosen measure is to make less risky investments. 58.5% agree somewhat or fully. Another 57.7% have cancelled or de-layed major vacation plans. Still more than half of the respondents (51.9%) confirm to have spent a bit less lately, 39.6% say they have spent a lot less. With regard to the citizen’s home, an impact will be that the respondents tend to delay or cancel reno-vation projects around the house (47.2%) or do a renovation themselves instead of hir-ing professionals (39.6%).
Citizens of Băile Tuşnad are eager when it comes to energy saving. 61.1% consider themselves very or somewhat eager. No-body selected ―not eager at all‖. The aver-age ―eagerness‖ on a scale from 1…4 is 2.15 (1=very eager, 4=not eager at all).
Saving money is the absolute main motiva-tion to save energy. All respondents agreed at least somewhat to this statement, 90.4% agreed fully. Being more ecologic and feel-ing better is a very important motive as well; 86.5% agree somewhat or fully with both statements. 88% would start saving energy if they would receive additional financial incentives.

Baile Tusnad (Romania)
INTENSE Background Paper Energy efficiency in your home: Survey in 12 Central and Eastern European municipalities 66
Demographic data
The questions were answered by 35 women and 20 men. 53.7% have an aca-demic degree, 29.6% finished their educa-tion after secondary school.
Age In %
Younger than 18 0
18-24 27,3
25-34 21,8
35-44 29,1
45-54 14,5
55-64 5,5
65 and older 1,8

Koprivnica (Croatia)
INTENSE Background Paper Energy efficiency in your home: Survey in 12 Central and Eastern European municipalities 67
Koprivnica (Croatia)
General information
Koprivnica is a city in northern Croatia, administrative capital of the Koprivnica-Križevci County, and a town with a population of 31,554 people. It is situated on the slopes of Bilogora and Kalnik mountains from the south, and river Drava from the north. Its position enabled it to develop numerous functions for the wider area such as trade, crafts and administration.
Koprivnica was named after the brook with the same name, which was first mentioned at the beginning of the 13th century during the Hungarian Kingdom, and the town got the status of a free royal town in 1356.
Koprivnica developed significantly in the 20th century with the advent of the Podravka food industry, known worldwide for its Vegeta spice, and there is even a museum of Podravka. Economy is based on farming, livestock breeding, food (Podravka), pharmaceutical (Belupo), textile, wood and timber, paper, leather, metal-processing and building material (brickwork) industries. The development of tourism in the region is facilitated by rich cultural heritage and powerful economic
potential. Sports activities include handball, football, carting and horseback riding. The town offers various recreational opportunities, especially on the nearby Drava river and at the so-called Podravina Riviera.
Worth mentioning is the annual "motifs of Podravina" event when the whole town becomes a gallery of naïve art. Many of the world-famous Croatian naïve artists come from the villages along the Drava in this county, notably Ivan Generalić, Josip Gen-eralić, Mirko Virius and many others; and today the third naïve art generation work-ing in the Podravina region exceeds 50 artists.
Overview of housing conditions of the respondents
> Number of residents: 31.554 > Number of valid responses: 136 > Share of house/flat ownership: 84.5%
Structure of housing:
> 57.1% detached houses (one or more storeys, mostly one: 39.1% of all houses)
> 41.4% apartment houses (low and high rises)
> 1.6% town houses (neighbouring units on both sides but not above or below)
Approximately half of the households (52.8%) consist of three or four persons. Two person households are common as well (19.4%); five person households (10.1%) and single households (9.3%) are less frequent.

Koprivnica (Croatia)
INTENSE Background Paper Energy efficiency in your home: Survey in 12 Central and Eastern European municipalities 68
Figure 71: Conditioned living space (Distribution in per cent)
Similar as in many other cities, flats tend to be smaller than houses in terms of floor space. Most flats have 41-80 sqm and most houses 101-140 sqm.
Looking at the age of the building stock, Koprivnica has a high share of buildings being built between 1961 and 1990 – 60.5%. However, the activities have been ongoing continuously since then. 9.3% were erected between 1991 and 1999, and even 21.0% since 2000. This development is similar for detached houses and for apart-ment houses.
Upgrading old houses (built before 1990)
The share of buildings which was at least partially upgraded is approximately 45%. However, it should be pointed out that approx. 36% of all respondents did not answer these questions so that the share of retrofitted buildings might actually be smaller or higher. Of those who did answer these questions, 44.8% said that they had new windows installed in their homes. 32.5% had their ceiling insulated, 25.0% their walls. While new windows were in-stalled equally in apartment houses and single detached houses, insulation meas-ures were mainly carried out in detached houses. In just 2 out of 31 flats, walls and the ceiling have been additionally insu-lated.
Only houses that were built before 1990 were considered:
Figure 72: Upgrading measures (Responses in per cent)
Using renewables
In a few cases alternative sources of energy have are used. In three cases a heat pump was installed, in 6 cases solar collectors are used.
16 respondents think they will further up-grade their house or use renewable re-sources in the next five years.
0 10 20 30 40
> 160 sqm
141-160 sqm
121-140 sqm
101-120 sqm
81-100 sqm
61-80 sqm
41-60 sqm
20-40 sqm
> 160 sqm
141-160 sqm
121-140 sqm
101-120 sqm
81-100 sqm
61-80 sqm
41-60 sqm
20-40 sqm
Flats 0,0 0,0 3,8 18,9 15,1 30,2 37,7 11,3
Houses 21,9 6,8 23,3 30,1 12,3 4,1 1,4 0,0
25,0
32,0
44,8
0 10 20 30 40 50 60 70
Wall insulation added
Insulation of ceiling added
New windows added

Koprivnica (Croatia)
INTENSE Background Paper Energy efficiency in your home: Survey in 12 Central and Eastern European municipalities 69
Financing measures
Two thirds of the inhabitants (66.9%) in-vested in their homes during the last three years. 72.5% of residents of detached houses undertook investments; in apart-ment houses the share is 49.0%. 55 respon-
dents invested own financial means, 41 of them financed the investments entirely by themselves. 16 respondents made use of bank loans. Regional or state support was not used at all.
Energy use: heating and electricity
Figure 73: Heating sources (Responses in per cent)
A central heating system is the most com-monly installed solution for heating in gen-eral and in detached houses. In apartment blocks and town houses it is installed in 34.5% of all flats. The most frequently used source of heat is gas. It is used in both de-tached houses and apartment blocks. Wood is the second most used source, but has a significantly smaller share with just 12.5%. Almost all of the houses equipped with a wood heating are detached houses (with one or two floors). There is no indica-tion from the data that any of these fuels have become more or less popular over time.
19.8% of all respondents make use of addi-tional portable heaters, the majority of them uses one heater, just two respondents use two.
Cooling
Electronic cooling systems are used by a third of the respondents. 15.5% of the re-spondents use exclusively electronic sys-tems for cooling; 17.5% combine the use of electronic cooling devices with manual
ventilation. Such systems are installed in detached houses and flats equally, regard-less of the age of the building.
Individual metres and cost control
In Koprivnica, half of the respondents have a heat metre. There is no correlation be-tween metres installed and building type or building age, i.e. there are also houses built after 2000 that do not have a heat metre.
Most of the citizens have direct control over their radiator settings. 77.4% of those that have radiators in their homes can regulate each of them separately;
16.7% have one control unit for all radiators in their apartment. 5.9% cannot control the settings of their radiators. All of these apartments are in high rise apartment blocks, built between 1961 and 1990 and connected to district heating.
The average household in Koprivnica pays 5.1% of its household income for electricity. Compared to other municipalities partici-pating in the survey, this figure is compara-tively low. 90.1% of respondents pay 10% or less.
Thermal comfort
Figure 74: Typical temperature at which people feel comfortable (Responses in per cent)
1,5
2,2
9,6
12,5
44,1
47,1
0 10 20 30 40 50 60 70
Heat pump
Electric heating
District heating
Wood heating
Gas heating
Central heating system
1,7
37,3
57,6
3,4
0 10 20 30 40 50 60 70
16-18°C
19-21°C
22-24°C
25-27°C
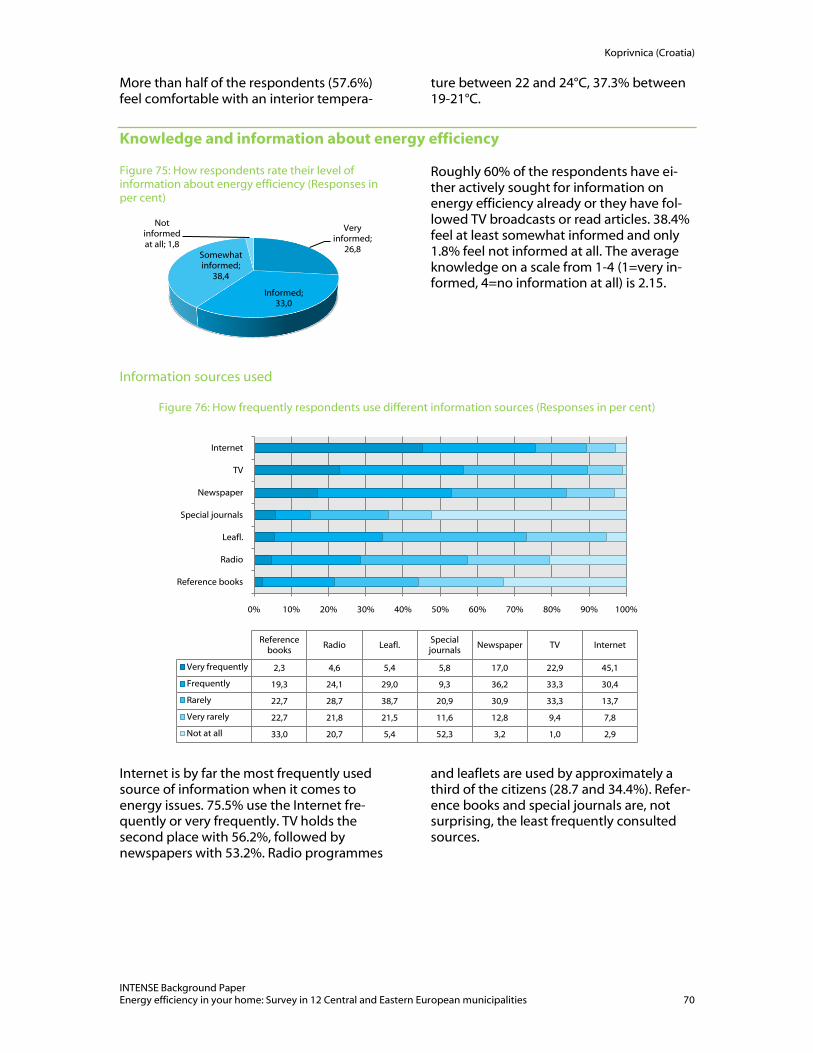
Koprivnica (Croatia)
INTENSE Background Paper Energy efficiency in your home: Survey in 12 Central and Eastern European municipalities 70
More than half of the respondents (57.6%) feel comfortable with an interior tempera-
ture between 22 and 24°C, 37.3% between 19-21°C.
Knowledge and information about energy efficiency
Figure 75: How respondents rate their level of information about energy efficiency (Responses in per cent)
Roughly 60% of the respondents have ei-ther actively sought for information on energy efficiency already or they have fol-lowed TV broadcasts or read articles. 38.4% feel at least somewhat informed and only 1.8% feel not informed at all. The average knowledge on a scale from 1-4 (1=very in-formed, 4=no information at all) is 2.15.
Information sources used
Figure 76: How frequently respondents use different information sources (Responses in per cent)
Internet is by far the most frequently used source of information when it comes to energy issues. 75.5% use the Internet fre-quently or very frequently. TV holds the second place with 56.2%, followed by newspapers with 53.2%. Radio programmes
and leaflets are used by approximately a third of the citizens (28.7 and 34.4%). Refer-ence books and special journals are, not surprising, the least frequently consulted sources.
Very informed;
26,8
Informed; 33,0
Somewhat informed;
38,4
Not informed at all; 1,8
0% 10% 20% 30% 40% 50% 60% 70% 80% 90% 100%
Reference books
Radio
Leafl.
Special journals
Newspaper
TV
Internet
Reference books
Radio Leafl.Special journals
Newspaper TV Internet
Very frequently 2,3 4,6 5,4 5,8 17,0 22,9 45,1
Frequently 19,3 24,1 29,0 9,3 36,2 33,3 30,4
Rarely 22,7 28,7 38,7 20,9 30,9 33,3 13,7
Very rarely 22,7 21,8 21,5 11,6 12,8 9,4 7,8
Not at all 33,0 20,7 5,4 52,3 3,2 1,0 2,9

Koprivnica (Croatia)
INTENSE Background Paper Energy efficiency in your home: Survey in 12 Central and Eastern European municipalities 71
Topics of Interest
Figure 77: Which topics concerning energy efficiency are important for the respondents (Responses in per cent)
All of the topics are rated as highly impor-tant. In all cases, not less than 75% of all respondents find the topic in question im-portant or very important. There is practi-cally no topic which is considered unimpor-
tant. The most important topics are energy efficient living (96.9% important or very important), energy efficiency and energy saving in general (95.0%), and easy meas-ures for refurbishment (94.8%).
Trust
Figure 78: How much do you trust the following institutions when it comes to information about energy sav-ing?
0% 10% 20% 30% 40% 50% 60% 70% 80% 90% 100%
Energy efficient constructionEasy measures for refurbishment
Technical solutionsEcological building material
Passive houseWhat to consider when building a house
Energy efficient livingEnergy efficiency in general
Energy efficient
construction
Easy measures
for refurbish
ment
Technical solutions
Ecological building material
Passive house
What to consider
when building a
house
Energy efficient
living
Energy efficiency in general
Very important 49,5 53,1 54,3 54,8 54,9 65,2 66,3 68,3
Somewhat important 38,7 41,7 36,2 34,4 24,2 21,7 30,6 26,7
Somewhat not important 9,7 3,1 7,4 5,4 9,9 5,4 1,0 1,0
Not important 1,1 2,1 2,1 1,1 2,2 4,3 1,0 1,0
No opinion 1,1 0,0 0,0 4,3 8,8 3,3 1,0 3,0
0% 10% 20% 30% 40% 50% 60% 70% 80% 90% 100%
House managers
Politicians
Media
State authorities
Energy supply companies
Neighbours and friends
Municipalities
NGOs
Individual experts
House managers
Politicians MediaState
authorities
Energy supply
companies
Neighbours and friends
Municipalities
NGOsIndividual
experts
Full trust 0,0 0,0 1,1 1,1 3,1 3,3 7,9 13,5 13,9
Trust 21,5 6,4 47,9 26,6 36,5 43,5 39,3 58,3 69,3
Little trust 45,6 19,1 42,6 46,8 41,7 44,6 42,7 24,0 14,9
No trust 24,1 72,3 7,4 23,4 16,7 6,5 9,0 2,1 1,0
Don’t know 8,9 2,1 1,1 2,1 2,1 2,2 1,1 2,1 1,0
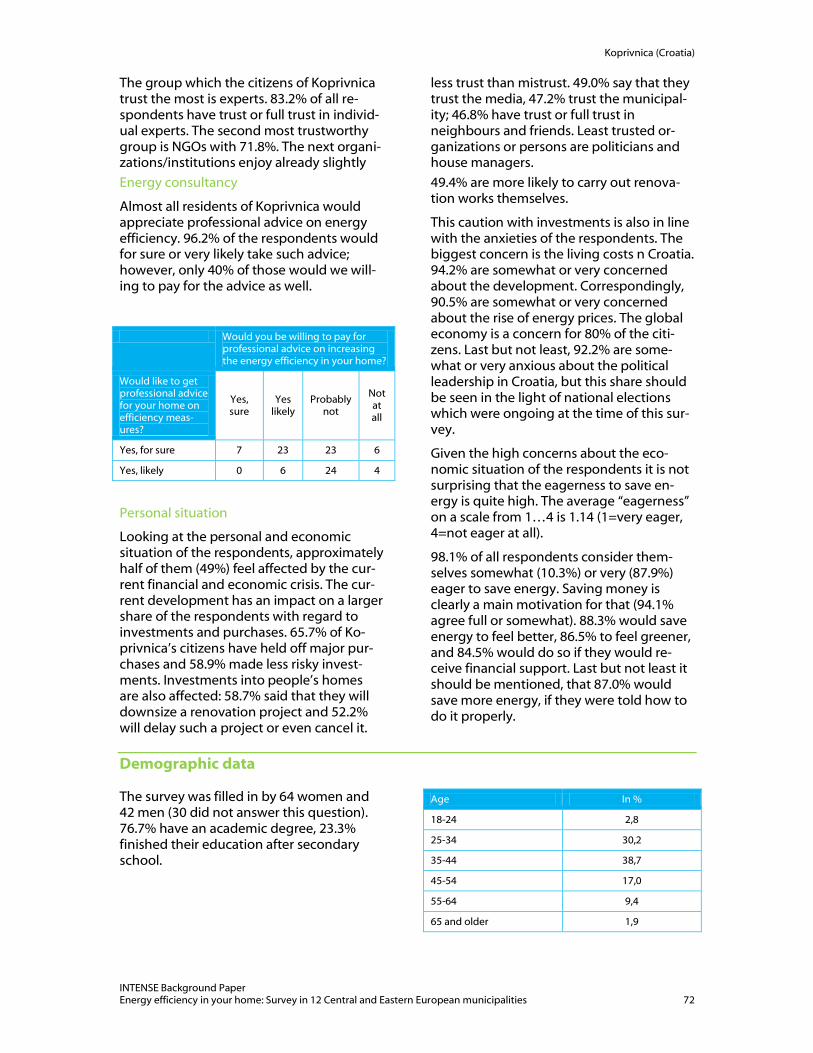
Koprivnica (Croatia)
INTENSE Background Paper Energy efficiency in your home: Survey in 12 Central and Eastern European municipalities 72
The group which the citizens of Koprivnica trust the most is experts. 83.2% of all re-spondents have trust or full trust in individ-ual experts. The second most trustworthy group is NGOs with 71.8%. The next organi-zations/institutions enjoy already slightly
less trust than mistrust. 49.0% say that they trust the media, 47.2% trust the municipal-ity; 46.8% have trust or full trust in neighbours and friends. Least trusted or-ganizations or persons are politicians and house managers.
Energy consultancy
Almost all residents of Koprivnica would appreciate professional advice on energy efficiency. 96.2% of the respondents would for sure or very likely take such advice; however, only 40% of those would we will-ing to pay for the advice as well.
Would you be willing to pay for professional advice on increasing the energy efficiency in your home?
Would like to get professional advice for your home on efficiency meas-ures?
Yes, sure
Yes likely
Probably not
Not at all
Yes, for sure 7 23 23 6
Yes, likely 0 6 24 4
Personal situation
Looking at the personal and economic situation of the respondents, approximately half of them (49%) feel affected by the cur-rent financial and economic crisis. The cur-rent development has an impact on a larger share of the respondents with regard to investments and purchases. 65.7% of Ko-privnica’s citizens have held off major pur-chases and 58.9% made less risky invest-ments. Investments into people’s homes are also affected: 58.7% said that they will downsize a renovation project and 52.2% will delay such a project or even cancel it.
49.4% are more likely to carry out renova-tion works themselves.
This caution with investments is also in line with the anxieties of the respondents. The biggest concern is the living costs n Croatia. 94.2% are somewhat or very concerned about the development. Correspondingly, 90.5% are somewhat or very concerned about the rise of energy prices. The global economy is a concern for 80% of the citi-zens. Last but not least, 92.2% are some-what or very anxious about the political leadership in Croatia, but this share should be seen in the light of national elections which were ongoing at the time of this sur-vey.
Given the high concerns about the eco-nomic situation of the respondents it is not surprising that the eagerness to save en-ergy is quite high. The average ―eagerness‖ on a scale from 1…4 is 1.14 (1=very eager, 4=not eager at all).
98.1% of all respondents consider them-selves somewhat (10.3%) or very (87.9%) eager to save energy. Saving money is clearly a main motivation for that (94.1% agree full or somewhat). 88.3% would save energy to feel better, 86.5% to feel greener, and 84.5% would do so if they would re-ceive financial support. Last but not least it should be mentioned, that 87.0% would save more energy, if they were told how to do it properly.
Demographic data
The survey was filled in by 64 women and 42 men (30 did not answer this question). 76.7% have an academic degree, 23.3% finished their education after secondary school.
Age In %
18-24 2,8
25-34 30,2
35-44 38,7
45-54 17,0
55-64 9,4
65 and older 1,9

Samobor (Croatia)
INTENSE Background Paper Energy efficiency in your home: Survey in 12 Central and Eastern European municipalities 73
Samobor (Croatia)
General information:
Samobor is a picturesque medieval town with a long history, well preserved old core and long tourist tradition. It is located 36 km northwest from the Croatian capital of Zagreb, and very close to the border with Slovenia. The population is 34,931 or 10,356 households, whereof 41.33 % are farm households. During its history main activity was craft and today it is entrepreneurial city with focus on crafts, small and medium enterprises.
Since Samobor sits in the middle of the Samoborsko Gorje, a mountainous region that offers a wealth of hikes through rolling hills, lush pastures and dense forests, it is a very much favoured excursion site, both for the locals and for the visitors from wider Zagreb City area. Furthermore, Samobor is very well known by its annual late winter carnival ("Fašnik") which became a town trademark and symbol of its identity. The town is also reputed to be the place where the best "kremšnite" - one of Croatia's best known cakes - are made.
The economy of Samobor city survived despite a very difficult 10 years of war, loss
of markets, inadequate privatization, bank-ruptcies and reorganization of local gov-ernment.
At that time, large factories which were main carriers of development and em-ployment were shut down and the result was high unemployment but by develop-ment of entrepreneurship part this problem was partially solved. Economic entities use geographical position and seek new mar-kets to export their goods, but also having the capital city in the neighbourhood al-lows the development of service industry.
Overview of housing conditions of the respondents
> Number of residents: 34,931 > Number of valid responses: 100 > Share of house/flat ownership: 96.6%
Structure of housing:
> 64.0% detached houses > 27.0% apartment houses (low and high
rises) > 9.0% town houses (neighbouring units
on both sides but not above or below)
Slightly more than half of the households (53.1%) consist of three or four persons. Two person households are common as well (19.4%). Households of 5 persons ac-count for 12.2%, with 6 persons 8.2%.
Single households (5.1%) are rare.
Figure 79: Conditioned living space (Distribution in per cent)
0,0 10,0 20,0 30,0 40,0
> 160 sqm
141-160 sqm
121-140 sqm
101-120 sqm
81-100 sqm
61-80 sqm
41-60 sqm
20-40 sqm
> 160 sqm
141-160 sqm
121-140 sqm
101-120 sqm
81-100 sqm
61-80 sqm
41-60 sqm
20-40 sqm
Flats 8,6 2,9 0,0 8,6 8,6 37,1 22,6 11,4
Houses 31,1 16,4 9,8 11,5 18,0 6,6 1,6 0,0

Samobor (Croatia)
INTENSE Background Paper Energy efficiency in your home: Survey in 12 Central and Eastern European municipalities 74
The size of houses in Samobor is a bit more evenly distributed, with a peak at 81-100 sqm and 141-160 sqm. Flats and town houses in Samobor have a wide range of sizes as well. Although most of them are below 80 sqm, there is also a significant share of flats with more than 80 sqm (28.7%).
The majority of the buildings stock (56.7%) was built between 1961 and 1990. 12.4% of
buildings are older than that. After a phase of low construction activities in the 1990s, more buildings were again erected in the 2000s. Since 2005, 16.5% of the buildings were built. The new buildings built after 2000 are not only single detached houses, also a significant share of apartment houses were built. 38.5% of all apartment buildings were built after 2000. In comparison, only 17.9% of the detached houses were built after 2000.
Upgrading old houses (built before 1990)
The most frequently carried out measure to upgrade houses has been the installation of new windows. 53% of house or flat owners have recently installed new windows. Walls and roofs were insulated by roughly a third of the respondents. 31.3% added wall insu-lation and 32.3% added additional ceiling insulation to their homes.
Only houses that were built before 1990 were considered:
Figure 80: Upgrading measures (Responses in per cent)
Using renewables
Alternative sources of energy are rarely used in Samobor so far. 9 respondents (9.4%) have added solar collectors to their homes, and one has recently installed a heat pump.
13 respondents think they will further up-grade their house or use renewable re-sources in the next five years.
Financing measures
A very big share of the inhabitants (80.6%) invested in their homes during the last three years. The majority of them (68%) invested own financial means. 45.3% of all citizens investing financed the measure completely by themselves. Other sources
used were mainly bank loans. 25.3% of the citizens investing have used bank loans, 3 citizens used bank loans specifically fore-seen for improving the energy efficiency of the building. Regional or state support was not used.
31,3
32,3
53,0
0 10 20 30 40 50 60 70
Wall insulation added
Insulation of ceiling added
New windows installed

Samobor (Croatia)
INTENSE Background Paper Energy efficiency in your home: Survey in 12 Central and Eastern European municipalities 75
Energy use: heating and electricity
Figure 81: Heating sources (Responses in per cent)
The most common source for heating is gas. It is used by 55.0% of the respondents. Heat supply through central heating sys-tems is quite common as well, 25% of re-spondents are connected to such a system. Wood is used in 20% of the homes; all of them are either detached houses or town houses. Oil and electric heating are also predominantly used in detached houses, usually in houses built between 1961 and 1990.
23.6% of all respondents make use of addi-tional portable heaters. The majority of them use one heater, few respondents use two or more.
Cooling
Electronic cooling systems are rather wide-spread in Samobor compared to other mu-nicipalities taking part in the survey. 55.7% of all respondents have electronic cooling systems installed, but only 22.8% use it exclusively. The other 32.9% use it together with ventilation through the windows.
Individual metres and cost control
In Samobor, less than half of the respon-dents (41.9%) have one or more individual heat metres installed in their flats. The lack of heat metres is not typical for any type of house or age of building, it can be observed among all building types and ages.
Regarding the control of radiators, most citizens can regulate the settings of their radiators. Just a small minority of 8.8% of those with radiators installed have no pos-sibility at all to change the settings. All of those flats or houses were built between 1961 and 1990. 76.3% have full control over all radiators; the remaining 15% have one control unit for all radiators.
Looking at electricity costs, the average household in Samobor pays 5.6% of the household income for the electricity bill. 92.4% of all respondents pay 10% or less.
Thermal comfort
Figure 82: Typical temperature at which people feel comfortable (Responses in per cent)
Most residents (65.6%) feel comfortable between 22 and 24°C, a quarter between 19 and 21°C.
1,0
6,0
9,0
10,0
20,0
25,0
55,0
0 10 20 30 40 50 60 70
Heat pump
District heating
Electric heating
Oil heating
Wood heating
Central heating system
Gas heating
5,6
25,6
65,6
3,3
0 10 20 30 40 50 60 70
16-18°C
19-21°C
22-24°C
25-27°C

Samobor (Croatia)
INTENSE Background Paper Energy efficiency in your home: Survey in 12 Central and Eastern European municipalities 76
Knowledge and information about energy efficiency
Figure 83: How respondents rate their level of informa-tion about energy efficiency (Responses in per cent)
Slightly more than half of Samobor’s citi-zens (54.0%) have either actively sought for information on energy efficiency already or they have followed TV broadcasts or read articles. Additional 41.4% consider them-selves somewhat informed and only 4.6% think that they are not informed at all. The average knowledge on a scale from 1-4 (1=very informed, 4=no information at all) is 2.31.
Information sources used
Figure 84: How frequently respondents use different information sources (Responses in per cent)
In Samobor the Internet is the most fre-quently used source of information about energy issues. 72.8% consult online sources frequently or very frequently. Newspaper and TV are media which are used by roughly half of the respondents at least
frequently. Those media which are used least are special journals and reference books, but they are consulted still by a sig-nificant share of the citizens at least fre-quently: 21.6% for special journals, 29.2% for reference books.
Very informed;
19,5
Informed; 34,5
Somewhat informed;
41,4
Not informed at all; 4,6
0% 10% 20% 30% 40% 50% 60% 70% 80% 90% 100%
Leaflets
Special journals
Reference books
Radio
TV
Newspapers
Internet
LeafletsSpecial journals
Reference books
Radio TV Newspapers Internet
Very frequently 2,9 6,2 7,7 11,6 15,0 20,0 41,6
Frequently 27,5 15,4 21,5 20,3 33,8 29,3 31,2
Rarely 34,8 20,0 23,1 36,2 36,3 32,0 11,7
Very rarely 18,8 18,5 16,9 17,4 11,3 12,0 9,1
Not at all 15,9 40,0 30,8 14,5 3,8 6,7 6,5

Samobor (Croatia)
INTENSE Background Paper Energy efficiency in your home: Survey in 12 Central and Eastern European municipalities 77
Topics of Interest
Figure 85: Which topics concerning energy efficiency are important for the respondents (Responses in per cent
In Samobor the rating of interesting topics is among the highest of the entire survey. All issues have been rated by at least 80% of the respondents as important or very important. Energy efficiency and energy saving in general is the topic of the highest
interest with 96.4%, passive houses is the topic of ―lowest‖ interest which 80.0% of the respondents find important or some-what important. Interestingly, there are very few respondents that do not have an opinion at all.
Trust
Figure 86: How much do you trust the following institutions when it comes to information about energy saving?
0% 10% 20% 30% 40% 50% 60% 70% 80% 90% 100%
Energy efficient constructionPassive house
Ecological building materialsWhat to consider when building a house
Technical solutionsWasy meansures for refurbishment
Energy efficient livingEnergy efficiency in general
Energy efficient
construction
Passive house
Ecological building materials
What to consider
when building a
house
Technical solutions
Wasy meansures
for refurbishme
nt
Energy efficient
living
Energy efficiency in
general
Very important 46,8 54,7 57,0 61,0 62,2 65,4 68,8 75,0
Somewhat important 36,4 25,3 31,6 23,4 25,6 28,2 23,8 21,4
Somewhat not important 13,0 14,7 8,9 10,4 7,3 2,6 6,3 3,6
Not important 2,6 1,3 1,3 3,9 2,4 2,6 0,0 0,0
No opinion 1,3 4,0 1,3 1,3 2,4 1,3 1,3 0,0
0% 10% 20% 30% 40% 50% 60% 70% 80% 90% 100%
Politicians
Media
House managers
Energy supply companies
Municipality
Neighbours and friends
State authorities
NGOs
Individual experts
Politicians MediaHouse
managers
Energy supply
companiesMunicipality
Neighbours and friends
State authorities
NGOsIndividual
experts
Full trust 0,0 1,3 1,7 2,5 3,9 5,1 5,3 9,1 20,7
Trust 1,3 42,5 16,7 26,6 23,7 50,0 19,7 51,9 59,8
Little trust 25,3 46,3 38,3 40,5 46,1 38,5 51,3 24,7 13,4
No trust 69,3 5,0 33,3 29,1 23,7 2,6 21,1 9,1 2,4
Don’t know 4,0 5,0 10,0 1,3 2,6 3,8 2,6 5,2 3,7

Samobor (Croatia)
INTENSE Background Paper Energy efficiency in your home: Survey in 12 Central and Eastern European municipalities 78
There are three groups which enjoy signifi-cantly more trust than others in Samobor. Experts are the most trustworthy group; 80.5% have trust or full trust in the. The next groups are NGOs (61.0%) and neighbours/friends (55.6%). The citizens of Samobor have the least trust in politicians. Only 1.3% have trust in them, the rest has little or no trust at all.
Energy consultancy
The overwhelming majority of the respon-dents in Samobor would appreciate profes-sional advice on energy efficiency (95.2% said for sure or very likely), but less than half would potentially also pay for that.
Would you be willing to pay for professional advice on increasing the energy efficiency in your home?
Would like to get professional advice for your home on efficiency meas-ures?
Yes, sure
Yes likely
Probably not
Not at all
Yes, for sure 6 25 16 5
Yes, likely 2 1 12 5
Personal situation
Similar to other cities, a significant share of the inhabitants of Samobor state (53.7%) that they are affected by the current finan-cial and economic crisis. The survey shows some changes in behaviour caused by the
crisis. 68.6% say that they have been spend-ing less, 69.6% have held off major pur-chases, and 62.1% are downsizing a renova-tion project.
The effects of the crisis are also reflected by the citizens’ concerns and anxieties. 91.5% are somewhat or very nervous about the costs of living in Croatia, and 88.1% are nervous about rising energy costs. The cur-rent economic development is a concern for 80.5% of the respondents. Besides these economic aspects, also the state of the en-vironment is making people anxious. 93.9% are somewhat or very anxious about the state of the environment in general, 71.3% about the state of the environment in Samobor.
Given the high concerns about the eco-nomic and environmental situation of the respondents it is not surprising that the eagerness to save energy is among the highest of the entire survey. The average ―eagerness‖ on a scale from 1…4 is 1.12 (1=very eager, 4=not eager at all).
All respondents consider themselves somewhat (12.0%) or very (88.0%) eager to save energy. Main motivations for saving energy are saving money (96.0% agree fully or somewhat), to feel better (92.0%), and to be more ecologic (88.9%). 94.4% of the respondents would be willing to save more energy if they would receive financial sup-port, and 83.6% would do it if somebody would explain them how to do it properly.
Demographic data
The survey was filled in by 39 women and 43 men (18 did not answer this question). 54.9% have an academic degree, 45.1% finished their education after secondary school.
Age In %
Younger than 18 0
18-24 8,4
25-34 21,7
35-44 31,3
45-54 30,1
55-64 6,0
65 and older 2,4

Sapareva Banya (Bulgaria)
INTENSE Background Paper Energy efficiency in your home: Survey in 12 Central and Eastern European municipalities 79
Sapareva Banya (Bulgaria)
General information
Sapareva Banya is a small municipality, located in South-Western Bulgaria, 75 km away from the capital Sofia. It covers 180.8 sqkm, comprising one town and four vil-lages with a population of about 8,300 in-habitants. Sapareva Banya proudly shares one third of its territory with Rila National Park, which was established in 1992. First evidence for permanent villages dated from the Neolithic age (6000-4000 B.C.) around warm mineral springs existing on the territory. While Sapareva Banya is mostly known for its cool and clean moun-tain water, it is also famous for its unique natural phenomenon — the hottest min-eral water in Europe (103°C) and the only active geyser in the Balkans.
The favourable location, natural resources and protected areas are preconditions for tourism development. Local people are mainly involved in the tourism, agriculture and services. There are about 200 active commercial and industrial enterprises in the sectors of textile, wood processing, and food and drink industries.
Sapareva Banya municipality ensures stable conditions for economic development and good social and cultural conditions for the inhabitants. The budget for 2010 is
5 211 526 BGN (about 2.6 million EUR), in-cluding financial resources for the sport clubs, folklore ensembles and cultural cen-tres. The priorities stated in the Municipal Development Plan 2007-2013 are: tourism development; establishment of favorable conditions for investments and economical development; improvement and construc-tion of technical and social infrastructure; increasing of the professional qualification of the population. The activities of local administration are directed to more effi-cient involvement of the local potential for achieving the strategic goals for improving quality of life, preservation and effective use of the natural resources and cultural heritage, and social and technical infra-structure development.
Overview of housing conditions of the respondents
> Number of residents: 8,300 > Number of valid responses: 130 > Share of house/flat ownership: 100%
Structure of housing:
All respondents of Savapareva Banya live in single detached houses.
> 10.0% in detached houses with one storey
> 72.3% in detached houses with two storeys
> 17.7% in detached houses with three or more storeys
In most cases, four (26.2%) or three persons (24.6%) live in the households. 18.5% of all households have five members, 13.1% six. Households consisting of two people are rare.

Sapareva Banya (Bulgaria)
INTENSE Background Paper Energy efficiency in your home: Survey in 12 Central and Eastern European municipalities 80
Figure 87: Conditioned living space (Distribution in per cent)
Houses in Sapareva Banya tend to be quite large. The average size of houses is around 100 to 140 sqm. There are few small houses with less then 60 sqm. In the smallest cate-gory of 20-40 sqm there are only two-person households living in the houses. However, in the category 41-60 sqm there are house-holds with four or more members.
The housing stock in Sapareva Banya is relatively new. There is only one building dating back to earlier than 1945. The major-
ity of buildings were built between 1961 and 1990 (62.3%). Slightly more than a fifth of buildings were (21.5%) after 1990.
Upgrading old houses (built before 1990)
Despite the fact that the building stock is comparatively young at least a quarter of buildings have undergone some upgrading measures. In 25.3% of buildings wall insula-tion was added, 23.2% have upgraded insu-lation in the ceiling. Installing new windows is the most popular upgrading measures with 47.9% of houses.
Only houses that were built before 1990 were considered:
Figure 88: Upgrading measures (Responses in per cent)
Using renewables
As the most southern municipality in the survey, it is understandable that especially solar energy is used. 46 of 127 houses (36.2%) have installed solar energy collec-tors on their roofs. Being in a geothermal active region, also heat pumps are an effi-cient source of heat energy. 23 of 129 re-
spondents said that they have a heat pump installed in their house (17.8%).
Additional 6 respondents plan to undertake renovation measures or the use of renewable sources of energy in the coming two years.
Financing measures
More than two thirds of the inhabitants interviewed have invested into their homes during the last 3 years (70.3%). Of 90 in-habitants that have invested, 77 contrib-uted with own financial resources, 48 fi-nanced the measures fully by themselves
(53% of all that have invested). 34 respon-dents (37.8%) used bank loans, five of them loans that are specifically foreseen for en-ergy efficient refurbishment. Local or state support programmes do not play any role.
0 10 20 30
> 160 sqm
141-160 sqm
121-140 sqm
101-120 sqm
81-100 sqm
61-80 sqm
41-60 sqm
20-40 sqm
> 160 sqm
141-160 sqm
121-140 sqm
101-120 sqm
81-100 sqm
61-80 sqm
41-60 sqm
20-40 sqm
Houses 26,3 10,9 17,8 13,2 12,4 10,9 6,2 2,3
23,3
25,3
47,9
0 20 40 60
Insulation of ceiling added
Wall insulation added
New windows installed

Sapareva Banya (Bulgaria)
INTENSE Background Paper Energy efficiency in your home: Survey in 12 Central and Eastern European municipalities 81
Energy use: heating and electricity
Figure 89: Heating sources (Responses in per cent)
Wood is the dominating heating source in Sapareva Banya, 79.2% of citizens use ei-ther wood or wood pellets for heating. Wood and wood pellets are used in houses of all ages, except for the most recently built after 2005. In all of these 7 houses, only electricity is used for heating. This is surprising, as the municipality is situated at an altitude of 983 m, were longer cold peri-ods can expected which would justify equipping the house with a heating system not-based on electricity.
Given that a comparatively large share is using electricity for heating, the share of citizens using additional portable electric heaters is also very high – 41.9%. Most of these households have one or two heaters.
Cooling
Being the southernmost municipality of the survey, it is not surprising that a significant share of the respondents use electronic cooling systems. 32.6% of respondents have such systems installed in their homes. In 92.3% of houses built after 2,000 elec-tronic cooling is used, but only in 23.2% built until 1990.
Individual metres and cost control
Roughly a fifth (20.9%) of all respondents has a heat metre installed in their homes.
As all houses are single detached houses and many of them are heated with wood, the majority of them will have a heating system just for this one house. It is less common to have heating metres in such cases, as in multi apartment blocks which are connected to a district heating system. Also, those that heat with electricity can measure their consumption through the electricity metre.
As most houses have individual heat sup-ply, most of the respondents can regulate the settings of their radiators. Only 10.5% of those with radiators cannot adjust the set-tings, all others have an influence.
On average, the respondents pay 9.1% of their household incomes for electricity. 64.6% of respondents pay 10% or less of their household incomes. The use of elec-tricity as a heating source has of course an influence on the electricity consumption.
Thermal comfort
Figure 90: Typical temperature at which people feel comfortable (Responses in per cent)
The temperature where most people (43.1%) feel comfortable is between 22-24°C. A quarter is more comfortable above, another quarter below this range.
0,8
0,8
3,1
3,8
5,4
13,1
73,8
0 20 40 60 80 100
Heat pump
District heating
Gas heating
Central heating system
Wood pellet heating
Electric heating
Wood heating
0,8
4,6
23,1
43,1
25,4
3,1
0 20 40 60
13-15°C
16-18°C
19-21°C
22-24°C
25-27°C
Above 27°C

Sapareva Banya (Bulgaria)
INTENSE Background Paper Energy efficiency in your home: Survey in 12 Central and Eastern European municipalities 82
Knowledge and information about energy efficiency
Figure 91: How respondents rate their level of information about energy efficiency (Reponses in per cent)
Just a minority of 25.6% say that they feel informed or very informed. The majority seems relatively inactive to gain knowledge on energy issues in general. Consequently, the average knowledge on a scale from 1-4 (1=very informed, 4=no information at all) is just 2.71.
Information sources used
Figure 92: How frequently respondents use different information sources (Responses in per cent)
Most respondents of Sapareva Banya use the internet as an information source. 61.5% of all respondents use it at least fre-quently. Television is the second-most used
source with 59.1% of respondents using it frequently or very frequently. The least popular sources are special journals, leaflets and reference books.
Very informed;
8,5
Informed; 27,1
Somehwat informed;
48,8
Not informed at all; 15,5
0% 10% 20% 30% 40% 50% 60% 70% 80% 90% 100%
Leaflets
Reference books
Special journals
Newspapers
Radio
TV
Internet
LeafletsReference
booksSpecial journals
Newspapers Radio TV Internet
Very frequently 5,4 5,5 7,4 13,3 16,8 19,1 30
Frequently 10,8 5,5 12 23 19,5 40 31,5
Rarely 21,6 18,2 28,7 31,9 31 28,7 18,5
Very rarely 36 30,9 18,5 17,7 22,1 10,4 5,9
Not at all 26,1 40 33,3 14,2 10,6 1,7 8,4

Sapareva Banya (Bulgaria)
INTENSE Background Paper Energy efficiency in your home: Survey in 12 Central and Eastern European municipalities 83
Topics of Interest
The citizens of Sapareva Banya attribute high importance to all of the topics in ques-tion. Except for passive houses, where 45.0% of respondents think it is very impor-
tant, in all other topics more than half of the respondents think these issues are very important.
Figure 93: Which topics concerning energy efficiency are important for the respondents (Responses in per cent)
Trust
Figure 94: How much do you trust the following institutions when it comes to information about energy sav-ing?
0% 10% 20% 30% 40% 50% 60% 70% 80% 90% 100%
Passive house
Ecological building materials
What to consider when building a house
Energy efficienct living
Energy efficiency in general
Energy efficienct construction
Technical solutions
Easy measures for refurbishment
Passive house
Ecological building materials
What to consider
when building a
house
Energy efficienct
living
Energy efficiency in general
Energy efficienct constructi
on
Technical solutions
Easy measures
for refurbish
ment
Very important 45 52,9 53,4 57,4 59,7 60,8 61,2 67,7
Somewhat important 18 16,8 20,7 22,1 26,9 22,5 28,1 25,8
Somewhat not important 15,3 16,8 13,8 15,6 7,6 13,3 9,1 4,8
Not important 8,1 5 1,7 2,5 1,7 0,8 0,8 0,8
No opinion 13,5 8,4 10,3 2,5 4,2 2,5 0,8 0,8
0% 10% 20% 30% 40% 50% 60% 70% 80% 90% 100%
Politicians
State authorities
NGOs
Media
House managers
Energy supply company
Neighbours and friends
Municipality
Individual experts
PoliticiansState
authorities
NGOs MediaHouse
managers
Energy supply
company
Neighbours and friends
Municipality
Individual experts
Full trust 8,2 9,1 15,1 15,7 3,6 12,4 16,9 18,7 21,2
Trust 2,5 13,2 13,4 21,5 22,5 24,8 28 29,3 36,3
Little trust 23,8 22,3 35,3 38,8 27,9 28,9 29,7 26,8 23,9
No trust 49,2 42,1 29,4 13,2 22,5 20,7 16,9 20,3 12,4
Don't know 16,4 13,2 6,7 10,7 23,4 13,2 8,5 4,9 6,2

Sapareva Banya (Bulgaria)
INTENSE Background Paper Energy efficiency in your home: Survey in 12 Central and Eastern European municipalities 84
Citizens of Sapareva Banya have little trust in others when it comes to energy issues. Experts are the only group that is consid-ered trustworthy by more than 50% of the respondents. The municipality is just under this 50%-margin. 48% of respondents find the municipality trustworthy or fully trust-worthy. 44.9% trust in friends and neighbours. The least trusted institutions are politicians and state authorities.
Energy consultancy
A high share of the citizens (83.7%) would be interesting in obtaining professional advice on what they could to increase en-ergy efficiency. Out of these, 55.4% would also consider to pay for such kind of advice.
Would you be willing to pay for professional advice on increasing the energy efficiency in your home?
Would like to get professional advice for your home on efficiency meas-ures?
Yes, sure
Yes likely
Probably not
Not at all
Yes, for sure 27 8 10 6
Yes, likely 1 15 15 10
Personal situation
The respondents from Sapareva Banya are, compared to other municipalities partici-pating in the survey, less affected by the financial and economic crisis – 22.0%. Con-
sequently, also the share of citizens react-ing to the crisis by saving or postponing investments is lower than in many other municipalities. The most often chosen reac-tion is saving more in all aspects of life (65.3% agree strongly or somewhat), fol-lowed by buying more generic brands (59.3%), and delaying or cancelling a reno-vation project around the house (58.0%).
When asked about concerns and anxieties, it shows that most residents are concerned about the living costs in the country (97.5% are very or somewhat concerned), immedi-ately followed by the rise of energy prices (96.2%). Other topics are generally of high concern as well: the current state of the economy (84.3%), and the state of the envi-ronment (78.7%).
The eagerness to save energy is very high among the residents Sapareva Banya. This is not surprising as a very high share of respondents is nervous about the devel-opment of living costs and energy prices. 91.5% say that they are very or somewhat eager to save energy. Ecologic and eco-nomic reasons for saving energy are equally important incentives in Sapareva Banya. 86.9% would save more energy to save more money, 83.1% would do it to ―be greener‖. A major obstacle seems to be initial financial support (92.7% agree) or advice how to do it properly (87.3%).
Demographic data
The questions were answered by 84 women and 46 men. 58.9% of the respon-dents have an academic degree, 39.5% finished their education after secondary school.
Age In %
Younger than 18 0.8
18-24 7.7
25-34 27.7
35-44 33.1
45-54 19.2
55-64 8.5
65 and older 3.1

INTENSE Background Paper Energy efficiency in your home: Survey in 12 Central and Eastern European municipalities 85
Conclusions
The development in the municipalities par-ticipating in the survey is diverse and there are few common developments. However, some conclusions can be found on the ba-sis of the existing data.
Housing conditions
Typical for Central and Eastern Europe a large part of the building stock is privatized. The reason for this is the massive transfor-mation of formerly publicly owned houses to private flats. In most cases, the renters of flats received the possibility to buy their flat in the beginning of the economic transition phase. The lowest rate can be found in Riga with 71.6%, but the ownership rate usually exceeds 80%. It should be highlighted that this development is nowadays an obstacle for renovating buildings, as often a consen-sus between all flat owners of an apartment house must be found. This is one explana-tion why in some cases, there is a higher share detached houses which have under-gone renovation than apartment houses.
Another interesting development is the size distribution of houses. In some municipali-ties, single detached houses have signifi-cantly larger heated floor space compared to apartments, but also compared to de-tached houses in other countries. On the other hand, there are some municipalities, such as Veszprém (Hungary) or Băile Tuş-nad (Romania) with rather small houses.́ Apartments are relatively small, usually they are smaller than 80 sqm, often smaller than 60 sqm. As single households are also quite rare, our survey confirms that the living space per person is comparatively low in Central and Eastern Europe.
Investing into homes
It is surprising that usually more than half of the respondents have invested into their homes during the last three years. The questionnaire did not ask for the type of investment but it can be assumed that ex-changing light bulbs will not be considered as an investment by most the respondents. The overwhelming majority of citizens used own financial means to finance the meas-ure and often a large share of those who
invested financed the measures entirely by themselves. The availability of bank loans differ between the countries, but except for Sapareva Banya and Samobor the share of citizens using bank loans to finance in-vestments does not exceed 20%. Special bank loans to for measures to enhance energy efficiency are available only in some countries. The same is true for local or na-tional support.
Talking about upgrading houses that were built before 1990, many citizens have un-dertaken refurbishment measures. The most often chosen measure is the ex-change of windows, while adding addi-tional insulation to walls or the ceiling is usually done much less often. On average 45-55% have recently exchanged windows and 25-35% have added insulation. In some municipalities these values differ however. The share of respondents who added insu-lation is significantly lower in Riga, Elek-tėnai, Cēsis and Băile Tuşnad, while the share of citizens that undertook renovation measures is higher than average in Ptuj, Ružomberok and the Moravian Karst region and slightly higher in Saku.
Heating and cooling
The supply of heat energy is individual for each municipality and reflects the local circumstances and the development of the heat supply systems over time. Wood pel-lets as a fuel that recently gains popularity is not yet wide-spread. Heating with elec-tricity which is less favourable due to the overall low efficiency has a significant share in some municipalities (Ptuj, Sapareva Banya, Ružomberok) while in others it is practically non-existent (e.g. Veszprém).
The equipment of individual metres and control over radiators is also dependent on the development of the heating systems over time, the local building and local con-ditions. Problematic are those cases with-out individual metres and little control over the radiator settings. Typically such constel-lations are found in areas of concrete-slab apartment houses, built between 1961 and 1990 and supplied by district-heating. The

INTENSE Background Paper Energy efficiency in your home: Survey in 12 Central and Eastern European municipalities 86
data suggest that such problematic cases are found in Riga, Cēsis, Elektrėnai, Saku, and partly Veszprém.
Except for a few cases in the south (espe-cially Samobor, Sapareva Banya, Kopriv-nica), the share of citizens using electronic cooling devices is still small and usually does not exceed 10 per cent. An interesting exception however is the northernmost municipality, Saku, where 15% of the re-spondents have such systems installed.
Costs for electricity
As electricity is generally metered in all countries, it was possible to gain informa-tion how much of the household income is needed to cover the energy costs. In com-parison to Western Europe the figures are quite high. The average costs for electricity amount to 5 to 11 per cent of the house-hold income in the survey municipalities. The smallest shares are found in Saku, Veszprém, and the Croatian towns of Samobor and Koprivnica. The highest shares are found in Elektrėnai, the Moravian Karst region, and Ružomberok. Neverthe-less, given the fact that a similar figure for most German regions should between 1.5-2.5%, it becomes clear that the electricity costs are a higher burden for the citizens in Central and Eastern Europe.
Knowledge and information about energy efficiency
The level of feeling informed differs quite a lot between the municipalities. There are municipality with citizens that feel very informed (Samobor, Saku) and those where the level is significantly lower (Sapareva Banya, Veszprém, Ružomberok, Elektrenai). Most citizens use the internet to obtain information about energy efficiency, fol-lowed by television and newspapers. Those media which are least used are usually spe-cialized literature or magazines.
It should be highlighted however, that the degree of feeling informed does not corre-lated with the eagerness to save energy. Citizens of Elektrėnai for example are among the most eager ones to save energy, despite being the ones that feel least in-formed. The eagerness to save energy is highly individual as well, and differs sub-stantially between the municipalities. The
most eager citizens can be found in Croatia where virtually everyone said that he or she is eager to save more energy. The lowest value can be found in the Moravian Karst region and in Riga.
In order to find out who can be a suitable stakeholder to address citizens in energy questions, the respondents were asked about their trust in certain groups. While the level of trust is generally low, individual experts are considered significantly more trustful than others. Experts are rated the most trustworthy group in almost all mu-nicipalities. On the other hand politicians are nowhere considered as a trustworthy group. The trust in other group differs from municipality to municipality. To give an example: NGOs are considered as highly trustworthy in some municipalities (Kopriv-nica, Croatia) while citizens of others have almost no trust in them at all (Ružomberok, Slovakia and Moravian Karst region, Czech Republic).
The interest in energy topics is high throughout the entire region of the survey. Participants were asked to rate items that deal with specific aspects of energy effi-ciency according to importance. Usually, energy efficiency and energy saving in general enjoy the highest importance. En-ergy efficient living and easy measures for refurbishment were often among the items that were evaluated as highly important. The topic with the lowest importance are usually passive houses, but it can be as-sumed that a part of the respondents do not know exactly what a passive house is. In some case the answer ―don’t know‖ was chose significantly more often when asked about passive houses.
At this point we will end the summary and refer the interested reader to study the municipalities of his interest in detail. We hope that this survey has provided the reader with some insights into current pat-terns of energy consumption and behav-iour in Central and Eastern Europe. Fur-thermore, we hope that stakeholders in the cities and towns represented in this publi-cation can use the results of this survey to shape their efforts to communication en-ergy efficiency and energy saving to their citizens.

INTENSE Background Paper Energy efficiency in your home: Survey in 12 Central and Eastern European municipalities 87
Annex 1: The questionnaire
On the following pages, the English version of the questionnaire is presented, in the way, it was visible online. For all languages the survey was available online in the national language and in English. If only paper questionnaires were collected, the online version was used by the respec-tive country coordinators to insert the data. The example used here, is the Slovak version.
The following table provides an overview of the questionnaire formats and raw data available. All of these are available upon request from the authors.
Questionnaire1 Raw data
Country Municipality Langugae LS2 DOC3 LS4 SPSS5
Bulgaria Sapareva Banya Bulgarian
English — —
Croatia Koprivnica Croatian
English — —
Samobor Croatian
English — —
Czech Republic Moravian Karst Region Czech
English — —
Estonia Saku Estonian
English —
Hungary Veszprém Hungarian
English —
Latvia Cesis Latvian
English — —
Riga Latvian
English — —
Lithuania Elektrenai Lithuanian —
English — —
Poland Ozarow6 Polish — —
English — —
Romanian Baile Tusnad Romanian
English — —
Slovakia Ruzomberok Slovak
English — —
Slovenian Ptuj Slovene
English — —
1 Refers to the blank questionnaire template. Not to collected and filled hard-copies. 2 CSV (Comma separated values) format for import to LimeSurvey Version 1.7 and above 3 Microsoft Word 97 and above or compatible 4 CSV or XML format for analysis e.g. in Stata or other similar software 5 SPSS Version 17 or above 6 Although the responses in Ozarow were too little for analysis, the questionnaire is available in Polish.

INTENSE Background Paper Energy efficiency in your home: Survey in 12 Central and Eastern European municipalities 88
01
02
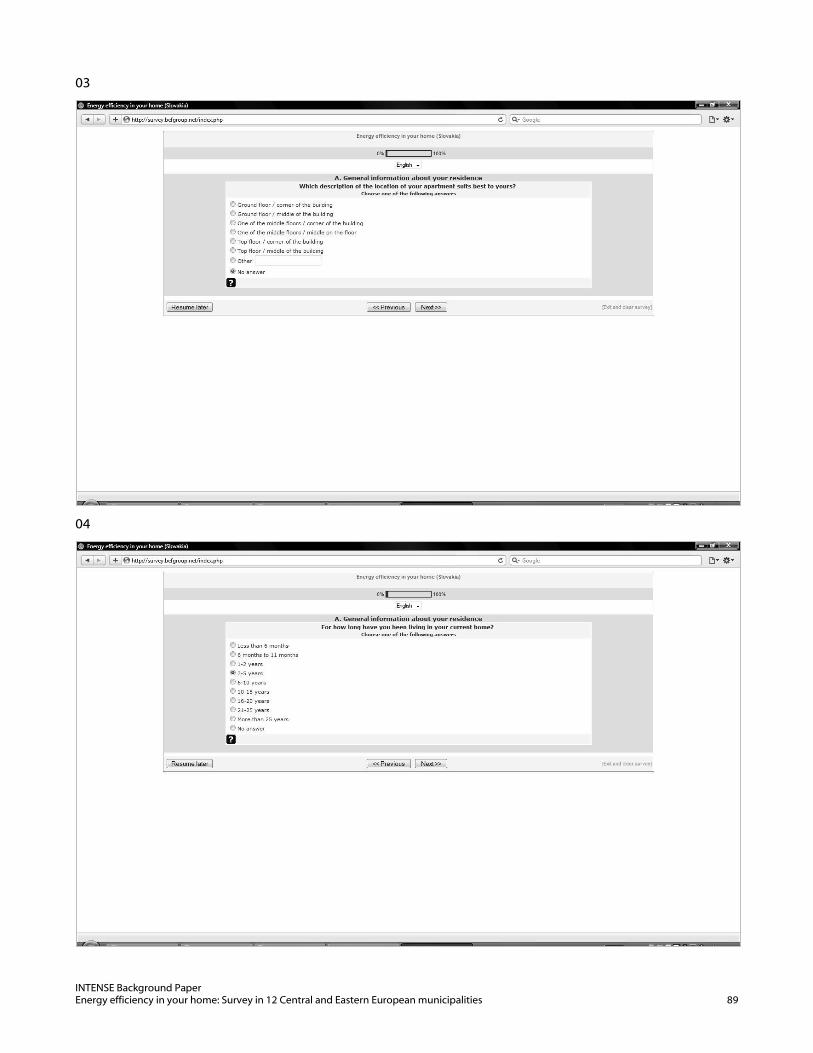
INTENSE Background Paper Energy efficiency in your home: Survey in 12 Central and Eastern European municipalities 89
03
04
INTENSE Background Paper Energy efficiency in your home: Survey in 12 Central and Eastern European municipalities 90
05
06

INTENSE Background Paper Energy efficiency in your home: Survey in 12 Central and Eastern European municipalities 91
07
08

INTENSE Background Paper Energy efficiency in your home: Survey in 12 Central and Eastern European municipalities 92
09
10

INTENSE Background Paper Energy efficiency in your home: Survey in 12 Central and Eastern European municipalities 93
11
12
INTENSE Background Paper Energy efficiency in your home: Survey in 12 Central and Eastern European municipalities 94
13
14

INTENSE Background Paper Energy efficiency in your home: Survey in 12 Central and Eastern European municipalities 95
15
16

INTENSE Background Paper Energy efficiency in your home: Survey in 12 Central and Eastern European municipalities 96
17
18

INTENSE Background Paper Energy efficiency in your home: Survey in 12 Central and Eastern European municipalities 97
19
20

INTENSE Background Paper Energy efficiency in your home: Survey in 12 Central and Eastern European municipalities 98
21
22

INTENSE Background Paper Energy efficiency in your home: Survey in 12 Central and Eastern European municipalities 99
23
24
INTENSE Background Paper Energy efficiency in your home: Survey in 12 Central and Eastern European municipalities 100
25
26

INTENSE Background Paper Energy efficiency in your home: Survey in 12 Central and Eastern European municipalities 101
27
28

INTENSE Background Paper Energy efficiency in your home: Survey in 12 Central and Eastern European municipalities 102
29
30

INTENSE Background Paper Energy efficiency in your home: Survey in 12 Central and Eastern European municipalities 103
31
32

INTENSE Background Paper Energy efficiency in your home: Survey in 12 Central and Eastern European municipalities 104
33
34

INTENSE Background Paper Energy efficiency in your home: Survey in 12 Central and Eastern European municipalities 105
35
36

INTENSE Background Paper Energy efficiency in your home: Survey in 12 Central and Eastern European municipalities 106
37
38

INTENSE Background Paper Energy efficiency in your home: Survey in 12 Central and Eastern European municipalities 107
39
40

INTENSE Background Paper Energy efficiency in your home: Survey in 12 Central and Eastern European municipalities 108
41
42

INTENSE Background Paper Energy efficiency in your home: Survey in 12 Central and Eastern European municipalities 109
43
44
INTENSE Background Paper Energy efficiency in your home: Survey in 12 Central and Eastern European municipalities 110
45
46
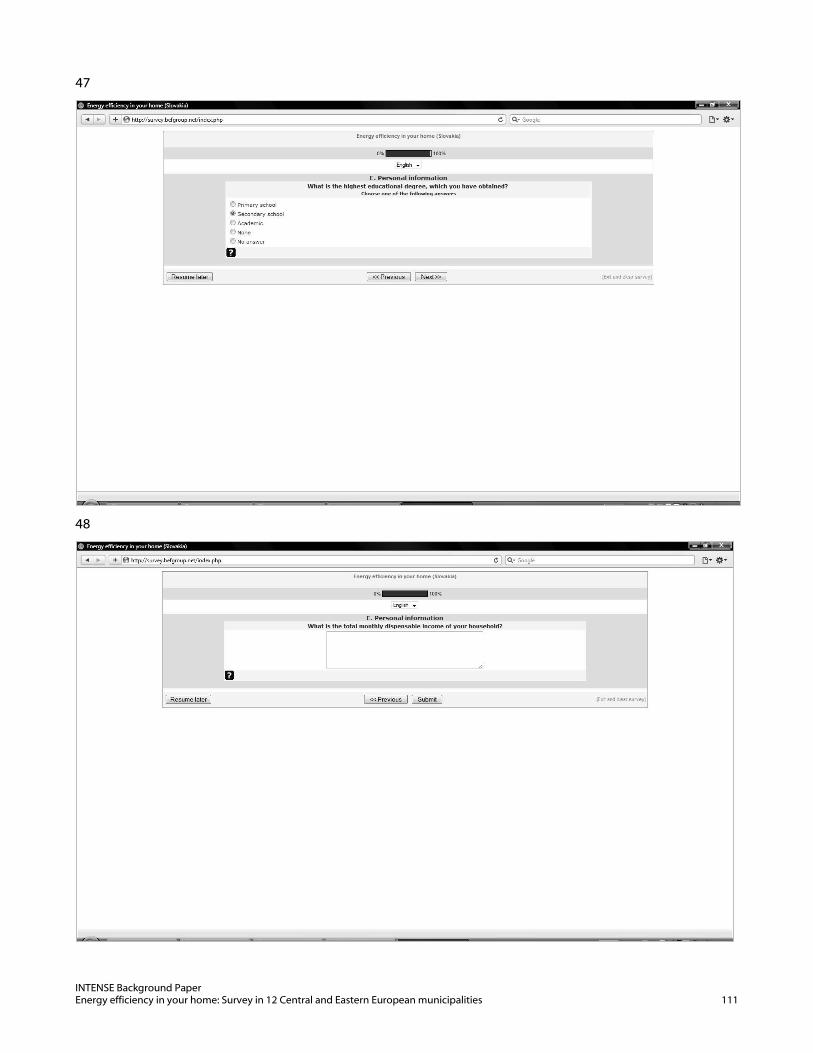
INTENSE Background Paper Energy efficiency in your home: Survey in 12 Central and Eastern European municipalities 111
47
48

INTENSE Background Paper Energy efficiency in your home: Survey in 12 Central and Eastern European municipalities 112