energy efficiency trends and policies in italy · energy efficiency trends and policies in italy 3...
TRANSCRIPT

Energy Efficiency Trends and Policies in ITALY 1
Energy Efficiency trends and policies in ITALY
Date: July 2018

Energy Efficiency Trends and Policies in
Contact person: Giulia Iorio Alessandro Federici Italian National Agency for New Technologies, Energy and Sustainable Economic Development, ENEALungotevere Thaon di Revel, 76, RomE-mail: [email protected] [email protected]
http://www.agenziaefficienzaenergetica.it/
The sole responsibility for the content of this publication lies with the authors. It does not necessarily reflect the opinion of the European Communities. The European Comany use that may be made of the information
Energy Efficiency Trends and Policies in ITALY
ional Agency for New Technologies, Energy and Sustainable Economic Development, ENEAThaon di Revel, 76, Rome, Italy
http://www.agenziaefficienzaenergetica.it/
The sole responsibility for the content of this publication lies with the authors. It does not necessarily reflect the opinion of the European Communities. The European Commission is not responsible for any use that may be made of the information contained therein.
2
ional Agency for New Technologies, Energy and Sustainable Economic Development, ENEA
The sole responsibility for the content of this publication lies with the authors. It does not necessarily mission is not responsible for
Energy Efficiency Trends and Policies in ITALY 3
CONTENT OF THE REPORT
The report describes the energy efficiency trends and policies in Italy, focusing on energy efficiency trends based on the ODYSSEE database. The analysis focuses on the period 2000-2016. The report also illustrates the recent and innovative energy efficiency policies and measures, included in 4th National Energy Efficiency Action Plans (NEEAP), submitted in June 2017, and National Energy Strategy 2017 (NES).

Energy Efficiency Trends and Policies in ITALY 4
TABLE OF CONTENT
CONTENT OF THE REPORT ..................................................................................................................3 TABLE OF CONTENT .............................................................................................................................4 LIST OF FIGURES ...................................................................................................................................5 LIST OF TABLES ....................................................................................................................................6 EXECUTIVE SUMMARY ..........................................................................................................................7 1. ECONOMIC AND ENERGY EFFICIENCY CONTEXT ...................................................................8
1.1. Economic context ........................................................................................................................... 8 1.2. Total Energy consumption and intensities ..................................................................................... 8 1.3. Energy efficiency policy background ............................................................................................ 12 1.3.1. Energy efficiency targets .............................................................................................................. 13
2. ENERGY EFFICIENCY IN BUILDINGS ....................................................................................... 16 2.1. Energy efficiency trends ............................................................................................................... 16 2.2. Energy efficiency policies ............................................................................................................. 20
3. ENERGY EFFIENCY IN TRANSPORT ........................................................................................ 22 3.1. Energy efficiency trends ............................................................................................................... 22 3.2. Energy efficiency policies ............................................................................................................. 27
4. ENERGY EFFICIENCY IN INDUSTRY ........................................................................................ 28 4.1. Energy efficiency trends ............................................................................................................... 28 4.2. Energy efficiency policies ............................................................................................................. 34
5. ENERGY EFFICIENCY IN AGRICULTURE ................................................................................ 35 5.1. Energy efficiency trends ............................................................................................................... 35
REFERENCES ...................................................................................................................................... 37

Energy Efficiency Trends and Policies in ITALY 5
LIST OF FIGURES
Figure 1: Macro-economic developments in Italy (2000=100) ............................................................................... 8 Figure 2: Primary energy consumption by energy source ...................................................................................... 9 Figure 3: Final energy consumption by sector ........................................................................................................ 9 Figure 4: Shares of energy consumption by sector ............................................................................................... 10 Figure 5: Shares of energy consumption by energy source .................................................................................. 10 Figure 6: Primary and final energy intensity ......................................................................................................... 11 Figure 7: Technical energy efficiency index (ODEX) .............................................................................................. 12 Figure 8: Savings on National energy bills and energy savings, years 2011-2017 ................................................ 15 Figure 9: Energy consumption of households by energy source .......................................................................... 16 Figure 10: Shares of energy consumption by energy source in households ......................................................... 16 Figure 11: Energy consumption by types of end-use in households ..................................................................... 17 Figure 12: Variation households consumption – Italy – Mtoe (2000-2016) ......................................................... 17 Figure 13: Energy efficiency in households by index ODEX (2000=100) ............................................................... 18 Figure 14: Energy unit consumption of electrical appliances in households (2000=100) ..................................... 18 Figure 15: Energy consumption of services sector by energy source ................................................................... 19 Figure 16: Energy intensity and energy consumption per employee in services sector (2000=100) ................... 19 Figure 17: Energy consumption of transport sector by mode .............................................................................. 23 Figure 18: Energy consumption of transport sector by fuel ................................................................................. 23 Figure 19: Variation transport consumption – Italy – Mtoe (2000-2013) ............................................................. 24 Figure 20: Energy consumption of road transport by mode ................................................................................. 24 Figure 21: Energy consumption trends of road transport (2000=100) ................................................................. 25 Figure 22: Passenger transport by mode (2000=100) ........................................................................................... 25 Figure 23: Goods traffic transport by mode and energy consumption ................................................................. 26 Figure 24: Energy efficiency in transport sector (2000=100) ................................................................................ 26 Figure 25: Energy consumption in industry by fuel and industrial production index (2010=100) ........................ 28 Figure 26: Shares of energy consumption by fuel in industry ............................................................................... 29 Figure 27: Energy consumption of manufacturing industry by branch ................................................................. 29

Energy Efficiency Trends and Policies in ITALY 6
Figure 28: Shares of energy consumption by branch in industry .......................................................................... 30 Figure 29: Unit consumption of energy-intensive products (toe/t, 2000=100) .................................................... 30 Figure 30: Variation industry consumption – Italy – Mtoe (2000-2016) ............................................................... 31 Figure 31: Variation industry consumption – Italy: before and after the crisis .................................................... 31 Figure 32: Energy intensity in industry sector (2000=100) ................................................................................... 32 Figure 33: Energy efficiency index in industry (2000=100) ................................................................................... 33 Figure 34: Energy efficiency trends in industrial branches (%/year) .................................................................... 33 Figure 35: Energy consumption in agriculture by energy source .......................................................................... 36 Figure 36: Energy and economic components in agriculture (2000=100) ............................................................ 36
LIST OF TABLES
Table 1: Achieved energy savings by sector, period 2011-2017 and expected for 2020 (final energy, Mtoe/year) according to the 2014 NEEAP ...................................................................................................................... 13
Table 2: Renovated surface area of Italy’s central government buildings pursuant to art. 5 of the Energy Efficiency Directive, years 2014-2017.......................................................................................................... 14
Table 3: Mandatory savings (Mtoe) pursuant to article 7 of the Energy Efficiency Directive, years 2014-2017 .. 14 Table 4: Cost-effectiveness of incentive mechanisms, cumulative data for 2017 ................................................ 15 Table 5: Ecobonus: eligible energy efficiency ....................................................................................................... 20 Table 6: Ecobonus: investments (M€) and energy savings (GWh/year) by technology, 2017 .............................. 21 Table 7: Energy audits received by ENEA pursuant to article 8 of Italian Legislative Decree 102/2014 at
December 2017 and savings potential from projects with a payback time of less than 3 years ................ 35

Energy Efficiency Trends and Policies in ITALY 7
EXECUTIVE SUMMARY
In 2016 primary energy consumption was 155.1 Mtoe: the consumption has been decreasing since 2005 returning to consumption levels of the first half of the 1990s. The final energy consumption is also decreasing: in 2016 amounted to 115.9 Mtoe, -7.1% in the period 2000-2016. The corresponding energy intensities fell: in the period 2000-2016 primary energy intensity by 11.8% and final energy intensity by 7.9%. The trend of both energy intensities was decreasing since 2005, more rapidly in the last years. The drop in the final consumption was due to decreases in energy consumption of industry (-33.5%) and transport sector (-8.0%). The driving sector was services sector, +28.6% of energy consumption in 2000-2016, followed by households, +16.7%. In the last five years practically all sectors have showed decreases in energy consumption. In the period 2000-2016, all fossil fuels had a important decrease: -24.2% for oil products, -52.4% for coal and -12.0% for natural gas. Electricity consumption increased by 4.8%, down in the last years. The renewable energy sources had a highest growth rate in the period 2000-2016: over 300% reaching the share of 7.2% of final energy consumption in 2016. Heat consumption is also rising: +30.5% in the period 2004-2016 with a quota of 3.4% in 2016. The energy efficiency for final consumers, as measured by ODEX, improved by 15.1% over the period 2000-2016, with an average rate of 1.0% per year from 2000 to 2016. In industry the energy efficiency improvement has been steady and significant: 1.7% per year over the period 2000-2016. All industrial branches contributed to the progress in energy efficiency of industry sector, more rapidly in the years 2004-2011: chemicals is the most efficient branch. The progress in transport sector has been constant (0.7% per year). The residential sector had a steady progress in energy efficiency but smaller than in 1990s caused by the changes in lifestyle and dwelling comfort: 1.2% per year over the period 2000-2016. The National Energy Strategy 2017 (NES) was adopted on 10 November 2017 with a Ministerial Decree of the Minister for Economic Development and the Minister for the Environment and Protection of Land and Sea. The NES 2017 is the ten-year policy document which lays down the measures to be carried out in the energy sector up to 2030, in line with the European Roadmap 2050. The target set for 2030, with regard to energy efficiency, is a saving of 10 Mtoe with a reduction of final consumption on average from 118 to 108 Mtoe. Consistent with the NES, the National Energy Efficiency Action Plan 2017 reinforces the measures in place aimed at achieving the energy efficiency targets by 2020. The NEEAP 2017 sets the final end-use energy savings target of 15.5 Mtoe in final energy for 2020. The measures involve all sectors: public and private buildings, SMEs, transport sector and the National Energy Efficiency Fund. The measure are mainly incentive mechanisms (White Certificates, Thermal Account, fiscal deductions for energy renovation and for building renovation) and legislative measures (Minimum Energy Efficiency Requirements for buildings). In particular, the White Certificates mechanism will have to guarantee at least 60% of the target, while the remaining 40% will be obtained with the other measures such as tax deductions, the Thermal Account, the Industry 4.0 Plan and the National Energy Efficiency Fund.
Energy Efficiency Trends and Policies in ITALY 8
1. ECONOMIC AND ENERGY EFFICIENCY CONTEXT
1.1. ECONOMIC CONTEXT
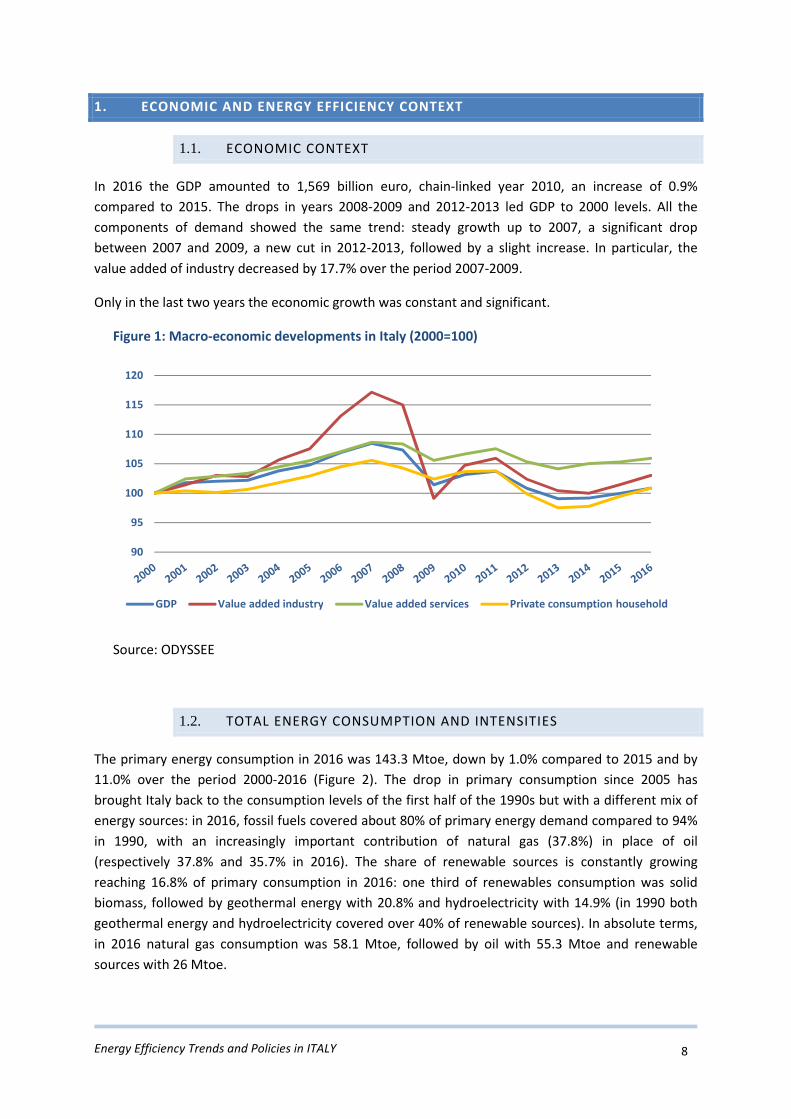
In 2016 the GDP amounted to 1,569 billion euro, chain-linked year 2010, an increase of 0.9% compared to 2015. The drops in years 2008-2009 and 2012-2013 led GDP to 2000 levels. All the components of demand showed the same trend: steady growth up to 2007, a significant drop between 2007 and 2009, a new cut in 2012-2013, followed by a slight increase. In particular, the value added of industry decreased by 17.7% over the period 2007-2009.
Only in the last two years the economic growth was constant and significant.
Figure 1: Macro-economic developments in Italy (2000=100)
Source: ODYSSEE
1.2. TOTAL ENERGY CONSUMPTION AND INTENSITIES
The primary energy consumption in 2016 was 143.3 Mtoe, down by 1.0% compared to 2015 and by 11.0% over the period 2000-2016 (Figure 2). The drop in primary consumption since 2005 has brought Italy back to the consumption levels of the first half of the 1990s but with a different mix of energy sources: in 2016, fossil fuels covered about 80% of primary energy demand compared to 94% in 1990, with an increasingly important contribution of natural gas (37.8%) in place of oil (respectively 37.8% and 35.7% in 2016). The share of renewable sources is constantly growing reaching 16.8% of primary consumption in 2016: one third of renewables consumption was solid biomass, followed by geothermal energy with 20.8% and hydroelectricity with 14.9% (in 1990 both geothermal energy and hydroelectricity covered over 40% of renewable sources). In absolute terms, in 2016 natural gas consumption was 58.1 Mtoe, followed by oil with 55.3 Mtoe and renewable sources with 26 Mtoe.
90
95
100
105
110
115
120
GDP Value added industry Value added services Private consumption household

Energy Efficiency Trends and Policies in ITALY 9
Figure 2: Primary energy consumption by energy source
Source: ODYSSEE, EUROSTAT
In 2016, final energy consumption amounted to 115.9 Mtoe, down 0.3% compared to 2015, back to the negative trend of the last few years with the exception of 2015: in the period 2010-2016, the end-uses consumption decreased at average rate of 2% per year. The final energy consumption has returned to consumption levels of the early 1990s: the stable growth of all sectors until 2005 was followed by a constant reduction in energy consumption for industry and fluctuating consumptions for the other sectors. Over the period 2000-2016, the energy consumption decreased by 34.7% in industry and by 8.0% in transport sector against a growth of 32.9% in the services sector and of 16.7% in residential sector (figure 3).
Figure 3: Final energy consumption by sector
Source: ODYSSEE
These trends have changed the composition of final consumption by sector (figure 4): the transport sector continues to have the highest energy consumption but its share has decreased from 34.1% to
020406080
100120140160180200
Mtoe
waste non ren.
import-export electricityother renewables
biomass
coal
gas
oil
020406080
100120140160
Mtoe
agriculture
services
residential
transport
industry
Energy Efficiency Trends and Policies in ITALY 10
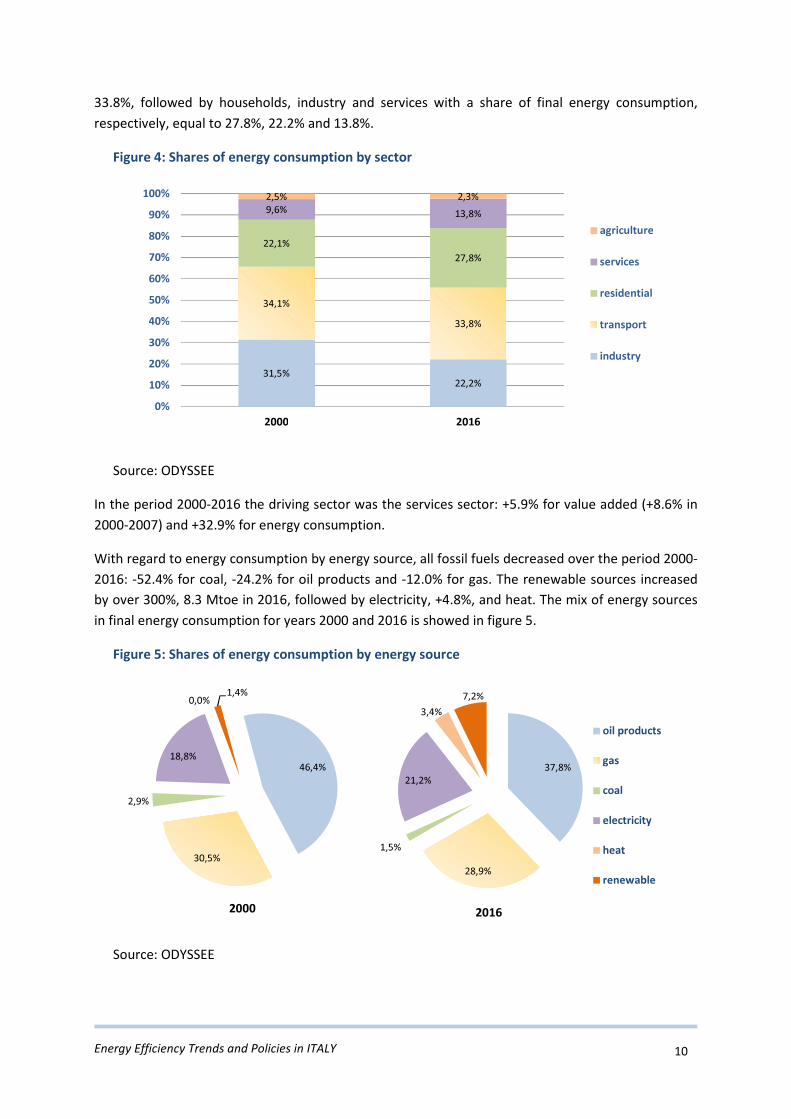
33.8%, followed by households, industry and services with a share of final energy consumption, respectively, equal to 27.8%, 22.2% and 13.8%.
Figure 4: Shares of energy consumption by sector
Source: ODYSSEE
In the period 2000-2016 the driving sector was the services sector: +5.9% for value added (+8.6% in 2000-2007) and +32.9% for energy consumption. With regard to energy consumption by energy source, all fossil fuels decreased over the period 2000-2016: -52.4% for coal, -24.2% for oil products and -12.0% for gas. The renewable sources increased by over 300%, 8.3 Mtoe in 2016, followed by electricity, +4.8%, and heat. The mix of energy sources in final energy consumption for years 2000 and 2016 is showed in figure 5.
Figure 5: Shares of energy consumption by energy source
Source: ODYSSEE
31,5%22,2%
34,1%33,8%
22,1%27,8%
9,6% 13,8%2,5% 2,3%
0%10%20%30%40%50%60%70%80%90%
100%
2000 2016
agriculture
services
residential
transport
industry
46,4%
30,5%
2,9%
18,8%
0,0% 1,4%
2000
37,8%
28,9%
1,5%
21,2%
3,4%7,2%
2016
oil products
gas
coal
electricity
heat
renewable

Energy Efficiency Trends and Policies in ITALY 11
In 2016 the primary energy intensity was 0.099 koe/€2010, -1.8% compared to 2015. Over the period 2000-2016 the intensity has been decreased by 11.8%, more or less rapidly according to energy consumption. The final energy intensity had a similar trend to the primary energy intensity with a slower decrease: in the 2016 it was 0.074 koe/€2010, -1.1% compared to 2015, and -7.9% over the period 2000-2016: the drop was more rapidly in the years of the crisis (2011-2014) and slower in the last two years due to the recovery of energy consumption (figure 6).
Figure 6: Primary and final energy intensity
Source: ODYSSEE, EUROSTAT
The trends are mainly due to growth rate of GDP higher than energy consumption: it was higher in the years of economic expansion (2000-2007) and less low in the years of stagnation (2008-2014). The energy intensity is influenced by factors not related to energy efficiency such as structural changes, comfort effects linked to human behavior, therefore to assess the progress in energy efficiency it’s better to use the indicators based on energy unit consumption such as ODEX index. The ODEX index aggregates energy efficiency indicators observed for energy end-uses and appliances into an aggregate bottom-up energy efficiency index with weighs given by their share in total final energy consumption. In the 2016 the energy efficiency index for the whole economy amounted to 84.9, measured as three-year moving average and base year 2000, which means a 15.1% of energy efficiency improvement from 2000 and a gain of 1%/year: the energy efficiency trends in sectors measured by technical ODEX index are showed in figure 7. All sectors had have improvement in energy efficiency since 2000: industry improved by 24.4%, followed by transport sector by 17.1%, households by 10.7% and services sector by 3.4%. For households a slower improvement was observed compared to 90s due to the increase in energy consumption for a better comfort.
0,060
0,070
0,080
0,090
0,100
0,110
0,120
koe/€2
010
Primary energy intensity Final energy intensity

Energy Efficiency Trends and Policies in ITALY 12
Figure 7: Technical energy efficiency index (ODEX)
Source: ODYSSEE
1.3. ENERGY EFFICIENCY POLICY BACKGROUND
Following the guidelines of the measures contained in the Clean Energy for All Europeans package, presented at the end of 2016 by the European Commission, the National Energy Strategy 2017 confirms the key role of energy efficiency in Italy energy transition path. The NES aims to strengthen energy efficiency policies by facilitating the measures that have the best cost-effectiveness ratio in order to achieve 30% energy savings by 2030 compared to the expected consumption at that date. Extensive additional energy efficiency investments are expected over the entire period: 110 billion euros are expected to be spent in energy efficiency over the period out of the 175 billion euros overall NES. This amount of resources will result in a reduction in final energy consumption from active policies of around 10 Mtoe/year in 2030, equal to about 1 Mtoe of annual savings from new works in the period 2021-2030, to be mainly focused in residential sector, services and transport. For the residential sector it is expected that there will be an expansion of works under the National Fund for Energy Efficiency, launched in March 2018 to support projects that require a high initial investment, stimulating their financing by banks. The NES also seeks to optimise the Ecobonus mechanism, and for this purpose the 2018 Budget Law has further developed the incentive system by adding new deduction rates as appropriate, new interventions and new technical and performance conditions, as well as significant changes to credit transfer which was extended to all taxpayers and for any project, and which may benefit suppliers who have carried out the work or other private parties with the option of subsequent credit transfer. With regard to this last point, the recent bulletin of May 2018 from the Revenue Agency clarified that the credit transfer must be considered limited to a single transfer subsequent to the original one, and that by "other private parties" must be understood parties other than suppliers, provided they are connected to the relationship that gave rise to the deduction.
707580859095
100105
2000
=100
ODEX industry ODEX households ODEX transport ODEX services ODEX

Energy Efficiency Trends and Policies in ITALY 13
Particular attention was also paid to public buildings through the continuation of the Programme for the Energy-related Renovation of Buildings of the Central Public Administration (PREPAC) in the period 2021-2030 and the definition of mandatory savings clauses in the contracts of energy services supplying the public administration. For the industrial sector, besides strengthening and simplifying the obligation scheme of White Certificates, efforts will be focused on Industry 4.0 National Plan, and the promotion of energy efficiency in SMEs will continue through calls for co-financing of energy audits and management systems. For the transport sector, the NES underlines the need to reduce the use of private mobility through measures aimed at encouraging a shift towards smart mobility and local public transport. As far as road freight transport is concerned, an important contribution in terms of efficiency is expected from the optimisation of the logistics system, promoted through the diffusion of new ITS (Intelligence Transport Systems) technologies. Some measures consistent with these guidelines have already been included in the Budget Law for 2018. The NES will be incorporated in the Energy and Climate Action Plan which, in the first formulation, Italy will send to the European Commission by the end of the year, which will also include the provisions of the 2017 National Energy Efficiency Action Plan in which the measures already implemented or planned for the achievement of 2020's targets were analysed, assessing their expected impact and the barriers that hinder their complete implementation throughout the country and therefore the achievement of the energy savings potential.
1.3.1. ENERGY EFFICIENCY TARGETS
Compared to the 2011-2020 target, envisaged in the National Energy Efficiency Action Plan (NEEAP) of 2014, the energy savings achieved in 2017 amounted to just over 8 Mtoe/year, equivalent to almost 52% of the final target. Approximately 37% of these savings derive from the obligation scheme of the White Certificates and over a quarter from tax relief. At a sectoral level, the residential sector has already reached its target for 2020, while industry is half way to its objective (Table 1).
Table 1: Achieved energy savings by sector, period 2011-2017 and expected for 2020 (final energy, Mtoe/year) according to the 2014 NEEAP
Measure Sector Wh
ite
Certi
ficate
s
Tax R
elief
*
Conto
Te
rmico
Impre
sa 4.0
Na
tiona
l Plan
*
Europ
ean
Regu
lation
s and
Hig
h-Spe
ed Ra
il *
Italia
n Leg
islativ
e De
crees
192/
05
and 2
6/6/1
5 **
Energy savings Achieved
target (%) Achieved
in 2017 ** Expected by 2020
Residential 0.71 2.08 - - - 0.85 3.64 3.67 99.2% Services 0.15 0.02 0.005 - - 0.04 0.22 1.23 17.5% Industry 2.1 0.03 - 0.3 - 0.07 2.5 5.1 49.0% Transport 0.01 - - - 1.68 - 1.69 5.5 30.7% Total 2.97 2.13 0.005 0.3 1.68 0.96 8.05 15.5 51.9%
*Estimate for the year 2017. **Estimate for the period January-September 2017. The residential sector includes the savings from the replacement of large household appliances also. Source: ENEA elaboration of data from the Ministry of Economic Development, ISTAT, Gestore dei Servizi Energetici S.p.A., ENEA, FIAIP, GFK

Energy Efficiency Trends and Policies in ITALY 14
With regard to the obligation to carry out energy-related renovations of 3% of the total floor area of heated and/or cooled buildings owned and occupied by the Italian central public administration, in the four-year period 2014-2017 projects for over 190 properties were completed or planned for a total area of over 1,870,000 m2 (Table 2). The result is primarily attributable (both in terms of projects and in terms of renovated surface area) to PREPAC, while the remainder is attributable to other specific incentive measures (Structural Funds) and the projects carried out by the Italian Government Agency for State Property as part of the centralised maintenance system ( Law Decree 98/2011).
Table 2: Renovated surface area of Italy’s central government buildings pursuant to art. 5 of the Energy Efficiency Directive, years 2014-2017
2014 2015 2016 2017 Total area of buildings with a total useful floor area of over 500 m2 owned and occupied by the central government that do not meet the energy performance requirements referred to in article 5 (1) of the EED
14,828,984 14,441,992 13,973,749 13,414,012
Total area of buildings with a total useful floor area of over 250 m2 owned and occupied by the central government that do not meet the energy performance requirements referred to in article 5 (1) of the EED
Not subject to the obligation 361,360 361,360 361,360
Total area of the heated and/or cooled buildings owned and occupied by central public administrations that has been renovated or whose renovation has been planned during the year
386,992 468,243 559,737 459,045
Percentage of the area subject to mandatory renovation 2.61% 3.16% 3.90% 3.33% Source: Ministry of Economic Development on data from the State Property Agency and Ministry of Environment
With regard to the minimum energy saving target of 25.5 Mtoe of overall final energy to be achieved in the years 2014-2020 pursuant to article 7 of the Energy Efficiency Directive, the savings achieved in the years 2014-2016 and 2017 (estimated) through the notified measures are showed in table 3 shows. The results are in line with the expected savings trend to achieve the 2020 target.
Table 3: Mandatory savings (Mtoe) pursuant to article 7 of the Energy Efficiency Directive, years 2014-2017
Notified measures New Savings achieved Cumulative savings
2014 2015 2016 2017* 2014-2017 Expected in 2020
Mandatory scheme - White Certificates 0.872 0.859 1.101 1.341 4.174 12.51 Alternative measure 1 - Conto Termico 0.003 0.008 0.019 0.045 0.075 0.43 Alternative measure 2 - Tax relief 0.306 0.597 0.873 1.164 2.940 8.39 Alternative measure 3 - National Energy Efficiency Fund 0.000 0.000 0.000 0.000 0.000 0.18 Alternative measure 4 - Impresa 4.0 National Plan 0.000 0.000 0.000 0.300 0.300 4.00 Total savings 1.181 1.465 1.993 2.850 7.489 25.50
* Preliminary estimate on data not yet consolidated Source: Elaboration of the Ministry of Economic Development based on data from ENEA and Gestore dei Servizi Energetici S.p.A.

Energy Efficiency Trends and Policies in ITALY 15
Table 4 shows for each mechanism the years in force, the total stimulated investment I, the savings achieved both in energy and in cash flow, the induced costs and the cost/effectiveness indicator (c€/kWh)1.
Table 4: Cost-effectiveness of incentive mechanisms, cumulative data for 2017
Mechanism Years I Savings Costs Cost-effectiveness
(n) (G€) Energy (Mtoe)
Financial (G€) (G€) (c€/kWh)
White Certificates 13 12.0 57.3 38.0 7.0 2.9 Ecobonus 11 34.6 8.6 5.4 20.5 8.6 PV (Feed-in Tariff) 12 82.7 134 (20 y) 32.0 Other electric RES <25 110 (20 y)
Source: ENEA elaboration of data from ARERA, CSEA, Chamber of Deputies, ENEA, GME, Gestore dei Servizi Energetici S.p.A., Ministry of Economic Development
The preliminary analysis shows that energy efficiency mechanisms have a better cost effectiveness than renewables, as evidenced by the cost incurred by the actors involved for each kWh saved: 2.9 euro cents for White Certificates and 8.6 for the Ecobonus, compared with 32 for renewable electric sources. For the period 2011-2017 the cumulative energy savings amounted to approximately 8.3 Mtoe in primary energy, of which about 6 Mtoe linked to lower consumption of natural gas (Figure 8). The assessment of the bill savings was based on the price trend of crude oil and natural gas over the years in question. Overall, the cumulated savings on bill exceeds 2.5 billion euros per year in 2017, of which 1.5 billion euros for lower imports of natural gas. The savings achieved in 2011-2017 prevented the emission of about 19 MtCO2 in 2017, more than 5% of the CO2 emissions reported for Italy in 2016.
Figure 8: Savings on National energy bills and energy savings, years 2011-2017
Source: ENEA elaboration
1 The results are assessed throughout 2017 not considering any inertial effects that can be produced in future years. The effects of the Feed-in Tariff for photovoltaic (PV) systems and incentives for “Other electric RES” devices are considered over 20 years.
0
100
200
300
400
500
0,0
0,5
1,0
1,5
2,0
2011 2012 2013 2014 2015 2016 2017
M€/ye
ar
Mtoe
/year
Gas saving (Mtoe, area) Oil saving (Mtoe, area)White Certificates (Mtoe, bar) Tax relief (Mtoe, bar)Conto Termico (Mtoe, bar) Decree 192/05 and 26/6/15 (Mtoe, bar)Impresa 4.0 National Plan (Mtoe, bar) Measures in transport sector (Mtoe, bar)Gas bill (M€, dotted line) Oil bill (M€, dotted line)
Energy Efficiency Trends and Policies in ITALY 16
2. ENERGY EFFICIENCY IN BUILDINGS
2.1. ENERGY EFFICIENCY TRENDS
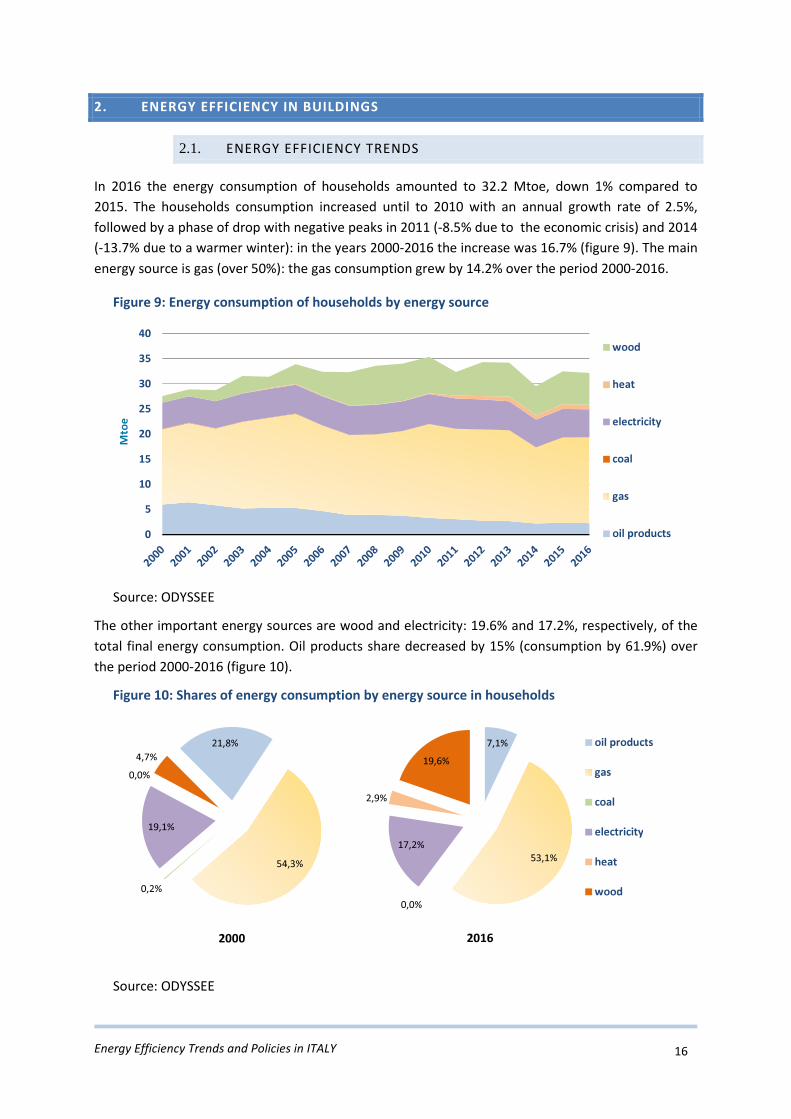
In 2016 the energy consumption of households amounted to 32.2 Mtoe, down 1% compared to 2015. The households consumption increased until to 2010 with an annual growth rate of 2.5%, followed by a phase of drop with negative peaks in 2011 (-8.5% due to the economic crisis) and 2014 (-13.7% due to a warmer winter): in the years 2000-2016 the increase was 16.7% (figure 9). The main energy source is gas (over 50%): the gas consumption grew by 14.2% over the period 2000-2016.
Figure 9: Energy consumption of households by energy source
Source: ODYSSEE
The other important energy sources are wood and electricity: 19.6% and 17.2%, respectively, of the total final energy consumption. Oil products share decreased by 15% (consumption by 61.9%) over the period 2000-2016 (figure 10).
Figure 10: Shares of energy consumption by energy source in households
Source: ODYSSEE
05
10152025303540
Mtoe
wood
heat
electricity
coal
gas
oil products
21,8%
54,3%
0,2%
19,1%
0,0%4,7%
2000
7,1%
53,1%
0,0%
17,2%
2,9%
19,6%
2016
oil products
gas
coal
electricity
heat
wood

Energy Efficiency Trends and Policies in ITALY 17
In 2016 the energy consumption for air conditioning (space heating and air cooling) took almost 70% of the total consumption (Figure 11), stable in recent years. Over the period 2000-2016 energy consumption for lighting and electrical appliances increased, except for the years 2011-2014, while energy consumption for cooking and hot water was constant: in 2016 the share of consumption was 13.9% for lighting and electrical appliances, 11.7% for hot water and 6.3% for cooking.
Figure 11: Energy consumption by types of end-use in households
Source: ODYSSEE
In the period 2000-2016 the improvement in energy efficiency were not enough to offset the increases in households energy consumption: the growth equal to 4.6 Mtoe was mainly due to a demographic effect, more dwellings, and a lifestyle effect, more appliances for a better comfort in dwelling, counterbalanced by energy savings (figure 12). This result is also showed by the ODEX index.
Figure 12: Variation households consumption – Italy – Mtoe (2000-2016)
Source: ODYSSEE
05
10152025303540
Mtoe
electrical appliances
cooking
water heating
air conditioning
Variation consumption
Climate effect More dwellings
More appliances
per dwelling
Larger homes Energy savings
Other
-3-2-10123456
Mtoe

Energy Efficiency Trends and Policies in ITALY 18
Energy efficiency in households over the period 2000-2016 improved by 10.7% (figure 13). The slowdown compared to 90s is due to an increase in energy consumption for space: a high raise in wood consumption, especially related to the second residences, and expansion of the natural gas network.
Figure 13: Energy efficiency in households by index ODEX (2000=100)
Source: ODYSSEE
Over the period 2000-2016 energy efficiency of electrical appliances was 32.1%, 2.4%/year, due to a considerable decrease in energy unit consumption (figure 14). Water heating and heating improved by 20.1% and 8.0%,respectively, in the same period.
Figure 14: Energy unit consumption of electrical appliances in households (2000=100)
Source: ODYSSEE
In 2016 the energy consumption of services was 16.0 Mtoe. The main energy sources are electricity and natural gas: 52.7% and 41.0%, respectively, together they cover over 90% of the sector
65707580859095
100105
households ODEX
heating
water heating
electrical appliances
6065707580859095
100105 refrigerator
freezer
washing machine
dish washer
large appliances

Energy Efficiency Trends and Policies in ITALY 19
consumption (figure 15).
Figure 15: Energy consumption of services sector by energy source
Source: ODYSSEE
The services sector is the driving sector of overall economy: in the period 2000-2016 it has showed the highest increase in energy consumption, +32.9%. This growth was confirmed by the energy intensity, total (+25.6%) and electricity (+49.0%), and by the energy consumption per employee, total (+21.5%) and electricity (+44.2%). In the last years the global indicators were decreasing due to less significant growth in energy consumption compared to added value and employment of the sector (figure 16).
Figure 16: Energy intensity and energy consumption per employee in services sector (2000=100)
Source: ODYSSEE
02468
101214161820
Mtoe
other
heat
electricity
gas
oil products
90
100
110
120
130
140
150
160energy intensity
electricity intensity
energy cons/emp
electricity cons/emp

Energy Efficiency Trends and Policies in ITALY 20
2.2. ENERGY EFFICIENCY POLICIES
The Budget Law 2018 confirmed the tax deduction scheme (Ecobonus) to incentivize energy renovation of the existing building stock, and introducing some new features concerning, for some specific cases, new rates of deduction, new eligible actions and/or new technical and/or performance requirements. Other important changes relate to sample checks on all interventions and significant updates on credit transfer rules. The eligible actions, the relative rates and deductions or the maximum expenses are summarized in Table 52.
Table 5: Ecobonus: eligible energy efficiency Code Action Maximum eligible
deduction (€) (^) Maximum
eligible expense (€)
Deduction (%)
344 Reduction of heating energy demand of the whole building 100,000.00 65%
345
a) insulation of vertical walls, roof, slabs (*) 60,000.00 65% b) windows and shutters replacement (*) 60,000.00 50% c) installing solar shades (*) 60,000.00 50% d) actions on common parts, involving over 25% of the building surface area 40,000.00
(#) 70% e) same actions as in d) to achieve at least the average quality as per tables 3 and 4 of Annex 1, of the Italy’s Ministerial Decree 26/06/2015 “Guidelines for the Energy Certification Decree”
40,000.00 (#) 75%
f) actions as in d) and e) implemented in seismic zones 1,2 and 3, aimed to reduce seismic risks also, resulting in one lower class of the seismic risk classification
136,000.00 (#) 80%
g) actions as in d) and e) implemented in seismic zones 1,2 and 3, aimed to reduce seismic risks also, resulting in two or more lower classes of the seismic risk classifications
136,000.00 (#) 85%
346 Installing solar panels to produce domestic hot water 60,000.00 65%
347
a) full or partial replacement of heating systems with systems equipped with (**)
i. condensing boilers that are at least class A efficient 30,000.00 50% ii. condensing boilers that are at least class A efficient and require the installation of advanced thermoregulation systems 30,000.00 65% iii. condensing hot air generators 30,000.00 65% iv. high efficiency heat pumps, with low enthalpy geothermal systems 30,000.00 65% v. hybrid appliances with heat pump integrated with a condensation boiler 30,000.00 65% vi. micro-CHP systems 100,000.00 65% vii. replacing conventional water heaters with heat pump boiler for domestic hot water 30,000.00 65%
b) installation of biomass heating system 30,000.00 50% c) installation of Building Automation systems 65%
(^) Deduction for a single building unit. (*) If the actions are on the same real estate unit, the maximum deduction is equal to 60,000 euro. (**) If the action concerns the installation of several appliances, the maximum deduction is equal to 30,000 euros, or to 100,000 euros if a micro-co-generator is installed. (#) Times the number of real estate units of the building. Source: ENEA elaboration
Expenses occurred for the replacement of heating systems with hybrid systems or condensing hot air generators can be deducted at a 65% rate. Hybrid systems are composed by a heat pump integrated with a condensation boiler, assembled in a factory and designed by the manufacturer just to work together. The new actions introduced by the 2018 budget law are: the micro-CHP systems replacing existing heating system, as long as the intervention saves primary energy by at least 20%; those able to reduce the seismic risk of one class (80% deduction), or two or more classes (85% deduction), implemented together with the interventions on common parts of the building envelope involving
2 Law 27/12/2006 n. 296 and subsequent amendments and integrations

Energy Efficiency Trends and Policies in ITALY 21
over 25% of the outer surface. Concerning the latter actions, the maximum eligible expenditure is equal to € 136,000, times the number of real estate units in the whole building. Following the changes introduced by the Budget Law, ENEA has designed and launched the new website (http://finanziaria2018.enea.it) which requires compiling a single-sheet form to access the Ecobonus, with sections and fields describing the technical aspects and occurred expenses, for all the eligible actions. The procedure automatically calculates energy savings for the most common actions implemented individually and in a single housing unit, in order to help users when they are not obliged to apply to a technician (windows replacement, installation of solar panels to produce domestic hot water, replacement of conventional boilers with heat pump boilers, replacement of heat pumps with condensing hot air generators or with high efficiency heat pumps, and installing a biomass heating system). Investments and energy savings achieved in 2017 by technology are showed in table 6: in terms of achieved energy savings the main contribution derives from the replacement of windows and shutters (584 GWh/year on over 1,300), while over a quarter of savings was achieved thanks to interventions on walls, slabs and roofs (about 350 GWh/year).
Table 6: Ecobonus: investments (M€) and energy savings (GWh/year) by technology, 2017 Year 2017 2017
Technology/action M€ % GWh/y % Walls 384.6 10.3% 146.6 11.3% Slabs and roofs 412.3 11.1% 193.6 14.9% Windows and shutters 1,736.4 46.6% 583.8 44.9% Solar thermal 50.3 1.4% 36.6 2.8% Solar shading 183.9 4.9% 25.6 2.0% Condensing boilers 633.5 17.0% 223.2 17.1% Geothermal plants 3.1 0.1% 0.5 0.0% Heat pumps 234.8 6.3% 61.3 4.7% Building automation 20.3 0.5% 10.1 0.8% Other 64.4 1.7% 20.0 1.5% Total 3,723.7 100% 1,301 100%
Source: ENEA
Concerning achieved energy savings, the trend is increasing, with 0.112 Mtoe/year in 2017. Energy savings amount to just over 0.4 Mtoe/year in the 2014-2017 period; starting from 2011, the achieved energy savings amount to 0.77 Mtoe/year; total savings are equal to 1.31 Mtoe/year since the scheme started in 2007. Around 80% of investments activated in 2017 (€ 2.9 billion out of over 3.7 overall) were dedicated to buildings built before the ‘80s; in particular, about a quarter of total resources (over 920 million euros) was allocated to buildings built in the ‘60s. Approximately 40% of investments (over 1.4 billion euros) concerned a detached or semi-detached house, while about 35% of the resources (about 1.3 billion euros) involved blocks of flats with more three floors. The Guidelines for Energy Performance Contracts (EPC) for the buildings of the public administration, developed by ENEA, are intended to provide public administrators with a tool to support and guide the drafting of energy performance contracts specific to the individual project, consistent with the latest legislation, such as Legislative Decree 50/2016 (New Code of Public Contracts), Ministerial

Energy Efficiency Trends and Policies in ITALY 22
Decree 11 October 2017 concerning the Minimum Environmental Criteria of the assignment of design and works services, the EUROSTAT and ANAC guidelines, and implementing decrees of the Ministry of Infrastructure and Transport. From a technical point of view, the energy audit plays a fundamental role both in the design phase and in the management and control phase of the Energy Performance Service: the Guidelines provide that its drafting is the responsibility of the public administration so that it can be aware of the energy status and the potential for improvement of its buildings, and so it can therefore make an unhurried decision in terms of the technical and financial convenience of the projects to improve the building's performance, which represents the fundamental of the contract, to be determined before, after and during the execution of the contract, referring to the actual use of the building and the climatic conditions of the location. The Decree 26 June 2015 “Minimum requirements” sets performance requirements in terms of primary energy for new buildings or those subject to major renovation that are more stringent by 15% compared to the previous standards and will be progressively stricter in 2017, 2019 and 2021. The Decree established the characteristics of a Nearly Zero Energy Building (NZEB). the Italian NZEB standard requires compliance with other minimum requirements in addition to the overall limit on primary energy consumption: useful thermal performance indexes, to be compared with the limit values of the reference building, the overall average heat transmission transfer coefficient, the equivalent summer solar area per unit of useful area, the performance of the winter and summer air conditioning systems and the production of domestic hot water, the limits on the transmittances of the dispersing elements. In 2017, ENEA launched a national NZEB Observatory that allowed statistics on number and type of NZEBs, information on regional policies, public and private initiatives for information and training and the state of research in the sector. From an initial estimate, based on the data of NZEB buildings with an Energy Performance Certificate (called APE in Italy) in a sample of regions (Lombardia, Piemonte, Abruzzo, Marche), the Italian NZEBs (according to the 2015 standards) in 2016-2017 period are approximately 600, mainly new (80%) and residential buildings (88%). Despite the still limited number, there is a rapid increase in NZEBs, also due to the even more stringent obligations imposed in advance with respect to the deadlines of 2019 and 2021: in Lombardia the date was brought forward to January 2016; in Emilia Romagna to 2017 for public buildings and to 2019 for others; in the province of Bolzano starting from 1 January 2015, according to local regulations.
3. ENERGY EFFIENCY IN TRANSPORT
3.1. ENERGY EFFICIENCY TRENDS
The energy consumption of transport sector amounted to 39.1 Mtoe in 2016, -1.1% compared to 2015, continuing the drop started in 2007 with the exception of 2014. The road transport is the main mode, both for passenger and freight transport: in 2016 it absorbed 84.3% of energy consumption of transport sector (down in the last years), followed by air transport (international air transport

Energy Efficiency Trends and Policies in ITALY 23
included) at 10.2% and water transport at 2.5% (figure 17).
Figure 17: Energy consumption of transport sector by mode
Source: ODYSSEE
In 2016 oil products covered 92.1% of energy consumption but their share had fallen from 97.5% in 2000. Biofuels grew rapidly until 2010 and then decreased: in 2016 the consumption was 1.0 Mtoe reaching the share of 3.7% (figure 18). The consumption of gas and electricity is constantly increasing: gas grew by over 300% in the period 2000-2016 achieving the 2.8% of sector consumption, electricity by 31.1% over the same period.
Figure 18: Energy consumption of transport sector by fuel
Source: ODYSSEE
Since 2007 the energy consumption has started to decrease because of the economic crisis: -15.8% over the period 2007-2016 and -10.6% since 2000. Over the period 2000-2016, the transport energy consumption reduced by 3.4 Mtoe (-8.0%). The variation in energy consumption is due to a drop in
05
101520253035404550
Mtoe
air transport
water
rail
road
05
101520253035404550
Mtoe
biofuels
electricity
gas
oil products

Energy Efficiency Trends and Policies in ITALY 24
the passenger and freight traffic, measured in passenger-kilometre and tonne-kilometre (activity effect equal to -1.1 Mtoe), to reductions in energy specific consumption (energy savings equal to -7.9 Mtoe) and modal shift (-2.0 Mtoe). Other effects, mainly the fall in load factors for the traffic of goods due to the economic crisis, led to an increase in the consumption (7.7 Mtoe) (figure 19).
Figure 19: Variation transport consumption – Italy – Mtoe (2000-2013)
Source: ODYSSEE
In 2016 energy consumption of road transport amounted to 33.0 Mtoe, with a decrease of 1.9% compared to 2015, confirming the negative trend in recent years interrupted only in 2014 (-15.8% between 2007 and 2016). Cars are the main transport vehicles with a consumption of 17.6 Mtoe in 2016, 53.3% of the total energy consumption (63.3% in 2000) (figure 20).
Figure 20: Energy consumption of road transport by mode
Source: ODYSSEE
Over the period 2000-2016 the energy consumption of road transport decreased by 9.7%: cars consumption reduced by 24.0% because of more efficient new cars, shift from gasoline cars to other
Variation consumption
Activity effect Energy savings Modal shift Other
-5
-4
-3
-2
-1
0
1
2
Mtoe
05
1015202530354045
Mtoe
trucks and light vehicles
buses
motorcycles
cars

Energy Efficiency Trends and Policies in ITALY 25
type of cars and the economic crisis of 2007. The other road transport modes had an increase in energy consumption (figure 21).
Figure 21: Energy consumption trends of road transport (2000=100)
Source: ODYSSEE
The energy consumption by transport mode follows the trends of passengers and goods transport (measured in passenger-kilometre and tonne-kilometre). In 2016 the passenger traffic was at the level of 2000: +0.5% in the period. The passenger traffic has increased significantly in the last years after the drop over the period 2007-2013 (equal to -15.8%). In the period 2000-2016 the cars traffic is decreased by 3.0% against a growth of 12.9% in public transport (rail and bus), reflecting a modal shift to public transport (figure 22). The main passenger transport mode is cars with 79.7% demand in 2016 (82.6% in 2000), followed by public transport with 18.3%.
Figure 22: Passenger transport by mode (2000=100)
Source: ODYSSEE
Over the period 2000-2016 freight traffic reduced by 23.6% due to a significant decrease in road
70
80
90
100
110
120
130
140 cars
motorcycles
buses
trucks, light vehicles
7085
100115130145160175190 cars
public modes
train
metro, tram
domestic air

Energy Efficiency Trends and Policies in ITALY 26
transport by 39.1%: in 2016 the goods by road transport were 60.5% of all goods against 75.9% in 2000. The water transport increased by 57.5% reaching a share of 28.4%. In figure 23 are showed the trends of goods traffic by mode and energy consumption of road and water transport.
Figure 23: Goods traffic transport by mode and energy consumption
Source: ODYSSEE
The energy efficiency index of transport sector in 2016 was 84.4, with an improvement of 15.6% over the period 2000-2016 (figure 24). The efficiency of transport sector depends mainly on the energy efficiency of transport road because cars and trucks take up over 80% of energy consumption: between 2000 and 2016 energy efficiency of cars improved by 18.9% while energy efficiency of trucks worsened by 88.6%. The other transport modes have improved in energy efficiency but their impact is limited: 51.9% for water transport, 37.1% for air transport and 13.4% for rail in the period 2000-2016.
Figure 24: Energy efficiency in transport sector (2000=100)
Source: ODYSSEE
020406080100120140160
0
50
100
150
200
250
2000=100Gtkm
road train water road EC water EC
406080
100120140160180200 transport
ODEXcars
trucks, light vehiclesrail
water
air transport

Energy Efficiency Trends and Policies in ITALY 27
3.2. ENERGY EFFICIENCY POLICIES
The National Energy Strategy 2017 foresees specific actions for the transport sector: • strengthening sustainable local mobility to reduce urban traffic and supporting the modal
switch to smart mobility (car sharing, car pooling, smart parking and bike sharing), cycle and pedestrian mobility, as well as local public transport;
• improving the energy and environmental efficiency of the national stock of cars. These measures include local energy, environmental, and pollutant emission requirements, as well as plans for building infrastructures for intermodal transport.
The Stability Law 2016 introduced incentives for the period 2016-2018 in support of combined road-rail freight goods (Ferrobonus) and road-sea freight goods (Marebonus). Marebonus3 aims to encourage the water transport instead of road transport through incentives determined on the basis of road avoided in the national territory per unit of goods. The Law has allocated 44 million euros per year in the period 2016-2018 for the implementation of new maritime services for the combined road-sea freight goods and the improvement of services on existing routes arriving and departing from ports located in Italy. Only one three-year project for each route is eligible for each shipowner and the project can’t renewed, extended or repeated. The improvement of the maritime services has to relate to at least four actions included in at least two of the following eight categories:
• improvement of the environmental impact; • sustainable reduction of the times of the intermodal transport chain, or by reducing
navigation times and/or loading and unloading times of the goods; • improvement of ground services loading and unloading of vehicles; • increase in service frequency; • improvement of on-board services during navigation; • implementation of ITS technologies; • strengthening of safety and security; • increase in hold capacity.
The object of Ferrobonus4 is the shift of goods traffic from the road to the rail through incentives to support the combined and transhipped transport on rail from and to logistics hubs and ports in Italy. It is particularly aimed at Southern Italy, where the imbalance between rail and the road is more marked. The Law has allocated 20 million per year in the period 2016-2018. The incentive is aimed at the railway companies which undertake to maintain their volume of rail traffic goods unchanged or to increase it.
3 Law 28/12/2015, art.1, comma 647 and comma 649 4 Law 28/12/2015, art.1, comma 648 and comma 649

Energy Efficiency Trends and Policies in ITALY 28
4. ENERGY EFFICIENCY IN INDUSTRY
4.1. ENERGY EFFICIENCY TRENDS
The energy consumption in industry amounted to 25.6 Mtoe in 2016, +1.4% compared to the previous year. 2016 has been a year in countertrend after the drops in energy consumption that have occurred since 2005, except for the slight growth in 2010 immediately blocked by the financial crisis on credit market and public budget started in 2011: over the period 2000-2016 the energy consumption decreased by 34.7%. The industrial production index showed the same trend (figure 25). The decrease in energy consumption involved all energy sources: over the period 2000-2016 oil
products reduced by 60%, followed by gas and coal by 50% and electricity by 21%. Only renewable sources were increasing: +131.0% reaching a consumption of 0.7 Mtoe.
Figure 25: Energy consumption in industry by fuel and industrial production index (2010=100)
Source: ODYSSEE
Electricity and gas are the main energy sources with almost 70% of total consumption in 2016: between 2000 and 2016 the share of electricity rose from 29.9% to 35.9% while the share of gas dropped from 43.4% to 33.5%. The heat consumption is growing over the period: in 2016 the consumption was 2.7 Mtoe reaching 10.7% of total energy consumption (figure 26).
020406080100120140
05
1015202530354045
2010=100Mtoe
oil products gas coal electricity heat renewables production index

Energy Efficiency Trends and Policies in ITALY 29
Figure 26: Shares of energy consumption by fuel in industry
Source: ODYSSEE
The performance in industry depends on manufacturing industry: manufacturing industry consumed 25.2 Mtoe of energy in 2016, +1.4% compared to 2015 and -35.3% over the period 2000-2016. All industrial branches showed the same trend in energy consumption: growth up to early 2000s, followed by drops with a negative peak in 2009, when all the industrial sectors had significant reductions in energy consumption. Over the period 2005-2016 decreases greater than 30% were observed for almost all branches: in particular textiles (-53,9%), and non metallic minerals (-48.0%). 2016 seems to be a turning point year: all industrial branches had an increase in energy consumption over 4% compared to 2015, with the exception of machinery (+1.9%), textiles (-0.7%), paper (-2.5%) and non metallic minerals (-7.0%) (figure 27). The first provisional data for 2017 seem to confirm the reverse trend of the sectors.
Figure 27: Energy consumption of manufacturing industry by branch
Source: ODYSSEE
17,1% 15,0% 16,2% 18,0% 16,6% 16,4% 15,6% 16,6% 17,6% 14,8% 11,3% 11,7% 11,5% 10,4% 8,7% 11,0% 10,4%
43,4% 43,6% 43,6% 42,3%36,1% 35,3% 34,8% 33,6% 31,6% 33,8% 33,7% 31,5% 32,4% 33,9% 34,5% 33,5% 33,5%
9,0% 9,8% 8,6% 9,5%9,6% 10,1% 9,6% 9,6% 9,0% 6,2% 9,3% 11,3% 10,7% 8,3% 8,3% 5,9% 6,9%
29,9% 30,8% 30,9% 29,5%29,9% 30,3% 31,7% 32,0% 32,4% 33,6% 34,1% 35,4% 34,4% 35,6% 35,9% 36,2% 35,9%
0,0% 0,0% 0,0% 0,0% 7,1% 7,3% 7,6% 7,6% 8,5% 10,0% 10,2% 8,3% 9,1% 9,7% 10,3% 10,7% 10,7%
0%10%20%30%40%50%60%70%80%90%
100%
oil products gas coal electricity heat renewables
05
1015202530354045
Mtoe
other manufacturingmachinery
non ferrous metalssteel
non metallic mineralschemicals
paper
textiles
food

Energy Efficiency Trends and Policies in ITALY 30
Industrial production decreased in the period but less than the energy consumption as evidence of improvement in energy efficiency. Energy-intensive branches absorbed over 60% of final energy consumption of industry, but their weight is decreasing: in 2016 a fifth of total consumption was consumed by primary metals, followed by non metallic minerals (18.0%), chemicals (13.7%) and paper (9.0%). The other industrial branches have used less than 10%, except for machinery (14.9%) and food (11.0%) (figure 28).
Figure 28: Shares of energy consumption by branch in industry
Source: ODYSSEE The unit consumption of steel and paper decreased by 1.6%/y and 0.7%/y, respectively, over the period 2000-2016, except during economic crisis years due to non-used production capacity resulting in a loss of energy efficiency. The unit consumption of cement reduced by 0.9%/y: it remains quite stable since 2008, is decreasing only in the last years (figure 29).
Figure 29: Unit consumption of energy-intensive products (toe/t, 2000=100)
Source: ODYSSEE
75
80
85
90
95
100
105
steel paper cement
8,9%6,9%
6,7%
15,7%
20,6%
18,1%
2,5%
13,1%
6,7%
0,4% 0,5%
2000
11,0% 4,3%
9,0%
13,7%
18,0%
18,6%
2,6%
14,9%
6,1% 0,5% 1,4%
2016
food
textiles
paper
chemicals
non metallic mineralssteel
non ferrous metalsmachinery
other manufacturingminning
construction

Energy Efficiency Trends and Policies in ITALY 31
The decrease in industry energy consumption in the period 2000-2016 amounted to 13.6 Mtoe. The reduction was mainly determined by energy savings through improvement in energy efficiency (equal to -9.5 Mtoe) and the drop in activity, especially since 2007, due to the economic crisis and the recession (equal to -8.1 Mtoe) (figure 30).
Figure 30: Variation industry consumption – Italy – Mtoe (2000-2016)
Source: ODYSSEE
In the figure 31 is shown the variation of the energy consumption before and after the crisis. The figure explains as the improvement in energy efficiency, represented by energy savings, was constant in both periods (5.26 Mtoe in 2000-2007 and 4.27 Mtoe in 2007-2016) while the reduction in activity due to the crisis had the greatest effect on the decrease of energy consumption over the period 2007-2016 (equal to 7.9 Mtoe).
Figure 31: Variation industry consumption – Italy: before and after the crisis
Source: ODYSSEE
Variation consumption
Activity Structure Energy savings Other
-16-14-12-10
-8-6-4-2024
Mtoe
-14-12-10
-8-6-4-2024
Mtoe
Variation consumption Activity Structure Energy savings Other
2000-2007 2007-2012

Energy Efficiency Trends and Policies in ITALY 32
In 2016, the energy intensity of the industry was 85.4 toe/M€2010, a slight increase of 0.5% compared to 2015: over the period 2000-2016 the intensity decreased by 27.5% (figure 32). The industry intensity was quite stable until 2005 and then decreased rapidly with the drops in energy consumption of primary metals, non metallic minerals and chemicals.
Figure 32: Energy intensity in industry sector (2000=100)
Source: ODYSSEE
The intensities of all industrial branches reduced over the period 2000-2016: the greatest drops were observed for primary metals (-53.9%), especially in the last years due to a cut in the production, textiles (-46.2%), caused by a reduction of activity and an improvement in energy efficiency especially since 2007, and chemicals (-51.1%). In 2016 the energy intensities of all industrial branches have increased except for non metallic mineral and textiles.
405060708090
100110120 industry
manufacturing
food
textiles
paper
chemicals
non metallic mineralsprimary metals
machinery

Energy Efficiency Trends and Policies in ITALY 33
Over the period 2000-2016 the energy efficiency of industry improved by 24.4%, as measured by technical ODEX, with an average rate of 1.7%/y (figure 33).
Figure 33: Energy efficiency index in industry (2000=100)
Source: ODYSSEE
All the industrial branches have improved in energy efficiency over the period 2000-2016. In the years following the crisis the improvement in energy efficiency has been slower especially for the energy intensive branches, except for chemicals, due to unused production capacity (figure 34).
Figure 34: Energy efficiency trends in industrial branches (%/year)
Source: ODYSSEE
50
60
70
80
90
100
110
120 chemicals
steel
non ferrous metalscement
paper
food
machinery
textile
industry
-6%
-5%
-4%
-3%
-2%
-1%
0%
1%
2000-2007 2007-2016
chemicals
steel
non ferrous metalscement
paper
food
machinery
textile
industry

Energy Efficiency Trends and Policies in ITALY 34
4.2. ENERGY EFFICIENCY POLICIES
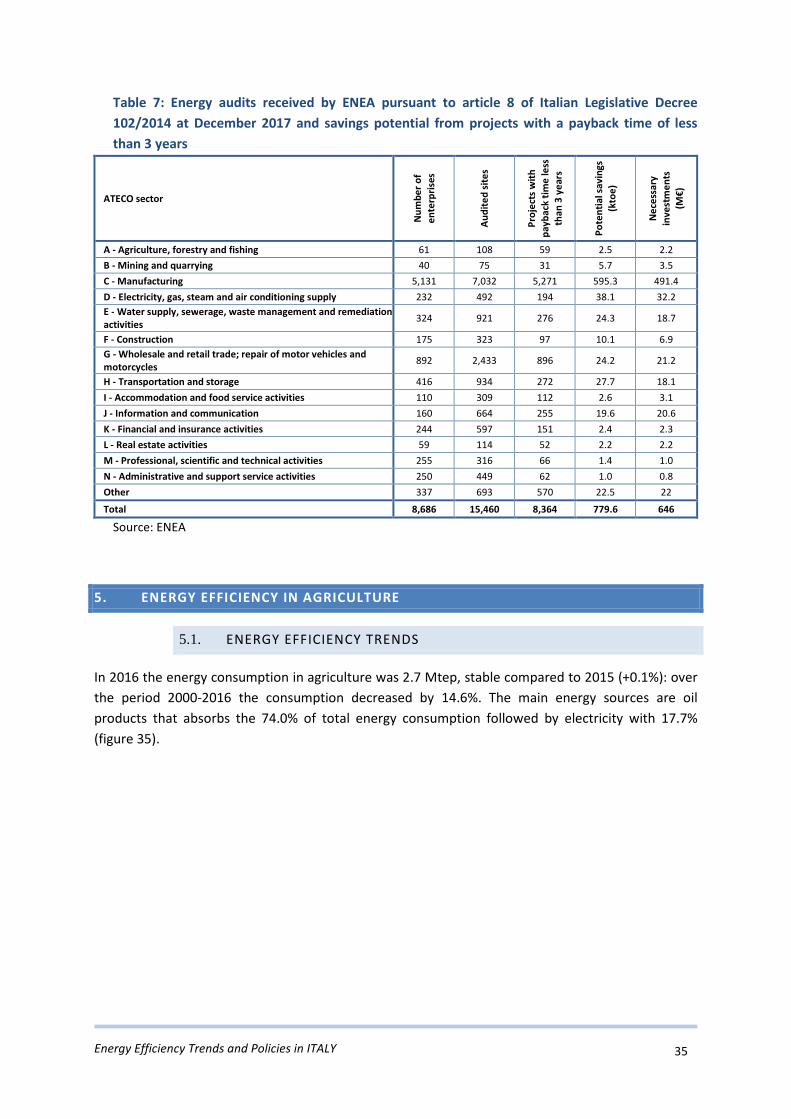
The Legislative Decree 102/2014 (art. 8, comma 10) reserves up to EUR 15 million per year over the period 2014-2020 for the co-financing of regional programmes aimed at supporting the implementation of energy diagnosis or the adoption of management systems compliant with ISO 50001 in SMEs. It is estimated that 15,000 SMEs will be involved per year and just as many energy efficiency projects will be originated by energy diagnosis. Relative to implementing article 8 of EED and its obligation to energy-intensive and large industries, at 31st December 2016, 15.154 audits were transmitted to ENEA, corresponding to 8.130 enterprises. Thanks to this result, Italy is positioned at the top of the list of more virtuous EU member states in implementing article 8 of EED and its obligation to energy-intensive and large industries. In the rest of EU, indeed, at the end of the first obligation period on December 2015, 13.000 audits were elaborated, 7.000 of which represented by audit declarations. In collaboration with the main involved stakeholders, ENEA proposed an innovative scheme to analyse the energy structure of the audited productive site, starting with the definition of a tree scheme which, by means of a multi-level procedure, allows to better define the energy performance of a plant or productive site, for each energy vector (electric, thermal, steam, hot water, etc.) purchased and used in the examined site, distinguishing annual consumption by the different users in the site itself. The high number of performed audits is very likely to be continue to grow thanks to the the compliance actions of MiSE and to the existence of a database of Small and Medium Enterprises participating to regional calls in the framework of the Decree of 12nd May 2015, aimed at favouring SMEs in realising energy audits and energy savings. 15 million euros were made available in 2015, for co-financing regional programs to incentivise energy audits in SMEs or the adoption of energy management systems conform to ISO 50001 standards. From the analysis of the received audits at the end of 2017, the potential for energy savings deriving from projects having a payback time of at most 3 years is considerable: with approximately 8,400 projects, energy savings of around 0.78 Mtoe/year are possible with around 650 million euros of investment. Approximately 5,300 projects have been identified in the manufacturing sector, for a savings of about 0.6 Mtoe/year with about 500 million euros of investments (Table 7).
Energy Efficiency Trends and Policies in ITALY 35
Table 7: Energy audits received by ENEA pursuant to article 8 of Italian Legislative Decree 102/2014 at December 2017 and savings potential from projects with a payback time of less than 3 years
ATECO sector
Numb
er of
enter
prises
Audit
ed sit
es
Projec
ts wi
th pa
yback
time l
ess
than 3
years
Poten
tial sa
vings
(ktoe
)
Neces
sary
invest
ments
(M
€)
A - Agriculture, forestry and fishing 61 108 59 2.5 2.2 B - Mining and quarrying 40 75 31 5.7 3.5 C - Manufacturing 5,131 7,032 5,271 595.3 491.4 D - Electricity, gas, steam and air conditioning supply 232 492 194 38.1 32.2 E - Water supply, sewerage, waste management and remediation activities 324 921 276 24.3 18.7 F - Construction 175 323 97 10.1 6.9 G - Wholesale and retail trade; repair of motor vehicles and motorcycles 892 2,433 896 24.2 21.2 H - Transportation and storage 416 934 272 27.7 18.1 I - Accommodation and food service activities 110 309 112 2.6 3.1 J - Information and communication 160 664 255 19.6 20.6 K - Financial and insurance activities 244 597 151 2.4 2.3 L - Real estate activities 59 114 52 2.2 2.2 M - Professional, scientific and technical activities 255 316 66 1.4 1.0 N - Administrative and support service activities 250 449 62 1.0 0.8 Other 337 693 570 22.5 22 Total 8,686 15,460 8,364 779.6 646
Source: ENEA
5. ENERGY EFFICIENCY IN AGRICULTURE
5.1. ENERGY EFFICIENCY TRENDS
In 2016 the energy consumption in agriculture was 2.7 Mtep, stable compared to 2015 (+0.1%): over the period 2000-2016 the consumption decreased by 14.6%. The main energy sources are oil products that absorbs the 74.0% of total energy consumption followed by electricity with 17.7% (figure 35).

Energy Efficiency Trends and Policies in ITALY 36
Figure 35: Energy consumption in agriculture by energy source
Source: ODYSSEE
All components of agriculture were quite stable in the period 2005-2013 after a great drop of the early 2000s (figure 36). In the last years there was a slight growth. The energy intensity reduced by 12.5% over the period as the consequence of decrease in energy consumption.
Figure 36: Energy and economic components in agriculture (2000=100)
Source: ODYSSEE, *ISTAT (Italian National Institute of Statistics)
0,0
0,5
1,0
1,5
2,0
2,5
3,0
3,5Mt
oe
renewable
heat
electricity
gas
oil products
80859095
100105110115120
energy consumption
energy intensity
production*
value added
Energy Efficiency Trends and Policies in ITALY 37
REFERENCES
(1) National Energy Strategy 2017: http://www.sviluppoeconomico.gov.it/images/stories/documenti/testo_della_StrategiaEnergeticaNazionale_2017.pdf
(2) Italian National Energy Efficiency Action Plan 2017: https://ec.europa.eu/energy/sites/ener/files/documents/it_neeap_2017_en.pdf
(3) Annual Report on Energy Efficiency 2016, results achieved and targets for 2020: https://ec.europa.eu/energy/sites/ener/files/documents/it_annual_report_2018_en.pdf
(4) Italian Energy Efficiency Annual Report 2016, ENEA (English executive summary): http://www.enea.it/it/seguici/pubblicazioni/pdf-volumi/2018/raee-2018-executivesummary-en.pdf