energy expenditure for thermoregulation and …...energy expenditure for thermoregulation and...
TRANSCRIPT

AMERICAN JOURNAL OF PHYSIOLOGY
Vol. 231, No. 3, September 1976. Printed in U.S.A.
Energy expenditure for thermoregulation and
locomotion in emperor penguins
BERRY PINSHOW, MICHAEL A. FEDAK, DONALD R. BATTLES, AND KNUT SCHMIDT-NIELSEN Department of Zoology, Duke University, Durham, North Carolina 27706
PINSHOW,BERRY,MICHAEL A. FEDAK,DONALD R. BATTLES, AND KNUT SCHMIDT-NIELSEN. Energy expenditure for thermo- regulation and locomotion in emperor penguins. Am. J. Phys- iol. 231(3): 903-912. 1976. -During the antarctic winter em- peror penguins (Aptenodytes forsteri) spend up to four mo fasting while they breed at rookeries 80 km or more from the sea, huddling close together in the cold. This breeding cycle makes exceptional demands on their energy reserves, and we therefore studied their thermoregulation and locomotion. Rates of metabolism were measured in five birds (mean body mass, 23.37 kg) at ambient temperatures ranging from 25 to -47°C. Between 20 and -10°C the metabolic rate (standard metabolic rate (SMR)) remained nearly constant, about 42.9 W. Below -1OOC metabolic rate increased linearly with de- creasing ambient temperature and at -47OC it was 70% above the SMR. Mean thermal conductance below - 10°C was 1.57 W m-2 OC-’ . Metabol’ rc rate during treadmill walking increased linearly with increasing speed. Our data suggest that walking 200 km (from the sea to the rookery and back) requires less than 15% of the energy reserves of a breeding male emperor penguin initially weighing 35 kg. The high energy require- ment for thermoregulation (about 85%) would, in the absence of huddling, probably exceed the total energy reserves.
temperature regulation; cost of transport; treadmill running; starvation
EMPEROR PENGUINS (Aptenodytes forsteri) have a unique characteristic - their breeding season coincides
with the antarctic winter. The ecology and natural his- tory of these birds have been well documented (21, 39, 46, 50), but with few exceptions their physiology has been less well studied (18, 31, 36, 37).
In mid-March, as winter approaches, emperor pen- guins leave the sea and walk over newly frozen sea ice to the rookery, which is generally situated on the sea ice where it abuts the permanent ice shelf or continental landmass (6). The distance they walk from the sea to the rookery may be between 50 and 120 km (7). At the rookery the birds court and copulate, and during the first half of May each breeding female lays a single egg. Her mate collects the egg, which he places on his feet and envelops in his brood pouch. The female is then free to return to the sea.
The males are entirely responsible for incubation, which lasts between 62 and 66 days (39). The mean air temperature during this period may be as low as -28°C (22). While incubating, the males spend much of their time huddling together in groups that may number
several thousand individuals (13, 39). The eggs hatch during the first 2 wk of July. The female usually returns to the rookery about this time with a stomach of food for the chick, but if she is delayed the male is capable of feeding the chick its first few meals with an esophageal secretion similar to pigeon milk (41).
After transferring the chick to his mate, the male walks back to the sea. The distance covered may now be considerably greater than at the beginning of the season because new ice forms as the winter progresses, and the round trip distance may exceed 200 km. After feeding, the male returns to the rookery, and both parents now begin to walk back and forth between the sea and the rookery carrying food for the chick. This shuttle service continues for about 6 mo until the chick is fledged in late December.
Emperor penguins can feed only while at sea and, therefore, must fast from the moment they leave the water to migrate to the rookery until they return to the sea. For the males this period may exceed 115 days (21).
The female, playing no part in incubation, goes without food for a considerably shorter period than the male. To sustain themselves during the long fast, emperior pen- guins have large deposits of subcutaneous and perito- neal fat, and by the end of the season they have lost up to 40% of their starting body mass (30).
Two obvious questions arise from this sequence of events. First, from an energy point of view, how do emperor penguins cope with the long fast in the cold and a 200-km walk? Second, why do they breed during the winter?
The present investigation deals with the first ques- tion, and we present data quantifying the demands made by thermoregulation and locomotion on the en- ergy reserves of emperor penguins. The study was di- vided into two parts. The first, to investigate the rela- tion of metabolic rate and thermal conductance in em- peror penguins to a wide range of ambient (air) temper- atures, and the second, to measure the energetic cost of locomotion in these birds.
MATERIALS AND METHODS
This project was undertaken at McMurdo Station (77'51 S, 166"40' E), R oss Island, Antarctica during the austral summers of 1973-74 and 1974-75.
Experimental animals. The emperor penguins we studied were captured at the edge of the annual sea ice
by 10.220.32.246 on June 28, 2017http://ajplegacy.physiology.org/
Dow
nloaded from
904 PINSHOW, FEDAK, BATTLES, AND SCHMIDT-NIELSEN
approx. 30 km north of McMurdo Station. They were transported by helicopter to McMurdo where they were maintained in a pen (4 x 5 m) built on the sea ice. When not fasting each bird was force-fed between 2 and 3 kg fish per day. The fish were either whole Trematomus borchgrevinki or slices of Dissostichus mawsoni, both caught in McMurdo Sound. Vitamins (Micebrin T, Eli Lilly and Co. and Vitamin E in 50-mg tablets) were given to the birds every other day. Fresh snow was provided daily as a water source.
During the 1973-74 season 10 birds were used for experiments. Four were taught to walk on the treadmill and were fed daily. Two of these birds were subse- quently used for the metabolic response experiments and were not fed for the 2 wk duration of those experi- ments. The remaining six birds were used to measure the decrease in body mass during fasting. During the 1974-75 season three birds were used for the metabolic response experiments. They were fed between experi- ments. All birds were released in apparently good health near the site of their capture. Sex was not deter- mined.
Units, terms, and accuracy. The International Sys- tem of Units (33) has been used throughout this paper. Where necessary, data and equations from the litera- ture have been converted to units appropriate to this system.
The word “specific” before the name of a physical quantity, meaning “divided by mass”, is used as recom- mended by the Symbols Committee of the Royal Society (47). For expressions of uncertainties in the measuring processes we follow the recommendations of Eisenhart (17) and Ku (28, 29). Propagated systematic errors are computed from estimates of the maximum error of indi- vidual measurements. Imprecision is the computed standard error of a measurement, expressed as a per- centage of that measurement. Statistical methods are those of Sokal and Rohlf (45).
Chamber and treadmiLL. Oxygen consumption was calculated from measurements made while birds either stood in a metabolic chamber or walked on a treadmill.
The metabolic chamber was built of 7.6-cm thick ure- than foam bonded between sheet aluminum. It was divided into two sections by a perforated masonite board. The upper section contained the refrigeration unit heat-exchange coil, two heating elements, and a fan. The lower section (the working chamber) was 0.91 x 0.76 m by 1.32 m high. Air was circulated in the lower section by the fan. In the side of the chamber there were two double-glazed observation ports that were normally kept covered.
Temperature in the chamber was regulated by using a modified Athena model 50 proportional temperature controller to vary the output of the two heating ele- ments while the refrigeration unit ran continuously. In this manner temperature could be varied between -50 and 30°C and could be held constant (kO.5”C) for days at a time.
During experiments in the chamber the birds stood in a cage built of Dexion angle aluminum and hardware cloth. In order for the excreta to be collected, they stood on an epoxy-coated grid over a removable stainless steel
oil pan that fitted the floor of the cage. SAE 10 W arctic motor oil was used at low temperatures since it would remain liquid to below - 20°C. At temperatures lower than -20°C the excreta would melt into the very viscous oil. At temperatures above 0°C either SAE 30 W motor oil or mineral oil was used in the pan. Condensation of atmospheric moisture on both cage and pan during weighing was found to be negligible.
To keep emissivity of the chamber walls as close to unity as possible and thereby avoid the complications caused by reflected thermal radiation (38), the walls were lined with black cloth overlaid with burlap. The mean ratio of the animals’ surface area to the surface area of the experimental section of the chamber was about 0.1. Between measurement periods the chamber door was open for as little time as possible. The chamber would return to the experimental temperature within 15 min of the door’s being closed.
For the studies of locomotion the emperor penguins were trained to walk on a treadmill (Collins model P2075HA). The tread was driven by a variable-speed motor that maintained constant set speeds. Tread speed was calculated from tread length and from the time elapsed for a counted number of revolutions. Systematic error and imprecision were both less than 1% of any measured speed.
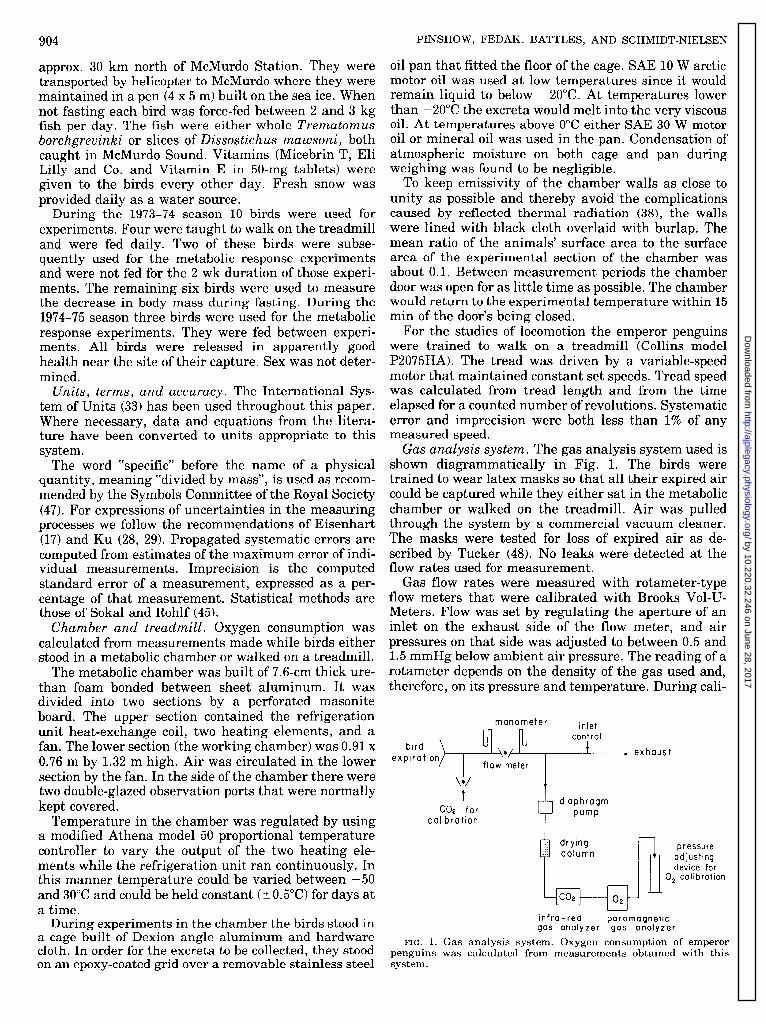
Gas analysis system. The gas analysis system used is shown diagrammatically in Fig. 1. The birds were trained to wear latex masks so that all their expired air could be captured while they either sat in the metabolic chamber or walked on the treadmill. Air was pulled through the system by a commercial vacuum cleaner. The masks were tested for loss of expired air as de- scribed by Tucker (48). No leaks were detected at the flow rates used for measurement.
Gas flow rates were measured with rotameter-type flow meters that were calibrated with Brooks Vol-U- Meters. Flow was set by regulating the aperture of an inlet on the exhaust side of the flow meter, and air pressures on that side was adjusted to between 0.5 and 1.5 mmHg below ambient air pressure. The reading of a rotameter depends on the density of the gas used and, therefore, on its pressure and temperature. During cali-
ex bird
pIrat
I
\ / 0
t
CO2 for calibration
infra -red gas analyze
exhaust
diaphragm
pump
FIG. 1. Gas analysis system. Oxygen consumption of emperor penguins was calculated from measurements obtained with this system.
by 10.220.32.246 on June 28, 2017http://ajplegacy.physiology.org/
Dow
nloaded from

ENERGY EXPENDITURE IN EMPEROR PENGUINS
bration in Durham, N.C. ambient air pressures ranged between 750 and 760 mmHg. In McMurdo ambient air pressures ranged between 740 and 755 mmHg. Calibra- tions at various pressures showed that the errors in flow-rate measurements due to absolute pressure changes in the system were less than 1% of any mea- sured value.
All flow rates could be measured with systematic error of less than 1% of measured values. Flow rates of 20-80 liter min-* (the range of flows drawn through the mask) could be measured with imprecision of less than 2%. Flows of less than 1 liter min+ (used in CO, calibra- tion) could be measured with an imprecision of 5% or less. The gas flow rates and volumes are expressed in standard temperature and pressure, dry [ STPD].
The fractional concentrations of oxygen (Fo& in the gas streams were monitored with a Beckman model G-2 paramagnetic gas analyzer that produced a full-scale response to a change from 21 to 20% 0,. Recordings were made with a Honeywell class 15 strip-chart recorder. The oxygen analyzer was regularly calibrated by chang- ing pressure in the analysis cell. This was done by inserting the sample line outlet into a water column of known depth. Fo, could be measured to a fractional concentration difference of +0.0002 in sampled air.
Carbon dioxide concentrations were measured using a Beckman model 864 infrared gas analyzer with an out- put linearizing circuit in conjunction with a Health model EU20V strip-chart recorder.
Integration of 0, and CO, recordings was done by planimetry. The CO, analyzer was calibrated each day by bleeding CO, at known flow rates into a stream of atmospheric air of known flow rate drawn in from out- side. A linear regression equation was calculated to relate fractional concentration of CO, and the deflec- tions produced on the chart recorder. Fractional concen- tration of CO, in the air coming from the animal could then be calculated using this equation.
Oxygen consumption (Vo,), taking CO2 production into account, was calculated using equation 1 of Pappen- heimer (35). Vo, could be measured with a maximum propagated systematic error of 5%. Imprecision was esti- mated to be 4% or less. The energy equivalent of 1 liter of 0, was assumed to be 20.08 kJ.
Temperatures were measured with arc-welded cop- per-constantan thermocouples in conjunction with a Leeds & Northrup Speedomax model W recording po- tentiometer. The thermocouples were calibrated against thermometers certified by the National Bureau of Standards to have a maximum systematic error of O.Ol”C. Temperature recordings had a systematic error of 0.2OC and imprecision of less than 0.1% of the absolute temperature value of any measurement.
Cloaca1 temperature was used as a measure of body temperature. Air temperature in the chamber (ambient temperature) was measured by thermocouples that were suspended midway between the bird and the wall or ceiling of the chamber and were shielded from the bird.
Evaporative water loss. Evaporative water loss was measured gravimetrically. Birds were weighed with a magnetically damped beam balance modified after
905
Krogh and Trolle (27) that had a systematic error of 0.0025 kg. Excreta were caught in a pan of oil placed under the grid on which the birds stood. The pan was weighed with an Ohaus model 119D beam balance that had a systematic error of 0.001 kg. Imprecision of both balances was less than 0.1% of any measured value.
Evaporative water loss was calculated from the equa- tion
change in body mass = mass of 0, consumed - (mass of water lost by evaporation + mass of (1) excreta + mass of CO, produced)
The equation follows from the law of conservation of matter.
Surface area. When standing still in the cold, an emperor penguin usually supports itself on a tripod consisting of its intratarsal joints (“heels”) and tail. The penguin pulls in its head, holds its wings flush with its sides and tucks its toes into its lower abdominal feath- ers. Viewed frontally or in profile the bird is elliptical; viewed from above the bird is circular. By adopting this posture an emperor penguin exposes only its feathered surface, beak, and soles of feet to the environment. It is, therefore, this surface that is relevant to the calculation of thermal conductance.
The geometric form that a standing emperor penguin most closely resembles is a prolate spheroid; penguin surface areas were therefore computed using the equa- tion
A t, = 2nr,’ + 2~ T,r., p (2) E
where Ab = surface area 7-1 = major semi-axis
r2 = minor semi-axis E = eccentricity = (r,2 - r22)1/2
P = sin-l E, E in rad
To calculate rl and r2, measurements were made of the birds’ height and largest girth.
Experimental procedures. The procedure used for measurements of metabolic response to ambient tem- perature in emperor penguins was as follows. Prior to an experiment the bird involved was fasted for a mini- mum of 60 h. To assure steady-state conditions the bird was kept at the selected experimental temperature for at least 12 h. Simultaneous measurements were then made of oxygen consumption, carbon dioxide produc- tion, and of cloaca1 and environmental temperature during three or four 2-h periods. Body mass was mea- sured at the beginning and end of each measurement period. Upon completion of the final measurement pe- riod linear dimensions of the bird were measured. The chamber was kept dark during experiments. All meas- urements were made between 0600 and 1700 McMurdo time.
In general birds would remain calm for the duration of an experiment and stand quietly in the chamber. There were, however, instances when a bird would move around a great deal, attempt to climb out of the
by 10.220.32.246 on June 28, 2017http://ajplegacy.physiology.org/
Dow
nloaded from

906 PINSHOW, FEDAK, BATTLES, AND SCHMIDT-NIELSEN
cage, or simply shuck off the mask. In such cases the they did not seem disturbed by the cold. Our failure to data were discarded. make measurements at still colder temperatures was
Oxygen consumption during walking was measured due to technical rather than biological problems. over the full range of speeds that the birds would The linear regression equations for the relation of maintain for at least 20 min. Data were used only metabolic rate to ambient temperature for the above when the bird was observed to be walking steadily and two ranges are given in Table 1, A. The lines for the the measured Fo, was nearly constant. No attempt was two equations intersect at -10.5”C. Therefore, we con- made to match the air speed past the bird to tread speed (19). Emperor penguins walked at ambient tem- 90‘ I I I I I I 1 I I peratures of -5 to 10°C. The masks worn while walk- ing were supported by a pulley system and counter- 80- 0 \
weighted to minimize interference with the animal. :.. \ \
3 TO- O 0 \ 0 0 0 \ RESULTS
0 p 60- a \
Metabolic response to ambient temperature. Meta- a
bolic rate was measured at ambient temperatures from [r 50-
25 to -47°C (Fig. 2). At ambient temperatures above 0
__*\____j# I
0 l l S ’ .% s’ 0 0 0 \. --- 0 0 0 0
2 40- : 0 8 .
0 0. 20°C both body temperature and metabolic rate in- creased, and the birds were restless and appeared to be stressed. At ambient temperatures between 20 and - 10°C metabolic rate remained relatively constant (mean, 42.87 W, SD, 3.69, n, 52). We consider this temperature range to be the thermoneutral zone and the metabolic rate to be the standard metabolic rate
: = 30-
2 ZO-
IO-
0 0 0 0
(SMR) as defined by Bligh and Johnson (4). A linear regression equation was calculated for the 52 data points in this range (Table 1, A). Values computed using this equation differ from the computed mean SMR by 1% or less.
01 I I I I I 1 I I -50 -40 -30 -20 -IO 0 IO 20 30
AMBIENT TEMPERATURE “c
FIG. 2. Relation between metabolic rate and ambient tempera- ture for emperor penguins. Each point represents mean of 3 or 4 measurements, each 2 h long, made on 1 bird after a 12-h acclimation
Between -10 and -47°C the metabolic rate in- period at experimental temperature. The 2 solid lines represent
creased with decreasing ambient temperature, and at linear regression equations calculated for our data. The 2 dashed
-47°C it was about 70% above the SMR. In this range lines represent linear regression equations calculated by Le Maho et
113 data points were obtained. Although the birds al. (32) for emperor penguins in outdoor conditions. Statistical infor-
shivered visibly at ambient temperatures below -10°C mation pertaining to birds we used for measurement and to calcu- lated 1 inear regression equations are to be found in Table 1, A.
TABLE 1. Equations for regression lines relating metabolic rate to ambient temperature and to walking speed for emperor penguins*
Temp, “C n Body Mass, kg Regression Equation,
y=b+ax -bla r SD,, SD, SD v SD, SE:,,, df F
A) Resting metabolic rate 20to -10 52 Mean 23.37 y = 42.83 + 0.01x 0.02 0.05 0.54 3.77 9.81 3.80 1,50 0.03
-10 to -47 113 Range, 20.5 - 28.6 y = 33.87 - 0.84~ 40.32 -0.81 0.06 1.80 11.14 10.78 6.53 1,111 215
B) Specific resting metabolic rate
20to -10 52 Mean, 23.37 y = 1.98 + o.oolx 0.08 0.002 0.02 0.15 9.81 0.15 1,50 0.35 -10 to -47 113 Range, 20.5 - 28.6 y = 1.46 - 0.037x 39.46 -0.79 0.003 0.09 0.50 10.78 0.31 1,111 180
C) Walking metabolic rate
Speed, m s-l Y = 47.32 + 189.9% 0.81 0.48 10.05 35.64 0.15 21.26 1,45 86 0.20-0.80 47 Mean, 20.79
Range, 18-22
D) Specific walking metabolic rate
0.20-0.80 47 Mean, 20.79 Y = 2.56 + 8.52x 0.81 0.90 0.44 1.61 0.15 0.94 1,45 89
Range, 18-22
A ) Equations relating metabolic rate to ambient temperature for emperor penguins. y = metabolic rate in W; x = ambient temperature in “C; a = slope in W “C-l; b = intercept at 0°C; -b/a = ambient temperature at y = 0. B) Equations relating specific metabolic rate to ambient temperature for emperor penguins. y = specific metabolic rate in W kg-‘; a = slope in W kg-’ “C-l; X, b, and -b/a as in A. C) Equation relating metabolic rate to walking speed for emperor penguins. y = metabolic rate in W; x = walking speed in m s-l; a = slope in J m-l; b = intercept at zero speed. D) Equation relating specific metabolic rate to walking speed for emperor penguins. y = specific metabolic rate in W kg-‘; a = slope in J kg-’ m-l; x and b as in C. Statistics: r, product moment correlation coefficient; SD, standard deviation of subscripted value; SE,, , standard error of the estimate; df, degrees of freedom for f statistic; F, F statistic for linear term. * See Figs. 2 and 5.
by 10.220.32.246 on June 28, 2017http://ajplegacy.physiology.org/
Dow
nloaded from

ENERGY EXPENDITURE IN EMPEROR PENGUINS
sider the lower critical temperature to be about -1OOC (Fig. 2).
Although there may be no clear breakpoint in the relation of an animal’s metabolic rate to ambient tem- perature (see DISCUSSION) it is convenient, for the pur- pose of comparison, to express the data with two least- squares linear regression lines, as has been done above-one line for the relation between metabolic rate (MR) and ambient temperature (T,) in the ther- moneutral zone, and one line for the relation between MR and T, below the lower critical temperature (T,). If one chooses to display the data in this manner, one must decide which data to use for the calculation of each line. Often this is done by inspection, but a stand- ardized and statistically satisfactory procedure is to be preferred. We proceeded as follows.
A range of temperatures was chosen that was broad enough to clearly include the lower critical tempera- ture. The data points were then divided into two groups, an upper temperature group and a lower tem- perature group, and the corresponding pair of linear regression lines and their pooled mean square (PMS)’ were calculated. This process was repeated for all pos- sible divisions of the data within the chosen range of temperatures. The intersect of the two regression lines that had the smallest PMS was considered to be the lower critical temperature.
Mean respiratory quotient (RQ) (rate of CO, produc- tion/rate of 0, comsumption) for all measurements of metabolic rate was 0.73 (SD, 0.09, n, 171).
Body temperature. Cloaca1 (body) temperature in in- dividual birds was found to vary little over the range of experimental ambient temperatures (20 to - 47°C). Also, little variation among the birds was observed. The mean body temperatures (T,) for five birds were
I) $,, 37.6”C; SD, 0.3; n, 17 2) Tb, 380°C; SD, 0.3; n, 17 3) $,, 372°C; SD, 0.3; n, 39 4) ‘$,, 37.8”C; SD, 0.3; n, 43 5) Tb, 380°C; SD, 0.3; n, 40
The overall mean for all five birds was 37.8”C (SD, 0.3; n, 156). This value is lower than the range of values reported by Boyd and Sladen (5) of 38.4-38.7”C for te- lemetered abdominal temperatures in emperor pen- guins, and differs significantly ( ts9, 3.77; P < 0.01) from the stomach temperatures (mean, 38.2”C; SD, 0.63; n, 36) reported by Le Maho et al. (32). A discussion of body temperature measurements in penguins appears to Le Maho et al. (32).
Evaporative water loss. The rate of evaporative water loss as a function of ambient temperature is plotted in Fig. 3. Between -47 and 20°C water lost by evaporation varied between 0.5 and 15 g h-l (mean, 5.85 g h-l; SD, 3.35; n, 123). Above 20°C evaporative water loss in- creased, and at 25°C for one bird it was 28.44 g h-l, which is almost 5 times the mean rate. For the calcula- tion of thermal conductance, which follows, it was as-
’ PMS = (RSS, + RSS,)/(df, + df& where RSS = residual sum of squares; df = degrees of freedom of the RSS; and subscripts 1 and 2 refer to the two lines involved.
w ” -50 -40 -30 -20 -10 0 10 20 30 AMBIENT TEMPERATURE “C
FIG. 3. Relation between evaporative water loss and ambient temperature for emperor penguins. Points correspond to those in Fig. 2 and 4. Details in text. Evaporative water loss is converted to
evaporative heat transfer on right ordinate, assuming 2.43 kJ are required to evaporate 1 g water.
sumed that the vaporization of 1 g of water requires 2.43 kJ
S,rface area. Body surface area (Akj) has calculated from the linear measurements of three birds during the 1974-75 season. Their mean calculated surface areas and mean body masses (fi) were:
I> Ab, 0.52 m*; fi, 21.91 kg 2) Ab, 0.53 m2; ti, 23.61 kg 3) A,,, 0.49 m2; fi, 20.57 kg
Assuming that body surface area is related to body mass by Ab = k m”-GG7 (after Meeh, 1894, quoted in Kleiber (25)) a value for k was calculated for each pen- guin. The mean k, 0.065 (SD, O.OOl), was then used to estimate, from their body mass, the surface area of the two penguins used in the 1973-74 season. The estimated values of surface area were used in conductance calcula- tions for these two birds.
The surface areas we calculated are somewhat smaller than those given by Le Maho et al. (32). They measured the body surface areas of five dead, unplucked emperor penguins by planimetry and found a mean of 0.64 m2 (SD, 0.5). The mean body mass of these birds was 23.96 kg (SD, 4.57), three of the birds being over 25 kg. Their measurements included the beak and feet.
Thermal conductance. Thermal conductance was cal- culated using the equation from Dawson and Schmidt- Nielsen (15). Between -47 and -1OOC thermal conduct- ante remained essentially unchanged at 1.57 W rns2 OC+ (SD, 0.23; n = 73) (Fig. 4). From -10 to 25OC thermal cond uctan ce increa .sed with i ncreasing ambient tempera ture. The highest observed thermal conduct- ance was 4.90 W rnw2 ‘C-l at an ambient temperature of 25°C. This is about 3 times the lowest thermal conduct- ance measured in the same bird at - 15°C.
Decrease in body mass during fasting. Decrease in body mass was measured in six emperor penguins. They were weighed 4 days after capture (mean starting mass, 26.21 kg; SD, 2.41). For 19 days they were retained in a 4 x 5 m enclosure and fresh snow was supplied daily. The weather during this period was mild, with air tempera-
by 10.220.32.246 on June 28, 2017http://ajplegacy.physiology.org/
Dow
nloaded from

c) 0
5
OJ
‘E
3”
0
* 0’ I I ! I j 1
-50 -40 -30 -20 -10 0 10 20 30
AMBIENT TEMPERATURE ‘C
FIG. 4. Relation between thermal conductance and ambient tem- perature for emperor penguins. Points correspond and 3. Detai 1s in text.
to those in Figs. 2
tures ranging from -15 to 0°C. They were then re- weighed (mean, 21.74 kg; SD, 1.16). The mean daily decrease in body mass was 0.235 kg (SD, 0.049). This is nearly the same mean daily decrease in body mass as the 0.239 kg measured in unrestrained emperor pen- guins with a mean initial body mass of 25 kg during the summer by Le Maho et al. (32).
Energy cost of walking. The relation between specific metabolic rate and walking speed in the emperor pen- guins is plotted in Fig. 5. The specific metabolic rate was found to increase linearly with increasing walking speed over the range of speeds that the birds maintained for 20 min or more. Table 1, D lists the equation relating specific metabolic rate to walking speed for these birds and information about their body masses during the experiments. The mean resting specific metabolic rate was 1.81 W kg-* (SD, 0.25; n = 27). This was determined while the birds stood quietly on the stationary tread. The birds had not been fasting and were in a brightly lit room.
From Fig. 4 it is possible to obtain two quantities: a) the specific energy cost of transport (E,), and b) the change in metabolic rate with a change in walking speed, which is the slope of the regression line (E,) (19).
The specific energy cost of transport is the energy used perunit body mass while walking 1 m at a particu- lar speed, e.g., for emperor penguin with a mass of 20.80 kg walking at 0.56 m s-l, the specific energy cost of transport would be 7.33 W kg-l divided by 0.56 m s-l, or 13.09 J kg-* m-l. The slope of the regression line (E, = 8.52 J kg-’ rn-‘> has the same units as the cost of transport but its value remains constant regardless of speed. The usefulness of the quantity E, for comparing the energetics of locomotion in different animals has been pointed out (43).
DISCUSSION
PINSHOW, FEDAK, BATTLES, AND SCHMIDT-NIELSEN
regression line extrapolates to a value of T, equivalent to body temperature at MR = 0. The usefulness of this scheme is that one can make interspecific comparisons, e.g., one can identify a lower critical temperature from the intersection of regression lines. However, care should be taken when making such comparisons. As pointed out by King (24) and Calder and King (11) the transition region of critical temperature is probably curvilinear rather than abrupt, and the concept of a single critical temperature is therefore an oversimplifi- cation. Also, for some birds the extrapolated T, at MR = 0 differs widely from the temperature predicted on the basis of the Scholander model (e.g., 12, 20).
With the above reservations in mind, it appears from the data presented (Fig. 2 and Table 1, A) that the metabolic response to ambient temperature in emperor penguins conforms reasonably well to the Scholander model. The relationship between metabolic rate and ambient temperature below the lower critical tempera- ture can be regarded as linear and the regression line extrapolates to 40.3”C at MR = 0, which is close to the mean measured Tt, of 37.8”C.
Another useful method of making interspecific com- parisons among animals is through the use of allometric equations. Calder (10) has recently reviewed allometric relations pertaining to avian energetics and we shall use such equations to compare emperor penguins with other birds.
Lasiewski and Dawson (30) compiled data on the standard metabolic rate in 58 species of nonpasserine birds ranging in mass from 0.003 to 100 kg. Their eaua-
I
* I I I I I I I I
0 0
1;14
1 / -0 /
/ 0
03 /
/ IL /
O2 kf P
-mean resting metabolic rote21 s.d.
tn
1 t Metabolic response to ambient temperature. In recent
years there has been much discussion concerning the use of the physical model for homeothermy developed by Scholander et al. (44) (e.g., 3, 9, 12, 25, 26).
This model assumes a) that there is a linear relation- ship between metabolic rate and ambient tern .perature below the lower critical temperature, and b) that the
0 0.1 0.2 0.3 0.4 0.5 0.6 0.7 0.8 SPEED m s-1
FIG. 5. Relation between specific metabolic rate and walking speed for emperor penguins. (“Specific” is used as recommended by the Symbols Committee of the Royal Society (47) and means “divided by mass”.) Resting specific metabolic rate was measured while birds stood quietly on stationary tread. See Table 1, D for information on body mass of birds used for measurement and for statistical informa- tion pertaining to calculated regression equations.
by 10.220.32.246 on June 28, 2017http://ajplegacy.physiology.org/
Dow
nloaded from
ENERGY EXPENDITURE IN EMPEROR PENGUINS 909
tions for the relation of standard m mass in these birds is
.etabol .ic rate to body
SMR = 3.79 m0-723 (3)
where SMR is in W and m is in kg. Aschoff and Pohl (1) have revised this equation. They
distinguish between standard metabolic rate during the activity and the resting phases of a bird’s daily cycle. Their equation for nonpasserine birds in the activity phase is
SMR = 4.41 m0-72g (4)
with units as above. The standard metabolic rates predicted for a 23.37 kg
bird (mean mass of the emperor penguins used in this study) by these two equations are 37.0 W and 43.87 W, respectively. The former predicted value is 14% smaller than the standard metabolic rate of 42.87 W measured for emperor penguins in this study, whereas the latter predicted values is about equal to the measured value.
In comparing our data with those of Le Maho et al. (32) some striking differences are apparent (Fig. 2). The value of the slope of the line relating MR to T, below the T, as measured for emperor penguins by Le Maho et al. is 1.7 times that measured in this study. The variances about the two lines are unequal (Bartlett’s test: x2, 9.14; P < O.Ol), the slopes differ significantly (Fl,lgl = 10.55; P < 0.01); and the elevations differ significantly (F,,,,, = 121; P < 0.01). Also the mean resting MR measured by Le Maho et al. (in the thermoneutral zone) is signifi- cantly different (14% greater) from the SMR measured in this study (tgg = 5.77; P < 0.01).
These differences are not very surprising and may be attributed to a variety of causes. The present study was conducted in a laboratory situation, whereas Le Maho et al. made all their measurements on birds that stood outdoors, under field conditions, during experiments. The birds used by those investigators were exposed to radiation temperatures that might differ markedly from the measured air temperatures. Also, the birds used by them stood on ice duri ng experimen .ts, and, therefore, might have lost more heat through conduct ion to the substrate then the birds we used, which stood on an epoxy-coated steel grid. The birds used by Le Maho et al. were acclimatized to the conditions under which measurement took place, whereas the birds used in the present study were all acclimatized to summer condi- tions and only exposed to the experimental conditions for 12 h prior to measurement. Their birds were of significantly larger mass (mean, 25.09 kg; SD, 3.14; n = 15) than the birds used in the present study (mean, 23.37 kg; SD, 2.31; n, = 52) (ts5 = 3.54, P < 0.01). The birds of Le Maho et al. were fasted for the entire duration of experiments, and, therefore, underwent marked de- crease in body mass; our birds either fasted for a rela- tively short period or were fed between experiments. The different types of masks used in th .e two studies might have had different effects on heat loss from the bird’s head, and, in addition, Le Maho et al. used a semirestraining device while we did not. Finally, stress caused to the birds by the different techniques might have affected the metabolic measurements differently.
The number of possible variables is large and we do not have enough information to separate them and assess their individual influences on the measurements.
Jarman (22) has calculated various thermoregulatory parameters for emperor penguins, but since he made no metabolic measurements, we do not consider his results comparable with those of Le Maho et al. (32) or with our own.
Evaporative water Loss. Crawford and Lasiewski (14) have compiled data for rates of evaporative water loss in 41 species of nonpasserine birds ranging in mass from 0.003 to 100 kg. The values are for resting birds at ambient temperatures within or below their respective zones of thermoneutrality. Their equation relating evaporative water loss (W) to body mass is
where W is in g Hz0 h-l and m in kg. Thus calculated, the rate of evaporative water loss for
a 23.37 kg nonpasserine bird would be 6.97 g Hz0 h-l. This is 19% greater than mean W of 5.85 g Hz0 h-l measured in this study for emperor penguins at temper- atures in and below their thermoneutral zone. It is probable that emperor penguins are able to conserve water by cooling exhaled air in the nasal passageways as do Adelie and Gentoo penguins (34).
Thermal conductance. To evaluate the rate of heat flow between an animal and the environment it is often useful to consider heat transfer in terms of thermal conductance, which is an expression of the sum of heat losses or gains through convection, conduction, and ra- diation.
A difficulty in comparing thermal conductances in different species is that one of the parameters called for in the calculation is surface area. Surface area is almost never measured directly. For birds it is traditionally calculated using an allomertric equation known as Meeh’s formula:
A b = k mO.667
(6)
where Ah = surface area in square meters and m = body mass in kilograms (Meeh, 1897, quoted from Kleiber (25)). Benedict (2) supplied a value of k = 0.1 for birds. Drent and Stonehouse (16) have demonstrated that for many birds the surface area predicted by the Meeh equation, using k = 0.1, is a close approximation to that measured from skins by various techniques. They do, however, point out that penguins were not used in their study and “. . . penguins must be as far removed from the standard configuration as is any bird.” Use of the Meeh formula, with k = 0.1, to predict the surface area of a 23.37-kg bird gives a value of 0.82 m2. This is 55% greater than the 0.53 m2 we estimated for a 23.37-kg emperor penguin using k = 0.065.
Drent and Stonehouse (16) have compiled a list of thermal conductance values at lower critical tempera- tures for 63 species of birds. The values range between 0.89 and 2.48 W mm2 ‘C-l, the exceptions being the extremely high values for two finches measured by Cade et al. (8). The only value listed by Drent and Stonehouse for a penguin is from their own study on the Peruvian penguin, Spheniscus humboldti (mean mass,
by 10.220.32.246 on June 28, 2017http://ajplegacy.physiology.org/
Dow
nloaded from

910 PINSHOW, FEDAK, BATTLES, AND SCHMIDT-NIELSEN
3.87 kg), for which they measured 0.94 W m-” OC+. This is some 40% lower than the 1.57 W rn+ ‘C-l calculated here for the emperor penguin.
Despite their statement to the effect that penguins are not shaped like the birds from which K = 0.1 was derived, Drent and Stonehouse used this constant in the Meeh equation to predict the surface area of the Peru- vian penguin. The surface area of a 3.87kg bird, accord- ing to the Meeh equation, is 0.25 m2. If one assumes that the Peruvian penguin is isometric with the emperor penguin, and if one uses the K value of 0.065 estimated for the emperor penguin, then a 3.87kg penguin would have a surface area of 0.16 m? Thermal conductance for the Peruvian penguin, using this estimate for surface area, would be 1.47 rn-” ‘C-l, an estimate 56% greater than the 0.94 W rn+ O C-l computed by Drent and Stone- house.
Am = E,FAt (7)
According to modeZ 1 it would cost an emperor penguin 1.47 kg of fat to walk 200 km at 0.56 m s-l.
lModeZ 2. This model follows the reasoning of Tucker (49). Here it is assumed that the specific energy cost of transport (EJ is constant and that as the animal’s mass changes the whole animal energy cost (et) changes pro- portionately. E, is calculated from equation D in Table 1. The rate of mass loss is proportional to metabolic rate.
By definition
d.nz/dt = -F MR (8)
E, = MRIm u, (9)
Substituting for MR
To sum up: Judging from the exceedingly cold condi- tions in which emperor penguins live, one might expect to find that they have physiological characteristics sharply distinguishing them from other birds. For in- stance, emperor penguins might have a thermoneutral zone extending to extremely low temperatures, i.e., have a very low thermal conductance. From the data presented, this does not seem to be the case. With respect to thermoregulation, emperor penguins appear to fit what might be expected for any bird of the same body mass, and their thermal conductance is not excep- tionally low. However, due to their body shape, emperor penguins have a surface area somewhat smaller than might be expected for a bird of similar mass and more conventional shape.
Energy cost of waZking. It is interesting to calculate the energy requirement for the emperor penguin’s long walk in terms of tissue utilized as fuel. Two simple models for doing this are discussed. The first model assumes that the energy cost of walking for an emperor penguin remains constant while body mass changes. The second model assumes that the energy cost of walk- ing is proportional to body mass. The “true” cost is likely to fall between the values calculated by the two models.
dmldt = -F E,m u,
The solution to this differential equation is
(10)
mu, = m(o) exp (-F E,u,t) (11)
where rn((,) is the penguin’s mass at the beginning of the walk, and rnttJ its mass after walking for time t.
If At is the total duration of the walk, then Am, the total mass loss in At, is
Am = m(,) - m(&) = rnfo) [ 1 - exp (- F E,u,At)] (12)
According to modeZ 2, the cost for an emperor penguin, with an initial body mass of 35 kg, to walk 50 km to the rookery at 0.56 m s-l would be 0.61 kg of fat. Then, after a long fast, with its mass reduced by 40% to 21 kg it would cost the bird 1.08 kg of fat to walk 150 km back to the sea at the same speed. In total, it would cost 1.69 kg of fat to walk 200 km.
In both models the calculations are made for an em- peror penguin that walks 200 km at constant speed (u,) of 0.56 m s-l (2 km h-l). This is a representative speed chosen on the basis of our treadmill data and our own subjective observations of birds walking in the wild. We are unaware of any reliable field measurements of em- peror penguin walking speeds. It is assumed that all of the energy used for the walk is derived from the catabo- lism of fat and that the catabolized tissue has an energy density of 3.77 x lo7 J kg-l, similar to that of migrating birds (23, 42). Thus, the mass loss per joule of energy produced, F, is 2.66 x lOAs kg.
When calculating the mass loss associated with the long walk we should also consider that an emperor penguin might leave the sea at the start of the breeding season with a stomach filled with fish (39), or that there might be cracks in the sea ice large enough for an emperor penguin to feed in on its way to and from the rookery. Furthermore, some of the energy required for the walk might be derived from the catabolism of sub- stances other than fat (e.g., glycogen, protein) with energy densities different from that of fat.
In conclusion, the rate of decrease in body mass of emperor penguins reported in this study is in accord with previous investigators who have measured rates of mass decrease in these birds under a variety of circum- stances (32, 39, 40). Their findings can be summarized as follows: nonmolting emperor penguins, fasting dur- ing the summer, lose between 0.23 and 0.25 kg/day. During the winter, if separated from the rookery, males lose between 0.20 and 0.30 kg/day; however, huddling males may lose as little as 0.12 kg/day.
lModeZ 1. It is assumed that the energy cost for an From these data we can calculate that a single iso- emperor penguin to walk 1 m at a particular speed (et) is lated male emperor penguin would require about 25 kg independent of changes in body mass and, therefore, of tissue for a fast lasting 100 days. In addition, about remains constant. This whole-animal cost is calculated 1.5 kg of fat is needed for a 200-km walk. As a large from equation C in Table 1 (estimated from penguins penguin carries between 15 and 20 kg of tissue in re- with a mean body mass of 23.37 kg). Thus the total mass serve, the calculated energy requirement of a lone pen- lost (Am) during a walk of duration At would be: guin would exceed its reserves. It is apparent that col-
by 10.220.32.246 on June 28, 2017http://ajplegacy.physiology.org/
Dow
nloaded from

ENERGY EXPENDITURE IN EMPEROR PENGUINS
lective thermoregulation through huddling is an impor- tant method of energy conservation for the incubating males. By huddling they reduce the surface area ex- posed to the environment. Thus, the male emperor pen- guin can reduce its energy consumption considerably, to about 12 kg of tissue for the loo-day fast. It is therefore able, with some leeway, to complete the long fast as well as a ZOO-km walk.
We gratefully acknowledge access to the original data of Le Maho et al. (32).
We thank Dr. Ernest Elsevier of the Dept. of Mechanical Engi-
REFERENCES
1. ASCHOFF, J., AND H. POHL. Der Ruheumsatz von Vogeln als Funktion der Tageszeit und der Korpergrosse. J. OrnithoZ. 111: 38-47, 1970.
2. BENEDICT, F. G. Die Oberflachenbestimmung verscheidener Tiergattungen. Ergeb. Physiol., Biol. Chem. Exptl. Pharmakol. 36: 300-346, 1934.
3. BIRKEBAK, R. C. Heat transfer in biological systems. Intern. Rev. Gen. ExptZ. ZooZ. 2: 269-366, 1966.
4. BLIGH, J., AND K. G. JOHNSON. Glossary of terms for thermal physiology. J. AppZ. PhysioZ. 35: 941-961, 1973.
5. BOYD, J. C., AND J. L. SLADEN. Telemetry studies of the internal body temperature of Adelie and emperor penguins at Cape Cro- zier, Ross Island, Antarctica. Auk 88: 366-380, 1971.
6. BUDD, G. M. The biotopes of emperor penguin rookeries. Emu 61: 171-189, 1961.
7. BUDD, G. M. Population studies in rookeries of the emperor penguin Aptenodytes forsteri. Proc. ZooZ. Sot. Lond. 139: 26% 288, 1962.
8. CADE, T. J., C. A. TOBIN, AND A. GOLD. Water economy and metabolism of two estrildine finches. Physiol. ZooZ. 38: 9-33, 1965.
9. CALDER, W. A. Body weight and the energetics of temperature regulation: A re-examination. J. Exptl. BioZ. 56: 775-780, 1972.
10. CALDER, W. A. Consequences of body size for avian energetics. In: Auian Energetics. Cambridge, Mass.: Nuttall Ornithological Club, 1974, p. 86-151.
11. CALDER, W. A., AND J. R. KING. Thermal and caloric relations of birds. In: Auian Biology, edited by D. S. Farner and J. R. King. New York: Academic, 1974, vol. 4, p. 259-413.
12. CALDER, W. A., AND K. SCHMIDT-NIELSEN. Temperature regula- tion and evaporation in the pigeon and the roadrunner. Am. J.
Physiol. 213: 883-889, 1967. 13. CENDRON, J. The visite hivernale a une roockerie de Manchots
empereurs. La Terre et La Vie 2: 101-108, 1952. 14. CRAWFORD, E. C., AND R. C. LASIEWSKI. Oxygen consumption
and respiratory evaporation of the emu and rhea. Condor 70: 333-339, 1968.
15. DAWSON, T., AND K. SCHMIDT-NIELSEN. Effect of thermal con- ductance on water economy in the antelope jack rabbit, Lepus aLLeni. J. CeZZuZar Comp. Physiol. 67: 463-471, 1966.
16. DRENT, R. H., AND B. STONEHOUSE. Thermoregulatory responses of the Peruvian penguin, Spheniscus humboLdti. Comp. Bio- them. Physiol. 40A: 689-710, 1971.
17. EISENHART, C. Expression of the uncertainties of final results. In: Precision Measurement and CaZibration. StatisticaL Concepts and Procedures. Washington, D.C.: Natl. Bur. Standards Spec. Publ. 300, 1969, vol. 1, p. 69-72.
18. FEDAK, M. A., B. PINSHOW, AND K. SCHMIDT-NIELSEN. Emperor and Adelie penguins: energy cost of walking. Antarctic J. US 9: 97-98, 1974.
19. FEDAK, M. A., B. PINSHOW, AND K. SCHMIDT-NIELSEN. Energy cost of bipedal running. Am. J. PhysioZ. 227: 1038-1044, 1974.
20. HART, J. S. Seasonal acclimatization in four species of small wild birds. Physiol. ZooZ. 35: 224-236, 1962.
21. ISENMANN, P. Contribution a l’ethologie et a l’ecologie du Man- chat empereur (Aptenodytes forsteri, Gray) a la colonie de Pointe Geologie (Terre Adelie). L’Oiseau et Reu. Franc. OrnithoZ. 41, no. special: 9-64, 1971.
911
neering at Duke University for his kind help in solving our refriger- ation problems.
We also thank Aeronca Environmental Control, Inc. of Pineville,
N. C. for the excellent metabolic chamber they build for us at no charge.
This work was supported by National Science Foundation Grant GV-39184 and National Institutes of Health Research Career Award l-K6, GM-21, 522 to K. Schmidt-Nielsen.
B. Pinshow’s present address: Dept. of Zoology, Univ. of Wiscon- sin, Madison, Wise. 53706.
M. A. Fedak’s present address: Concord Field Station, Harvard Univ., Old Causeway Road, Bedford, Mass. 07130.
Received for publication 2 February 1976.
22. JARMAN, M. Experiments on the emperor penguin, Aptenodytes forsteri in various thermal environments. Brit. Antarct. Survey BUZZ. 33, 34: 57-63, 1973.
23. JOHNSTON, D. W. Caloric density of avian adipose tissue. Comp. Biochem. PhysioZ. 34: 827-832, 1970.
24. KING, J. R. Oxygen consumption and body temperature in rela- tion to ambient temperature in the white crowned sparrow.
Comp. Biochem. PhysioZ. 12: 13-24, 1964. 25. KLEIBER, M. The Fire of Life. An Introduction to AnimaZ Ener-
getics. New York: Wiley, 1961, 454 p. 26. KLEIBER, M. Body size, conductance for animal heat flow and
Newton’s law of cooling. J. Theoret. BioZ. 37: 139-150, 1972. 27. KROGH, A., AND C. TROLLE. A balance for the determination of
insensible perspiration in man and its use. Skand. Arch. Phys- ioZ. 73: 159-162, 1936.
28. Ku, H. H. Expressions of imprecision, systematic error and uncertainty associated with a reported value. In: Precision Meas- urement and CaZibration. StatisticaL Concepts and Procedures.
Washington, D.C.: Natl. Bur. Standards, Spec. Publ. 300, 1969, vol. 1, p. 73-78.
29. Ku, H. H. Notes on the use of propagation of error formulas. In: Precision Measurement and CaZibration. StatisticaL Concepts and Procedures. Washington, D.C.: Natl. Bur. Standards, Spec. Publ. 300, 1969, vol. 1, p. 331-341.
30. LASIEWSKI, R. C., AND W. R. DAWSON. A re-examination of the relation between standard metabolic rate and body weight in birds. Condor 69: 13-23, 1967.
31. LE MAHO, Y., AND P. DELCLITTE. Etude de la regulation ther- mique du Manchot empereur ( Aptenodytes forsteri G.) dans les conditions ambiantes naturelles. Compt. Rend., 278: 2553-2556,
1974. 32. LE MAHO, Y., P. DELCLITTE, AND J. CHATONNET. Thermoregula-
tion in fasting emperor penguins under natural conditions. Am. J. PhysioZ. 231: 913-922, 1976.
33. MECHTLY, E. A. The InternationaL System of Units. Physical Constants and Conversion Factors (2nd rev.). Washington, D.C.: NASA SP-7012, 1973. 21 p.
34. MURRISH, D. E. Respiratory heat and water exchange in pen- guins. Respirat. PhysioZ. 19: 262-270, 1973.
35. PAPPENHEIMER, J. R. (Chairman). Standardization of definitions and symbols in respiratory physiology. Federation Proc. 9: 602- 605, 1950.
36. PINSHOW, B., D. R. BATTLES, H. PINSHOW, AND K. SCHMIDT-
NIELSEN. Emperor penguins: thermoregulation and locomotion. Antarctic J. US 10: 127-129, 1975.
37. PINSHOW, B., M. A. FEDAK, AND K. SCHMIDT-NIELSEN. Metabolic response of starving emperor penguins at low temperatures. Antarctic J. US 9: 96-97, 1974.
38. PORTER, W. P. Thermal radiation in metabolic chambers. Sci- ence, 166: 115-117, 1969.
39. PROVOST, J., EcoZogie du Manchot Empereur. Paris: Hermann, 1961. 204 p.
40. PROVOST, J., AND F. BOURLI~RE. Vie sociale et thermoregulation chez le Manchot empereur. AZauda 21: 141-156, 1957.
41. PROVOST, J., AND V. VILTER. Histologie de la secretion oesophag- ienne du Manchot empereur. Proc. Intern. OrnithoZ. Congr., Ithaca, 13th, 1963, p. 1085-1094.
42. ROGERS, D. T., JR., AND E. P. ODUM. Effect of age, sex, and level
by 10.220.32.246 on June 28, 2017http://ajplegacy.physiology.org/
Dow
nloaded from
912 PINSHOW, FEDAK, BATTLES, AND SCHMIDT-NIELSEN
of fat deposition on major body components in some wood war- blers. Auk 81: 505-513, 1964.
43. SCHMIDT-NIELSEN, K. Locomotion: Energy cost of swimming, flying, and running. Science 177: 222-228, 1972.
44. SCHOLANDER, P. F., R. HOCK, V. WALTERS, F. JOHNSON, AND L. IRVING. Heat regulation in some arctic and tropical mammals and birds. Biol. BUZZ. 99: 237-258, 1950.
45. SOKAL, R. R., AND J. ROHLF. Biometry. San Francisco: W. H. Freeman, 1969. 776 p.
46. STONEHOUSE, B. The emperor penguin Aptenodytes forsteri. I. Breeding behaviour and development. Sci. Rept. FuZkZand Is-
Land Dependencies Surv. 6: l-33, 1953. 47. SYMBOLS COMMITTEE OF THE ROYAL SOCIETY. Quantities, Units,
and Symbols (2nd ed.) London: The Royal Society, 1975. 54 p. 48. TUCKER, V. A. Respiratory exchange and evaporative water loss
in the flying budgerigar. J. Exptl. BioZ. 48: 67-87, 1968. 49. TUCKER, V. A. Energetics of natural avian flight. In: Avian
Energetics. Cambridge, Mass.: Nuttall Ornithological Club, 1974, p. 298-333.
50. WILSON, E. A. Aves. British NationaL Antarctic Expedition 1901-
1904. London: Brit. Mus. Nat. Hist., 1907, vol. 2, Zoology. 121 p.
by 10.220.32.246 on June 28, 2017http://ajplegacy.physiology.org/
Dow
nloaded from