energy flow in ecosystems & the biosphere. important vocabulary 1. ecology: study of the...
TRANSCRIPT
Energy Flow in Ecosystems & The Biosphere
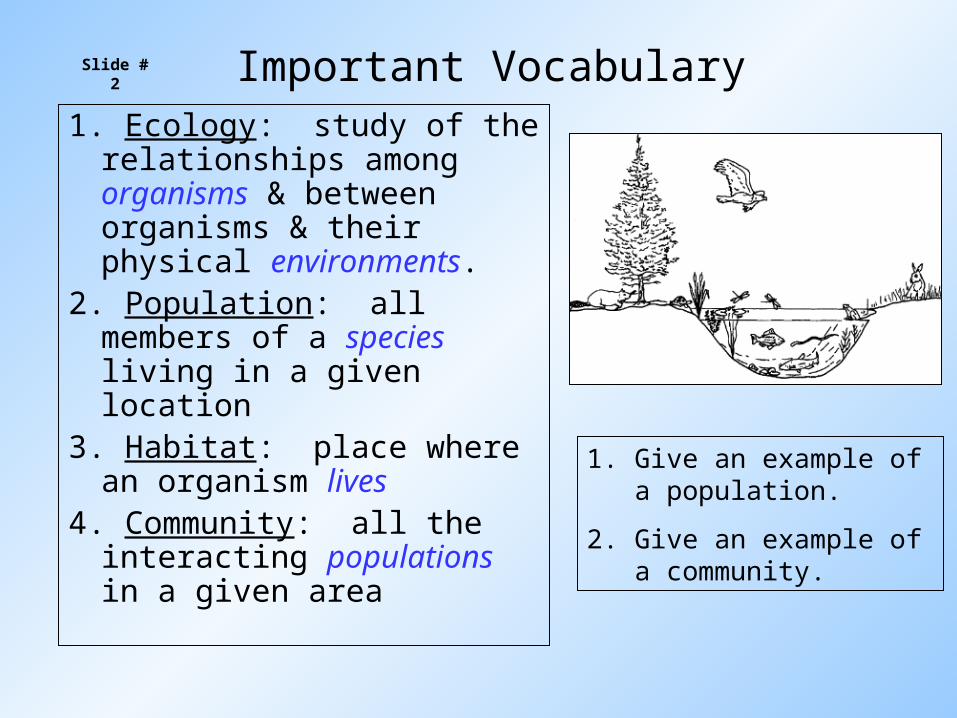
Important Vocabulary1. Ecology: study of the
relationships among organisms & between organisms & their physical environments.
2. Population: all members of a species living in a given location
3. Habitat: place where an organism lives
4. Community: all the interacting populations in a given area
Slide # 2
1. Give an example of a population.
2. Give an example of a community.
Important Vocabulary
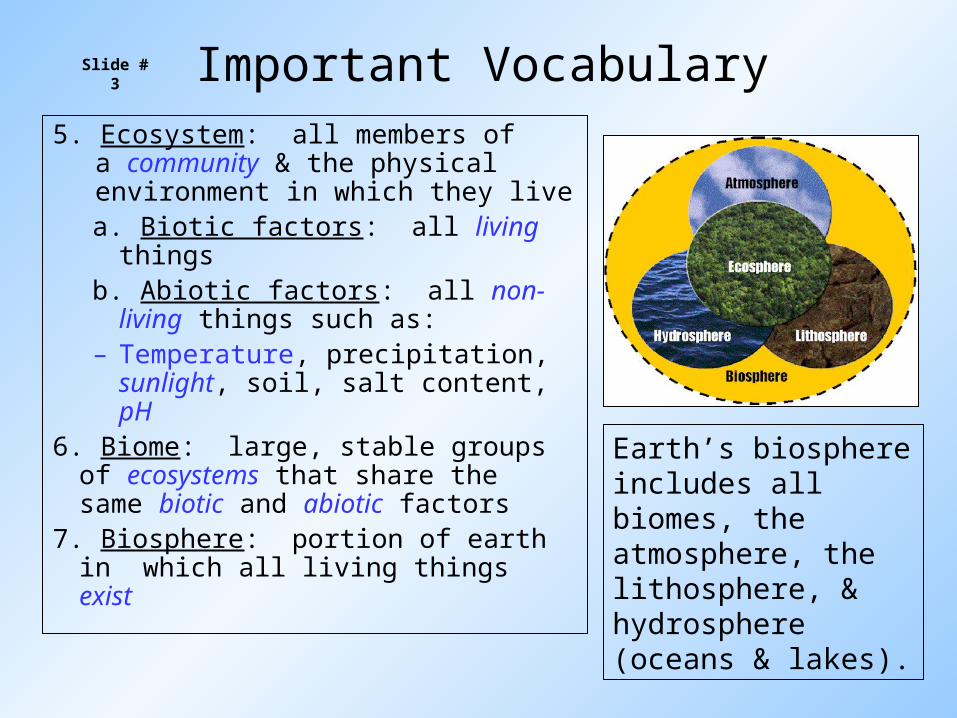
5. Ecosystem: all members of a community & the physical environment in which they livea. Biotic factors: all living thingsb. Abiotic factors: all non-living
things such as:– Temperature, precipitation,
sunlight, soil, salt content, pH6. Biome: large, stable groups of
ecosystems that share the same biotic and abiotic factors
7. Biosphere: portion of earth in which all living things exist
Slide # 3
Earth’s biosphere includes all biomes, the atmosphere, the lithosphere, & hydrosphere (oceans & lakes).

Slide # 4
Go to Section:
Smallest Largest
Individual Population Community Ecosystem Biome Biosphere
Ecological Levels of Organization
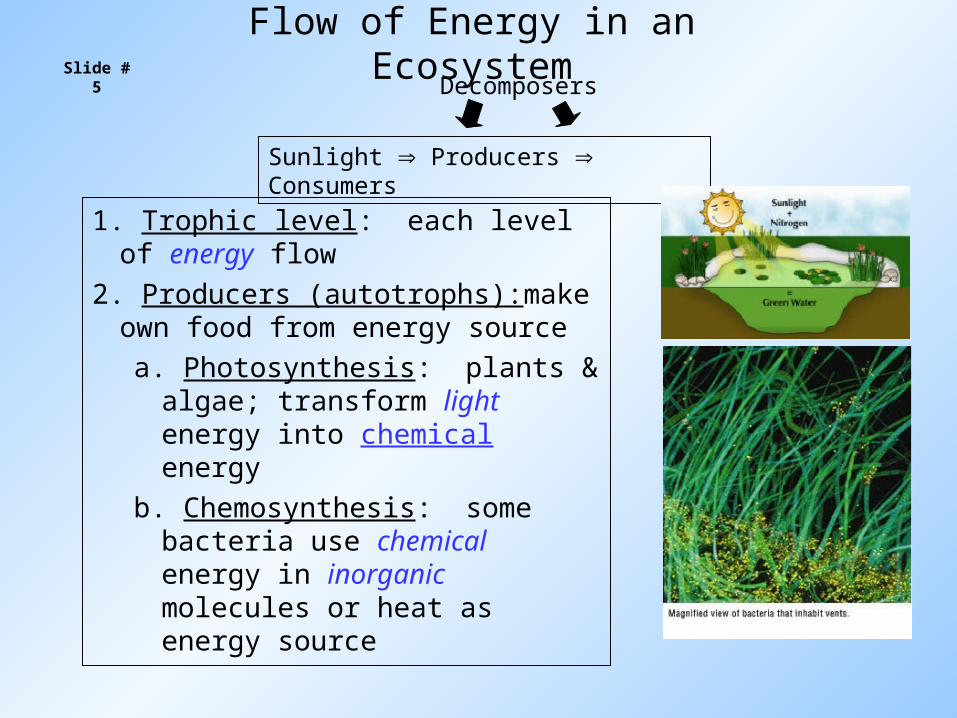
Flow of Energy in an Ecosystem
1. Trophic level: each level of energy flow
2. Producers (autotrophs):make own food from energy source
a. Photosynthesis: plants & algae; transform light energy into chemical energy
b. Chemosynthesis: some bacteria use chemical energy in inorganic molecules or heat as energy source
Slide # 5
Sunlight Producers Consumers
Decomposers
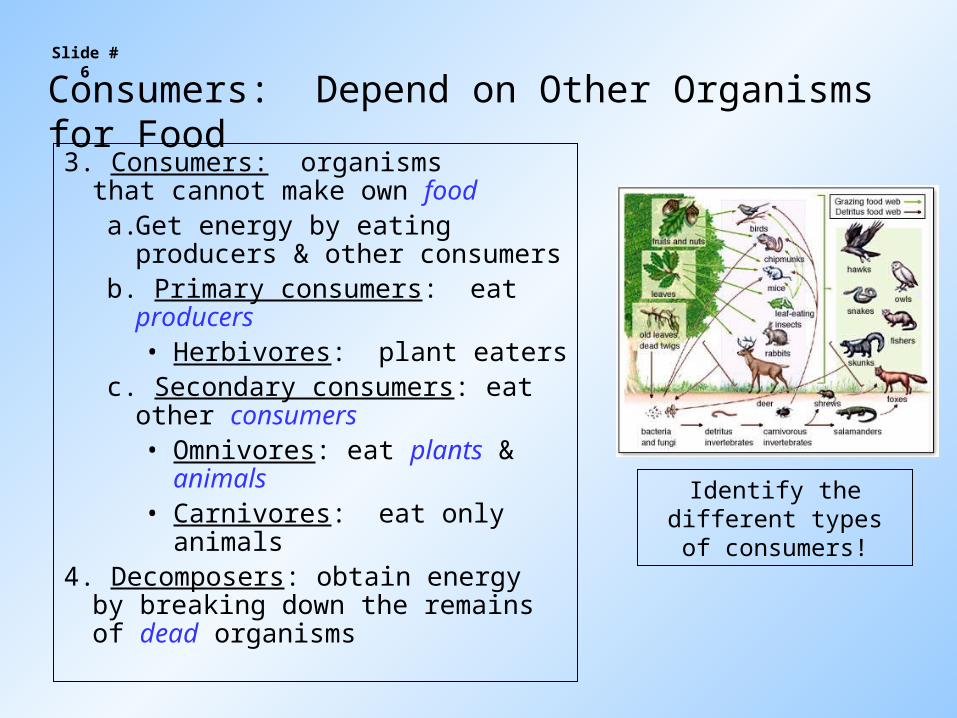
Consumers: Depend on Other Organisms for Food3. Consumers: organisms
that cannot make own fooda. Get energy by eating producers
& other consumersb. Primary consumers: eat
producers• Herbivores: plant eaters
c. Secondary consumers: eat other consumers• Omnivores: eat plants &
animals• Carnivores: eat only animals
4. Decomposers: obtain energy by breaking down the remains of dead organisms
Slide # 6
Identify the different types of consumers!

Decomposers
Obtain energy from the remains of other organisms
Earthworms and termites aid in the breakdown of organic matter, which replenishes nutrients to the soil.
Principle Decomposers:
*Bacteria*Fungi
Must know!
Slide # 7
Go to Section:
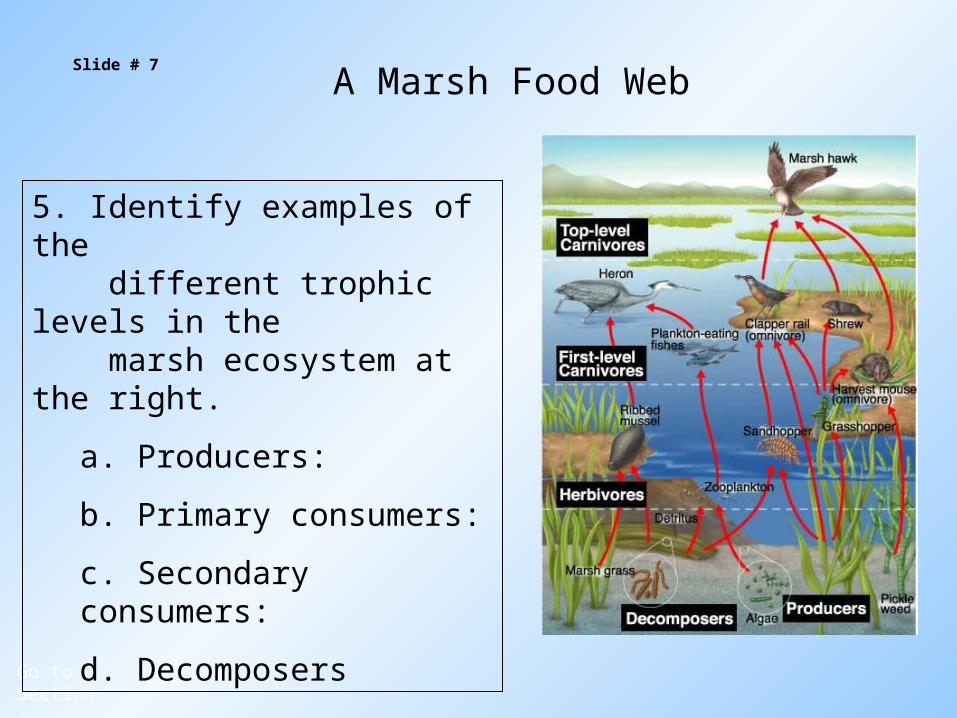
5. Identify examples of the different trophic levels in the marsh ecosystem at the right.
a. Producers:
b. Primary consumers:
c. Secondary consumers:
d. Decomposers
A Marsh Food Web
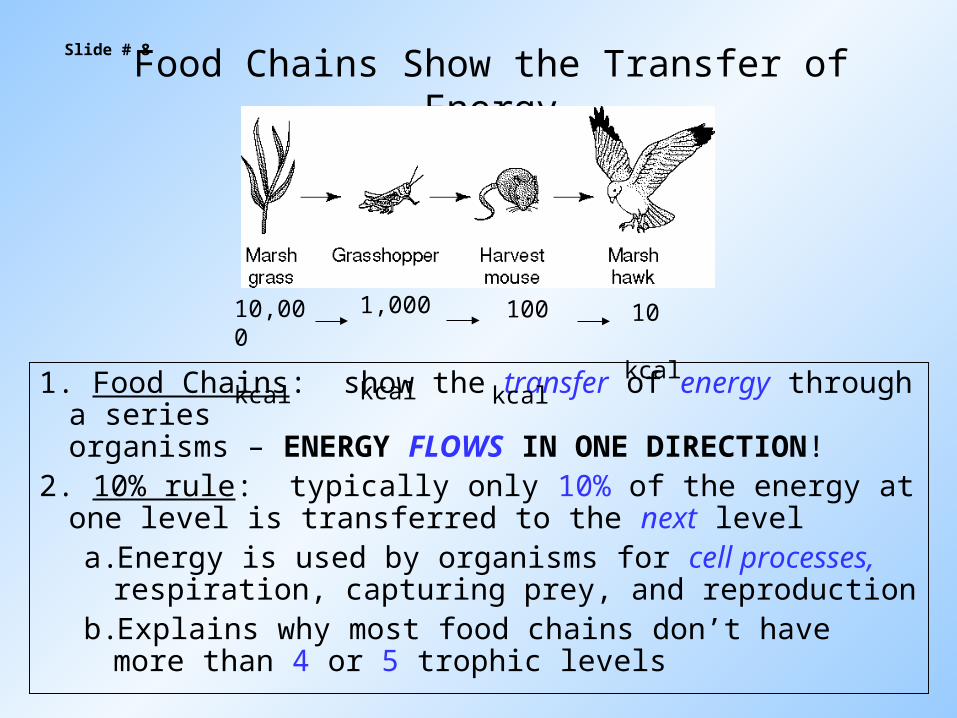
Food Chains Show the Transfer of Energy
1. Food Chains: show the transfer of energy through a series organisms – ENERGY FLOWS IN ONE DIRECTION!
2. 10% rule: typically only 10% of the energy at one level is transferred to the next levela. Energy is used by organisms for cell processes,
respiration, capturing prey, and reproductionb. Explains why most food chains don’t have more than 4
or 5 trophic levels
Slide # 8
10,000 kcal
1,000 kcal
100 kcal
10 kcal
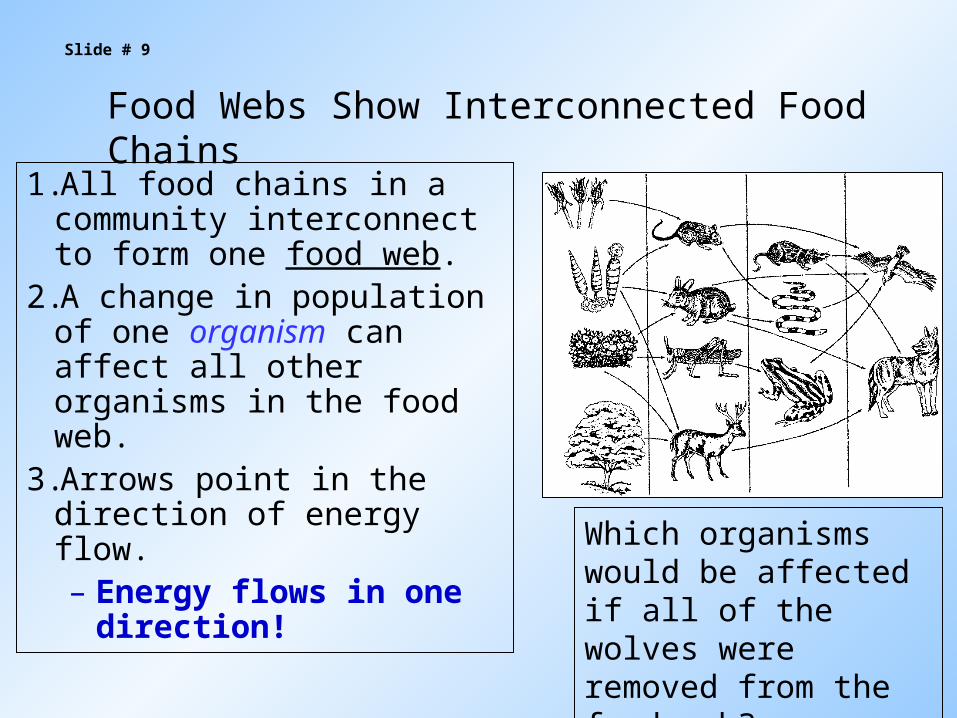
Food Webs Show Interconnected Food Chains
1.All food chains in a community interconnect to form one food web.
2.A change in population of one organism can affect all other organisms in the food web.
3.Arrows point in the direction of energy flow.– Energy flows in one
direction!
Slide # 9
Which organisms would be affected if all of the wolves were removed from the food web?

Ecological Pyramids: Show the Amount of Matter or Energy in an Ecosystem
1. Pyramid of numbers: shows how many individuals are required to support the next level of feeding.
2. Usually does not illustrate the actual amount of organism mass (stored energy) that is transferred through each feeding level.
Slide # 11
6 birds
1,000,000 insects
1 tree
An inverted numbers pyramid

Energy Pyramid: Total Energy Available at Each Level
1. Energy pyramid: shows amount of energy available at each level
2. Shows that about 90% of the energy is lost as heat ~ 10% is transferred to the next level
Slide # 12
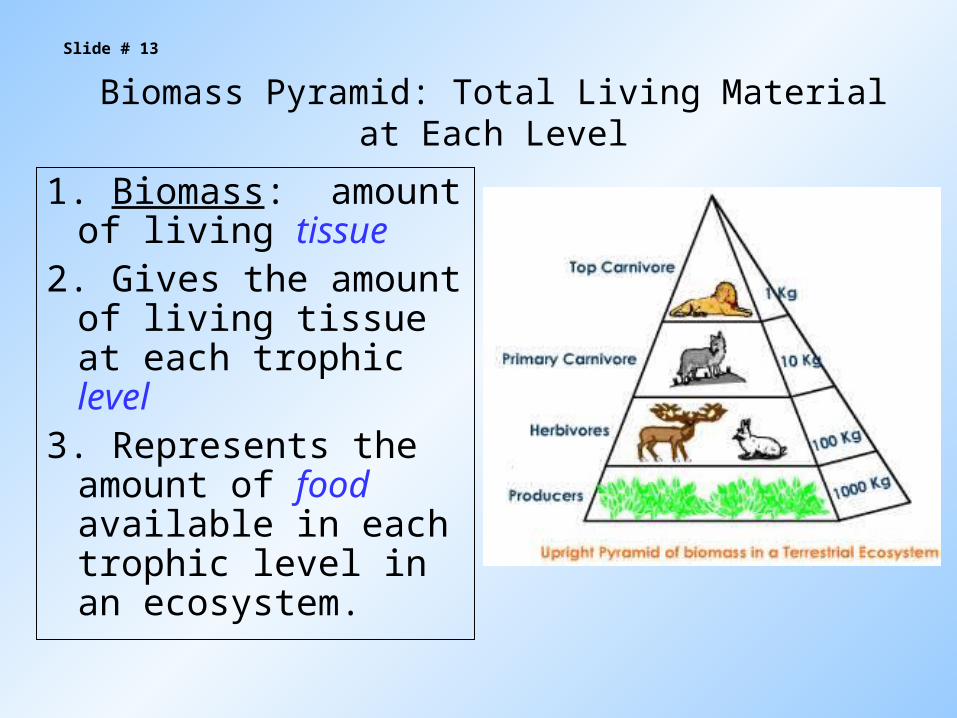
Biomass Pyramid: Total Living Material at Each Level
1. Biomass: amount of living tissue
2. Gives the amount of living tissue at each trophic level
3. Represents the amount of food available in each trophic level in an ecosystem.
Slide # 13
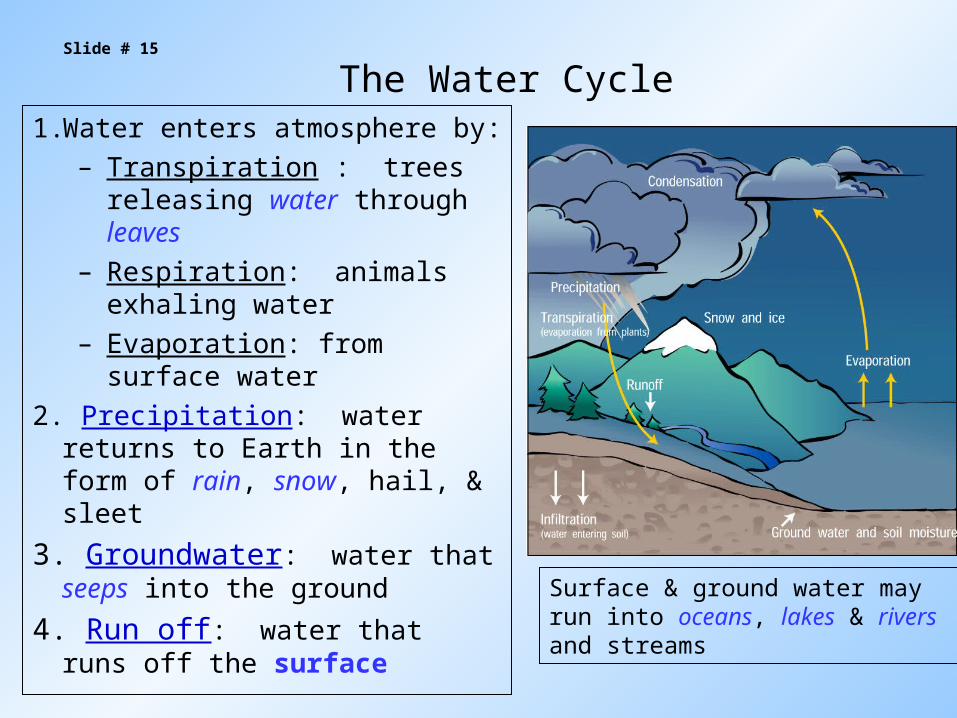
The Water Cycle1. Water enters atmosphere by:
– Transpiration : trees releasing water through leaves
– Respiration: animals exhaling water
– Evaporation: from surface water
2. Precipitation: water returns to Earth in the form of rain, snow, hail, & sleet
3. Groundwater: water that seeps into the ground
4. Run off: water that runs off the surface
Slide # 15
Surface & ground water may run into oceans, lakes & rivers and streams
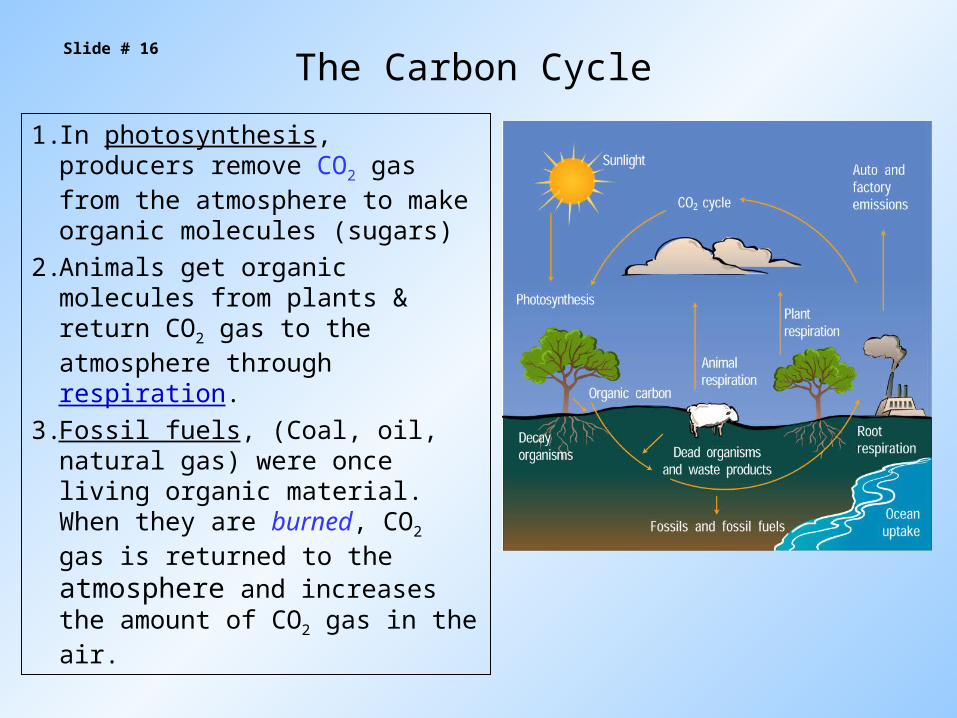
The Carbon Cycle
1. In photosynthesis, producers remove CO2 gas from the atmosphere to make organic molecules (sugars)
2. Animals get organic molecules from plants & return CO2 gas to the atmosphere through respiration.
3. Fossil fuels, (Coal, oil, natural gas) were once living organic material. When they are burned, CO2 gas is returned to
the atmosphere and increases the amount of CO2 gas in the air.
Slide # 16
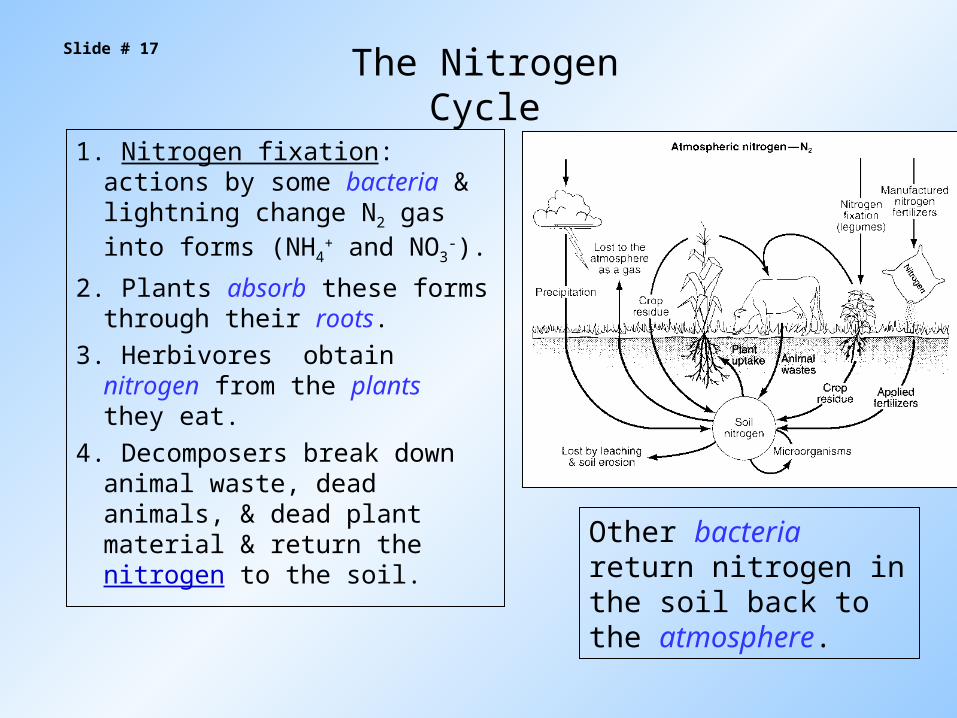
The Nitrogen Cycle
1. Nitrogen fixation: actions by some bacteria & lightning change N2 gas into forms (NH4
+ and NO3-).
2. Plants absorb these forms through their roots.
3. Herbivores obtain nitrogen from the plants they eat.
4. Decomposers break down animal waste, dead animals, & dead plant material & return the nitrogen to the soil.
Slide # 17
Other bacteria return nitrogen in the soil back to the atmosphere.
TAKS Practice
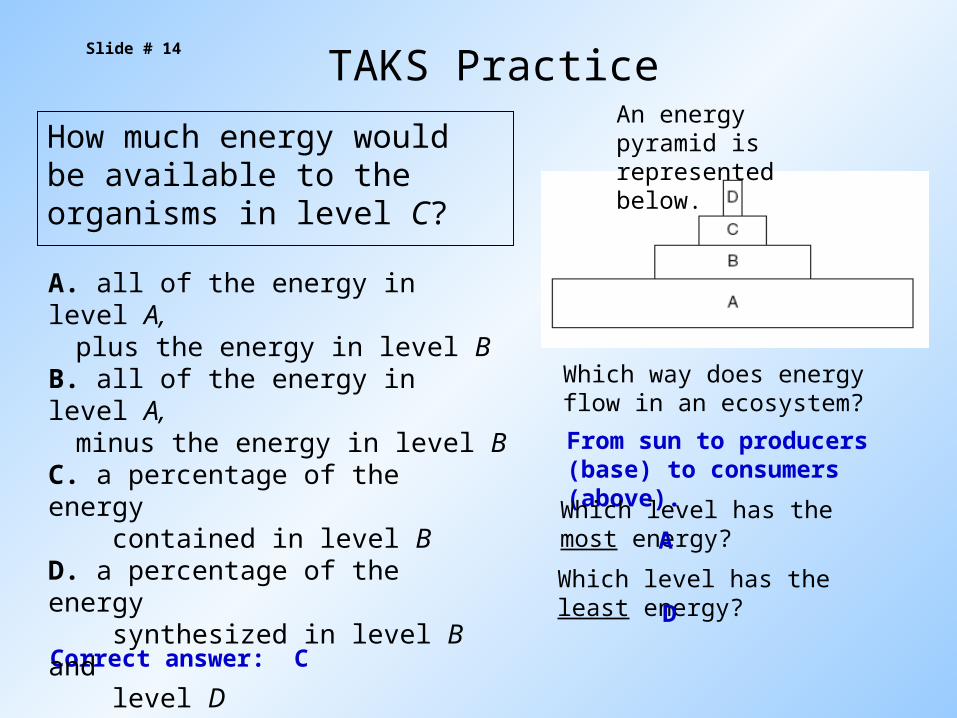
How much energy would be available to the organisms in level C?
An energy pyramid is represented below.
Which way does energy flow in an ecosystem?
From sun to producers (base) to consumers (above).
Which level has the most energy? A
Which level has the least energy? D
Correct answer: C
Slide # 14
A. all of the energy in level A, plus the energy in level BB. all of the energy in level A, minus the energy in level BC. a percentage of the energy contained in level BD. a percentage of the energy synthesized in level B and level D
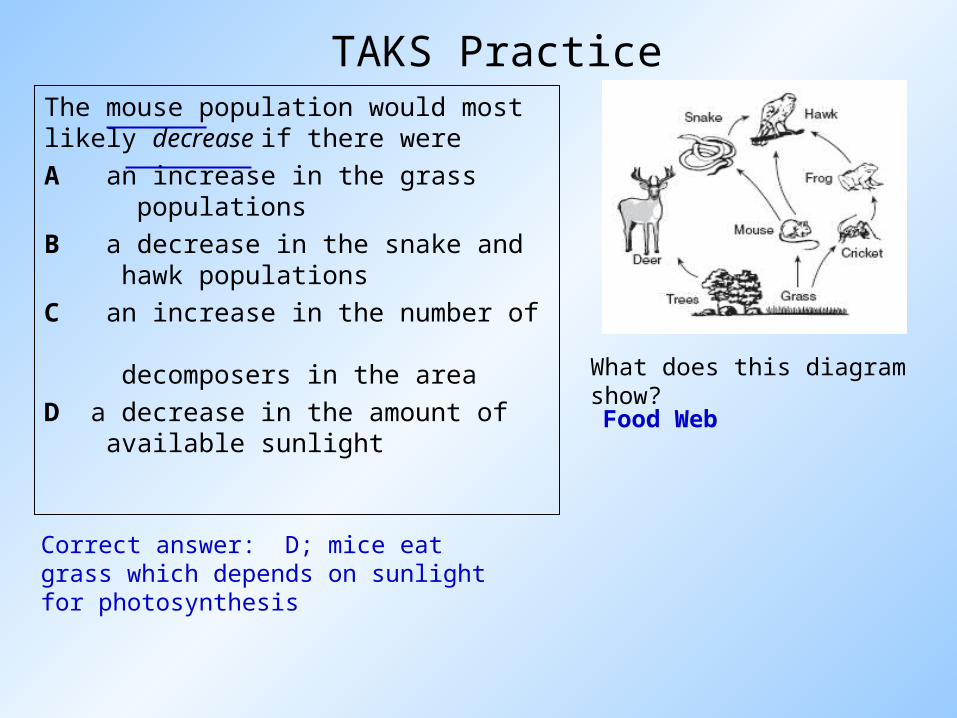
TAKS PracticeThe mouse population would most likely decrease if there were
A an increase in the grass populations
B a decrease in the snake and hawk populations
C an increase in the number of decomposers in the area
D a decrease in the amount of available sunlight
What does this diagram show?
Food Web
Correct answer: D; mice eat grass which depends on sunlight for photosynthesis