energy generation from palm oil mill effluent: a life
TRANSCRIPT

This is a repository copy of Energy generation from palm oil mill effluent: A life cycle assessment of two biogas technologies.
White Rose Research Online URL for this paper:http://eprints.whiterose.ac.uk/153289/
Version: Accepted Version
Article:
Siva, RS, Noor, ZZ, Chong, CS et al. (2 more authors) (2020) Energy generation from palm oil mill effluent: A life cycle assessment of two biogas technologies. Energy, 191. 116513. ISSN 0360-5442
https://doi.org/10.1016/j.energy.2019.116513
© 2019 Published by Elsevier Ltd. Licensed under the Creative Commons Attribution-NonCommercial-NoDerivatives 4.0 International License (http://creativecommons.org/licenses/by-nc-nd/4.0/).
[email protected]://eprints.whiterose.ac.uk/
Reuse
This article is distributed under the terms of the Creative Commons Attribution-NonCommercial-NoDerivs (CC BY-NC-ND) licence. This licence only allows you to download this work and share it with others as long as you credit the authors, but you can’t change the article in any way or use it commercially. More information and the full terms of the licence here: https://creativecommons.org/licenses/
Takedown
If you consider content in White Rose Research Online to be in breach of UK law, please notify us by emailing [email protected] including the URL of the record and the reason for the withdrawal request.
1
Energy generation from palm oil mill effluent: A life cycle assessment of two biogas
technologies
Siva Raman Sharvinia, Zainura Zainon Noora,b,*, Chun Shiong Chongc
Lindsay C Stringerd, David Glewe
aSchool of Chemical and Energy Engineering, Universiti Teknologi Malaysia, Johor Bahru
81310, Malaysia
bCentre for Environmental Sustainability and Water Security, Universiti Teknologi Malaysia,
Johor Bahru 81310, Malaysia
cDepartment of Biosciences, Universiti Teknologi Malaysia, Johor Bahru 81310, Malaysia
dSustainability Research Institute, School of Earth and Environment, University of Leeds,
Leeds LS2 9JT, United Kingdom
eLeeds Sustainability Institute, School of the Built Environment and Engineering, Leeds
Beckett University, Leeds LS2 8AG, United Kingdom
*Corresponding author:
Email: [email protected]
2
GRAPHICAL ABSTRACT
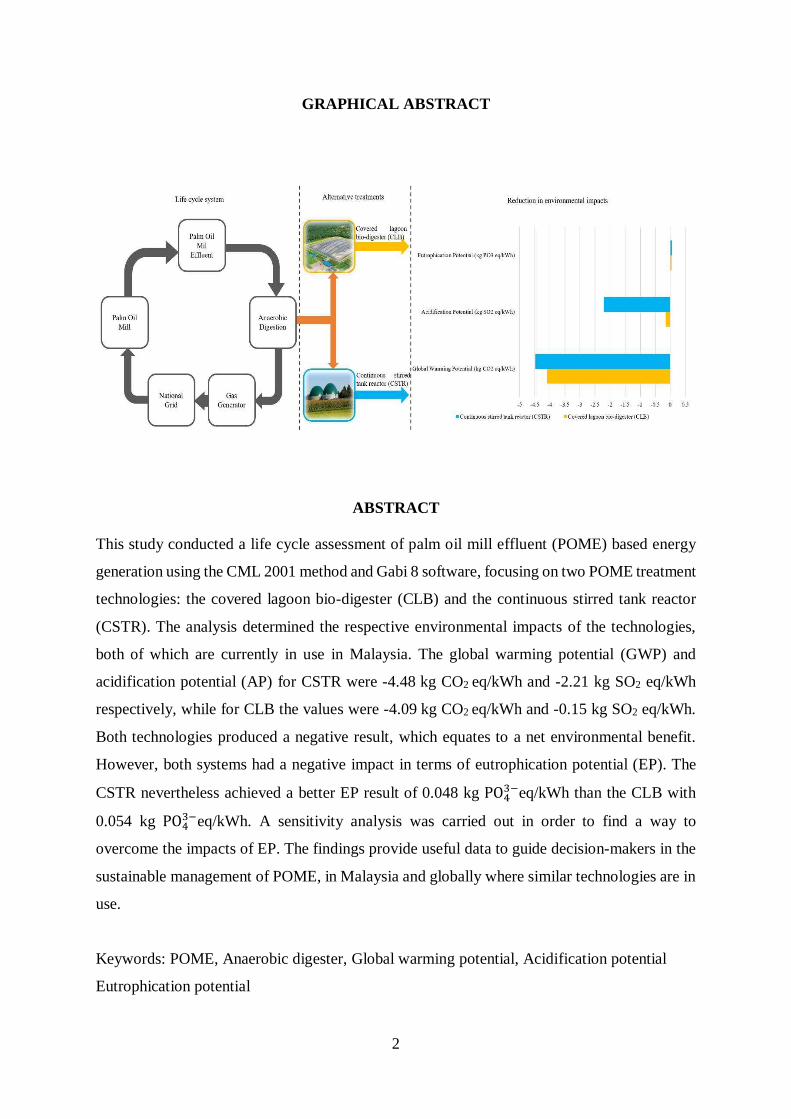
ABSTRACT
This study conducted a life cycle assessment of palm oil mill effluent (POME) based energy
generation using the CML 2001 method and Gabi 8 software, focusing on two POME treatment
technologies: the covered lagoon bio-digester (CLB) and the continuous stirred tank reactor
(CSTR). The analysis determined the respective environmental impacts of the technologies,
both of which are currently in use in Malaysia. The global warming potential (GWP) and
acidification potential (AP) for CSTR were -4.48 kg CO2 eq/kWh and -2.21 kg SO2 eq/kWh
respectively, while for CLB the values were -4.09 kg CO2 eq/kWh and -0.15 kg SO2 eq/kWh.
Both technologies produced a negative result, which equates to a net environmental benefit.
However, both systems had a negative impact in terms of eutrophication potential (EP). The
CSTR nevertheless achieved a better EP result of 0.048 kg PO替戴貸eq/kWh than the CLB with
0.054 kg PO替戴貸eq/kWh. A sensitivity analysis was carried out in order to find a way to
overcome the impacts of EP. The findings provide useful data to guide decision-makers in the
sustainable management of POME, in Malaysia and globally where similar technologies are in
use.
Keywords: POME, Anaerobic digester, Global warming potential, Acidification potential
Eutrophication potential
3
1. Introduction In Malaysia, 5.8 million hectares of land are covered by oil palm plantations [1] and there
are approximately 454 palm oil mills (POMs) in operation [2]. Each oil palm produces 8 to 15
fresh fruit bunches (FFBs) annually [3]. Oil extracted from these FFBs consists of 10% of the
whole dry matter of the palm, while the remaining 90% is palm oil biomass [4], comprising
empty fruit bunches (EFBs), palm oil mill effluent (POME), mesocarp fibres, palm kernel
shells, and palm oil trunks and fronds [5,6]. Both POME and EFBs are generated in huge
quantities [7]. POME is a non-toxic, thick, viscous liquid waste that can cause damage if it is
directly released into the environment as it is a highly polluting wastewater [8].
POME has high organic content. An anaerobic treatment method is thus most suitable
because such a method is more efficient [9]. Anaerobic digestion (AD) is currently considered
the most environmentally friendly biological treatment process because the waste subjected to
AD can be converted into value-added products such as bio-energy [10]. In the biodegradation
step, a high-rate bioreactor is effective because it can produce a high methane yield within a
relatively short retention time while tolerating the operating and capital costs [9].
One of the types of AD system is the fluidised bed reactor (FBR), which requires a
large surface area for biomass attachment and mass transfer. The FBR is usually employed in
treatment of high-strength wastewater [11]. However, the process requires highly turbulent
conditions, which result in higher energy consumption. Also, the media in the reactor, which
can be costly, has to be well maintained to sustain the efficiency of the system. Bacteria tend
to adhere to the reactor bed due to the intensive conditions in the system. Unfortunately, this
system is not efficient in terms of capturing the biogas produced [12]. A further type of AD
system is the up-flow anaerobic sludge blanket (UASB) reactor, which does not require any
media for the treatment of wastewater with high suspended solids. While the UASB reactor is
an efficient system in terms of removing chemical oxygen demand (COD), it produces an
increased amount of methane emissions in doing so. The system also has a tendency to retain
a high concentration of biomass within the reactor itself [12]. The other main disadvantage of
using the UASB reactor is that it has a very poor ability to separate biomass and treated effluent.
On the plus side, the UASB reactor consumes a low amount of energy [13].
The UASB reactor can be combined with an up-flow fixed film (UFF) reactor to create
an up-flow anaerobic sludge fixed film (UASFF) reactor [12]. The UASB reactor has a low
energy demand, so the UASFF offers an improved version of both the UASB and UFF reactors.
However, while it has a good process control system, it still has a very poor ability to separate
4
effluent and biomass, resulting in very poor efficiency [14]. A further type of bed reactor is
the expanded granular sludge bed (EGSB) reactor, which is based on a modification of the
hydrodynamics of the UASB reactor [10]. The EGSB reactor is efficient in the removal of
COD. It performs better with an average organic loading rate (OLR) compared to the UASB
which performs best at a low OLR. Most of the biological and chemical reactions proceed
much more slowly under psychrophilic conditions, resulting in more energy consumption
compared to mesophilic conditions [15]. According to recent research [16], the EGSB reactor
performs comparably under both conditions. Nevertheless, the EGSB reactor has two main
disadvantages: the inability of the granular bed to retain suspended solids and its requirement
for the installation of active biomass for granular anaerobic sludge [12].
One of the most common AD methods is the covered lagoon bio-digester (CLB),
applied by the majority of the POMs with biogas facilities in Malaysia. It is considered a simple
and stable operating system that is also capable of tolerating a high OLR. The two main
disadvantages of this system are the large area of land it needs and the long hydraulic retention
time required to produce the biogas [12]. Conversely, this system consumes a very low amount
of energy and has low operating costs [17]. The CLB is one of the two treatment technologies
evaluated in this study.
The other type of technology evaluated in this study is the continuous stirred tank
reactor (CSTR), one of the commercialised AD systems used in most of the POMs employing
the tank system. It is very cheap and relatively easy to construct. The system has a good mixing
ability, which enhances the contact area between the biomass and wastewater [18]. The CSTR
system has lower operating costs than some of the other systems because a low amount of
energy is consumed. However, the operation can be time consuming and there is very low
biomass retention [12]. Few of the AD systems, for example, CLB, CSTR and UASB have
been commercialised in POMs in Malaysia. UASB is still under consideration and not solely
utilised for energy generation, while the remaining AD systems are still under observation at a
lab scale.
The present study uses a life cycle assessment (LCA) approach to quantify the
environmental impacts of two different POME treatment technologies. The research builds on
previous investigations that use LCA to evaluate different environmental indicators for energy
generation from POME. LCA is a tool that can be used to evaluate the environmental impact
of a product from its formation stage or the extraction of natural resources (cradle) until its
complete degradation in the environment or end of life (grave) [19]. Most existing LCA studies

5
have compared a biogas technology with a composting system [20,21] or have conducted
analyses of combinations of the open lagoon system with biogas and composting facilities [22].
Environmental impact assessments for different treatment scenarios for palm oil
production waste have been published previously [20]. Key scenarios and findings are
summarised from this below. The scenarios for comparison are: (a) dumping EFB and storing
POME and ponds, (b) returning EFB to the plantation and POME as before, (c) using EFB and
POME for co-composting and returning the produced compost to the plantation, (d) generating
biogas from POME and followed by (c). Findings from analyses by [20] showed that the major
contributor to the GWP is the methane emission upon dumping the POME and EFB. Nutrient
recycling and reduced methane emissions can decrease the GWP value from 245 kg CO2 eq to
up to 5 kg CO2 eq per ton FFB. For instance, co-composting EFB and POME leads to reduction
in GWP and considered as nutrient recovery. Therefore, composting helps in simultaneously
reducing the environmental burdens and gaining net environmental benefit. The best option
with reduced environmental impact would be co-composting of EFB and POME, with or
without treating POME in a biogas plant as this way could make use the nutrients of both the
palm oil residues.
In other studies, environmental impacts of six alternatives for the conversion of 30 t/h
of FFBs into biorefineries have been assessed [21]. Alternative scenarios that were assessed
were: production of biogas from the POME (C1), composting of EFB and fibre (C2), biomass
combustion for high pressure steam CHP (C3), pellet production (C4), biochar production (C5),
and biochar and bio-oil production (C6). With respect to GHG emissions, reductions of >33%
were found to be achieved, while composting and anaerobic digestion reduced the EP value by
30%. As a whole, the most preferred alternative was the pellet production biorefinery.
LCA studies have been conducted by [22] for a combination of open lagoon technology
(COLT) with composting and COLT-Biogas for POME treatment. COLT-Biogas technology
comprises: composting (A), land application (B) and membrane technology (C). The most
environmentally friendly technology was COLT-Biogas A as this technology was able to emit
357.18 kg CO2 eq less than the other treatment processes with respect to GWP. With respect to
EP, COLT-Biogas A and COLT-Composting result in zero EP as no nitrification of the water
or land occurs with the use of these technologies. The highest EP of 7.73 kg PO替戴貸eq was
observed for the open lagoon technology, followed by COLT-Biogas B, with EP of 6.14 kg PO替戴貸eq, and COLT-Biogas C, with EP of 5.96 kg PO替戴貸eq. The highest value of AP was mainly
observed in COLT-Biogas A, where turning and moving the EFB in the composting area used

6
diesel, resulting in the contribution of approximately 55% of the AP value. HTP emissions
were negligible in this study because the palm oil mill’s processing was not within the system
boundary. As a whole, the lowest energy consumption was by COLT-Biogas C, while the
highest net energy ratio (NER) was observed for COLT-Biogas B and COLT-Biogas C. The
technology with the lowest EP and GWP values was COLT-Biogas A, while COLT-Biogas B
and COLT-Biogas C had the lowest AP values [22].
The present study builds on this previous work. Our main objective was to use a LCA
to quantify the environmental impacts of two different POME treatment technologies. The
environmental impact and the amount of sludge used for composting purposes is discussed in
section 3.4 (sensitivity analysis). Sensitivity analysis performed in this study evaluates the EP
impacts after the application of a composting system to the existing biogas system for
electricity generation. This adds to the novelty as the boundary of this study does not include
the composting system. The results offer useful information to decision-makers and planners
for biogas projects in existing POMs without such facilities. Findings can also guide the
implementation of biogas facilities in new POMs.
2. Methodology
One of the best ways to assess the environmental performance of POME-based energy
generation is to use LCA. A LCA generally consists of four parts: i) goal and scope definition,
ii) inventory analysis, iii) impact assessment, and iv) interpretation. In addition, an analysis of
the sensitivity of the parameter that has the most effect on the life cycle emissions is undertaken
in this study. The next section provides an overview of the CLB and CSTR set-ups that we
evaluate. We then describe our methods in relation to the four parts of the LCA and the
sensitivity analysis.
2.1. Overview of the two compared POME treatment technologies for energy generation
The CLB and CSTR that were evaluated in this study are located at two different POMs, which
for the purpose of this study are named POM 1 and POM 2.
The CLB in POM 1 is an improvement on the conventional system- the open ponding
system. First, the POME from the mill is directed to the cooling pond in order to stabilise the
temperature of the inlet wastewater before it enters the CLB system. This is to ensure the
maintenance of optimal conditions (pH and temperature) in the digester and thereby ensure that
7
the system yields the highest efficiency in terms of organic material decomposition. POME
from the cooling pond is channelled to mixing ponds and then pumped into the digester where
the majority of the decomposition takes place. The CLB is covered with a non-permeable high-
density polyethylene (HDPE) membrane and a geotextile is set over the slope of the pond to
fully enclose the digester system. The biogas that is generated is extracted from below the
HDPE membrane and directed to the scrubber and chiller. The POME digestate from the
anaerobic digester is directed to facultative ponds to further reduce the level of biological
oxygen demand (BOD), before discharging digestate POME for land application. The biogas
generated is purified and combusted in gas engines to generate electricity, and supplied to the
national grid. The sludge obtained from the digester is used for composting purposes.
The CSTR at POM 2 is another AD system that has been implemented in POMs in
place of the conventional system- the open digesting tank. First, the POME from the mill is
channelled to the de-oiling tank for the removal of 90% of the oil. Then, the POME is directed
into a cooling pond to reduce its temperature to about 50 °C. The POME is then stored in the
distribution tank before being directed to the digester tanks for AD to take place. The top of
the tank is covered to trap the biogas. POME is fed continuously into the digester under
appropriate mixing and circulation conditions inside the tank. The digestate POME and
generated biogas is stored in a holding tank. The digestate POME undergoes further treatment
as it passes through anaerobic and aerobic ponds before it is used for land application. The
generated biogas is purified before being combusted in gas engines to supply the national grid.
The sludge obtained from the digester is used for composting purposes.
2.2. Life cycle assessment (LCA)
The LCA software Gabi 8 was used to evaluate the environmental impacts of inventory
elements and life cycles for our two scenarios. This subsection sets out the goal, scope,
functional unit, system boundaries, assumptions, and impact assessment.
The aim of this study was to assess and compare the environmental impacts of energy
generation from POME in the context of Malaysia by comparing two different POME treatment
technologies: CLB and CSTR systems. The main goal was to evaluate the potential
environmental benefits of employing two different POME treatment technologies to determine
which treatment technology was most environmentally friendly. Two POMs located in two
8
different states of Malaysia were used as case studies. A gate-to-gate LCA was undertaken to
quantify and compare the environmental impact of the CLB and CSTR systems. The LCA
therefore covered all the stages of the process of energy generation from POME, beginning
with the transfer of the POME from the POM, through pre-treatment before entry to the AD
system, production of biogas in AD, purification of the biogas generated, combustion of the
biogas in the gas engine for energy generation and finally, treatment of the effluent, before
discharging it for land application. The environmental impact of every process was taken into
consideration. In this study, 1 kWh of electricity generated from POME was used as the
functional unit because this enabled easy comparison of the two technologies.
All data on the inputs and outputs to the Gabi 8 software were directly obtained from
the POMs. Data were normalised to the functional unit of 1 kWh of electricity generation for
easy comparison between the two different treatment technologies. It was, however, necessary
to calculate the emissions (output), as the databases available in Gabi 8 did not represent the
scenarios investigated by this study. The default emission factor values listed in Table 1 were
obtained from the 2006 Intergovernmental Panel on Climate Change (IPCC) Guidelines for
National Greenhouse Gas Inventories [23] while the grid displacement value was obtained
from the latest report of the Clean Development Mechanism (CDM) electricity baseline 2014
[24]. Moreover, [25] report a range of methane correction factors, so a suitable value based on
the scenario had to be used. Most of the mills with biogas systems in Malaysia follow the IPCC
guidelines to calculate carbon emissions for CDM applications. The CDM has played a great
role in encouraging a massive reductions of CO2 eq over the years, helping to mitigate climate
change [26]. External data such as discharge of digestate POME for land application and usage
of sludge for composting purposes were not taken into consideration as these did not fall within
the system boundaries. Efficiency for both the CLB and CSTR systems was assumed to be 90%
based on a report by [27] and information obtained directly from both the POMs. The mass and
energy balances inclusive of every input and output flow are listed in Table 2.

9
Table 1 Emission and conversion factors
Description Symbol Unit Value Reference Emission factor Global warming potential
GWP大滝填 kg CO2 eq/kg CH4
21 [23]
Grid displacement EF大拓鉄 kg CO2 eq/kWh 0.694 [24] PO4 equivalence factor (eutrophication potential)
Po,cod kg PO替戴貸eq/kg COD
0.022 [22]
Po,tn kg PO替戴貸eq/kg N 0.42 [28] SO2 equivalence factor (acidification potential)
So,ww kg SO2 eq/kg H2S 1.88 [22]
Methane production per kg COD digester
Bo,ww kg CH4/ kg COD 0.21 [23]
Methane correction factor
Digester efficiency CFEww 0.9 [27] Digestate POME MCFww,digestate 0.1 [25] Recovery/combustion utilisation
MCFww,anaerobic 1.0 [25]

10
Table 2 Inventory for CLB and CSTR (functional unit = 1 kWh of electricity)
Unit CLB CSTR Inputs POME production m3 0.028 0.020 Electricity Transfer pump kWh 0.038 0.034 Blower kWh 0.0018 - Mixer kWh - 0.13 Scrubber kWh 0.00075 0.0367 Chiller kWh 0.001 0.012 Booster fan kWh - 0.0075 Processes Biogas production m3 0.50 0.60 Outputs Electricity kWh 1 1 Sludge (used for composting purposes)
kg 1.6667 1.6667
Emissions CO2 emissions Open pond kg CO2 eq 0.01 0.08 Biogas captured (reduction) kg CO2 eq -4.13 -4.71 SO2 emissions Biogas captured (reduction) kg SO2 eq -0.15 -2.21 PO4 emissions COD in POME kg PO替戴貸eq 0.051 0.040 N in POME kg PO替戴貸eq 0.0032 0.0081 CO2 emissions from electricity Transfer pump kg CO2 eq 0.026 0.024 Blower kg CO2 eq 0.0012 - Mixer kg CO2 eq - 0.090 Scrubber kg CO2 eq 0.00052 0.025 Chiller kg CO2 eq 0.00069 0.0083 Booster fan kg CO2 eq - 0.0052
The equations applied to quantify the investigated emissions were modified based on
the CDM methodology booklet [29]. The following equations were applied to calculate the
emissions contributing to GWP: GWP 噺 E竪┸丹誰歎奪嘆 髪 E竪┸叩樽叩奪嘆誰但辿達┸歎歎 髪 E竪┸歎歎┸辰辿巽奪坦担叩担奪 (1) E竪┸丹誰歎奪嘆 噺 E竪┸奪狸奪達 抜 EF大拓鉄 (2) E竪┸叩樽叩奪嘆誰但辿達┸歎歎 噺 岫な 伐 CFE歎歎岻 抜 MEP竪┸歎歎┸担嘆奪叩担鱈奪樽担 抜 GWP大滝填 (3) E竪┸歎歎┸辰辿巽奪坦担叩担奪 噺 MEP竪┸歎歎┸辰辿巽奪坦担叩担奪 抜 GWP大滝填 (4)
where Eh,power is the emissions from the energy generated (kg CO2 eq); Eh,elec is the amount of
energy used (kWh); EFCO2 is the emission factor for grid displacement (kg CO2 eq/kWh);
11
Eh,anaerobic,ww is the emission from the wastewater of the anaerobic treatment system (kg CO2
eq); CFEww is the methane correction factor for the anaerobic digester; MEPh,ww,treatment is the
methane emission from the wastewater upon treatment (kg CH4); GWPCH4 is the emission
factor for GWP (kg CO2 eq/kg CH4); Eh,ww,digestate is the emission from the digestate POME (kg
CO2 eq); and MEPh,ww,digestate is the methane emission from the digestate POME (kg CH4).
As regards MEPh,ww,treatment, which is the methane emission from the wastewater upon
treatment and MEPh,ww,digestate, which is the methane emission from the digestate POME, these
can be expressed, respectively, as: MEP竪┸歎歎┸担嘆奪叩担鱈奪樽担 噺 Q竪┸歎歎 抜 COD竪┸歎歎┸担嘆奪叩担奪辰 抜 B誰┸歎歎 抜 MCF歎歎┸叩樽叩奪嘆誰但辿達 (5) MEP竪┸歎歎┸辰辿巽奪坦担叩担奪 噺 Q竪┸歎歎 抜 COD竪┸歎歎┸辰辿巽奪坦担叩担奪 抜 B誰┸歎歎 抜 MCF歎歎┸辰辿巽奪坦担叩担奪 (6)
where Qh,ww is the flow rate of the wastewater (m3); CODh,ww,treated is the digested amount of
COD based on the difference between the initial COD input and final COD output of the
particular process (kg CODtreated/m3); Bo,ww is the methane production per kg of COD digested
(kg CH4/kg COD); MCFww,anaerobic is the methane correction factor for recovery utilisation;
CODh,ww,digestate is the value of the digestate COD for the respective process (kg CODdigestate/m3);
and MCFww,digestate is the methane correction factor for the digestate POME.
In this study, sulphur dioxide generation was considered to be the major contributor to
AP, where the acidifying effect can be expressed as: AP 噺 E竪┸坦探狸丹竪探嘆 辰辿誰淡辿辰奪┸歎歎 (7) E竪┸坦探狸丹竪探嘆 辰辿誰淡辿辰奪┸歎歎 噺 岫な 伐 CFE歎歎岻 抜 H態S竪┸巽奪樽奪嘆叩担奪辰 抜 S誰┸歎歎 (8)
where Eh,sulphur dioxide,ww is the emission of sulphur dioxide from the wastewater of the anaerobic
treatment system (kg SO2 eq); H2Sh,generated is the amount of hydrogen sulphide gas generated
(kg H2S); and So,ww is the SO2 equivalence factor related to the AP impact (kg SO2 eq/kg H2S).
Eutrophication potential was calculated based on the availability of total nitrogen and
phosphorus content. Based on the industrial data, only COD and total nitrogen in the POME
were observed to contribute to phosphate emissions, which were calculated as follows: EP 噺 E竪┸丹竪誰坦丹竪叩担奪┸歎歎┸達誰辰 髪 E竪┸丹竪誰坦丹竪叩担奪┸歎歎┸担樽 (9) E竪┸丹竪誰坦丹竪叩担奪┸歎歎┸達誰辰 噺 COD竪┸歎歎┸丹誰鱈奪 抜 P誰┸達誰辰 (10) E竪┸丹竪誰坦丹竪叩担奪┸歎歎┸担樽 噺 TN竪┸歎歎┸丹誰鱈奪 抜 P誰┸担樽 (11)

12
where Eh,phosphate,ww,cod represents the emissions from the wastewater of the anaerobic treatment
system due to the presence of COD in the POME (kg PO替戴貸eq); CODh,ww,pome is the amount of
COD in the POME (kg COD); Po,cod is the PO替戴貸 equivalence factor contributing to the EP
impact due to COD (kg PO替戴貸eq)/kg COD); Eh,phosphate,ww,tn considers the emissions from the
wastewater of the anaerobic treatment system due to presence of total nitrogen (TN) in the
POME (kg PO替戴貸eq); TNh,ww,pome is the amount of TN in the POME (kg TN); and Po,tn is the PO替戴貸 equivalence factor contributing to the EP impact due to TN (kg PO替戴貸eq/kg TN).
The life cycle impact assessment (LCIA) of the LCA is the phase in which the impact
categories were assessed based on the midpoint impact categories using the methodology CML
2001. This phase is the most crucial in the overall LCA. The LCA involved calculating the
environmental impact of POME-based electricity generation by the CLB and by the CSTR
based on: global warming potential (GWP), acidification potential (AP) and eutrophication
potential (EP). GWP was assessed as the main aim of implementing biogas facilit ies in POMs
is to mitigate greenhouse gas emissions, while AP is a type of impact that occurs as a result of
changes in the base and acid equilibrium in water and in soil bodies due to the presence of
contaminants such as SO2, NO2, NO and NH3 [30,31]. The other environmental impact factor
that was evaluated was EP. Eutrophication occurs due to the presence of very high
micronutrient levels in the environment and causes excessive production of biomass [21]. In
addition, to analyse the EP impacts of change in variations in the composition of sludge and
amount of POME anaerobic sludge, a sensitivity analysis was conducted.
3. Results and discussion
3.1. Global warming potential with product displacement
The GWP for the two different technologies was calculated based on the amount of
input and the unit was expressed in kg CO2 eq per kWh of electricity generated. Induced impact
for each scenario is obtained by subtracting the avoided impacts from the induced impacts [32].
The GWP of the CLB system was -4.09 kg CO2 eq per kWh of electricity generated and
consisted of a mixture of displacement and emissions as follows: -4.13 kg CO2 eq captured in
the CLB system, 0.01 kg CO2 eq of methane losses during the open pond treatment (facultative
pond) and electricity emissions of 0.03 kg CO2 eq from the pumps and other processes. The
GWP of the CSTR system was -4.48 kg CO2 eq, composed of: -4.71 kg CO2 eq from three
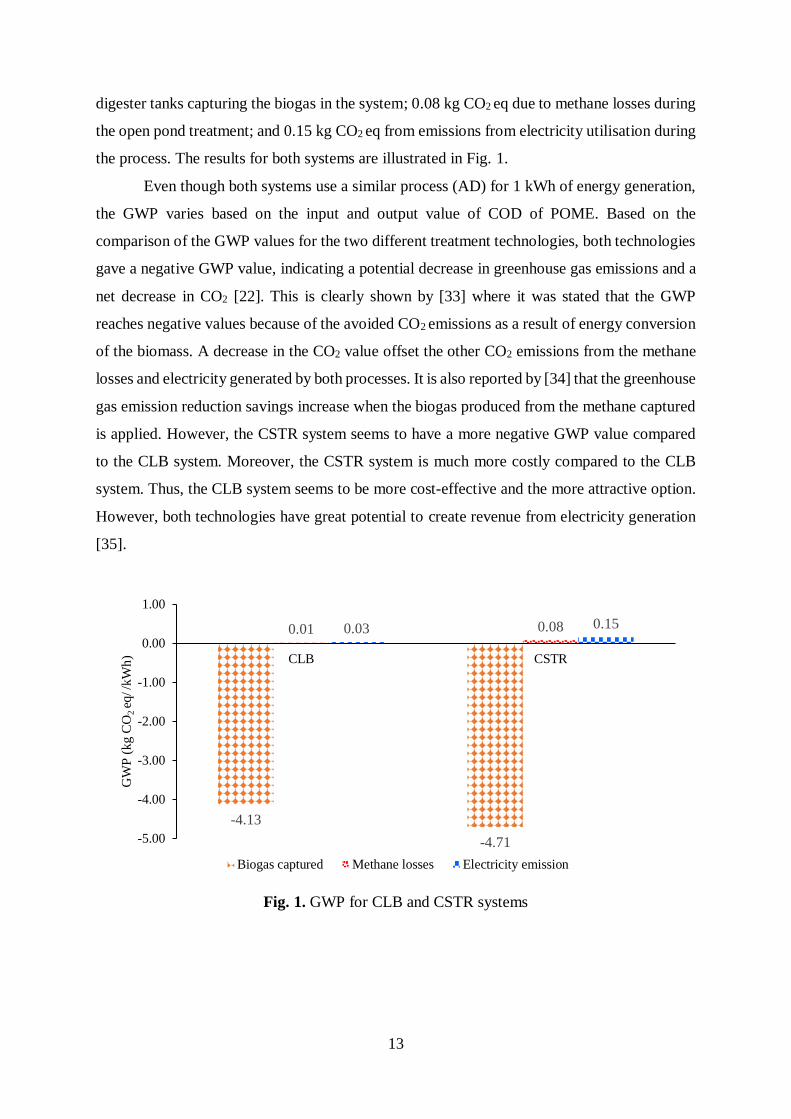
13
digester tanks capturing the biogas in the system; 0.08 kg CO2 eq due to methane losses during
the open pond treatment; and 0.15 kg CO2 eq from emissions from electricity utilisation during
the process. The results for both systems are illustrated in Fig. 1.
Even though both systems use a similar process (AD) for 1 kWh of energy generation,
the GWP varies based on the input and output value of COD of POME. Based on the
comparison of the GWP values for the two different treatment technologies, both technologies
gave a negative GWP value, indicating a potential decrease in greenhouse gas emissions and a
net decrease in CO2 [22]. This is clearly shown by [33] where it was stated that the GWP
reaches negative values because of the avoided CO2 emissions as a result of energy conversion
of the biomass. A decrease in the CO2 value offset the other CO2 emissions from the methane
losses and electricity generated by both processes. It is also reported by [34] that the greenhouse
gas emission reduction savings increase when the biogas produced from the methane captured
is applied. However, the CSTR system seems to have a more negative GWP value compared
to the CLB system. Moreover, the CSTR system is much more costly compared to the CLB
system. Thus, the CLB system seems to be more cost-effective and the more attractive option.
However, both technologies have great potential to create revenue from electricity generation
[35].
Fig. 1. GWP for CLB and CSTR systems
-4.13
-4.71
0.01 0.080.03 0.15
-5.00
-4.00
-3.00
-2.00
-1.00
0.00
1.00
CLB CSTR
GW
P (
kg C
O 2 e
q//k
Wh
)
Biogas captured Methane losses Electricity emission

14
3.2. Acidification potential with product displacement
The CLB and CSTR systems both showed a negative value for AP, but the only
contributor to this impact was SO2 which was from the H2S composition of the biogas. The AP
value for the CLB system was -0.15 kg SO2 eq while for the CSTR system it was -2.21 kg SO2
eq (Fig. 2).
As both systems are closed systems, it can be assumed that there are no SO2 emissions.
Also, [36] show that the presence of a biogas system produces a negative result for acidification
potential, which equates to a net environmental benefit. Their analysis compared biogas and
dung combustion in household cooking systems in developing countries. No diesel
consumption is involved in the process, which further helps it to be more environmentally
friendly. However, we found that the CSTR system has a greater negative value compared to
the CLB system because the amount of POME used to generate 1 kWh of energy differs under
each scenario. The hydrogen sulphide content in the CSTR system was higher than in the CLB
system, resulting in a greater amount of sulphur dioxide being captured in the CSTR.
Fig. 2. AP for CLB and CSTR
3.3. Eutrophication potential
The other environmental impact factor that was evaluated was EP. In this study, the
only biomass considered is POME; EFBs and FFBs are not taken into account. According to
[19], the EP of POME is calculated based on the total phosphorus and nitrogen as well as the
-0.15
-2.21-2.50
-2.00
-1.50
-1.00
-0.50
0.00CLB CSTR
AP
(kg
SO 2
eq/k
Wh
)
Sulphur dioxide captured

15
COD mass fractions. However, in this study, the total phosphorus value of POME was not
taken into account as it was not detected when the POME samples from every process were
tested.
Fig. 3 provides the EP results for both systems. The CLB system and the CSTR system
emitted 0.054 kg PO替戴貸eq and 0.048 kg PO替戴貸eq, respectively. The CLB system had a higher
EP result in terms of emissions of PO替戴貸due to the absence of concrete in the pond wall before
and after the AD system, which resulted in the POME dissolving in nearby land and water.
Similarly, [22] reported the highest EP value for open lagoon technology due to the absence of
concrete pond walls. However, the CLB system has a higher EP impact compared to the CSTR
system because of the difference in amount of the POME used to generate 1 kWh of electricity.
Fig. 3. EP for CLB and CSTR
The percentage relative contribution of the two different POME treatment technologies
to the environmental impacts GWP, AP and EP is illustrated in Fig. 4. The preferred order of
ranking of the two technologies is presented in Table 3. Both systems produced an overall
negative value for GWP and AP, which represents a net environmental benefit. However, the
CSTR system captured more CO2 and SO2, resulting in a higher negative percentage and better
outcome compared to the CLB system. As for EP, both systems had a positive EP value and
hence a negative impact on the environment. This is because the presence of COD and TN in
POME tends to cause an EP impact due to the absence of concrete material in the pond wall,
0.051
0.040
0.0032
0.0081
0.000
0.010
0.020
0.030
0.040
0.050
0.060
CLB CSTR
EP
(P
hos
pha
te-e
q/kW
h)
Based on N in POME
Based on COD in POME
16
resulting in nitrification of land and water by both systems. However, the CSTR had a lower
EP value than the CLB.
Fig. 4. Comparison of environmental impacts for CLB and CSTR
Table 3 Preferred ranking of technologies for each environmental impact category
Environmental impact category Preferred ranking order GWP with product displacement CSTR > CLB AP with product displacement CSTR > CLB EP CSTR > CLB
3.4. Sensitivity analysis
Palm oil mills not only generate POME, a type of polluted wastewater; they also
produce a large amount of POME sludge. POME sludge has great potential for use as an
organic fertilizer [37] or compost. The most common type of POME sludge used for
composting is POME anaerobic sludge, which is derived from the effluent of the AD digester.
Sludge is also produced by the open treatment ponds or aerobic treatment [37], and is known
as treated POME sludge. POME anaerobic sludge contains a high level of nutrients compared
to treated POME sludge (Table 4). Both the CSTR and CLB systems produce a great amount
of sludge as a result of treating POME for energy generation. Both systems produce 1.667 kg
of sludge for 1 kWh of energy generation. Information was insufficiently available from the
POMs on the properties of POME anaerobic and treated POME sludge, so the properties
summarised in Table 4 were obtained from the literature.
-48%-6%
53%
-52%
-94%
47%
-100%
-80%
-60%
-40%
-20%
0%
20%
40%
60%
80%
100%
GWP AP EP
% o
f con
trib
utio
ns to
env
iron
me
nta
l im
pact
s
CLB CSTR

17
Table 4 Properties of POME anaerobic sludge and treated POME sludge Property POME anaerobic sludge (A) [38] Treated POME sludge (B) [37] pH value 7.41 7.40 Moisture content (%) 95.0 68.46 Carbon (%) 37.5 25.53 Nitrogen (%) 4.7 4.21 C/N ratio 6.7 6.35 Volatile solids (%) - 89.43 Total solids (%) - 32.40 Phosphorus (%) 1.25 ± 0.10 0.08 ± 0.01 Potassium (%) 5.16 ± 2.20 0.03 ± 0.01
In this study, EP has a negative environmental impact compared to GWP and AP in the
case of both the CLB and CSTR systems. The total EP values for the CLB and CSTR systems
were 0.054 kg PO替戴貸eq and 0.048 kg PO替戴貸eq, respectively. However, the total EP value of both
systems can be offset by the application of 1.6667 kg sludge for composting for every 1 kWh
of electricity generation. Currently, both POM 1 and POM 2 use POME anaerobic sludge for
composting. In order to evaluate the use of sludge for composting as a possible solution to the
EP impact, a sensitivity analysis was carried out, the results of which are illustrated in Fig. 5
and Fig. 6.
Fig. 5. Total EP impact based on variation in composition of sludge
0.0000
0.0050
0.0100
0.0150
0.0200
0.0250
0.0300
100 A 90 A +10 B
80 A +20 B
70 A +30 B
60 A +40 B
50 A +50 B
40 A +60 B
30 A +70 B
20 A +80 B
10 A +90 B
100 B
Tot
al E
P (
Ph
osph
ate
-eq/
kWh
)
Amount of mixed sludge composition (%)
CLB
CSTR
18
Fig. 6. Total EP impact based on variation in amount of POME anaerobic sludge
Fig. 5 shows that the total EP value gradually increases when the proportion of treated
POME sludge in the mixed sludge increases in relation to the amount of POME anaerobic
sludge. The lowest EP value is observed when the sludge is composed solely of POME
anaerobic sludge. However, as shown in Fig. 6, the result differs markedly when only POME
anaerobic sludge is used for composting. When the amount of POME anaerobic sludge is
increased by approximately 0.2 kg, the total EP value reduces for the CLB and CSTR systems
by 19% and 28.6%, respectively. This is due to the increment in the nitrogen and phosphorus
content of this sludge, which contributes toward offsetting the overall EP impact.
The above results indicate that the EP value can only be improved by adding more
POME anaerobic sludge. Altering the composition of 1.6667 kg of sludge that consists of
POME anaerobic sludge and treated POME sludge by adding more treated POME sludge tends
to increase the overall EP value (Fig. 5). This is because the amount of nitrogen and phosphorus
in the mixture tends to reduce when more treated POME sludge is added, increasing the overall
contribution of phosphate to the EP impact.
As the amount of POME anaerobic sludge used for composting increases, the total EP
value tends to gradually decrease. The EP value drops below zero for the CSTR system when
the amount of sludge used is 2.467 kg for 1 kWh of electricity generation. However, the EP
value of the CLB system only drops below zero when the amount of sludge used is 2.867 kg
for 1 kWh of electricity generation. This indicates that an increment of 1.2 kg of POME
-0.015
-0.01
-0.005
0
0.005
0.01
0.015
0.02
0.025
1.667 1.867 2.067 2.267 2.467 2.667 2.867
Tot
al E
P (
Ph
osph
ate
-eq/
kWh
)
Amount of POME anaerobic sludge (kg)
CLB
CSTR
19
anaerobic sludge per 1 kWh could completely offset the total EP value for both CLB and CSTR
systems, reducing the impact to below zero. Increasing the use of this type of sludge for
composting would therefore result in a net environmental benefit, and building a concrete wall
around the pond for both the CLB and CSTR systems would definitely improve the EP result
even further.
4. Conclusion
The aim of this study was to undertake a LCA of two different POME treatment
technologies in two POMs in order to identify whether employing a closed AD system would
be more beneficial from an environmental perspective. Our key findings show that:
Both the CLB and CSTR systems have a net environmental benefit in terms of GWP
and AP. However, the CSTR system captured 0.39 kg CO2 eq/kWh and 2.06 kg SO2
eq/kWh more than the CLB system.
In terms of the EP impact, the CSTR system was more beneficial as it emitted 0.006 kg PO替戴貸eq less than the CLB system. Mitigation measures, such as the use of concrete for
the pond wall, are crucial to reduce the EP impact of both systems. Moreover,
increasing the amount of anaerobic POME sludge used for composting by 1.2 kg per 1
kWh can result in an EP value below zero.
The findings presented offer important insights to encourage mill owners to implement
more environmentally friendly biogas facilities in POMs. Such facilities could generate energy
and increase the contribution of biogas to the primary energy production mix in Malaysia.
Malaysia has committed to reducing GHG emissions by 45% by 2030 in its Nationally
Determined Contributions under the Paris Agreement. As such, finding ways in which to
increase the share of renewables in the national energy mix, while also dealing with POME
waste, is both nationally and globally important.
Issues to be addressed in future research are varied. A wider range of boundaries should
be focussed on where possible, as this study only looked at gate to gate considerations due to
data limitations. Further research is needed to study the impacts of the final discharge. For
instance, impacts from digestate POME following land application should be taken into
consideration. Additionally, collection of primary data on the properties of POME anaerobic
sludge is needed to further verify the results of the sensitivity analysis. LCA can be conducted
20
using different methodologies to those used here, such as ReCiPe, which looks into endpoint
impacts, including those on the end user of the electricity generated by the national grid. A
wider range of POME treatment to energy generation technologies from other countries could
be compared for a more comprehensive picture of options. Our study considered two different
treatment technologies due to its focus on systems in Malaysia, where application of different
types of POME treatment to energy generation technologies is currently limited.
Acknowledgements
This work was supported by the Ministry of Education Malaysia (4B297) and the
Biotechnology and Biological Sciences Research Council (BB/P027717/1).
References
[1] MPOB. Malaysian oil palm statistics 2017. 37th ed. Bangi,Malaysia: Malaysian Palm
Oil Board;2018. p. 205.
[2] Kushairi A, Kheang LS, Azman I, Hishamuddin E, Ong-Abdullah M, Izuddin ZBMN,
et al. Oil palm economic performance in Malaysia and r&d progress in 2017. J Oil Palm
Res 2018;30(2):163-95.
[3] Yasin MHM, Mamat R, Najafi G, Ali OM, Yusop AF, Ali MH. Potentials of palm oil
as new feedstock oil for a global alternative fuel: A review. Renew Sust Energ Rev
2017;79:1034–49.
[4] Sue TT, Pantzaris TP. Chapter 6-energy from oil palm biomass. Pocketbook of oil palm
uses. Malaysia: Malaysian Palm Oil Board;2017. p. 139.
[5] Abdulrazik A, Elsholkami M, Elkamel A, Simon L. Multi-products productions from
Malaysian oil palm empty fruit bunch (EFB): Analyzing economic potentials from the
optimal biomass supply chain. J Clean Prod 2017;168:131–48.
[6] Loh SK. The potential of the Malaysian oil palm biomass as a renewable energy source.
Energ Convers Manage 2017;141:285–98.
[7] Saelor S, Kongjan P, O-Thong S. Biogas production from anaerobic co-digestion of
palm oil mill effluent and empty fruit bunches. In: The international conference on
“alternative energy in developing countries and emerging economies”;2017. p. 717-22
[Bangkok, Thailand].

21
[8] Kamyab H, Chelliapan S, Din MFM, Rezania S, Khademi T, Kumar A. Chapter 2-palm
oil mill effluent as an environmental pollutant. Palm oil. Malaysia: IntechOpen;2018.
p. 13-28.
[9] Choong YY, Chou KW, Norli I. Strategies for improving biogas production of palm oil
mill effluent (POME) anaerobic digestion: A critical review. Renew Sust Energ Rev
2018;82:2993-3006.
[10] Li Y, Chen Y, Wu J. Enhancement of methane production in anaerobic digestion: A
review. Appl Energ 2019;240:120-37.
[11] Safari GH, Yetilmezsoy K, Mahvi AH, Zarrabi M. Post-treatment of secondary
wastewater treatment plant effluent using a two-stage fluidized bed bioreactor system.
J Environ Health Sci 2013;11(10):1-9.
[12] Ahmed Y, Yaakob Z, Akhtar P, Sopian K. Production of biogas and performance
evaluation of existing treatment processes in palm oil mill effluent (POME). Renew
Sust Energ Rev 2015;42:1260–78.
[13] Daud MK, Rizvi H, Akram MA, Ali S, Rizwan M, Nafees M, et al. Review of upflow
anaerobic sludge blanket reactor technology: Effect of different parameters and
developments for domestic wastewater treatment. J Chem-Ny 2018;1–13.
[14] Emadian SM, Rahimnejad M, Hosseini M, Khoshandam B. Investigation on upflow
anaerobic sludge-fixed film (UASFF) reactor for treating low-strength bilge water of
caspian sea ships. J Environ Health Sci Eng 2015;13(23):1-9.
[15] Zhu G, Jha AK. Psychrophilic dry anaerobic digestion of cow dung for methane
production: Effect of inoculum. Science Asia 2013;39:500-10.
[16] Cruz-Salmon A, Rios-Valdovinos E, Pola-Albores F, Lagunas-Rivera S, Meza-
Gordillo R, Ruiz-Valdiviezo VM, et al. Expanded granular sludge bed bioreactor in
wastewater treatment. J Environ Sci Manage 2019;5(1):119–38.
[17] Mutungwazi A, Mukumba P, Makaka G. Biogas digester types installed in South
Africa: A review. Int J Hydrogen Energ 2018;81:172-80.
[18] Kariyama ID, Zhai X, Wu B. Influence of mixing on anaerobic digestion efficiency in
stirred tank digesters: A review. Water Res 2018;143:503-17.
[19] Carneiro MLNM, Pradelle F, Braga SL, Gomes MSP, Martins ARFA, Turkovics F, et
al. Potential of biofuels from algae: Comparison with fossil fuels, ethanol and biodiesel
in Europe and Brazil through life cycle assessment (LCA). Renew Sust Energ Rev
2017;73:632–53.
22
[20] Stichnothe H, Schuchardt F. Comparison of different treatment options for palm oil
production waste on a life cycle basis. Int J Life Cycle Ass 2010;15:907–15.
[21] Garcia-Nunez JA, Rodriguez DT, Fontanilla CA, Ramirez NE, Silva Lora EE, Frear C
S, et al. Evaluation of alternatives for the evolution of palm oil mills into biorefineries.
Biomass Bioenerg 2016;95:310–29.
[22] Nasution MA, Wibawa SD, Ahamed T, Noguchi R. Comparative environmental impact
evaluation of palm oil mill effluent treatment using a life cycle assessment approach:
A case study based on composting and a combination for biogas technologies in North
Sumatera of Indonesia. J Clean Prod 2018;184:1028–40.
[23] Eggleston HS, Buendia L, Miwa K, Ngara T, Tanabe K. IPCC Guidelines for National
Greenhouse Gas Inventories. Hayama, Japan: Institute for Global Environmental
Strategies;2006(a).
[24] CDM. Study on Grid Connected Electricity Baselines in Malaysia. Malaysia: Clean
Development Mechanism;2014.
[25] Doorn MRJ, Towprayoon S, Vieira SMM, Irving W, Palmer C, Pipatti R, et al. Chapter
6-wastewater treatment and discharge. IPCC Guidelines for National Greenhouse Gas
Inventories. Hayama, Japan: Institute for Global Environmental Strategies;2006(b).
[26] Lim XL, Lam WH. Review on clean development mechanism (CDM) implementation
in Malaysia. Renew Sust Energ Rev 2014;29:276-85.
[27] CDM. CDM project 2336: Felda Serting Hilir biogas power plant project. Malaysia:
Clean Development Mechanism, http://cdm.unfccc.int/Projects/DB/SGS-
UKL1227808382.8/view;2008 [accessed 10 February 2019].
[28] Eshun JF, Apori SO, Oppong-Anane K. Environmental system analysis of tomato
production in Ghana. Afr. Crop Sci. J. 2011;19(3):165–72.
[29] UNFCC. CDM Methodology Booklet. Bonn, Germany: United Nations Framework
Convention on Climate Change,
https://cdm.unfccc.int/methodologies/documentation/meth_booklet.pdf;2017
[accessed 6 February 2019].
[30] Chan YH, Tan RR, Yusup S, Lam HL, Quitain AT. Comparative life cycle assessment
(LCA) of bio-oil production from fast pyrolysis and hydrothermal liquefaction of oil
palm empty fruit bunch (EFB). Clean Techn Environ Policy 2016;18:1759–68.
[31] Chatterjee R, Sharma V, Mukherjee S, Kumar S. Life cycle assessment of bio-diesel
production – a comparative analysis. J. Inst. Eng. India Ser. C 2014;95(2):143–49.

23
[32] Woon KS, M.C Lo I, L.H. Chiu S, Y.S Yan D. Environmental assessment of food waste
valorization in producing biogas for various types of energy use based on LCA
approach. Waste Manage 2016;50:290-9.
[33] Lorenzi G, Gorgoroni M, Silva C, Santarelli M. Life Cycle Assessment of biogas
upgrading routes. In: The 10th international conference on “applied energy”;2018. p.
2012-18 [Hong Kong, China].
[34] Harsono SS, Grundmann P, Siahaan D. Role of biogas and biochar palm oil residues
for reduction of greenhouse gas emissions in the biodiesel production. In: The 3rd
international conference on “new, renewable energy and energy conservation”;2015. p.
344-51 [Jakarta, Indonesia].
[35] Nasution MA, Wibawa SD, Ahamed T, Noguchi R. Selection of palm oil mill effluent
treatment for biogas generation or compost production using an analytical hierarchy
process. J Mater Cycles Waste Manag 2017;1–13.
[36] Lansche J, Muller J. Life cycle assessment (LCA) of biogas versus dung combustion
household cooking systems in developing countries: A case study in Ethiopia. J Clean
Prod 2017;165:828-35.
[37] Khairuddin MdN, Zakaria AJ, Isa IMd, Jol H, Wan-Mohd-Nazri WAR, Salleh MdKS.
The potential of treated palm oil mill effluent (pome) sludge as an organic fertilizer.
AGRIVITA J Agr Sci 2016;38(2):142-54.
[38] Baharuddin AS, Hock LS, Yusof MZM, Rahman NAB, Shah UkM, Hassan MA, et al.
Effects of palm oil mill effluent (POME) anaerobic sludge from 500 m3 of closed
anaerobic methane digested tank on pressed-shredded empty fruit bunch (EFB)
composting process. Afr J Biotechnol 2010;9(16):2427-36.