energy generation, storage, and...
TRANSCRIPT
Energy Generation, Storage,and Transformation
Roderick M. Macrae

1. Chemical Fuels
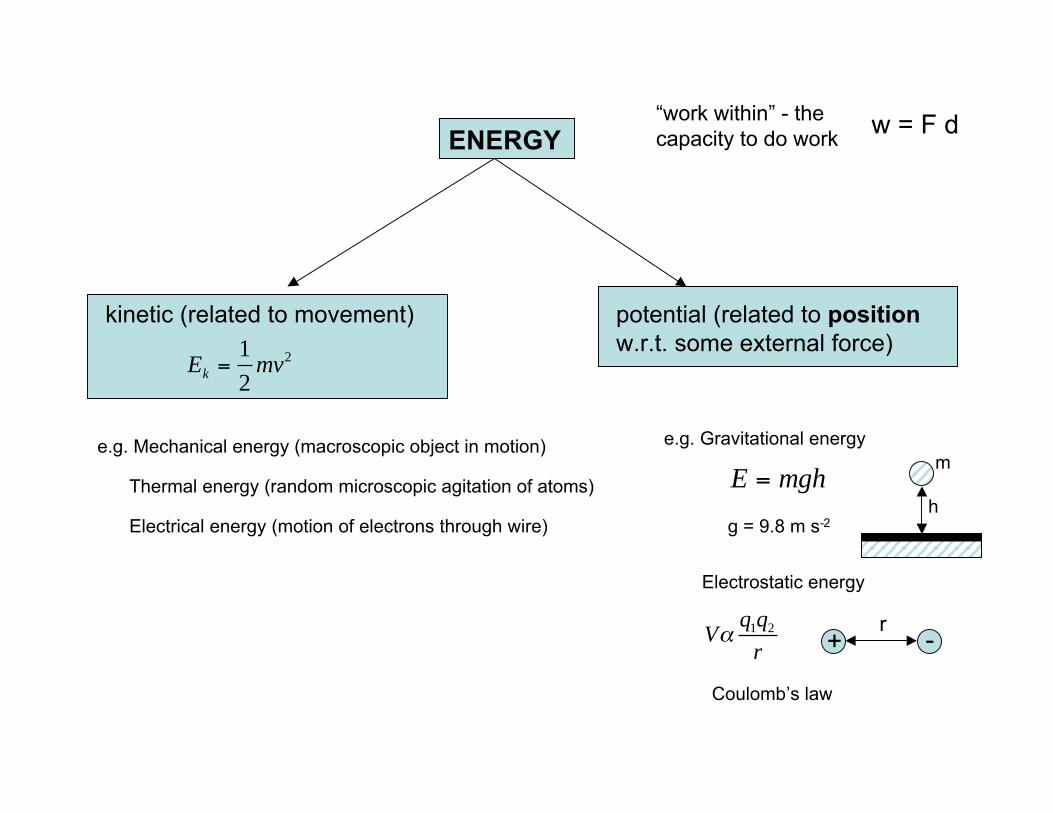
ENERGY
kinetic (related to movement)
Ek =12
mv2
“work within” - thecapacity to do work
w = F d
e.g. Mechanical energy (macroscopic object in motion)
Thermal energy (random microscopic agitation of atoms)
Electrical energy (motion of electrons through wire)
potential (related to positionw.r.t. some external force)
e.g. Gravitational energym
hE = mghg = 9.8 m s-2
-r
Electrostatic energy
+Vαq1q2
r
Coulomb’s law
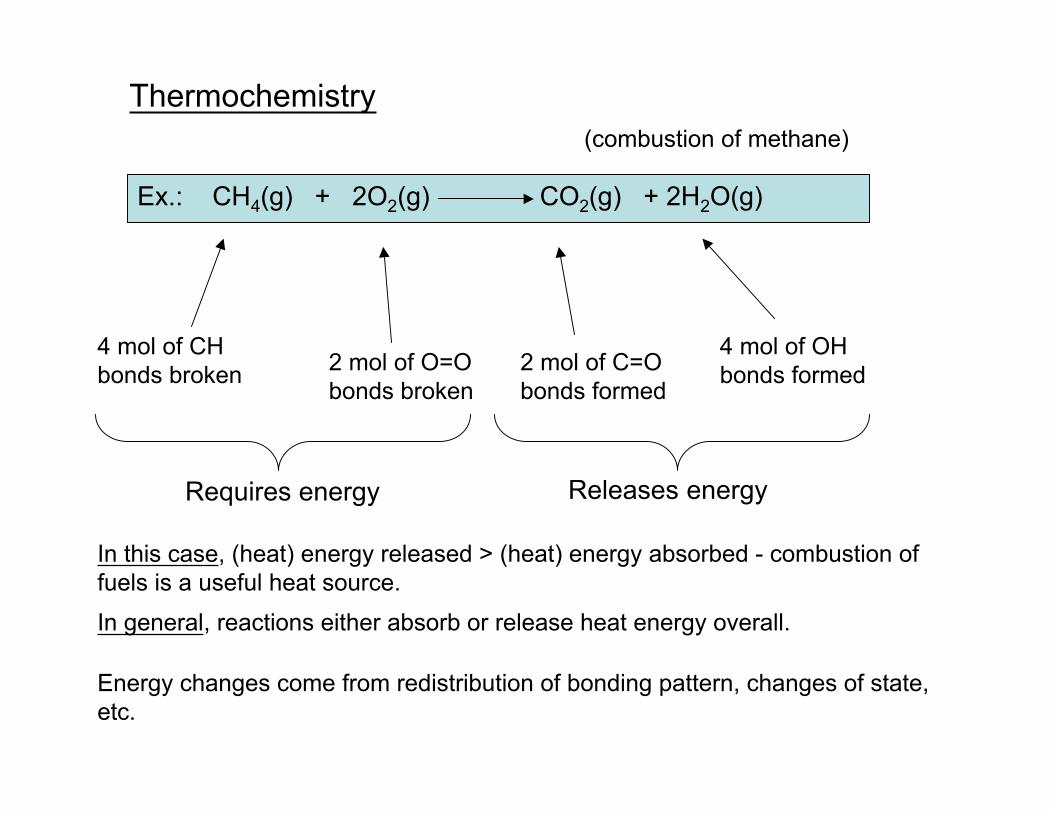
Thermochemistry
Ex.: CH4(g) + 2O2(g) CO2(g) + 2H2O(g)
(combustion of methane)
4 mol of CHbonds broken 2 mol of O=O
bonds broken2 mol of C=Obonds formed
4 mol of OHbonds formed
Requires energy Releases energy
In this case, (heat) energy released > (heat) energy absorbed - combustion offuels is a useful heat source.
In general, reactions either absorb or release heat energy overall.
Energy changes come from redistribution of bonding pattern, changes of state,etc.
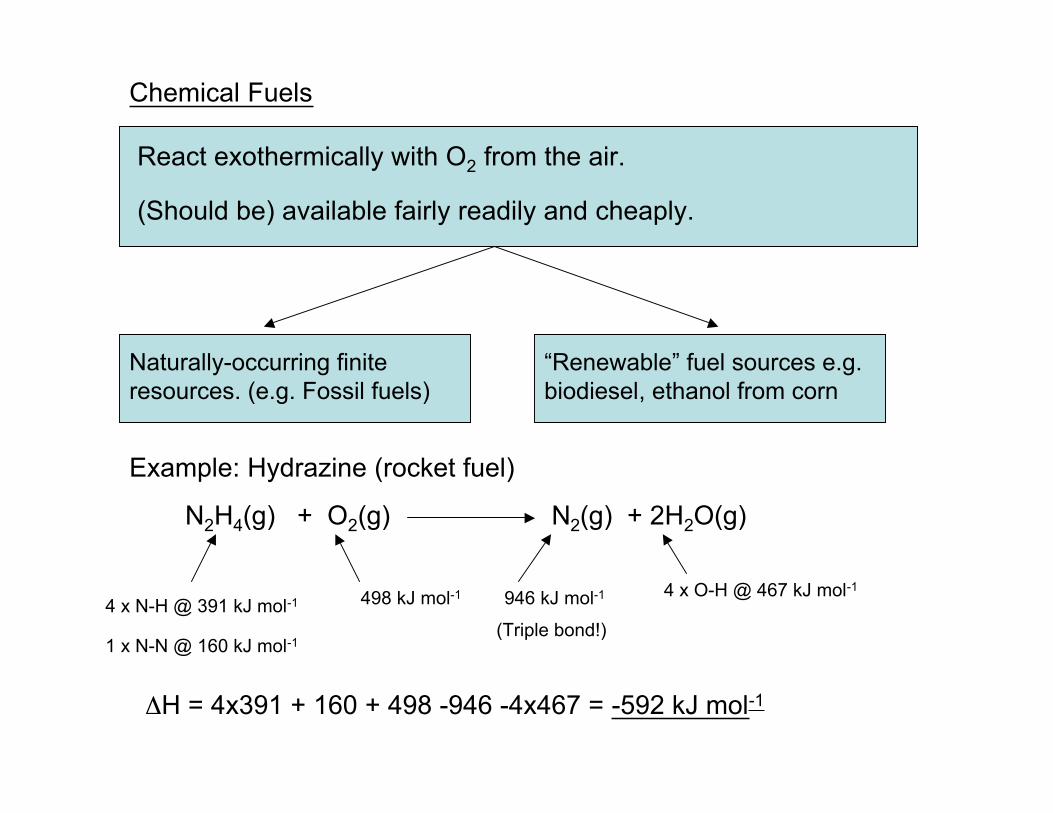
Chemical Fuels
React exothermically with O2 from the air.
(Should be) available fairly readily and cheaply.
Naturally-occurring finiteresources. (e.g. Fossil fuels)
“Renewable” fuel sources e.g.biodiesel, ethanol from corn
Example: Hydrazine (rocket fuel)
N2H4(g) + O2(g) N2(g) + 2H2O(g)
4 x N-H @ 391 kJ mol-1
1 x N-N @ 160 kJ mol-1
498 kJ mol-1 946 kJ mol-1
(Triple bond!)
4 x O-H @ 467 kJ mol-1
ΔH = 4x391 + 160 + 498 -946 -4x467 = -592 kJ mol-1
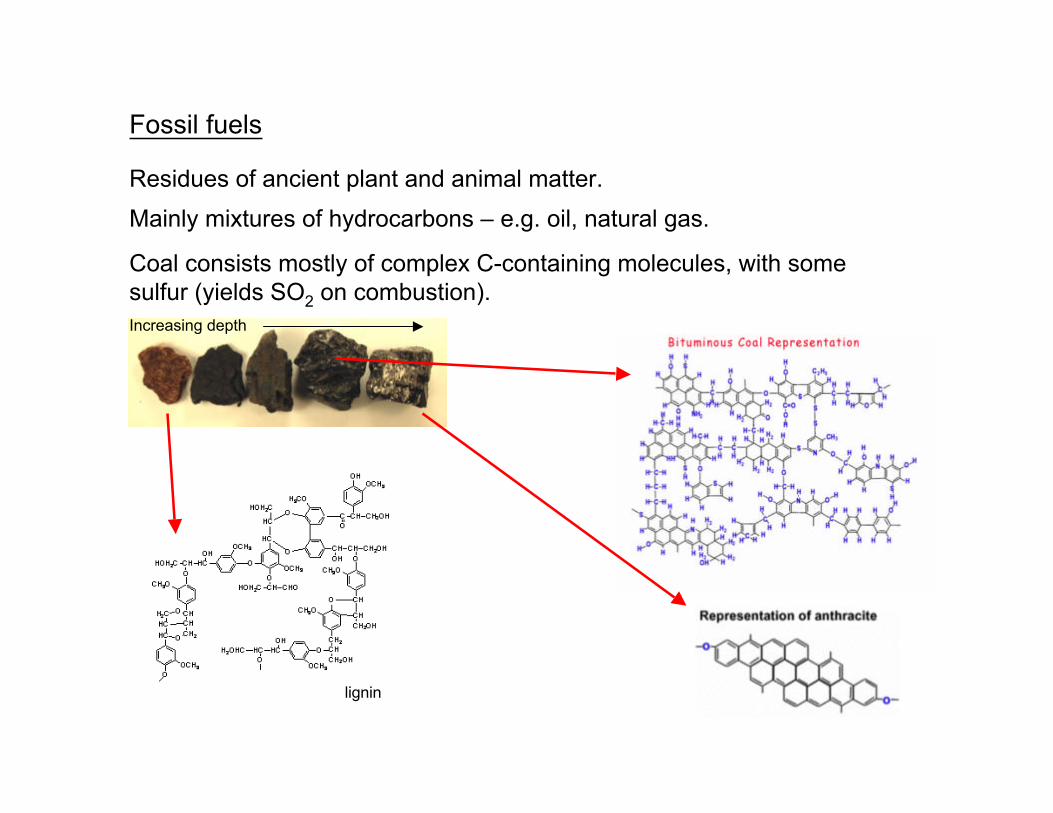
Fossil fuels
Residues of ancient plant and animal matter.
Mainly mixtures of hydrocarbons – e.g. oil, natural gas.
Coal consists mostly of complex C-containing molecules, with somesulfur (yields SO2 on combustion).Increasing depth
lignin
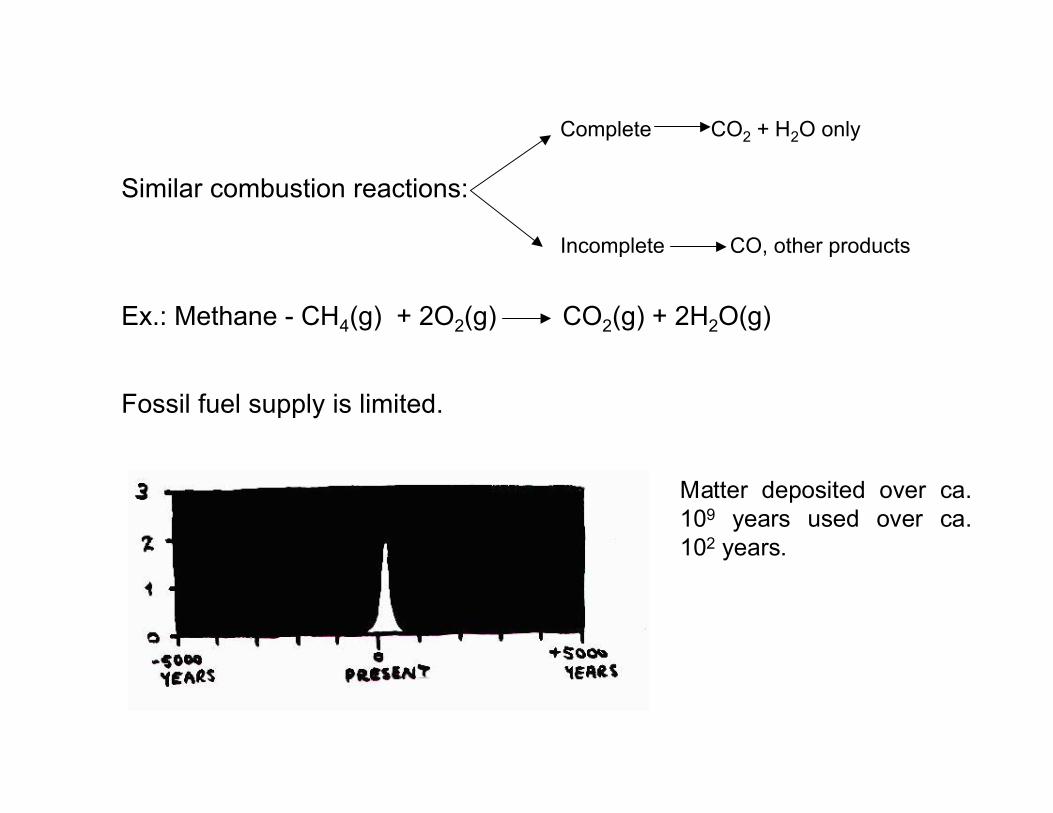
Similar combustion reactions:
Complete CO2 + H2O only
Incomplete CO, other products
Ex.: Methane - CH4(g) + 2O2(g) CO2(g) + 2H2O(g)
Fossil fuel supply is limited.
Matter deposited over ca.109 years used over ca.102 years.
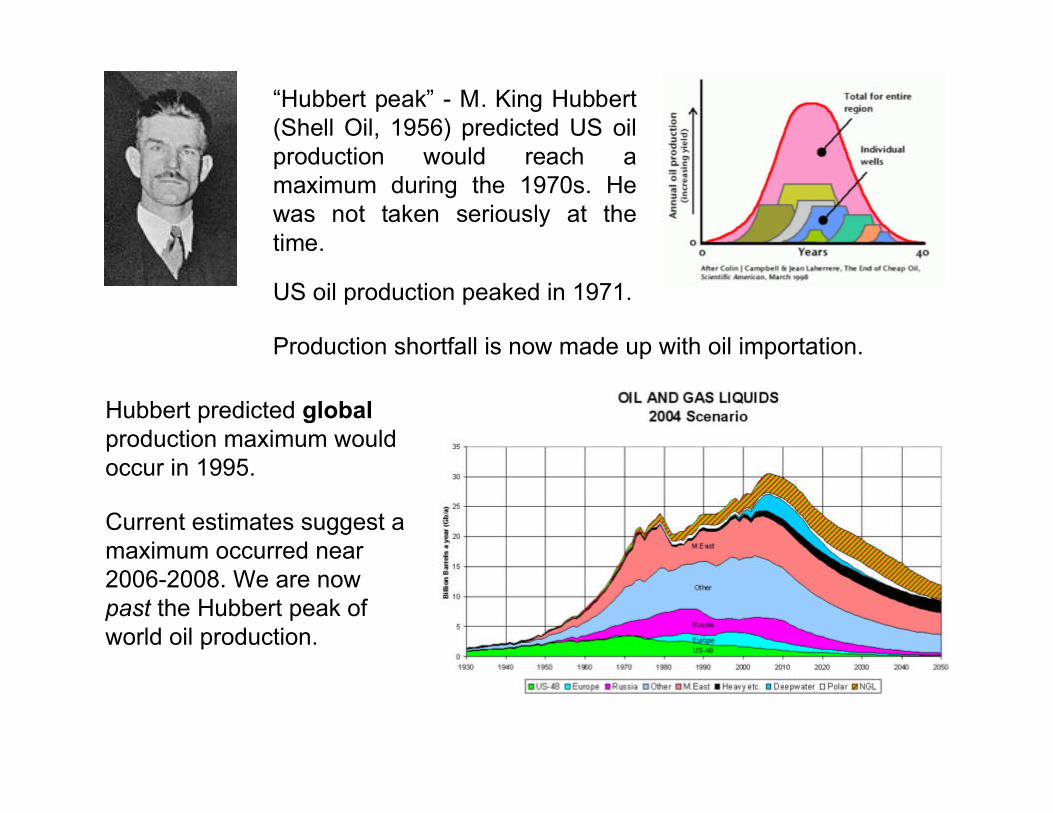
“Hubbert peak” - M. King Hubbert(Shell Oil, 1956) predicted US oilproduction would reach amaximum during the 1970s. Hewas not taken seriously at thetime.
US oil production peaked in 1971.
Hubbert predicted globalproduction maximum wouldoccur in 1995.
Production shortfall is now made up with oil importation.
Current estimates suggest amaximum occurred near2006-2008. We are nowpast the Hubbert peak ofworld oil production.
Alternative future combustion-based energy sources
Hydrogen: H2(g) + 1/2 O2(g) H2O(g) ΔH° = -241.8 kJ (= - ΔH°f(H2O))
Liquefaction difficult (b.p. 20.8 K) - H storage is an issue. (Ideas: In Td holesof ccp Ti as TiH, in nanotubes, MOFs, etc. Target: reversible, 6 wt.% H2.)
Other problems: H2 production requires energy (electrolysis of water, etc.)
“Biomass” (e.g. carbohydrates (Cx(H2O)y), ethanol, etc.)
e.g. ethanol C2H5OH(l) + 3O2(g) 2CO2(g) + 3H2O(l) ΔH = -1367 kJ
Disadvantages:
ΔH less than gasoline (EtOH already partly oxidized)
By-product is acetaldehyde (component of urban smog)
To meet 10% of current demand would need to convert 25% of farmland tofuel production.

Comparing fuels
fuel value (J/g)
energy density (J/mL)
e.g. CH4(g) 0.656 g/L 50.0 kJ/g 32.8 kJ/L
C2H5OH(g) 0.785 g/mL 26.8 kJ/g 2.1x10⁴ kJ/L
H2(g) 0.082 g/L 120.0 kJ/g 9.84 kJ/L
Example calculation:
Balanced combustion (H2 H2O, C CO2, N N2)
e.g. CH4(g) + 2O2(g) CO2(g) + 2H2O(g)
ΔH° = (-393.0 kJ + 2x-241.818 kJ) - (-74.81 kJ) = -802.34 kJ
F.V. = 802.34 kJ/mol x 1 mol/16.0428 g = 50.013 kJ/g
E.D. = 50.013 kJ/g x 0.656 g/L = 32.8 kJ/L
Non-fossil-fuel energy sources based on combustion maybe “renewable” but are not “sustainable”.
Why not?
CO2 production, climate change and the GreenhouseEffect.

2. The Greenhouse Effect
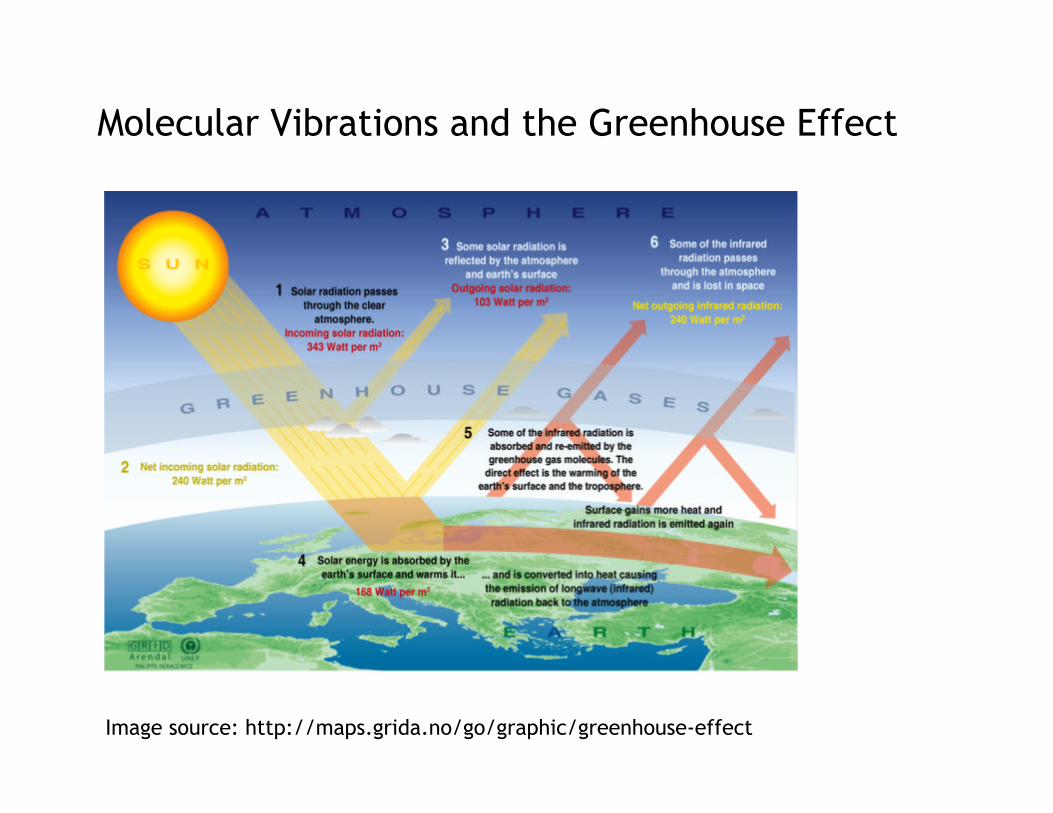
Molecular Vibrations and the Greenhouse Effect
Image source: http://maps.grida.no/go/graphic/greenhouse-effect
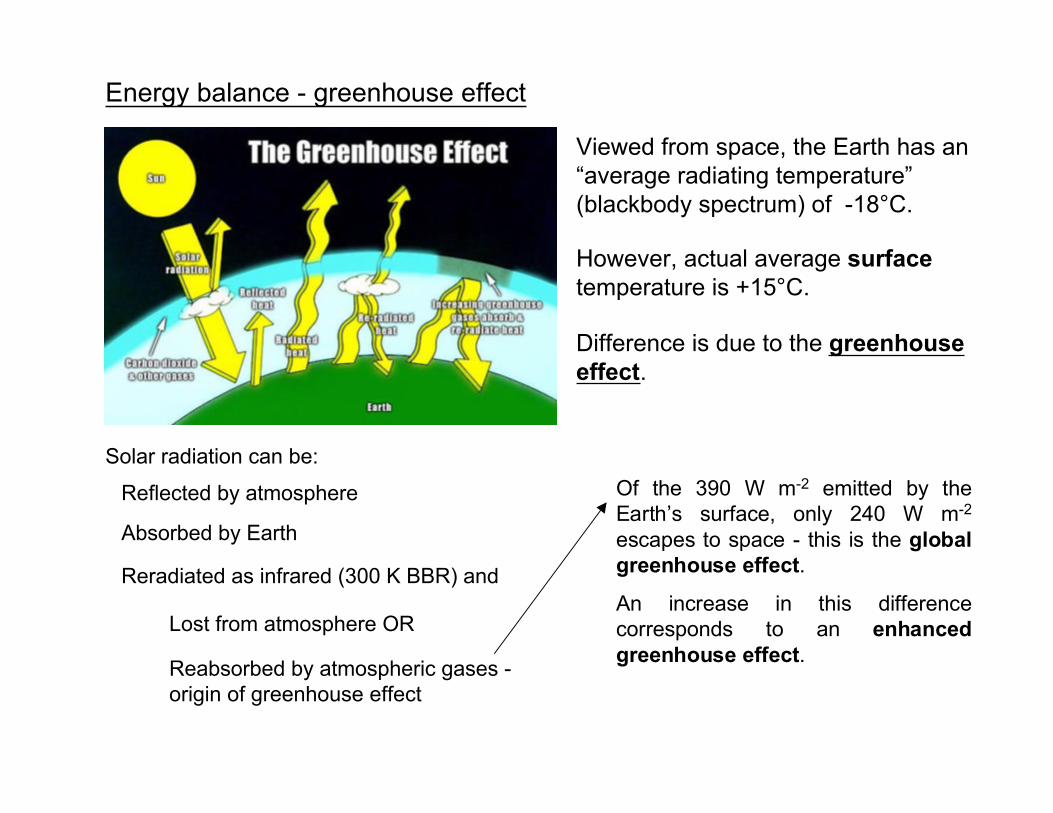
Energy balance - greenhouse effect
Viewed from space, the Earth has an“average radiating temperature”(blackbody spectrum) of -18°C.
However, actual average surfacetemperature is +15°C.
Difference is due to the greenhouseeffect.
Solar radiation can be:
Reflected by atmosphere
Absorbed by Earth
Reradiated as infrared (300 K BBR) and
Lost from atmosphere OR
Reabsorbed by atmospheric gases -origin of greenhouse effect
Of the 390 W m-2 emitted by theEarth’s surface, only 240 W m-2
escapes to space - this is the globalgreenhouse effect.
An increase in this differencecorresponds to an enhancedgreenhouse effect.
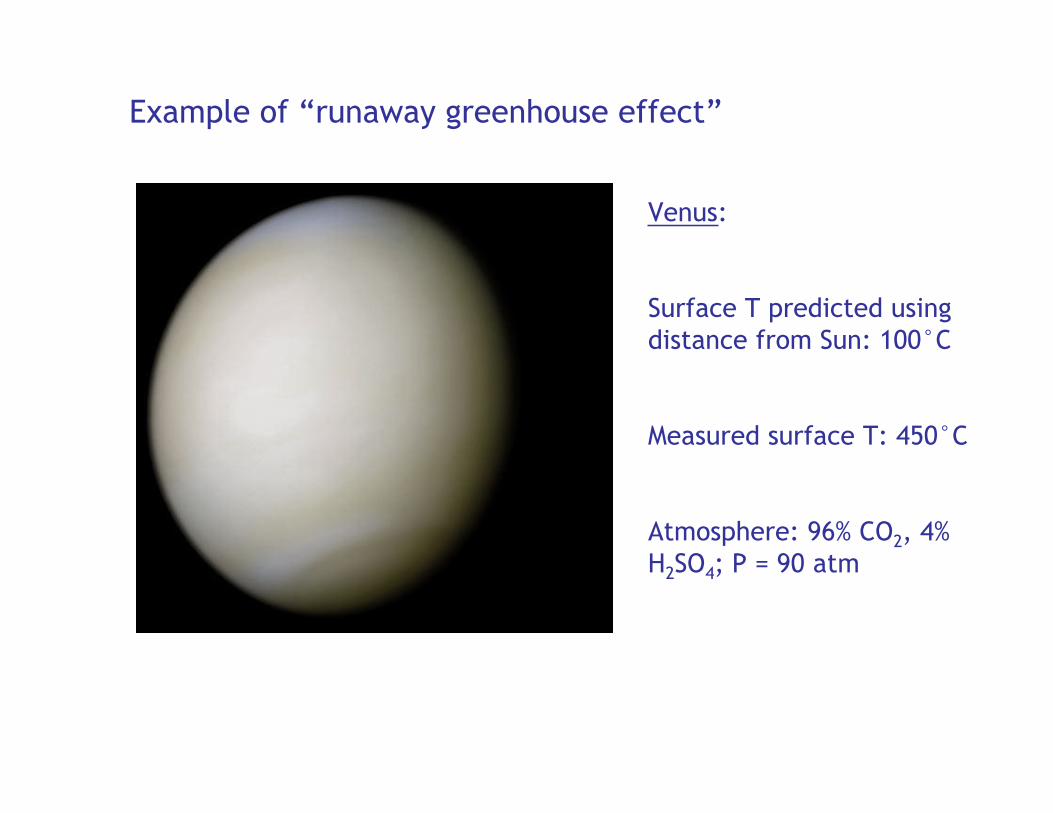
Example of “runaway greenhouse effect”
Venus:
Surface T predicted usingdistance from Sun: 100°C
Measured surface T: 450°C
Atmosphere: 96% CO2, 4%H2SO4; P = 90 atm
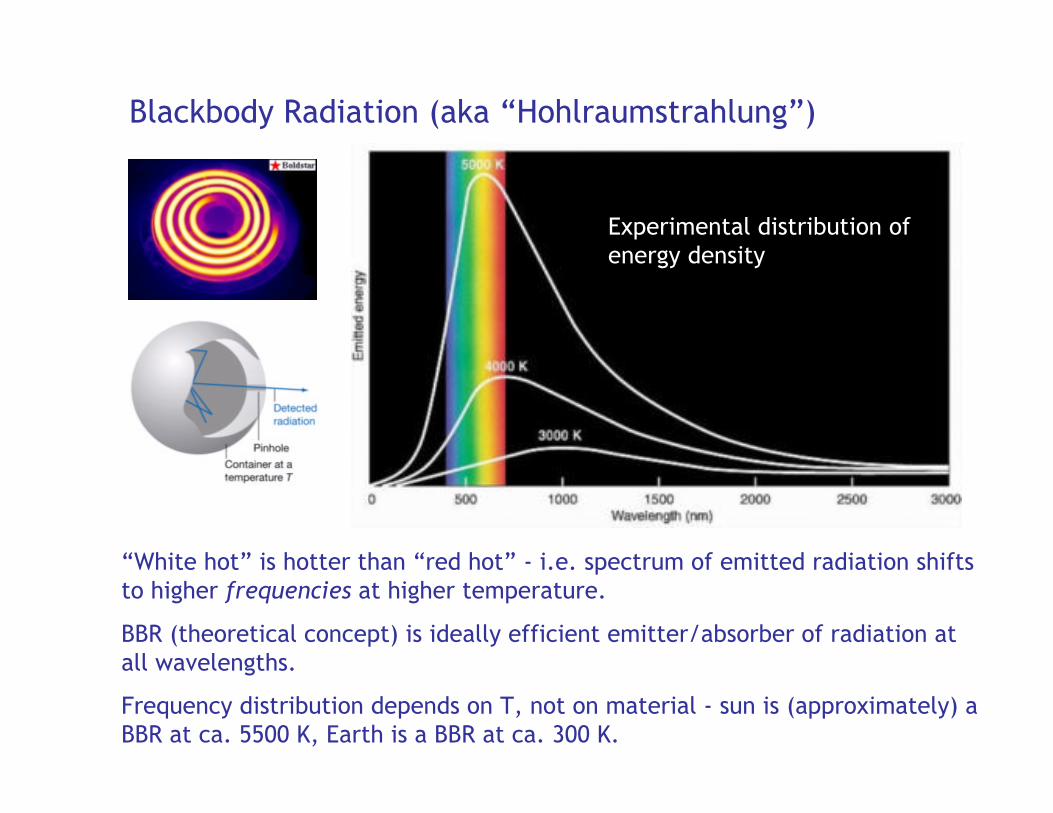
Blackbody Radiation (aka “Hohlraumstrahlung”)
“White hot” is hotter than “red hot” - i.e. spectrum of emitted radiation shiftsto higher frequencies at higher temperature.
BBR (theoretical concept) is ideally efficient emitter/absorber of radiation atall wavelengths.
Frequency distribution depends on T, not on material - sun is (approximately) aBBR at ca. 5500 K, Earth is a BBR at ca. 300 K.
Experimental distribution ofenergy density
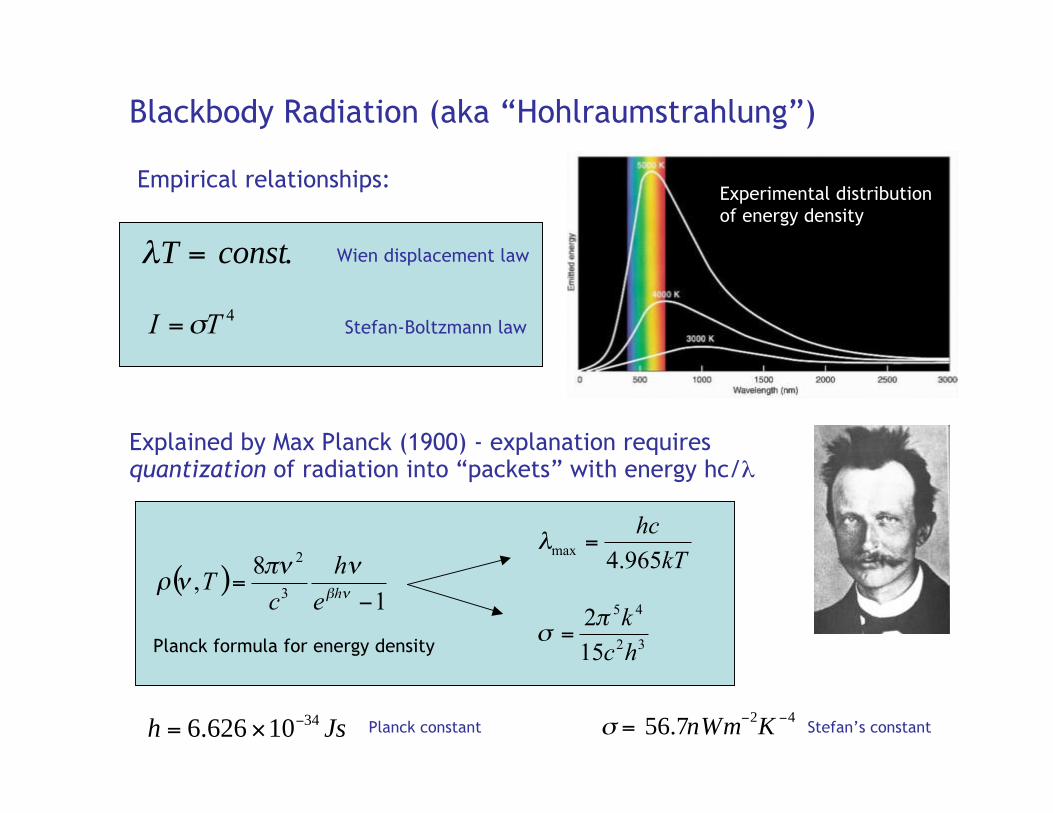
Blackbody Radiation (aka “Hohlraumstrahlung”)
Experimental distributionof energy density
Empirical relationships:
4TI σ=
Wien displacement law
Stefan-Boltzmann law
λT = const.
Explained by Max Planck (1900) - explanation requiresquantization of radiation into “packets” with energy hc/λ
( )1
8,
3
2
−= νβ
νπννρ
he
h
cT
kT
hc
965.4max =λ
32
45
15
2
hc
kπσ =
σ = 56.7nWm−2K −4Stefan’s constant
Planck formula for energy density
h = 6.626 ×10⁻³⁴ Js Planck constant
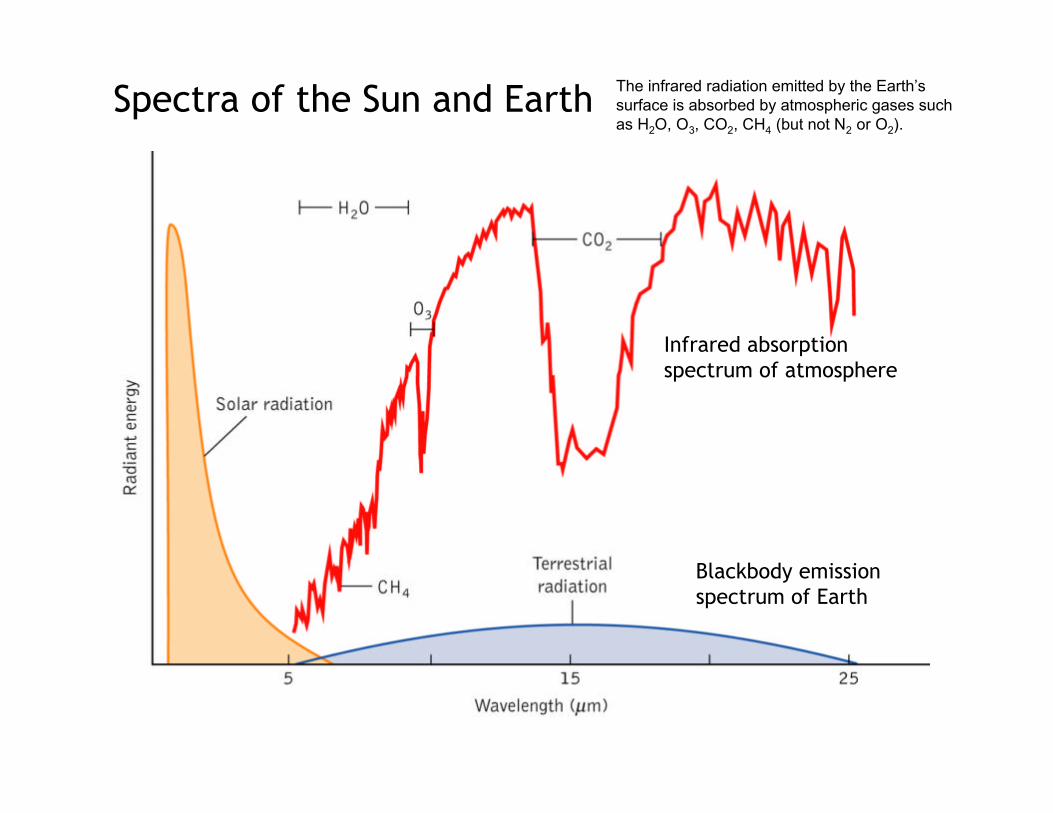
Spectra of the Sun and Earth
Infrared absorptionspectrum of atmosphere
Blackbody emissionspectrum of Earth
The infrared radiation emitted by the Earth’ssurface is absorbed by atmospheric gases suchas H2O, O3, CO2, CH4 (but not N2 or O2).
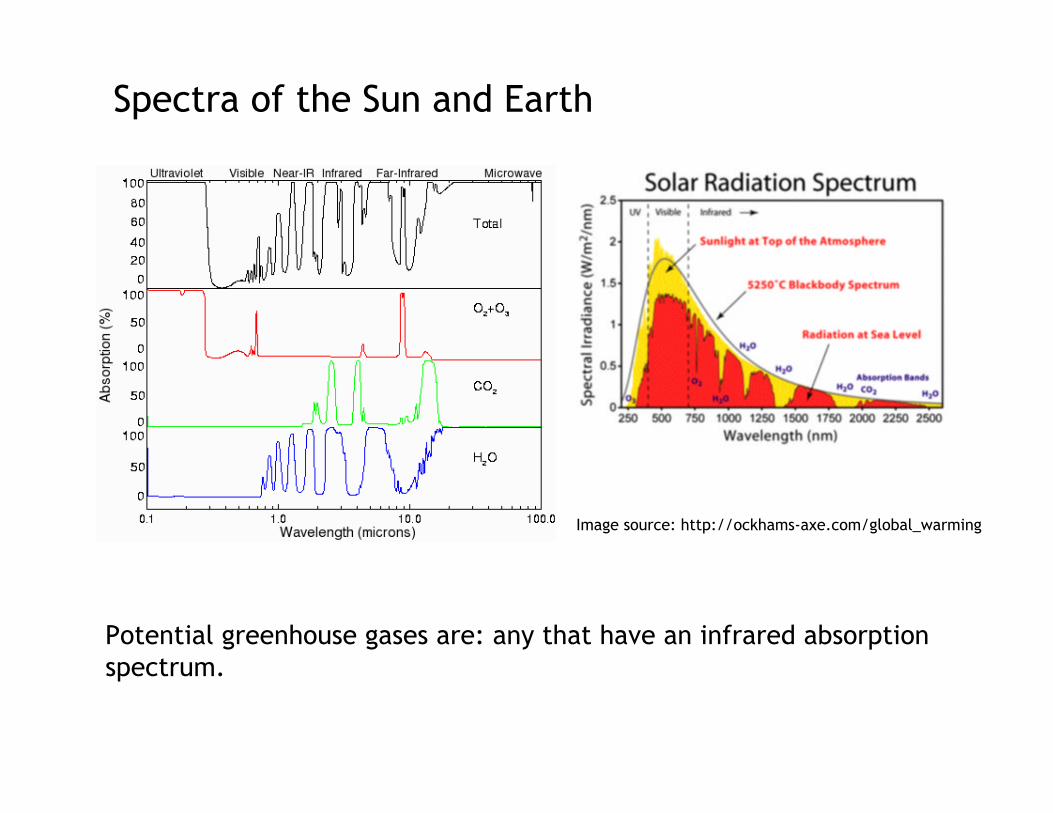
Image source: http://ockhams-axe.com/global_warming
Spectra of the Sun and Earth
Potential greenhouse gases are: any that have an infrared absorptionspectrum.
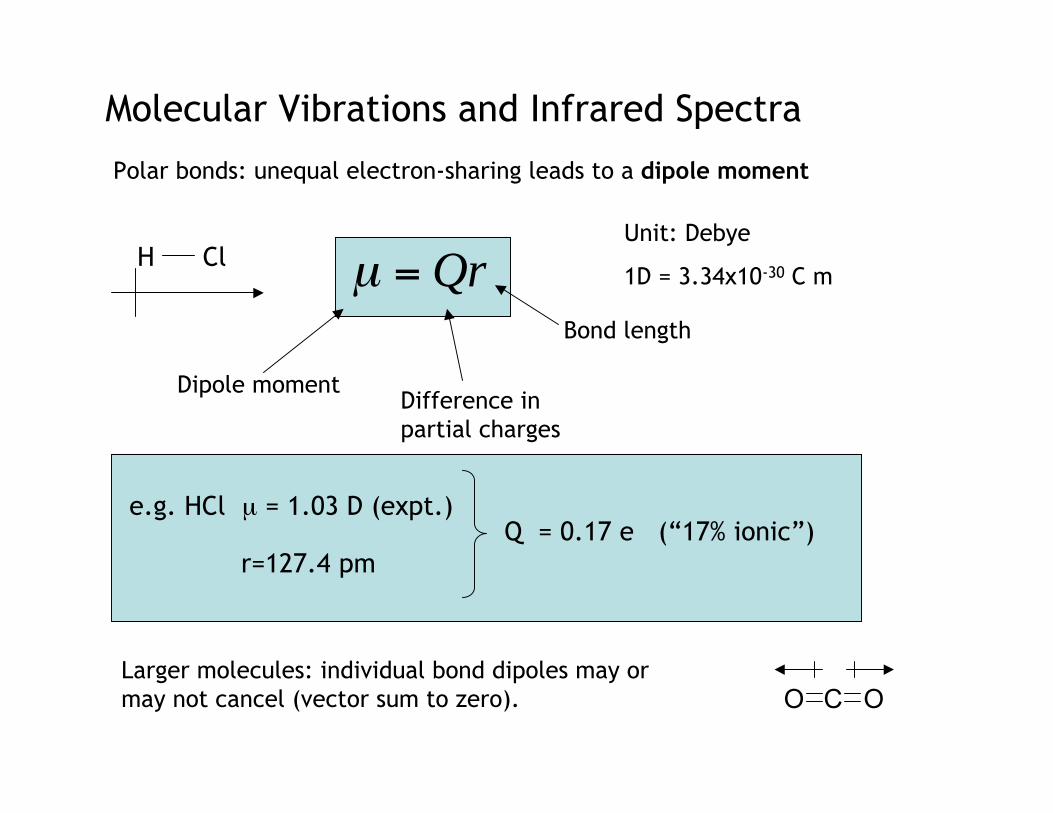
Molecular Vibrations and Infrared Spectra
Polar bonds: unequal electron-sharing leads to a dipole moment
H Cl µ = Qr
Dipole momentDifference inpartial charges
Bond length
Unit: Debye
1D = 3.34x10⁻³⁰ C m
e.g. HCl µ = 1.03 D (expt.)
r=127.4 pmQ = 0.17 e (“17% ionic”)
Larger molecules: individual bond dipoles may ormay not cancel (vector sum to zero). CO O
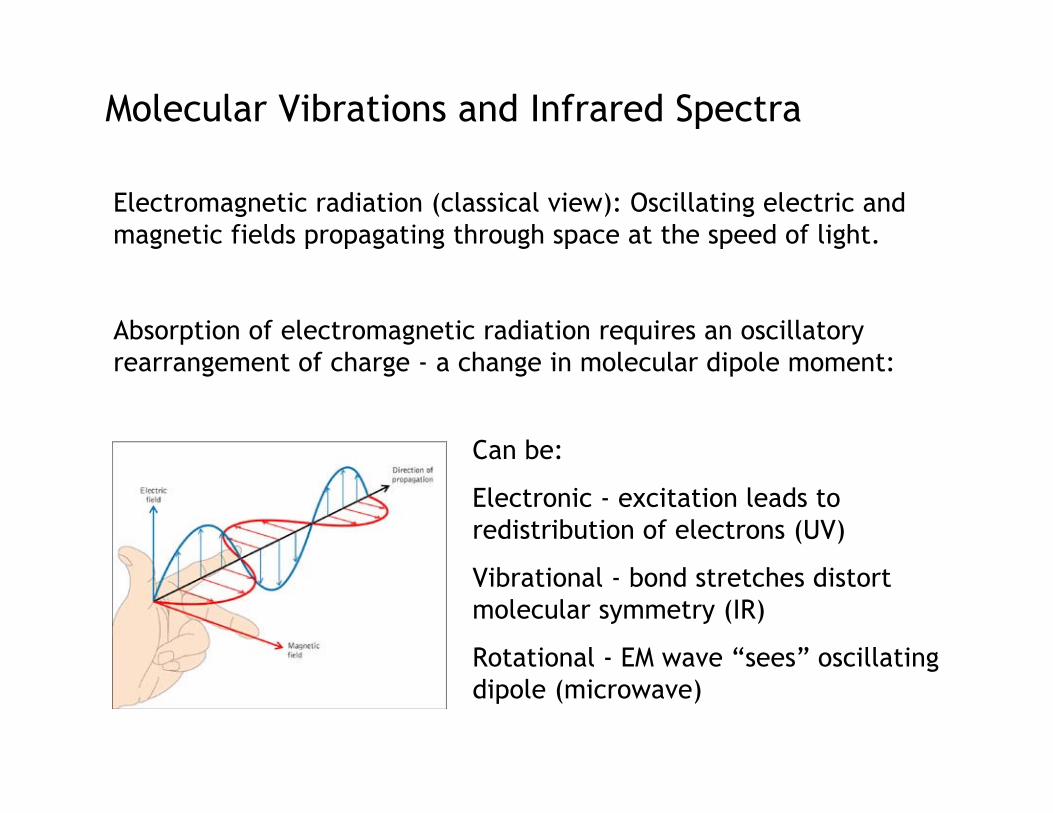
Molecular Vibrations and Infrared Spectra
Electromagnetic radiation (classical view): Oscillating electric andmagnetic fields propagating through space at the speed of light.
Absorption of electromagnetic radiation requires an oscillatoryrearrangement of charge - a change in molecular dipole moment:
Can be:
Electronic - excitation leads toredistribution of electrons (UV)
Vibrational - bond stretches distortmolecular symmetry (IR)
Rotational - EM wave “sees” oscillatingdipole (microwave)
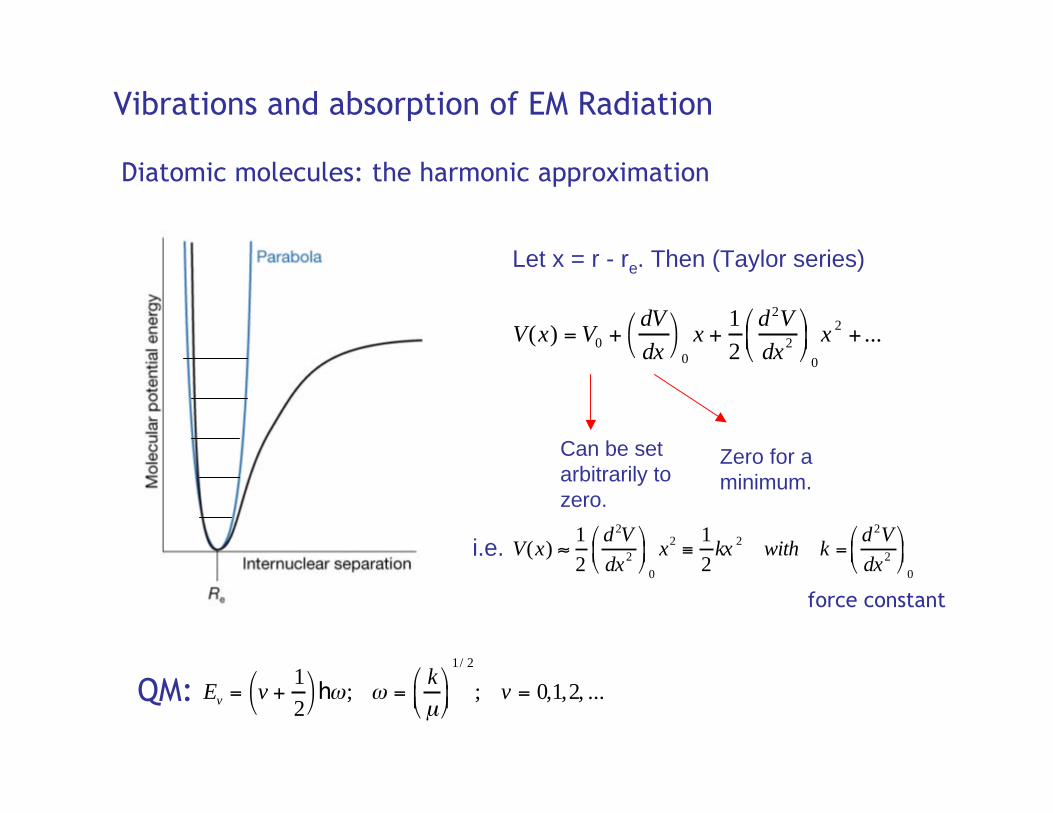
Vibrations and absorption of EM Radiation
Diatomic molecules: the harmonic approximation
Let x = r - re. Then (Taylor series)
V(x) = V0 +dVdx
0x +
12
d2Vdx2
0
x 2 + ...
Can be setarbitrarily tozero.
Zero for aminimum.
i.e. V(x) ≈ 12
d2Vdx2
0
x2 ≡12
kx 2 with k =d2Vdx2
0
force constant
Ev = v +
12
hω; ω =
kµ
1/ 2
; v = 0,1,2, ...QM:
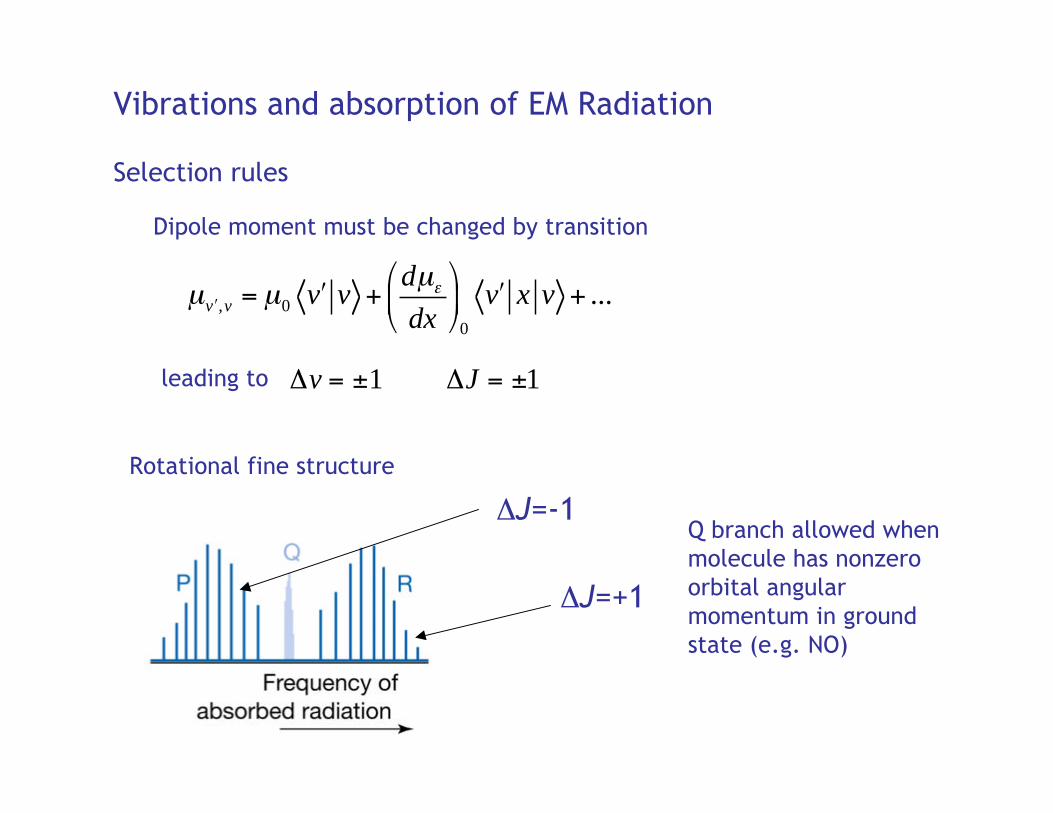
Vibrations and absorption of EM Radiation
Selection rules
Rotational fine structure
Δv = ±1 ΔJ = ±1leading to
ΔJ=-1
ΔJ=+1
Q branch allowed whenmolecule has nonzeroorbital angularmomentum in groundstate (e.g. NO)
Dipole moment must be changed by transition
µ ′v ,v = µ0 ′v v +dµεdx
0
′v x v + ...
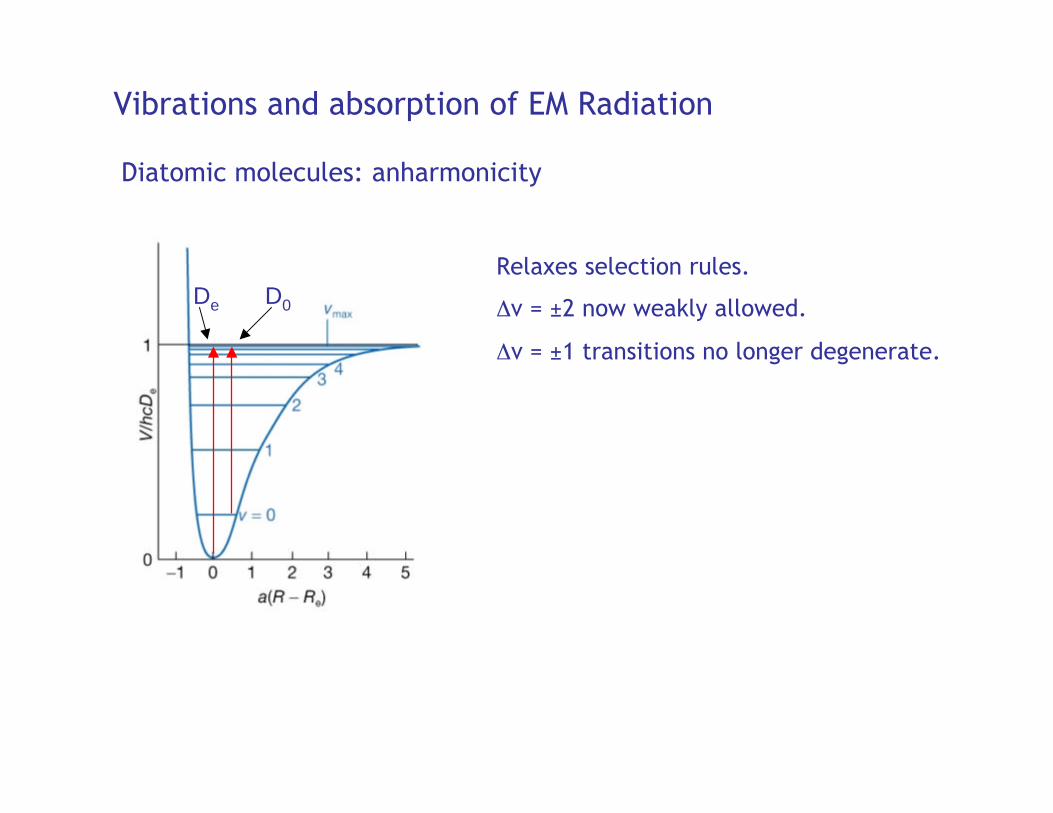
De D0
Vibrations and absorption of EM Radiation
Diatomic molecules: anharmonicity
Relaxes selection rules.
Δv = ±2 now weakly allowed.
Δv = ±1 transitions no longer degenerate.
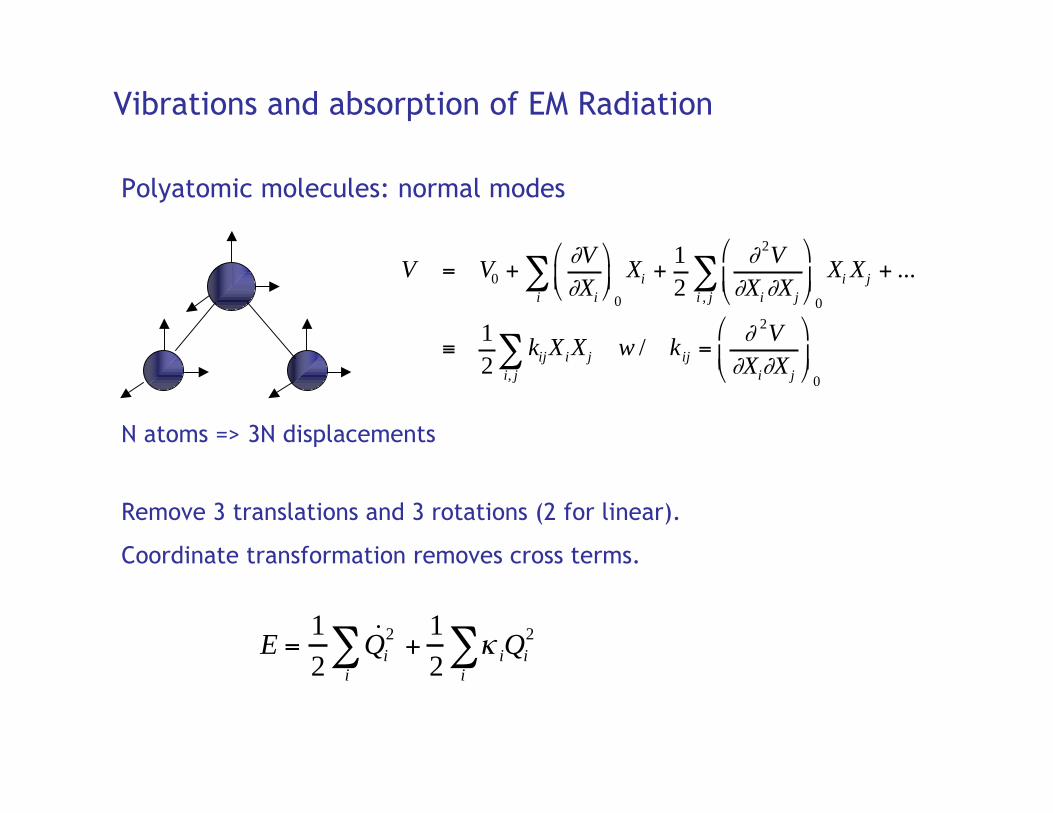
Vibrations and absorption of EM Radiation
V = V0 +∂V∂Xi
0
Xii∑ +
12
∂ 2V∂Xi∂Xj
0
Xii , j∑ Xj + ...
≡12
kijXii, j∑ Xj w / kij =
∂ 2V∂Xi∂Xj
0
Polyatomic molecules: normal modes
N atoms => 3N displacements
E =12
˙ Q i2
i∑ +
12
κ iQi2
i∑
Remove 3 translations and 3 rotations (2 for linear).
Coordinate transformation removes cross terms.

O2, N2 - homonuclear diatomics - µ = 0 for all possibleinternuclear distances r - no IR absorption.
3 “normal modes”, some of which can absorb IR
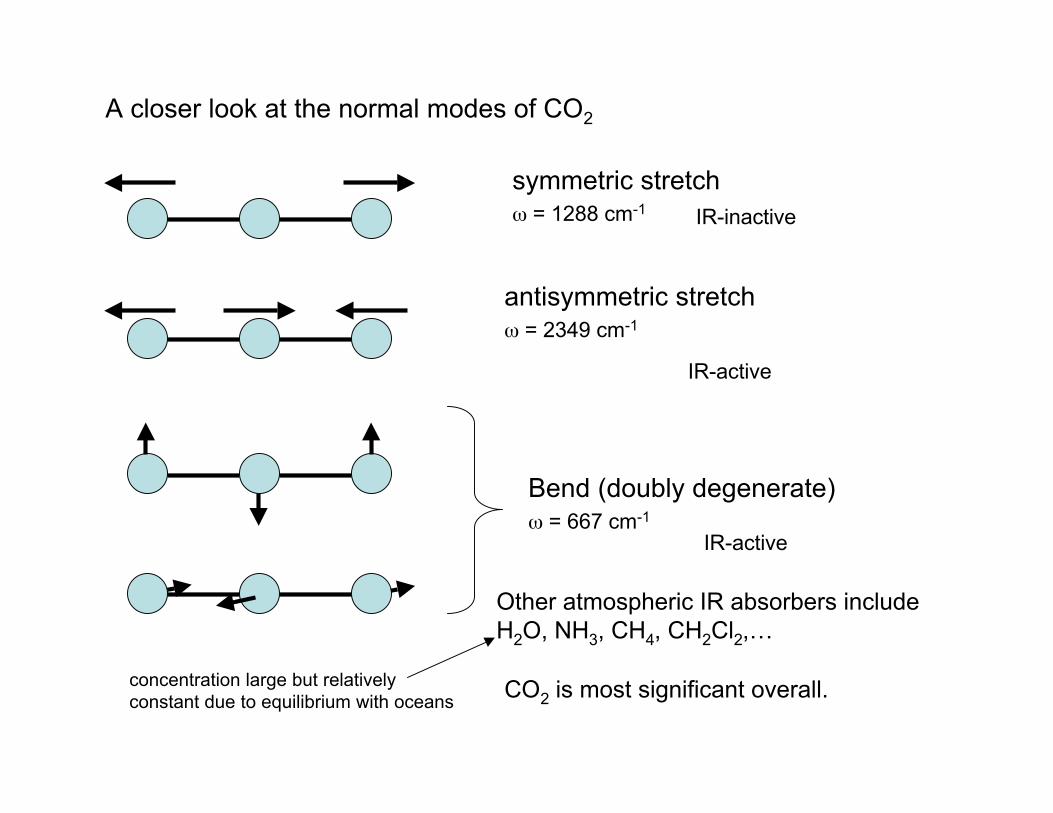
A closer look at the normal modes of CO2
symmetric stretchω = 1288 cm-1 IR-inactive
antisymmetric stretchω = 2349 cm-1
IR-active
Bend (doubly degenerate)ω = 667 cm-1
IR-active
Other atmospheric IR absorbers includeH2O, NH3, CH4, CH2Cl2,…
CO2 is most significant overall.concentration large but relativelyconstant due to equilibrium with oceans
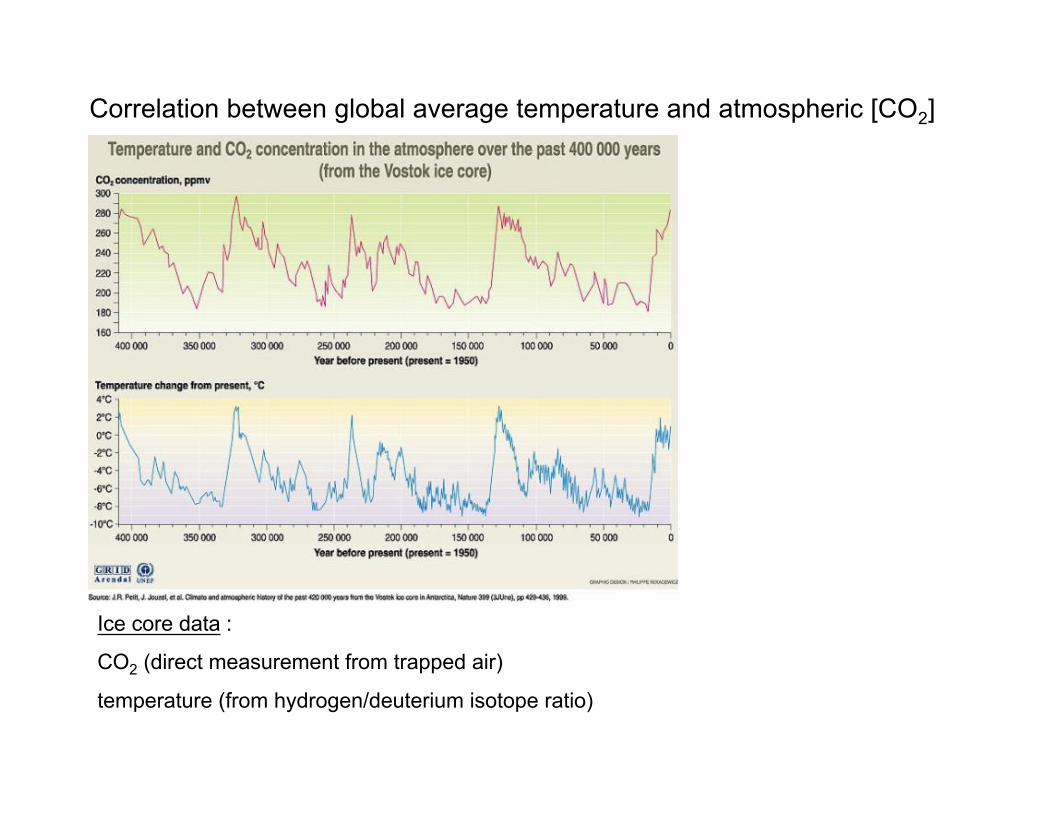
Correlation between global average temperature and atmospheric [CO2]
Ice core data :
CO2 (direct measurement from trapped air)
temperature (from hydrogen/deuterium isotope ratio)
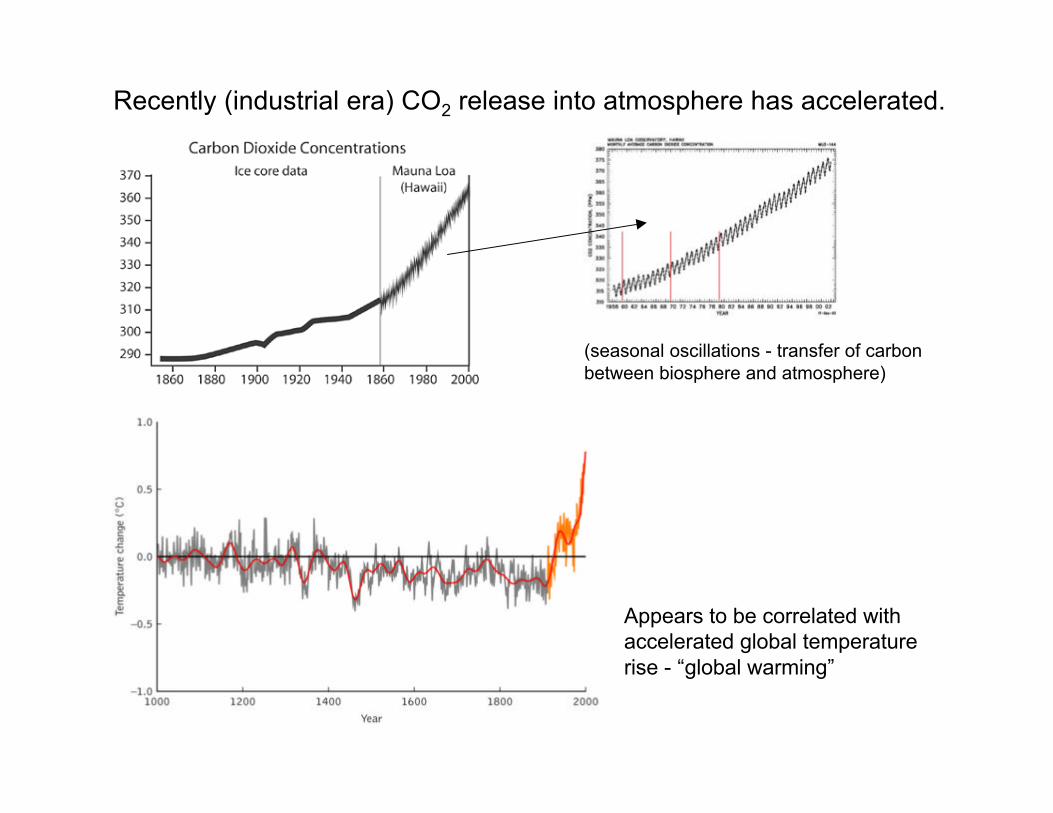
Recently (industrial era) CO2 release into atmosphere has accelerated.
Appears to be correlated withaccelerated global temperaturerise - “global warming”
(seasonal oscillations - transfer of carbonbetween biosphere and atmosphere)
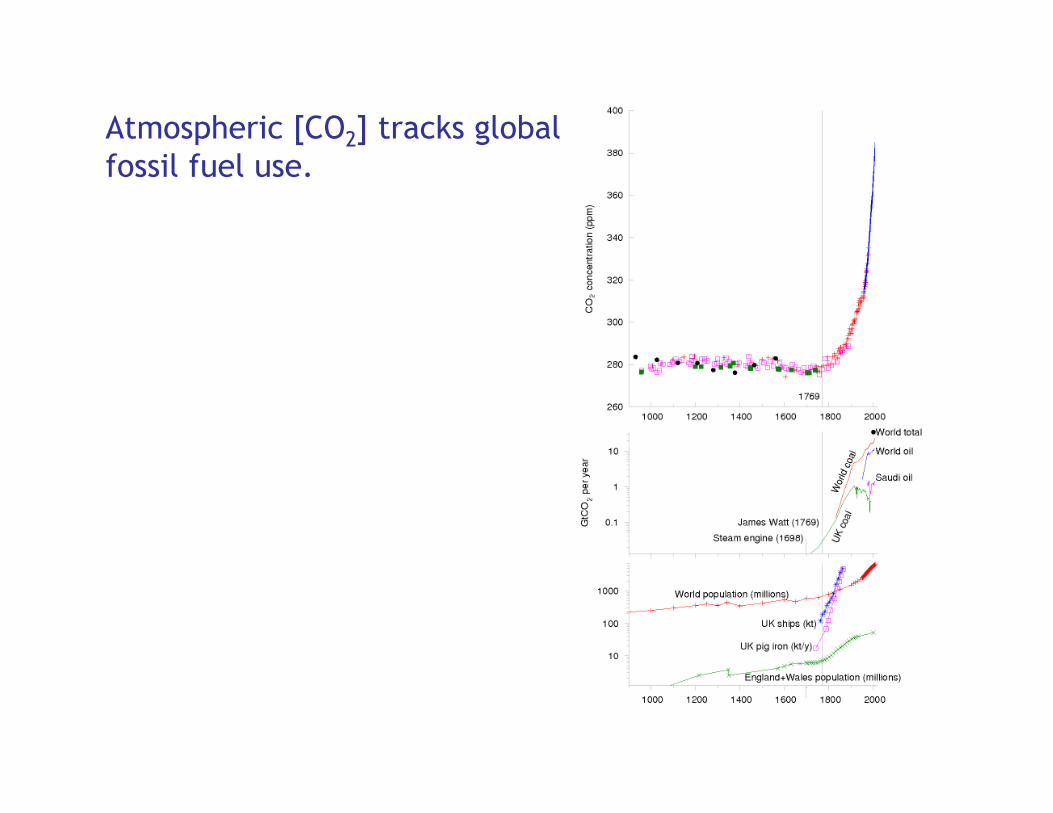
Atmospheric [CO2] tracks globalfossil fuel use.
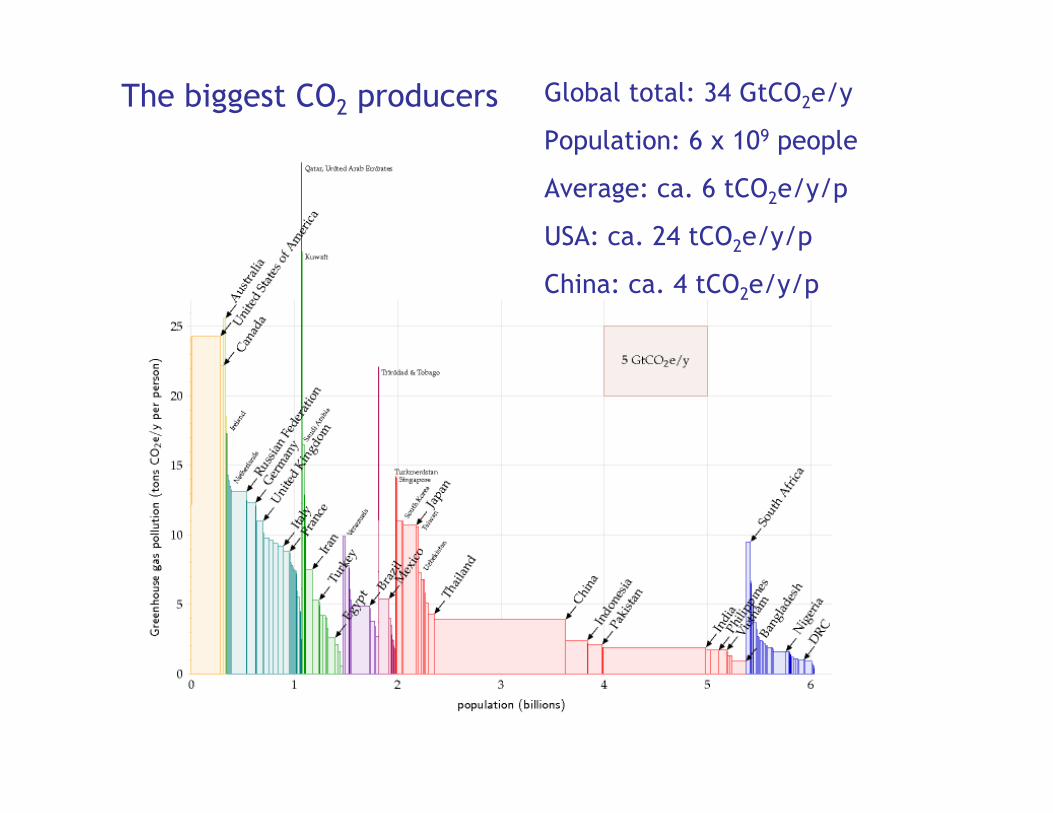
The biggest CO2 producers Global total: 34 GtCO2e/y
Population: 6 x 10⁹ people
Average: ca. 6 tCO2e/y/p
USA: ca. 24 tCO2e/y/p
China: ca. 4 tCO2e/y/p
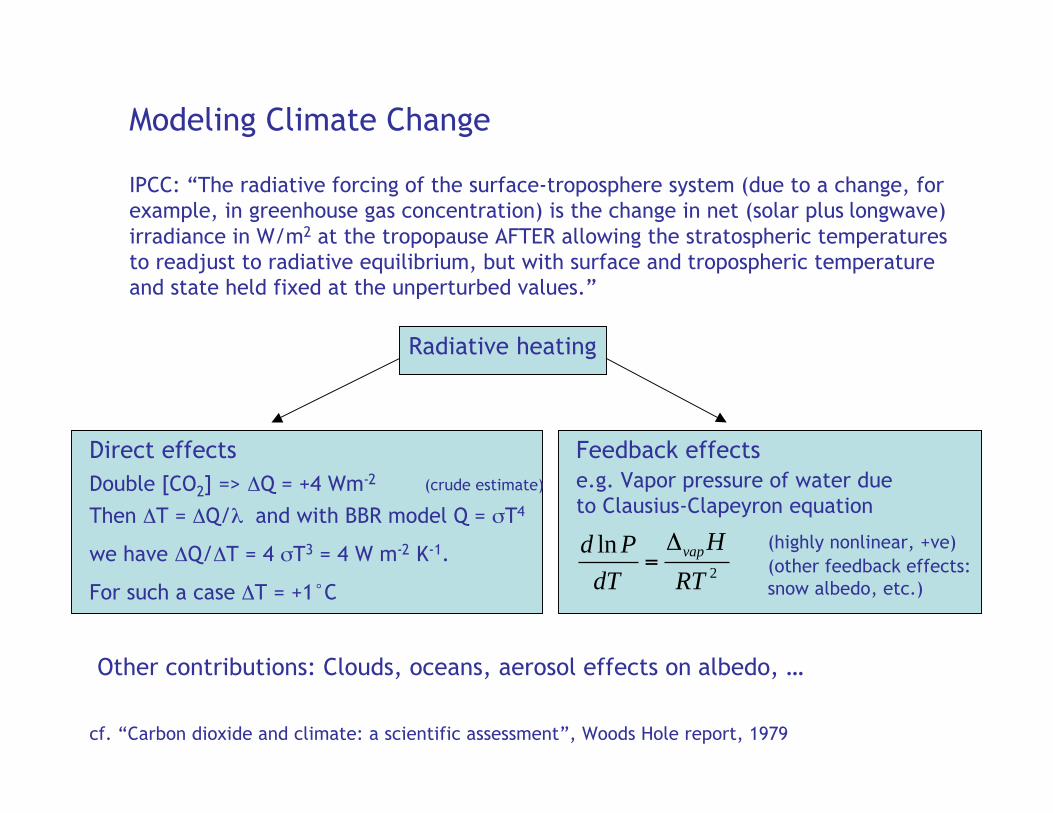
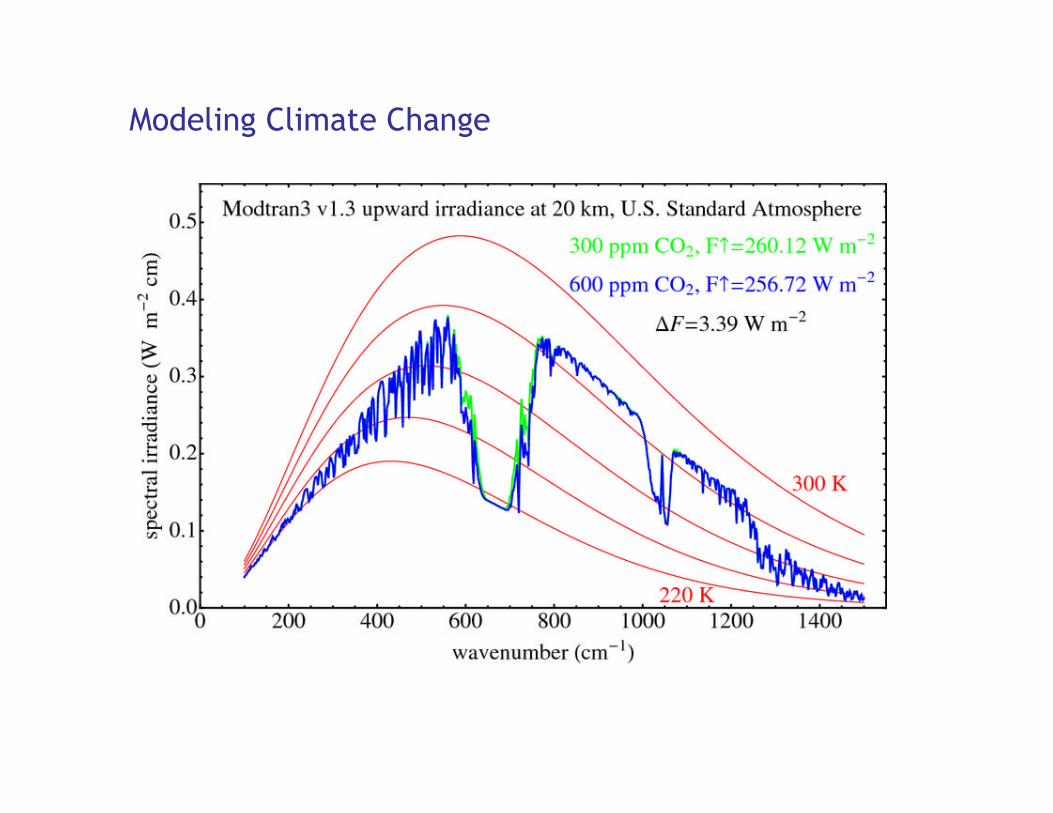
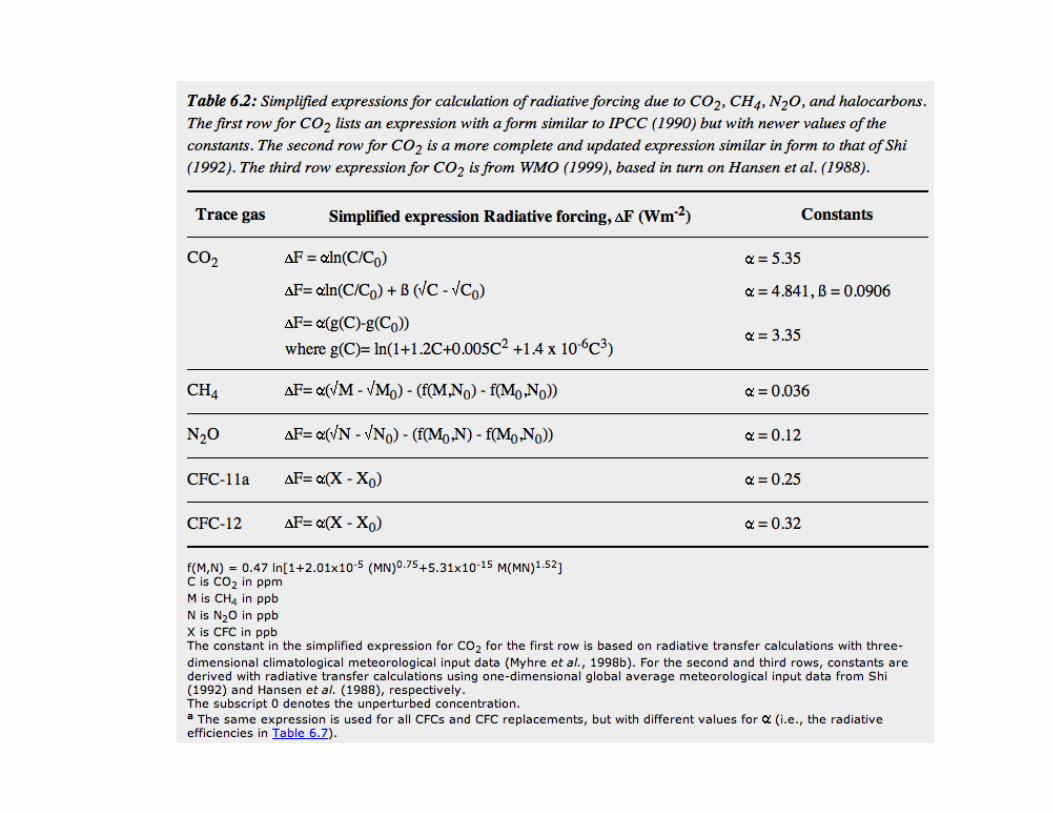
Modeling Climate Change
cf. “Carbon dioxide and climate: a scientific assessment”, Woods Hole report, 1979
IPCC: “The radiative forcing of the surface-troposphere system (due to a change, forexample, in greenhouse gas concentration) is the change in net (solar plus longwave)irradiance in W/m2 at the tropopause AFTER allowing the stratospheric temperaturesto readjust to radiative equilibrium, but with surface and tropospheric temperatureand state held fixed at the unperturbed values.”
Radiative heating
Direct effects Feedback effectsDouble [CO2] => ΔQ = +4 Wm-2 (crude estimate)
Then ΔT = ΔQ/λ and with BBR model Q = σT4
we have ΔQ/ΔT = 4 σT3 = 4 W m-2 K-1.
For such a case ΔT = +1°C
e.g. Vapor pressure of water dueto Clausius-Clapeyron equation
d ln PdT
=ΔvapHRT 2
(highly nonlinear, +ve)
Other contributions: Clouds, oceans, aerosol effects on albedo, …
(other feedback effects:snow albedo, etc.)
Modeling Climate Change
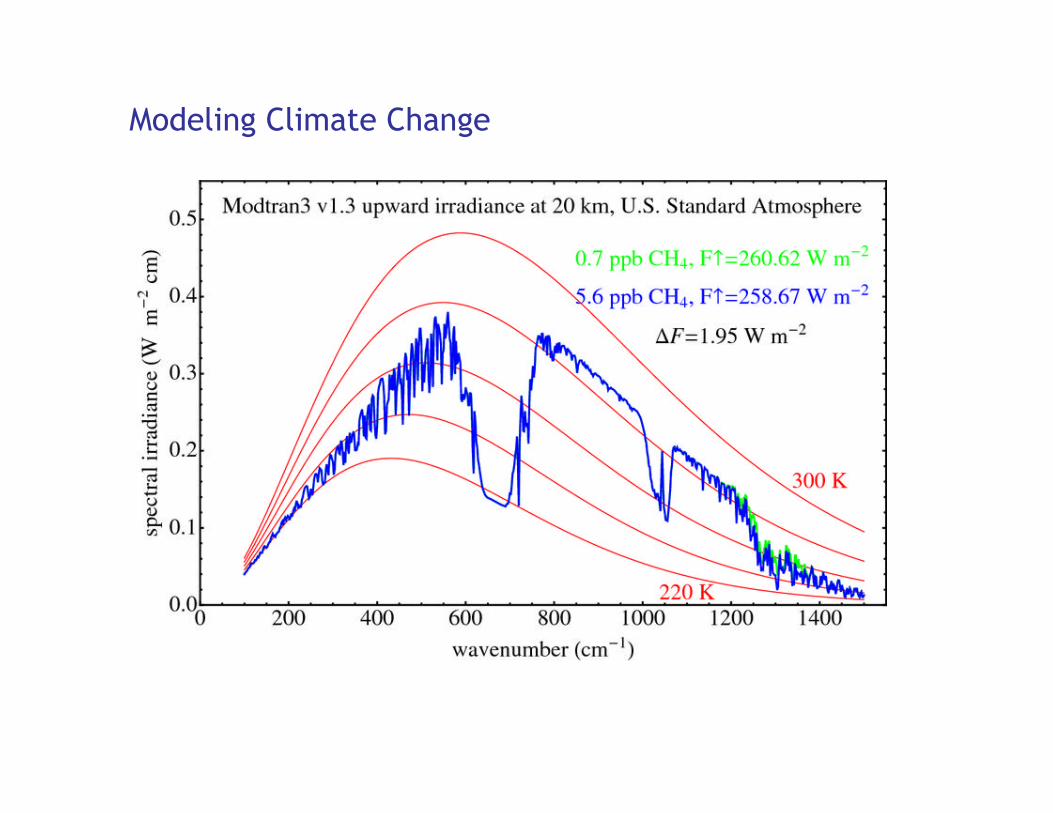
Modeling Climate Change
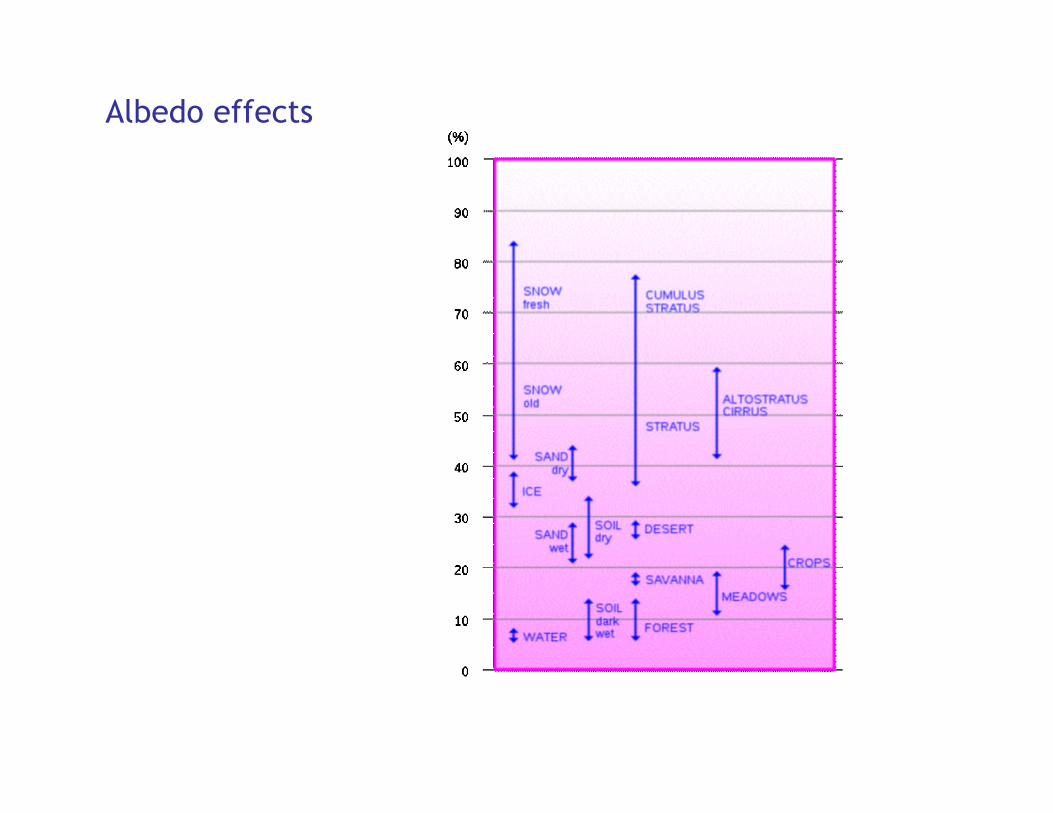
Albedo effects
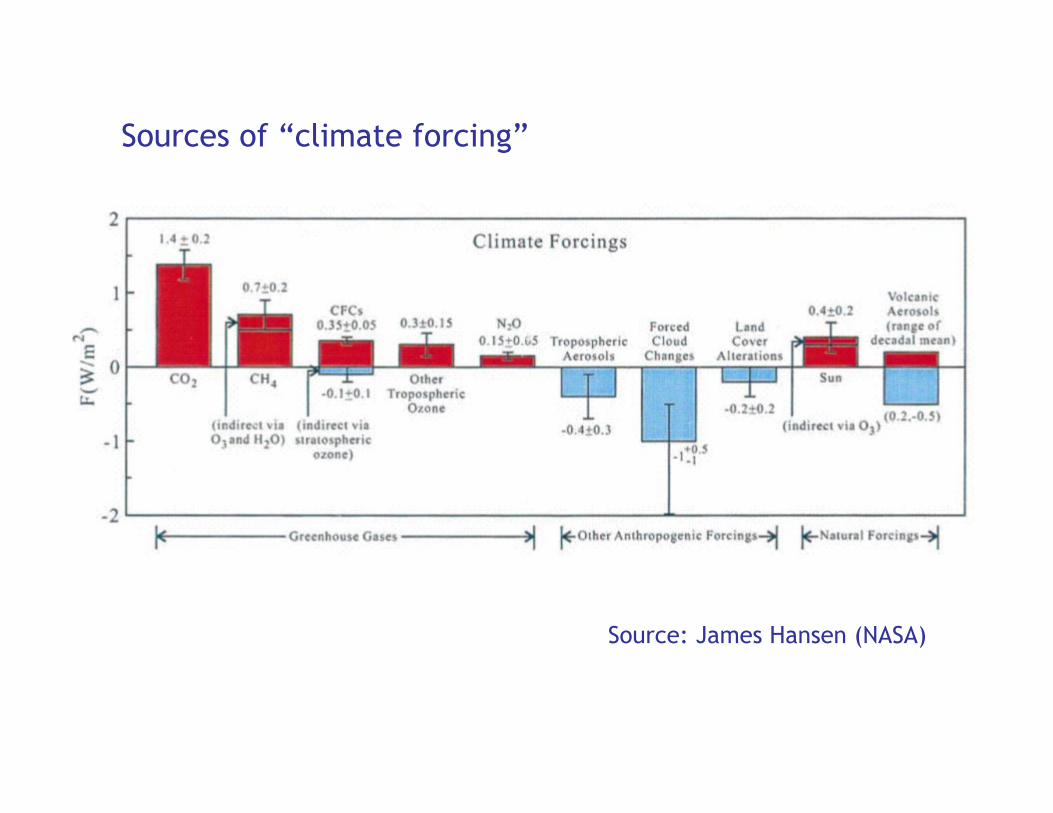
Sources of “climate forcing”
Source: James Hansen (NASA)
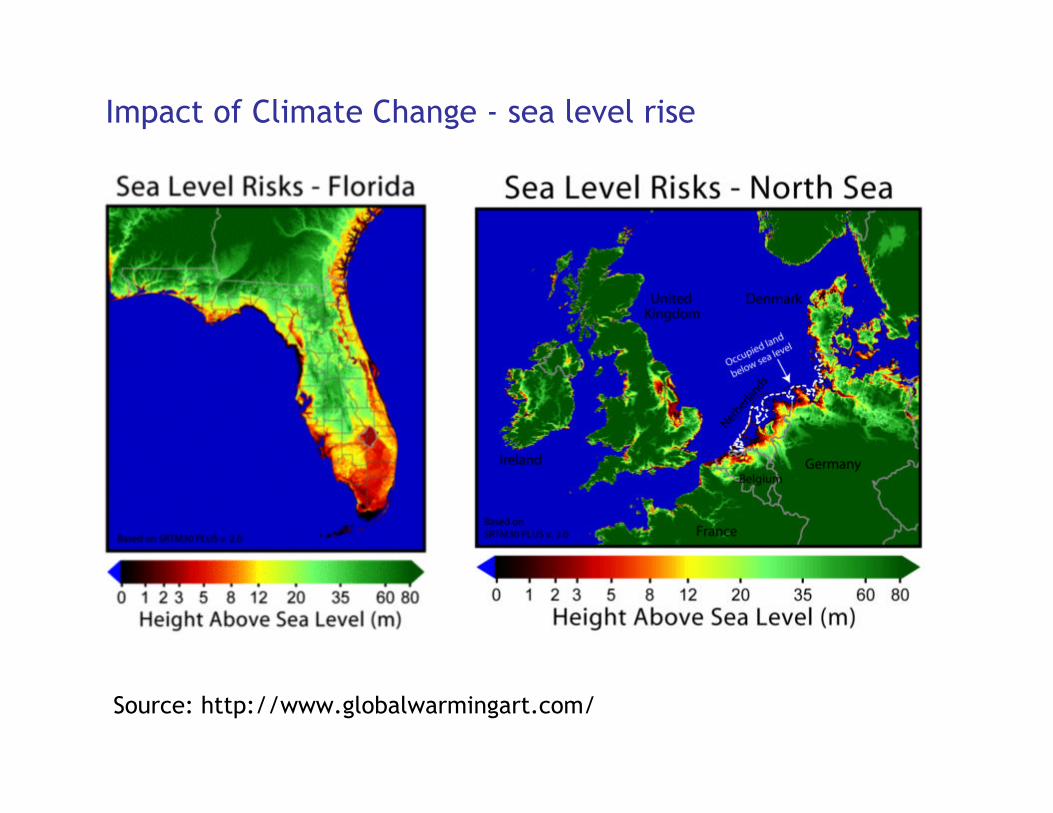
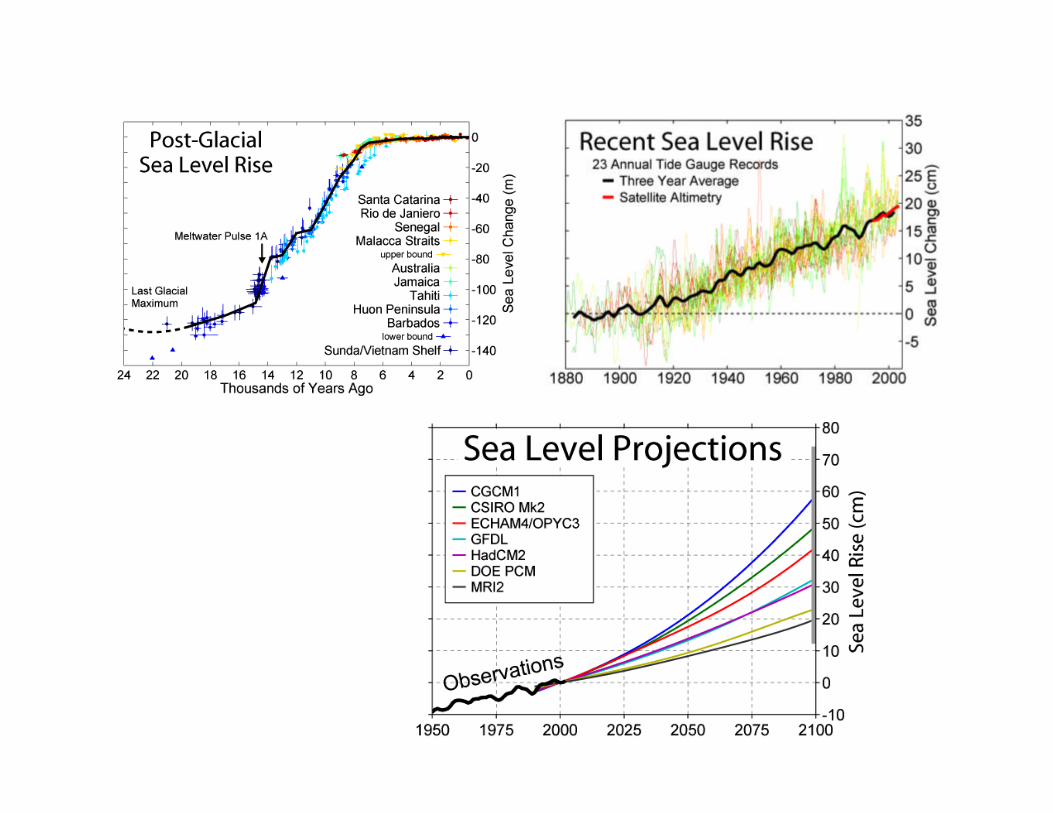
Impact of Climate Change - sea level rise
Source: http://www.globalwarmingart.com/
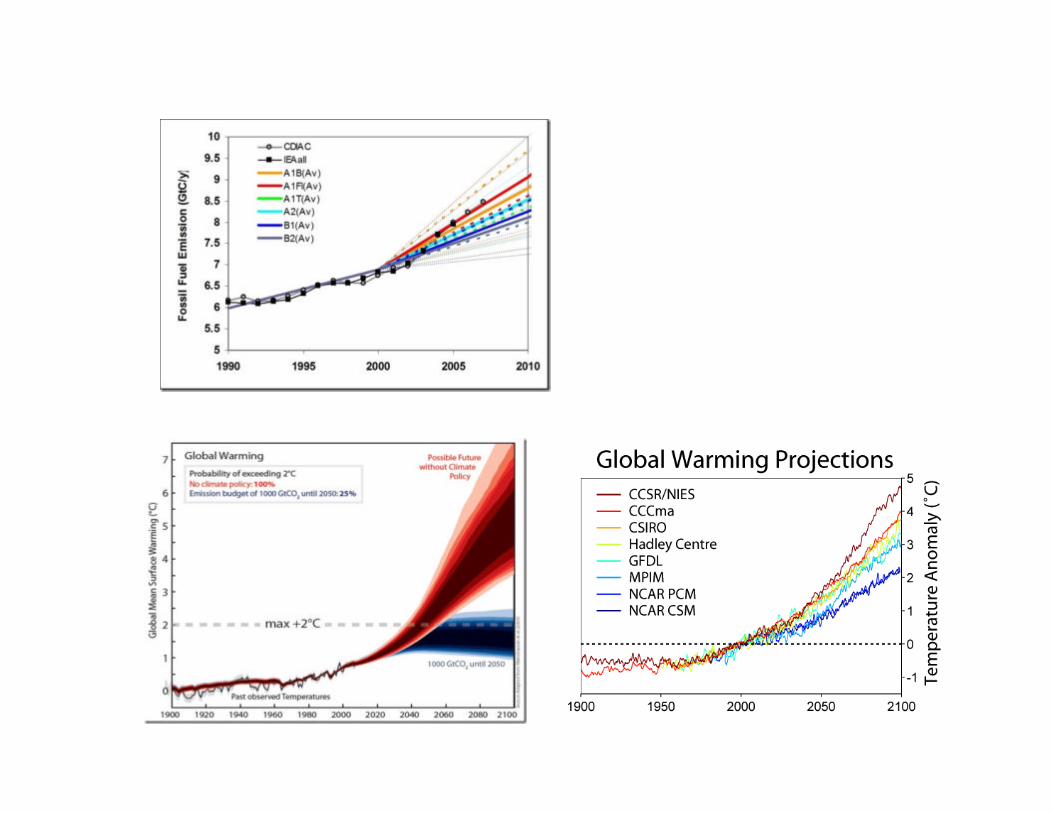
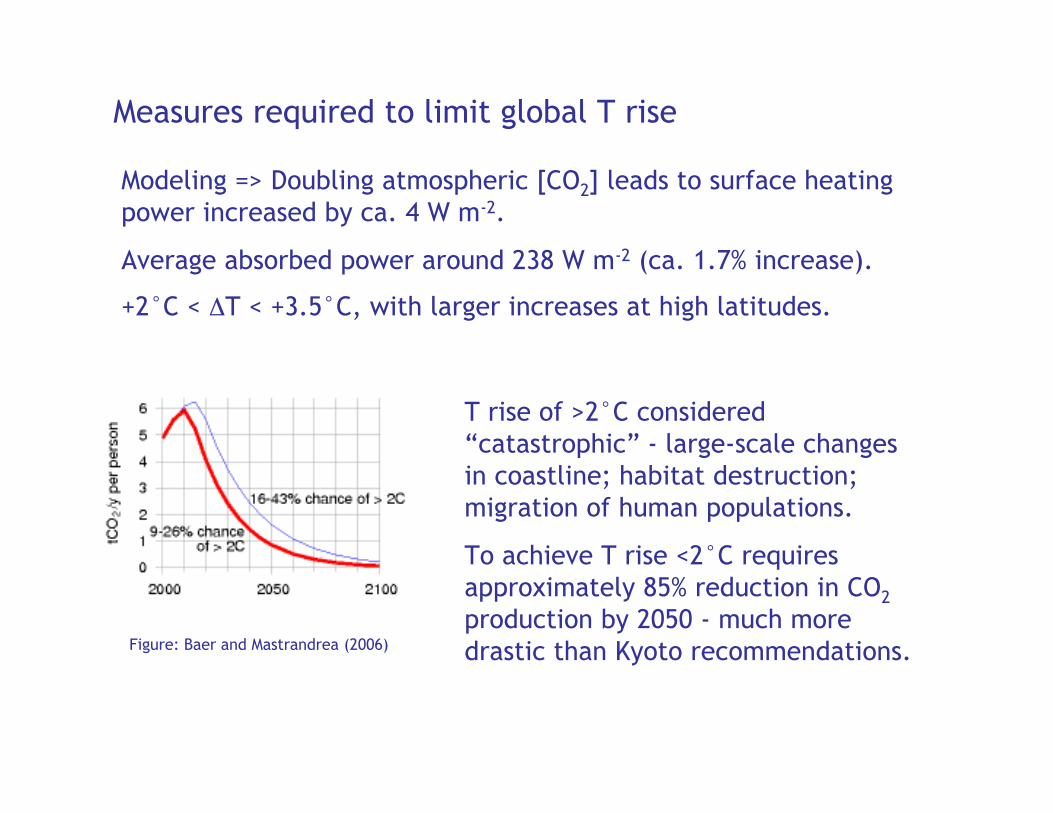
Measures required to limit global T rise
T rise of >2°C considered“catastrophic” - large-scale changesin coastline; habitat destruction;migration of human populations.
To achieve T rise <2°C requiresapproximately 85% reduction in CO2production by 2050 - much moredrastic than Kyoto recommendations.Figure: Baer and Mastrandrea (2006)
Modeling => Doubling atmospheric [CO2] leads to surface heatingpower increased by ca. 4 W m-2.
Average absorbed power around 238 W m-2 (ca. 1.7% increase).
+2°C < ΔT < +3.5°C, with larger increases at high latitudes.
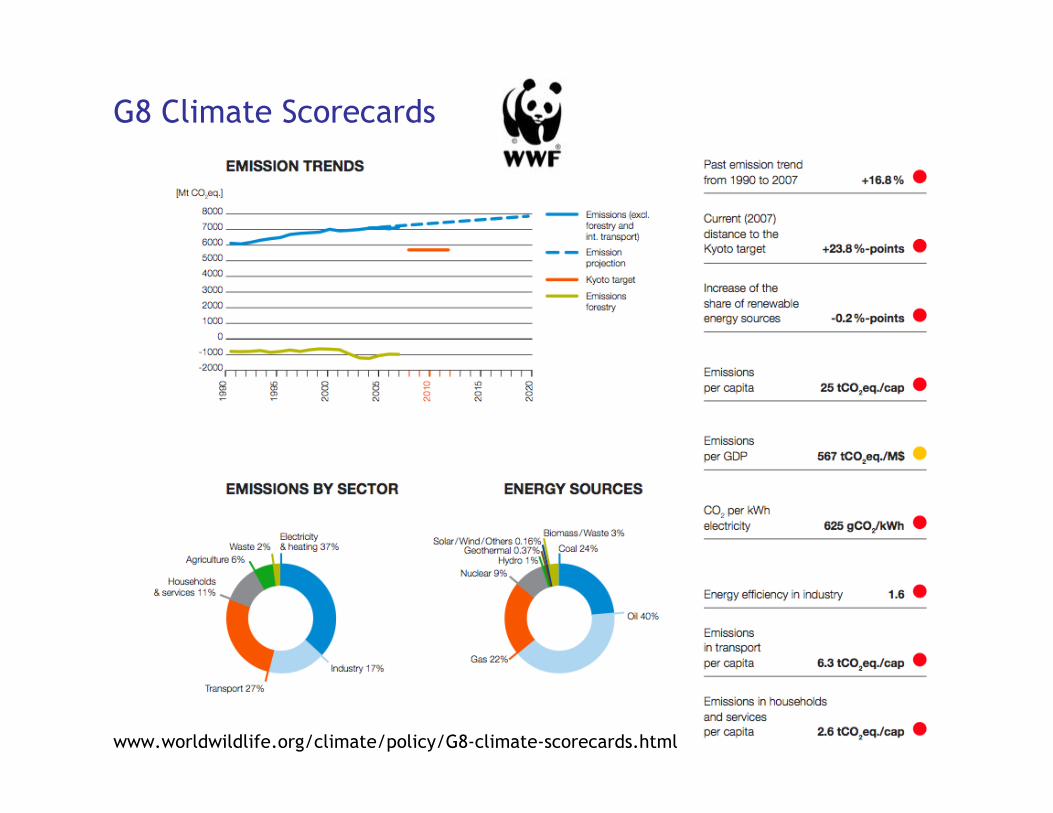
G8 Climate Scorecards
www.worldwildlife.org/climate/policy/G8-climate-scorecards.html
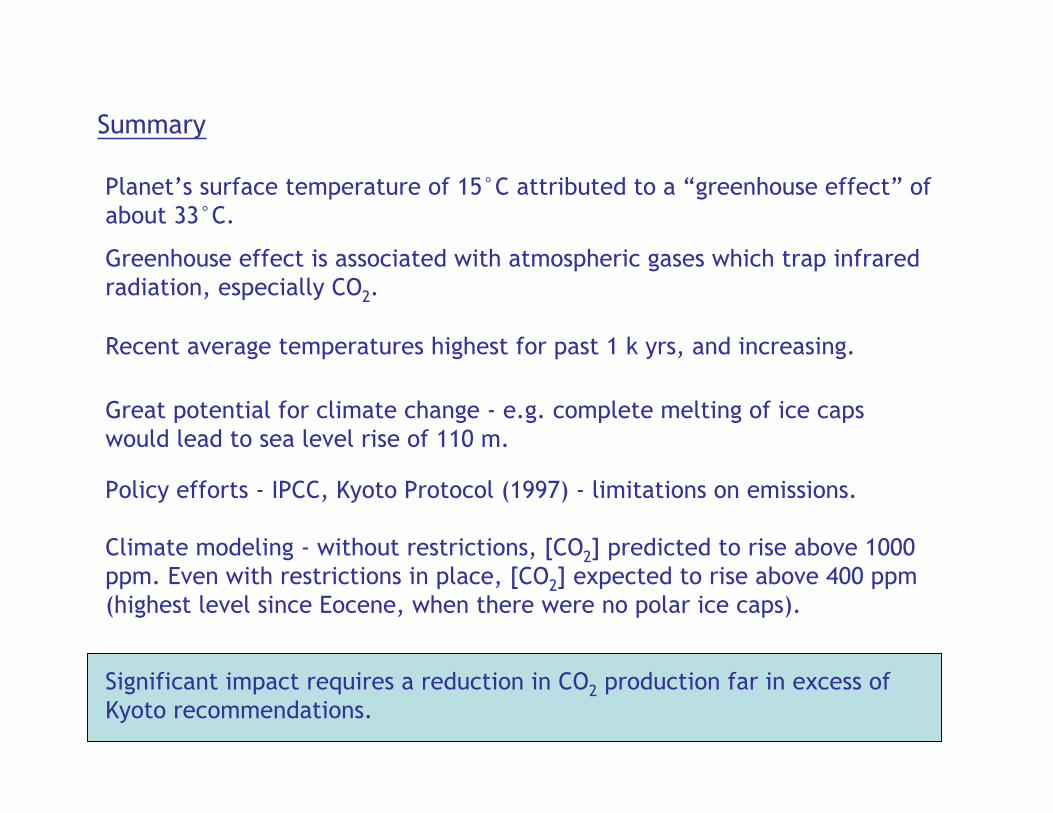
Summary
Planet’s surface temperature of 15°C attributed to a “greenhouse effect” ofabout 33°C.
Greenhouse effect is associated with atmospheric gases which trap infraredradiation, especially CO2.
Recent average temperatures highest for past 1 k yrs, and increasing.
Great potential for climate change - e.g. complete melting of ice capswould lead to sea level rise of 110 m.
Policy efforts - IPCC, Kyoto Protocol (1997) - limitations on emissions.
Climate modeling - without restrictions, [CO2] predicted to rise above 1000ppm. Even with restrictions in place, [CO2] expected to rise above 400 ppm(highest level since Eocene, when there were no polar ice caps).
Significant impact requires a reduction in CO2 production far in excess ofKyoto recommendations.