energy in 2011 – disruptions and continuity - inmesol es · christof rühl, london june 2012 bp...
TRANSCRIPT
BP Statistical Review of World Energy June 2012 bp.com/statisticalreview
Energy in 2011 – disruptions and continuity
Christof Rühl, 13th June 2012
© BP 2012
1 A year of disruptions
2 Energy and the economy
3 Fuel by fuel
4 Concluding remarks
Christof Rühl, London June 2012
BP Statistical Review of World Energy June 2012 1
1. A year of disruptions
Energy in 2011 – disruptions and continuity
BP Statistical Review of World Energy
© BP 2012
GDP and energy growthMtoe Annual change, %
Supply disruptions
“Arab Spring” “Fukushima”
Source: includes data from Oxford Economics
0%
1%
2%
3%
4%
2001-11 2011
GDP Energy
-80
-60
-40
-20
0
Libya Syria/Yemen Japan Germany
Coal NuclearGas Oil
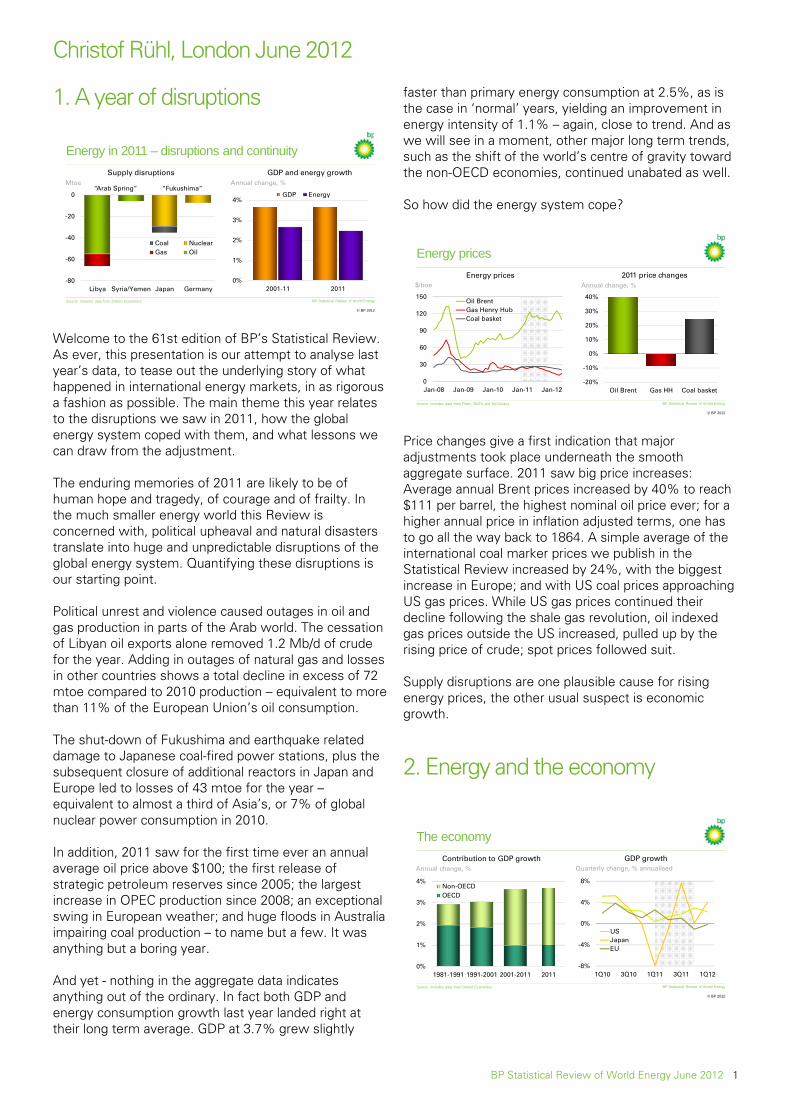
Welcome to the 61st edition of BP’s Statistical Review. As ever, this presentation is our attempt to analyse last year’s data, to tease out the underlying story of what happened in international energy markets, in as rigorous a fashion as possible. The main theme this year relates to the disruptions we saw in 2011, how the global energy system coped with them, and what lessons we can draw from the adjustment. The enduring memories of 2011 are likely to be of human hope and tragedy, of courage and of frailty. In the much smaller energy world this Review is concerned with, political upheaval and natural disasters translate into huge and unpredictable disruptions of the global energy system. Quantifying these disruptions is our starting point. Political unrest and violence caused outages in oil and gas production in parts of the Arab world. The cessation of Libyan oil exports alone removed 1.2 Mb/d of crude for the year. Adding in outages of natural gas and losses in other countries shows a total decline in excess of 72 mtoe compared to 2010 production – equivalent to more than 11% of the European Union’s oil consumption. The shut-down of Fukushima and earthquake related damage to Japanese coal-fired power stations, plus the subsequent closure of additional reactors in Japan and Europe led to losses of 43 mtoe for the year – equivalent to almost a third of Asia’s, or 7% of global nuclear power consumption in 2010. In addition, 2011 saw for the first time ever an annual average oil price above $100; the first release of strategic petroleum reserves since 2005; the largest increase in OPEC production since 2008; an exceptional swing in European weather; and huge floods in Australia impairing coal production – to name but a few. It was anything but a boring year. And yet - nothing in the aggregate data indicates anything out of the ordinary. In fact both GDP and energy consumption growth last year landed right at their long term average. GDP at 3.7% grew slightly
faster than primary energy consumption at 2.5%, as is the case in ‘normal’ years, yielding an improvement in energy intensity of 1.1% – again, close to trend. And as we will see in a moment, other major long term trends, such as the shift of the world’s centre of gravity toward the non-OECD economies, continued unabated as well. So how did the energy system cope?
0
30
60
90
120
150
Jan-08 Jan-09 Jan-10 Jan-11 Jan-12
Oil BrentGas Henry HubCoal basket
Energy prices
BP Statistical Review of World Energy
© BP 2012
$/boe
Source: includes data from Platts, BAFA and McCloskey
Annual change, %
2011 price changesEnergy prices
-20%
-10%
0%
10%
20%
30%
40%
Oil Brent Gas HH Coal basket
Price changes give a first indication that major adjustments took place underneath the smooth aggregate surface. 2011 saw big price increases: Average annual Brent prices increased by 40% to reach $111 per barrel, the highest nominal oil price ever; for a higher annual price in inflation adjusted terms, one has to go all the way back to 1864. A simple average of the international coal marker prices we publish in the Statistical Review increased by 24%, with the biggest increase in Europe; and with US coal prices approaching US gas prices. While US gas prices continued their decline following the shale gas revolution, oil indexed gas prices outside the US increased, pulled up by the rising price of crude; spot prices followed suit. Supply disruptions are one plausible cause for rising energy prices, the other usual suspect is economic growth.
2. Energy and the economy
-8%
-4%
0%
4%
8%
1Q10 3Q10 1Q11 3Q11 1Q12
USJapanEU
0%
1%
2%
3%
4%
1980-1990 1990-2000 2000-2010 20110%
1%
2%
3%
4%
1981-1991 1991-2001 2001-2011 2011
Non-OECDOECD
The economy
GDP growthQuarterly change, % annualisedAnnual change, %
Contribution to GDP growth
Source: includes data from Oxford Economics BP Statistical Review of World Energy
© BP 2012

BP Statistical Review of World Energy June 2012 2
To be upfront, there is not much in the economic data to indicate abnormal pressure on energy demand or prices. The global economy grew by 3.7% in purchasing power parity terms last year, or by 2.7% when using market exchange rates – significantly slower than in 2010, but by both measures almost exactly at the ten year average. As has become customary, non-OECD economies outpaced the OECD, contributing almost three quarters (73%) of global growth – but both camps landed exactly at their ten year average by this measure as well. While the global economy adjusts to lower growth after the crisis, the shift of its centre of gravity toward the non-OECD continued. Volatility and disparities exist in both camps – but in 2011, they were more pronounced in the OECD: the Japanese pathway is shaped by the tragedy that was the earthquake and tsunami. Post-crisis growth in the US and Europe started to diverge, with the US in tentative recovery mode, and Europe dragged down by unresolved issues in its unified currency area. Both developments are still with us. The post-crisis adjustment is proving difficult in the developing world as well, but repercussions there started later and are an issue for 2012 and beyond. Adding in primary energy growth confirms – for once, given the upheavals of the last few years – the big picture: no extraordinary impact from the economy on energy demand. The composition of fuels also evolved broadly in line with long term trends, with the obvious exception of nuclear power. An interesting deviation from trend emerges only if one distinguishes OECD from non-OECD energy growth.
-2%
0%
2%
4%
6%
8%
2001-11 2011-2%
0%
2%
4%
6%
8%
2001-11 2011
GDP Energy
GDP and energy growth
BP Statistical Review of World Energy
© BP 2012
Annual change, %
Non-OECD OECD
Source: includes data from Oxford Economics
Annual change, %
Non-OECD energy consumption growth of 5.3% stayed firmly on trend last year, with China growing at 8.8% – that is, adding more than total annual UK energy consumption – similar to last year. OECD energy consumption, in contrast, fell by 0.8%, despite average GDP growth. While OECD GDP finally returned to pre-crisis levels, energy consumption remains 3.3% below its 2007 peak; it has declined in three out of the last four years. Why last year? There are broadly three reasons: First, the impact of high oil prices everywhere, and of high coal and gas
prices outside the US. Energy prices in the OECD are least sheltered by subsidies, and so the price impact is most direct. The US, for example, the world’s second largest energy consumer, used 0.4% less energy in 2011, despite lower gas prices and a strong recovery in hydropower. US energy consumption has now fallen in four out of the last six years, driven by a rapid decline in oil consumption – the fuel that has had the most rapid price increase. The second reason for the decline was the impact of Fukushima: Energy consumption in Japan, the world’s third largest economy, declined by 5%; and switching off nuclear power had knock-on effects on another large economy, Germany. Finally, Europe experienced an exceptional swing to warmer weather compared to 2010, the key reason behind a 3.1% decline in EU energy consumption. The energy dislocations in the OECD give another indication of how markets coped with the disruptions that characterized 2011. Fuel substitution, supply and demand responses and trading patterns all played their role. In a nutshell, three major adjustments took place: an increase in oil supplies, most notably from Saudi Arabia, together with flexibility in trading and the global refining system, allowed heavier Saudi crudes to replace lighter Libyan oil in Europe; a diversion of natural gas from Europe to Asia allowed the substitution of lost nuclear energy in Japan without harming the energy needs of other economies in this fast growing region; and finally, the release of coal from the Americas, facilitated by the availability of unconventional gas in the US, helped to replace gas in Europe. To trace these developments in more detail, we best look at them fuel by fuel.
3. Fuel by fuel Oil
0
50
100
150
2007 2008 2009 2010 2011 2012
Dated BrentAnnual averages
70
85
100
115
130
Jun-10 Dec-10 Jun-11 Dec-11 Jun-12
Dated BrentWTI
Crude oil prices
BP Statistical Review of World Energy
© BP 2012
Source: includes data from Platts
Dated Brent and WTI$/bbl$/bbl
Dated Brent
Like energy markets at large, oil markets experienced significant turbulence in 2011 and so far this year. Oil
Christof Rühl, London June 2012
BP Statistical Review of World Energy June 2012 3
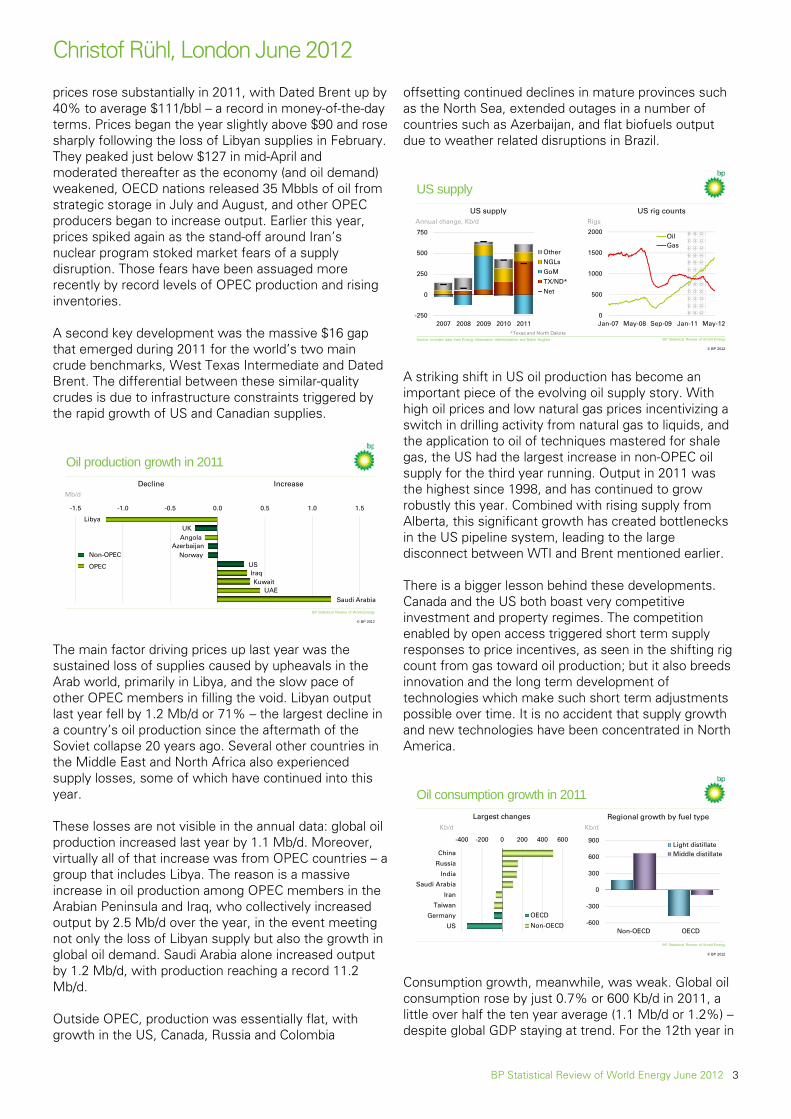
prices rose substantially in 2011, with Dated Brent up by 40% to average $111/bbl – a record in money-of-the-day terms. Prices began the year slightly above $90 and rose sharply following the loss of Libyan supplies in February. They peaked just below $127 in mid-April and moderated thereafter as the economy (and oil demand) weakened, OECD nations released 35 Mbbls of oil from strategic storage in July and August, and other OPEC producers began to increase output. Earlier this year, prices spiked again as the stand-off around Iran’s nuclear program stoked market fears of a supply disruption. Those fears have been assuaged more recently by record levels of OPEC production and rising inventories. A second key development was the massive $16 gap that emerged during 2011 for the world’s two main crude benchmarks, West Texas Intermediate and Dated Brent. The differential between these similar-quality crudes is due to infrastructure constraints triggered by the rapid growth of US and Canadian supplies.
Oil production growth in 2011
BP Statistical Review of World Energy
© BP 2012
IncreaseMb/d
Decline
UAEKuwait
IraqUS
NorwayAzerbaijan
AngolaUK
Libya
-1.5 -1.0 -0.5 0.0 0.5 1.0 1.5
Non-OPEC
OPEC
Saudi Arabia
The main factor driving prices up last year was the sustained loss of supplies caused by upheavals in the Arab world, primarily in Libya, and the slow pace of other OPEC members in filling the void. Libyan output last year fell by 1.2 Mb/d or 71% – the largest decline in a country’s oil production since the aftermath of the Soviet collapse 20 years ago. Several other countries in the Middle East and North Africa also experienced supply losses, some of which have continued into this year. These losses are not visible in the annual data: global oil production increased last year by 1.1 Mb/d. Moreover, virtually all of that increase was from OPEC countries – a group that includes Libya. The reason is a massive increase in oil production among OPEC members in the Arabian Peninsula and Iraq, who collectively increased output by 2.5 Mb/d over the year, in the event meeting not only the loss of Libyan supply but also the growth in global oil demand. Saudi Arabia alone increased output by 1.2 Mb/d, with production reaching a record 11.2 Mb/d. Outside OPEC, production was essentially flat, with growth in the US, Canada, Russia and Colombia
offsetting continued declines in mature provinces such as the North Sea, extended outages in a number of countries such as Azerbaijan, and flat biofuels output due to weather related disruptions in Brazil.
0
500
1000
1500
2000
Jan-07 May-08 Sep-09 Jan-11 May-12
OilGas
US supply
BP Statistical Review of World Energy
© BP 2012
Source: includes data from Energy Information Administration and Baker Hughes
US rig countsRigsAnnual change, Kb/d
US supply
-250
0
250
500
750
2007 2008 2009 2010 2011
Other
NGLs
GoM
TX/ND*
Net
*Texas and North Dakota
A striking shift in US oil production has become an important piece of the evolving oil supply story. With high oil prices and low natural gas prices incentivizing a switch in drilling activity from natural gas to liquids, and the application to oil of techniques mastered for shale gas, the US had the largest increase in non-OPEC oil supply for the third year running. Output in 2011 was the highest since 1998, and has continued to grow robustly this year. Combined with rising supply from Alberta, this significant growth has created bottlenecks in the US pipeline system, leading to the large disconnect between WTI and Brent mentioned earlier. There is a bigger lesson behind these developments. Canada and the US both boast very competitive investment and property regimes. The competition enabled by open access triggered short term supply responses to price incentives, as seen in the shifting rig count from gas toward oil production; but it also breeds innovation and the long term development of technologies which make such short term adjustments possible over time. It is no accident that supply growth and new technologies have been concentrated in North America.
Oil consumption growth in 2011
Kb/d
Largest changes Regional growth by fuel typeKb/d
-600
-300
0
300
600
900
Non-OECD OECD
Light distillateMiddle distillate
-400 -200 0 200 400 600
US
Germany
Taiwan
Iran
Saudi Arabia
India
Russia
China
OECD
Non-OECD
BP Statistical Review of World Energy
© BP 2012 Consumption growth, meanwhile, was weak. Global oil consumption rose by just 0.7% or 600 Kb/d in 2011, a little over half the ten year average (1.1 Mb/d or 1.2%) –despite global GDP staying at trend. For the 12th year in

BP Statistical Review of World Energy June 2012 4
a row oil was the slowest growing fossil fuel; its share in global energy continues to fall. On the surface, oil consumption data mimics the contrast between OECD and non-OECD energy demand discussed earlier. But in oil, the OECD decline can already be called structural. Non-OECD consumption grew by 1.2 Mb/d or 2.8%. China once again saw the world’s largest increase, at 500 Kb/d, accounting for 42% of the net increment, with significant gains also seen in Russia (160 Kb/d), India (140 Kb/d) and Saudi Arabia (110 Kb/d). Consumption declined in North Africa and growth was below average in the Middle-East – yet another glimpse of the political upheaval in these regions, but also reflecting subsidy cuts in Iran, driven by sanctions. OECD consumption continued its long term decline and fell by 600 Kb/d, reaching its lowest level since 1995. The US (350 Kb/d) and Germany (80 Kb/d) accounted for the largest contractions. By coincidence, the warm European winter reduced heating oil demand by about the same amount (120 Kb/d) which was required to deliver a 38% increase in fuel and crude oil for power generation to Japan (140 Kb/d), as oil helped to mitigate the nuclear outages. Distinguishing by refined product category further illuminates the reasons behind weak consumption growth. The weakest portion of overall product demand was light distillates, including gasoline, which fell by 1% or 300 Kb/d globally. Gasoline is price sensitive; higher prices at the pump drove a decline in consumption. This contrasts with middle distillates, including diesel, which is primarily used in commerce, and therefore tends to be aligned with GDP growth. During the past years of high prices, middle distillates were the fastest-growing product group.
Limits to oil consumption growth
$/bbl Litres/100km for new sales
Vehicle fuel economySubsidised consumption
0
30
60
90
120
0%
10%
20%
30%
40%
2003 2005 2007 2009 2011
Oil price (RHS)
% of global demand
5
6
7
8
9
10
11
2002 2005 2008 2011
US*
EU
China
Japan
Source: includes data from the International Council for Clean Transportation and the US Environmental Protection Agency
* Includes light trucksBP Statistical Review of World Energy
© BP 2012 The consumption data confirm another important development. Demand responses to high international prices are still disproportionally concentrated in OECD economies, where subsidies of oil products are absent. However, emerging economies are becoming more price sensitive because subsidisation in this segment has decreased. Only about 20% of the world’s oil
consumption was in countries with subsidies last year, down from nearly 40% in 2008, the last year of record high oil prices. Because subsidies are expensive and because of the realisation that energy efficiency matters in international competition, the cycle of rising oil prices resulting in rising subsidies appears to have been broken: we estimate that non-OECD countries passed roughly 70% of last year’s oil price increase on to consumers, up from about 25% in 2008. Of the countries that continue to subsidize consumption, most are the oil exporters themselves – in 2011 this group, which accounts for less than one-quarter of global oil consumption, contributed two-thirds of global demand growth. Longer term price effects are starting to become more visible as well. Fuel efficiency for new vehicles is improving rapidly in most markets – in both the OECD and emerging markets. While this is driven in part by government standards, several years of high oil prices have helped change consumer preferences. The vehicle fleet turns over only gradually, and so the improved efficiency of new vehicles will weigh on consumption for years to come.
85
86
87
88
89
90
4Q10 2Q11 4Q11 2Q12
Demand
Supply
2500
2600
2700
2800
2900
Jan Mar May Jul Sep Nov
2006-10 range 2006-10 average2011 2012
Oil consumption and production
BP Statistical Review of World Energy
© BP 2012
OECD commercial oil stocksMbblsMb/d
World liquids demand and supply
Source: includes data from Energy Information Administration and Monthly Oil Data Services © OECD/International Energy Agency May 2012
35 Mbbl SPR release
Turning back to the aggregate data, the global developments in production and consumption put us in a position to explain the trajectory of prices in 2011, and this year. As 2011 began, oil consumption was outpacing production – reflecting the legacy of aggressive OPEC production cuts to offset the impact of the recession on oil demand. That gap widened significantly after the loss of Libyan supplies in February 2011. Even with the large increase in output from Saudi Arabia and other Gulf states described earlier, overall OPEC output did not surpass pre-disruption levels – and global production did not exceed consumption – until late in 2011. This timing left inventories well below average despite the SPR release and in this way supported crude prices throughout the second half of 2011. So far this year, global production has exceeded consumption by a large margin. Although tensions surrounding the Iran nuclear stand-off supported another spike in prices early this year, inventories have now moved above the five-year average, setting the stage for

Christof Rühl, London June 2012
BP Statistical Review of World Energy June 2012 5
the significant weakening in prices seen in recent weeks, with Dated Brent falling below $100 for the first time since February 2011. Refining
Refining: spare capacity and utilisation
Refinery utilisationCumulative spare capacity growthMb/d since 2005
Source: includes data from Parpinelli Tecnon and Energy Security Analysis Inc.
77%
81%
85%
89%
2005 2006 2007 2008 2009 2010 2011
WorldOECDNon-OECD
0
2
4
6
2006 2007 2008 2009 2010 2011
Non-OECD
OECD
BP Statistical Review of World Energy
© BP 2012 The global refining environment continues to be characterized by massive excess capacity and slow throughput growth. Net global refining capacity grew by 1.4 Mb/d in 2011, led by growth of 730 Kb/d in Asia Pacific, mainly in China. In contrast, global crude runs grew by just 380 Kb/d, slightly below liquids consumption growth because of new NGL supplies. The data continues to show differing fortunes between the OECD, where runs were down (by 310 Kb/d) and the non-OECD, where runs increased (by 680 Kb/d). The US bucked this trend of lower OECD throughputs and increased runs as Midwest refiners took advantage of weak domestic crude prices. Middle distillate exports and a reduced gasoline import requirement led to the US becoming a net oil product exporter for the first time in our data (1960). Global unused capacity increased by 1 Mb/d and is now more than 5 Mb/d higher than it was in 2005. Global refinery utilisation fell to 81.2%, the second lowest since 1994. There is too much refining capacity – but not everyone is suffering to the same extent. Flexible sites with world class operations can be successful and in 2011, some had the opportunity to prove it.
Crude oil trade and refining margins
Mb/d
Source: includes data from the International Energy Agency
$/bbl
NW Europe cracking marginsEuropean crude imports
0
2
4
6
8
1Q 2Q 3Q 4Q
2010 2011 2012
0
2
4
6
8
10
1995 1999 2003 2007 2011
S&C America
Other
FSU
Africa
Middle East
BP Statistical Review of World Energy
© BP 2012 The disruption of Libyan supplies meant that Europe lost around 800 Kb/d of good quality crude oil. Other African exporters made good about half of these losses by re-
optimising trade. The Former Soviet Union is Europe’s largest crude oil supplier by far but its oil production grew only marginally last year. That created an opportunity for Middle East exporters to regain market share and, led by Saudi Arabia, they increased medium and heavy sour crude exports to Europe by more than 250 Kb/d. With flexible sites and excess capacity in Europe, the lost Libyan barrels were easily replaced. European refiners made the switch to a heavier crude slate with only a modest impact on cracking margins. Just how modest is revealed by a look at the 2012 margins so far, which have increased because of spring maintenance, shutdowns in OECD refining, and strong gasoline export demand. However, with gasoline demand contracting year-on-year on both sides of the Atlantic, these spikes are likely to be transitory. Natural Gas
Natural gas markets in 2011
Source: includes data from Platts
Regional gas prices$/Mmbtu
-50
0
50
100
150
Production Consumption
North America
FSU
Europe
Middle East Asia
Other
Annual change, Bcm
Production and consumption growth
0
5
10
15
20
Feb 10 Aug 10 Feb 11 Aug 11 Feb 12
Asia LNG
Germany AGIP
UK NBP
US Henry Hub
BP Statistical Review of World Energy
© BP 2012 Natural gas has produced some of the biggest changes in global energy markets over the last few years: There is, first, the rapid increase in trade, especially of LNG, that has connected hitherto segmented regions in an increasingly flexible manner. And second, the development of unconventional resources in the US which has everyone wondering where gas may turn into a relatively abundant resource next. Both of these developments shaped 2011. And as it happens, they also played a key role in the response to last year’s disruptions. Let us start with a quick summary of changes on the aggregate level. Natural gas production and consumption growth moderated, compared to last year’s exceptional increases. Global production was up 3.1% (98 Bcm), slightly above trend (2.8%). Growth originated in the Middle East (11.4%, 54 Bcm), North America (5.5%, 45 Bcm) and the Former Soviet Union (4.6%, 34 Bcm). Consumption rose by 2.2% (70 Bcm), below trend (2.7%), and led by Asia Pacific (5.9%, 33 Bcm), North America (3.2%, 28 bcm) and the Middle East (6.9%, 26 Bcm). European consumption, in contrast, suffered an unprecedented 7.8% (42 Bcm) decline.

BP Statistical Review of World Energy June 2012 6
There is no global price for natural gas. Regional price changes therefore provide a first glimpse of the underlying forces of demand and supply and the patterns of change in any given period. Annual average spot prices for LNG in Asia rose by 82% to $14/Mmbtu in 2011, driven by a combination of higher oil prices pushing up oil-indexed contract prices, and strong additional demand for LNG from Japan, to displace losses in nuclear power. They have since risen another 16% for 2012 to-date. At the other end of the spectrum, US prices slipped by 8% to an average of $4/Mmbtu in 2011; they have since fallen a further 42% to average $2.3/Mmbtu in 2012. US Henry Hub prices have been at a record discount to oil as well as to international gas prices. European spot and contract prices hovered between the US and Asian extremes, with UK spot prices averaging $9/Mmbtu in 2011, up 37% on the previous year. Milder weather in Europe helped European spot prices to remain well below oil-linked contract prices throughout 2011 (AGIP, increasing by 32% and averaging $10.65/Mmbtu) and into 2012 so far – despite the loss of Libyan supplies and the diversion of LNG cargoes to Asia.
Global gas trade
Source: includes data from Cedigaz, GIIGNL, CISStats, Poten, Waterborne
LNG import growth in 2011Gas exports
20%
25%
30%
35%
0
500
1000
1500
2001 2003 2005 2007 2009 2011
LNG
Pipeline
Share of global consumption (RHS)
Bcm Annual change, Bcm
-10
0
10
20
30
To Asia To Europe
From Qatar
From Atlantic Basin
BP Statistical Review of World Energy
© BP 2012 International trade continued to outpace consumption, rising by 4% (39 Bcm). LNG grew by more than 10%, easily outpacing pipeline trade growth of 1.3%. 32% of all natural gas is now traded across international borders; and 32% of all traded gas is LNG. This means that more than 10% of all gas consumed reaches its destination as a LNG cargo. Trading patterns in 2011 show a large shift of LNG toward Asia, driven by the continued need to fuel rapid demand growth in the region as well as the necessity to replace nuclear power in Japan. Asian net LNG imports increased by 34% (27.6 Bcm), compared to 3% (2.1 Bcm) in Europe, with Asia-bound deliveries accounting for 90% of global LNG growth. By coincidence also last year, Qatar finalised the final phase of expansion of its LNG export capacity. Qatari LNG supply grew by 35% (26 Bcm) in 2011 as Qatar overtook Norway to become the world’s 2nd largest gas exporter. Japanese demand thus could tap into a combination of short-term deals for new Qatari supply and spot purchases from various
suppliers, especially Atlantic Basin suppliers such as Nigeria and Equatorial Guinea. The share of LNG deliveries into Asia rose to 63% of the global total; whereas Europe’s market share fell to 27%. What drove this switch?
-20
-10
0
10
20
30
China Japan Other Asia
Annual change, Bcm
Asia supply growth
Source: includes data from Cedigaz, GIIGNL, CISStats, Poten, Waterborne
Annual change, Bcm
Europe supply and demand growth
-45
-30
-15
0
15
Supply Demand
Other net import
Natural gas in Asia and Europe in 2011
Production
LNG
Pipeline
Production
From Libya
From Russia
BP Statistical Review of World Energy
© BP 2012 It was a combination of two developments. Japan’s need to import more natural gas to secure its energy supplies dominated the headlines. Indeed, the world’s largest LNG importer increased LNG imports by an additional 12.5% (12 Bcm). Independently, China for its new five year plan is debating a program to double the share of natural gas in its energy mix from 4% to 8% between 2011 and 2015. China’s gas market has more than doubled over the past five years, though it still is “only” the fourth largest market in the world. Since 2006, China’s gas consumption growth was the world’s largest three times, including in 2011, when growth came to 22% or 23 Bcm – by far the biggest increment ever in China, and supplied by a combination of domestic production increases (up 8% or 8 Bcm), pipeline imports (from Turkmenistan, 301% or 11 Bcm), and LNG imports (28% or 4 Bcm). In addition, Asia saw strong LNG demand growth from India (5 Bcm – driven by domestic production problems) and South Korea (5 Bcm – on strong economic growth and cold weather). Overall, LNG demand in Asia increased by 15% (27 Bcm). With Asia absorbing most of the growth in LNG supplies, there was little left for Europe. European markets also had to deal with the loss of Libyan supplies (7 Bcm) – and large production declines in the North Sea (23 Bcm, of which 12 Bcm from UK, 5 Bcm from Norway and 6 Bcm from the Netherlands), where the underlying natural decline of mature fields was exacerbated by maintenance shut-downs, much of which unplanned. The situation in Europe was mitigated by increased pipeline imports from Russia (9%, 11 Bcm), by falling demand, and by additional coal supplies. Gas consumption was sharply lower across all the major European markets - with the sole exception of Turkey (up 17.3%) - due to the combination of weak economic growth, an exceptionally mild winter compared to 2010, and substitution by coal in power generation.

Christof Rühl, London June 2012
BP Statistical Review of World Energy June 2012 7
Consumption fell faster than supply, leading to a significant inventory build and keeping spot prices well below oil-indexed contract prices.
10%
15%
20%
25%
30%
35%
Jan Mar May Jul Sep Nov
2006-10 range 2011 2012
Gas share in power generation
0
200
400
600
800
1971 1981 1991 2001 2011
Bcm
Production
Shale gas
Source: includes data from Energy Information Administration
US natural gas market
BP Statistical Review of World Energy
© BP 2012 While Asian markets were looking for supplies to meet surging demand, and Europe coped with declining production, the North American gas market faced a very different challenge. The continued momentum in the growth of unconventional gas supplies saw US gas production increase by a record 47 Bcm, accounting for 48% of the growth of world gas production in 2011, and taking US gas production to a new all-time high, above the previous peak in 1973. 30% of this total was shale gas. Demand could not keep up (2.4%, 17 Bcm), despite a reduction of net imports and gas prices low enough versus coal to encourage substantial substitution in power generation. The incremental supply which was left was ultimately absorbed by a large build-up in inventories. The growth of LNG trade and the production of unconventional gas continue to transform the world of natural gas. In 2011, they combined to give gas markets the flexibility to accommodate additional Japanese LNG demand, without disruption in other parts of the system. To see how, we need to look at coal. Coal Coal was the fastest growing fossil fuel last year, in production as well as consumption. The coal story is a story of production and trade patterns able to adjust to market conditions. In this way, coal was buttressing global supply security.
Coal growth in 2011
Largest changes in consumptionMtoeMtoe
Largest changes in production
26
7
6
5
5
-5
China
Indonesia
Colombia
Russia
Ukraine
US
Australia
158
25
6
5
-2
-6
-24
China
India
Australia
Spain
Canada
Japan
US
163
BP Statistical Review of World Energy
© BP 2012 Coal production increased by 6.1% (229 mtoe) globally, easily exceeding the ten year average (4.9%). Growth last year, as in many previous years, came from China (8.8%, 158 mtoe) which provided the largest volumetric increment, raising its share in global production to 50%. It did not come from India, where a prolonged monsoon caused production growth of 2.3% (5 mtoe) to lag consumption growth by an even wider margin than usual. EU production also grew by 2.6% (4.2 mtoe), the first increase since 1995. Only a small share of coal is traded, but this share is growing – in size and reach. In 2011, and outside China, coal exporters, benefiting from growing import needs in Asia and Europe, have been the largest contributors to production growth with Indonesia recording the largest production increment (18.1%, 30.6 mtoe) by far. The world’s biggest exporter, Australia, was an exception; it recorded a production decline (2.2%, 5.3 mtoe) because of floods. Strong global demand was driven by the non-OECD, in particular by China at 9.7% (163 mtoe) and India at 9.2% (25 mtoe) who together accounted for 98% of net consumption growth. Over the last decade, the OECD share in global coal consumption has declined from 47% to 29%. Last year, OECD consumption declined by 1.1% (12 mtoe), five times the average rate (-0.2%). Yet this was not your typical coal-equals-emerging-markets year. The OECD decline in 2011 was particularly pronounced in the US (-4.6%, 24 mtoe) where shale gas eroded coal’s role in power generation; and in Japan (-4.8%, 6 mtoe), where coal-fired electricity production had to be reduced after the earthquake. These declines were partially offset by growth in the EU (3.6%, 9.8 mtoe), where coal was winning against gas in power generation because of lower prices, and also because of regulatory incentives: carbon prices remained extremely weak under the present system and explicit quotas protected coal from competition in Spain (where almost half of the EU’s consumption growth had its origin with 5.1 mtoe).

BP Statistical Review of World Energy June 2012 8
Coal prices and trade
Import growth in 2011Annual change, Mtoe
Steam coal prices
60
90
120
150
180
Jan-10 Jul-10 Jan-11 Jul-11 Jan-12
China Qinhuangdao (fob)Japan Index (cif)NW Europe (cif)US CAPP (fob)
$/tonne
-10
0
10
20
30
To Asia* To Europe
From Indonesia
From Russia
From USFrom
Colombia
Source: includes data from McCloskey, Eurostat, IHS CERA
*China, India, Japan, South Korea, Hong Kong, Taiwan
From other
BP Statistical Review of World Energy
© BP 2012 Steam coal prices in Asia remained at a premium, with Chinese import demand driving up prices throughout the region - including in Japan, the world’s second largest coal importer, and despite falling demand there. European import prices rose more rapidly (31.4% y-o-y, compared to 26.1% in China), albeit from a lower level – and just enough to attract additional imports from across the Atlantic. A clear pattern emerges: Asian suppliers and Russia provided the bulk of additional coal for Asia; American suppliers and Russia did the same for Europe – in the course of events also replacing European Union imports from Indian Ocean suppliers that had been redirected to Asia. With Australia’s and South Africa’s coal exports falling in 2011, there was plenty of room for other suppliers to fill the gap. Indonesia benefitted most, growing exports to Asia by 18% (25.1 mtoe). Russia came second (25.7%, 3.8 mtoe). Meanwhile, Colombia (35.3%, 7.9 mtoe), the US (38.3%, 6.4 mtoe) and Russia again (15%, 4.5 mtoe) satisfied Europe’s higher net import requirements. In this way, markets balanced. European markets compensated for the natural gas cargoes (LNG) bypassing the old continent for Asia in part by picking up abundant US and Colombian coal supplies. Higher Asian prices directed previous exports from Indian Ocean suppliers back into Asia, while attracting new supplies from Russia and Indonesia. And coal from the US was available at a price advantage because at home, it had been backed out by natural gas. This, then, allows us to complete the puzzle of how markets coped with the large scale disruptions dominating the headlines in 2011. Production increases, demand changes and even the weather all helped. In essence, however, this is a story of fuel substitution and shifts in trade flows, triggered by price adjustments. Before leaving this subject, let’s have a short look at what happened to non-fossil fuels.
Non-fossil fuels
Nuclear, hydro and other renewables in power
Other OECD
Output changes in 2011
-200
-100
0
100
200
Nuclear Hydro Renewables
Japan
US
Germany
Annual change, TWh
Brazil
EUChina
Other
Shares of world power generation
0%
5%
10%
15%
20%
1991 1996 2001 2006 2011
NuclearHydroRenewables
BP Statistical Review of World Energy
© BP 2012 Nuclear was of course at the heart of one of the major disruptions in 2011. Global nuclear generation fell by 4.3% (119 TWh), the largest decline on record, bringing it back roughly to the level of 2001. Nuclear’s share of global energy (4.9%) was at the lowest level since 1986. But beyond the closure of Japanese and German nuclear plants, the global impact on energy markets of the Fukushima incident has actually been relatively mild. Nuclear output grew in 22 countries in 2011 and one country – Iran - joined the ranks of nuclear power producers in the Statistical Review. Renewable power generation grew 18%, the ninth successive year of double-digit growth. This was the largest ever volume increment (29.3 mtoe), contributing 10% of the overall increase in world energy consumption – a larger contribution than oil. The US (16.4%), China (48.4%) and Germany (22.9%), together accounted for more than half (56%) of renewable power growth in 2011. Overall, renewable energy, including biofuels, accounted for 2% of primary energy consumption in 2011, of which 1.6% was from fuels for power generation. The share of biofuels in total renewable energy declined because production was hampered by a weather related decline in Brazil offsetting production increases elsewhere. Renewable energy did not play a role in responding to the disruptions we discussed – partially because wind, solar and geothermal energy inputs are non-tradable, and partially because capacity expansion is still a function of policy support. For 2011, the path of renewable growth was largely pre-determined by existing policy settings. The impact of high oil prices on the economy I have described 2011 earlier as a year when the economy did not drive prices up. But up they went anyway, and this gave rise to a different discussion – the impact of high energy prices, and in particular of oil prices, on the global economy.
Christof Rühl, London June 2012
BP Statistical Review of World Energy June 2012 9
0%
2%
4%
6%
8%
US EU China India
Oil import billExports to oil producersNet cost
Impact of oil prices on the economy
Mb/d
Net oil imports
0
4
8
12
16
2001 2003 2005 2007 2009 2011
EU ChinaUS India
2011 net oil import bill% GDP
Source: includes data from the International Monetary Fund BP Statistical Review of World Energy
© BP 2012 There is widespread consensus that high oil prices are detrimental to economic growth, but no unanimity about how “high” prices need to be to create damage, nor about the magnitude of such damage. The various channels for such an effect are well known: On a global level, the main transmission mechanism is the transfer of income from oil importers to oil exporters. For oil importers, higher prices will leave them more exposed the higher the share of imported oil in their economy. But it is more complicated than this: The overall effect depends on how oil exporters use the additional income generated by higher prices. “Petrodollars” can be recycled in two ways – oil producers can save the additional income or spend it. To the extent they spend it to purchase goods and services from oil importing countries, income is shifted straight back, offsetting the initially higher import bill in oil consuming countries. To the extent they decide to save it by purchasing foreign assets, these revenues increase the global supply of savings, thereby reducing interest rates and lowering borrowing costs everywhere. However, if interest rates are already set close to zero by monetary policy, as is presently the case in major oil importing economies, this second channel loses all importance and the ability to export goods and services back into oil producing countries becomes even more important. This ability differs greatly across countries. In 2011, a year of record high oil prices, for example, European exports to oil producing nations have been much higher than those from the US, giving Europe a competitive advantage in absorbing its rising oil bill. Outside the OECD India is more vulnerable than China by this criterion. Compared to previous periods of high oil prices, this ranking of major economies has not changed. However, the 2011 data reflect a remarkable improvement in the US vs. other economies. Tellingly, this improvement is not driven by the US having increased exports to oil producers but rather by a reduction in US oil imports – further evidence of the intricate ways in which the technological improvements fostered by open competition in North America are changing the geopolitics of energy.
4. Concluding remarks
Long-term trends
Oil and gas reservesTrillion bbls
Shares of world primary energyTcm
0%
10%
20%
30%
40%
50%
1966 1981 1996 2011
Oil
Coal
Gas
Hydro
Nuclear
Renew.0.0
0.4
0.8
1.2
1.6
2.0
1981 1991 2001 2011 1981 1991 2001 20110
50
100
150
200
250OtherNorth AmericaFSUOPEC
BP Statistical Review of World Energy
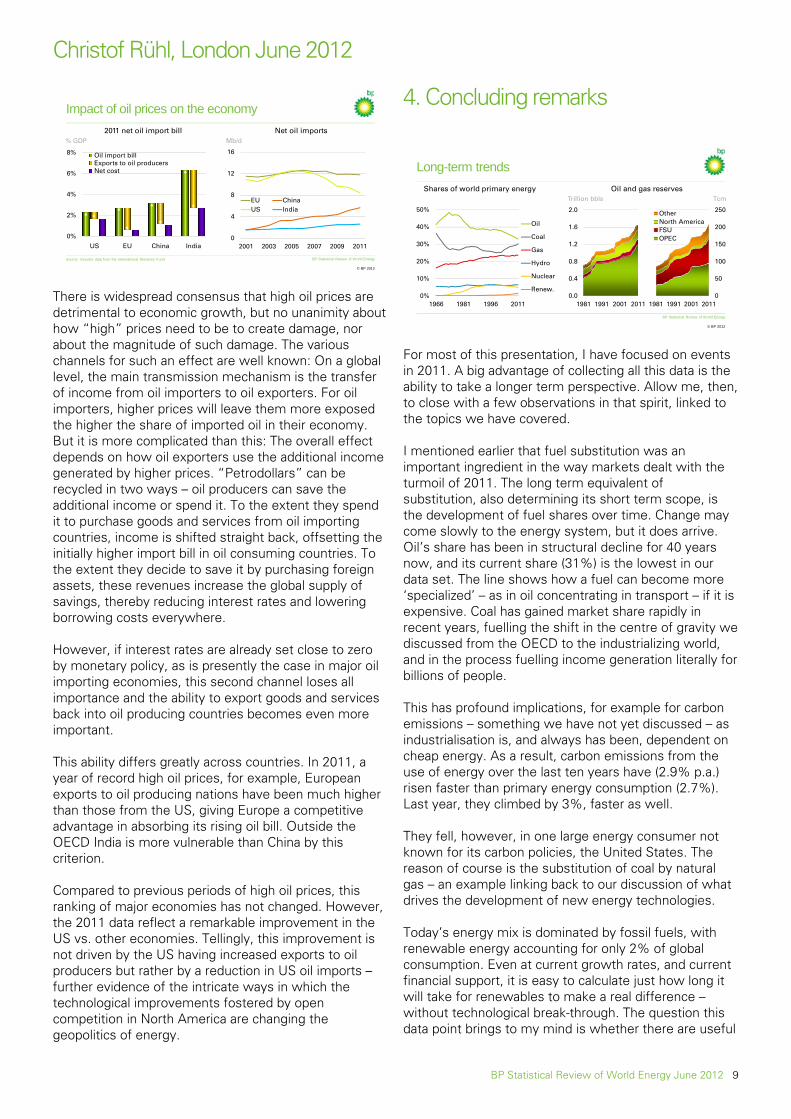
© BP 2012 For most of this presentation, I have focused on events in 2011. A big advantage of collecting all this data is the ability to take a longer term perspective. Allow me, then, to close with a few observations in that spirit, linked to the topics we have covered. I mentioned earlier that fuel substitution was an important ingredient in the way markets dealt with the turmoil of 2011. The long term equivalent of substitution, also determining its short term scope, is the development of fuel shares over time. Change may come slowly to the energy system, but it does arrive. Oil’s share has been in structural decline for 40 years now, and its current share (31%) is the lowest in our data set. The line shows how a fuel can become more ‘specialized’ – as in oil concentrating in transport – if it is expensive. Coal has gained market share rapidly in recent years, fuelling the shift in the centre of gravity we discussed from the OECD to the industrializing world, and in the process fuelling income generation literally for billions of people. This has profound implications, for example for carbon emissions – something we have not yet discussed – as industrialisation is, and always has been, dependent on cheap energy. As a result, carbon emissions from the use of energy over the last ten years have (2.9% p.a.) risen faster than primary energy consumption (2.7%). Last year, they climbed by 3%, faster as well. They fell, however, in one large energy consumer not known for its carbon policies, the United States. The reason of course is the substitution of coal by natural gas – an example linking back to our discussion of what drives the development of new energy technologies. Today’s energy mix is dominated by fossil fuels, with renewable energy accounting for only 2% of global consumption. Even at current growth rates, and current financial support, it is easy to calculate just how long it will take for renewables to make a real difference – without technological break-through. The question this data point brings to my mind is whether there are useful

BP Statistical Review of World Energy June 2012 10
lessons to be learned about the role of competition in the emergence of new technologies which we have documented in the data on fossil fuels. A second issue I would like to mention in conclusion relates to the short term capacity of the system to increase output if required – as it did in 2011. The long term equivalent of this ability is the availability of resources. Our data continue to show that proved reserves rise over time, despite the steady increase in energy consumption. Today’s proved reserves of oil are sufficient to meet current production for 54 years; for natural gas that figure is 64 years; and for coal it is more than 100 years. Indeed, since we began tracking proved reserves of oil & natural gas in 1980, global reserves have increased every year for natural gas, and every year but one for oil (1998, when oil prices collapsed). As we have long argued, the world faces challenges in growing supply rapidly enough to sustain growth in energy demand and the economy, but at a global level the availability of hydrocarbon resources is not one of them.
Conclusion
BP Statistical Review of World Energy
© BP 2012
• 2011: supply response, inter-fuel substitution, trade optimisation
• Key: flexible markets
• Lessons: diversity of supply, global integration
Where does this leave us? I do think there are a few takeaways to be had from this year of disruptions, with seemingly normal growth and in line with long-term structural changes. These evolve around the flexibility of markets – the ability to increase production, to substitute across fuels, and to change trading patterns has been crucial to the ease with which the system has adapted. For this to work, prices must be allowed their role as signals to guide the reallocation of energy flows. Our messages change only slowly as well – and one of them is to praise the role of markets in guaranteeing energy security. There is a second, related, conclusion here. It has become fashionable to advocate energy independence as a path to security. I believe an objective look at the data shows that it is precisely the inter-dependence of the world’s energy system that is its real strength. Just imagine if Japan would have been truly self-sufficient, and not integrated into the global energy system at all – the adjustments we have seen would have been impossible.
Disclaimer The data series for proved oil and gas reserves in BP Statistical Review of World Energy June 2012 and referenced in this speech does not necessarily meet the definitions, guidelines and practices used for determining proved reserves at company level, for instance, under UK accounting rules contained in the Statement of Recommended Practice, ‘Accounting for Oil and Gas Exploration, Development, Production and Decommissioning Activities’ (UK SORP) or as published by the US Securities and Exchange Commission, nor does it necessarily represent BP’s view of any proved reserves. Rather, the data series has been compiled using a combination of primary official sources and third-party data.