energy in farming - morrisons · easily adopt a strategic approach for energy efficiency, ... –...
TRANSCRIPT

A Report in Three Parts:– How Energy efficient is your farm?– What you can do to improve efficiency and save money?– Nationwide farm efficiency case studies
Energy infarming

CopyrightThis study is copyright and the intellectual property of Wm Morrison Supermarkets plc and the Granted Consultancy Ltd. It may not be reproduced in whole or in part except with their written permission. Where permission is sought, consent will normally be granted on the condition that Wm Morrison Supermarkets plc and Granted Consultancy are attributed as the source of the reproduced material. Without such written permission, all such rights to reproduce any part of this document are withheld.
Researched and prepared by Granted Consultancy Ltd. in February 2012 on behalf of Morrisons PLC.
Granted provides impartial advice on renewable energy solutions and funding. Find out more at www.grantedltd.co.uk
1.0 Introduction 01
2.0 Benchmarking 032.1 Auditing 062.2 Prioritising 072.3 Making change 08
3.0 Technologies to cut cost and footprint 093.1 Milk cooling 093.2 Vacuum pumps 113.3 Water heating 123.4 Poultry house heat exchangers 143.5 Lighting 143.6 Water efficiency and rainwater harvesting 163.7 Precision farming techniques 17
4.0 Renewables 174.1 Wind 184.2 Solar 204.3 Solar thermal 224.4 Hydro 224.5 Heat pumps 244.6 Biomass boilers 254.7 Anaerobic digestion 27
5.0 Finance and funding 285.1 Return on investment 285.2 Obtaining bank funding 285.3 Asset finance 285.4 Grants 29
6.0 Conclusion 30
7.0 Top tips for success 31
Case studies 32
Resources and further reading 56
Contents
This guide shows how you can quite easily adopt a strategic approach for energy efficiency, ensuring any changes have the long term viability of your farm as their goal. It can help you assess your current energy use and where and what savings can be achieved in both the short and long term.
Why make changes to your farm?
There are three main reasons:
1. In the long run it saves money After the initial outlay for the energy efficiency measures and/or renewable energy the reduction in energy use will save you money as your fuel bills will be less. Many of the measures that can be put in place have further tangible benefits outlined in this report.
2. It encourages the responsible use of the resources we have available to us We live on a finite planet; with climate change and the increasing population it is down to current generations to live sustainably. This will mean that there are still resources available to future generations.
3. Greenhouse gas emissions have to be reduced
GHG emission targets are being put in place as they arethe main cause of the greenhouse effect; blanketing theEarth in a reflective layer of gases which trap in heat.This legislation which is being enforced means farmingis under incfreasing pressure to manage its emissions.We have two options:
1. Do nothing but be at risk of enforced changes.
2. Adopt a proactive strategy and ensure a more resilient and efficient business.
Option 1 is a higher risk option. It means you will have less freedom of choice to implement enforced changes. It also means you may have to implement changes on a lessconvenient timescale, dictated by others.
Option 2 will enable you to have a far greater control over your approach. It will reduce the risk of being forced to make changes. It will also ensure that you are able to receive the full financial and business benefits.
This guide has been designed to show you how to easily and effectively implement a long term considered strategy.
It will:
– Show you where to focus your efforts and how to get the maximum impact from your time and money.
– Save you time and show you how maintain a positive advantage.
1.0IntroductionWhy is energy efficiency important?
Energy in Farming 01

Energy in Farming02
The main areas of energy use are shown in the matrix below, table 1, with the applicable technologies or measures which can be applied to help reduce this energy consumption.
Horticulture and soft fruit– Heating of greenhouses– Insulation, refrigeration and ventilation of crop storage facilities
Poultry– Heating– Ventilation and cooling systems– Lighting
Potatoes and vegetables– Field cultivation practices and the use of precision farming technology– Ventilation, insulation and refrigeration of cold stores
Farm business types and areas where energy efficiencies can be made are listed below:
Dairy– Milk cooling– Water heating– Vacuum pumping– Lighting– Field cultivation practices
Arable– Field cultivation practices and the use of precision Farming technology– Crop drying and storage
Pigs, lamb and beef– Heating– Ventilation– Insulation of buildings
Sector/energy use area
Cooling Heating Pumping Lighting Fieldcultivation
Drying
Diary Milk cooling and 2 stagepre cooling.
Water heating.Renewable heat.
Variable speed vacuum pump.
Type andnumber of bulbs.Renewable electricity.
Precisionfarming.
Arable Precisionfarming.
Renewable heat.
Pig Bedding.Heat lamps.Renewableheat.
Type andnumber of bulbs.Renewable electricity.
Beef and lamb Bedding.Renewable heat.
Type andnumber of bulbs.Renewable electricity.
Horticulture Renewable electricity.
Renewable heat.
Potatoes Renewable electricity.
Precisionfarming.
Poultry Renewable electricity.Heat exchanger.
Heatexchangers.
Type andnumber of bulbs.Renewable electricity.
Table 1

Energy in Farming 03
Benchmarking ensures you know where you are starting from; how energy efficient is your farm compared to other farms in your sector and what is achievable.
One way of establishing this is by completing a detailed energy audit of your farm. Whilst this gives you a more accurate understanding it can be time consuming and expensive. If you are unable to conduct a full audit, yet still want some idea of your usage, some simple data gathering for a quick benchmarking exercise can still provide a good understanding.
*cow, livestock unit or acres
The first step is to assess your energy bills. They provide a good indication of usage and are often available historically. Tweleve months’ bills will provide a reasonably accurate figure.
The table below shows the kind of information required to benchmark your enterprise. There is a form at the back of the report that you can use.
Table 2: Benchmarking for energy usage
2.0Benchmarking
Resource Quantity Cost data Benchmarking data
Per unit Per year Actual farmperformance
Industrystandard/indicator
Energy ElectricityDay
kWh/year £/kWh kWh/cow*
kWh/cow*
ElectricityNight
kWh/year £/kWh kWh/cow*
kWh/cow*
TotalElectricity
kWh/year £/kWh kWh/cow*
kWh/cow*
Dryer OIl Litres/year p/litre £/T £/T
LPG Litres/year p/litre
Fuel Tractor Diesel
Litres/year p/litre Li/cow*
Li/cow*
Waste Inorganic Tonnes/year
£/Tonne
Kg/cow*
Li/cow*
Water Water kWh/year £/kWh kWh/cow*
kWh/cow*

Now that you have established your own personal benchmark you have a good baseline to measure improvements and calculate savings. It is also possible and makes sense to compare your performance against similar farms. Each industry sector has its own benchmark data you can refer to for comparison of figures. These are detailed in tables below, further information can be found at the websites given in the resources section on Page 56:
Dairy farm benchmarking
Dairy farming is a sector that uses high quantities of electricity and is a useful example for all farm businesses to consider.
A good method of benchmarking for dairy farms is to use the annual consumption of electricity measured on a per cow basis. This is called normalisation and enables comparison both between farms and within farms across a longer time scale. It is an easy figure to calculate using your electricity bills. Using the table 1 above simply add up the total number of kWh units you have used over a 12 month period and divide it by the number of cows that you have.
– Your result should be between 200kWh per cow and 600 kWh per cow. Less than 200kWh you are either extremely efficient already or have missed out some bills!
– Above 600kWh – you probably get a Christmas card from your energy company.
DairyCo conducted research into the annual electricity consumption on dairy farms and their conclusions were that average annual consumption on a kWh per cow basis should be in the range of 350–425kWh.
– For the top performing farms the annual electricity cost per cow will be under £25.
– The worst performing farms will have a cost of £60+.
Multiply this difference across a 100+ cows and the impact on a business is huge, but so is the opportunity for savings.
A quick benchmarking assessment does have someweaknesses which you need to be aware of and may skew the resulting figures.
Table 6: Average annual consumption per cowas advised by DairyCo.
Information produced by The Carbon Trust (2006) Agriculture and Horticulture; introducing energy saving opportunities for farmers and growers.Published by The Carbon Trust and available at: http://www.carbontrust.co.uk/cut-carbon-reduce-costs/calculate/energy-metering-monitoring/pages/industry-benchmarks.aspx#publications. Information in table 2 provided by EBLEX.Further information about EBLEX and energy use can be found at: www.eblex.org.uk
Information in table 2 provided by EBLEX. Further information about EBLEX and energy use can be found at: www.eblex.org.uk
Information produced by BPEX and The Carbon Trust (2005) Energy se inpig farming. Published by The Carbon Trust and available at: http://www.carbontrust.co.uk/cut-carbon-reduce-costs/calculate/energy-metering-monitoring/pages/industry-benchmarks.aspx#publications
Table 3: Agriculture and horticulture benchmark figures
Table 4: Beef benchmark figures Table 5: Pig farming benchmark figures
Energy in Farming04
Edible
Typical energy consumption kWh/m3
Intensive Extensive
Heat Electricity Heat Electricity
675 15 250 12
Resource Average
Electricity per kg of beef 0.074kWh
Fuel use per kg of beef 0.184 per litre
Ornamental
Typical energy consumption kWh/m3
Intensive Extensive
Heat Electricity Heat Electricity
450 60 175 12
Pig farming Typical energy use perpig produced (kWh/pig)
Farrowing 8
Weaning 9
Finishing 10
Feeding System 3
Waste Management 6
Average consumption Range in annual kWh per cow
Rating
Less than 250 Excellent
250–350 Very good
350–425 Average
425–475 Room for improvement
475–550 Of concern
Above 550 Prompt action required

Energy in Farming 05
Things to consider for the previous example are:
– Is your dairy system high or low output?
– Are you running a mixed enterprise farm with not just a dairy herd?
– Do your figures include domestic properties?
– Are your milkings taking longer than 2.5 hours?
Benchmarking will give you a good indication of what youmay be able to achieve and the potential for savings. As long as you understand the weaknesses then it is a useful tool.
Benchmarking example: Agri assist Morrisons emissions footprint analysis
There are a number of comprehensive on-line tools that can provide more detailed analysis of your GHG emissions and, in particular, energy use.
Just over 100 DCD dairy farms participated within a Morrisons’ funded Emissions Footprinting process from November 2010/January 2011. Farms involved covered all areas within the DCD Liquid milk field, from Devon to Lancashire, Pembrokeshireto Norfolk. Average milk production/farm was considerably larger than the UK national average with milk output at1.54m litres/unit (range 8m p.a. to 350k p.a.).
Twelve months data was sourced from the most recent financial year end for each farm. This ranged from year ends February 2010 to February 2011, with the majority utilising data from the financial year ending 31st March 2010.
Electricity cost/unit – results
During the financial periods covered by the data collection process, electricity prices increased enormously, withthose still on tariffs secured during earlier periods enjoyinga considerable advantage compared to those receiving electricity through more recent contract arrangements.
The average consumption/farm within this survey of 100 farms was 83,222 units/year
The overall range financially per farm/p.a. recorded was Low £4,260 to High £7,539
The graphs above right illustrate the ranges paid in pence/unit for both high and low rate tariffs across the dataset.
Electricity cost/litre of milk
The key performance indicator for electricity efficiencyon dairy farms when expressed on a per litre basis again demonstrates a large range.
Electricity tariff Range
High Low Average
High Unit Cost 18.47p 4.64p 9.06p
Low Unit Cost 10.90p 2.12p 5.12pLitres of Milk Produced/Units of Electricity Purchased
The principle element to reduce electricity cost on farm is to engage in efficiency measures to improve the effectivenessof the electricity consumed.
20
18
16
14
12
10
8
6
4
2
0pe
nce
/ un
it
2.00
1.80
1.60
1.40
1.20
1.00
0.80
0.60
0.40
0.20
0.00
ppl
12
10
8
6
4
2
0
penc
e /
unit
Average electricity cost per litre of milk = 0.47p/litre
With many farms paying double and an extreme example paying four times this, the highest being 1.80p/litre on electricity alone.
Below are results from a benchmarking project across a broad range of Dairy Crest farm suppliers:
ElectricityHigh tariff cost p/u
ElectricityLow tariff cost p/u
Electricity costPer litre
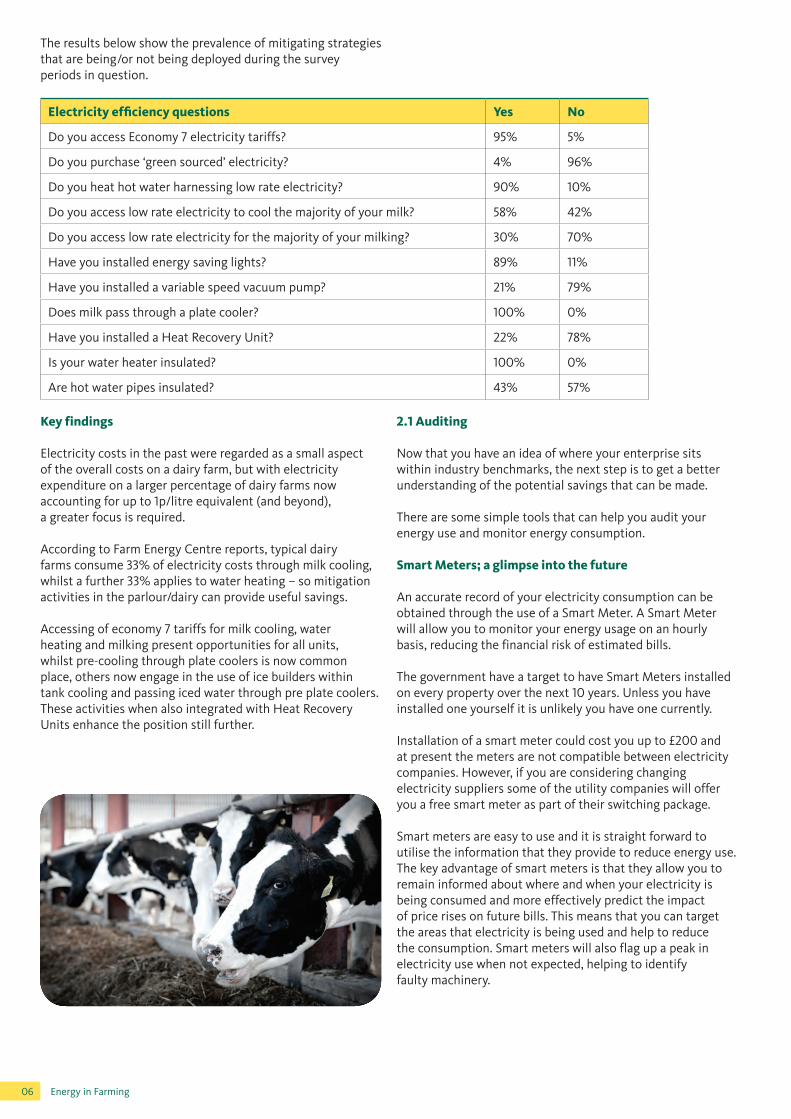
Electricity efficiency questions Yes No
Do you access Economy 7 electricity tariffs? 95% 5%
Do you purchase ‘green sourced’ electricity? 4% 96%
Do you heat hot water harnessing low rate electricity? 90% 10%
Do you access low rate electricity to cool the majority of your milk? 58% 42%
Do you access low rate electricity for the majority of your milking? 30% 70%
Have you installed energy saving lights? 89% 11%
Have you installed a variable speed vacuum pump? 21% 79%
Does milk pass through a plate cooler? 100% 0%
Have you installed a Heat Recovery Unit? 22% 78%
Is your water heater insulated? 100% 0%
Are hot water pipes insulated? 43% 57%
Key findings
Electricity costs in the past were regarded as a small aspectof the overall costs on a dairy farm, but with electricity expenditure on a larger percentage of dairy farms now accounting for up to 1p/litre equivalent (and beyond),a greater focus is required.
According to Farm Energy Centre reports, typical dairy farms consume 33% of electricity costs through milk cooling,whilst a further 33% applies to water heating – so mitigation activities in the parlour/dairy can provide useful savings.
Accessing of economy 7 tariffs for milk cooling, water heating and milking present opportunities for all units, whilst pre-cooling through plate coolers is now common place, others now engage in the use of ice builders within tank cooling and passing iced water through pre plate coolers. These activities when also integrated with Heat Recovery Units enhance the position still further.
The results below show the prevalence of mitigating strategies that are being/or not being deployed during the survey periods in question.
Energy in Farming06
2.1 Auditing
Now that you have an idea of where your enterprise sits within industry benchmarks, the next step is to get a better understanding of the potential savings that can be made.
There are some simple tools that can help you audit your energy use and monitor energy consumption.
Smart Meters; a glimpse into the future
An accurate record of your electricity consumption can be obtained through the use of a Smart Meter. A Smart Meter will allow you to monitor your energy usage on an hourly basis, reducing the financial risk of estimated bills.
The government have a target to have Smart Meters installed on every property over the next 10 years. Unless you have installed one yourself it is unlikely you have one currently.
Installation of a smart meter could cost you up to £200 andat present the meters are not compatible between electricity companies. However, if you are considering changingelectricity suppliers some of the utility companies will offer you a free smart meter as part of their switching package.
Smart meters are easy to use and it is straight forward to utilise the information that they provide to reduce energy use. The key advantage of smart meters is that they allow you to remain informed about where and when your electricity is being consumed and more effectively predict the impactof price rises on future bills. This means that you can targetthe areas that electricity is being used and help to reducethe consumption. Smart meters will also flag up a peak inelectricity use when not expected, helping to identifyfaulty machinery.

Energy in Farming 07
Conducting an Energy audit is the best way to identify any hotspots in your energy usage. The best way to carry thisout is to use a portable energy monitor, as shown below, to pinpoint energy usage by piece of equipment or supply. The Energy Monitor is simply attached to the feed on equipment, usually by clipping round the wire, and give you a reading of the usage on that piece of equipment. They are also able tobe placed on your meter and give a live feed of energy usage which can be used, by selective switching of equipment to identify high energy users.
When you are conducting the energy audit be sure to bear in mind not just the current rating of the equipment but its usual usage pattern and also its annual usage. For example in an office a 3kW bar heater will work out at the following high cost for the year even though it is not a very high peakenergy user:
At 10p/kWh this works out as £600 per year for a small office heater.
Energy monitor examples
Equipmentusage
Hours per day
Daysper Year
Total
3kW 8 250 6,000kWh
2.2 Prioritising
Prioritising is how you decide which measures to implement first and where best to commit financially.
The factors to consider are:
1. Are there simple, low cost measures I can make to my current operations that will improve my energy efficiency.
2. Where can I have the biggest impact on energy usage and costs within my business?
3. Should I concentrate on energy saving or energy generation through renewables.
In practical terms our advice would be:
1. Begin with low cost measures. You are more likely to see a better return on your money through low cost energy saving measures than on a high cost new project.
2. If you have a strong wind, south facing roofs or a head of water then it is likely you have good potential for renewable energy on the farm. In this case investment in renewables might give you a better payback than energy saving measures.
3. Look at the activities on your farm that are intensive users of energy. Consider what energy saving technologies or improved behaviours can be introduced.
This report is focussed on the direct use of energy on the farm. It does not look at the indirect use of energy through the production of items such as tractors, farm machinery, bought in feeds, fertiliser and drugs/dairy chemicals but it may be that you want to look at these as a separate issue.
Between the farming sectors energy use varies. We have detailed overleaf where, within each sector, the main energy saving potential exists.

2.3 Making change
It is likely that in order to reduce your farm GHG you will need to make changes. Some of these can be low or no cost measures, such as remembering to switch off lights, others may require a financial investment.
Whenever you consider a resource use on your farm, be it energy, water or other resources, it is important to adopt a two pronged approach.
On the one hand is the technology being used:
– The most efficient available?– Well maintained?– Suited to the task?
One the other hand, and often overlooked, is how thetechnology is used:
– Is it turned off when not in use?– Is it used appropriately?– Do people have sufficient skills to use it properly?
If you adopt the two pronged approach it will ensure you address the potential savings in a comprehensive mannerand are far less likely to miss opportunities.
Prior to outlaying on new technologies it may be worthwhile to carry out actions that can quickly improve the efficiency of your existing plant and equipment.
The list below is not exhaustive but is based upon information gathered when completing on-farm energy audits and serves as a useful basis for conducting your own energy audit.
Hot water tank – What condition is the insulation in?– Does it need to be improved with a new cylinder jacket or a couple of cans of expandable foam?
Thermostat – Are they working and are they set to the correct temperature?
Timer clocks – Are they working?– Is the time correct?
Electricity contract – Have you checked when your off peak hours are?– When is your contract due for renewal?– Is your contract part of a group scheme?– When does your contract end?
Smart meters – Put an end to estimated bills and avoid problems of contracts being renewed without your knowledge.– Have you got them installed?
Lighting – When were the bulbs last cleaned? – Are you using low energy bulbs? – Are the lights on for longer than they need to be?
Water – Are any taps leaking? – Are pipes carrying the hot water from the cylinder insulated?
Compressors – When did you last clean the grills?– Is the airflow around the compressors sufficient?
Wash-down procedures – Hot wash twice a day.– Is the temperature set correctly?
Milking times – Can you adjust your starting times to take more advantage of your off peak rate?
Tractors and machinery – Are they regularly serviced and maintained? – Are staff are properly trained to use machinery?– Fuel consumption can increase by up to 45% if machinery is not operated in an efficient manner.– Where possible ensure the horse power of the tractor is appropriate to the task in hand.– Make sure machinery is stored safely and if possible in a manner to deter theft.– Consider using GPS technology to improve the efficiency of field operations.
Diesel – Store in plastic bunded tanks where possible.– Avoid storing diesel in dark coloured metal tanks that receive direct sun light. – Up to 9 gallons of diesel a month can be lost due to evaporation from a 300 gallon metal tank in full sunlight.
Insulation(This particularly relevantto farms with cold stores)
– Are your buildings adequately insulated? – Are there gaps in the insulation?– Are seals in good working order?
Energy in Farming08

3.0Technologies to cut cost and footprint
3.1 Milk cooling
The process of milk cooling is responsible for around 30%of the energy consumed on dairy farms making it one of the most important areas to target.
The first thing to consider is the efficiency of your platecooler i.e. what reduction in milk temperature is it achieving. The minimum it should be achieving is 10ºC and if you’re pre-cooling is very efficient reductions in temperature of 20ºC can be achieved. If your plate cooler is working efficientlythe milk exiting the system should be within 2–4ºC of the temperature of the water entering.
Table 7 below displays the effect of plate cooler efficiency on the annual cost of cooling milk.
Cooling provided by water source (ºC) kWh (per 100 litres) Pence (per 100 litres) Annual cost (£)
No pre cooling 1.4 13.44 1,343
10 0.95 8.68 867
15 0.73 6.80 679
20 0.50 4.67 467
Table 7
This assumes a Day rate 10.85p/kWh, Night Rate 6.6p/kWh. One million litres produced annually. DX Tank less than 10 years old with no Ice Builder.
Energy in Farming 09
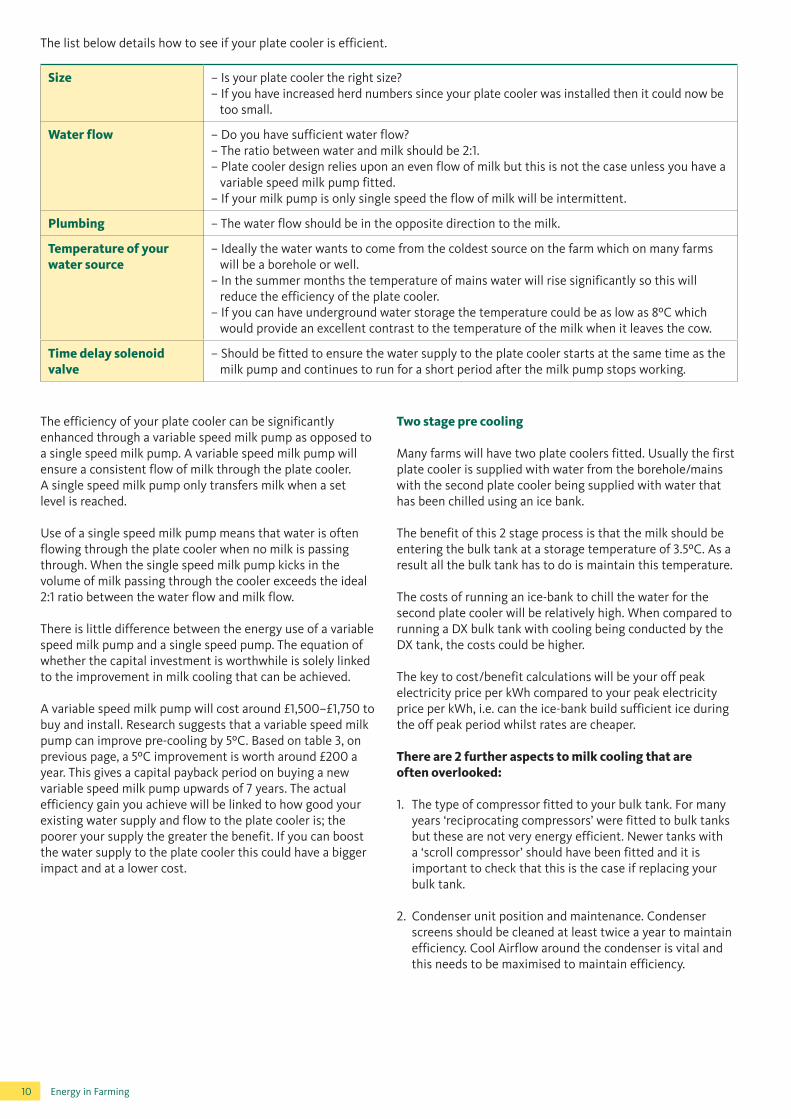
Size – Is your plate cooler the right size? – If you have increased herd numbers since your plate cooler was installed then it could now be too small.
Water flow – Do you have sufficient water flow?– The ratio between water and milk should be 2:1. – Plate cooler design relies upon an even flow of milk but this is not the case unless you have a variable speed milk pump fitted. – If your milk pump is only single speed the flow of milk will be intermittent.
Plumbing – The water flow should be in the opposite direction to the milk.
Temperature of yourwater source
– Ideally the water wants to come from the coldest source on the farm which on many farms will be a borehole or well. – In the summer months the temperature of mains water will rise significantly so this will reduce the efficiency of the plate cooler. – If you can have underground water storage the temperature could be as low as 8ºC which would provide an excellent contrast to the temperature of the milk when it leaves the cow.
Time delay solenoid valve
– Should be fitted to ensure the water supply to the plate cooler starts at the same time as the milk pump and continues to run for a short period after the milk pump stops working.
The list below details how to see if your plate cooler is efficient.
The efficiency of your plate cooler can be significantly enhanced through a variable speed milk pump as opposed toa single speed milk pump. A variable speed milk pump will ensure a consistent flow of milk through the plate cooler.A single speed milk pump only transfers milk when a setlevel is reached.
Use of a single speed milk pump means that water is often flowing through the plate cooler when no milk is passing through. When the single speed milk pump kicks in the volume of milk passing through the cooler exceeds the ideal 2:1 ratio between the water flow and milk flow.
There is little difference between the energy use of a variable speed milk pump and a single speed pump. The equation of whether the capital investment is worthwhile is solely linked to the improvement in milk cooling that can be achieved.
A variable speed milk pump will cost around £1,500–£1,750 to buy and install. Research suggests that a variable speed milk pump can improve pre-cooling by 5ºC. Based on table 3, on previous page, a 5ºC improvement is worth around £200 a year. This gives a capital payback period on buying a new variable speed milk pump upwards of 7 years. The actual efficiency gain you achieve will be linked to how good your existing water supply and flow to the plate cooler is; the poorer your supply the greater the benefit. If you can boost the water supply to the plate cooler this could have a bigger impact and at a lower cost.
Two stage pre cooling
Many farms will have two plate coolers fitted. Usually the first plate cooler is supplied with water from the borehole/mains with the second plate cooler being supplied with water that has been chilled using an ice bank.
The benefit of this 2 stage process is that the milk should be entering the bulk tank at a storage temperature of 3.5ºC. As a result all the bulk tank has to do is maintain this temperature.
The costs of running an ice-bank to chill the water for the second plate cooler will be relatively high. When compared to running a DX bulk tank with cooling being conducted by the DX tank, the costs could be higher.
The key to cost/benefit calculations will be your off peak electricity price per kWh compared to your peak electricity price per kWh, i.e. can the ice-bank build sufficient ice during the off peak period whilst rates are cheaper.
There are 2 further aspects to milk cooling that areoften overlooked:
1. The type of compressor fitted to your bulk tank. For many years ‘reciprocating compressors’ were fitted to bulk tanks but these are not very energy efficient. Newer tanks with a ‘scroll compressor’ should have been fitted and it is important to check that this is the case if replacing your bulk tank.
2. Condenser unit position and maintenance. Condenser screens should be cleaned at least twice a year to maintain efficiency. Cool Airflow around the condenser is vital and this needs to be maximised to maintain efficiency.
Energy in Farming10

3.2 Vacuum pumps
Sizing and efficiency
Traditionally most conventional vacuum pumps have been intentionally oversized with the basic theory being ‘biggest is best’. In the 1990s studies revealed that large vacuum pumps are not required as long as the vacuum regulator is correctly placed in the milking system as shown in diagram 1 below:
A reduced vacuum pump capacity can be used if the regulator is correctly positioned, maintaining the same vacuum level for milking.
It is recommended that you discuss with your dairy engineers both the size of your vacuum pump and the location of the regulator within the system. Generally, if your current pump is in good operational order it is not economical to change to a more energy efficient model.
Types of vacuum pump: performance
3 Main types of vacuum pump in use are:
– Rotary Lobe (blower) Pump– Water Ring– Sliding Vane Rotary
The different pumps have their own individual features with some types being more energy efficient than others and some types being better suited to variable speed vacuum.
– The Rotary Lobe (blower) Pump is both the most energy efficient and the most suited to variable speed vacuum.
– The Water Ring Pump is not very energy efficient and not suited for variable speed vacuum.
– The Sliding Vane Rotary Pump is ok from an energy efficiency angle but is not that suitable for variable speed vacuum when operating under a single phase electricity supply.
Check with your dairy engineer what type of pump you have and its suitability for variable speed vacuum.
Variable speed vacuum: savings and challenges
Conventional vacuum pumps operate at a constant speedand use a vacuum regulator to admit air into the system to maintain a constant level of vacuum.
Fixed speed vacuum pumps operate at the speed necessaryto deliver the theoretical maximum level of vacuum demand. This is often in excess of what is required for the normal operating of the parlour. The extra vacuum capacity is builtin to cover unusual events like multiple cluster kick offs. As a result the vacuum pump is operating at a much higher speed than is needed for the normal milking routine, wasting electricity as a result.
To avoid this waste of energy you can purchase a new variable speed vacuum pump or retrofit a Variable Speed Drive (VSD) to your vacuum system.
Unless your fixed speed vacuum pump is nearing the end ofits life it is unlikely to be economic to purchase a brand new variable speed pump.
With variable speed control systems the computerised VSD controller is electronically installed between the vacuum pump motor and the motor control switch. The regulator is replaced with a pressure sensor and this is connected to the VSD controller. The VSD controller constantly monitors the vacuum level and adjusts the motor speed accordingly.
Energy in Farming 11
Diagram 1
Distributiontank
Pulsator airline
Pulsator
Air in
Milkline
Milk in
Milk out
Receiver
Main airline
Vacuum pump
Milkpump
Sanitarytrap
Air out
Milk unit
Air leaksRegulator air in

Vacuum pump maintenance
To keep your system operating as efficiently as possible itis important to have a maintenance programme and this should include:
– Cleaning the regulator filter on a regular basis.– An annual service of the vacuum system to check pump oil level, condition of the pipes and the tension of the belts from the motor to the pump.– With rotary lube pumps, cleaning to remove accumulated chemical residue.
3.3 Water heating
Typically, dairy farms will have 2 or 3 water heaters:
– A main water heater to provide hot water for cleaning the milking system.– A second water heater to provide hot water for cleaning the bulk tank.– On some farms a third heater to provide hot water for udder washing.– Livestock farms will often have a water heater to provide warm water for calf feeding.
Hot water heating typically accounts for around 30% of the electricity used on dairy farm. It should be one of the main areas you target when looking at energy efficiency on the farm.
Frequent issues with water heating on farm are:
– Water being heated on costly peak rate electricity.– Inadequate insulation on tanks.– Age of equipment.– Hard or soft water creating efficiency issues.– No time clocks or thermostats, or they are not working.– Tank size not appropriate.
To review the efficiency of your water heating there are some simple questions to work through:
1. Are you heating the correct amount of hot water for your dairy herd and plant?
The size of your main water heater should correspond tothe number of milking points in the parlour and be sized accordingly. Table 10, above right, gives an idea of theappropriate tank capacity.
If your tank is too large you may be heating large quantitiesof hot water unnecessarily. If your tank is too small additional heating on expensive peak rate electricity might be required to top up the system.
Energy in Farming12
Trials have indicated that variable speed vacuum can reduce electricity consumption by anywhere between 30% and 70% with 40%–50% being the average.
Table 8 below details the annual energy and financial savings from the installation of VSD to a fixed speed pump costing £955 per annum to run.
Key points to consider with variable speed vacuum:
– The technology is most suited to a lobe pump or sliding vane pump on a three phase electricity supply.
– If you are on a single phase electricity supply you will need to discuss the options with your dairy engineer as different manufacturers recommend different courses of action.
– One VSD unit can run up to 3 vacuum pumps.
– The longer that your milking routine takes, the greater your saving from introducing variable speed technology.
Non energy benefits of variable speed vacuum
The benefits of variable speed technology are not justfinancial. Table 9 below details these benefits:
Percentage saving from VSD
Energy Saving (kWh)
COs saving (tonnes)
Financial saving (£)
30 3,265 1.73 287
40 4,380 2.31 382
50 5,475 2.89 478
60 6,570 3.46 573
70 7,665 4.04 669
Table 8
Longer pump life By getting pumps to operate at lower speeds the life span of the pump should be extended.
Reduced noiselevels
The reduced operating speed ofa variable speed pump willdramatically reduce noise levels.
Herd health Research from the US shows that variable speed controllers minimise teat-end impacts and thus help to reduce the herd Somatic Cell Count.
Table 9
Case Study – Bicton Home Farm; Vacuum on Demand pump (VoD) Please turn to page 32 for details
13
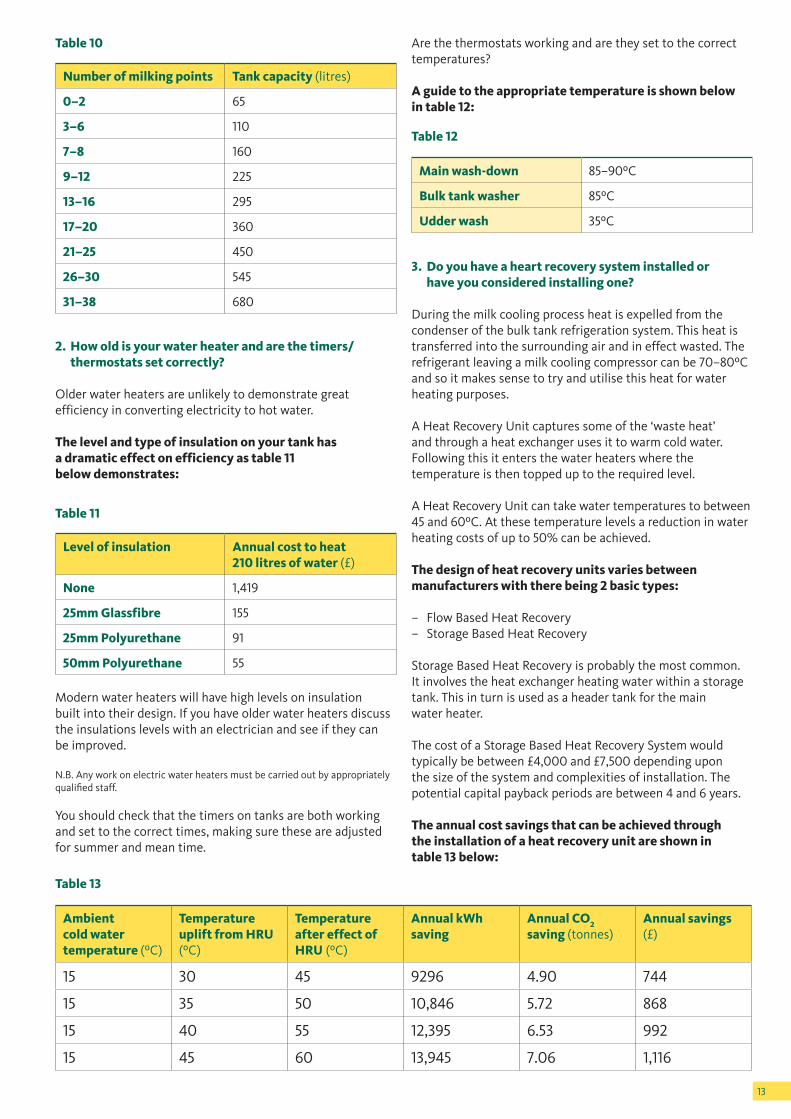
2. How old is your water heater and are the timers/ thermostats set correctly?
Older water heaters are unlikely to demonstrate great efficiency in converting electricity to hot water.
The level and type of insulation on your tank has a dramatic effect on efficiency as table 11 below demonstrates:
Modern water heaters will have high levels on insulation built into their design. If you have older water heaters discuss the insulations levels with an electrician and see if they can be improved.
N.B. Any work on electric water heaters must be carried out by appropriately qualified staff.
You should check that the timers on tanks are both working and set to the correct times, making sure these are adjusted for summer and mean time.
Number of milking points Tank capacity (litres)
0–2 65
3–6 110
7–8 160
9–12 225
13–16 295
17–20 360
21–25 450
26–30 545
31–38 680
Table 10 Are the thermostats working and are they set to the correct temperatures?
A guide to the appropriate temperature is shown below in table 12:
3. Do you have a heart recovery system installed or have you considered installing one?
During the milk cooling process heat is expelled from the condenser of the bulk tank refrigeration system. This heat is transferred into the surrounding air and in effect wasted. The refrigerant leaving a milk cooling compressor can be 70–80ºC and so it makes sense to try and utilise this heat for water heating purposes.
A Heat Recovery Unit captures some of the ‘waste heat’and through a heat exchanger uses it to warm cold water. Following this it enters the water heaters where thetemperature is then topped up to the required level.
A Heat Recovery Unit can take water temperatures to between 45 and 60ºC. At these temperature levels a reduction in water heating costs of up to 50% can be achieved.
The design of heat recovery units varies betweenmanufacturers with there being 2 basic types:
– Flow Based Heat Recovery– Storage Based Heat Recovery
Storage Based Heat Recovery is probably the most common.It involves the heat exchanger heating water within a storage tank. This in turn is used as a header tank for the main water heater.
The cost of a Storage Based Heat Recovery System would typically be between £4,000 and £7,500 depending uponthe size of the system and complexities of installation. The potential capital payback periods are between 4 and 6 years.
The annual cost savings that can be achieved through the installation of a heat recovery unit are shown in table 13 below:
Level of insulation Annual cost to heat210 litres of water (£)
None 1,419
25mm Glassfibre 155
25mm Polyurethane 91
50mm Polyurethane 55
Table 11
Main wash-down 85–90ºC
Bulk tank washer 85ºC
Udder wash 35ºC
Table 12
Table 13
Ambientcold water temperature (ºC)
Temperature uplift from HRU(ºC)
Temperature after effect of HRU (ºC)
Annual kWh saving
Annual CO2
saving (tonnes)Annual savings (£)
15 30 45 9296 4.90 744
15 35 50 10,846 5.72 868
15 40 55 12,395 6.53 992
15 45 60 13,945 7.06 1,116

Table 9, on previous page, has the assumptions listed below:
– 365 litre water tank heating water from 15ºC–85ºC twice a day.
– Average electricity price of 8.725p per kWh.
– To raise one litre of water one degree C takes 0.001163 kWh of electricity.
– CO2 emissions based upon 0.527kg/kWh.
Every farm is different so potential savings will vary. Your dairy engineer will be able produce a projection of the potential savings from which you can work out the capital payback period for your installation.
Interaction between HRU, plate coolers and pre-coolersA Heat Recovery Unit and a standard plate cooler arecompatible technologies.
Where a pre-cooler (with an ice bank) is fitted a Heat Recovery Unit is not a compatible technology.
3.4 Poultry house heat exchangers
Intensive poultry producers face high energy costs through the need to manage the temperature and ventilation in poultry sheds. These energy demands vary with:
– The time of day and seasons.
– The stages in the life cycle of the flock.
If the conditions within a shed are not efficiently managed flock health and performance will suffer.
Poultry House Heat Exchangers have been specifically developed for the industry to both reduce costs and improve management. They consist of an air to air heat exchanger which captures the heat from the exhaust ventilation within a poultry shed. This heat is then used to warm the incoming air to the shed. The benefits of this are:
– Up to a 50% reduction in the energy required to maintain the required temperatures within poultry sheds.
– Improved flock health as dust and ammonia emissions are captured in the heat exchange process.
– Heat Exchangers are available to suit a wide range of flock sizes. They can be retrofitted to the outside of existing sheds.
Energy in Farming14
Case Study – Portyhilly Farm; Heat Recovery Unit Please turn to page 34 for details
The benefits of poultry house heat exchangers are being published in the farming press and some manufacturers offer a ‘buy back’ scheme if you are not happy with the impact of the machine.
– Exchanger tubes the cold incoming air to a shed, is pre- heated and gas consumption is reduced by around 50%.
– The manufacturers of the machine claim that on 30,000 birds, 1,800 litres of gas are saved and, across 12 months, carbon emissions are reduced by 5,000 kgs.
– Trial data from the manufacturers indicate better weight gain for the chicks, reduction in feed consumption and reduction in use of litter. Based on 30,000 birds, cost savings of £7k p.a. were reported against a capital outlay of £25k.
The choice of manufacturers has been previously limited and until recently there have been very few options available to producers. As the technology is becoming widely used more manufacturers are developing the technology, bringing prices down and making it more obtainable.
Below are the claims of one manufacturer:
– Trials of the unit across 35 farms have indicated an average gas saving of 52.9%.
The units work by saving up to 80% of the energy that is discharged from poultry houses by normal ventilation methods – by passing the hot exhaust air over heat.
3.5 Lighting
– Lighting is likely to be responsible for around 5–15% of the electricity you use and is an area that can provide the quickest payback periods.
– Lighting technology and efficiency is improving all the time. In particular LED technology is a fast developing, highly efficient option.
– Lighting plays a very important role especially for the welfare of people working on the farm.
Case study – Poultry farm in Devon; Heat exchangers Please turn to page 36 for details
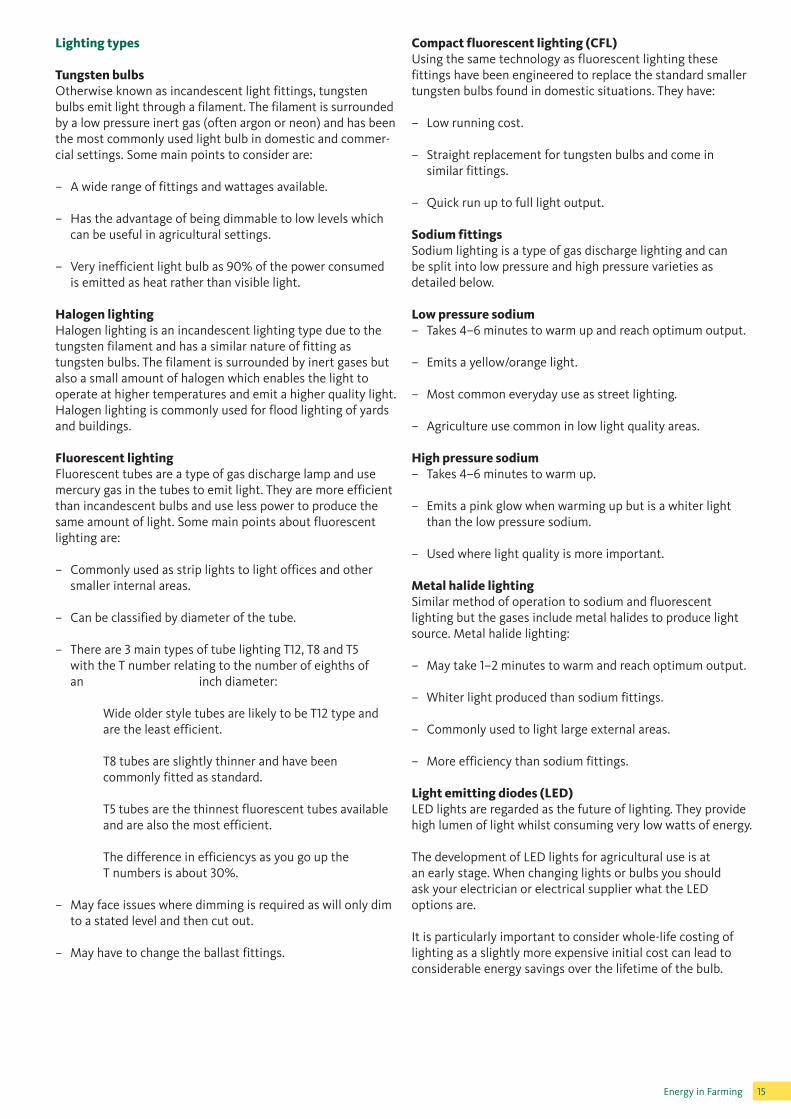
Lighting types
Tungsten bulbsOtherwise known as incandescent light fittings, tungsten bulbs emit light through a filament. The filament is surrounded by a low pressure inert gas (often argon or neon) and has been the most commonly used light bulb in domestic and commer-cial settings. Some main points to consider are:
– A wide range of fittings and wattages available.
– Has the advantage of being dimmable to low levels which can be useful in agricultural settings.
– Very inefficient light bulb as 90% of the power consumed is emitted as heat rather than visible light.
Halogen lightingHalogen lighting is an incandescent lighting type due to the tungsten filament and has a similar nature of fitting as tungsten bulbs. The filament is surrounded by inert gases but also a small amount of halogen which enables the light to operate at higher temperatures and emit a higher quality light. Halogen lighting is commonly used for flood lighting of yards and buildings.
Fluorescent lightingFluorescent tubes are a type of gas discharge lamp and use mercury gas in the tubes to emit light. They are more efficient than incandescent bulbs and use less power to produce the same amount of light. Some main points about fluorescent lighting are:
– Commonly used as strip lights to light offices and other smaller internal areas.
– Can be classified by diameter of the tube.
– There are 3 main types of tube lighting T12, T8 and T5 with the T number relating to the number of eighths of an inch diameter:
Wide older style tubes are likely to be T12 type and are the least efficient.
T8 tubes are slightly thinner and have been commonly fitted as standard.
T5 tubes are the thinnest fluorescent tubes available and are also the most efficient.
The difference in efficiencys as you go up the T numbers is about 30%.
– May face issues where dimming is required as will only dim to a stated level and then cut out.
– May have to change the ballast fittings.
Compact fluorescent lighting (CFL)Using the same technology as fluorescent lighting these fittings have been engineered to replace the standard smaller tungsten bulbs found in domestic situations. They have:
– Low running cost.
– Straight replacement for tungsten bulbs and come in similar fittings.
– Quick run up to full light output.
Sodium fittingsSodium lighting is a type of gas discharge lighting and can be split into low pressure and high pressure varieties as detailed below.
Low pressure sodium– Takes 4–6 minutes to warm up and reach optimum output.
– Emits a yellow/orange light.
– Most common everyday use as street lighting.
– Agriculture use common in low light quality areas.
High pressure sodium– Takes 4–6 minutes to warm up.
– Emits a pink glow when warming up but is a whiter light than the low pressure sodium.
– Used where light quality is more important.
Metal halide lightingSimilar method of operation to sodium and fluorescent lighting but the gases include metal halides to produce light source. Metal halide lighting:
– May take 1–2 minutes to warm and reach optimum output.
– Whiter light produced than sodium fittings.
– Commonly used to light large external areas.
– More efficiency than sodium fittings.
Light emitting diodes (LED)LED lights are regarded as the future of lighting. They provide high lumen of light whilst consuming very low watts of energy.
The development of LED lights for agricultural use is atan early stage. When changing lights or bulbs you shouldask your electrician or electrical supplier what the LEDoptions are.
It is particularly important to consider whole-life costing of lighting as a slightly more expensive initial cost can lead to considerable energy savings over the lifetime of the bulb.
Energy in Farming 15

Comparison of lighting energy efficiency
The efficiency of lighting can be measured in lumens per watt (lm/W). The fittings measured above can be rated against each other in their effectiveness to produce light from power input. This is shown in diagram 2 below.
Lighting controls
Lighting on farms is frequently left on for longer than necessary and often does not have any automatic control devices.
There are various fittings available for lighting control. These include:
– Occupancy sensors which can detect if someone is entering building/room. These can also be set to automatically switch off again if no movement is detected after a certain period.
– Dusk/dawn sensors can be fitted to trigger the switching on/off of lights as the light levels change.
– Timers can also be used to control when lights switch on/off.
– Combination sensors can incorporate any of the 3 above.
3.6 Water efficiency and rainwater harvesting
One of the biggest challenges facing agriculture in the future will be the availability of water. Climate change, an increasing population and the urbanisation of the countryside are impacting upon a resource that for years we have taken for granted.
Water on farms will either come from an on-site supply (borehole or spring) or from the mains. Typical costs per cubic metre are shown in table 14 below.
As costs will almost certainly increase in the future it is important to consider how you can conserve water by:
– Preventing and repairing leaks, fixing dripping taps and hose pipes.
– Reducing water pressure.
– Alternative washing and cleaning processes.
– The correct schedule of irrigation to meet crop needs and reduce evaporation.
Another option to consider is rainwater harvesting. This is done by capturing the water from your farm building that would otherwise have been lost through evaporation or soaking into the ground.
Buildings under construction present the ideal opportunityto install a rainwater harvesting system but it can also be added to existing structures. There are systems available to suit all needs and budgets. A simple system might be created by diverting roof gutters into a storage tank. A more complex system could involve pumped storage, filters and UV treatment for use on ready to eat crops.
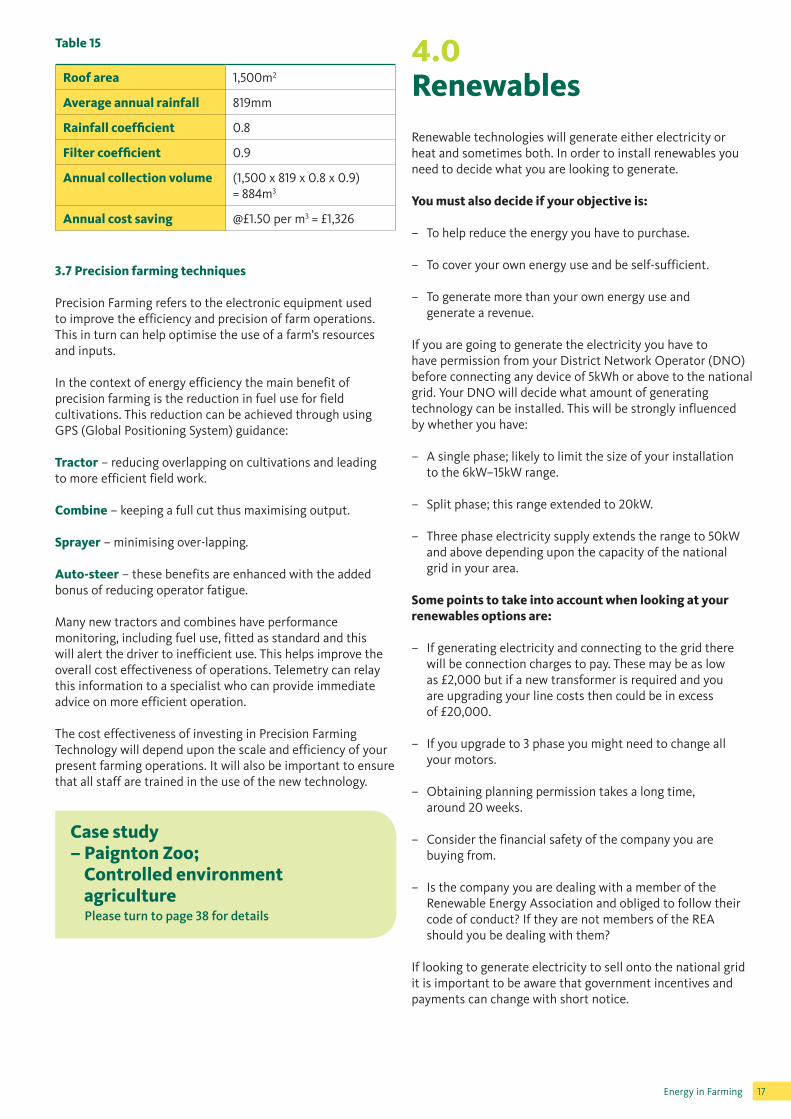
A simple calculation detailed below can be used to determine how much rainwater you can harvest. You will initially need to measure the roof area in m2 and your average rainfall in mm.
Multiply the roof and rainfall readings by a coefficient as not all the rainfall on a roof will drain away (0.8 for pitched roofs and 0.5 for flat roofs). Finally, add a filter coefficient if filters are used in the downpipes to remove contaminants (0.9 filter coefficient). An example can be seen in table 15 above right.
Energy in Farming16
Mains £1.40–£2.00 per m3 plus a standing charge
Borehole/abstraction £0.15–£0.30m3
Table 14
LED High Lumens/Watt More EfficientLow Pressure SodiumLighting Efficient
High Pressure Sodium
Metal Halide
Fluorescent Tubes
Compact FluorescentTubes
Halogen Lighting
Tungsten Bulbs Low Lumens/Watt Efficient Less Efficient
Diagram 2
3.7 Precision farming techniques
Precision Farming refers to the electronic equipment usedto improve the efficiency and precision of farm operations. This in turn can help optimise the use of a farm’s resources and inputs.
In the context of energy efficiency the main benefit of precision farming is the reduction in fuel use for fieldcultivations. This reduction can be achieved through using GPS (Global Positioning System) guidance:
Tractor – reducing overlapping on cultivations and leadingto more efficient field work.
Combine – keeping a full cut thus maximising output.
Sprayer – minimising over-lapping.
Auto-steer – these benefits are enhanced with the added bonus of reducing operator fatigue.
Many new tractors and combines have performancemonitoring, including fuel use, fitted as standard and thiswill alert the driver to inefficient use. This helps improve the overall cost effectiveness of operations. Telemetry can relay this information to a specialist who can provide immediate advice on more efficient operation.
The cost effectiveness of investing in Precision Farming Technology will depend upon the scale and efficiency of your present farming operations. It will also be important to ensure that all staff are trained in the use of the new technology.
Roof area 1,500m2
Average annual rainfall 819mm
Rainfall coefficient 0.8
Filter coefficient 0.9
Annual collection volume (1,500 x 819 x 0.8 x 0.9)= 884m3
Annual cost saving @£1.50 per m3 = £1,326
Table 15 4.0RenewablesRenewable technologies will generate either electricity orheat and sometimes both. In order to install renewables you need to decide what you are looking to generate.
You must also decide if your objective is:
– To help reduce the energy you have to purchase.
– To cover your own energy use and be self-sufficient.
– To generate more than your own energy use and generate a revenue.
If you are going to generate the electricity you have tohave permission from your District Network Operator (DNO) before connecting any device of 5kWh or above to the national grid. Your DNO will decide what amount of generating technology can be installed. This will be strongly influencedby whether you have:
– A single phase; likely to limit the size of your installation to the 6kW–15kW range.
– Split phase; this range extended to 20kW.
– Three phase electricity supply extends the range to 50kW and above depending upon the capacity of the national grid in your area.
Some points to take into account when looking at your renewables options are:
– If generating electricity and connecting to the grid there will be connection charges to pay. These may be as low as £2,000 but if a new transformer is required and you are upgrading your line costs then could be in excess of £20,000.
– If you upgrade to 3 phase you might need to change all your motors.
– Obtaining planning permission takes a long time, around 20 weeks.
– Consider the financial safety of the company you are buying from.
– Is the company you are dealing with a member of the Renewable Energy Association and obliged to follow their code of conduct? If they are not members of the REA should you be dealing with them?
If looking to generate electricity to sell onto the national grid it is important to be aware that government incentives and payments can change with short notice.
Energy in Farming 17
Case study – Paignton Zoo; Controlled environment agriculture Please turn to page 38 for details

The basics
– For a wind turbine to be economically viable an average wind speed of above 5m/s is required at its proposed location.
– You can get an indication of the wind speed for your postcode from the Department of Energy and Climate Change (DECC) website that provides a link to the NOABL wind speed database.
– The wind speed from the NOABL database is the indicative speed for a 1km square based on your grid reference. It can vary in terms of accuracy and on-site wind monitoring for a 6 to 12 month period should be undertaken to obtain a more accurate wind speed.
– A wind turbine must be located at least 250m from the nearest neighbouring residential property and 50 metres away from the nearest hedge (if a turbine is to be closer than 50 metres to a hedge a bat survey will be required).
– A connection into the national grid will usually be required and the ability and cost of achieving this must be determined from your DNO at a very early stage.
– Income from a wind turbine is usually derived from 3 sources: The FiTs you receive for each kWh unit of electricity generated. The cost saving of the electricity you no longer have to buy. The income from the electricity you sell. – To receive the FiTs your turbine must be have passed the Microgeneration Certification Scheme (MCS) guidelines. You should obtain written confirmation from the turbine supplier that their turbine is eligible to receive the feed In Tariff payments.
Table 17 below gives a rough guide of payback times for a 10kW and 50kW turbine:
*please not these calculations are based on the FiT as of April 2010
Energy in Farming18
10kW turbine – Cost in the region of £60,000.– At a wind speed of 5m/s the capital payback period will be around 7 years.– At a wind speed of 7m/s this fails to around 4.5 years.
50kW turbine – Cost in the region of £200,000 to £250,000.– At a wind speed of 5m/s the capital payback period will be in the region of 6.5 years.– At a wind speed of 7m/s the payback period falls to under 4.5 years.
Table 17
Table 16
11kW turbine 35,000kWh – 42,000kWh
20kW turbine 57,000kWh – 67,000kWh
50kW turbine 150,000kWh – 170,000kWh
100kW turbine 260,000kWh – 300,000kWh
We deal with renewable technologies in the following order:– Wind– Solar PV– Solar Thermal– Hydro– Heat Pumps– Biomass– Anaerobic Digestion
4.1 Wind
Wind power was commonly used on farms 50–100 years ago to power water pumps. This use has died out with water pumps now being powered by electricity.
Wind power is now used to power turbines which generate electricity. The introduction of Feed in Tariffs (FiTs) in April 2010 has seen this become an attractive financial option for many farms.
There are many wind turbines on the market and they all have variations in height, blade design, power output and track record. Typically, on farms where the primary purpose is to meet the onsite electricity demands, we see turbines ranging in size from 11kW to 100kW.
Table 16 below shows a guide to the electrical output from turbines at a wind speed of 6 metres per second:
The amount of electricity generated by a turbine is dependent upon the wind speed. This speed is assessed as an average speed over 12 months and measured in metres per second (m/s). It is important to remember that on some days the wind does not blow and a turbine will not produce any electricity.

First steps
If you believe that your farm has the potential for a wind turbine we would suggest that you firstly establish the wind speed for your farm through the DECC website.
If the indicative wind speed for your farm is greater than4.5 metres per second at a height of 10m, contact turbine manufacturers and ask them to undertake an initial site visit.
Many firms will offer to undertake a desk top assessment of your site for you. We would not recommend that you pay for this service as, in our experience, much of the information they provide can be obtained by you on the internet.
Contact your local DNO office and enquire what size turbine they would allow on your line and if your transformer will need to be changed.
Next steps
If after the above initial steps the indications are that youhave a good potential site and you are still interested we would suggest that:
1. You obtain a detailed site survey on the proposed location. The turbine manufacturers do provide this service but you can also obtain surveys from consultants who are independent of technology manufacturers.
2. Discuss the proposed project with your professional advisers.
3. If finance for the turbine will be required, discuss with your bank or an asset finance company.
4. Discuss your proposed project with a planning professional and obtain guidance from them on how to proceed.
5. Obtain a formal quote from your DNO on the grid connection charges.
6. Consider engaging an independent consultant to review your proposed project.
When you have gathered information from the above sources you will be well placed to reach a decision on whether to pursue your project. If you decide to proceed obtaining planning should be your first focus.
Planning permission
Planning permission will always be required for a wind turbine irrespective of size.
Factors that influence obtaining planning permission for a turbine are:
– The size of the turbine.
– Proximity to roads and rights of way.
– Proximity to dwellings and hedges.
– Visual impact on the landscape.
– Ecological impact on the surrounding area.
– Noise impact from the turbine.
– The locality of a National Park or Area of Outstanding Natural Beauty.
It is recommended to use the services of a professional firm to apply for your planning permission and one that has expertise in the sector. Before engaging their services obtain fee quotes from them and make sure you understand what work the quoted fees will cover.
Operation and maintenance
Wind turbines will require annual mechanical checks and servicing. The sensors built into a turbine also monitorthe performance of each turbine component and willautomatically shut the turbine down if any problems are detected. This will alert an engineer that a site visit is required.
When considering which turbine to buy it is very important that you:
– Consider what the annual servicing costs will be.
– Consider what warranty is offered by the manufacturer. You should be looking for a minimum of 5 years, ideally 10, and a warranty that covers parts and labour ideally.
– When you enter into a contract to buy a turbine make sure you are aware of the terms of the deposit.
Although the majority of turbine manufacturers and turbine sellers are very professional we would always recommend using the services of an independent professional.
As wind is eligible for the FiTs it is important to be aware that the tariff amounts for these can change at short notice thus affecting the viability of a project.
Energy in Farming 19
Case study – Frinkley Farm;
Large scale wind Please turn to page 40 for details
– Cloverbank Organic Farm; Small scale wind
Please turn to page 42 for details
– Bridgehouse Farm; Solar PV and wind
Please turn to page 44 for details

Meters are fitted to the system to record:
– The total number of kWh units generated (a total generation meter).
– The number of kWh units that are not used within your business and exported to the national grid (an export meter).
The approximate space required for each kWp of the PV installation is detailed in table 18 below:
A roof mounted system will require structural integrity for the lifetime of the panels, around 40 years. It is recommended that a full structural survey is undertaken.
Sighting a solar PV system
There are 4 main factors, detailed in table 19 (opposite), which will impact how much energy a solar PV systemwill generate.
How do I proceed?
There are many Solar PV companies now operating and picking the right company is not easy. Solar PV companieswill be happy to provide you with a free initial assessmenton your potential for a successful PV installation. This initial assessment should be discussed with your professional advisors before deciding whether to proceed further.
We would suggest choosing a company that can demonstrate a long track record in the industry or using one of the large Farmer Co-operative that have set up specialist Renewable Energy Teams to assist their members.
Next steps would include:
– Obtaining a detailed project feasibility study.
– Obtaining a Structural survey if a roof mounted scheme.
– Commencing the process of applying for planning permission.
– Applying to your DNO for permission to connect your system to the grid.
Energy in Farming20
Roof mounted array 8.5m2
Ground mounted array 10m2 – 13m2
Table 18
4.2 Solar
Sunlight or solar energy is probably the easiest source of renewable energy to access.
Solar energy, radiant light and heat from the sun, is harnessed through solar panels which in the UK take 2 formats:
1. Solar Photo Voltaic (PV) panels for the production of electricity.
2. Solar thermal panels for the heating of water.
Solar PV
A good quality Solar PV system will generate electricity for at least 25 years. This:
– Limits your exposure to rising energy costs.
– Allows you to receive money from the FiTs for every kWh of electricity generated.
– Reduces your environmental impact.
The important thing to remember is that solar panels only work when there is day light and need sunlight to reach peak power generation.
A dairy farm for instance requires electricity 365 days a yearso during the winter months the PV panels are only going to provide a minor contribution to the electricity you need.
During the summer months solar panels will be generating at their peak during the middle part of the day. If you are milking twice a day this is not going to match your periods of peak demand.
From the headline number of kWh PV system will generate, the percentage of these that you actually consume might be as low as 30%. However, you get extra income from the FiTs for every unit you export onto the grid.
What is a solar PV installation and what do I need?
Solar PV panels are fitted onto metal racking which can either be ground mounted or roof mounted.
Sunlight is converted into direct current (DC) electricity by the silicon inside the PV panel. This is then changed into alternating current (AC) through an inverter which is usable within your business.
You will need to connect your system to the national grid and permission from your DNO will be required. If you are on a single phase supply the size of your solar PV system will be limited to the 10kW to 20kW range.

Solar PV: FAQ
Q. How much does it cost?A. The total installed cost will vary from location to location. As a general guideline costs will be around £2,500 per kW installed (October 2011).
Q. How much energy will it generate? A. As a guide a 10kW array will produce in the region of 8,300kWh a year.
Q. How do I get paid for my electricity? A. You will benefit from the FiTs which are paid on every kWh unit you generate. You will also benefit through saving the cost of the electricity you will no longer have to buy. For any electricity you do not use you get paid a set rate (3p as of October 2011) as it is exported to the national grid.
Q. Do I need planning permission? A. You should always contact your Local Authority to check the position for your farm and scheme but for the vast majority of schemes it is probable that you will need to obtain planning permission. You will always need to advise Local Building Control of your proposed works.
Energy in Farming 21
Shading – When the sun is very low in the sky, first thing in the morning and last thing in the evening, it is possible that nearby buildings or trees may partially shade a PV array. If only around an hour at either end of the day this will have a very small impact on the energy generation.
– It is important to ensure that your PV array will not be shaded during the main part of the day. Avoid significant shading from surrounding buildings or trees.
Orientation – The further South that a PV array is facing the more direct sunlight it will receive and the more energy it will produce.
– In general you should only site a solar PV array so that it faces between the South East and South West otherwise its energy generation will be significantly reduced.
Angle – To ensure that a PV panel maximises its exposure to direct sunlight it should be mounted at an angle.
– In the UK latitudes, the best angle is between 30 degrees and 45 degrees from horizontal.
Array size – The larger the array of solar PV panels the more energy it will generate.
– A typical single PV panel may be mounted either horizontally or vertically as required.
– Any number of panels can be combined into a single array as required.
Table 19
Overshading % of sky blocked byobstacles
Overshading factor
Heavy >80% 0.5
Significant 60%–80% 0.65
Modest 20%–60% 0.80
None <20% 1.00
Case study – Cloverbank Organic Farm;
Solar PV tracker Please turn to page 46 for details
– Frinkley Farm; Roof mounted 50kW solar PV
Please turn to page 48 for details
– Black Dog Farm; Ground mounted 70kW solar PV and wind
Please turn to page 50 for details

4.4 Hydro
Hydropower is the common term for electricity produced from the kinetic energy of flowing water. Hydropower is the main source of energy in some 30 countries and produces approximately 20% of the world’s annual electrical output. Hydropower can range from very small systems producingjust a few watts to systems incorporating some of the largest artificial structures in the world and producing thousandsof megawatts.
Hydropower is a renewable energy. The water that drives the turbines and generators is supplied from the ‘water cycle’, which naturally replenishes the streams and rivers through rainfall. Modern water turbines are the culmination of 2,000 years of technological development from the water wheel to the present day’s extremely efficient water turbine.
Prior to the development of the integrated national electricity grid network many rural areas used water power on a small scale, from streams and rivers, to deliver power to local households, farms and businesses. This form of water poweris known as ‘micro hydro’ and we are now seeing considerable interest in redeveloping this form of local energy.
Essential aspects of hydropower
The two key aspects of a hydropower site are:
In micro-hydro schemes the electrical power output (kW) is roughly six to seven times the product from the multiplication of these two figures.
Either the ‘head’ or the ‘flow’ needs to be a sizable figure in order for a micro-hydro scheme to be economically viable.
Head – The height through which the water falls on the available section of waterway and measured in metres.
– It can be worked out by looking at OS maps or by using a surveyor’s theodolite.
– It is worth considering if you can co-operate with neighbouring landowners to access additional height.
Flow – The volume of water flowing per second.
– The daily flow rate for a potential site should be recorded over a 12 month period to determine the ‘flow distribution curve’ and the ‘mean annual flow’ in litres per second (l/s) for the site.
– A certain minimum volume of water must be left in the river to protect the ecology of the river species known as the residual flow. The Environment Agency will advise on this figure.
Energy in Farming22
4.3 Solar Thermal
Solar hot water systems, Solar Thermal, use sunlight to heat water. The most common types of solar water heaters are evacuated tube collectors and glazed flat plate collectors.
To date on farm use of solar thermal water heating has been limited. As the installation costs reduce and technology advances Solar Thermal is increasingly being seen as part ofan ‘integrated energy solution’. Within an integrated solutionSolar Thermal is providing part of the water heatingrequirement but not all. To use solar thermal in farming systems the most important step is to analyse your hotwater needs.
Two recent developments mean that Solar Thermal should be high on the list of energy saving technologies you are considering adopting:
1. The costs of Solar Thermal systems has fallen at the same time as the efficiency of the equipment has improved.
2. The new Renewable Heat Incentive (RHI) payments will pay you (8p as of October 2011) for every kWh unit of heat generated from a Solar Thermal system.
To receive the RHI payments the Solar Thermal system must be installed by an MCS accredited installer.
Solar Thermal panels come in two types, flat-plate collectors and evacuated tubes. Although slightly more expensive it is the evacuated tube systems that are more efficient and can deliver the higher temperatures, potentially as high as 60oC.
In a domestic environment the solar thermal panels transfer heat straight into the hot water cylinder through a twin coil mechanism. For farm installations it will be more efficient for the solar panels to heat the water within a thermal store. The water from the thermal store is then transferred to the water heater using control valves and timers. An example is shown in table 20 below.
Size 60 evacuated tubes
Cost £6,000 – £8,000
Heat provided 6,000kWh
Value of heat £480 based on 8p payments
Annual savings £960
Payback period 6–8 years
Table 20
Case study – Clyst St. George; Solar Thermal Please turn to page 52 for details

The cost of connecting the scheme to the national grid will vary considerably from location to location. These costs can be significant.
Examples of economic return can be seen in table 22 below:
Low head, low flow
Head (m) 4.70m
Flow (l/s) 180 l/s
Average output (kW per hour) 3kW
Yearly output (kW) 26,280kW
Install cost (£) £45,000
FiTs tariff (as in October 2011) 20.9p gives £5,492
Cost of electricity saved(based on 10p per kWh)
£2,628
Total £8,120
Considering a site for micro-hydro potential
Schemes are generally classified into:
Best practice dictates that schemes which do not involve a store of water are based on the flow of water in the summer months i.e. the lowest flow rate.
Environmental issues
All hydro schemes have an environmental impact as they deplete the main water flow from a stretch of water. This depleted flow could adversely affect biodiversity. Therefore the amount of flow that can be taken from the main water flow to power a turbine is regulated and an ‘Abstraction License’ has to be obtained.
Turbines are not ‘fish friendly’. Adequate screening has to be installed both upstream and downstream to stop fish entering the turbine. Where migratory fish exist in a river a fish pass must be installed to enable fish to complete their journey upstream.
A well designed scheme will mitigate any environmental damage during construction and produce ‘clean’ energy overa very long period of time.
Grid connection
Micro-hydro schemes can either be connected to the grid or ‘stand-alone’ systems.
– Grid connected systems will require the power to be fed through an inverter back into the grid.
– Stand-alone systems will usually involve a bank of batteries, an inverter and a charge regulator. These can add significantly to the cost of a system.
Costs and economic return
Although initial set up costs can be quite high, a hydropower site has the capacity to run indefinitely, representing an attractive medium/long term investment. The new FiTs have made a significant difference to the financial return generated by hydro schemes.
An indication of installation costs can be seen in table 21 below:
Low head schemes – A head of around 1m–10m.
– Often involve old mills and weirs.
– Can offer a good return if a large enough flow is present.
Medium head schemes – A head of 10m–50m.
High head schemes – A head of 50m+.
– Typically these will be fast flowing upland streams and rivers which have a low flow but a high head can be achieved.
– These sites will usually be without previous development.
Energy in Farming 23
Low head – £4,000 per kW installed up to 10kW .
– Drops per kW for schemes greater than 10kW.
Medium head – Fixed cost of about £10,000.
– £2,500/£3,500 per kW up to around 10kW.
Table 22
Table 21
As an example of the power that can be produced a flow of 1,000 litres per second over a drop of 2 metres could produce 12kW–13kW of electricity.
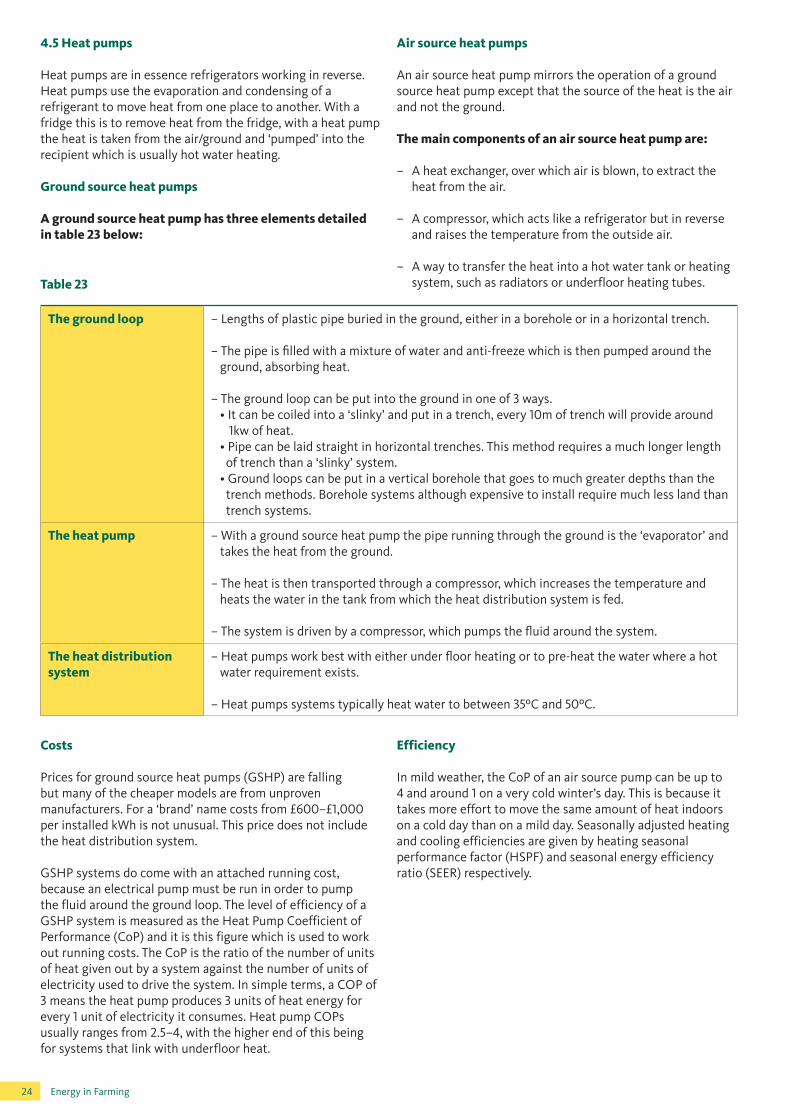
4.5 Heat pumps
Heat pumps are in essence refrigerators working in reverse. Heat pumps use the evaporation and condensing of a refrigerant to move heat from one place to another. With a fridge this is to remove heat from the fridge, with a heat pump the heat is taken from the air/ground and ‘pumped’ into the recipient which is usually hot water heating.
Ground source heat pumps
A ground source heat pump has three elements detailed in table 23 below:
Costs
Prices for ground source heat pumps (GSHP) are fallingbut many of the cheaper models are from unprovenmanufacturers. For a ‘brand’ name costs from £600–£1,000 per installed kWh is not unusual. This price does not include the heat distribution system.
GSHP systems do come with an attached running cost, because an electrical pump must be run in order to pumpthe fluid around the ground loop. The level of efficiency of a GSHP system is measured as the Heat Pump Coefficient of Performance (CoP) and it is this figure which is used to work out running costs. The CoP is the ratio of the number of units of heat given out by a system against the number of units of electricity used to drive the system. In simple terms, a COP of 3 means the heat pump produces 3 units of heat energy for every 1 unit of electricity it consumes. Heat pump COPs usually ranges from 2.5–4, with the higher end of this being for systems that link with underfloor heat.
Air source heat pumps
An air source heat pump mirrors the operation of a ground source heat pump except that the source of the heat is the air and not the ground.
The main components of an air source heat pump are:
– A heat exchanger, over which air is blown, to extract the heat from the air.
– A compressor, which acts like a refrigerator but in reverse and raises the temperature from the outside air.
– A way to transfer the heat into a hot water tank or heating system, such as radiators or underfloor heating tubes.
Efficiency
In mild weather, the CoP of an air source pump can be up to4 and around 1 on a very cold winter’s day. This is because it takes more effort to move the same amount of heat indoors on a cold day than on a mild day. Seasonally adjusted heatingand cooling efficiencies are given by heating seasonalperformance factor (HSPF) and seasonal energy efficiency ratio (SEER) respectively.
The ground loop – Lengths of plastic pipe buried in the ground, either in a borehole or in a horizontal trench.
– The pipe is filled with a mixture of water and anti-freeze which is then pumped around the ground, absorbing heat.
– The ground loop can be put into the ground in one of 3 ways. • It can be coiled into a ‘slinky’ and put in a trench, every 10m of trench will provide around 1kw of heat. • Pipe can be laid straight in horizontal trenches. This method requires a much longer length of trench than a ‘slinky’ system. • Ground loops can be put in a vertical borehole that goes to much greater depths than the trench methods. Borehole systems although expensive to install require much less land than trench systems.
The heat pump – With a ground source heat pump the pipe running through the ground is the ‘evaporator’ and takes the heat from the ground.
– The heat is then transported through a compressor, which increases the temperature and heats the water in the tank from which the heat distribution system is fed.
– The system is driven by a compressor, which pumps the fluid around the system.
The heat distributionsystem
– Heat pumps work best with either under floor heating or to pre-heat the water where a hot water requirement exists.
– Heat pumps systems typically heat water to between 35ºC and 50ºC.
Table 23
Energy in Farming24

Advantages and disadvantages
Conclusions
Air source heat pumps can provide cost effective space heating. A high efficiency heat pump can provide four times the heat compared to an electric heater.
Air source heat pumps are sometimes used to provide hot water from a pressurized system up to temperatures of 55ºC. To minimise the risk from Legionnaire’s disease it is advised that hot water is heated to above 60ºC.
Air source heat pumps should last for over 20 years with low maintenance requirements.
4.6 Biomass boilers
Biomass describes any organic matter and has been used as a source of energy for thousands of years. With the energy issues that face, us bio-energy is fast becoming an important form of renewable energy, one that can be grown and used sustainably, It is also a cost effective alternative to oil and gas.
Burning biomass is considered to have a near zero net greenhouse effect. The carbon dioxide given off during its combustion, which was absorbed during its growth, will be absorbed by the growth of the next biomass crop. It should be noted that initially biomass burning does produce greenhouse gases and it is only over a long period of time that it moves close to zero. There are also associated transport andprocessing emissions for the biomass fuel.
Advantages – Typically draws approximately 30% of the electricity of a standard resistance heater for the same amount of heating.
– Few moving parts, reducing maintenance requirements. • It should be ensured that the outdoor heat exchanger and fan is kept free from leaves and debris. • A heat pump will have significantly more moving parts than an equivalent electric resistance heater or fuel burning heater.
– As an electric system, no flammable or potentially asphyxiating fuel is used at the point of heating, reducing the potential danger to users, and removing the need to obtain gas or fuel supplies.
– May be used to heat air or water.
– The same system may be used for air conditioning in summer as well as a heating system in winter.
– Lower running costs in comparison with traditional electrical resistance heaters.
Disadvantages – Air source heat pumps require electricity for operation.
– External space needs to be found for the outside condenser unit which can be somewhat noisy and possibly unsightly.
– The cost of installation is high.
– Usually marketed as low energy or a sustainable technology, the HFCs have the potential to contribute to global warming.
– The effect the refrigerant could have is measured in global warming potential (GWP) and ozone depletion potential (ODP).
– Air source heat pumps lose their efficiency as external temperatures fall.
– In UK climates the system should be installed with an auxiliary source of heat providing heat at low temperatures or if the heat pump should require repair.
Energy in Farming 25

How can biomass play a role on your farm
The use of biomass on your farm falls into 3 main categories:
1. To fuel a small-medium scale biomass boiler (up to 250kW) that can heat the farm and its buildings and provide hot water.
2. To fuel a larger scale biomass boiler (250kW – 2mW) that can heat greenhouses or provide heat to neighbouring buildings through a district heating system.
3. You can grow energy crops such as miscanthus or short rotation coppice willow to feed either your own biomass boiler or for sale to an off-farm user.
Common biomass materials
In the UK we typically see the following materials used within biomass heating systems:
– Logs– Waste wood often in the form of wood chip– Wood pellets– Short rotation coppice – e.g. willow– Miscanthus
Each of the above requires a different form of burning which either means a fuel specific boiler or a multi-fuel (hack) boiler.
Table 24 below details benefits and risks or a biomass boiler installation:
Energy in Farming26
Benefits Cost competitive– With the increasing price of oil and gas, biomass is a viable fuel source.
Free fuel – Within the woodworking industry your waste biomass is free fuel.
Waste management – Consuming waste wood as fuel stops it from going to landfill. – Avoids transportation and landfill costs.
Self sufficiency – Production, processing and consumption of home grown biomass fuel crops will help build our energy self-sufficiency for the long term.
Energy storage – Unlike solar, wind and wave energy, biomass is an energy source that is easily stored. – It can then be transported and used at any time.
Sustainability – Increased use of wood biomass encourages the planting of forests and biomass crops which also act as carbon sinks.
Income – From the RHI payments for both biomass heating and CHP systems. – Also from the Feed In Tariffs where electricity is generated from a biomass powered CHP units.
Risks – Biomass boilers are sensitive to fuel quality and it is essential that the quality of the material matches the specifications required by the boiler.
– Installations costs can be high.
– Attention must be paid to matching the supply and demand of the required biomass material. Entering into long term supply contracts should be considered.
– The long term commitment required to plant biomass crops in the context of annually changing commodity prices. This may reduce farm income in the short term when compared to annual crops.
– Looking ahead, UK produced biomass may come under price pressure from imported sources.
Table 24
Biomass boilers are a specialised area and it is recommended that you enlist the support of a sector specialist. At the end of this guide we provide details on where to obtain further information regarding biomass.

4.7 Anaerobic digestion
Anaerobic Digestion (AD) is the controlled breakdown of organic matter in the absence of air to produce a combustible biogas and nutrient rich organic by-product.
AD systems can be located either on-farm or at largercentralised locations. The larger centralised operations are more commonly municipal operations and therefore thisguide focuses on on-farm systems.
The most important factor for an AD plant is the long term and consistent availability of feedstock. Feedstock needs to be blended to achieve a mix that will maximise biogas production. Examples of feedstocks:
– Animal manures and slurries– Energy crops such as whole-crop maize or grass silage– Food by-products– Animal by-products (abattoir waste)– Sewage Sludge
Key considerations
A number of small scale AD units are coming onto the market. At the moment these units do not have a long track record and you should be aware that this will entail a degree of risk.95% of what goes into a digester comes out as digestate and there needs to be a route for this. However it is a valuable fertiliser and may provide an extra income stream.
Costs
A small 15kW plant fed by manure and cattle slurry is likely to cost in the region of £150,000. At least 100 cattle would be needed to provide the feedstock required.
A 250kW plant would cost in the region of £850k. In addition to manure and cattle slurry further energy crops will be needed as feedstocks.
Upwards of 250 cattle would be needed to provide feedstocks for the 250kW plant.
What does an AD plant produce
Table 25 below details the products of an AD plant:
There are various opportunities and risks apparent with an AD plant. These are detailed in table 26 below:
Energy in Farming 27
Table 25
Table 26
Biogas – Mixture of methane and carbon dioxide roughly in the ratio 60:40.
– This can be burned to generate electricity and heat. • This is known as Combined Heat and Power or CHP.
Digestate – Low odour, slow nutrient release substance that can be applied directly to the land either in liquid or solid format (depending upon the nature of your AD plant).
– The nutrients within digestate are in a chemical format that is more easily accessible by plants than ‘chemical’ fertilisers from a bag.
Opportunities – The potential to power and heat part/all of the farm buildings plus sell electricity to the national grid.– Cost savings through the displacement of electricity and heat that would otherwise be bought.– FiTs on every kWh of electricity generated.– Receipt of Renewable Heat Incentive on CHP systems and biogas heating.– Income from any electricity exported to the grid.– Reduction in the purchase of fertiliser is provided by digestate.– Better management of organic waste on the farm and a reduction in GHG emissions.
Risks – High initial set up costs.– Some technology available on the market does not have a proven track record.– Supply of feedstock is important and sourcing may be an issue.– Needs continual management of the plant.– Connection costs to the national grid must be considered.– Bad management of the digestate and not complying with the waste regulations that apply to digestate.
Case study – Copys Green Farm; Anaerobic Digestion (AD) Please turn to page 54 for details
AD plants are a specialised area and it is recommended that you enlist the support of a specialist consultant. At the end of this guide we provide details on where to obtain further information regarding AD.
Energy in Farming28
Much of this guide refers to measures and technologythat are relatively inexpensive but we do in places refer totechnologies that can cost many thousands of pounds.
If you are a business that needs to borrow money to fund your journey towards energy efficiency, we provide some guidance on how to obtain the borrowing you need.
Outside of your own savings the money you need to invest in energy saving projects will primarily come from:
– Bank overdraft or loan– Asset Finance or HP– Grant support
5.1 Return on investment
Working out the capital payback period on any project is always a good discipline.
Take the total cost of a project and divide it by the annual cost saving you expect to achieve.
Three very important things to remember when considering your return on investment (ROI):
1. Technology costs and performance vary to an enormous degree between suppliers and manufacturers.
2. Always cross check with other sources the energy and cost savings that suppliers and manufacturers promise.
3. The small items and repair jobs will provide a much bigger ROI than spending lots of money.
5.2 Obtaining bank funding
Obtaining bank borrowing is fairly challenging. The money available within the markets for banks to lend has declined and many farmers have not been immune to pressure from their banks to reduce their borrowing.
Tenant farmers who are not in a position to provide security for their borrowings will face more pressure from their bank and are less likely to receive additional support.
Top tips for obtaining bank funding are:
– Good communication lies at the heart of any good bank/ customer relationship.
– Early engagement with the bank regarding any project is key.
– Does your bank manager understand farming? If not then it might be better to look to other funding sources as they may struggle to present your case to their superiors.
– Invite your manager to visit the farm.
– At annual review of your facilities float the question on how much extra borrowing the bank would consider.
– Never go over your overdraft limit without letting the bank know first.
– Make sure you comply with your lending covenants.
– Make sure that your annual certified accounts are up to date and never more than 12 months old.
– Forget the old adage of ‘preparing accounts for the taxman’ – your ability to borrow will be heavily influenced by the financial performance of the business as reported in your accounts and if the net worth of the business is improving.
– Present a well prepared case to the bank for any new lending request.
– Show how you have researched the technology/machinery you have chosen.
– Consider using a specialist banking consultant to help present your case.
– Demonstrate that you have considered the impact of a potentially reducing Single Farm Payment post 2013.
– In the current climate the security that the bank holds will be key to their decision process.
– Be prepared to pay higher interest rates and fees.
5.3 Asset finance
– The purchase of any machinery/equipment costing more than £2.5k can usually be financed through as asset finance or hire purchase agreement. This is subject to both the buyer and the seller being creditworthy in the eyes of the finance company.
– Unlike the ‘long-term relationship’ nature of bank borrowing asset finance is much more of a transactional arrangement with each side simply fulfilling the needs of the other.
– Using Asset Finance and not disturbing your bank relationship can avoid giving the bank a trigger point on which they seek to increase your interest rate and fees.
– The term of any asset finance deal can usually be tailored to ensure that the financial benefits of the project being funded covers the costs of the loan repayments.
5.0Finance and funding

Energy in Farming 29
5.4 Grants
With the government taking measures to reduce the UK’s budget deficit the range of grant options has diminished. Agriculture however, continues to receive support for certain energy efficiency measures and this support is expected to continue until the 2013 reforms of the CAP come into force.
Support in England can be accessed through DEFRA and in Scotland and Wales through the devolved governments.
At the time of writing, farmers in England are waiting for DEFRA to announce their national efficiency grants programme, replacing the regional grants that wereadministered by the Regional Development Agencies.
Typically, resource efficiency grants will contribute around 40% of the cost of the equipment involved.
Independent grant and funding sourcing organisations are also available and may be able to complete Expression of Interest and aplications on your behalf.
To be eligible to apply for the grant you will need to have a Resource Audit of the farm conducted and you will need to:
– Obtain quotes from 3 separate suppliers.
– Prove that you have access to the money required to buy the item before receiving the grant.
– Not commence the project until the grant has been approved.

Energy in Farming30
Against a backdrop of constant time pressure it is very easy to let the urgent overtake the important and not take proactive action with regards to the energy efficiency of your individual farm. Not taking proactive action simply means that you will have less time in the future to make the changes you need to make. The focus of this guide has been to provide you the tools to set a clear direction towards improving energy efficiency.
The biggest single piece of advice we can give is if you write down what you want to achieve, and by when, then the odds of success are much, much higher.
6.0Conclusion

Energy in Farming 31
As the pressure to improve energy efficiency builds and the level of Greenhouse Gas Emissions from Agriculture comes under more scrutiny it will be important to focus on how to make sure your project is successful.
Our tips for this are:
– Make sure you understand where a project sits within the long term plan for the business.
– Don’t believe everything that a salesmen tells you.
– Research any project thoroughly and consider using sector specialists to provide you with advice and guidance.
– Do not be a guinea pig or pioneer for new technology – unless you can afford to lose the money you spend.
– Make sure that any new technology/equipment is compatible with your existing farm infrastructure.
– Before incurring any significant costs consider if you will be able to raise any finance that you might need to complete a project.
– Do not be driven by the availability/non availability of grants.
– Before entering into any larger value contracts consider the financial standing of the supplier – make a credit check if you are not sure.
– Do not pay out large deposits without knowing what is going to happen to your money.
– If you need to obtain planning permission engage a professional not on the basis of how much they will charge but on his expertise and the quality of his work.
– Consider the timeline between the inception and completion of any project.
– Make sure you know the payment terms with any larger project.
– Read the small print when it comes to warranties and guarantees on any project.
– Ask for details of people who have already bought what you are thinking of buying.
7.0Top tips for success

Energy in Farming32
Background:
– Installed in 2010.
– Previous pump and newly installed pump 7.5kW.
– Previous pump was 10 years old with 2/3 years left, £4,800 to refurbish.
– The single speed pump was running at full capacity generating three x the vacuum that was required.
How it works:
– The pump maintains a balance between vacuum and airflow throughout the milking.
– Vacuum output alters subject to requirement.
– Automatic speed variation.
– Capacity to cope with the largest possible anticipated demand which occurs less than 1% of the time.
Case StudyBicton Home Farm; Vacuum on Demand pump (VoD)
Save energy and money
– The system can have a payback of less than 5 years.
– There can be energy savings of between 50–80%.
– Further savings through reduced amount of oil required for drip feeding by 80%.
Noise reduction
– The noise level can be reduced by 30%.
Longer equiptment life
– Using a variable speed controller slows the average speed of the pump to less than half of its full speed.
– Less wear means lower maintenance costs and longer life for the motor and vacuum pump.
Improved vacuum regulation
– The variable speed drive controller can be adjusted to provide improved vacuum regulation that results.
Advantages of VoD:
Wisconsin Public Service ,Vacuum Pump Technology, Accessed on 03/08/11, available at http://www.wisconsinpublicservice.com/business/vacuum_pump.aspx

Energy in Farming 33
Background information:
Home Farm is situated at Bicton College on the South Coast of Devon. It is a working farm which is also used for training students and apprentices at Bicton College. As of October 2011 the farm has:
– 190 crossbred cows with block spring calving, milked in groups of 24 twice a day.
– Out all year using a paddock grazing system, with average paddock size at 2ha and a stocking density of 2.61ha.
– Mainly forage diet supplemented with home grown maize, grass/red clover silage and small amount of concentrates.
– Rotational grazing helped achieve a milk yield of 72% from forage against an average of 44%.
– Calving interval is 368 days with a culling rate of 13%.
– Costs per litre are kept below 18p, leaving a healthy profit margin of 7ppl last year (2010).
– The pump was installed by Venture Dairy, Holsworthy, Devon.
Technology summary:
– 7.5kW.
– 3 phase supply.
– GEA Westfalia Surge 7.5kW pump with Westfalia VoD energy saver control unit RPS2800.
– VoD speeds pump up or down on demand.
– £6,600 fully installed.
Grants and funding:
– Home Farm received £5k from SWARM (South West Agricultural Resource Management) towards the installation of the VoD and a Heat Exchange unit.
– Funding is available from: Carbon Trust Loan Scheme.
Practicalities of Switching:
– The old pump can be left in situ as a backup if required.
– The VoD Pump needs to be checked every three months.
– Oil usage down by 80% reduction of 50 litres per year which saves on waste disposal.
– Spikes in electricity may trip out control box – Only requires a reset if this occurs.
– Short installation time – One day installation between milking, the original pump can be run if needed.
Carbon Reductions:
Based on the amount of electricity saved by the installation of a VoD, carbon emissions for Home Farm are reduced by:
– 17 tonnes per year.
– This equates to an £850 saving per year based on a carbon price of £50 per tonne.
The control unit installed at Home Farm.
The pump in situ at Home Farm.

Energy in Farming34
Background:
– The Heat Recovery Unit (HRU) was installed in Dec 2010.
– The system was installed when a large (2 x 600l) milk tank was installed and the installer prompted that at that time it might be a good opportunity to install the HRU.
– The HRU transfers waste heat from the refrigerant of the milk cooling system into water.
– The HRU was installed in the refrigerant line where the temperature of the refrigerant is at its highest.
– A 40% grant through the R4F scheme was obtained.
– The grant helped significantly with payback.
– An additional radiator taken from the HRU replaced an electric heating unit in the office.
How it works:
– The HRU works by taking excess heat that would otherwise be lost from the refrigerant and using it to pre-heat the water used in the dairy shed.
– The technology is fairly straight forward and can have significant impact upon the amount of fuel, normally electricity, that is required to heat the water.
– It should be adopted in conjunction with low-cost measures such as lagging and insulation of hot water systems.
Case StudyPorthilly Farm; Heat Recovery Unit
Efficient – As the HRU uses heat that would otherwise be wasted it is an efficient way of utilising energy.
– As the heater size was relatively large the amount of heat recovered was higher, a smaller heater will reduce this rate.
Energy saving – The energy saved per year equates to approximately 1,500–3,000kWh per annum.
Cost saving – The unit reduced the use of other fuels and has a predicted savings of between £100–£300 per year.
– It is not possible to have an exact cost saving due to changes in heat demand during this time at this location.
Advantages of a Heat Recovery Unit:
From ‘Improving Dairy Shed Energy Efficiency’ by the New Zealand Centre for Advanced Engineering, University of Canterbury Campus, Private Bag 4800.

Energy in Farming 35
Technology Summary:
– The actual system is fairly straight forward and a simple install.
– An HRU is installed in the refrigerant line between the compressor and condensing unit where the refrigerant is at its highest temperature. The refrigerant is placed in contact with the water and heat transfer takes place.
– In addition a radiator was added to the upstairs office, see picture below.
Grants and funding:
– Funding was received for 40% of the cost from the R4F scheme.
– If no funding were available payback would be approximately 6–10 years.
Cost Savings:
– In this particular installation other changes in farming practices, such as the number of cows, has increased which has diluted immediately obvious cost savings.
– On average the HRU would displace costs from electrical usage of between £100–£300 per year.
– These figures are based on a 100 cow herd and equate to approximately 30% of the water heater electricity consumption*.
Installation considerations:
The HRU interacts closely with the refrigeration system so the following should be considered to ensure both work effectively:
– Fit a non-return valve to stop refrigerant flowing from the HRU into the compressor outlet.
– Fit anti-vibration fittings to reduce noise and vibrations which can lead to failure in the pipes and fittings.
– Be aware that it is possible to overcool the refrigerant which reduces the cooling capacity of the bulk tank.
Cardon dioxide reductions:
– The HRU saves 1.5 tonnes of CO2 per year.
– This is based on a savings of 3,000kWh per year.
– Dec 2011 the shadow price for C02 was £7.59 per tonne. Hence the reduction in C02 emissions has an equivalent carbon price of approximately £11.39.
Background information:
Porthilly Farm is situated in Cornwall and has a herd of dairy cows as well as a shellfish business. The farm has been run as a dairy farm for over 50 years.
*Figures and further information taken from ‘Heat Recovery Units on Dairy Farms’ by FEC Services, Stoneleigh Park, Kenilworth, CV8 2LS

Energy in Farming36
Background:
_ Three helictical ramp Clima Unit 2 heat exchangers have been installed to service the four poultry sheds which house 75,000 chickens.
– The heat exchangers were installed in January, September and November 2011.
– Heat exchange is an additional technology to traditional poultry farming. It provides the heat needed to keep the sheds at the correct temperature (32ºC) reducing the need to use gas or oil powered heaters.
How it works:
– The heat exchangers run on electricity and can operate up to temperatures of -30ºC.
– They maintain constant air temperature in the poultry shed, reducing the moisture content.
– The heat exchanger runs on a ramp system, it sucks damp, warm air out of the poultry shed, removing the heat as it passes through the filters.
– Clean fresh air is then filtered into the heat exchanger and coiled tubes.
– These tubes are part heated by the extracted hot air and return incoming air to 32ºC.
– This is then pumped back into the poultry shed as clean, fresh, warm air. The air is distributed into the sheds through retractable fans.
Case StudyPoultry farm in Devon; Heat exchangers
Save energy and money
52.9% reduction in gas use for the poultry shed leading to a payback of 3 years.
Reduce litter The litter laid down at the beginning of the crop does not need to be changed throughout the 38 day duration of maturing. This is due to the dry air maintaining low moisture levels in the litter and the bird waste.
Improved air quality
The warm clean air being circulated into the poultry sheds provides a betterenvironment for the birds.
Reduction is gas use
The use of gas for heating the poultry sheds has been reduced by 50%. Previously the heaters were run 30 days a month. This has been reduced to 15 days.
Unit Number of sheds / number of chickens
Cost for heat exchanger and install
1 2 Sheds, 18,500 birds each, 37,000 in total.
£46,850
2 1 Shed, 25,000 birds. £31,750
3 1 Shed, 12,000 birds. £19,000
Advantages of heat exhangers:
Clima Unit, How it Works, Accessed on 22/11/2011, available at http://www.climaunit.co.uk/How%20it%20works.html

Energy in Farming 37
Technology Summary:
– Three Clima Unit 2 heat exchange units installed on site. A 2 INTO 1, a 1.5M and a small custom unit.
– Delivers fresh air at a rate of 0.7m³/kg/hr.
– Easy to maintain, with self clean ‘jet mist’ technology
– Complies with IPPC (Integrated Pollution Prevention Control Directive from the EU).
– Collects 75.9% of dust particles leaving the shed in the first 14 days (according to the manufacturer).
Grants and funding:
– £20,000 grant funding was awarded from the Rural Payments Agency; covering 40% of the first installation and the balance of the second.
– Low interest loans are available from the Carbon Trust.
Cost Savings:
– In this location the heat exchangers have been found to reduce fuel consumption by 50%.
– Additional cost savings are retrieved through reduced litter use.
Practicality of installation:
– The installation takes between 2 and 3 days depending on the size of the heat exchange unit being put in place.
– The poultry sheds must be empty while the installation is carried out.
– An electricity supply is required.
– Most installers run a 12 month guarantee if the farmer is not satisfied with the results of the heat exchanger.
– Filters have to be replaced once a year at a cost of around £60.
Cardon reductions:
– The largest of the heat exchangers saves 6 tonnes of carbon per year.
– This is based on a 52.9% reduction in gas use for the poultry sheds operating with the heat exchange units.
– This is an overall reduction of 40% for the carbon footprint of the farm.
These figures were provided by the manufacturer. For accurate carbon savings
raw data should be taken for your farm.
Background information:
– The farm has capacity for 75,000 chickens which are raised to RSPCA Freedom Food standards. This means that all of the birds have perches, daylight, straw and pecking toys.
– Until 1984 the farm was a working dairy farm before changing to poultry.
– The farm has 4 poultry sheds. Two are serviced by individual heat exchangers and two share a split exchanger unit.
– The Clima Unit 2 heat exchangers were installed by Vencomatic Environmental Solutions based in Yorkshire.
– The large heat exchange unit which is split to service two sheds was built in Holland. The two smaller are UK built.
Air distribution in the poultry shed.
The split heat exchange unit in situ.

Energy in Farming38
Background:
– The Zoo was looking for a sustainable approach to its supply chain.
– High Density Vertical Growing (HDVG) system was installed in 2009.
– 11,200 plants can be grown at any one time.
– Aims to allow using reduced resources.
How it works:
– The plants are housed on 8 levels of hanging rigs suspended on a conveyor chain that constantly rotates.
– The rotation allows even airflow and equal exposure to natural daylight for all the plants.
– The structure is orientated east-west to further optimise light capture.
– The yields are higher than conventional approaches and energy efficiency is also improved.
Case StudyPaignton Zoo; Controlled environmental agriculture
High output The 120m2 greenhouse in which the system is housed grows three times the 3,000 that would be grown using a conventional hydroponics system.
Optimal growing environment
A computerised Priva control system provides the optimal growing environment and automatically provides the nutrients and water to the system.
Reduced land resource
An equivalent 6m high system requires 87% less land and building footprint. This represents projected savings in excess of 40% on buildings and associated costs.
Reduced transport and improved freshness
As the plants are able to be grown at demand source, the amount of fuel and logistics required is reduced and plants arrive just 15 minutes after harvesting.
Advantages of VoD:

Energy in Farming 39
Carbon Reductions:
– It is difficult to give exact carbon reduction figures as savings from transport, food quality and waste would need to be included.
– Given the above kWh in comparison to a conventional system, savings of 67% may be achievable but these are not definitive and wider sustain-ability issues should be considered.
Background information:
Paignton Zoo Environmental Park is an education, scientific and conservation charity dedicated to protecting our global wildlife heritage and inspiring in people a respect for animals, plants and the environment.
The HDVG system has been successfully trialled as a public educational exhibit with various fibrous rooted leafy vegetables.
Technology summary:
– Vertically integrated system over eight levels.
– Each level is stacked 3m high.
– Covers a ground area of 85m2.
– Seasonal variation of between 3–20kg per square metre. between winter and summer.
– Can grow approximately 125 plants per m2.
Yield (fresh kg/m-2) and energy use (kWh kg-1):
– A spinach comparison between VertiCrop and a single layer greenhouse shows a yield of 6.34kg m-2 vs 2.2kg m-2.
– The same comparison shows energy use of 1.85kWh kg-1 vs 5.64kWh kg-1.
Practicalities and further adoption:
High Density Vertical Growing Systems yield in excess of 20 times that of field crops and reduce building and land use and associated energy costs. There is excellent potential for the adoption of this technology in urban environments and for the reductions in associated costs such as transport, packaging etc to improve the sustainability of horticulture in the UK and further afield.
Integrated zoo horticulture (Frediani 2009).
Comparison of area required to grow lettuce plants.
Proportion of fresh mass yield Dec09 to Apr10 (Frediani 2011).
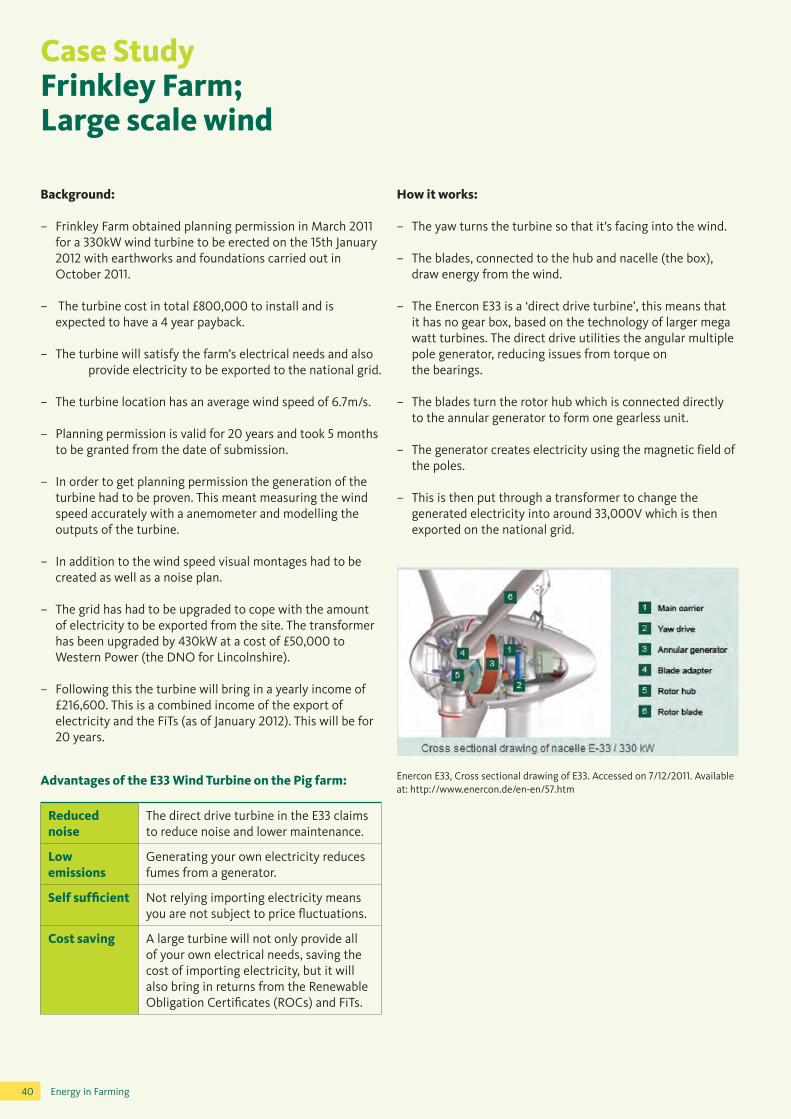
Energy in Farming40
Background:
– Frinkley Farm obtained planning permission in March 2011 for a 330kW wind turbine to be erected on the 15th January 2012 with earthworks and foundations carried out in October 2011.
– The turbine cost in total £800,000 to install and is expected to have a 4 year payback.
– The turbine will satisfy the farm’s electrical needs and also provide electricity to be exported to the national grid.
– The turbine location has an average wind speed of 6.7m/s.
– Planning permission is valid for 20 years and took 5 months to be granted from the date of submission.
– In order to get planning permission the generation of the turbine had to be proven. This meant measuring the wind speed accurately with a anemometer and modelling the outputs of the turbine.
– In addition to the wind speed visual montages had to be created as well as a noise plan.
– The grid has had to be upgraded to cope with the amount of electricity to be exported from the site. The transformer has been upgraded by 430kW at a cost of £50,000 to Western Power (the DNO for Lincolnshire).
– Following this the turbine will bring in a yearly income of £216,600. This is a combined income of the export of electricity and the FiTs (as of January 2012). This will be for 20 years.
How it works:
– The yaw turns the turbine so that it’s facing into the wind.
– The blades, connected to the hub and nacelle (the box), draw energy from the wind.
– The Enercon E33 is a ‘direct drive turbine’, this means that it has no gear box, based on the technology of larger mega watt turbines. The direct drive utilities the angular multiple pole generator, reducing issues from torque on the bearings.
– The blades turn the rotor hub which is connected directly to the annular generator to form one gearless unit.
– The generator creates electricity using the magnetic field of the poles.
– This is then put through a transformer to change the generated electricity into around 33,000V which is then exported on the national grid.
Case StudyFrinkley Farm; Large scale wind
Reduced noise
The direct drive turbine in the E33 claims to reduce noise and lower maintenance.
Low emissions
Generating your own electricity reduces fumes from a generator.
Self sufficient Not relying importing electricity means you are not subject to price fluctuations.
Cost saving A large turbine will not only provide all of your own electrical needs, saving the cost of importing electricity, but it will also bring in returns from the Renewable Obligation Certificates (ROCs) and FiTs.
Advantages of the E33 Wind Turbine on the Pig farm: Enercon E33, Cross sectional drawing of E33. Accessed on 7/12/2011. Available at: http://www.enercon.de/en-en/57.htm

Energy in Farming 41
Technology Summary:
– Planning permission has been received for a 330kW Enercon E33 wind turbine to be installed at Frinkley Farm.
– The E33’s turbine is a direct drive turbine meaning it has no gears.
– All of the preliminary works have been carried out including the foundations which incorporated 19.6m3 of concrete, the concrete slab for the turbine shed, earthworks for the cables and the access track. This will vary depending on ground conditions at your location.
Grants and funding:
– Very few grants are available for large scale wind turbines.
– Low interest loans are available and very often the installer is willing to invest in the wind project due to the high return on investment achieved.
Cost Savings:
– The 330kW wind turbine will suffice all of the pig farm’s electrical needs and have electricity left over to export onto the national grid.
– This will save Frinkley Farm £20,000 in electricity bills.
Practicality of installation:
– The first hurdle to overcome is obtaining planning permission. In Frinkley Farm’s case this has taken 2 years in total to obtain and at a cost of £55,000. Once the application was submitted a decision was granted in 5 months.
– The result of planning often comes down to the members of your committee. In Frinkley Farm’s case the campaigning to get people on side started prior to the planning application being submitted.
– The cables for the turbine were laid in between crops to reduce the impact of the earthworks on the farm.
– An access road has to be constructed to the turbine site for installation and maintenance.
– The turbine has a maintenance contract with Enercon and is connected to an online alerting system for any issues which may arise. This is monitored by Enercon’s office in St Ives, Cambridge.
Cardon reductions:
– It is estimated the turbine will generate 867.24MWh of electricity per year, saving 462.24 tonnes of CO2e per year.
– This equates to 11,556 tonnes of CO2e over the lifetime of the turbine.
– Based upon a carbon price of £12 per tonne this equates to a total carbon price of £138,672.
Background information:
– The array was installed by British Eco who have a national coverage for installations.
– The farm’s accommodates 430 sows, producing 200 pigs a week for slaughter and they are fattened on straw.
– The farm’s also has 600 acres of arable land which is used to produce the cereals for feeding the pigs.
– Frinkley Farm has 10 rooms in the farrowing house, 4 rooms of first stage weaners and a further 3 rooms of second stage weaners.
– The farm’s uses the slurry produced by the pigs on their 600 acres to produce cereals for feeding.
– Frinkley Farm has already erected a 50kW PV array (November 2011). More information can be found in the Frinkley Farm; PV case study.
Enercon E33, Turbine picture E33. Accessed on 7/12/11. Available at http://www.enercon.de/en-en/57.htm
The base of the wind turbine.

Energy in Farming42
Background:
– Cloverbank Organic Farm had a wind turbine installed on site in Spring 2007.
– The technology was installed due to the farm being off grid and so needing to be completely self sufficient.
– Full planning permission was required for the turbine.
– The turbine feeds into a large battery store which is able to even out the fluctuations in electricity generation.
– The turbine cost £30,000 to install.
– The turbine produces around 15MWh of electricity a year. This is eligible for ROC (renewable obligation certificate) payments at £45 a megawatt (as of November 2011).
– The ground conditions at the site are very good and so minimal ground works were required, taking 2 weeks to complete.
– The erection of the turbine took 10 days in total.
How it works:
– The Proven 6kW wind turbine starts generating at 2.5m/s.
– The blades turn the shaft which is connected to a direct drive motor meaning it has no gearing.
– This creates an electrical charge in direct current (DC) which is carried to an inverter, changing it to alternating current.
– The electrical layout consists of one 6kW inverter, a turbine control panel which includes both a voltmeter and an ammeter and a rotary isolator switch which isolates the turbine output and can be locked to the out position if needed, for example if maintenance needs to be carried out.
– A meter is installed to measure the amount of electricity being generated so that the ROCs can be claimed. For newer installations this would also be used for Feed in Tariffs (FiTs).
Case StudyCloverbank Organic Farm; Small scale wind
Reduced noise
– The turbine can be situated further away from the end location than the diesel generator previously used.
– This means that noise is reduced in the working environment as well as the noise produced from the wind turbine being much lower than the generator. The turbine produces 45dBA at 5m/s wind speed (hub height) as opposed to 70dB at 7m distance.
Self sufficient – The farm is off grid so not only does it need to produce its own electricity but it also make the farm non-reliant on fluctuating fuel prices.
Low maintenance
– The turbine is self supporting (no guy ropes).
Mixed output – The turbine output can be used for: • A direct electrical supply. • Storing the electricity in a battery. • Generating heat.
Advantages of small scale wind turbines:
Proven 6kW Wind Turbine, 6kW Proven Workings. Accessed on 12/12/11. Available at: http://www.turbineservices.co.uk/wind-turbines/proven/proven-6-kw/

Energy in Farming 43
Technology Summary:
– 6kW proven wind turbine which operated at 6kW in a 12m/s wind speed.
– The turbine is 15m to tip height and has a 5.6m rotor diameter.
– Cut in wind speed at 2.5m/s.
Grants and funding:
– A £5,000 grant was available although this made the installation ineligible for ROC payments.
– Grants and funding are available for small wind turbines. Some of these grants make installations ineligible for FiTs.
– Interest free and low interest loans are available for micro-turbines from the Carbon Trust.
Cost Savings:
– £8,000 was being spent on diesel for an electricity generator.
– The turbine produces half the electrical needs of the farm. This is a saving of £4,000 a year on generator costs as well as the ROC’s payments of £675.
– The cost saving does not take into account the rise in fuel prices. This saving will increase.
Practicality of installation:
– The works were carried out over a month and require the animals to be kept out of the field during installation.
– Maintenance is carried out periodically and a major service happens every 3 years.
– The turbine had to have a new blade installed after 3 years.
Cardon dioxide reductions:
– The installation saves 8.2 tonnes of CO2e per year.
– This is based on a generation of 15MWh per year.
– Dec 2011 the shadow price for C02 was £7.59 per tonne. Hence the reduction in C02 emissions from Cloverbank Organic Farm has a carbon price of £62.24.
Background information:
– Cloverbank Organic Farm was established in 2004.
– The farm has 40 sucklers and 129 sheep.
– The farm is completely self sufficient and is not connected to the grid for either electricity or gas.
– The farm consists of 130 acres.
– A biomass boiler is used in the house to provide heat.
– Bottled gas is used to provide heat and hot water for the cutting room but the farm is looking at piping heat over from the biomass.
– Cloverbank Organic Farm also has a tracking solar PV array on site. More detail can be seen on Cloverbank Organic Farm, Solar PV Tracker case study.
Proven 6kW Wind Turbine, Fferm Caer Delyn. Accessed on 12/12/11. Available at: http://www.caerdelyn.co.uk/wp/photos/
Energy in Farming44
Background:
– Bridgehouse Farm has a 50kW PV array installed on a south facing roof to provide electricity for its house containing 20,000 free range layers. This was installed in March 2011.
– The array was installed in addition to 4 hybrid sets of 1kW wind turbine and 1kW PV arrays on the roof of the 4 mobile units which contain a further 20,000 free range layers. This was installed in March 2009.
– The PV and wind was installed to provide electricity for lights, feeders and pumping fresh water from the borehole.
– This generates £1,200 a month from the Feed in Tariffs (FiTs).
– The installation generates almost all of the electrical requirements of the farm.
– Bridgehouse Farm installed the array to reduce outgoing costs and with the aim to become carbon neutral.
– Obtaining planning was contentious and took a long time to obtain.
How it works:
50kW PV
– Photovoltaic means turning sunlight into electricity by absorbing photons of light and turning them into electrodes.
– The cells which carry out this process are contained on a photovoltaic panel which is, at its peak, generating 240W.
– The panels are connected together to form an array. The charge produced from the array is taken to an inverter which transforms the current from direct current (DC) to alternating current (AC).
Hybrid system
– The system is made up of both wind and PV.
– The PV works on the same system as the large PV.
– The wind turbine blades turn a geared shaft which determines how fast the generator spins. The generator creates electricity by using the magnetic poles contained within its coils of copper wire. This is then transferred to the inverter.
– The feed into the same inverter changes the current from DC to AC.
– The mobile chicken sheds are not connected to the grid and so the electricity is stored in a battery.
– This can be stored for 6 hours.
Case StudyBridgehouse Farm; Solar PV and wind
Cost saving The array saves money from importing electricity as well as generating revenue from the FiTs.
Low maintenance
The ammonia resistant modules and small hybrid system are low maintenance and efficient in comparison to other renewable technologies.
Chicken friendly
The PV and wind does not interfere with the movements of the chickens nor affect their quality of life.
Low emissions
The installations are emission free and reduce the carbon footprint of the farm as it is not importing ‘dirty’ electricity.
Advantages of 50 kW solar PV and wind:

Energy in Farming 45
Technology Summary:
– The 50kW of PV take up 350m2 of roof space.
– The 50kW PV array are ammonia resistant modules.
– The mobile chicken sheds are not connected to the grid, the electricity generated is stored in batteries.
Grants and funding:
– Funding was not available for this installation.
– Low interest loans are available from the Carbon Trust and Sailx.
– PV for free schemes are also available.
– The FiTs are reviewed regularly. Once you are registered on a tariff this is valid for the 25 year duration.
Cost Savings:
– The 50kW array brings in an income of £1,200 a month from the FiTs.
– In addition, the generation of electricity saves approximately £300 a month on electricity bills.
Practicality of installation:
– In order for by the hybrid system and the large array to be erected, scaffolding has to be in place.
– Space is needed for the inverters and metering equipment.
– When installing PV in a farm environment it is advised to use ammonia resistant modules.
– In order to claim the FiTs it is necessary to register your array with your local District Network Operator (DNO).
– The DNO has to approve before any connection can take place and hence any payments received.
Cardon dioxide reductions:
– The 1kW PV and Wind array installations save 0.5 tonnes and 0.8 tonnes of CO2e each per year respectively.
– The 50kW PV array saves approximately 25 tonnes of CO2e per year.
– This gives a total CO2e saving of over 30 tonnes per year.
Background information:
– Bridgehouse Farm is one of five farms that rears birds for pullets, free range eggs and vaccines.
– Bridgehouse Farm is home to 40,000 free range layers.
– The current stock is 53 weeks old, having arrived at point of lay at 16 weeks, and laying at 95%.
– All of the sheds have natural ventilation.
– In addition to the 50kW array four of the temporary sheds have a 1kW PV array and a 1kW wind turbine installed. These were put in during 2009 and did not require planning permission.
– Bridgehouse Farm is currently going through an appeal to have a 250kW wind turbine installed on site.
One of the four hybrid renewable systems.

Energy in Farming46
Background:
– The tracking photovoltaic (PV) array was installed in May 2011.
– The array is 3.9kW peak generation capacity and has a dual axis, meaning it can rotate as well as change pitch.
– Full planning permission was required for the installation.
– The array is connected to a large battery store so that the electricity requirements of the farm can be met when the PV is not working to its full capacity.
– The tracker has been shown to be 40% more efficient, moving to find the strongest sunlight as opposed to fixed in one location.
– The tracker cost £18,000 to install.
– The tracker is eligible for the Feed in Tariff (FiTs).
– One of the main points highlighted by the farm owners was to ensure that you have an experienced installer for a tracking array as it is more complex than a standard array.
How it works:
– The PV modules operate in the same way as a standard module. For further information see other case studies and the report.
– On a tracking array the modules are mounted on a pole, about 4.5m off the ground.
– Sensors are mounted on the array which measure the incoming light levels and the wind speed.
– The sensors cause the panels to be moved by motor and gear chains to minimise the angle of incidence between the panel and the incoming light photons.
– When winds are too high the array moves to a horizontal position to avoid damage.
Case StudyCloverbank Organic Farm; Solar PV tracker
Efficient – As the array is always moving to find the best angle of incidence it has been shown to be 40% more efficient than a fixed array in the same location.
Roof space – No south facing roof is required for the installation.
– No cost for structural surveys and roof strengthening.
– The array is mounted off the ground on a single pole. This reduces disruption to grazing.
Cost saving – The array reduced the use of other fuels, in this case diesel for the generator, saving money.
– The array is eligible for FiTs, acting as a revenue stream.
Storeable energy
– The electricity produced by the array can be stored in a battery.
Advantages of solar PV tracker:
Dual Axis Azimuth Drive for the AZ-225. AltE. Accessed on: 13/12/11. Available at: http://www.altestore.com/store/Solar-Panel-Mounts-Trackers/Active-Solar-Trackers/Wattsun-Solar-Trackers/Wattsun-Single-and-Dual-Axis-Track-ers/p5508/
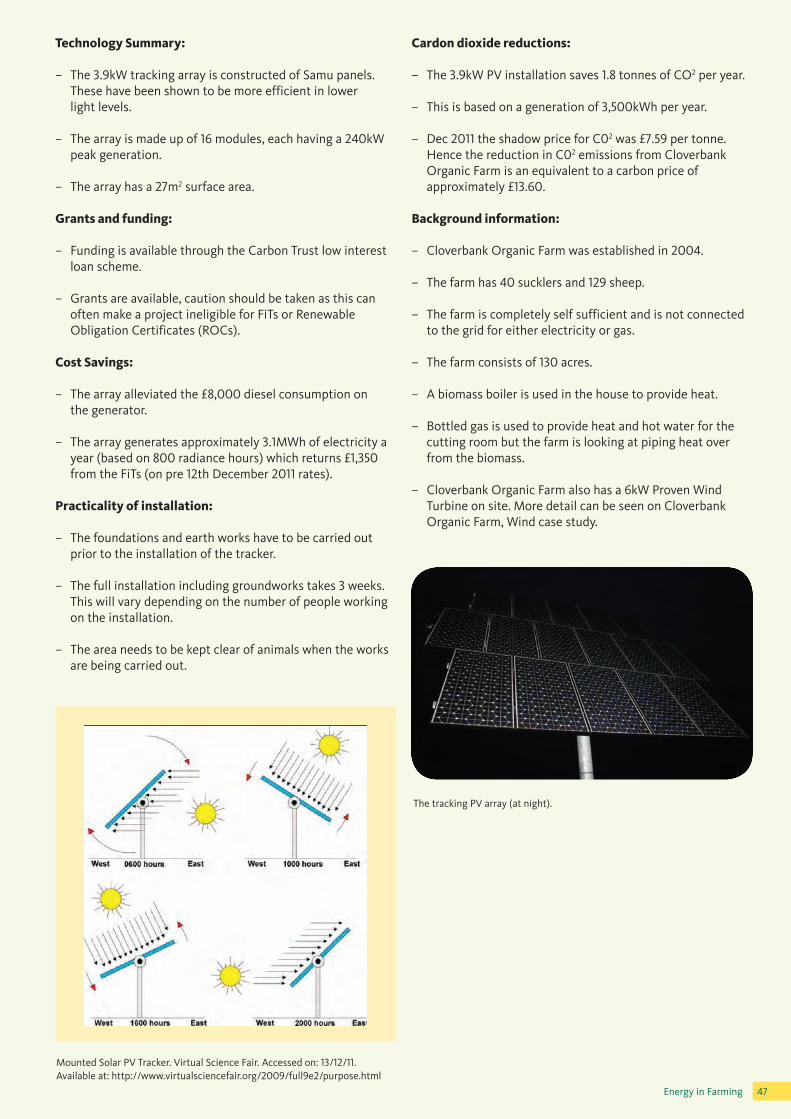
Energy in Farming 47
Technology Summary:
– The 3.9kW tracking array is constructed of Samu panels. These have been shown to be more efficient in lower light levels.
– The array is made up of 16 modules, each having a 240kW peak generation.
– The array has a 27m2 surface area.
Grants and funding:
– Funding is available through the Carbon Trust low interest loan scheme.
– Grants are available, caution should be taken as this can often make a project ineligible for FiTs or Renewable Obligation Certificates (ROCs).
Cost Savings:
– The array alleviated the £8,000 diesel consumption on the generator.
– The array generates approximately 3.1MWh of electricity a year (based on 800 radiance hours) which returns £1,350 from the FiTs (on pre 12th December 2011 rates).
Practicality of installation:
– The foundations and earth works have to be carried out prior to the installation of the tracker.
– The full installation including groundworks takes 3 weeks. This will vary depending on the number of people working on the installation.
– The area needs to be kept clear of animals when the works are being carried out.
Cardon dioxide reductions:
– The 3.9kW PV installation saves 1.8 tonnes of CO2 per year.
– This is based on a generation of 3,500kWh per year.
– Dec 2011 the shadow price for C02 was £7.59 per tonne. Hence the reduction in C02 emissions from Cloverbank Organic Farm is an equivalent to a carbon price of approximately £13.60.
Background information:
– Cloverbank Organic Farm was established in 2004.
– The farm has 40 sucklers and 129 sheep.
– The farm is completely self sufficient and is not connected to the grid for either electricity or gas.
– The farm consists of 130 acres.
– A biomass boiler is used in the house to provide heat.
– Bottled gas is used to provide heat and hot water for the cutting room but the farm is looking at piping heat over from the biomass.
– Cloverbank Organic Farm also has a 6kW Proven Wind Turbine on site. More detail can be seen on Cloverbank Organic Farm, Wind case study.
The tracking PV array (at night).
Mounted Solar PV Tracker. Virtual Science Fair. Accessed on: 13/12/11. Available at: http://www.virtualsciencefair.org/2009/full9e2/purpose.html
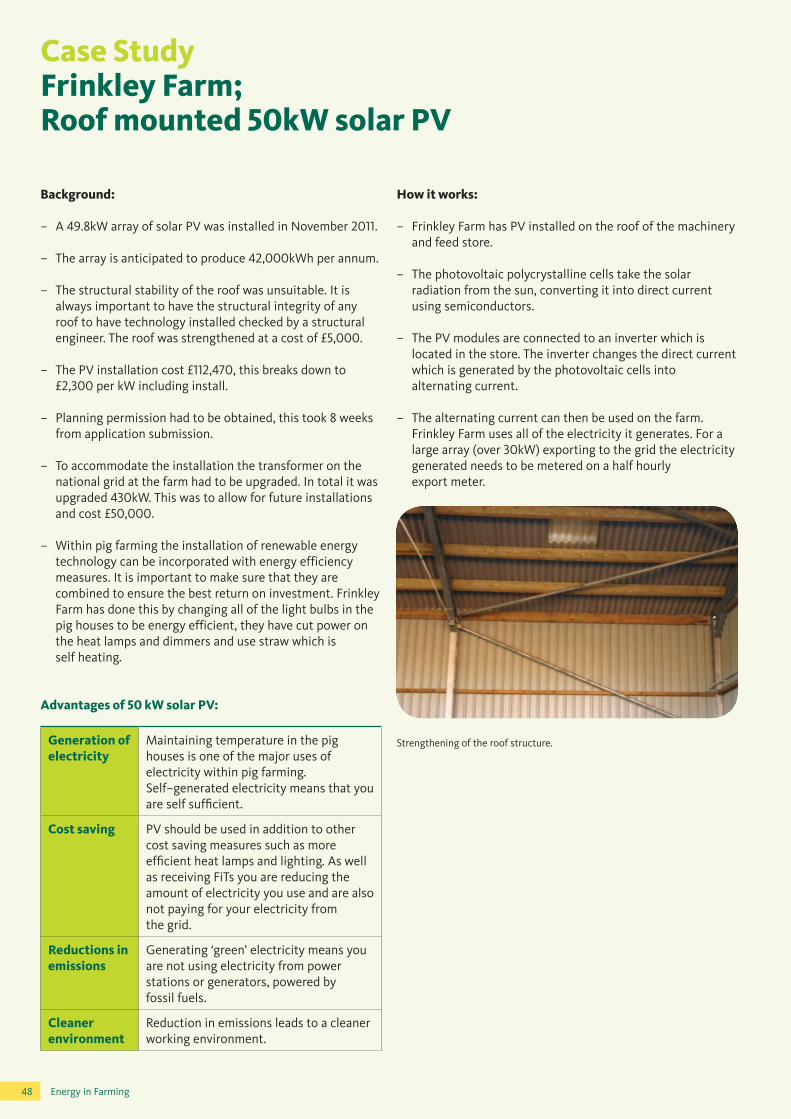
Energy in Farming48
Background:
– A 49.8kW array of solar PV was installed in November 2011.
– The array is anticipated to produce 42,000kWh per annum.
– The structural stability of the roof was unsuitable. It is always important to have the structural integrity of any roof to have technology installed checked by a structural engineer. The roof was strengthened at a cost of £5,000.
– The PV installation cost £112,470, this breaks down to £2,300 per kW including install.
– Planning permission had to be obtained, this took 8 weeks from application submission.
– To accommodate the installation the transformer on the national grid at the farm had to be upgraded. In total it was upgraded 430kW. This was to allow for future installations and cost £50,000.
– Within pig farming the installation of renewable energy technology can be incorporated with energy efficiency measures. It is important to make sure that they are combined to ensure the best return on investment. Frinkley Farm has done this by changing all of the light bulbs in the pig houses to be energy efficient, they have cut power on the heat lamps and dimmers and use straw which is self heating.
How it works:
– Frinkley Farm has PV installed on the roof of the machinery and feed store.
– The photovoltaic polycrystalline cells take the solar radiation from the sun, converting it into direct current using semiconductors.
– The PV modules are connected to an inverter which is located in the store. The inverter changes the direct current which is generated by the photovoltaic cells into alternating current.
– The alternating current can then be used on the farm. Frinkley Farm uses all of the electricity it generates. For a large array (over 30kW) exporting to the grid the electricity generated needs to be metered on a half hourly export meter.
Case StudyFrinkley Farm; Roof mounted 50kW solar PV
Generation of electricity
Maintaining temperature in the pig houses is one of the major uses of electricity within pig farming. Self–generated electricity means that you are self sufficient.
Cost saving PV should be used in addition to other cost saving measures such as more efficient heat lamps and lighting. As well as receiving FiTs you are reducing the amount of electricity you use and are also not paying for your electricity from the grid.
Reductions in emissions
Generating ‘green’ electricity means you are not using electricity from power stations or generators, powered by fossil fuels.
Cleaner environment
Reduction in emissions leads to a cleaner working environment.
Advantages of 50 kW solar PV:
Strengthening of the roof structure.

Energy in Farming 49
Technology Summary:
– 48.9kW of 235W polycrystalline PV panels made by Canadian Solar.
– The three inverters are Sunny Tripower by SMA.
Grants and funding:
– This installation was self funded but is eligible for the FiTs. It has a 15% return on investment.
– Low interest loans are available from installations as well as funded options in return for the FiTs payments.
Cost Savings:
– The installation is forecast to save £4,200 a year in electricity costs. This saving will increase as energy prices rise.
Practicality of installation:
– The installation took a week and required scaffolding to be erected around the shed. This time will vary depending on the number of people carrying out the installation.
– The roof had to be strengthened before the installation could take place which took several weeks.
– A standard 5 year guarantee was issued with the installation.
– Permission has to be obtained from the DNO (District network operator), in this case Western Power, to connect to the grid. This can result in time delays.
– To connect to the national grid, especially from a location which is not currently grid connected, earthworks for underground cables may be required.
Cardon dioxide reductions:
– The 48.9kW PV installation saves 24.5 tonnes of CO2 per year.
– This is based on a generation of 46,000 kWh per year.
– This is an overall reduction of 16% for the carbon footprint of the farm.
– Dec 2011 the shadow price for C02 was £7.59 per tonne. Hence the reduction in C02 emissions from Frinkley Farm has a carbon price of £185.96.
Background information:
– The array was installed by British Eco who have a national coverage for installations.
– The farm accommodates 430 sows, producing 200 pigs a week for slaughter.
– The farm also has 600 acres of arable land which is used to produce the cereals for feeding the pigs.
– The pigs are fattened on straw.
– Frinkley Farm has 10 rooms in the farrowing house, 4 rooms of first stage weaners and a further 3 rooms of second stage weaners.
– The farm uses the slurry produced by the pigs on their 600 acres to produce cereals for feeding.
– Frinkley Farm is in the process of erecting a wind turbine (As of December 2011). More information can be found in the Frinkley Farm; Wind case study.
The tracking PV array (at night).
The three inverters.

Energy in Farming50
Background:
– The ground mounted photovoltaic (PV) array was installed in May 2011.
– The array is for 69.9kW and is ground mounted in 2 arrays.
– Full planning permission was required for the installation.
– The array cost £210,000 to install.
– The array is eligible for the Feed in Tariff (FiTs).
– The system has been angled to the optimum angle and direction to ensure the maximum generation can be attained.
– Due to the size of the array, upgrading of the local trans former from 50 to 200kVA was required and was an additional cost of £17,000.
– The array was installed in addition to a smaller domestic scale installation on the farm house and each runs through a different meter meaning separate FiT registrations are possible.
How it works:
– Photovoltaic means turning sunlight into electricity by absorbing photons of light and turning them into electrodes.
– The cells which carry out this process are contained on a photovoltaic panel which is, at its peak, generating 240W.
– The panels are connected together to form an array.
– The charge produced from the array is taken to an inverter which transforms the current from direct current (DC) to alternating current (AC).
Case StudyBlack Dog Farm; Ground mounted 70kW solar PV
Income The array generates income from importing electricity as well as generating revenue from the FiTs.
Continuedgrazing
The ground mounting enables continued grazing of the field by smaller livestock, such as sheep and chickens.
Optimumefficiency
The PV is angled and sited correctly so that it maximises the generation and therefore the efficiency of the installation.
Clean energy The installation is emission free and reduces the carbon footprint of the farm as it is not importing ’dirty’ electricity.
Advantages of 70 kW solar PV:
How Solar Panels Work. Accessed on: 14/12/11. Available at: http://www.solarpower.com/how-does-solar-power-work/
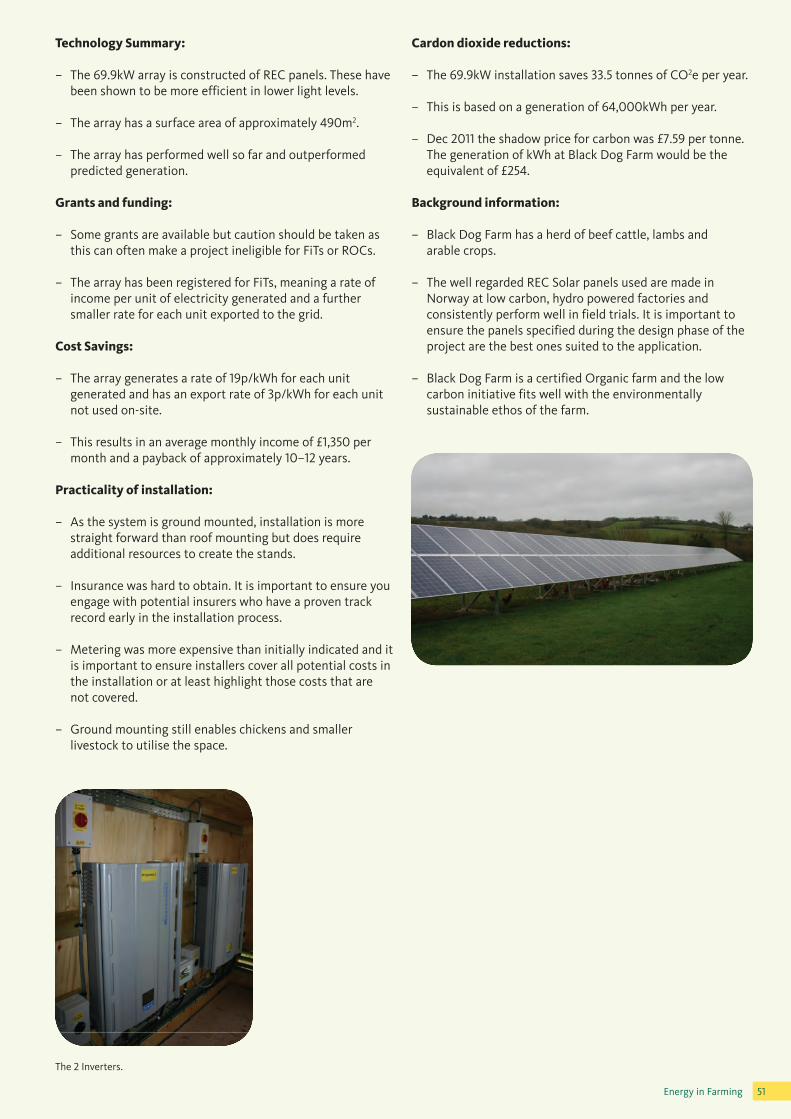
Energy in Farming 51
Technology Summary:
– The 69.9kW array is constructed of REC panels. These have been shown to be more efficient in lower light levels.
– The array has a surface area of approximately 490m2.
– The array has performed well so far and outperformed predicted generation.
Grants and funding:
– Some grants are available but caution should be taken as this can often make a project ineligible for FiTs or ROCs.
– The array has been registered for FiTs, meaning a rate of income per unit of electricity generated and a further smaller rate for each unit exported to the grid.
Cost Savings:
– The array generates a rate of 19p/kWh for each unit generated and has an export rate of 3p/kWh for each unit not used on-site.
– This results in an average monthly income of £1,350 per month and a payback of approximately 10–12 years.
Practicality of installation:
– As the system is ground mounted, installation is more straight forward than roof mounting but does require additional resources to create the stands.
– Insurance was hard to obtain. It is important to ensure you engage with potential insurers who have a proven track record early in the installation process.
– Metering was more expensive than initially indicated and it is important to ensure installers cover all potential costs in the installation or at least highlight those costs that are not covered.
– Ground mounting still enables chickens and smaller livestock to utilise the space.
Cardon dioxide reductions:
– The 69.9kW installation saves 33.5 tonnes of CO2e per year.
– This is based on a generation of 64,000kWh per year.
– Dec 2011 the shadow price for carbon was £7.59 per tonne. The generation of kWh at Black Dog Farm would be the equivalent of £254.
Background information:
– Black Dog Farm has a herd of beef cattle, lambs and arable crops.
– The well regarded REC Solar panels used are made in Norway at low carbon, hydro powered factories and consistently perform well in field trials. It is important to ensure the panels specified during the design phase of the project are the best ones suited to the application.
– Black Dog Farm is a certified Organic farm and the low carbon initiative fits well with the environmentally sustainable ethos of the farm.
The 2 Inverters.
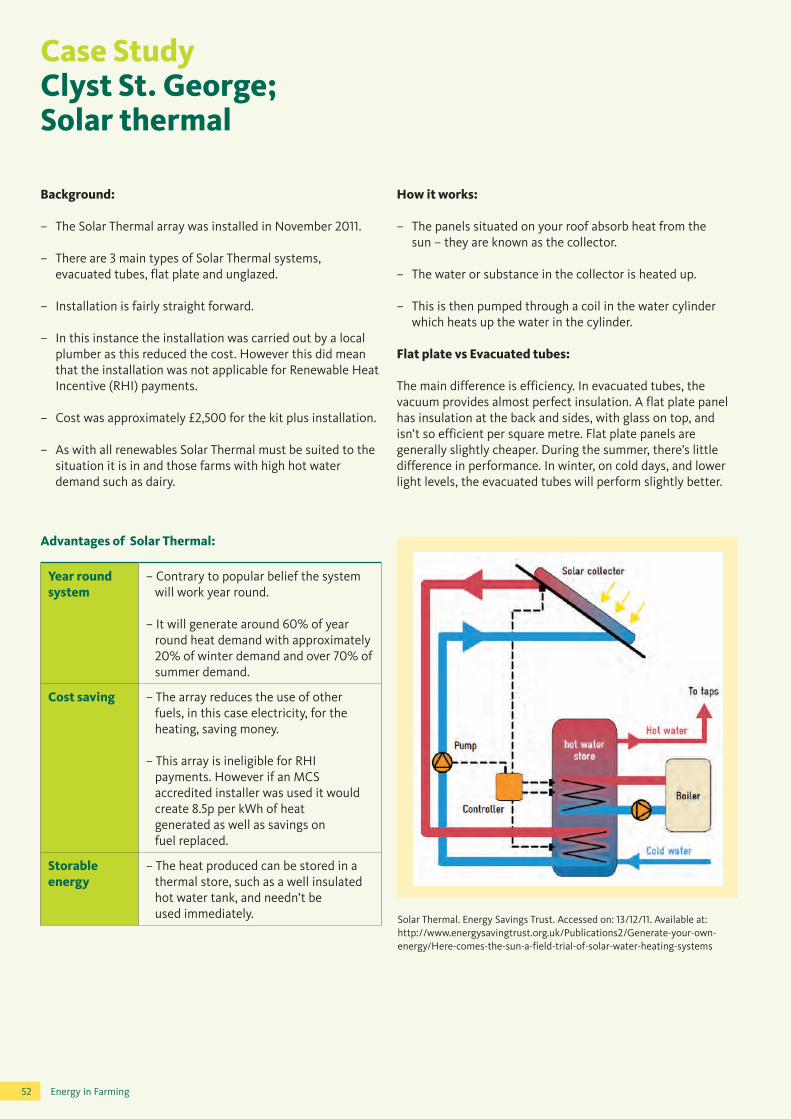
Energy in Farming52
Background:
– The Solar Thermal array was installed in November 2011.
– There are 3 main types of Solar Thermal systems, evacuated tubes, flat plate and unglazed.
– Installation is fairly straight forward.
– In this instance the installation was carried out by a local plumber as this reduced the cost. However this did mean that the installation was not applicable for Renewable Heat Incentive (RHI) payments.
– Cost was approximately £2,500 for the kit plus installation.
– As with all renewables Solar Thermal must be suited to the situation it is in and those farms with high hot water demand such as dairy.
How it works:
– The panels situated on your roof absorb heat from the sun – they are known as the collector.
– The water or substance in the collector is heated up.
– This is then pumped through a coil in the water cylinder which heats up the water in the cylinder.
Flat plate vs Evacuated tubes:
The main difference is efficiency. In evacuated tubes, the vacuum provides almost perfect insulation. A flat plate panel has insulation at the back and sides, with glass on top, and isn’t so efficient per square metre. Flat plate panels are generally slightly cheaper. During the summer, there’s little difference in performance. In winter, on cold days, and lower light levels, the evacuated tubes will perform slightly better.
Case StudyClyst St. George; Solar thermal
Year round system
– Contrary to popular belief the system will work year round.
– It will generate around 60% of year round heat demand with approximately 20% of winter demand and over 70% of summer demand.
Cost saving – The array reduces the use of other fuels, in this case electricity, for the heating, saving money.
– This array is ineligible for RHI payments. However if an MCS accredited installer was used it would create 8.5p per kWh of heat generated as well as savings on fuel replaced.
Storable energy
– The heat produced can be stored in a thermal store, such as a well insulated hot water tank, and needn’t be used immediately.
Advantages of Solar Thermal:
Solar Thermal. Energy Savings Trust. Accessed on: 13/12/11. Available at: http://www.energysavingtrust.org.uk/Publications2/Generate-your-own-energy/Here-comes-the-sun-a-field-trial-of-solar-water-heating-systems
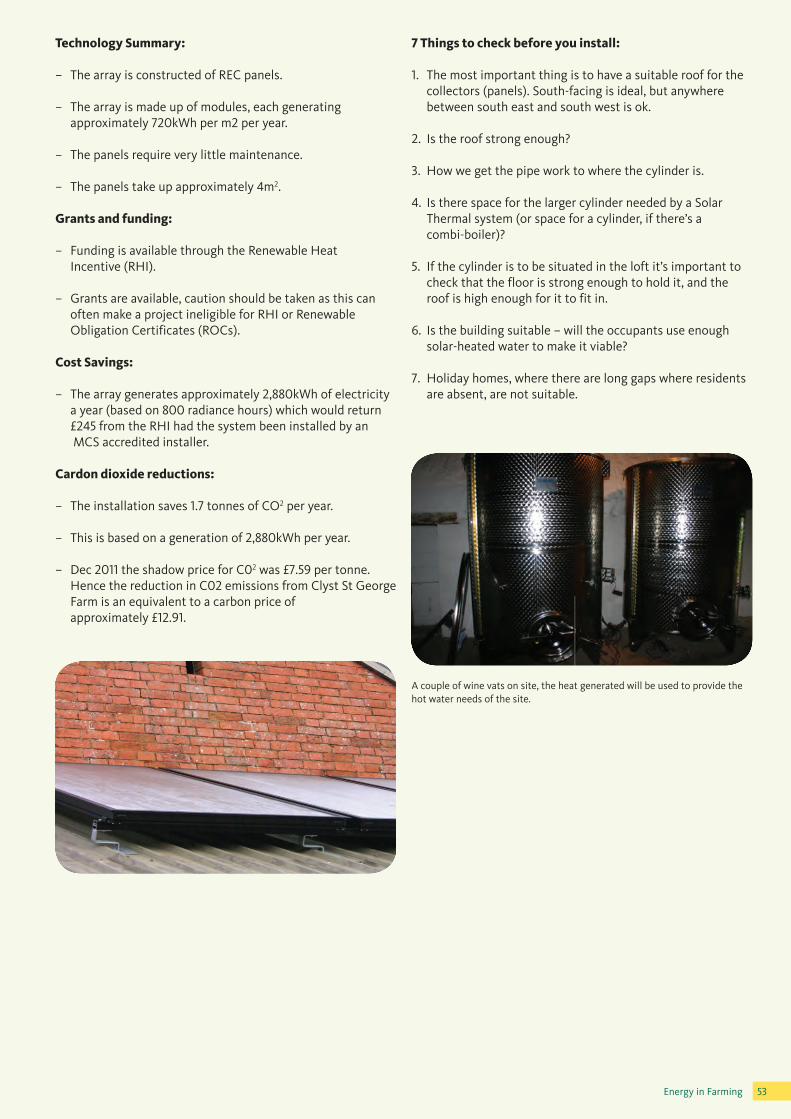
Energy in Farming 53
Technology Summary:
– The array is constructed of REC panels.
– The array is made up of modules, each generating approximately 720kWh per m2 per year.
– The panels require very little maintenance.
– The panels take up approximately 4m2.
Grants and funding:
– Funding is available through the Renewable Heat Incentive (RHI).
– Grants are available, caution should be taken as this can often make a project ineligible for RHI or Renewable Obligation Certificates (ROCs).
Cost Savings:
– The array generates approximately 2,880kWh of electricity a year (based on 800 radiance hours) which would return £245 from the RHI had the system been installed by an MCS accredited installer.
Cardon dioxide reductions:
– The installation saves 1.7 tonnes of CO2 per year.
– This is based on a generation of 2,880kWh per year.
– Dec 2011 the shadow price for C02 was £7.59 per tonne. Hence the reduction in C02 emissions from Clyst St George Farm is an equivalent to a carbon price of approximately £12.91.
7 Things to check before you install:
1. The most important thing is to have a suitable roof for the collectors (panels). South-facing is ideal, but anywhere between south east and south west is ok.
2. Is the roof strong enough?
3. How we get the pipe work to where the cylinder is.
4. Is there space for the larger cylinder needed by a Solar Thermal system (or space for a cylinder, if there’s a combi-boiler)?
5. If the cylinder is to be situated in the loft it’s important to check that the floor is strong enough to hold it, and the roof is high enough for it to fit in.
6. Is the building suitable – will the occupants use enough solar-heated water to make it viable?
7. Holiday homes, where there are long gaps where residents are absent, are not suitable.
A couple of wine vats on site, the heat generated will be used to provide the hot water needs of the site.

Energy in Farming54
Background:
– The AD plant was installed in 2009. The initial Combined Heat and Power unit (CHP) was faulty and its replacement began running to the current generation of 1280MWh per year in February 2011.
– The system cost £800,000M with a payback of 8 years.
– The system has additional costs of £85,850 a year to feed and maintain, this includes the feedstock, maintenance, meter rental, electricity standing charge and an electricity network availability charge.
– The AD plant satisfies all of the farm’s electricity needs, generating 3.5MWh/day and exporting 2.7MWh/day of this to the national grid.
– The AD plant produces sufficient heat to power a 200kW radiator which dries the grain. Sufficient heat is also produced for cheese making, to maintain the digester temperature, heat the farmhouse, heat the dairy wash water, warm the drinking water for the cows and dry crops.
– The digestate from the AD plant is used on the farm’s arable crops.
– Due to not using food waste the feedstock for the AD plant does not have to be pasteurised.
– A condition of planning permission was that the AD plants should be fed from within the farm.
– Two wood chip boilers were previously used to help provide heat requirements, a 50kW and a 34kW
– In the future the farm is looking to do a mini district heat system to the local village.
– The farm uses carbon neutral fuels where possible for the machinery.
How it works:
Case StudyCopys Green Farm; Anaerobic Digestion (AD)
Fertiliser The digestate is a strong fertiliser which is very efficient on the land.
Crop The sugar beet crop previously being grown was not very profitable. By switching to short chop maize it could be used as both feed for the cows and feedstock for the digester.
Warm water The excess heat from the plant is used to heat water for the cows. This means the animals are having to use less energy to heat the water and keep themselves warm, hence being more efficient.
Income The electricity brings in income of £155,000 a year from the Feed in Tariffs (FiTs) and £400,000 from electricity sales. By producing your own energy you are not subject to price fluctuations.
Advantages of Anaerobic Digestion:
Gas mixing skids.
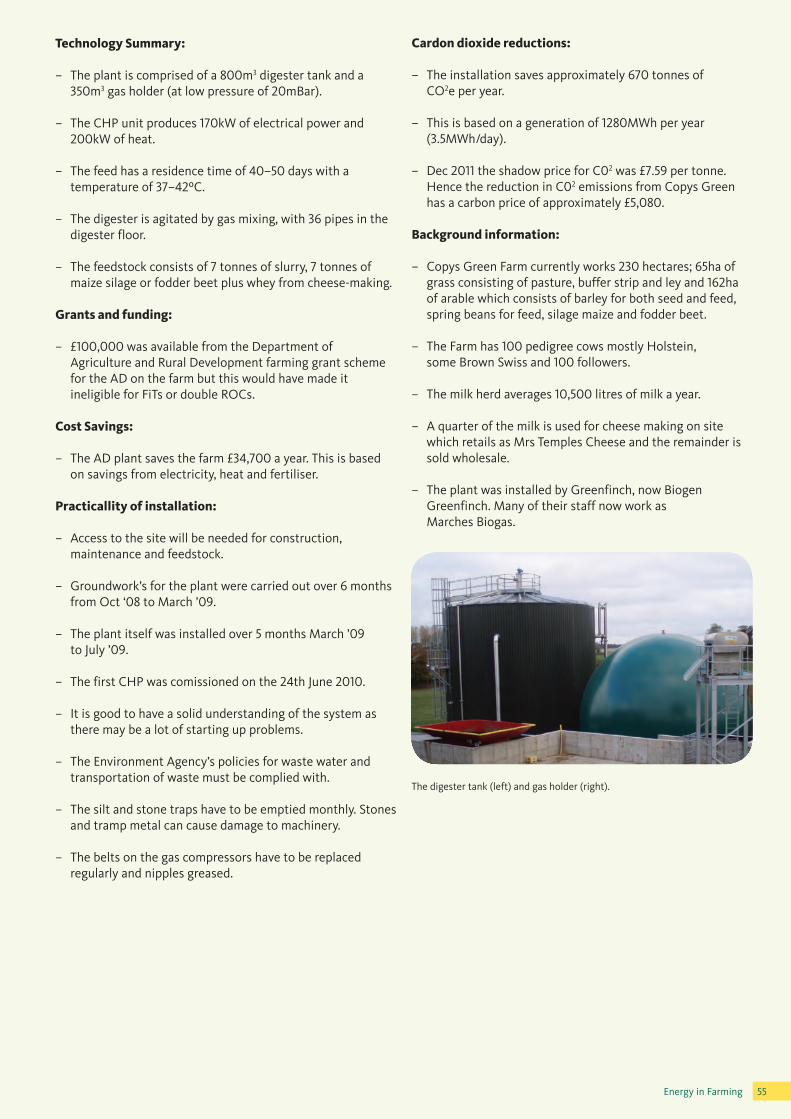
Energy in Farming 55
Technology Summary:
– The plant is comprised of a 800m3 digester tank and a 350m3 gas holder (at low pressure of 20mBar).
– The CHP unit produces 170kW of electrical power and 200kW of heat.
– The feed has a residence time of 40–50 days with a temperature of 37–42ºC.
– The digester is agitated by gas mixing, with 36 pipes in the digester floor.
– The feedstock consists of 7 tonnes of slurry, 7 tonnes of maize silage or fodder beet plus whey from cheese-making.
Grants and funding:
– £100,000 was available from the Department of Agriculture and Rural Development farming grant scheme for the AD on the farm but this would have made it ineligible for FiTs or double ROCs.
Cost Savings:
– The AD plant saves the farm £34,700 a year. This is based on savings from electricity, heat and fertiliser.
Practicallity of installation:
– Access to the site will be needed for construction, maintenance and feedstock.
– Groundwork’s for the plant were carried out over 6 months from Oct ‘08 to March ’09.
– The plant itself was installed over 5 months March ’09 to July ’09.
– The first CHP was comissioned on the 24th June 2010.
– It is good to have a solid understanding of the system as there may be a lot of starting up problems.
– The Environment Agency’s policies for waste water and transportation of waste must be complied with.
– The silt and stone traps have to be emptied monthly. Stones and tramp metal can cause damage to machinery.
– The belts on the gas compressors have to be replaced regularly and nipples greased.
Cardon dioxide reductions:
– The installation saves approximately 670 tonnes of CO2e per year.
– This is based on a generation of 1280MWh per year (3.5MWh/day).
– Dec 2011 the shadow price for C02 was £7.59 per tonne. Hence the reduction in C02 emissions from Copys Green has a carbon price of approximately £5,080.
Background information:
– Copys Green Farm currently works 230 hectares; 65ha of grass consisting of pasture, buffer strip and ley and 162ha of arable which consists of barley for both seed and feed, spring beans for feed, silage maize and fodder beet.
– The Farm has 100 pedigree cows mostly Holstein, some Brown Swiss and 100 followers.
– The milk herd averages 10,500 litres of milk a year.
– A quarter of the milk is used for cheese making on site which retails as Mrs Temples Cheese and the remainder is sold wholesale.
– The plant was installed by Greenfinch, now Biogen Greenfinch. Many of their staff now work as Marches Biogas.
The digester tank (left) and gas holder (right).

Energy in Farming56
Useful resources and further reading
Agriculture and Horticulture Development BoardLevy board for UK farming.www.ahdb.org.uk
BPEX Industry levy board for pig farmers in England and Wales.www.bpex.org.uk
Dairy Energy Europe WebsiteSpecific website for dairy farmers in Europe.Advice on all types of technology and case studies.www.dairyenergy.eu
Dairy CoIndustry levy board that provides technical advice and support for all aspects of dairy farming including resource efficiency.www.dairyco.org.uk
DECCDepartment for Energy and Climate Change.www.decc.gov.uk
DEFRADepartment for Food, Farming, Agriculture and Rural Affairs.www.defra.gov.uk/food-farm
EBLEXBeef and sheep meet industry levy body.www.eblex.org.uk
Horticulture Development CompanyLevy body for horticulture in the UK.www.hdc.org.uk
HGCALevy body for cereals and oilseeds in the UK.www.hgca.org.uk
Microgeneration Certification SchemeThe MCS website provides guidance on the certification of renewable technologies for the production of heat and electricity. Details are available from the website of suppliers and installers that have been MCS accredited.www.microgenerationscheme.org
Potato CouncilLevy bod for potato farming in the UK.www.potato.org.uk
FundingFor information on interest free loans and resourcemanagement, contact The Carbon Trust.www.carbontrust.co.uk