energy infrastructure primer
TRANSCRIPT

Version 1.1
April 2020
Alerian
3625 N. Hall St., Suite 1200
Dallas, TX 75219
alerian.com
Energy Infrastructure Primer: A guide for both new and experienced investors

2
Table of Contents
Introduction 3
Energy Infrastructure 101 4
Energy Infrastructure 201 9
Energy Infrastructure Investing 15
Classification Standard 21
Glossary 23
Disclaimers 27

3
// IntroductionAn investment in energy infrastructure is an investment in North America’s continued production and consumption of transportable energy over the next several decades. Energy infrastructure companies own the pipelines, storage tanks, and processing facilities that bring energy from the wellhead to America’s doorstep and increasingly to coasts for exports. In the energy industry, these activities describe “midstream”, which is the bridge between production (upstream) and consumption (downstream). While still related to the energy industry, most energy infrastructure business lines do not have direct exposure to commodity price fluctuations. Their businesses function primarily on a set fee per volume or fee for service basis. In short, the business model is driven by volumes.
The prices (or tariffs) that energy infrastructure companies can charge are determined either by negotiated contracts or are federally regulated. Typically, tariffs increase each year by a measure linked to inflation. In terms of volumes, the significant growth in North American oil and gas production has increased the need for energy infrastructure assets. While energy demand in North America remains fairly steady, global demand growth continues, particularly for emerging markets, creating opportunities for energy infrastructure companies. Increasingly, these companies are processing, transporting, and storing hydrocarbons that will ultimately be sent to locations worldwide.
EI 101 is designed for those who are starting from the beginning or those who would like a refresher on the basics of energy infrastructure. We’ve also detailed energy infrastructure business models, as well as the fundamental backdrop supporting opportunities in this space.
EI 201 goes into further detail on energy infrastructure business models and gets to the importance of shale in growing US energy production. This section is for those investors wanting to have a firm grasp on energy infrastructure economics before investing. We explain the nuances of various midstream business models, the regulations around pipelines and pipeline tariffs, and the valuation metrics typically used for the energy infrastructure space.
Energy Infrastructure Investing is designed for those who have decided to invest. This section walks through each energy infrastructure access product, explaining the pros and cons as well as exploring which goals might be met by each. This section includes considerations for selecting individual securities and investing in products, whether active or passive.

Energy Infrastructure 101
4
5
The Very Basics
Energy infrastructure companies are involved in the transportation, processing, and storage of oil, natural gas, and natural gas liquids (NGLs). Historically, a majority of the midstream space has been structured as master limited partnerships, or MLPs (we won’t cover MLPs extensively in Energy Infrastructure 101, but those looking for more information can find it in our MLP Primer). However, C-Corporations have become more prominent in midstream in recent years.
The Basic EI Business Models1
1. TransportationJust like it sounds, transportation involves moving energy commodities like oil and natural gas from one place to another. In North America, most energy travels through a pipeline, but it can also move via truck, railcar, or ship. Pipelines are the cornerstone of the energy infrastructure space.
2. ProcessingProcessing encompasses any business that transforms a raw commodity into a usable form. It involves removing impurities like water and dirt from wellhead natural gas and separating the natural gas stream into pipeline-quality natural gas and natural gas liquids (NGLs), which are used as heating fuels and petrochemical feedstocks.
3. StorageStorage includes tanks, wells, and other facilities both above and below ground. These assets provide flexibility to the energy economy, so there is propane available for winter heating, gasoline for summer driving, and jet fuel for the holidays. How Energy Infrastructure Companies Make Money
Energy infrastructure companies typically operate fee-based business models. EI companies earn a set fee for each barrel of oil or million British Thermal Unit (MMBtu) of natural gas transported, stored, or processed (in the case of natural gas) regardless of the price of the hydrocarbon. This is because these companies typically do not own the oil or gas. EI companies generally sign long-term contracts (5 to 20 years in length) with their customers, which makes for stable cash flows. Accordingly, the revenue equation for most business activities is fairly simple: price multiplied by volume. As such, more volumes means more cash flows. On the price side, a federal agency sets the fee charged by interstate liquids pipelines, and the fee increases with inflation. Pipeline fees can also be negotiated with a customer based on the cost of operating the pipeline and market rates for liquids or natural gas pipelines. On the
// Energy Infrastructure 101
volume side, growing production of North American oil and natural gas has necessitated more energy infrastructure such as pipelines, storage tanks, and processing plants.
How Investors Make Money with Energy Infrastructure
If you own a stock, there are two ways to make money. The price of the stock increases and you can sell it for more than you bought it. Formally, this is known as price appreciation. The stock also likely pays you dividends. The amount of dividends relative to the share price is known as yield.
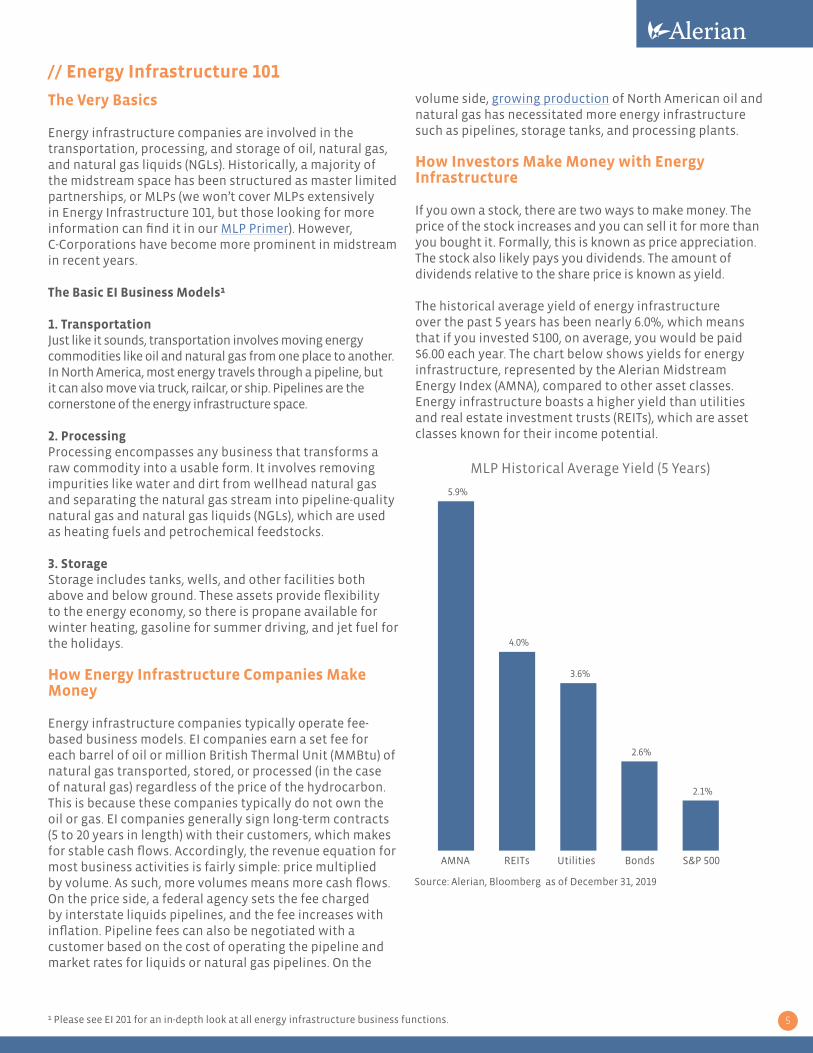
The historical average yield of energy infrastructure over the past 5 years has been nearly 6.0%, which means that if you invested $100, on average, you would be paid $6.00 each year. The chart below shows yields for energy infrastructure, represented by the Alerian Midstream Energy Index (AMNA), compared to other asset classes. Energy infrastructure boasts a higher yield than utilities and real estate investment trusts (REITs), which are asset classes known for their income potential.
1 Please see EI 201 for an in-depth look at all energy infrastructure business functions.
Source: Alerian, Bloomberg as of December 31, 2019
5.9%
4.0%
3.6%
2.6%
2.1%
AMNA REITs Utilities Bonds S&P 500
MLP Historical Average Yield (5 Years)

6
The Pipeline Business, Explained
The modern pipeline network2 in the United States has its roots in the outbreak of World War II. Before the war, the East Coast was the largest consumer of energy in the country. Refined products (such as gasoline, diesel, and jet fuel) were delivered from Gulf Coast refineries via tankers. Tankers also carried raw crude oil from the Middle East. However, once the US became involved in the war, German submarines began sinking these tankers. Together, the government and the petroleum industry built pipelines that could cover long distances and transport large amounts of oil. This network subsequently fueled the economic boom that followed the war., and many of those original pipelines are still in service today.
There are both large diameter trunklines that function like interstates (instead of being four lanes wide, they are often 42” in diameter, or large enough for a child to stand inside), as well as smaller delivery lines which connect the large pipelines to each town. Product traveling through trunklines is fungible—the customer will receive product on the other end that is the same quality as that which was sent, but they won’t be the exact same molecules. It is as if someone sent $100 to a college student through a bank. That student will not get the exact same $100 bill as his or her benefactor sent, but the student doesn’t care because $100 is $100. Money is fungible. However, smaller delivery lines operate on a batch system, where the exact same molecules are delivered as were shipped. In this case, our lucky college student gets a couple dozen cookies, and the ones delivered are the exact same cookies his or her parents baked, not cookies that some other people made.
Energy Renaissance
Prior to the 2000s, much of the energy industry was focused on peak oil and the ways companies and our society would have to shift in response. While producers knew that oil reserves existed, accessing the oil in a cost-effective way was still difficult. Experts forecasted that expensive and complex recovery methods would be needed to continue to produce even a modest number of barrels.
In the early 2000s, the natural gas industry in the US began widespread application of horizontal drilling and hydraulic fracturing. The technologies were not new, but the combination of both technologies makes it possible to profitably produce the large reserves of crude oil, natural gas, and NGLs trapped between layers of North American shale rock. Horizontal drilling was developed in the first half of the 20th century, and the first commercial applications of hydraulic fracturing took place in 1949. After seeing the success of natural gas companies in
// Energy Infrastructure 101
applying these technologies, oil producers began implementing the same drilling technology, seeing strong production growth from oil wells.
In 2009, the US became the world’s largest producer of natural gas. By 2012, the US had an abundance of natural gas, leading to lower prices, but gas production continued to grow. In 2014, rapid growth in US oil production had led to a global crude oversupply and weakness in oil prices. A multi-decade ban on US crude exports was lifted by Congress in December 2015. Oil prices gradually recovered from their relative bottoming in February 2016, and US oil production continued to increase. In 2018, the US became the world’s largest oil producer and is now exporting millions of barrels of crude each day. Global oil prices fell significantly in early 2020 due in part to the demand impacts stemming from the coronavirus. Price weakness may lead to a temporary reduction in US oil production, though the long-term view for production growth remains intact.
The term “energy renaissance” refers to the overwhelming growth in US energy production that has occurred over the last decade, culminating in projections that the US will become a net energy exporter by 2020.
2 Source: Pipeline 101: https://pipeline101.org/The-History-of-Pipelines/1900-1950
Source: US Energy Information Administration Annual Energy Outlook 2020
Long-Term Growth Expected for US Energy Production
7
What the North American Energy Landscape Means for Energy Infrastructure
Energy infrastructure companies are not the ones engaging in horizontal drilling or hydraulic fracturing. Instead, EI companies are typically focused on the more stable businesses within the energy complex. The midstream company that provides transportation, processing, and storage facilities for multiple producers has diversified its revenue stream and benefits broadly from energy production and exports.
Oil production growth has created a number of opportunities for midstream companies to build new pipelines connecting producing regions with demand centers, including the coast for export. Energy infrastructure companies have also built crude export terminals.
On the natural gas side, growing production and rising demand have created many opportunities for midstream. For example, several companies have built or are constructing liquefaction plants in the US and Canada where natural gas can be cooled and pressurized to a liquid form. This liquefied natural gas (LNG) can then be loaded onto ships for export. US LNG exports will help meet increasing demand for natural gas overseas. Midstream companies build and operate the pipelines that supply LNG export facilities, natural gas-fired power plants, and necessary storage facilities. They also own the processing plants necessary for transforming raw natural gas into a usable form.
Complementing the growth in oil and natural gas, production of natural gas liquids (NGLs) has also grown. Natural gas liquids must be processed into their component parts to be usable, creating more demand for fractionation facilities (the formal term for plants that process NGLs). EI companies build NGL-dedicated pipelines and fractionation facilities, as well as NGL export facilities to meet overseas demand.
The tremendous growth in US energy production over the last decade has necessitated a significant build out of energy infrastructure, including pipelines, natural gas processing facilities, storage capacity, and export terminals. For midstream, capital investment likely peaked in 2018 or 2019 in anticipation of more moderate production growth in 2020 (read more). The weakness in oil and natural gas prices in 2020 is likely to result in a temporary decline in US energy production, and midstream companies have further reduced capital spending plans in response. Midstream is expected to benefit from the fee-based cash flows of previously completed projects, while reduced growth spending should provide additional financial flexibility.
// Energy Infrastructure 101
Risks
If you have listened to a company’s earnings call, viewed an investor presentation, or perused a company’s annual report, you will have noticed disclaimers and/or a discussion of risk factors. Even if you don’t like reading fine print, PLEASE still read this. While some of these risks may be unlikely to occur, they could impact your expected total return.
Commodity Price Sensitivity – Since energy infrastructure companies do not own the oil and gas they transport, their business performance is not directly connected with the price of oil or gas. However, commodity prices can have implications as there are indirect connections between energy prices and the performance of midstream companies, even though profitability may not be directly impacted by commodity price fluctuations. If commodity prices are very low, upstream companies will drill less and demand will fall for gathering pipelines and other infrastructure. Additionally, in an environment with falling commodity prices, investor psychology may connect energy infrastructure with the broader energy sector and commodity prices beyond what the underlying business models would otherwise indicate. In other words, commodity prices can impact sentiment for energy infrastructure companies.
Environmental Risk – Some pipelines in major transportation corridors were constructed in the 1950s and 1960s. An aging pipeline system as well as high-profile oil spills and gas leaks have increased investor concerns regarding transportation safety and environmental risks. Pipelines are by far the safest form of transportation for oil and natural gas. Increased maintenance and new technologies enabling more frequent and accurate monitoring of pipelines has helped improve pipeline safety.
Renewable Energy – The potential for renewable forms of energy (solar, wind, hydro) to replace hydrocarbon-based energy is both the largest and least immediate risk to energy infrastructure. A game-changing technological breakthrough is likely many years away, and it will also take many years to fully implement. As an example, even global demand for coal increased in 2018, reflecting the longevity of energy sources and challenges in switching fuels. Moreover, petrochemicals are expected to drive significant demand growth for hydrocarbons, and renewable substitutes may not be readily available for petrochemical applications. If the next form of energy is transported in a gaseous or liquid form, it is highly likely that existing steel pipelines and storage facilities can be converted. For instance, liquid hydrogen could easily be moved by our current infrastructure.

8
Permitting Risks – The permitting process for a new pipeline involves federal and state government approvals and permits, as well as environmental impact studies and potentially eminent domain complications. Each state has its own regulations, and pipelines often pass through many states. Should an approval not be granted (or conditionally granted), a pipeline may need to be rerouted, which is an expensive and time-consuming necessity. It is at this stage that community and environmental protesters often delay the timeline. Any delays or cost overruns in the permitting process may make the project less profitable, as well as potentially prevent the pipeline from being built, resulting in lost sunk costs for the company.
// Energy Infrastructure 101

9
Energy Infrastructure 201

10
Shale Revolution
Shale is a type of geological formation found in sedimentary rocks3. When the media refers to natural gas plays such as the Marcellus and Utica shales in Pennsylvania and Ohio, they are referring to a specific layer of rock formed at a particular time in history. The amount and type of natural resources found in that layer will depend on what sort of life form, water, or lack of water existed during that period. Notice how the Marcellus formation sits above the Utica formation.
// Energy Infrastructure 201For many decades, producers drilled for oil and gas in rock formations such as carbonates, sandstones, and siltstones. These formations, known as conventional formations, have multiple porous zones that allow the oil and gas to flow naturally through the rock. This ability of rocks to allow fluids to flow is known as permeability. Conventional formations have higher permeability than unconventional formations like shale rock. Vertical drilling, which involves drilling straight into the ground, worked for many years on conventional formations because once the drill bit hit a particular area, the high permeability would allow for the hydrocarbons to be extracted easily. For quite some time, the energy industry has known that oil and gas existed in shale. But because shale rock is not as permeable, using old techniques with vertical drilling did not make it economically feasible to recover resources because it would only capture a limited amount. Three technologies together truly changed the game for extracting shale resources:
1. 3D seismic imaging2. Horizontal drilling3. Hydraulic fracturing
While seismic imaging in 3D may be the least well-known component of the shale revolution, it plays a vital role when it comes to drilling a successful well. Seismic technology uses acoustic energy, vibrations, and reflected signals to determine the location and density of rock formations. Think of it like an underground map. While considerably more expensive than 2D seismic imaging, 3D seismic imaging results in fewer dry holes4 and more productive wells.
3 Sedimentary rocks are formed through the accumulation of layers and layers of grain and sediments, in water or on land, over thousands of years. Metamorphic rocks are rocks that have been transformed by an external force like heat, pressure, or chemicals. Igneous rocks are made from molten rock.4 A dry hole is a well that is drilled but produces no oil or natural gas. It may produce water or small amounts of oil and gas, but not enough to recoup drilling costs.
Potsville Group
Mauch Chunk Group
Greenbriar Limestone
Pocono Group
Ohio Shale
Genesee / Sonyea / West Falls / Java Fms
Tully Limestone
Onondaga FormationBois Blanc Formation / Huntersville ChertRidgeley Sandstone
Helderberg Group
Bass Islands Dolomite / Keyser Formation
Salina Group
Lockport Dolomite and McKenzie Formation
Clinton Group
Medina Group / Tuscarora Formation
Queenston Shale / Oswego Formation
Reedsville Shale
Trenton / Black River Limestones
Loysburg Formation
Beekmantown Group
Rose Run Sandstone
Copper Ridge Dolomite
© Geology.com
Hamilton Group
Marcellus Formation
Utica Formation
318 MYA
359 MYA
416 MYA
443 MYA
488 MYA
Cam
bria
nO
rdov
icia
nSi
luria
nD
evon
ian
Mis
siss
ippi
an
Source: geology.comSource: geomore.com/seismic

11
// Energy Infrastructure 201
Source: National Energy Board, US Energy Information Administration
Horizontal drilling is another technology that has drastically improved the success rates and economic viability of shale drilling. Horizontal drilling allows the operator to drill a well, and then manipulate the drill bit underground to make a 90-degree turn and cover a much larger area. Multiple (up to 20 or more) horizontal wells can be drilled from a single drill pad, lowering drilling costs, increasing efficiency, and minimizing the impact to the environment. After the well is drilled and lined with casing, a second technique called hydraulic fracturing is used.
Hydraulic fracturing describes the process in which a mixture of water, sand, and other chemicals is pumped into a well at a very high pressure to break up shale rock. The highly pressurized mixture lets a driller open all those tiny pockets. The water is then removed, and the remaining sand props open the rock, allowing hydrocarbons to flow freely to the surface.
In short, 3D seismic drilling tells producers where to drill, horizontal drilling increases the amount of area drilled, and hydraulic fracturing solves the issue of low permeability.
THEN NOW
Horizontal DrillingVertical Drilling5
Hydraulic Fracturing
The map below shows some of the major natural gas, crude oil, and NGL plays in the United States.
5 Ohio Oil and Gas Association. September 30, 2013.

12
Energy Infrastructure Business Models
In Energy Infrastructure 101, the pipeline business was thoroughly examined and explained. Pipelines are perhaps the most familiar of the assets that energy infrastructure companies operate, but these companies are also involved in a much larger swath of the energy value chain.
Gathering & Processing – Before hydrocarbons enter a large pipeline, they need to be gathered and, in the case of natural gas, processed. Gathering involves connecting wells to major pipelines through a series of small diameter pipelines. Gathering pipelines transport either crude oil or natural gas from the wellhead. Processing is required for natural gas and involves the removal of potential contaminants and separation of natural gas liquids (NGLs) so that the gas can meet purity standards for pipeline transmission.
Gathering and processing companies focus on obtaining fee-based revenues by charging upstream companies a set fee for every million British Thermal Unit (MMBtu) of natural gas or barrel of oil that is gathered or processed. The contract often includes a minimum volume commitment or acreage dedication, which provides further cash flow stability. Occasionally, some companies will have different compensation structures, which may include payment in the form of keep-whole contracts. This allows them to keep the extracted NGLs and sell them to third parties at market prices. Another contract structure is percent of proceeds (colloquially known as POP), in which the processor is paid by retaining a percentage of any processed natural gas or NGLs. As keep-whole and POP contract structures expose gathering and processing companies to volatility in commodity prices, the vast majority of companies have moved (or attempted to move) to a purely fee-based revenue structure.
Fractionation – At a fractionation facility, NGLs are separated into their individual usable components of ethane, propane, butane, isobutane, and natural gasoline. Ethane is primarily used as a feedstock, or input, into petrochemical plants to make ethylene, which is used to make plastics and other chemical products such as solvents and adhesives. Propane by itself can be used as a heating fuel or used as a feedstock to make propylene, which can be used in the manufacturing of textiles or plastics, such as headlights, eyeglasses, foam bedding, and water bottles.
// Energy Infrastructure 201In general, ethane and propane make up the bulk of the NGL stream, with a concentration ranging from 55% to 85%. Butane, isobutane, and natural gasoline are used to produce motor gasoline. Butane is the primary component of lighter fluid and can be used as a feedstock to make butadiene, which is used in creating synthetic rubber.
The majority of fractionation is done on a fee-for-service basis. However, the amount of fees earned depends on the amount of volumes fractionated, which in turn depends on something called the frac spread6. Essentially, the frac spread is a measure of the reverse of the adage “the whole is greater than the sum of its parts.” With NGLs, the sum of the parts is worth more than the whole. Some NGLs must be removed for the natural gas stream to meet purity standards, but often they are only removed for additional profitability. The frac spread is the difference between the value of the NGLs if removed and the value of the NGLs if they are left in the natural gas stream and sold at the same price as natural gas. Ethane rejection is the industry term for when ethane prices are so low that it is better to leave ethane in the natural gas stream than extract it.
The high cost7 of NGL handling, storage, and transportation additionally factors into the volumes of NGLs that will be fractionated. In order for the hydrocarbons to remain liquids, they must be kept under high pressure or cooled to very low temperatures. Additionally, gaseous NGLs are heavier than air and flammable, requiring increased safety measures. NGL storage typically takes place in underground caverns for these reasons, while the smaller amounts stored above ground are placed in insulated tanks and thicker steel.
6 If you are familiar with crack spreads for refineries, this is very similar. If you are not familiar with crack spreads, the EIA has a great explanation – https://www.eia.gov/todayinenergy/includes/crackspread_explain.php 7 Compared to refined products

13
Transportation – Transportation companies are the bread and butter of the sector. The fee-based business model is the most well-known and most frequently referenced, perhaps because it is one of the simplest to understand. Typically, midstream companies will enter long-term contracts with customers committing to use a certain amount of pipeline capacity. The midstream company will collect a fee per unit of hydrocarbon transported. Contract provisions such as take-or-pay agreements or minimum volume commitments allow the pipeline company to collect specified fees even if the customer does not fully use its committed capacity.
Interstate liquids pipelines are regulated by the FERC, and rates are most often based on the FERC’s oil pipeline index. Every five years, the FERC sets the rate by which tariffs will be increased, with the rate based on the Producer Price Index for Finished Goods plus an adjustment. Through 2021, these FERC-regulated pipelines will increase the tariff they charge by PPI + 1.23% every July 1.
Interstate natural gas pipelines generate revenue by collecting a tariff for each unit of natural gas transported under long-term commitments. Customers enter contracts for capacity for these pipelines in much the same way that apartments are rented, but instead of year-long leases, interstate natural gas pipeline contracts are often for 5 to 20 years. Like a lease, customers are obligated to pay regardless of whether they use the space or not. Additional fees are charged when a customer needs to inject or withdraw hydrocarbons to meet demand spikes or oversupply. The length and terms of these contracts allow the pipeline company to earn the rate of return necessary to break ground on new construction. Transportation companies have historically avoided building speculative projects (“on spec”), given the capital intensity of pipelines in particular. Instead, pipeline companies will move forward with projects once they have sufficient customer commitments.
Storage – Natural gas that is not immediately required for electricity generation or heating is stored until needed. The same is true of crude oil waiting to be refined and refined products (such as gasoline, diesel, and jet fuel) waiting to be consumed. Storage facilities operate a fee-based business model similar to rent, with contract lengths generally ranging from one to five years. Storage tanks for crude oil and refined products may also have inflation escalators.
A full list of Alerian’s Energy Midstream Classification Standard can be found here, and Alerian’s Midstream Screener classifies each currently trading energy infrastructure company and MLP according to its sector.
// Energy Infrastructure 201
Pipeline Permitting
Natural Gas PipelinesAccording to the Natural Gas Act, companies that would like to build an interstate natural gas pipeline must obtain a “Certificate of Public Convenience and Necessity” from the Federal Energy Regulatory Commission (FERC) before beginning a project. This is a multi-step process.
1. Pre-Filing and Environmental Review. Pre-filing involves notifying all stakeholders of the proposed project and offering a medium for said stakeholders to voice concerns related to the project. This phase also includes a study of the potential project site. This process begins about seven to eight months before the application for the actual certificate is filed.
2. Application for FERC Certificate. This is the beginning of the formal process. Applicants must turn in lots of data on the project, such as construction plans, route maps, schedules, and more.
3. Environmental Review. An official study is carried out on how the project will impact the environment. The public is then given an opportunity to comment on the results of the study. After this, the FERC will consider the comments and issue formal approval or denial of the project.
The formal process takes about a year. However, this timeline is not guaranteed. In April 2018, FERC requested stakeholder input on its current policies to review and authorize interstate natural gas pipelines, particularly related to the transparency, timing, and predictability of its certification process. As of March 2019, there have been no updates.
Petroleum PipelinesThe permitting of oil pipelines is not subject to FERC regulation. While companies constructing oil pipelines are required to obtain federal permits such as those described under the Clean Water and Clean Air Acts, state approvals are the only governmental authorizations required for oil pipeline construction projects to move forward. At first blush, this may seem like an advantage for oil pipelines. Many would agree it is easier to acquire permits to build a pipeline from Oklahoma to Texas than from Pennsylvania to New York, for example. However, dealing with landowner issues in multiple states is not necessarily easy. If a landowner does not agree to the path of a pipeline and eminent domain authority does not exist in that landowner’s state, then the oil pipeline could be forced to take a more expensive alternative route. For natural gas pipelines, FERC approval includes federal eminent domain – a primary advantage of building a natural gas pipeline over building an oil pipeline.
14
Pipeline Regulation
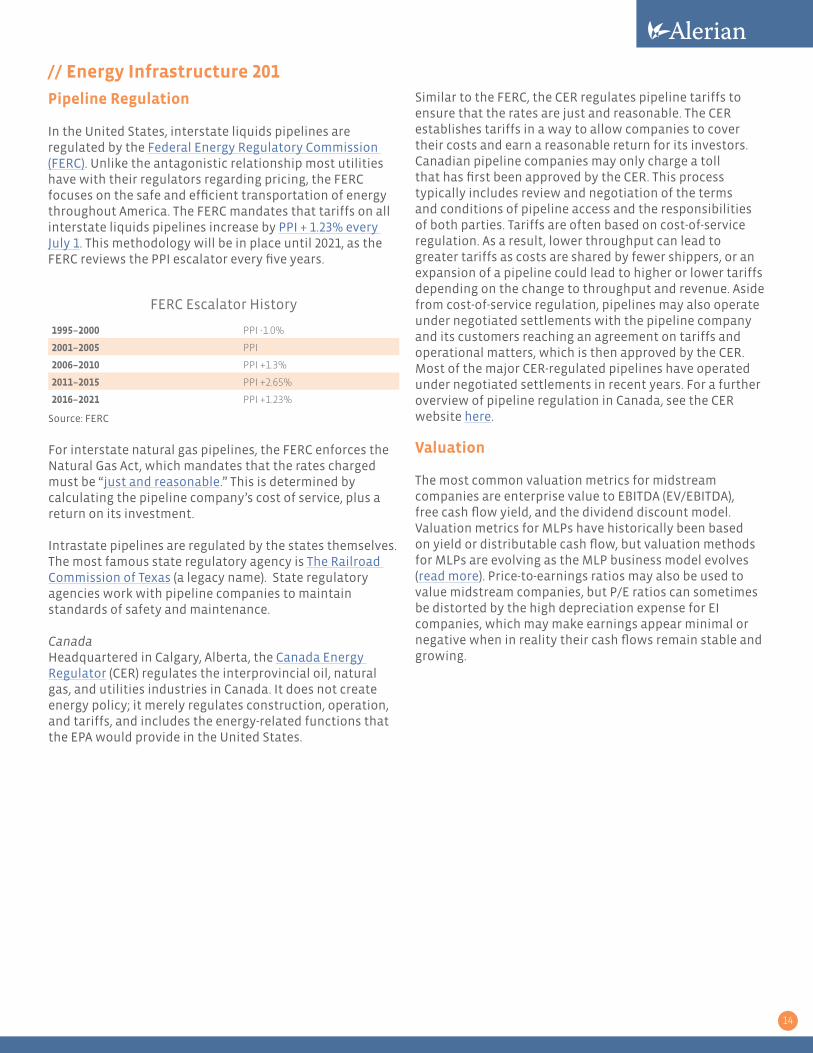
In the United States, interstate liquids pipelines are regulated by the Federal Energy Regulatory Commission (FERC). Unlike the antagonistic relationship most utilities have with their regulators regarding pricing, the FERC focuses on the safe and efficient transportation of energy throughout America. The FERC mandates that tariffs on all interstate liquids pipelines increase by PPI + 1.23% every July 1. This methodology will be in place until 2021, as the FERC reviews the PPI escalator every five years.
// Energy Infrastructure 201
1995–2000 PPI -1.0%
2001–2005 PPI
2006–2010 PPI +1.3%
2011–2015 PPI +2.65%
2016–2021 PPI +1.23%
FERC Escalator History
Source: FERC
For interstate natural gas pipelines, the FERC enforces the Natural Gas Act, which mandates that the rates charged must be “just and reasonable.” This is determined by calculating the pipeline company’s cost of service, plus a return on its investment.
Intrastate pipelines are regulated by the states themselves. The most famous state regulatory agency is The Railroad Commission of Texas (a legacy name). State regulatory agencies work with pipeline companies to maintain standards of safety and maintenance.
CanadaHeadquartered in Calgary, Alberta, the Canada Energy Regulator (CER) regulates the interprovincial oil, natural gas, and utilities industries in Canada. It does not create energy policy; it merely regulates construction, operation, and tariffs, and includes the energy-related functions that the EPA would provide in the United States.
Similar to the FERC, the CER regulates pipeline tariffs to ensure that the rates are just and reasonable. The CER establishes tariffs in a way to allow companies to cover their costs and earn a reasonable return for its investors. Canadian pipeline companies may only charge a toll that has first been approved by the CER. This process typically includes review and negotiation of the terms and conditions of pipeline access and the responsibilities of both parties. Tariffs are often based on cost-of-service regulation. As a result, lower throughput can lead to greater tariffs as costs are shared by fewer shippers, or an expansion of a pipeline could lead to higher or lower tariffs depending on the change to throughput and revenue. Aside from cost-of-service regulation, pipelines may also operate under negotiated settlements with the pipeline company and its customers reaching an agreement on tariffs and operational matters, which is then approved by the CER. Most of the major CER-regulated pipelines have operated under negotiated settlements in recent years. For a further overview of pipeline regulation in Canada, see the CER website here.
Valuation
The most common valuation metrics for midstream companies are enterprise value to EBITDA (EV/EBITDA), free cash flow yield, and the dividend discount model. Valuation metrics for MLPs have historically been based on yield or distributable cash flow, but valuation methods for MLPs are evolving as the MLP business model evolves (read more). Price-to-earnings ratios may also be used to value midstream companies, but P/E ratios can sometimes be distorted by the high depreciation expense for EI companies, which may make earnings appear minimal or negative when in reality their cash flows remain stable and growing.
15
Energy InfrastructureInvesting

16
Now that you’re read about the business models, risks, and fundamentals for energy infrastructure, perhaps you have decided that an investment in energy infrastructure is right for you and your portfolio. Now what? The first thing to do is decide how much of your portfolio to allocate to energy infrastructure. Many investors use energy infrastructure in their equity income sleeve, their real asset sleeve, or their energy or equity growth sleeve. In Alerian’s conversations with investors over the years, we’ve seen a typical allocation of 3%-6%, although depending on the portfolio’s objective, we’ve also seen upwards of 10%. It’s important to keep in mind that investments in energy infrastructure come with risks, as do all equity investments.
Buying Individual Securities
For investors willing to do the work of researching individual securities and comfortable with single security risk, direct investment in individual energy infrastructure companies may be an attractive option. Of course, once investors have decided to buy individual securities, there is the question of which one(s) to buy. As an indexing and market intelligence firm, our desire is to equip investors to make informed decisions about energy infrastructure and MLPs. To maintain objectivity, we do not make stock picks, and Alerian employees do not own individual EI/MLP positions. However, after years of following the space, we have these recommendations for investors looking to put together a portfolio of energy infrastructure.
Management Teams – Consider the management team of the corporation. Solid management teams are those that have led the company to build new projects on time and on budget, that have been effective and efficient stewards of investor capital, and who work well together and have excellent relationships with their customers, investors, and other industry stakeholders. They do what they say they will do and have a deep bench of talent.
Asset Footprint – Like Warren Buffet’s moat, those midstream companies which already own land and rights of way in growth areas benefit from their established position by being able to expand their position without excessive political or regulatory headwinds. Additionally, companies which own a variety of assets along the energy value chain can clip multiple coupons along the way while also realizing cost savings from integration. Companies with basin diversity have a natural hedge against changing hydrocarbon flows.
// Energy Infrastructure Investing
Capital Markets Access – Midstream companies need access to capital to build or acquire assets. For these expansion projects and acquisitions to generate a positive return, this capital must come at a cost below the expected return of the asset. Companies with a bigger footprint, greater margin for error8, and lower business risk tend to have better and cheaper access to capital. Likewise, midstream companies with an investment-grade credit rating or access to alternative sources of capital (such as a DRIP or PIPEs) will also have more capital flexibility.
Growth Opportunities – Obviously, all investors would like to own companies that continue to expand their asset footprint. Organic growth projects tend to generate a higher internal rate of return (IRR) than acquisitions, so energy infrastructure companies with a larger backlog of projects relative to their current size are likely to have more visibility to growth.
Financial Metrics – Low leverage ratios and low payout ratios mean greater margins of error in terms of execution risk and during unforeseen macroeconomic issues (including severe weather and commodity price movements).
Size – Larger midstream companies can more easily access the capital markets and are more likely to get investment grade ratings, have higher trading liquidity, and reach a broader investor group. However, it also takes bigger projects, built or acquired, to move the needle for the company’s bottom line.
8 Through lower leverage and lower payout ratios

17
// Energy Infrastructure Investing
The Myriad of Energy Infrastructure Products
For those investors not interested in buying individual midstream securities, a variety of access products are available, many of which include MLPs. MLPs are pass-through structures that do not pay taxes at the entity level. Instead, income and deductions are passed through to the end investor (read more about MLPs). Regulated Investment Companies (RICs) such as mutual funds and Exchanged Traded Funds (ETFs) under the Investment Company Act of 1940 (collectively, “40 Act Funds”) are also pass-through structures. Under current law, 40 Act Funds seeking to retain pass-through status are prohibited from owning more than 25% of their assets in MLPs. Funds that abide by this law are called “RIC-compliant.” Other access products will be entirely C-Corporation focused, containing no MLPs.
There are funds that have more than 25% of their assets in MLPs; however, these funds are no longer pass-through structures and are required to pay taxes at the fund level. Functionally, this means that fund performance is reduced by the amount of taxes accrued (i.e. will be owed when positions are sold). Think of it like your employer withholding a certain portion of income taxes. In this case, the fund withholds (or accrues) a portion of the
returns. Some funds will use leverage to offset some of the effect of taxes. While leverage can increase returns when performance is positive, when performance is negative, leverage will also cause the fund to lose more money. These funds are also able to preserve the return of capital benefit for their investors, and since they can own 100% MLPs, the proportion of income that is classified as return of capital is greater. They tend to be favored by investors seeking to maximize after-tax income.
Some funds are passively managed, where performance is linked to an index or benchmark. These funds tend to have lower fees. An actively managed fund has higher fees to account for the fact that a portfolio manager must be paid to choose individual stocks.

18
40 Act Funds – C corporation taxation – 100% MLPs
A 40 Act Fund, such as a mutual fund or ETF, which owns more than 25% MLPs will be taxed as a C-Corporation. As the underlying positions increase in value, the fund will accrue a deferred tax liability (DTL) to account for taxes that will be owed should the position be sold. This DTL is assessed at the corporate tax rate of 21% plus an assumed rate attributable to state taxes. The DTL is removed from the Net Asset Value (NAV) of the fund, meaning that if the value of the underlying portfolio rises from $100 to $110, the fund’s NAV will move from $100 to $107.9. As the position falls, the DTL will be reduced. When the fund is in a net DTL position, the DTL effectively reduces the volatility of the underlying portfolio, assuming no leverage is employed. If the fund has no DTL to unwind, it will track the underlying portfolio on a one-for-one basis. Fund distributions track the return of capital proportion of the underlying basket of securities and lower an investor’s cost basis.
Advantages:• Owning the underlying securities• Tax character of distributions mirrors that of
underlying portfolio• Fees are taken from the NAV, preserving the yield
Disadvantages:• DTL mutes gains and losses when the fund is in a net
DTL position
Suitability:• Taxable investors seeking after-tax yield
ETFs vs Mutual FundsETFs trade throughout the day; whereas mutual funds price only at the end of the day. However, mutual funds always price at NAV, while ETF prices are determined by the market. ETFs may also be sold short. Typically, ETFs have lower fees, ranging from around 40 bps-100 bps. Mutual funds fees in this category are a bit higher and range from around 70 bps–140 bps. Mutual funds may also use up to 33% leverage.
Closed-End FundsCEFs were the first 100% MLP C-Corporation, 40 Act products. Like mutual funds, they can also use up to 33% leverage. Because CEFs do not have a creation/redemption feature, pricing may stray from NAV, causing them to trade at a premium or discount. Their liquidity is also constrained by the fund itself as opposed to the underlying securities held.
40 Act Funds – RIC Compliant – Less than 25% MLPs
Funds which own less than 25% MLPs do not pay taxes at the fund level, enabling them to pass through the entire return to their investors. The return of capital benefit from owning MLPs is muted due to the limit imposed on MLP ownership. Investors interested in RIC-compliant energy infrastructure funds should research what the fund owns for the other 75%. Common positions include midstream C-Corporations, utility companies, exploration and production companies, refiners, and MLP affiliates structured as C-Corporations.
Advantages:• Ownership of the underlying securities• Little to no tracking error
Disadvantages:• Maximum of 25% of portfolio invested in MLPs• Other 75% performance can meaningfully deviate from
MLP performance• Generally lower yield
Suitability:• Tax-advantaged investors• Total return investors in a taxable account• Investors without exposure to the asset classes in the
other 75%• Investors that prefer broad exposure
As with 40 Act Funds that make a C corporation tax election, RIC compliant 40 Act funds may be mutual funds or ETFs.
// Energy Infrastructure Investing

19
Exchange-Traded Notes (ETNs)
An ETN is an unsecured debt obligation of the issuer. It is an agreement between an investor and an issuing bank under which the bank agrees to pay the investor a return specified in the issuance documents. MLP ETNs may track a basket that is 100% MLPs without accruing for DTLs.
Advantages:• Little to no tracking error as the bank agrees
to pay the return• Intraday knowledge of portfolio holdings• 100% MLP exposure
Disadvantages:• Coupons are taxed at ordinary income rates• Lower income as the expense ratio is removed from
coupon payments• Exposure to the credit risk of the underlying bank
Suitability:• Tax-advantaged accounts such as 401(k)s or IRAs• Total return investors in a taxable account18• Investors comfortable with the credit risk of the
financial institution
Separately Managed Accounts (SMA)
An SMA is an account that is managed by a portfolio manager. An SMA could own both MLPs and corporations without RIC constraints (i.e. MLPs not limited to 25%). If an SMA includes MLPs, it may generate Unrelated Business Taxable Income (UBTI). Once UBTI exceeds $1,000 in an account, additional taxes may be assessed.
Advantages:• Keeps tax characteristic of the underlying investment• Typically lower fees than publicly traded products
Disadvantages:• May generate UBTI• High minimum investment
Suitability:• Large institutions such as pensions and endowments• Very wealthy individual investors
// Energy Infrastructure Investing
9 Section 1260 of the Internal Revenue Code ( http://www.law.cornell.edu/uscode/text/26/1260) contains some ambiguity with regards to ETNs. If constructive ownership rules were to apply, then long-term capital gains could be recharacterized as ordinary income. Accordingly, investors are advised to consult with their tax advisors.

20
// Energy Infrastructure Investing
Active Versus Passive
Although this will vary by investor, the next thing to decide in regards to energy infrastructure investment philosophy is active versus passive management. While this decision is germane to any sector, there are a few things unique to the midstream space. Advocates of passive investing note that over the long term and after factoring in fees, active managers are unable to consistently outperform the index to which they benchmark their performance. Advocates of active investing argue that with extensive research on individual companies, selective investing, and close monitoring of securities, a portfolio manager can generate alpha, or risk-adjusted outperformance versus a benchmark.
Choosing an Active Manager
For those investors who are not comfortable choosing their own securities, but still would like active management, Alerian recommends considering the following factors when selecting an active manager.
History – As stated ad nauseum, past performance is not an indication of future returns. However, the energy infrastructure space is still relatively young. EI market capitalization has increased remarkably since the mid-2000’s. As one can imagine, with the outsized growth of the space leading up to 2014, many money managers entered the midstream space. It is worth looking into the track record of an active manager being considered.
Outperformance – The entire purpose of paying for active management is to outperform the benchmark index after fees. If the active manager is not consistently outperforming the index, or, after fees is underperforming the index, an investor is better served by investing in a passively managed product. Outperformance in a single year may be notable but consider whether the manager has outperformed in previous years and under various market conditions.
Differentiation – An active manager whose portfolio closely mimics an index may be engaging in closet indexing. Investors are encouraged to examine the underlying portfolio to be sure it matches the investment thesis and philosophy of the manager.
Choosing an Indexed Product
As an indexing firm, Alerian constructs and maintains energy infrastructure and MLP indices which it licenses to its partners for the creation of passively managed investment products. We launched the first real-time MLP index in 2006, which has since become the industry standard benchmark, and we continue to work hard to maintain energy infrastructure and MLP indices that meet the most rigorous standards. With that bias in mind, Alerian recommends that investors looking for a passive investment consider the following when researching underlying indices.
Transparency – Passive investors should know what they are buying. The constituents of the underlying index should be available to investors, as should the methodology used to determine those constituents. If a change is to be made, that information should be public as well. Any index that lacks transparency is more like active management than a truly passive investment. A transparent portfolio allows investors to be sure the underlying portfolio matches their investment thesis. Not all EI indices are the same—some are midstream focused, others are focused on income, and others are 100% MLPs.
Objectivity – An index provider may be tempted to include certain EI companies for subjective reasons: a personal investment, a relationship with the management team, or to juice returns on a stock already included in an actively managed fund. For each index, there should be rules in place to prevent personal opinions and emotions from impacting the construction and rebalancing of the index. Having a codified set of rules that is transparent and freely available to the public, as well as prohibiting index committee members from taking positions in individual EI companies in their personal accounts, all help maintain objectivity. Additionally, indexing firms should be careful to avoid conflicts of interest with actively managed investments.

ClassificationStandard
21

22
// Classification Standard
The Energy Midstream Classification Standard is a framework for standardizing the sector classifications of midstream energy infrastructure companies. Midstream companies are categorized by their primary business activity, with an additional delineation by product or customer made for certain activities to account for structural differences in business risk.
Transportation via large-diameter pipeline of crude oil and refined petroleum products.
Super-cooling natural gas and transforming it from a gaseous state into a liquid, which can be shipped overseas.
Transportation via large-diameter pipeline of natural gas and natural gas liquids.
Loading and unloading of liquid hydrocarbons from railcars.
Transportation of hydrocarbons from the wellhead to processing plants, fractionation facilities, and aggregation points for large-diameter pipelines.
Storage of crude oil, refined petroleum products, natural gas, and natural gas liquids in above ground tanks, depleted gas reservoirs, aquifers, and salt caverns.
Pipeline TransportationPetroleum
Liquefaction
Pipeline TransportationNatural Gas
Rail Terminaling
Gathering & Processing Storage

Glossary
23
24
3D Seismic Imaging: a process that uses acoustic energy, similar to sonar, to determine the density and topography of underground rock formations
At the Market: typically in reference to an equity offering where new shares are created and issued at market prices based on demand
Backwardation: the market condition where the price of a forward or futures contract is trading lower than the predicted spotprice
Contango: the market condition where the futures price of a commodity is higher than the expected spot price
Distributable Cash Flow: please see MLP 201 – Understanding MLP Cash Flows and Financial Reporting for a detailed explanation
Horizontal Drilling (Directional Drilling): a drilling technique that involves manipulating a drill bit underground so that it changes direction, please see MLP 201 – Shale Revolution for a detailed explanation
Hydraulic Fracturing: a process in which a mixture of water, sand, and other chemicals is pumped into a well at a very high pressure to break up delicate shale rock, please see MLP 201 – Shale Revolution for a detailed explanation
Hydrocarbons: a general term for crude oil and natural gas, encompassing all organic molecules with a molecular structure containing exclusively carbon and hydrogen atoms
// Glossary
Incentive Distribution Rights: please see MLP 201 – Incentive Distribution Rights for a detailed explanation
Investable Weight Factor: the float, or percent of units available for public trading
Liquefaction: the process in which natural gas is converted from its gaseous state to a liquefied state
Proppant: according to the EPA, “a granular substance such as sand that is used to keep the underground cracks open once the hydraulic fracturing fluid is withdrawn”
Regassification: the process in which liquefied natural gas in converted from its liquid state to its gaseous state
Shale: fine-grained sedimentary rock composed of silt and clay, characterized by its many breakable thin layers. As it relates to energy, hydrocarbons can be found in these layers.
Take-or-pay contract: a contract between a seller and buyer mandating that a buyer must purchase a certain amount of goods or services or pay a penalty
Total Return: price appreciation plus yield
West Texas Intermediate: a grade of crude oil typically extracted from Texas that is commonly used as a pricing benchmark
25
ATM: At the Market
AUM: Assets Under Management CER: Canada Energy Regulator
DCF: Distributable Cash Flow
DOE: Department of Energy
E&P: Exploration and Production
EBITDA: Earnings Before Interest, Taxes, Depreciation and Amortization
EIA: Energy Information Administration
EPA: Environmental Protection Agency
EPS: Earnings Per Share
ETF: Exchange Traded Fund
ETN: Exchange Traded Note
ETP: Exchange Traded Product
FERC: Federal Energy Regulatory Commission
FFO: Funds From Operations
FINRA: Financial Industry Regulatory Authority
IDR: Incentive Distribution Right
IEA: International Energy Agency
IPO: Initial Public Offering
IWF: Investable Weight Factor
// Acronyms
LNG: Liquefied Natural Gas
LPG: Liquefied Petroleum Gas
M&A: Mergers and Acquisitions
MLP: Master Limited Partnership
MQD: Minimum Quarterly Distribution
NAV: Net Asset Value
NGL: Natural Gas Liquid
NGV: Natural Gas Vehicle
NYSE: New York Stock Exchange
PLR: Private Letter Ruling
PPI: Producer Price Index
PTP: Publicly Traded Partnership
PUD: Proved Undeveloped Reserves
REIT: Real Estate Investment Trust
RIA: Registered Investment Advisor
RIC: Regulated Investment Company
SEC: Securities and Exchange Commission
UBTI: Unrelated Business Taxable Income
WTI: West Texas Intermediate
26
C: Hundreds (100)
M: Thousands (1,000)
MM: Millions (1,000,000)
B: Billions (1,000,000,000)
T: Trillions (1,000,000,000,000)
Bbl: Barrel, equal to 42 US Gallons
MBbls: One thousand barrels
MMBbls: One million barrels
MBbls/d: One thousand barrels per day
MMBbls/d: One million barrels per day
Btu: British thermal unit, a measurement of the energy content of natural gas
MBtu: One thousand British thermal units
MMBtu: One million British thermal units
MBtu/d: One thousand British thermal units per day
MMBtu/d: One million British thermal units per day
// Units of Measure
CF: Cubic feet, a volumetric measurement for natural gas at 60 degrees Fahrenheit and 14.73 psi of pressure
CCF: One hundred cubic feet of natural gas
MCF: One thousand cubic feet of natural gas
MMCF: One million cubic feet of natural gas
BCF: One billion cubic feet of natural gas
TCF: One trillion cubic feet of natural gas
CCF/d: One hundred cubic feet of natural gas per day
MCF/d: One thousand cubic feet of natural gas per day
MMCF/d: One million cubic feet of natural gas per day
BCF/d: One billion cubic feet of natural gas per day
TCF/d: One trillion cubic feet of natural gas per day

27
// Disclaimers
[email protected] // 972.957.77003625 N. Hall St., Suite 1200, Dallas, TX 75219
This Document Is Impersonal and Not a Solicitation. In jurisdictions where Alerian or its affiliates do not have the necessary licenses, this document does not constitute an offering of any security, product, or service. Alerian receives compensation in connection with licensing its indices to third parties. All information provided by Alerian in this document is impersonal and not customized to the specific needs of any entity, person, or group of persons. Alerian and its affiliates do not endorse, manage, promote, sell, or sponsor any investment fund or other vehicle that is offered by third parties and that seeks to provide an investment return linked to or based on the returns of any Alerian index.
No Advisory Relationship. Alerian is not an investment advisor, and Alerian and its affiliates make no representation regarding the advisability of investing in any investment fund or other vehicle. This document should not be construed to provide advice of any kind, including, but not limited to, tax and legal.
You Must Make Your Own Investment Decision. It is not possible to invest directly in an index. Index performance does not reflect the deduction of any fees or expenses. Past performance is not a guarantee of future returns. You should not make a decision to invest in any investment fund or other vehicle based on the statements set forth in this document, and are advised to make an investment in any investment fund or other vehicle only after carefully evaluating the risks associated with investment in the investment fund, as detailed in the offering memorandum or similar document prepared by or on behalf of the issuer. This document does not contain, and does not purport to contain, the level of detail necessary to give sufficient basis to an investment decision. The addition, removal, or inclusion of a security in any Alerian index is not a recommendation to buy, sell, or hold that security, nor is it investment advice.
No Warranties. The accuracy and/or completeness of any Alerian index, any data included therein, or any data from which it is based is not guaranteed by Alerian, and it shall have no liability for any errors, omissions, or interruptions therein. Alerian makes no warranties, express or implied, as to results to be obtained from use of information provided by Alerian and used in this service, and Alerian expressly disclaims all warranties of suitability with respect thereto.
Limitation of Liability. While Alerian believes that the information provided in this document is reliable, Alerian shall not be liable for any claims or losses of any nature in connection with the use of the information in this document, including but not limited to, lost profits or punitive or consequential damages, even if Alerian has been advised of the possibility of same.
Research May Not Be Current. This document has been prepared solely for informational purposes based on information generally available to the public from sources believed to be reliable. Alerian makes no representation as to the accuracy or completeness of this document, the content of which may change without notice. Alerian expressly disclaims any obligation to update the contents of this document to reflect developments in the energy Master Limited Partnership sector. The methodology involves rebalancings and maintenance of indices that are made periodically throughout the year and may not, therefore, reflect real-time information.
Linked Products. Alerian licensees its indexes to third parties for the creation of investment funds or other vehicles. Alerian is not responsible for the information on these websites or for anything that they provide.
Policies and Procedures. Analytic services and products provided by Alerian are the result of separate activities designed to preserve the independence and objectivity of each analytic process. Alerian has established policies and procedures to maintain the confidentiality of material non-public information received during each analytic process. Alerian and its affiliates provide a wide range of services to, or relating to, many organizations, and may receive fees or other economic benefits from these organizations.
Copyright. No Unauthorized Redistribution. Alerian © 2020. All rights reserved. This document, in whole or in part, may not be redistributed, reproduced, and/or photocopied without prior written permission.