energy management and information systems (emis) · energy management and information systems...
TRANSCRIPT

Energy Management and Information Systems (EMIS)
January 8, 2015
Jessica Granderson Deputy Head, Building Technology and Urban Systems
Department 1

• Definitions, motivation, LBNL work in EMIS • Common questions about EMIS use, and associated
LBNL resources • Questions, discussion
2
Outline

EMIS Comprise a Family of Technologies
3
Whole Building Level EMIS
Benchmarking and Monthly Utility Bill Analysis
Energy Information System
Advanced EIS
System Level EMIS
Building Automation System
Fault Detection and Diagnostics
Automated System Optimization

EMIS Examples
Building automation system (BAS)
Fault Detection and Diagnostics
Benchmarking and Monthly Utility Bill
Analysis
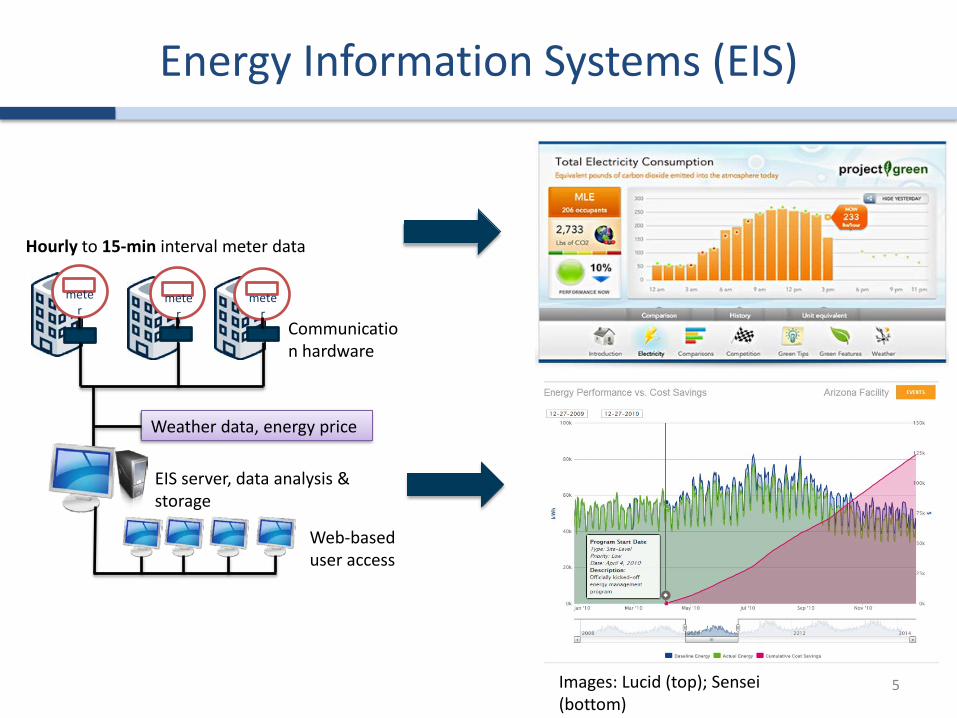
Energy Information Systems (EIS)
5
Hourly to 15-min interval meter data
meter
meter
meter
Communication hardware
EIS server, data analysis & storage
Web-based user access
Weather data, energy price
Images: Lucid (top); Sensei (bottom)

Motivating Context for EMIS
• Utility bills alone are insufficient to manage building energy use • Building performance is not typically monitored and tracked • Enormous savings are missed, efficiency is not maintained over
time
6

What is Compelling About EMIS?
• Continuous visualization and analysis of interval meter data
enables – Site energy savings up to 20% through operational measures – Persistence in efficient performance
• EMIS tools are beginning to offer automated measurement
and verification capability
• The same technology that drives the savings can be used to verify the savings
7
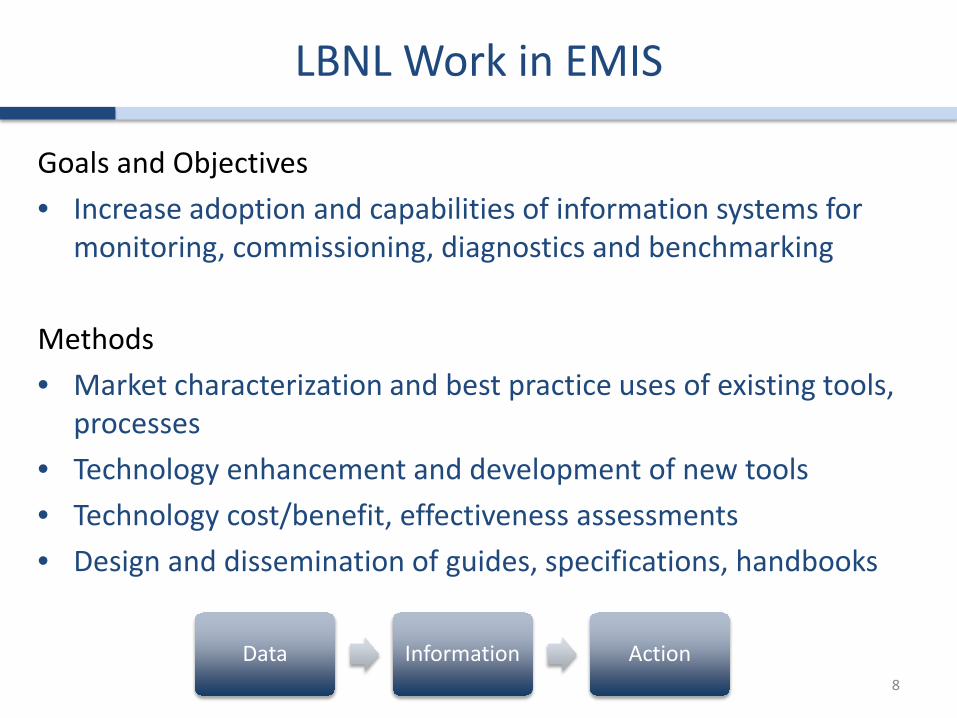
LBNL Work in EMIS
Goals and Objectives • Increase adoption and capabilities of information systems for
monitoring, commissioning, diagnostics and benchmarking Methods • Market characterization and best practice uses of existing tools,
processes • Technology enhancement and development of new tools • Technology cost/benefit, effectiveness assessments • Design and dissemination of guides, specifications, handbooks
8
Data Information Action

9
Common Questions About EMIS Use, and Associated LBNL Resources
10

1. How Do I Distinguish One EMIS Offering From Another?
• Fault detection and diagnostics, energy analytics, energy management system, optimization system
• Vendor websites look the same, many claim savings of 20%, features sound the same
11
• Real time performance reports • Trend analysis • Carbon footprints • Automated alerting • Tailored information displays • Configurable events/alarms
• KPI reporting • Load prediction • Baselining • Whole-bldg anomaly detection • ECM identification • Dashboard views • x-y plotting • Highly configurable •Eminently extensible

EMIS Terminology/Characterization Framework
12 Other attributes include “AKA” names used in the industry, representative examples
of commercial offerings

2. Now That I Have Data, What Do I Do With It?
2011 Energy Information Handbook • Purpose: instructional resource detailing energy
and performance monitoring methods for commercial buildings
• Audience those with little experience in the use of data
– Secondary: software developers and service providers, control companies
• Relevant technologies: spectrum of performance monitoring tools
13
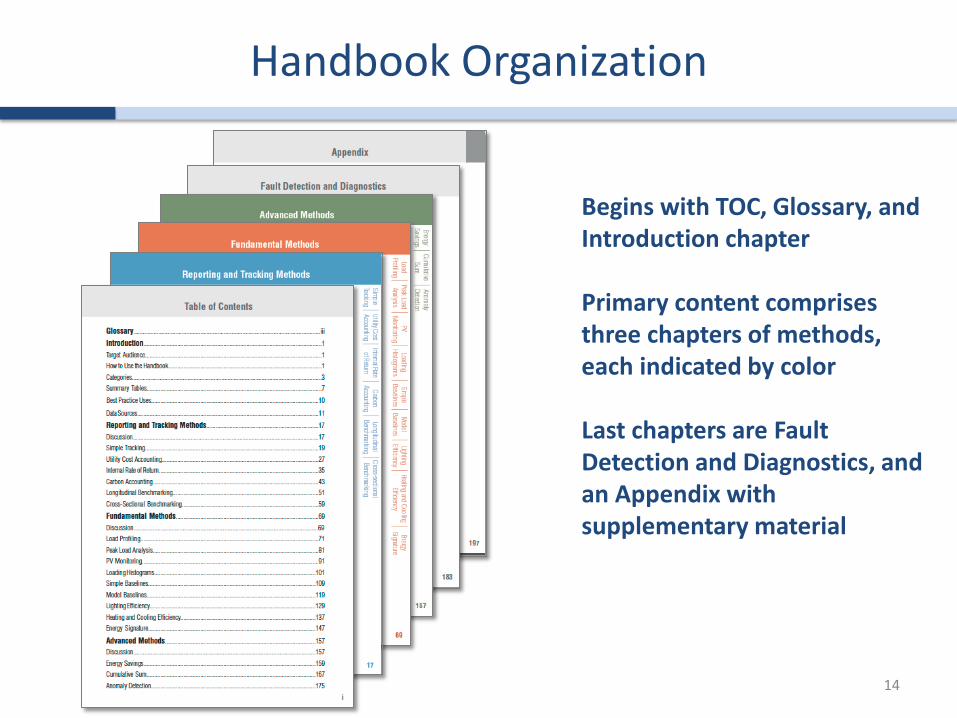
Handbook Organization
14
Begins with TOC, Glossary, and Introduction chapter Primary content comprises three chapters of methods, each indicated by color Last chapters are Fault Detection and Diagnostics, and an Appendix with supplementary material

List and Grouping of Analysis Methods
15
18 analysis methods grouped into three chapters based on shared characteristics Organized from simpler to more technically complex

Summary Tables
16
At-a-glance summary tables to help reader identify useful methods given data availability, systems of interest, level of expertise
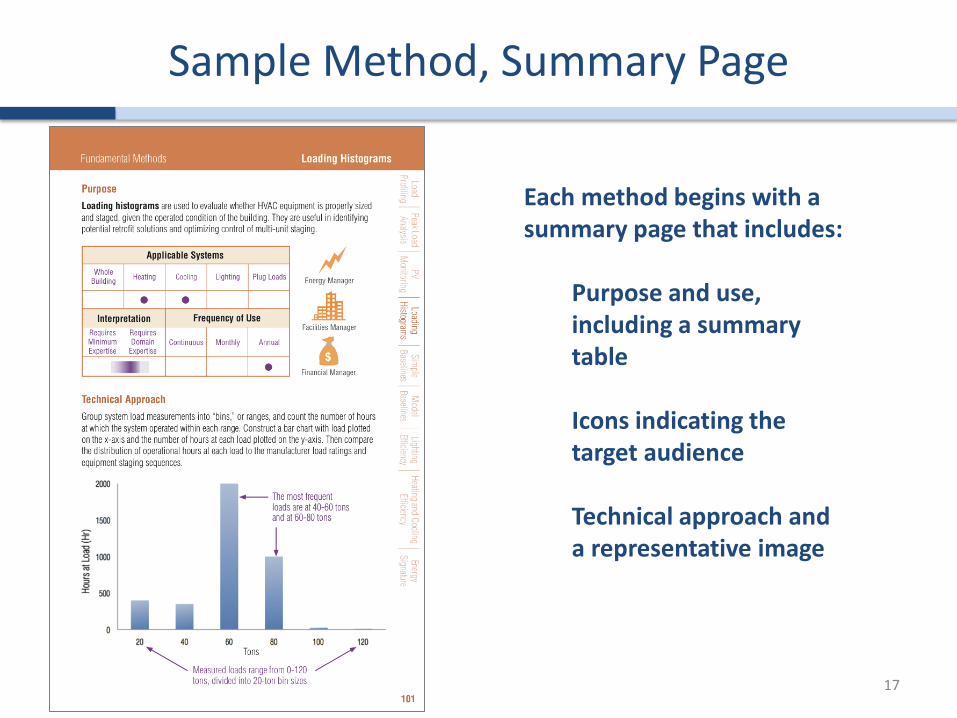
Sample Method, Summary Page
17
Each method begins with a summary page that includes:
Purpose and use, including a summary table
Icons indicating the target audience
Technical approach and a representative image

Sample Method, Related Methods
18
Following the summary page, related methods are presented:
Shading and highlighting to indicate relationships with other methods in handbook
Description of the relationship in short paragraph and call outs

Sample Method, Calculation and programming
19
A page dedicated to calculation and programming:
State of commercialization
Required data
Step-by-step instructional numeric example

Sample Method, Notes and Sketches
20
Following computation, a page for notes and sketches

Sample Method, Application Examples
21
Wherever possible, real-world examples of how method can be applied:
Description of how method output is interpreted, rules of thumb
Heavily annotated to support reader interpret data, draw conclusions 3-5 examples per method, illustrating different investigations/questions and energy saving benefits of use

3. What References Might Answer My Questions About Monitoring and Analysis?
22
‘Cliff’s Notes’ synthesis of ~40 existing guides, handbooks, case studies, specifications
22
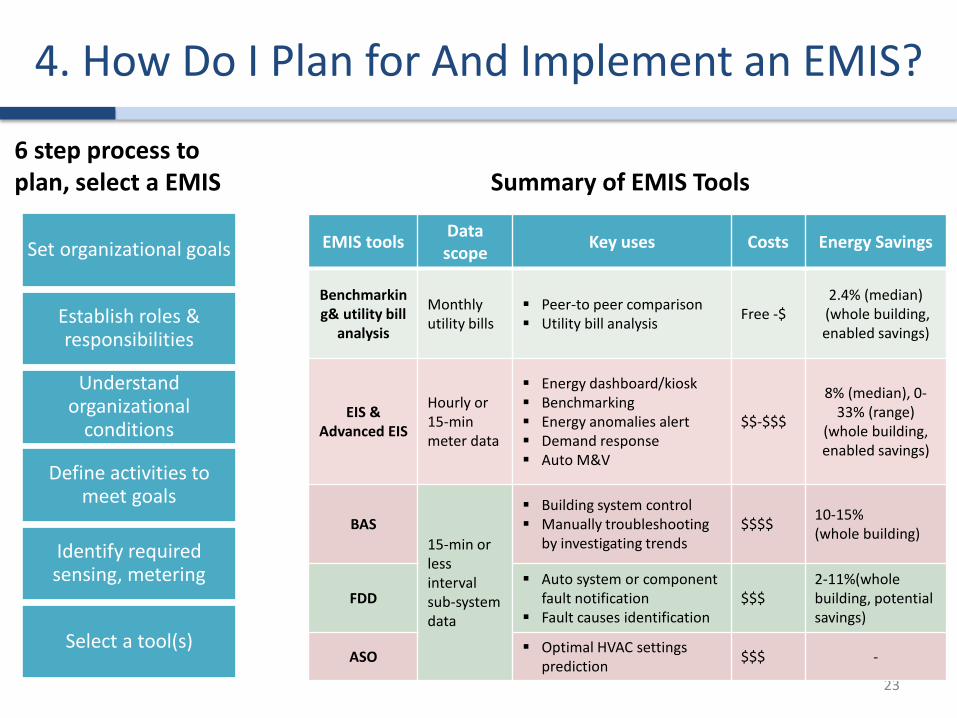
4. How Do I Plan for And Implement an EMIS?
23
Set organizational goals
Establish roles & responsibilities
Understand organizational
conditions
Define activities to meet goals
Identify required sensing, metering
Select a tool(s)
6 step process to plan, select a EMIS
EMIS tools Data scope Key uses Costs Energy Savings
Benchmarking& utility bill
analysis
Monthly utility bills
Peer-to peer comparison Utility bill analysis Free -$
2.4% (median) (whole building, enabled savings)
EIS & Advanced EIS
Hourly or 15-min meter data
Energy dashboard/kiosk Benchmarking Energy anomalies alert Demand response Auto M&V
$$-$$$
8% (median), 0-33% (range)
(whole building, enabled savings)
BAS 15-min or less interval sub-system data
Building system control Manually troubleshooting
by investigating trends $$$$ 10-15%
(whole building)
FDD Auto system or component
fault notification Fault causes identification
$$$ 2-11%(whole building, potential savings)
ASO Optimal HVAC settings prediction $$$ -
Summary of EMIS Tools
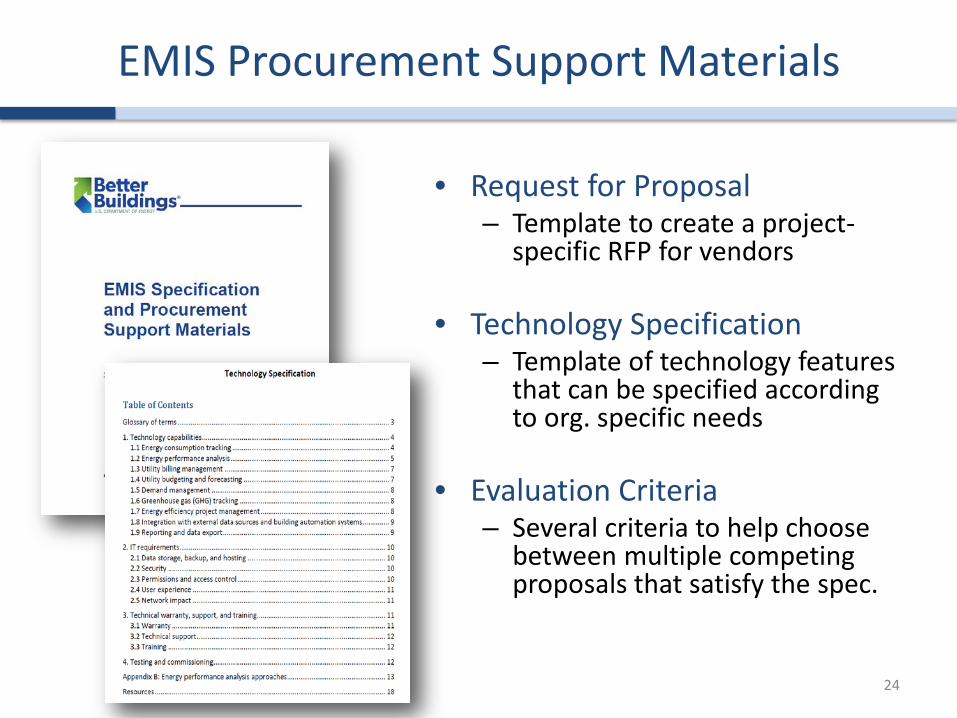
EMIS Procurement Support Materials
24
• Request for Proposal – Template to create a project-
specific RFP for vendors
• Technology Specification – Template of technology features
that can be specified according to org. specific needs
• Evaluation Criteria – Several criteria to help choose
between multiple competing proposals that satisfy the spec.

5. What Do EIS Cost, and What do They Save?
Synthesized case investigations to identify as-implemented costs, over-time energy savings, best
practices, factors associated with larger savings
25
26 participating organizations, 260M sf install base, 17 unique EIS

EIS Costs Reported by Study Participants
26
Median 5-yr cost of ownership = $150K, 1800$/pt, .06$/sf
• Note the wide distribution of costs paid by study participants • Some economies of scale with size of implementation
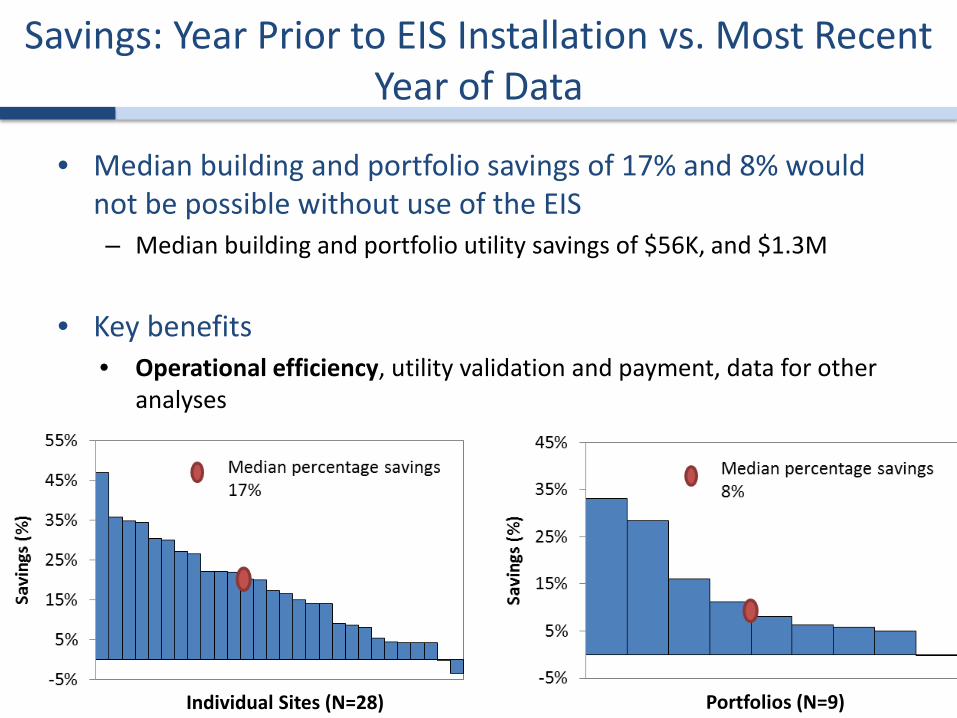
Savings: Year Prior to EIS Installation vs. Most Recent Year of Data
• Median building and portfolio savings of 17% and 8% would not be possible without use of the EIS – Median building and portfolio utility savings of $56K, and $1.3M
• Key benefits • Operational efficiency, utility validation and payment, data for other
analyses
27 Individual Sites (N=28) Portfolios (N=9)

Key Factors and Best Practices
• Initial EUI, extent of efficiency projects, depth of metering, and total years of installation correlated with higher savings – EIS rarely if ever implemented as sole strategy – All but two participants reported savings could not have been
achieved without the EIS – Those with less aggressive efficiency projects still saved 5%
• Best practices
– Installation of submetering, beyond whole-building level – Load profiling on a regular basis – Use of automated energy anomaly detection features – Monitoring peak load and managing demand charges – With regular usage over time, savings can accrue and deepen
28

Examples of EIS Uses
29

Examples of EIS Uses
30
Examples of EIS Uses
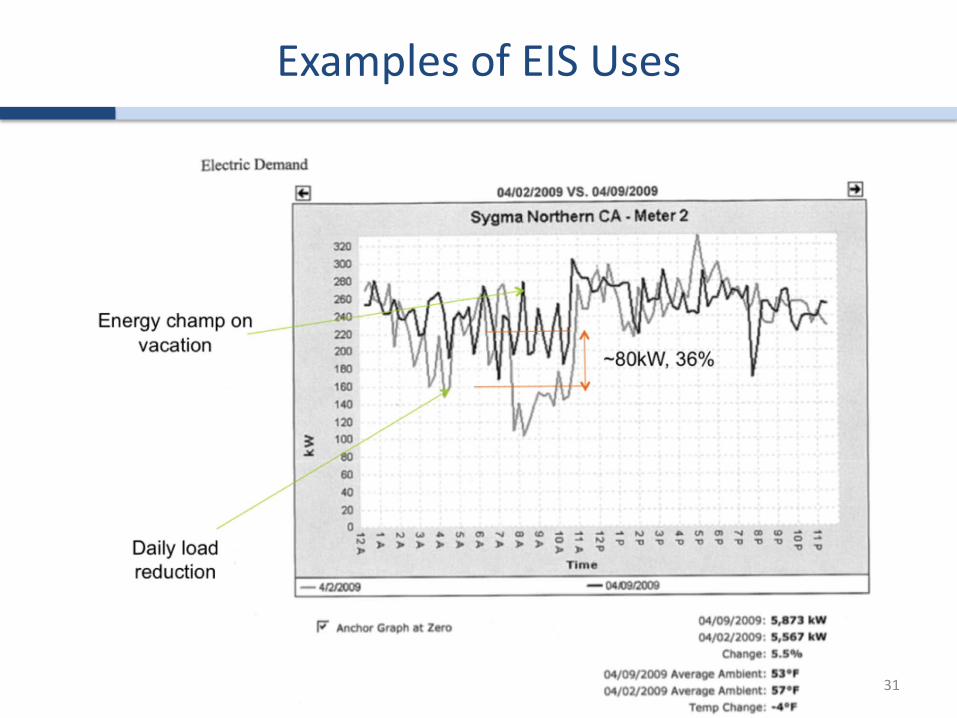
31

Examples of EIS Uses
32

Examples of EIS Uses
33

Examples of EIS Uses
34

6. How Can I Use EMIS to Verify Energy Savings?
Automated M&V is beginning to be offered in energy management and information systems
Baselines are automatically created using historic interval meter data (system level or whole-building) and weather data feeds
Regression, NN, Bin models most common
35
User enters the date of ECM implementation, savings automatically calculated
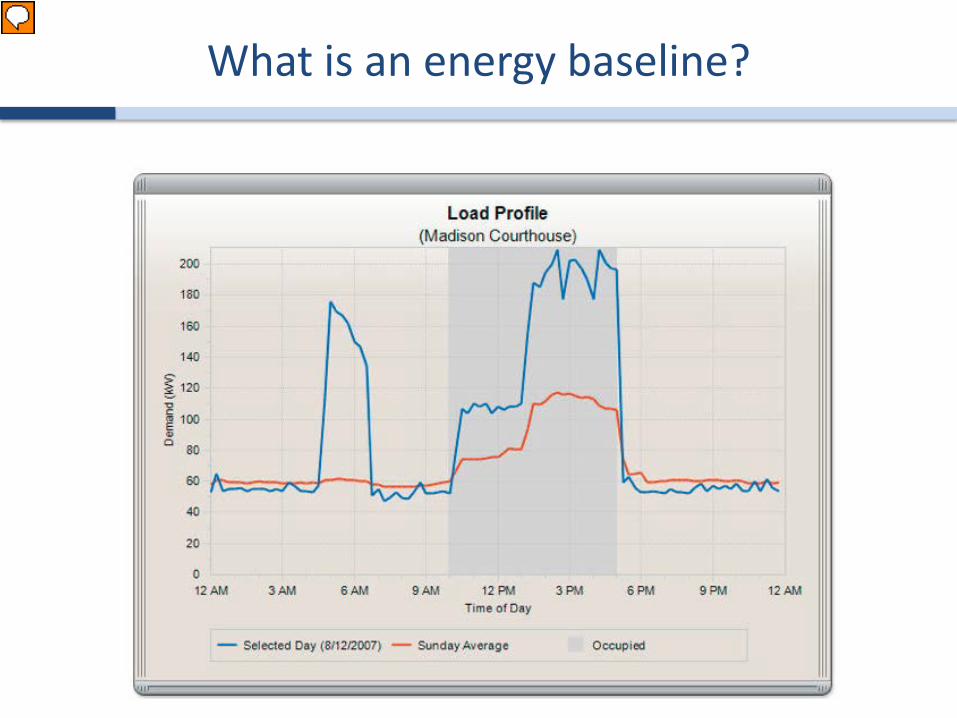
What is an energy baseline?
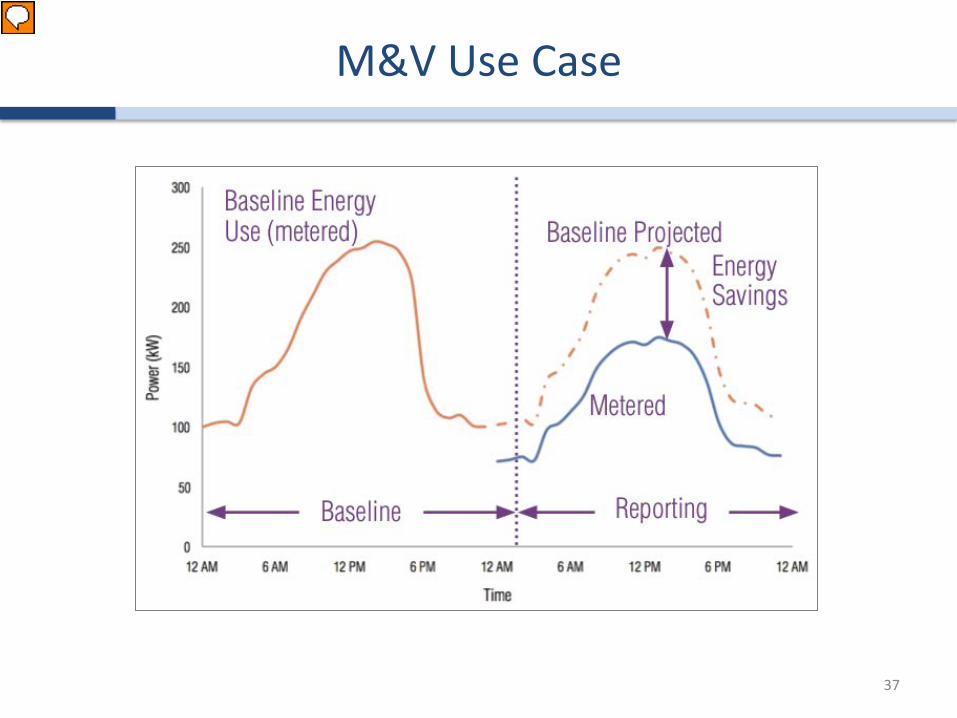
M&V Use Case
37
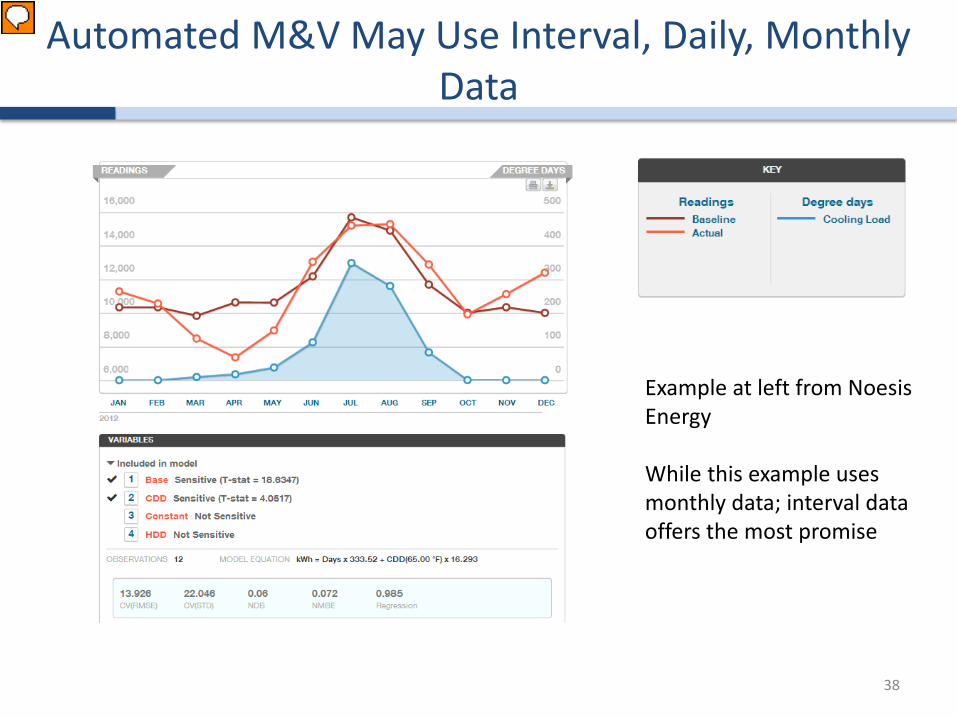
Automated M&V May Use Interval, Daily, Monthly Data
38
Example at left from Noesis Energy While this example uses monthly data; interval data offers the most promise

The Energy Baselines in EMIS Serve Many Purposes
39
Energy baseline
M&V
Cost savings
Detect waste in real time
Near future load
forecasting
Benchmarking
Quantifying load shed (DR)
Where Can You Access These Resources?
Visit: eis.lbl.gov Contact: Jessica Granderson [email protected]
40

Questions?
41