energy market outlook and industry trends … · 2013‐2038 energy market outlook and industry...
TRANSCRIPT

2013‐2038 ENERGY MARKET OUTLOOK AND INDUSTRY TRENDS
MYRON ROLLINS AND ANN DONNELLYFLORIDA GAS UTILITY ANNUAL MEETING

This report was prepared for Client by Black & Veatch Corporation (“B&V”) and is largely based on information not within the control of B&V As such B&V has not made an analysis verified orinformation not within the control of B&V. As such, B&V has not made an analysis, verified, or rendered an independent judgment of the validity of the information provided by others, and, therefore, B&V does not guarantee the accuracy thereof.
In conducting our analysis and in forming an opinion of the projection of future operations summarized in this report, B&V has made certain assumptions with respect to conditions, events, and circumstances that may occur in the future. The methodologies we utilize in performing the y g p ganalysis and making these projections follow generally accepted industry practices. While we believe that such assumptions and methodologies as summarized in this report are reasonable and appropriate for the purpose for which they are used; depending upon conditions, events, and circumstances that actually occur but are unknown at this time, actual results may materially differ from those projected.
U f thi t i f ti t i d th i h ll tit t th ’ i dUse of this report, or any information contained therein, shall constitute the user’s waiver and release of B&V and Client from and against all claims and liability, including, but not limited to, any liability for special, incidental, indirect or consequential damages, in connection with such use. In addition, use of this report or any information contained therein shall constitute an agreement by the user to defend and indemnify B&V and Client from and against any claims and liability, including, but not limited to, liability for special, incidental, indirect or consequential damages, in connection with such use. To the fullest extent permitted by law, such waiver and release, and indemnificationwith such use. To the fullest extent permitted by law, such waiver and release, and indemnification shall apply notwithstanding the negligence, strict liability, fault, or breach of warranty or contract of B&V or Client. The benefit of such releases, waivers or limitations of liability shall extend to B&V and Client’s related companies, and subcontractors, and the directors, officers, partners, employees, and agents of all released or indemnified parties. USE OF THIS REPORT SHALL CONSTITUTE AGREEMENT BY THE USER THAT ITS RIGHTS, IF ANY, IN RELATION TO THIS REPORT SHALL NOT EXCEED, OR BE IN ADDITION TO, THE RIGHTS OF THE CLIENT.
Readers of this report are advised that any projected or forecasted financial, operating, growth, performance, or strategy merely reflects the reasonable judgment of B&V at the time of the preparation of such information and is based on a number of factors and circumstances beyond our control. Accordingly, B&V makes no assurances that the projections or forecasts will be consistent with actual results or performance. To better reflect more current trends and reduce to chance of forecast error we recommend that periodic updates of the forecasts contained in this report be
2
forecast error, we recommend that periodic updates of the forecasts contained in this report be conducted so more recent historical trends can be recognized and taken into account.
Anyuseofthisreport,andtheinformationtherein,constitutesagreementthat:(i)B&Vmakesnowarranty,expressorimplied,relatingtothisreport,(ii)theuseracceptsthesoleriskofanysuchuse,and(iii)theuserwaivesanyclaimfordamagesofanykindagainstB&V.

AGENDA
ABOUT THE EMPPOWER SECTOR PROJECTIONSPROJECTIONSFUEL MARKET PROJECTIONS
3

ABOUT THE BLACK & VEATCH ENERGY MARKET PERSPECTIVE
EMP North American Market Coverage
The Black & Veatch Energy Market Perspective is prepared every six months to providemonths to provide B&V clients with a fresh and insightful assessment of the current state of North American energy markets, and a Base Case long term view of how those markets may functionmay function.
TheB&VEnergyMarketPerspectiveisavailableasaNationalServiceorasoneormoreRegionalServices:Western,Texas(ERCOT),Northeast,MidwestandSoutheast 4

ABOUT THE ENERGY MARKETABOUT THE ENERGY MARKET PERSPECTIVE (EMP)
• Subscription‐based service
• Uses proprietary Integrated Market Modeling processModeling process
• 25‐year projections (2013 – 2038)
• Covers 5 regions of North America• Covers 5 regions of North America
TheEMPfeaturesanalyticalneutralityanddoesnotadvocatecertaintechnologiesoragendas 5

POWER SECTOR PROJECTIONS
6

SOUTHEAST AND FLORIDA AT A GLANCE• Florida Reliability
Coordinating Council (FRCC) and SERC Reliability C ti (SERC)
SOUTHEAST AND FLORIDA AT A GLANCE
Corporation (SERC) reliability regions minus the portions of SERC in the Midwest ISO (MISO) and in PJM.
• Geography: All or most of Florida, Arkansas, Louisiana, Mississippi, Alabama, Georgia, Tennessee, North Carolina, South Carolina and parts of Missouri Kentuckyparts of Missouri, Kentucky and Texas
• Reliability region: Southeastern Electric Reliability Council (SERC) and Florida Reliability Coordinating Council (FRCC)
• Market Hubs: Entergy, Southern, TVA , Central
7

KEY ISSUES AND ASSUMPTIONS THATKEY ISSUES AND ASSUMPTIONS THAT INFLUENCE THE BASELINE PERSPECTIVE
• Generation expansion plans
• Transmission
• Regulation
• RPS requirements and response
infrastructure
• Unit retirements
p
• Power demand and conservation
• Supply and pipeline expansion plan
• Finding and development
• Fuel demand and pricing
• LNG imports / exports
F t t ti t d g a d de e op e tcosts• Future construction costs
Integratesprimaryresearch,leadingdatasourcesandclientconsultingexperience 8

COMPLIANCE PLANNING & DEADLINES

BLACK & VEATCH BASELINE GHG FORECAST–BLACK & VEATCH BASELINE GHG FORECASTCHANGES FROM MID‐YEAR EMP
1010

COMPARATIVE TECHNOLOGY COSTSCOMPARATIVE TECHNOLOGY COSTS
Assumptions: Capital costs are national average values and will vary widely by region and site.Coal assumes an average delivered price of $1.50/MMBtu.
Source: Black & Veatch Energy Market Perspective Analysis1111

COAL UNIT RETIREMENTSCOAL UNIT RETIREMENTS FORECAST REMAINS UNCHANGED AT 61.7GW BY 2020• Black & Veatch expects a wave of retirement of smaller, older coal‐fired assets by 2020
• Forecasted retirements driven primarily by EPA hazardous air pollutant requirements and projected natural gas prices
• Forecast does not include retirements from potential future GHG emissionfrom potential future GHG emission regulations
S Bl k & V t h
Black&Veatchforecastsadditional63GWofcoal‐fueledgeneratorretirementsby2037 12
Source: Black & Veatch

IN THE SE REGION, COAL UNITS TOTALING 17 GW ,ARE EXPECTED TO RETIRE THROUGH 2020
•17,897 MW of cumulative capacity iscumulative capacity is retired through 2020• Coal – 17,062 MW• CT – 638 MW• Other – 197 MW
S b t ti l l• Substantial coal retirements due to the EPA MATS Rule by 2016
•After 2030, many of the coal fired generatorscoal fired generators built in the 1960s and 1970s reach their assumed life of 65 years and are retired
• In addition, nuclear units have used the extensions on their operating licenses and
istart to retire
Source:Black&Veatch1. CapacityislistedasNetDependableCapacity2. Thermal‐ OtherunitsincludeSteamOilandGas,andnon‐gasCombustionTurbine. 13

NATURAL GAS‐FUELEDNATURAL GAS FUELED GENERATION WILL CONTINUE TO GROW• Power sector demand for gas expected to grow 2% annually
• More than 390 000 MW of new capacity• More than 390,000 MW of new capacity is expected before 2037 – a nearly 27% increase from previous forecast
• Technology advances in combined cycle with advances in combustion turbine technology
Emporia Energy Center ‐ Kansas
Source: Black & Veatch
Coalretirementsanddeclineinregionalreservemarginswilldrivecontinuedcapacitygrowth 14

ECONOMY GAS PRICES SLOWECONOMY, GAS PRICES SLOW NUCLEAR DEVELOPMENT
• Expect deferrals and cancellations of new units to continue
• Utilities will work to get the most of• Utilities will work to get the most of existing units with up‐rates
• Uncertainty regarding Fukushima “lessons learned” will diminish
• Over the next 25 years, B&V forecasts a decline in nuclear resources
Refueling Nuclear Reactor
decline in nuclear resources
Source: Black & Veatch
Inthenear‐term,budgetdeficitandwastedisposalconcernslimitfederalloanguaranteeprograms 15

RENEWABLE ENERGY GROWTHRENEWABLE ENERGY GROWTH WILL CONTINUE
• In the short term, the status of tax incentives for wind looms in the political arena
• ~115,000 MW of new capacity additions anticipated by 2037
• Wind will make up majority of new capacity additions
• Solar capacity expected to grow as aLopburi 55 MW Solar Farm ‐ Thailand
• Solar capacity expected to grow as a result of technology advances
Source: Black & Veatch
RenewablecapacityadditionsaredrivenbystateRenewablePortfolioStandardsrequirements 16

SOUTHEAST ‐ AS GAS RESOURCES INCREASE GAS GENERATION BECOMES THE DOMINANT SOURCE OF ENERGY• In addition to the much higher capacity mixInadditiontothemuchhighercapacitymix
ofgas,thegenerationproducedbygasincreasesdramaticallyduetothehighefficiencyofthenewgeneration.
17

NATURAL GAS GENERATION CONTINUES TO STAY STRONG THROUGH 2037 IN FLORIDA • Inadditiontothemuchhighercapacitymix
of gas the generation produced by gasofgas,thegenerationproducedbygasincreasesdramaticallyduetothehighefficiencyofthenewgeneration.
Source:Black&Veatch1. CapacityislistedasNetDependableCapacity2. Windreceives13%capacitycreditinFlorida3. Thermal– OtherincludesSteamOilandGas,andnon‐gasCombustionTurbine
18

FUEL MARKETS PROJECTIONS
19

GAS PRICES SHOW A STEADY INCREASE THROUGHOUT THE STUDY PERIOD
• The Southeast Energy Market Perspective isMarket Perspective is comprised of 4 distinct zonal pricing points for electricity:1. Central (TVA)2. Southern3 Carolinas3. Carolinas4. Florida
• Locations within each zone are assigned to a corresponding natural gascorresponding natural gas delivery point such as Transco Z4, Transco Z5, Leach, and Florida Gates
• Gas prices rise throughout the study period to reflect the expected increase in demand for natural gas as coal generation is expected to be replaced by natural gasto be replaced by natural gas based generation in the short run. Source: Black & Veatch
20

US NATURAL GAS DEMAND FORECAST BY SECTOR (EOY 2012)
Residential Commercial Industrial Electric Gen0.45% 0.60% 0.54% 2.39%
Projected 2013‐2037 Compound Annual Growth Rate
21

BASE CASE FLORIDA NATURAL GAS DEMAND FORECAST BY SECTOR (EOY 2012)
22
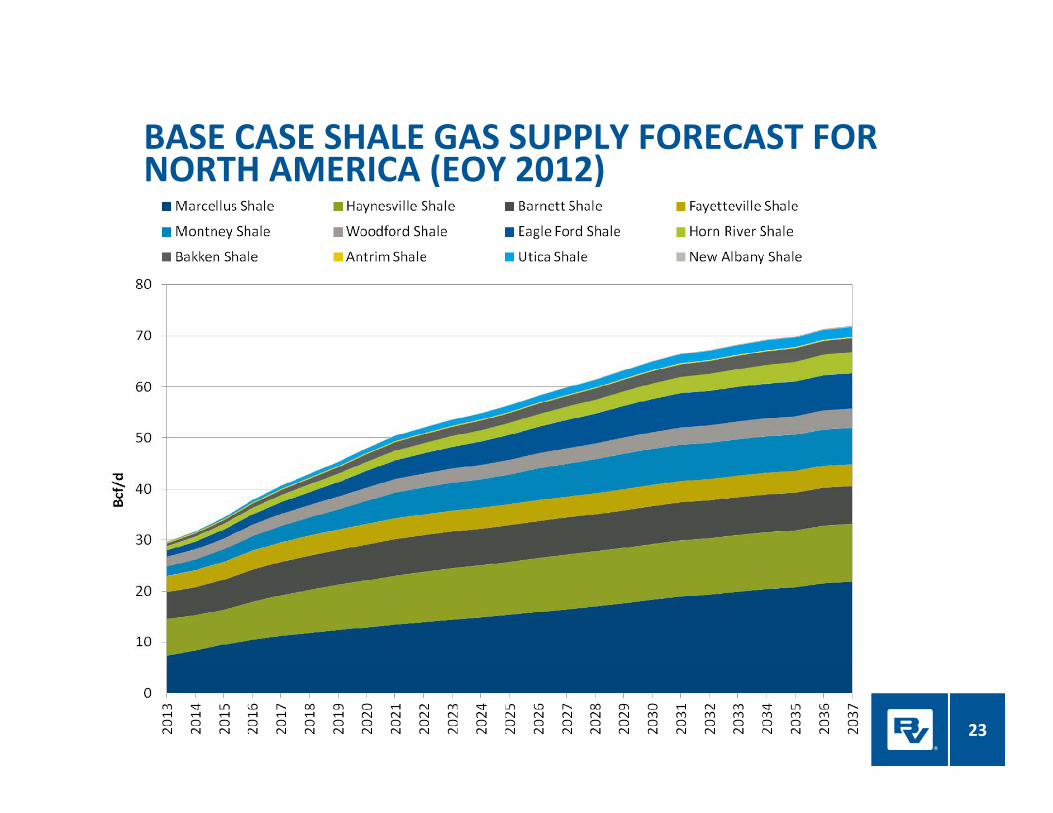
BASE CASE SHALE GAS SUPPLY FORECAST FOR NORTH AMERICA (EOY 2012)
23

EOY 2012 BASE CASE FORECAST ‐ NATURAL GAS SUPPLY TO FLORIDA
24

SIGNIFICANCE OF CRUDE OIL AND NGLSIGNIFICANCE OF CRUDE OIL AND NGL MARKETS TO THE POWER MARKET
• These liquid fuels have a significant impact on the power markets• The net revenue credits in the liquids rich gas basins q gare based upon oil and NGL prices
• The resulting incremental gas production establishes the volume and rate of flow into the various North American gas market centers
• These flows establish gas price basis differentials• Such gas price differentials are reflected in power• Such gas price differentials are reflected in power market price differentials
25

THE BRENT‐WTI DIFFERENTIAL WILL NARROW AS PIPELINE AND RAIL CAPACITY IS ADDED TO COASTAL
B&V End Of Year 2012 WTI Price Forecast B&V End Of Year 2012 Brent Price Forecast
EIA AEO 2012 Reference Oil Price*
PIPELINE AND RAIL CAPACITY IS ADDED TO COASTAL EXPORT POINTS
$140
$160
$100
$120
2$)
$60
$80
$/bb
l (20
12
• EIA’s forecast, released in early 2012, is illustrative of the price uncertainty caused by increases in domestic oil supplies in 2012
• B&V has lowered its WTI forecast from mid‐year 2012 due to supply
$20
$40
• B&V has lowered its WTI forecast from mid‐year 2012 due to supply surplus from North American and Mid‐East production as well as a continued global economic downturn
$0
$
2013 2015 2017 2019 2021 2023 2025 2027 2029 2031 2033 2035
*EIA AEO 2012 Reference Case is for Low Sulfur Light Oil
26

NGL PRICES WILL RISE IN RESPONSE TO GROWTH IN
EOY 2012 EMP Mont Belvieu NGL Prices
B&V Ethane B&V Propane B&V nButane B&V iButane B&V Pentanes Plus
DOMESTIC DEMAND AND EXPORTS
250
300p
200
n (201
2$)
100
150
cents /
gallon
50
100
• Incremental domestic demand is expected from sources
02013 2015 2017 2019 2021 2023 2025 2027 2029 2031 2033 2035
such as ethylene and fertilizer plants• Exports of propane, butane, and ethylene are expected
27

LIQUIDS RICH SHALE AND TIGHT QSANDSTONE/CARBONATE PRODUCTION REGIONS
2.0 – 6.0 GPMNiobrara
GPM = NGL gallons per Mcf
Source: Company websites, investor reports, B&V Research28

THE OUTLOOK FOR COAL IS CHALLENGINGTHE OUTLOOK FOR COAL IS CHALLENGING FOR COAL PRODUCERS AND END USERS
• Power generators’ switching from coal to lower priced gas continues to diminish coal ‘s market share and challenge utilities with long-term coal contracts
Black & Veatch coal analytics partner John T Boyd Co analysis• Black & Veatch coal analytics partner John T. Boyd Co. analysis of fundamentals:• Underground mining in the eastern US transitioning to thinner
seams and more challenging geological conditions, reducing productivity and coal recovery
• Surface mining in the eastern US suffers from permitting issues and new regulationsAs demand falls profitability declines as fixed costs are spread over• As demand falls, profitability declines as fixed costs are spread over fewer tons
• Many Central Appalachian producers were losing money at prevailing coal prices in 2012
29

US COAL BASINS ARE EVOLVINGUS COAL BASINS ARE EVOLVING (SOURCE: JOHN T. BOYD COALVISION)
Central Appalachian (CAPP)• Thermal coal demand will fall from 169 MM tons in 2007 to 56 MM tons in
2020• As scrubbers are installed, Illinois Basin and Northern Appalachian coals are pp
replacing CAPP all or in part. • CAPP destined to primarily serve metallurgical coal markets both domestically
and abroad.Powder River Basin (PRB)( )
• A logical replacement for low sulfur CAPP• In the absence of CSAPR, coal sulfur content is not a priority – hence limited PRB
growth.• Expansion beyond current borders is unlikely as PRB already has had a large p y y y g
presence in the Southeast• Coal demand in Southeast is waning• Numerous planned coal unit retirements in Southeast • Southeast has seen largest coal-to-gas switchingg g g
30

COAL PRICES REMAIN LESS VOLATILE COMPARED TO NATURAL GAS PRICES
• B&V uses John T.Boyd as our coal consultant andour coal consultant, and they deliver plant level coal forecasts which are used in our power models
• These coal prices are delivered to our PROMOD regions, not at the producing basins
• Coal forecasts stay relatively flat due to the balance between coal retirements and a rise in consumption due toconsumption due to increased natural gas and power prices
Source: Black & Veatch and John T. Boyd Co.
31

AVERAGE ANNUAL COAL PRICES DELIVERED TO CENTRALAVERAGE ANNUAL COAL PRICES DELIVERED TO CENTRAL FLORIDA (2013$) (SOURCE: JOHN T. BOYD CO.)
This forecast averages contract pricesAnd transportation components knownFor several coal plants in Central Florida
32

WHAT HAS CHANGED IN OUR LATEST GAS FORECAST?
• Our MidYear 2013 Henry Hub price is lower than EOY 2012 post 2025 by $0.50
WHAT HAS CHANGED IN OUR LATEST GAS FORECAST? MIDYEAR 2013 COMPARED WITH EOY 2012
to $1.00 per MMBtu due to more abundant gas production from shale oil and gas basins as well as from conventional fields such as Permian• We adjusted supply curves for major production basins that include shale and
conventional gas, focusing on the impact of tight oil with associated gas, and liquids rich tight gas more gas supplyrich tight gas – more gas supply
• We made adjustments for revenue credits in the Rocky Mountain liquids fairway and its southern extension into the Permian and Maverick basins of West Texas and in the Appalachian basin (Marcellus and Utica) – more gas supply
G d d i hi h hi h t t l d d b 5 t 10 B f/d i th l t• Gas demand remains high ‐ higher total demand by 5 to 10 Bcf/d in these later years, but not enough to raise gas prices from EOY 2012 forecast
• More LNG export demand than for previous forecast but this demand is counteracted by more supply; positive developments for LNG exports • FERC approvals for non FTA countries• Investment in U.S. LNG export projects• Strong interest in long‐term contracts by customers such as Japan• Events in Alaska increasing likelihood of LNG export from Alaska• Events in Alaska increasing likelihood of LNG export from Alaska
33

MID‐YEAR 2013 NATURAL GAS PRICE
Historical (Nominal) B&V Projection (Year‐End 2012)
Henry Hub Natural Gas Spot Price
$8 00
$9.00
$10.00EIA AEO 2012 B&V Projection (Mid‐Year 2013)
2015‐2020
$5 00
$6.00
$7.00
$8.00
3$/M
MBtu
2015‐2020Prices rise to bring a trend toward
profitability for Non‐core dry gas producers
2026‐2037Price trajectory tracks continued growth
i ti d d
$3.00
$4.00
$5.00
2013
2020‐2025Emission costsa
push B&V projection upward similarto EOY 2012
in power generation demand
$0.00
$1.00
$2.00
2010 2011 2013 2015 2017 2018 2020 2022 2024 2025 2027 2029 2031 2032 2034 2036 2038
2012‐2014Demand Recovery &
Rationalized Production
2010 2011 2013 2015 2017 2018 2020 2022 2024 2025 2027 2029 2031 2032 2034 2036 2038
34

www.bv.com